
Application of Activated Seashells and Sand Armor for Disrupting N and P Release from River Sediments


1
Department of Chemical Engineering, Hankyong National University, Anseong 17579, Korea
2
Department of Integrated System Engineering, Hankyong National University, Anseong 17579, Korea
3
Department of Environmental and Safety Engineering, Ajou University, Suwon 16499, Korea
4
Department of Bioresources and Rural System Engineering, Hankyong National University, Anseong 17579, Korea
5
Institute of Agricultural Environmental Sciences, Hankyong National University, Anseong 17579, Korea
*
Author to whom correspondence should be addressed.
Water 2022, 14(18), 2875; https://doi.org/10.3390/w14182875
Submission received: 20 July 2022
/
Revised: 7 September 2022
/
Accepted: 9 September 2022
/
Published: 15 September 2022
(This article belongs to the Section Water, Agriculture and Aquaculture)
Abstract
:We investigated the applicability of oyster (OS) and mussel shells (MS) as capping materials to inhibit the movement of nitrogen (N) and phosphorus (P) from river sediments. OS and MS are difficult to dispose of as waste, and have been used environmentally to clean up sediments contaminated with nitrogen and phosphorus. OS and MS increased the nutrient adsorption efficiency through simple heat treatment. The effectiveness of OS and MS capping with sand armor (SA) was evaluated in laboratory incubation experiments for 63 d. The sediments were capped with an active capping material (OS or MS) and then with either 1 cm or 3 cm SA. The pH and EC values were remarkably high under MS capping conditions because Ca2+ and Mg2+ were eluted from the MS material. The elution of Ca2+ and Mg2+ negatively affected the inhibition of NH4-N release by MS capping. OS capping demonstrated better performance for blocking the release of NH4-N and T-N than that of MS capping; the efficiency was enhanced by adding a 3 cm SA layer on top of the MS layer. In contrast, the PO4-P and T-P releases from the river sediments were effectively impeded by MS capping. OS capping with a 3 cm SA layer (OS/SA3) was recommended as the best capping strategy for inhibiting N and P releases from river sediments. The capping efficiencies of OS/SA3 for NH4-N, T-N, PO4-P, and T-P were 92.2%, 51.4%, 101.3%, and 93.3%, respectively.
1. Introduction
Domestic sewage, industrial wastewater, and agricultural runoff have contributed to elevated levels of nitrogen (N) and phosphorus (P) in water bodies [1,2]. These unregulated discharges release N-based and P-based compounds into the groundwater and water bodies leading to the widespread pollution of aquatic environments [3,4]. The excess amounts of N and P in an ecosystem have resulted in a number of ecological problems such as eutrophication [5,6]. Over time, N and P accumulate in aquatic sediments, including lake and river sediments. These sediments can serve as nutrient sinks or sources of N and P. Eutrophication has persisted for decades even after reducing or eliminating external pollution in industrial and domestic wastewater because the nutrients deposited in the sediment act as an internal source of nutrients [7]. Therefore, under such conditions, it is imperative to employ remediation techniques that aim to inhibit the mobility of N and P from sediments to the immediate aquatic environment [8,9].
Numerous sediment remediation methods have been investigated in recent years. These include dredging [10], natural recovery monitoring [11], phytoremediation [12,13], soil washing [14], hypo-limnetic oxygenation [15,16], and in situ capping methods. However, sediment resuspension from dredging and prolonged recovery times for natural recovery monitoring make the in situ capping technique more viable [17]. In situ capping remediation techniques inhibit the transport pathway of contaminants, thereby reducing their mobility, toxicity, and bioavailability through sequestration and obstruction [4,18,19].
Researchers have extensively studied the use of activated carbon [20], zeolites [19,21,22], and bentonite [23] as capping materials in both laboratory and field-scale experiments. However, these materials have several limitations when used in large-scale capping remediation projects, and minimizing their secondary environmental impacts can be problematic. Activated carbon production is energy-intensive, and covering large areas with capping materials increases remediation costs [24,25]. Raw zeolite largely demonstrated a low adsorption efficiency for negatively charged anions [21], and the use of bentonite poses a risk to the benthic ecosystem owing to its high pH [26]. Biochar [5,27], layered double hydroxide [28], illite [26], and zero-valent iron [29] have also been studied as contemporary active capping materials. The need for inexpensive and readily accessible capping materials has attracted considerable attention. In recent years, oyster shells (OS) and (MS) have been used as adsorbents to successfully remove various contaminants from wastewater [30,31,32,33,34]. Seashells are used, as they are readily available, environmentally friendly, and rich in calcium carbonate [35]. This high calcium carbonate partially dissolves in aqueous solutions to release calcium cations. These cations can bind to phosphate anions to form calcium hydroxyl phosphate, enabling Ca-P precipitation under alkaline conditions [36,37]. The calcination and thermal treatment can be the way to improve the adsorption capacity of seashells [38,39].
Oysters and mussels are the shellfish most commonly produced in the aquaculture industry worldwide. Oyster is mass produced by aquaculture worldwide, producing 438 billion tons in 2016 [40]. Approximately 300,000 tons of oysters and 60,000 tons of mussels are produced annually in Korea [38,39]. Mussels are the second most farmed species in the world after oysters, accounting for 14% of bivalve mollusk production in 2010 [41]. The stacking of oyster and mussel shells causes undesirable odors from decomposition by microorganisms and deposits large quantities of salt onto soil [42]. The Korean government has promoted a policy of drying oyster shells, grinding them into a fine powder, converting the powder into fertilizer, and supplying the fertilizer to farmers at no cost. However, farmers are reluctant to use the free fertilizer because of the smell and the impacts on plant growth from the subsequent high salinity in the soil following its application [39]. Various trials have investigated alternative uses for seashells besides their application as fertilizer, and their feasibility for use as construction materials, supplementary feed for livestock, and alternative liming materials for soil remediation has been assessed [42].
To the best of our knowledge, research on the feasibility of using OS and MS as capping materials for the remediation of contaminated sediments has been extremely limited. However, there are a number of challenges associated with their application as capping materials. In this study, we applied thermally treated OS and MS as capping materials to sequester nutrients and impede their release from sediments to the overlying water. We believe that thermally treated OS and MS are superior candidates for capping materials because they are inexpensive and derived from biomass in aquatic environments. In addition, the practice is environmentally friendly, since the waste is recycled for use in environmental remediation.
In this study, we investigated the application of thermally treated OS and MS as capping materials to block the release of N and P from contaminated river sediments. The effect between sand armor (SA) thickness and capping efficiency (CE) was also investigated by overlaying the active capping materials (OS and MS) with SA. Different forms of N and P, namely NH4-N, NO3-N, T-N, PO4-P, and T-P, were monitored during a 63-day incubation experiment. At the end of the incubation period, the N and P fluxes from the sediments, capping materials, and CE were quantified. The effect of capping materials on changes in the aquatic environment was also studied by observing the pH, electrical conductivity (EC), dissolved oxygen (DO), and oxidation-reduction potential (ORP). After completion of the incubation experiment, a P-fractionation of the sediment was performed, and the NH4-N, T-N, and T-P concentrations in the pore water were analyzed.
2. Materials and Methods
2.1. Sediments and River Water Sampling
The procedures for collecting and pre-treating sediment and river water have been described in previous studies [8,43]. The sediment used in our study was collected from the Geum River located in Sejong City, Korea, in December 2019. Samples were taken up to a depth of 10 cm below the sediment surface using Van Veen grab samplers. The collected sediment was homogenized using a mechanical mixer after removing any large debris. The water sample used for this investigation was collected using a 2-L airtight polyvinyl chloride container. In the laboratory, the water was filtered with a GF/C filter (1.2 µm pore size, Whatman, Maidstone, UK) and stored in a refrigerator before use.
2.2. Preparation of Capping Materials
The OS and MS were sourced from a local seafood market near the campus of Hankyong Natioinal University in Anseong City, Korea. The OS and MS were washed, dried, and grounded. After grinding, the powder was sieved using standard No. 16 and No. 20 (850 µm and 1.15 mm) bottom sieves. Particles of the granular size that can settle down reliably were selected. The particles retained between the sieves were used. OS and MS were pyrolyzed under anoxic conditions using a muffle furnace (CRFT 830S, Dongseo Science Co. Ltd., Pusan, Korea) for 4 h at temperatures of 700 °C and 800 °C, respectively. The optimal temperatures for OS and MS pyrolysis were determined from our previous studies [38,39].
2.3. Laboratory Scale Incubation Experiments
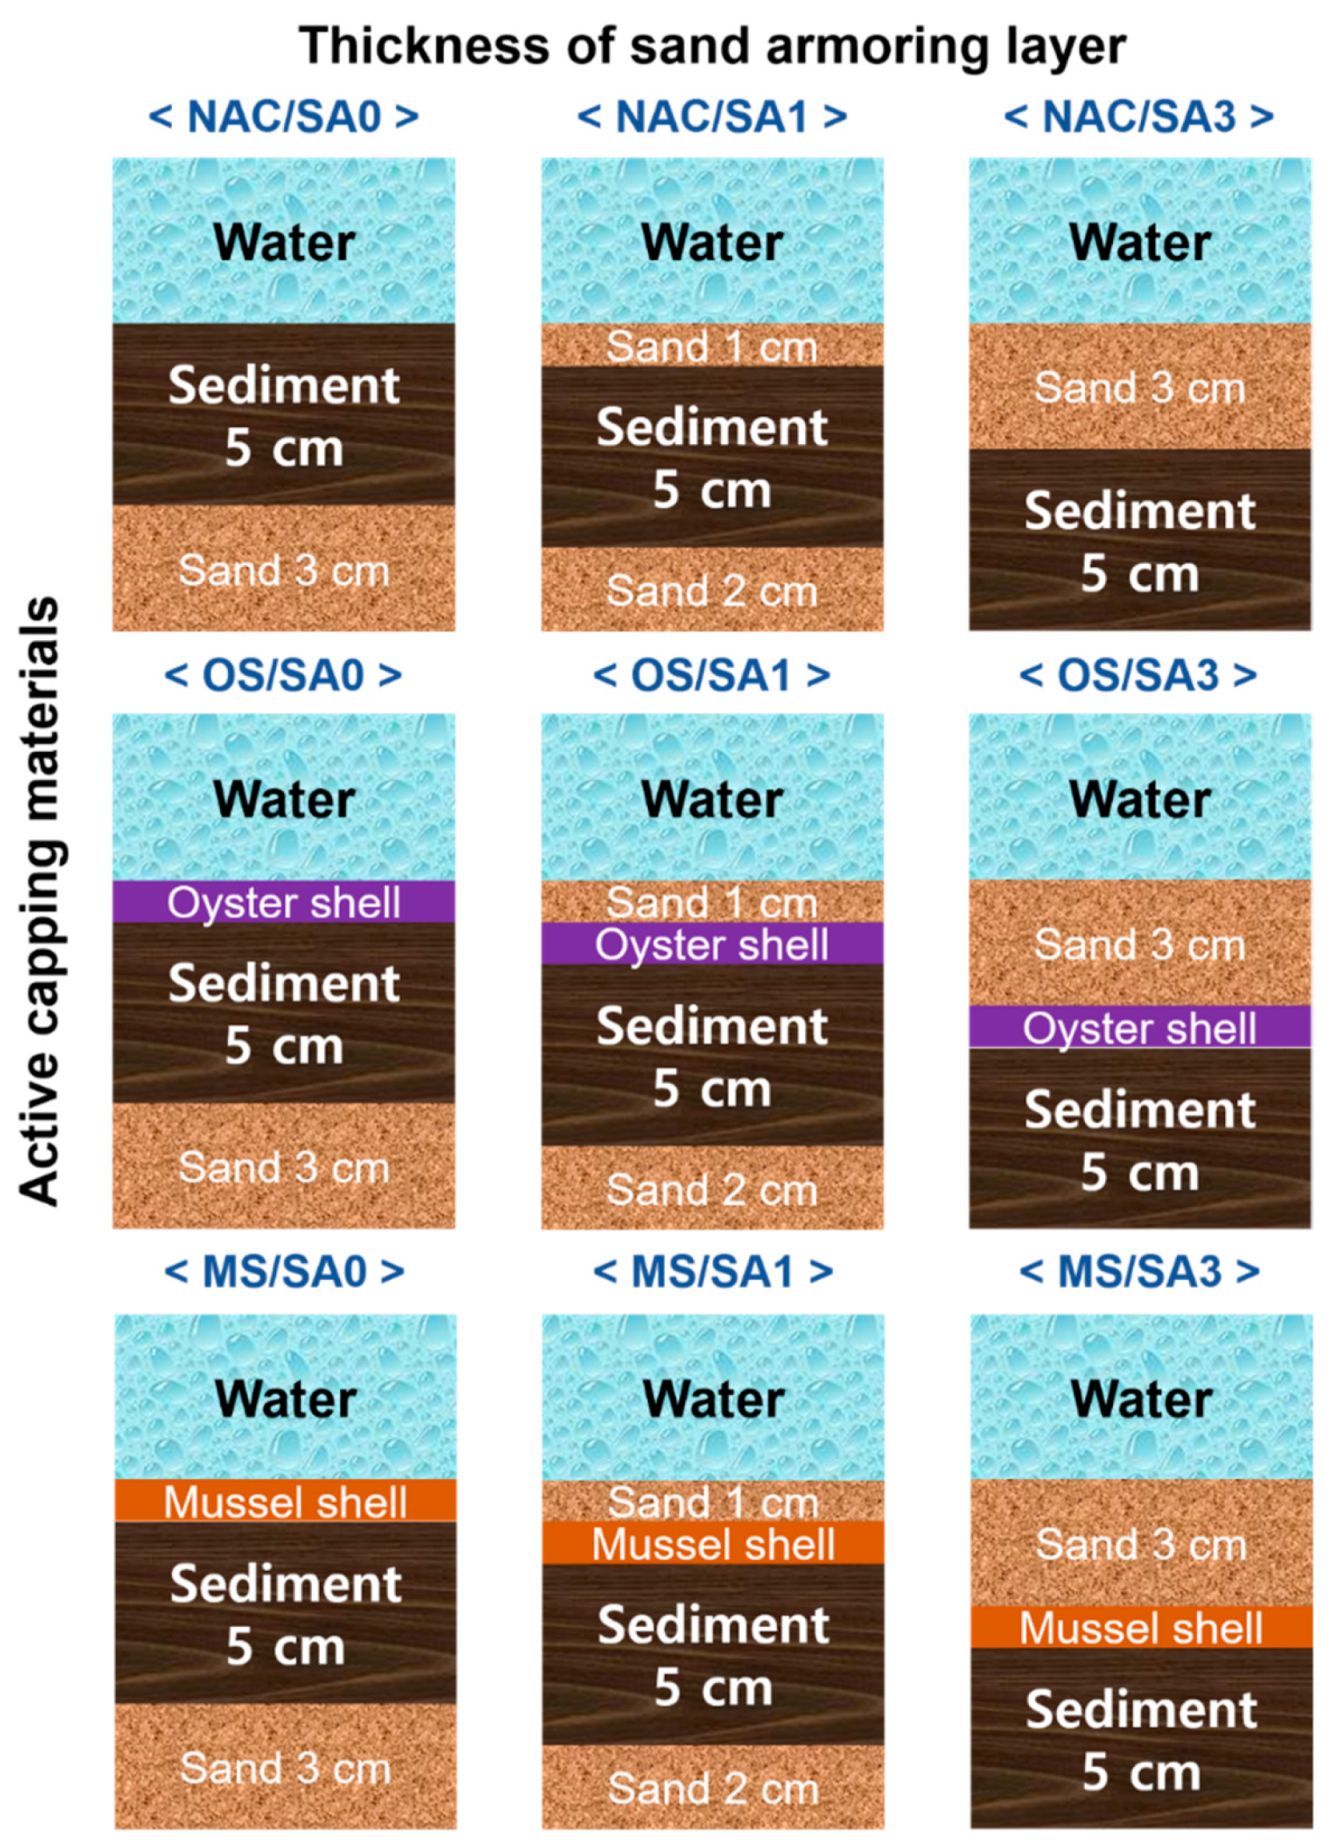
Laboratory sediment incubation experiments were performed using columns filled with sample water and sediments. Three different active capping conditions and three different armoring layers were constructed for nine different experimental systems, as illustrated in Figure 1. The effectiveness of OS and MS as capping materials was compared to that of non-active capping (NAC) materials. Two different SA layers, 1 cm (SA1) and 3 cm (SA3), were placed on top of the sediment or active capping layer. The OS and MS capping materials were also tested without SA (SA0) for comparison. The experimental conditions are denoted as X-Y, where X refers to the active capping material used, and Y represents the thickness of the SA layer. For instance, OS/SA1 refers to using an OS capping and having 1 cm of SA placed over the sediments. For all experimental conditions, the same sediment thickness (5 cm) and volume (3 L) of overlying water was set, and 3 cm (SA0) and 2 cm (SA1) thick sand layers were placed under the sediments to set the constant distance between sampling ports and the surface of the sediment layer. The sediment was leveled with a plastic plate to a 5 cm thick layer before the capping materials were applied. A pump (Model 7527-15, Cole-Parmer, Vernon Hills, IL, USA) was used to fill the sediment incubation column with river water (3 L) to prevent suspension of the sediment and capping materials. The acryl sediment column had an inner diameter of 15 cm, a height of 25 cm, and a sampling port located 10 cm from the bottom. A DO probe (HI9146, Hanna Instruments, Cluj-Napoca, Romania) was installed and fixed through the center of the lids and made airtight using a silicone resin paste. The device was calibrated prior to use according to the manufacturer’s instructions. The incubation experiment was performed in incubators in order to conduct the experiments under dark conditions at a constant temperature of 25 °C for 63 days. At 0.5, 1.5, 3, 7, 14, 21, 28, 42, 56, and 63 days after the start of the incubation experiment, water samples of 15 mL were taken through a sampling port using a syringe (50 mL) to analyze the water pH, EC, ORP, T-N, NH4-N, NO3-N, T-P, and PO4-P. In addition, the DO was measured daily during the incubation period.
2.4. Analysis of N and P in Water Samples
Water quality parameters were promptly determined to reduce errors using standard methods for water and wastewater analysis [44]. pH and EC meters (Seven-multi S40; Mettler Toledo, Schwerzenbach, Switzerland) were used to measure the pH and EC of water. T-N was determined using a UV-Visible spectrophotometer (Optizen POP QX, Mecasys Co., Daejeon, Korea) at a wave length of 220 nm following the thermal decomposition of the sample using NaOH and K2S2O8. The indophenol and brucine methods were used to analyze NH4-N and NO3-N, respectively. The sample for NH4-N analysis was reacted with alkaline phenol and hypochlorite, and the blue-colored sample was measured at 630 nm. The sample for NO3-N analysis was reacted with brucine sulfate in a 13N H2SO4 solution at 100°C, and the colored sample was measured at 410 nm. The detection limits for T-N, NH4-N and NO3-N were 0.1, 0.01, and 0.1 mg/L, respectively. Total phosphorus (T-P) was determined via the ascorbic acid reduction method after digesting the samples with K2S2O8. After the reaction of ammonium molybdate-antimony potassium tartrate, the intensity of the blue-colored sample was analyzed using the UV-Visible spectrophotometer at 880 nm. PO4-P was determined using ascorbic acid without the digestion process. The detection limits for T-P and PO4-P were 0.01 mg/L.
After completion of the incubation experiments, the sediment was dissected immediately below the capping layer and centrifuged at 4000 rpm to press out the pore water contained in the sediment. The concentrations of T-N, NH4-N, and T-P in the pore water of the sediments were determined using the methods described above.
2.5. Data Analysis
The flux of nutrients released from the sediments into the overlying water was calculated as follows [45,46]:
where JD is the flux of nutrients released from contaminated sediments during incubation (mg/m2d). Ci and Ct are the pollutant concentrations (mg/L) in the tank at the beginning of the experiment and during the sampling period, respectively. The time (d) between sampling and the start of the experiment is represented by t. V is the volume (L) of river water in the tank, and A is the contact area between river water and sediment (m2).
2.6. Sequential Extraction of P
After the incubation experiments, the P fractions present in both the capping materials and sediments were quantified using the methods described by Hieltjes and Lijklema [48]. The pretreatment procedures to quantify each fraction are as follows: (1) T-P: 20 mL HClO4 was added to 1 g of the sediment sample, boiled for 2 h, 100 mL of distilled water was added, 5 mL of the solution was adjusted to pH 1.8–2.2 with 5 N NaOH, and another 50 mL of distilled water was added. (2) Adsorbed-P: 25 mL of 1 M NH4Cl was added to 1 g of the sediment sample and reacted for 2 h. (3) Non-apatite inorganic phosphorus (NAI-P): 25 mL of 0.1 N NaOH was added to 1 g of the sediment sample and reacted for 17 h. (4) Apatite-P: 25 mL of HCl (1 M) was added to 1 g of the sediment sample and reacted for 24 h. (5) Residual-P was determined by subtracting Apatite-P, Adsorbed-P, and NAI-P from T-P.
3. Results and Discussions
3.1. Water and Sediment Properties
The physicochemical properties of the water and sediment are listed in Table 1. The DO and T-P concentrations in the water corresponded to Level 1 (best water quality level) and Level 2, respectively. Water quality levels were based on the water quality standards for rivers established by the Korean Ministry of Environment. However, the suspended solid (SS) concentration in the water was too high to be classified, exceeding the threshold set for the worst water quality level by the Korean Ministry of Environment. In sediments, the T-N and T-P levels were below the established sediment quality guidelines of the Korean Ministry of Environment. However, according to the US Environmental Protection Agency (EPA), the T-N and T-P contents in sediments exceeded high levels (T-N: >2000 mg/kg; T-P: >650 mg/kg). Although the overlying water quality was satisfactory, large amounts of N and P were accumulated in the sediment. Under certain circumstances, N and P can be released from sediments and lead to the eutrophication of rivers.
3.2. Effects of Capping Materials on the Water Environment
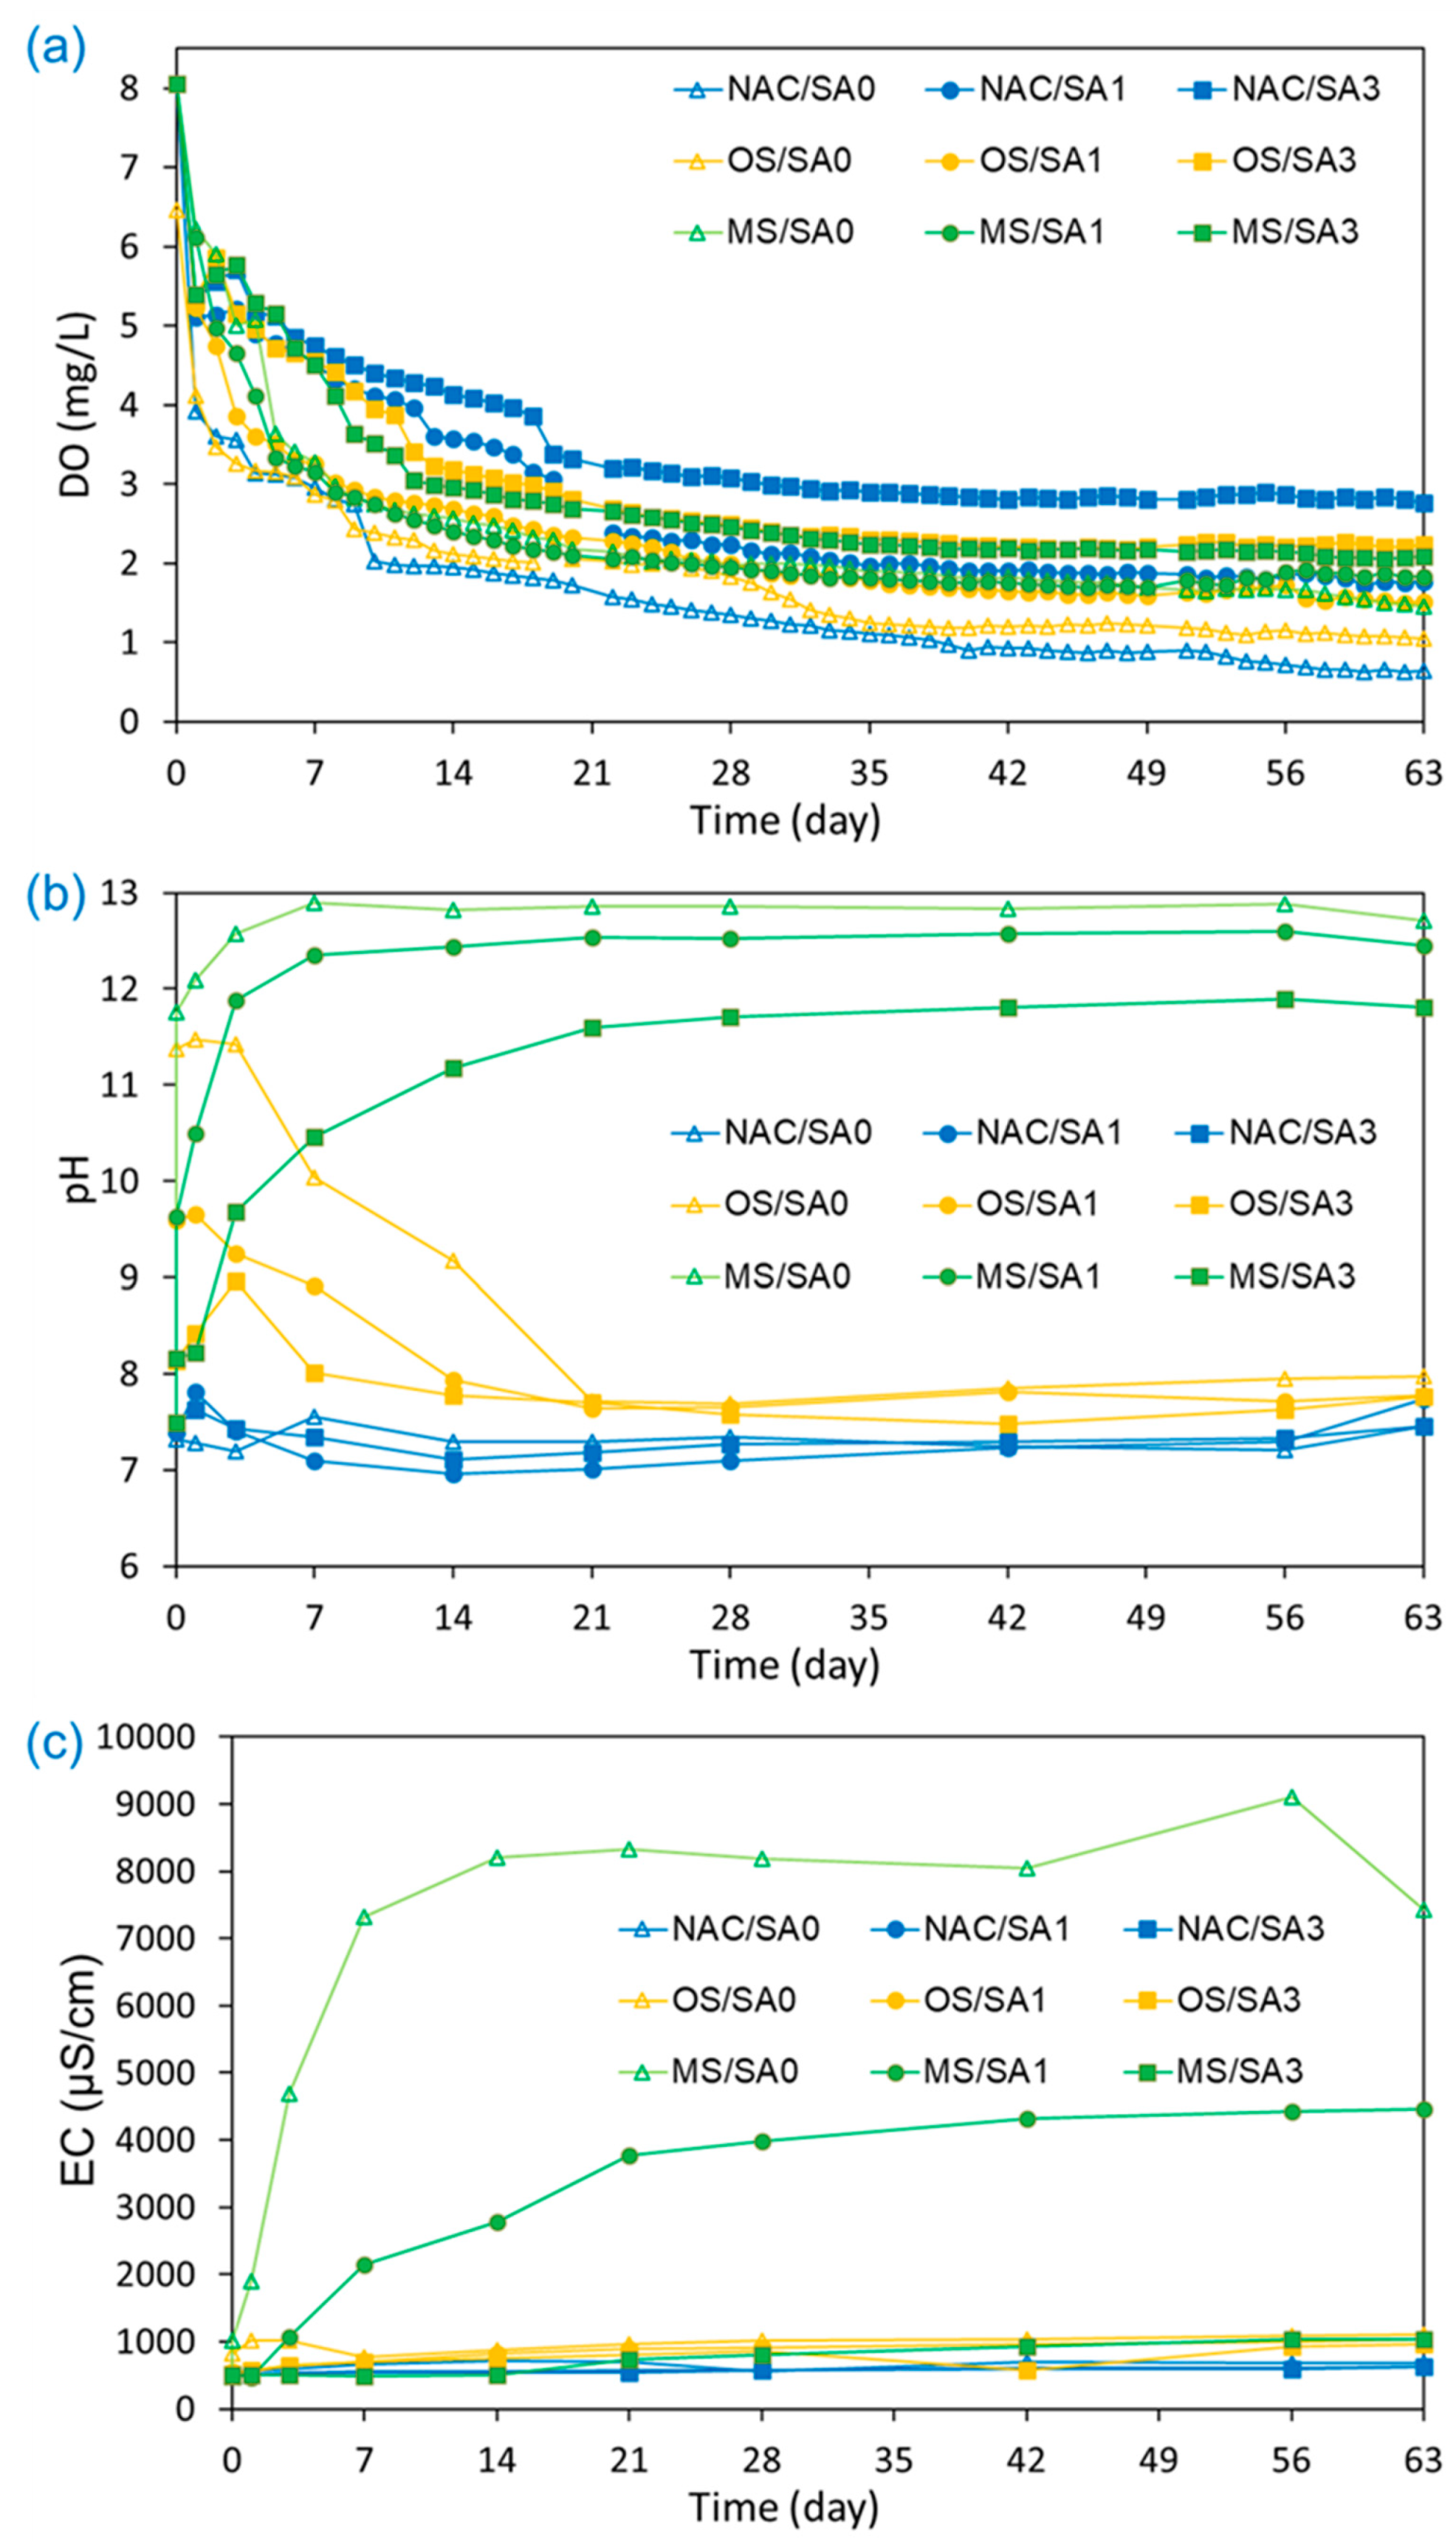
The variations in DO, pH, and EC values in the water overlying uncapped and capped sediments during the incubation experiments were monitored to investigate the changes in environmental conditions in the overlying water from capping treatments and understanding the release of nutrients from sediments (Figure 2). The DO concentration, one of the key parameters affecting and determining the fate of chemicals [49], was monitored for 63 d. It decreased sharply within the first 7 d under all conditions, followed by a gradual decrease until 40 d. After 40 days, there was little change in DO until the completion of the incubation experiments. The lowest DO concentration was observed in the uncapped conditions (NAC/SA0), and the mean and standard deviation of DO concentrations (mg/L) under capped conditions increased in the following order (Table 2): NAC/SA0 (1.55 ± 1.17) < OS/SA0 (1.90 ± 1.22) < OS/SA1 (2.25 ± 1.07) < MS/SA1 (2.31 ± 1.10) < MS/SA0 (2.35 ± 1.22) < NAC/SA1 (2.70 ± 1.28) < MS/SA3 (2.82 ± 1.17) < OS/SA3 (2.91 ± 1.14) < NAC/SA3 (3.46 ± 1.01). The capping of MS, OS, and SA delayed the DO reduction rate. The presence of a capping layer shifts the deposition of organic matter to the newly formed cap–water interface, thus removing the source of biologically available carbon and slowing the depletion of DO [50]. A higher DO concentration was observed when a 3 cm SA layer was applied. Thick SA delays and physically impedes the release of oxygen-consuming organic matter and nutrients by increasing the diffusive distance between the sediments and overlying water [51]. Under OS and MS capping conditions, the Ca2+ released from OS and MS binds to organic matter (consumes DO during its degradation), leading to an increase in the DO concentration of the overlying water [52,53]. Therefore, the OS cap was found to have a lower overlying DO concentration than that of the MS cap, which may be because of the lower Ca content (66.6%) of OS than that (80.5%) of MS. The higher DO of NAC/SA3 than those of MS/SA3 and OS/SA3 can be explained by the fact that the release of Ca2+ from MS and OS enhanced the release of NH4+, which consumed DO in the overlying water. The effect of MS and OS capping on the release of NH4+ is described in Section 3.3.
The pH values of NAC/SA0, NAC/SA1, and NAC/SA3 were 7.34 ± 0.12, 7.32 ± 0.28, and 7.36 ± 0.15, respectively. This suggests that SA prevented the migration of consumable organic matter from sediments to overlying water but had no effect on pH. Similar results have also been reported by other researchers [54,55], and the negligible change in pH is one of the key advantages of sand capping. When MS capping was implemented, the pH of MS/SA0, MS/SA1, and MS/SA3 were 12.16 ± 1.59, 11.54 ± 1.66, and 10.37 ± 1.70, respectively (Table 2). Although the pH values of OS capping were lower than those of MS capping, the pH values of OS capping were higher than those of NAC/SA0 and SA capping without MS and OS capping. The pH values for OS and MS capping also demonstrated different patterns of change over time. The pH of OS/SA0 increased from pH 7.49 to pH 11.47 within 3 d and then decreased to pH 7.69 on day 21. However, the pH of MS/SA0 increased to 12.58 and then plateaued until the end of the experiments. The high pH of OS and MS could be due to CaO and Ca(OH)2 compounds in OS and MS reacting with water to produce calcium hydroxide, which releases OH− after dissociation [56]. This reason can also be applied to explain that the pH of MS capping is higher than that of OS capping. A higher pH was observed by capping with the MS material, because MS has a higher CaO content than OS material. The pH was also dependent on the thickness of the SA layer, and the SA layer mitigated the increase in pH caused by MS and OS. In Table 2, the pH values for MS/SA1, MS/SA3, OS/SA1, and OS/SA3 were 11.54 ± 1.66, 10.37 ± 1.70, 8.31 ± 0.35, and 7.91 ± 0.46, respectively, indicating that a thicker SA layer was more effective at alleviating pH increases by MS and OS capping.
The EC values for both MS and OS capping were relatively similar throughout the experimental period, as observed in Figure 2c. However, the EC values for MS capping increased markedly from 1020 µS/cm to 8200 µS/cm. This suggests that MS capping may have a considerable impact on the EC of the overlying water. The increase in EC is also due to nutrient release from sediments, but its impact on EC is much smaller than that of the ions eluted from the capping materials, i.e., MS and OS. The increase in EC values for MS capping may be due to the elution of ions such as Ca2+, Mg2+, Na+, and K+ from the surface of MS upon solubilization in water [8,57]. Therefore, the EC values in MS capping were consistent with the observed elevated pH values, as the MS capping material contains basic salts such as Ca(OH)2 and CaO [38]. Similar to the pH results, low EC values were observed as the thickness of the SA layer increased. The average EC (Table 2) of MS/SA0, MS/SA1, and MS/SA3 were 7420 ± 3392, 4460 ± 1671, and 1031 ± 209 µS/cm, respectively, and the EC of the MS capping decreased under a thick SA layer. Lower EC values were observed for OS capping than for MS capping, and the EC values for OS/SA0 and MS/SA0 on day 63 were 1113 µS/cm and 7420 µS/cm, respectively. The EC values for MS/SA3 were similar to that of OS capping, and the EC differences between OS and MS capping decreased when 3 cm of SA was applied to the OS and MS capping layers.
3.3. Impact of Capping on the Release of N and P from Sediments into the Overlying Water
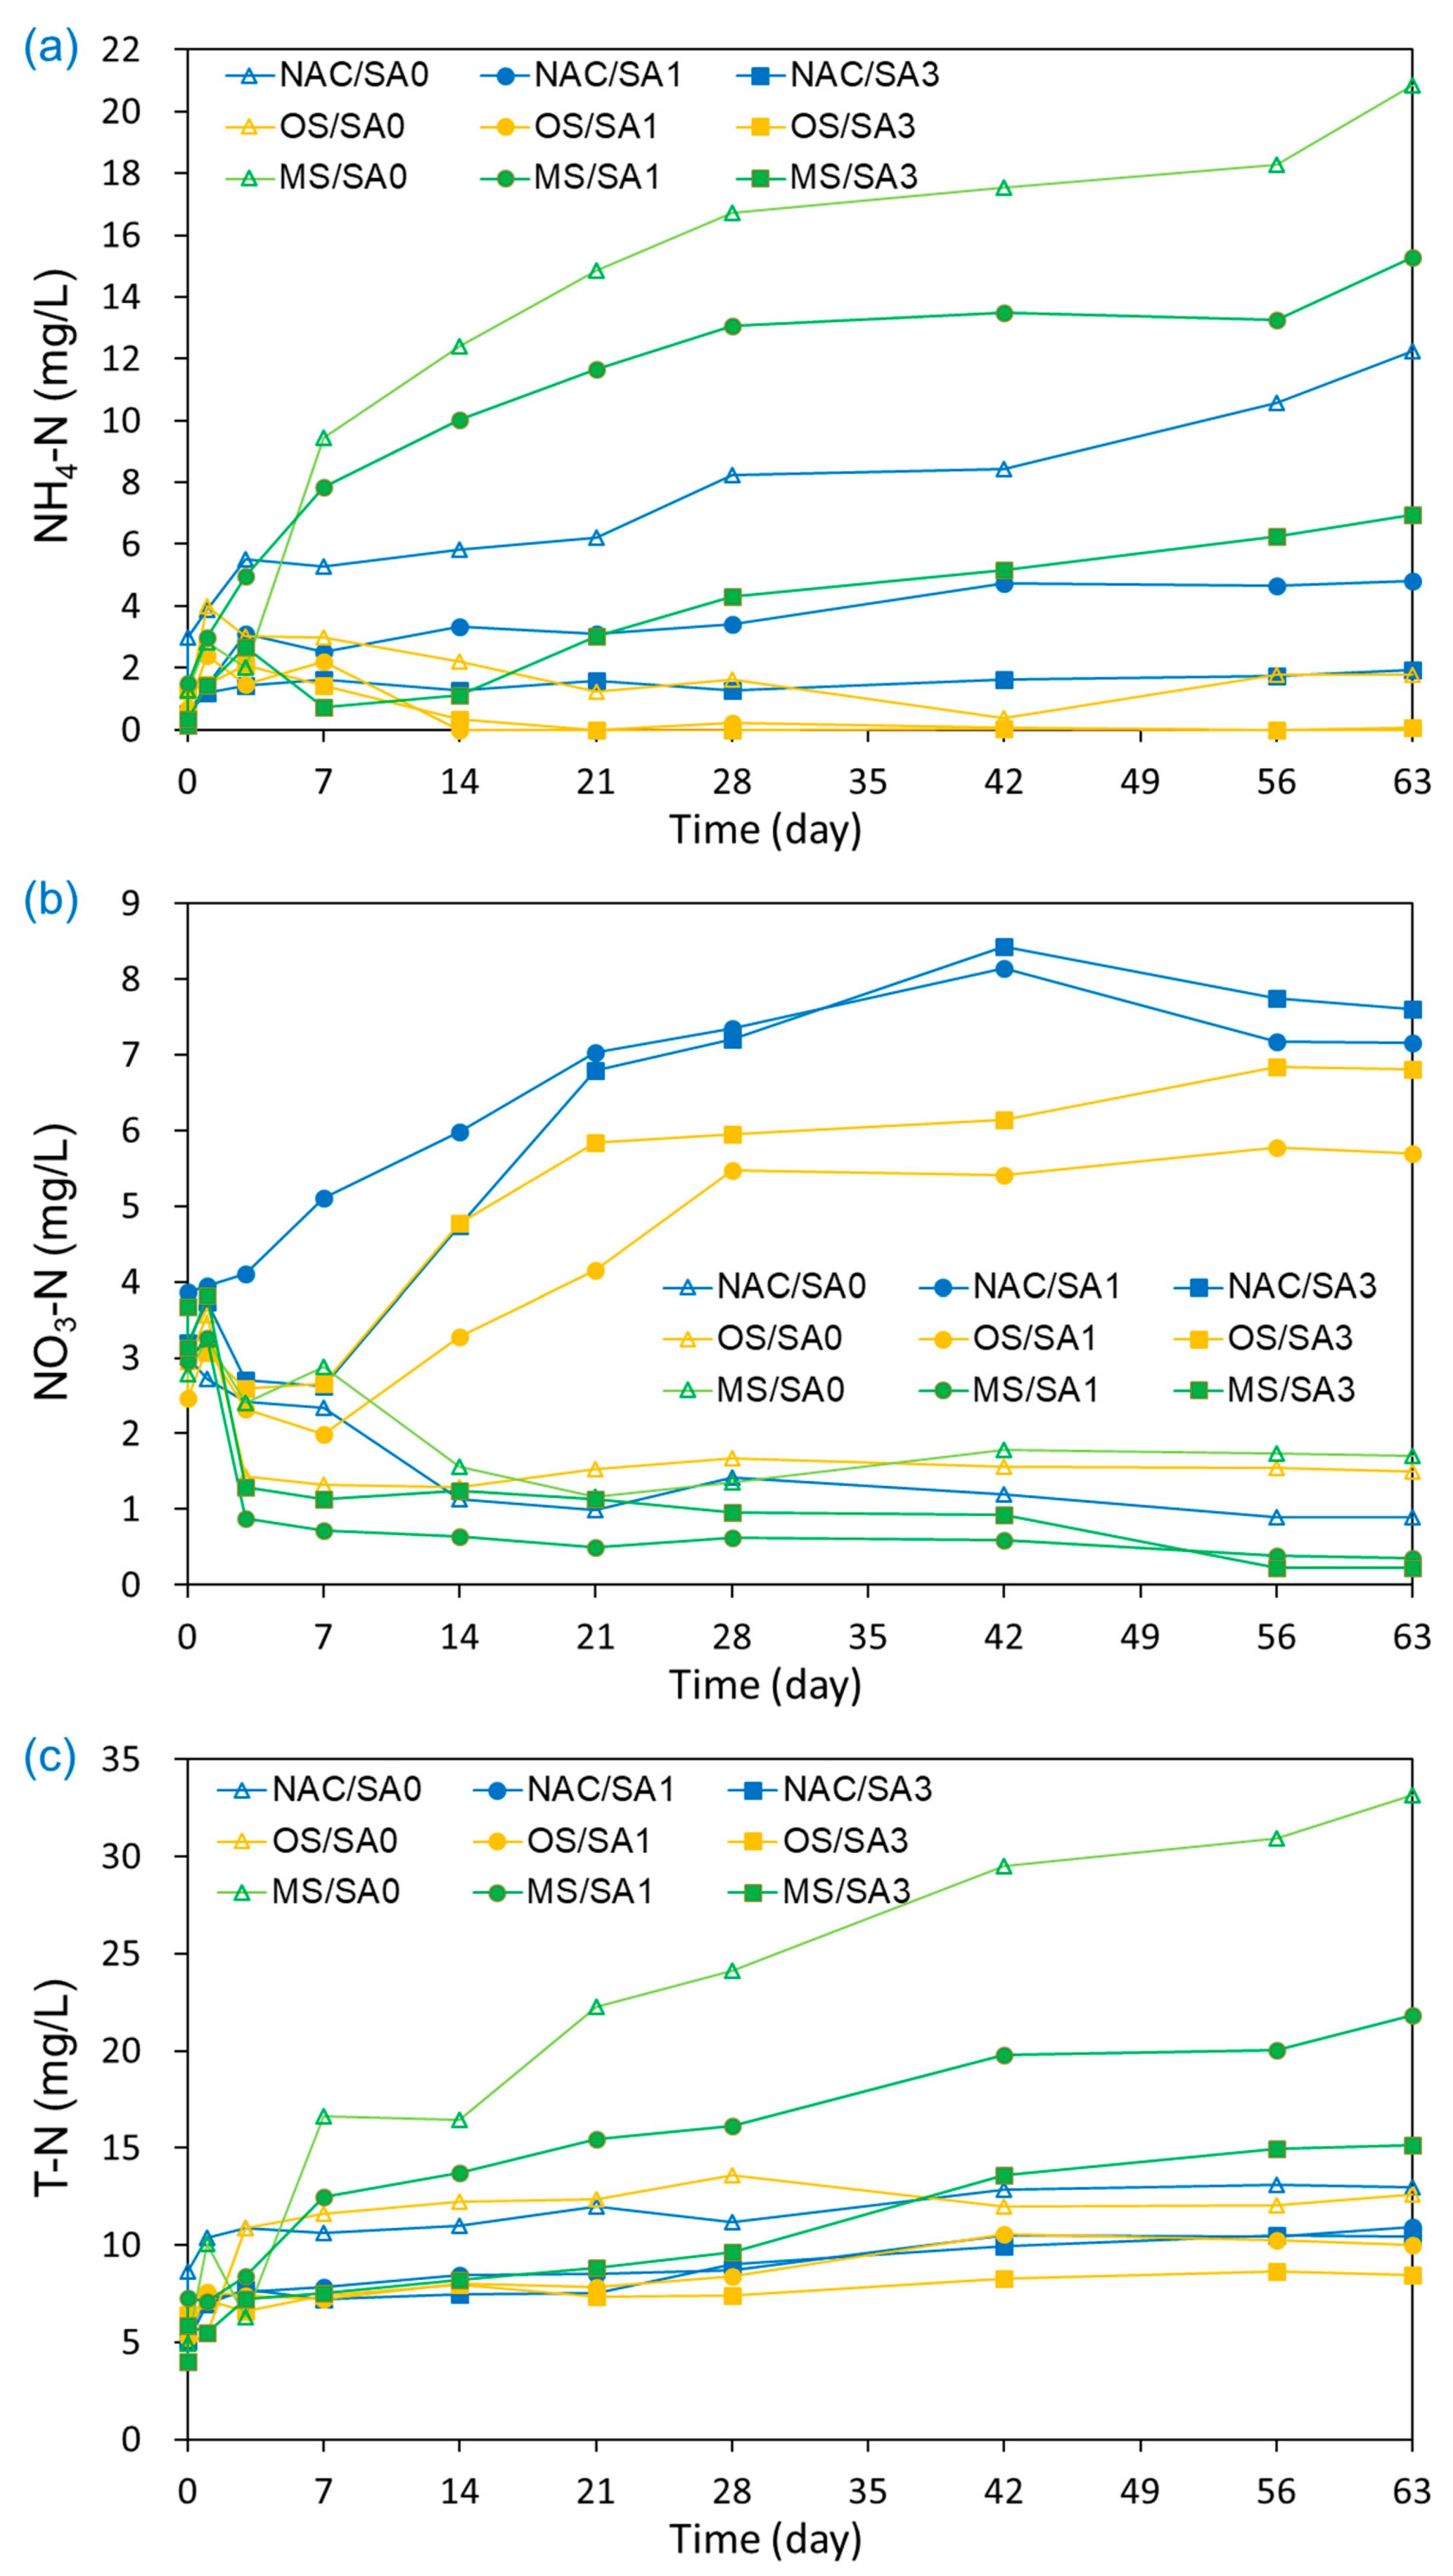
The changes in the concentrations of NH4-N, NO3-N, and T-N over time under different capping conditions are illustrated in Figure 3. The increasing N values signify greater aquatic eutrophication risks and contribute to hypoxia, DO consumption, and poisoning [58,59]. As shown in Figure 3a, the NH4-N concentration in the overlying water under uncapped conditions (NAC/SA0) continuously increased from 0.14 mg/L to 12.26 mg/L during the experimental run. With the exception of OS/SA1 and OS/SA3, an increase in NH4-N values from the base concentration was also observed under capping conditions. Higher NH4-N concentrations were observed for MS/SA0 and MS/SA1 than that for NAC/SA0 (untreated), indicating that MS/SA0 and MS/SA1 capping accelerated NH4-N release from sediments to overlying water rather than disrupting NH4-N release. The acceleration of the NH4-N releases by MS/SA0 and MS/SA1 was attributed to the Ca2+ and Mg2+ ions eluted from the MS-released NH4-N adsorbed on the surface of the sediments via ion exchange [60]. The much higher EC values of MS/SA0 and MS/SA1 (Figure 2c) were also consistent with the large number of ions eluted from the MS capping material to the overlying water, affecting the release of NH4-N from sediments. The higher concentrations of NH4-N in pore water under MS/SA0 and MS/SA1 capping conditions than those under other conditions (Figure 4) were also consistent with the fact that the Ca2+ and Mg2+ eluted from the MS capping material enhanced the release of NH4-N from sediments.
The amount of NH4-N released is closely related to the average DO concentrations, and in previous studies, higher NH4-N concentrations were observed under conditions with lower average DO concentrations [8,26,61]. The release of dissolved inorganic N as NH4+ may be due to the anaerobic conditions created at the bottom, which prevent the oxidation of NH4+ to NO3 and thus inhibit nitrification at the sediment-water interface [16,45]. However, in this study, such a trend was not observed, and the NH4-N concentrations under uncapped conditions with the lowest DO concentrations were lower than those of MS/SA0 and MS/SA1. Because oxygen was not depleted under uncapped conditions and the oxygen concentrations were maintained at > 1 mg/L under capping conditions, the effect of oxygen depletion on the increase in the dissolution of NH4+ was negligible.
NO3-N was monitored for all experiments because of the presence of DO in the overlying water under all experimental conditions (Figure 3b). In contrast to NH4-N, the NO3-N concentrations under untreated conditions (NAC/SA0) decreased from 3.67 mg/L to 0.89 mg/L during the incubation period. In previous studies [8,26,61], NO3-N concentrations under uncapped conditions were exclusively observed during the initial experimental period because DO depletion occurred at the start of the experiment. High NO3-N concentrations were obtained for NAC/SA1 and NAC/SA3; both also demonstrated a relatively high average DO concentration (NAC/SA1: 2.72 ± 1.28 mg/L; NAC/SA3: 3.47 ± 1.01 mg/L). The elevated DO concentrations in the overlying water increased the decomposition rate of organic N and the oxidation of NH4+ to NO3− [16]. In addition, the high concentrations of NH4+-N also accelerated the rate of DO degradation in the overlying water, resulting in relatively low DO concentrations [5]. However, MS/SA1 and MS/SA3 demonstrated lower mean NO3-N concentrations (MS/SA1: 1.33 ± 1.29 mg/L; MS/SA3: 1.62 ± 1.30 mg/L) than that of NAC/SA0 (1.88 ± 0.98 mg/L), but displayed higher average DO concentrations than that of NAC/SA0.
The T-N concentrations under untreated and capping conditions gradually increased with incubation time (Figure 3c). Similar to the NH4-N results, the mean T-N concentrations for MS/SA0 (18.0 ± 10.8 mg/L) and MS/SA1 (13.3 ± 6.0 mg/L) were higher than those of the untreated (NAC/SA0) and other experimental conditions. OS/SA3 showed the lowest T-N concentrations (7.2 ± 1.3 mg/L) but showed higher NO3-N concentrations than those of MS capping conditions. This inverse trend in T-N and NO3-N concentrations released from sediments under different capping conditions was also observed in other studies [8,57]. The low T-N concentrations under OS capping conditions suggest that OS is the most efficient capping material to inhibit N release into the overlying water. The ratio of the mean NH4-N concentration to the mean T-N concentration under different capping conditions ranged from 8.3% to 64.5%, which was less than that reported in a previous study [8]. In the previous study, it was reported that almost 90% of T-N was released in the form of NH4-N. The low NH4-N/T-N ratio of our study was attributed to the presence of DO throughout the incubation period. The presence of DO in overlying water increased the decomposition of organic N and the oxidation of NH4+ to NO3− [16].
The T-P and PO4-P concentrations in the overlying water under untreated and capped conditions are illustrated in Figure 5. The T-P concentration in the overlying water under NAC/SA0 conditions steadily increased from 0.077 mg/L to 0.851 mg/L, with the highest average overlaying T-P concentrations compared to that of all capping conditions. This indicated that all capping treatments were effective in disrupting the release of T-P from sediments. The T-P concentrations (mg/L) released from sediments into overlying water decreased in the following order: NAC/SA0 (0.448 ± 0.346) > OS/SA0 (0.229 ± 0.155) > NAC/SA1 (0.206 ± 0.150) > OS/SA1 (0.166 ± 0.115) > NAC/SA3 (0.117 ± 0.072) > MS/SA0 (0.103 ± 0.048) > OS/SA3 (0.102 ± 0.045) > MS/SA1 (0.088 ± 0.019) > MS/SA3 (0.069 ± 0.018). These results indicate that a thicker sand layer delayed the migration of T-P from surface sediments to overlying water by increasing the diffusion distance [61]. Under MS capping, the PO4-P concentrations (mg/L) in the overlying water decreased in the following order: MS/SA3 (0.035 ± 0.013) > MS/SA1 (0.030 ± 0.013) > MS/SA0 (0.029 ± 0.008). Under MS capping conditions with different SA layer thicknesses, there were no substantial differences of PO4-P concentrations as a response to the thickness of the sand layer, and the thinner sand layer demonstrated slightly lower PO4-P concentrations. MS capping material had a high adsorption capacity for PO4-P, effectively blocking the release of PO4-P and removing PO4-P in the overlying water. Under MS capping conditions, the mean PO4-P concentrations during the incubation period were lower than the initial PO4-P concentrations. Therefore, the thick layer of SA overlying the MS capping layer was also a barrier for MS to adsorb the PO4-P present in the overlying water.
3.4. N and P Fluxes and CE under Uncapped and Capped Conditions
The N and P fluxes and CEs under the different capping conditions are listed in Table 3. A nutrient flux can be defined as the transfer of specific nutrient species from sediments to overlying water [62,63]. As shown in Equation (2), CE is defined as the ratio of the flux under specified conditions to the flux of the untreated condition (NAC/SA0). The CEs of NH4-N, T-N, PO4-P, and T-P increased with increasing SA thickness. As described in Section 3.3., the sand layer delayed the release of N and P by increasing the diffusion distance between the sediments and the overlying water. However, this trend was not observed for PO4-P fluxes under MS capping conditions. This can be explained by the fact that the MS capping material with high PO4-P adsorption capacity demonstrated high CEs of over 100%, regardless of the presence of the SA layer. The dissolution of Ca2+ from MS capping material adsorbed PO4-P in the pores and overlying water via the formation of Ca3(PO4)2 and Ca5(PO4)3OH [64], thus reducing the release of PO4-P from sediments into the overlying water. The flux of PO4-P was higher under OS capping conditions without a SA layer (OS/SA0) than under MS capping conditions without a SA layer (MS/SA0). MS capping conditions using a 3 cm SA layer (MS/SA3) also demonstrated higher CEs than that of OS/SA3. These results can be explained by the lower adsorption capacity of the OS capping material for PO4-P than that of the MS capping material. The CEs of OS/SA0 and OS/SA1 for PO4-P were close to 100%. The CEs of OS capping conditions for T-P were highly dependent on the thickness of the SA layer, and the CEs of OS/SA3 for T-P was 93.3%, which was acceptable. The presence of the SA layer compensated for the relatively low P-adsorption capacity of the OS capping material to achieve a high CE.
MS capping, which demonstrated high CEs for PO4-P and T-P, was unsuitable for NH4-N and T-N. The fluxes of NH4-N and T-N were higher under MS capping conditions than under the untreated condition, and the CEs demonstrated negative values. In contrast to PO4-P and T-P fluxes, OS capping conditions demonstrated lower fluxes of NH4-N and T-N than those under MS capping conditions. The slower release of NH4-N and T-N under MS capping conditions than that under OS capping conditions was consistent with the notion that the OS capping material had a higher adsorption capacity of NH4-N (14.62 mg/g) than that of MS (2.84 mg/g). The OS can adsorb NH4+ ions via a cation exchange mechanism [65]. Although the Ca2+ eluted from the capping materials enhanced PO43- anion adsorption, more Ca2+ cations were released under MS capping conditions than under OS capping conditions, accelerating the release of NH4-N from sediments to the overlying water. The SA layer overlying the OS capping material was also helpful in impeding the release of NH4-N and T-N, and the CEs of OS/SA3 for NH4-N and T-N were 92.2% and 51.4%, respectively. OS capping conditions with a 3 cm SA layer (OS/SA3) can effectively block N and P releases and is recommended as a strategy for the remediation of N and P contaminated sediments.
OS and MS are waste, and it is costly to dispose of them. Therefore, it can be assumed that raw OS and MS are supplied free of charge, and only the calcination process is calculated as cost. The cost for the calcination process under the lab scale was calculated from the consumed electricity and mass recovery. The electricity of 6.3 and 7.2 kW h for thermally treating OS and MS were consumed. From the TGA analysis, the recovery of OS at 700 °C and MS at 800 °C for 4 h was 89.1% and 56.7%, respectively. A total of 176.7 and 317.5 kW h of electricity per 1 kg of OS and MS were consumed, corresponding to 10,779 KRW (=7.98 USD) and 19,368 KRW (=14.35 USD), respectively. The cost of producing 1 kg of MS is two times higher than that of OS. It is expected that the production cost of OS and MS can be lowered when mass-produced on a large scale.
3.5. Phosphorus Fractionation of Sediments under Different Capping Conditions
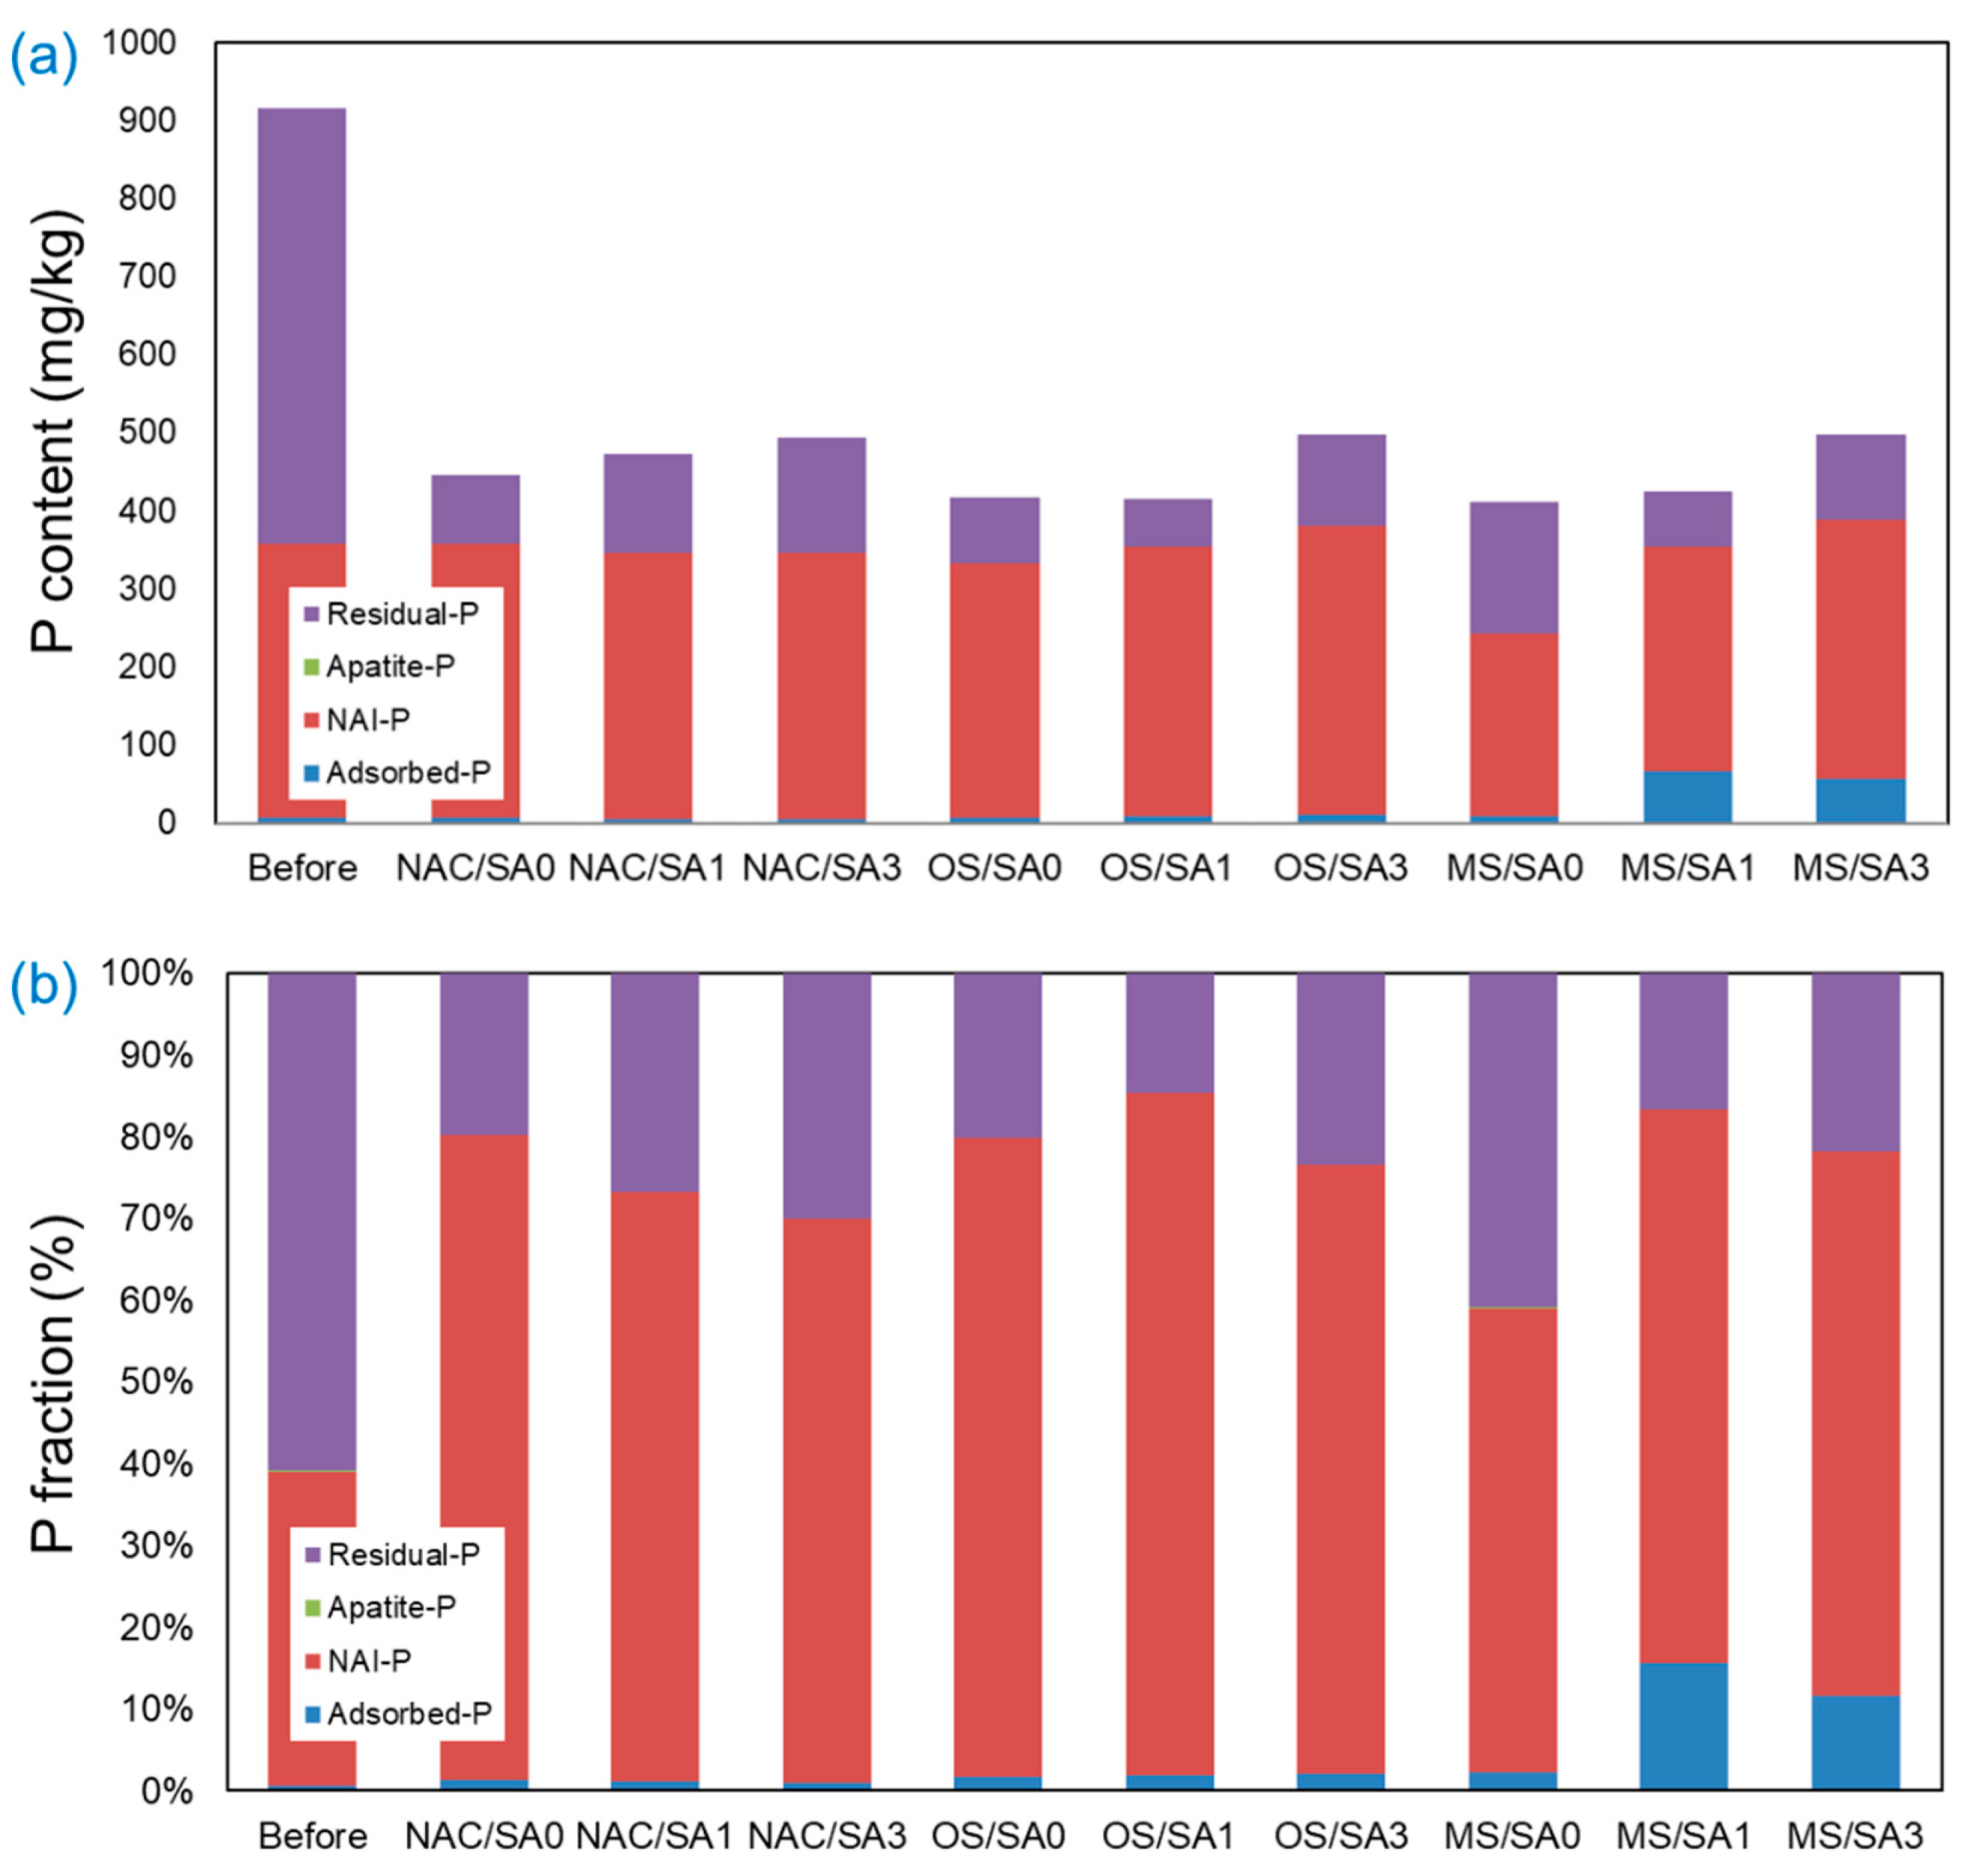
The P present in the sediment was classified into four stages by fractionation (Adsorbed-P, NAI-P, Apatite-P, and Residual-P), and the results are shown in Figure 6. The T-P content (mg/kg) was reduced by approximately 50% following completion of the incubation experiments under all conditions compared to that before the experiment. NAI-P (fraction bound to Al/Fe) and Residual-P (most strongly bound fraction) accounted for most of the P fraction in the pre-experimental sediments. This notably high level of NAI-P in pre-experimental sediments suggests the dissolution of Fe2+ or Al3+ complexes under reductive conditions, releasing this type of T-P from the sediment [66,67]. Following the completion of the experiment, the NAI-P content was similar under all experimental conditions, except for MS/SA0. The low NAI-P fraction under MS/SA0 is a consequence of the pH increase in the overlying water when the MS capping is applied, which hinders the adsorption of P onto Al3+ and Fe3+ ions [68,69]. Under all capping conditions (NAC, OS, and MS), the total amount of T-P increased as the thickness of the SA increased. This is because as the thickness of the SA increases, the amount of P eluted from the sediment decreases, and the amount of P remaining in the sediment increases. When MS was capped, the Adsorbed-P fraction, the weakest bound form, was present to a large extent. In the MS/SA1 and MS/SA3 capping conditions, the proportions of the Adsorbed-P fraction were 15.7% and 11.6%, respectively, which were higher than those of the other experimental conditions. In contrast to the restricted release of PO4-P and T-P under MS capping conditions, the ratio of Adsorbed-P under the MS/SA0 capping condition was 2.2%, which was relatively low compared to that under MS capping conditions with SA (MS/SA1 and MS/SA3). In the case of MS/SA0, weakly adsorbed P (Adsorbed-P fraction) could easily migrate into the overlying water, because there was no physical barrier (SA).
4. Conclusions
This study investigated the application of OS and MS as capping materials to inhibit the release of N and P from river sediments. The effect of the SA layer thickness on N and P release was also investigated by monitoring the concentrations of NH4-N, NO3-N, T-N, PO4-P, and T-P and other water quality parameters (DO, pH, and EC) in the overlying water over a 63-day period. A thicker SA was beneficial in delaying the depletion of DO. MS and OS capping materials caused alarming increases in the pH of the overlying water, and the pH of MS capping conditions was higher than that of the OS capping conditions. The thick SA layer was helpful in alleviating the pH increase caused by the use of MS and OS capping materials. High pH and EC values under MS capping conditions were due to the elution of Ca2+ and Mg2+ from MS, which prevented the MS layer from capturing the NH4-N released from sediments. However, the OS capping of sediments effectively disrupted the release of NH4-N and T-N from sediments, and its CEs were enhanced by the combined use of the SA layer. MS capping was superior to OS capping to disrupt the release of PO4-P and T-P because of the high P adsorption capacity of MS. OS capping is preferred over MS capping because OS capping effectively blocked the release of both N and P, and the lower PO4-P and T-P CEs under OS capping conditions were improved by adding a SA layer. OS capping conditions with a 3 cm SA layer achieved high CEs for PO4-P, T-P, NH4-N, and T-N. Therefore, OS capping with a 3 cm SA layer is recommended to disrupt N and P releases from river sediments into the overlying water. In this study, nitrogen and phosphorus concentrations over incubation time were analyzed along with environmental variables. To more precisely elucidate the mechanism, it is necessary to measure the species and activity of microorganisms affecting nitrogen and phosphorus elution.
Author Contributions
J.O.Q., Methodology and writing—original draft preparation; S.-H.H., methodology and formal analysis; C.-G.L., writing, review, and editing; S.-J.P., conceptualization, data curation, writing—original draft preparation, and writing—review and editing. All authors have read and agreed to the published version of the manuscript.
Funding
This research was funded by the Korea Environment Industry & Technology Institute (KEITI) through the Aquatic Ecosystem Conservation Research Program, funded by Korea Ministry of Environment, grant number RE202201970.
Institutional Review Board Statement
Not applicable.
Informed Consent Statement
Not applicable.
Data Availability Statement
The data presented in this study are available on request from the corresponding author.
Conflicts of Interest
The authors declare no conflict of interest.
References
- Wang, D.; Pillai, S.C.; Ho, S.-H.; Zeng, J.; Li, Y.; Dionysiou, D.D. Plasmonic-based nanomaterials for environmental remediation. Appl. Catal. B Environ. 2018, 237, 721–741. [Google Scholar] [CrossRef]
- Nabil, B.; Messikh, N.; Bousba, S.; Magri, P.; Faycal, D.; Zaghdoudi, R. Adsorption of Humic Acid from Aqueous Solution on Different Modified Bentonites. Chem. Eng. Trans. 2017, 60, 2017. [Google Scholar]
- Vikrant, K.; Kim, K.-H.; Ok, Y.S.; Tsang, D.C.W.; Tsang, Y.F.; Giri, B.S.; Singh, R.S. Engineered/designer biochar for the removal of phosphate in water and wastewater. Sci. Total Environ. 2018, 616–617, 1242–1260. [Google Scholar] [CrossRef]
- Yin, K.; Viana, P.; Zhao, X.; Rockne, K. Characterization, performance modeling, and design of an active capping remediation project in a heavily polluted urban channel. Sci. Total Environ. 2010, 408, 3454–3463. [Google Scholar] [CrossRef] [PubMed]
- Zhu, Y.; Tang, W.; Jin, X.; Shan, B. Using biochar capping to reduce nitrogen release from sediments in eutrophic lakes. Sci. Total Environ. 2019, 646, 93–104. [Google Scholar] [CrossRef]
- Berg, U.; Neumann, T.; Donnert, D.; Nüesch, R.; Stüben, D. Sediment capping in eutrophic lakes–efficiency of undisturbed calcite barriers to immobilize phosphorus. Appl. Geochem. 2004, 19, 1759–1771. [Google Scholar] [CrossRef]
- Yin, H.; Han, M.; Tang, W. Phosphorus sorption and supply from eutrophic lake sediment amended with thermally-treated calcium-rich attapulgite and a safety evaluation. Chem. Eng. J. 2016, 285, 671–678. [Google Scholar] [CrossRef]
- Gu, B.-W.; Lee, C.-G.; Lee, T.-G.; Park, S.-J. Evaluation of sediment capping with activated carbon and nonwoven fabric mat to interrupt nutrient release from lake sediments. Sci. Total Environ. 2017, 599-600, 413–421. [Google Scholar] [CrossRef]
- Abel, S.; Nybom, I.; Mäenpää, K.; Hale, S.E.; Cornelissen, G.; Akkanen, J. Mixing and capping techniques for activated carbon based sediment remediation – Efficiency and adverse effects for Lumbriculus variegatus. Water Res. 2017, 114, 104–112. [Google Scholar] [CrossRef]
- Oldenborg, K.A.; Steinman, A.D. Impact of sediment dredging on sediment phosphorus flux in a restored riparian wetland. Sci. Total Environ. 2019, 650, 1969–1979. [Google Scholar] [CrossRef]
- Konoplev, A.; Golosov, V.; Wakiyama, Y.; Takase, T.; Yoschenko, V.; Yoshihara, T.; Parenyuk, O.; Cresswell, A.; Ivanov, M.; Carradine, M.; et al. Natural attenuation of Fukushima-derived radiocesium in soils due to its vertical and lateral migration. J. Environ. Radioact. 2018, 186, 23–33. [Google Scholar] [CrossRef] [PubMed] [Green Version]
- Dykes, G.A.; Coorey, R.; Ravensdale, J.T.; Sarjit, A. Phosphates. In Encyclopedia of Food Chemistry; Melton, L., Shahidi, F., Varelis, P., Eds.; Academic Press: Oxford, UK, 2019; pp. 218–224. [Google Scholar]
- Ashraf, S.; Ali, Q.; Zahir, Z.A.; Ashraf, S.; Asghar, H.N. Phytoremediation: Environmentally sustainable way for reclamation of heavy metal polluted soils. Ecotoxicol. Environ. Saf. 2019, 174, 714–727. [Google Scholar] [CrossRef]
- Hermassi, M.; Valderrama, C.; Moreno, N.; Font, O.; Querol, X.; Batis, N.H.; Cortina, J.L. Fly ash as reactive sorbent for phosphate removal from treated waste water as a potential slow release fertilizer. J. Environ. Chem. Eng. 2017, 5, 160–169. [Google Scholar] [CrossRef]
- Dittrich, M.; Gabriel, O.; Rutzen, C.; Koschel, R. Lake restoration by hypolimnetic Ca(OH)2 treatment: Impact on phosphorus sedimentation and release from sediment. Sci. Total Environ. 2011, 409, 1504–1515. [Google Scholar] [CrossRef] [PubMed]
- Beutel, M.W. Inhibition of ammonia release from anoxic profundal sediments in lakes using hypolimnetic oxygenation. Ecol. Eng. 2006, 28, 271–279. [Google Scholar] [CrossRef]
- Walker, T.R.; MacAskill, D.; Rushton, T.; Thalheimer, A.; Weaver, P. Monitoring effects of remediation on natural sediment recovery in Sydney Harbour, Nova Scotia. Environ. Monit. Assess. 2013, 185, 8089–8107. [Google Scholar] [CrossRef]
- Kang, K.; Lee, C.-G.; Choi, J.-W.; Kim, Y.-K.; Park, S.-J. Evaluation of the use of sea sand, crushed concrete, and bentonite to stabilize trace metals and to interrupt their release from contaminated marine sediments. Water Air Soil Pollut. 2016, 227, 1–12. [Google Scholar] [CrossRef]
- Xiong, C.; Wang, D.; Tam, N.F.; Dai, Y.; Zhang, X.; Tang, X.; Yang, Y. Enhancement of active thin-layer capping with natural zeolite to simultaneously inhibit nutrient and heavy metal release from sediments. Ecol. Eng. 2018, 119, 64–72. [Google Scholar] [CrossRef]
- Hua, S.; Gong, J.-L.; Zeng, G.-M.; Yao, F.-B.; Guo, M.; Ou, X.-M. Remediation of organochlorine pesticides contaminated lake sediment using activated carbon and carbon nanotubes. Chemosphere 2017, 177, 65–76. [Google Scholar] [CrossRef]
- Liu, T.; Wang, H.; Zhang, Z.; Zhao, D. Application of synthetic iron-oxide coated zeolite for the pollution control of river sediments. Chemosphere 2017, 180, 160–168. [Google Scholar] [CrossRef]
- Jacobs, P.H.; Förstner, U. Concept of subaqueous capping of contaminated sediments with active barrier systems (ABS) using natural and modified zeolites. Water Res. 1999, 33, 2083–2087. [Google Scholar] [CrossRef]
- Lin, J.; Zhao, Y.; Zhan, Y.; Wang, Y. Control of internal phosphorus release from sediments using magnetic lanthanum/iron-modified bentonite as active capping material. Environ. Pollut. 2020, 264, 114809. [Google Scholar] [CrossRef] [PubMed]
- Zheng, H.; Liu, X.; Liu, G.; Luo, X.; Li, F.; Wang, Z. Comparison of the ecotoxicological effects of biochar and activated carbon on a marine clam (Meretrix meretrix). J. Clean. Prod. 2018, 180, 252–262. [Google Scholar] [CrossRef]
- Perelo, L.W. Review: In situ and bioremediation of organic pollutants in aquatic sediments. J. Hazard. Mater. 2010, 177, 81–89. [Google Scholar] [CrossRef] [PubMed]
- Gu, B.-W.; Hong, S.-H.; Lee, C.-G.; Park, S.-J. The feasibility of using bentonite, illite, and zeolite as capping materials to stabilize nutrients and interrupt their release from contaminated lake sediments. Chemosphere 2019, 219, 217–226. [Google Scholar] [CrossRef]
- Wang, M.; Zhu, Y.; Cheng, L.; Andserson, B.; Zhao, X.; Wang, D.; Ding, A. Review on utilization of biochar for metal-contaminated soil and sediment remediation. J. Environ. Sci. 2018, 63, 156–173. [Google Scholar] [CrossRef]
- Wu, J.; Lin, J.; Zhan, Y. Interception of phosphorus release from sediments using Mg/Fe-based layered double hydroxide (MF-LDH) and MF-LDH coated magnetite as geo-engineering tools. Sci. Total Environ. 2020, 739, 139749. [Google Scholar] [CrossRef]
- Todaro, F.; Barjoveanu, G.; De Gisi, S.; Teodosiu, C.; Notarnicola, M. Sustainability assessment of reactive capping alternatives for the remediation of contaminated marine sediments. J. Clean. Prod. 2021, 286, 124946. [Google Scholar] [CrossRef]
- Zukri, N.; Khamidun, M.; Sapiren, M.; Abdullah, S.; Rahman, M. Lake Water Quality Improvement by Using Waste Mussel Shell Powder as an Adsorbent. In IOP Conference Series: Earth and Environmental Science; IOP Publishing: Bristol, UK, 2018; p. 012057. [Google Scholar]
- Huh, J.-H.; Choi, Y.-H.; Lee, H.-J.; Choi, W.J.; Ramakrishna, C.; Lee, H.-W.; Lee, S.-H.; Ahn, J.-W. The use of oyster shell powders for water quality improvement of lakes by algal blooms removal. J. Korean Ceram. Soc. 2016, 53, 1–6. [Google Scholar] [CrossRef]
- Jones, M.I.; Wang, L.Y.; Abeynaike, A.; Patterson, D.A. Utilisation of waste material for environmental applications: Calcination of mussel shells for waste water treatment. Adv. Appl. Ceram. 2011, 110, 280–286. [Google Scholar] [CrossRef]
- Papadimitriou, C.A.; Krey, G.; Stamatis, N.; Kallianiotis, A. The use of waste mussel shells for the adsorption of dyes and heavy metals. J. Chem. Technol. Biotechnol. 2017, 92, 1943–1947. [Google Scholar] [CrossRef]
- Abeynaike, A.; Wang, L.; Jones, M.I.; Patterson, D.A. Pyrolysed powdered mussel shells for eutrophication control: Effect of particle size and powder concentration on the mechanism and extent of phosphate removal. Asia-Pac. J. Chem. Eng. 2011, 6, 231–243. [Google Scholar] [CrossRef]
- El Haddad, M.; Regti, A.; Laamari, M.R.; Slimani, R.; Mamouni, R.; El Antri, S.; Lazar, S. Calcined mussel shells as a new and eco-friendly biosorbent to remove textile dyes from aqueous solutions. J. Taiwan Inst. Chem. Eng. 2014, 45, 533–540. [Google Scholar] [CrossRef]
- Hussain, S.; Aziz, H.A.; Isa, M.H.; Ahmad, A.; Van Leeuwen, J.; Zou, L.; Beecham, S.; Umar, M. Orthophosphate removal from domestic wastewater using limestone and granular activated carbon. Desalination 2011, 271, 265–272. [Google Scholar] [CrossRef]
- Loganathan, P.; Vigneswaran, S.; Kandasamy, J.; Bolan, N.S. Removal and recovery of phosphate from water using sorption. Crit. Rev. Environ. Sci. Technol. 2014, 44, 847–907. [Google Scholar] [CrossRef]
- Lee, J.-I.; Kang, J.-K.; Hong, S.-H.; Lee, C.-G.; Jeong, S.; Park, S.-J. Thermally treated Mytilus coruscus shells for fluoride removal and their adsorption mechanism. Chemosphere 2021, 263, 128328. [Google Scholar] [CrossRef] [PubMed]
- Lee, J.I.; Park, S.J. Adsorption characteristics of calcined oyster shell for the removal of fluoride. J. Korean Soc. Environ. Eng. 2019, 41, 695–702. [Google Scholar] [CrossRef]
- Silva, T.H.; Mesquita-Guimarães, J.; Henriques, B.; Silva, F.S.; Fredel, M.C. The potential use of oyster shell waste in new value-added by-product. Resources 2019, 8, 13. [Google Scholar] [CrossRef]
- Martínez-García, C.; González-Fonteboa, B.; Martínez-Abella, F.; Carro-López, D. Performance of mussel shell as aggregate in plain concrete. Constr. Build. Mater. 2017, 139, 570–583. [Google Scholar] [CrossRef]
- Hamester, M.R.R.; Balzer, P.S.; Becker, D. Characterization of calcium carbonate obtained from oyster and mussel shells and incorporation in polypropylene. Mater. Res. 2012, 15, 204–208. [Google Scholar] [CrossRef]
- Eek, E.; Cornelissen, G.; Kibsgaard, A.; Breedveld, G.D. Diffusion of PAH and PCB from contaminated sediments with and without mineral capping; measurement and modelling. Chemosphere 2008, 71, 1629–1638. [Google Scholar] [CrossRef] [PubMed]
- Ministry of Environment Korea. Standard Methods for the Analysis of Water and Wastewater; Ministry of Environment Korea: Sejong City, Korea, 2007.
- Lin, J.; Zhan, Y.; Zhu, Z. Evaluation of sediment capping with active barrier systems (ABS) using calcite/zeolite mixtures to simultaneously manage phosphorus and ammonium release. Sci. Total Environ. 2011, 409, 638–646. [Google Scholar] [CrossRef] [PubMed]
- Schaanning, M.; Breyholtz, B.; Skei, J. Experimental results on effects of capping on fluxes of persistent organic pollutants (POPs) from historically contaminated sediments. Mar. Chem. 2006, 102, 46–59. [Google Scholar] [CrossRef]
- Eek, E.; Godøy, O.; Aagaard, P.; Breedveld, G.D. Experimental determination of efficiency of capping materials during consolidation of metal-contaminated dredged material. Chemosphere 2007, 69, 719–728. [Google Scholar] [CrossRef]
- Hieltjes, A.H.; Lijklema, L. Fractionation of Inorganic Phosphates in Calcareous Sediments; Wiley Online Library: Hoboken, NJ, USA, 1980. [Google Scholar]
- Liikanen, A.; Murtoniemi, T.; Tanskanen, H.; Väisänen, T.; Martikainen, P.J. Effects of temperature and oxygenavailability on greenhouse gas and nutrient dynamics in sediment of a eutrophic mid-boreal lake. Biogeochemistry 2002, 59, 269–286. [Google Scholar] [CrossRef]
- Himmelheber, D.W.; Pennell, K.D.; Hughes, J.B. Natural attenuation processes during in situ capping. Environ. Sci. Technol. 2007, 41, 5306–5313. [Google Scholar] [CrossRef] [PubMed]
- Jiao, Y.; Xu, L.; Li, Q.; Gu, S. Thin-layer fine-sand capping of polluted sediments decreases nutrients in overlying water of Wuhan Donghu Lake in China. Environ. Sci. Pollut. Res. 2020, 27, 7156–7165. [Google Scholar] [CrossRef]
- Wang, Y.; Wang, W.-H.; Yan, F.-L.; Ding, Z.; Feng, L.-L.; Zhao, J.-C. Effects and mechanisms of calcium peroxide on purification of severely eutrophic water. Sci. Total Environ. 2019, 650, 2796–2806. [Google Scholar] [CrossRef]
- Kim, B.-G.; Khirul, M.A.; Cho, D.; Kwon, S.-H. The effect of calcium peroxide originating from oyster shell powder on control of phosphorus compounds in oceanic sediment. Korean J. Chem. Eng. 2020, 37, 105–110. [Google Scholar] [CrossRef]
- Gibbs, M.M.; Hickey, C.W. Flocculants and Sediment Capping for Phosphorus Management. In Lake Restoration Handbook; Springer: Berlin, Germany, 2018; pp. 207–265. [Google Scholar]
- Knox, A.S.; Paller, M.H.; Roberts, J. Active capping technology—New approaches for in situ remediation of contaminated sediments. Remediat. J. 2012, 22, 93–117. [Google Scholar] [CrossRef]
- Khirul, M.A.; Kim, B.-G.; Cho, D.; Yoo, G.; Kwon, S.-H. Effect of oyster shell powder on nitrogen releases from contaminated marine sediment. Environ. Eng. Res. 2020, 25, 230–237. [Google Scholar] [CrossRef] [Green Version]
- Hong, S.-H.; Lee, J.-I.; Lee, C.-G.; Park, S.-J. Effect of temperature on capping efficiency of zeolite and activated carbon under fabric mats for interrupting nutrient release from sediments. Sci. Rep. 2019, 9, 15754. [Google Scholar] [CrossRef] [PubMed]
- Camargo, J.A.; Alonso, Á. Ecological and toxicological effects of inorganic nitrogen pollution in aquatic ecosystems: A global assessment. Environ. Int. 2006, 32, 831–849. [Google Scholar] [CrossRef] [PubMed]
- Huang, J.; Kankanamge, N.R.; Chow, C.; Welsh, D.T.; Li, T.; Teasdale, P.R. Removing ammonium from water and wastewater using cost-effective adsorbents: A review. J. Environ. Sci. 2018, 63, 174–197. [Google Scholar] [CrossRef] [PubMed]
- Hong, S.-H.; Lee, C.-G.; Park, S.-J. Application of calcium-rich mineral under nonwoven fabric mats and sand armor as cap layer for interrupting N and P release from river sediments. Environ. Sci. Pollut. Res. 2022, 29, 59444–59455. [Google Scholar] [CrossRef]
- Lampert, D.J.; Sarchet, W.V.; Reible, D.D. Assessing the effectiveness of thin-layer sand caps for contaminated sediment management through passive sampling. Environ. Sci. Technol. 2011, 45, 8437–8443. [Google Scholar] [CrossRef]
- Jenkins, C.H. Nutrient Flux Assessment in the Port Waterways; Environment Protection Authority: Parramatta, Australia, 2005.
- Le Tissier, M.; Buddemeier, R.; Parslow, J.; Swaney, D.; Crossland, C.; Smith, S.; Whyte, H.; Dennison, W.; Hills, J.; Kremer, H. The Role of the Coastal Ocean in the Disturbed and Undisturbed Nutrient and Carbon Cycles–A Management Perspective; LOICZ: Geesthacht, Germany, 2006. [Google Scholar]
- Lee, J.-I.; Oh, J.-S.; Yoo, S.-C.; Jho, E.H.; Lee, C.-G.; Park, S.-J. Removal of phosphorus from water using calcium-rich organic waste and its potential as a fertilizer for rice growth. J. Environ. Chem. Eng. 2022, 10, 107367. [Google Scholar] [CrossRef]
- Lu, M.; Shi, X.; Feng, Q.; Zhang, M.; Guo, Y.; Dong, X.; Guo, R. Modification of oyster shell powder by humic acid for ammonium removal from aqueous solutions and nutrient retention in soil. J. Environ. Chem. Eng. 2021, 9, 106708. [Google Scholar] [CrossRef]
- Kim, G.; Jung, W. Role of sand capping in phosphorus release from sediment. KSCE J. Civ. Eng. 2010, 14, 815–821. [Google Scholar] [CrossRef]
- Burley, K.L.; Prepas, E.E.; Chambers, P.A. Phosphorus release from sediments in hardwater eutrophic lakes: The effects of redox-sensitive and-insensitive chemical treatments. Freshw. Biol. 2001, 46, 1061–1074. [Google Scholar] [CrossRef]
- Ajmal, Z.; Muhmood, A.; Usman, M.; Kizito, S.; Lu, J.; Dong, R.; Wu, S. Phosphate removal from aqueous solution using iron oxides: Adsorption, desorption and regeneration characteristics. J. Colloid Interface Sci. 2018, 528, 145–155. [Google Scholar] [CrossRef] [PubMed]
- Guo, Z.; Li, J.; Guo, Z.; Guo, Q.; Zhu, B. Phosphorus removal from aqueous solution in parent and aluminum-modified eggshells: Thermodynamics and kinetics, adsorption mechanism, and diffusion process. Environ. Sci. Pollut. Res. 2017, 24, 14525–14536. [Google Scholar] [CrossRef] [PubMed]
Figure 1.
Experimental setup of table-size incubation systems to evaluate the efficiency of capping materials and sand armor thickness.
Figure 1.
Experimental setup of table-size incubation systems to evaluate the efficiency of capping materials and sand armor thickness.

Figure 2.
Effects of capping material on (a) dissolved oxygen (DO) concentration, (b) pH, and (c) electrical conductivity (EC) in the overlying water under different capping conditions during the 63-day incubation period.
Figure 2.
Effects of capping material on (a) dissolved oxygen (DO) concentration, (b) pH, and (c) electrical conductivity (EC) in the overlying water under different capping conditions during the 63-day incubation period.

Figure 3.
Effects of capping material and composition on the release of (a) NH4-N, (b) NO3-N, and (c) T-N from capped and uncapped sediments during the 63-day incubation period.
Figure 3.
Effects of capping material and composition on the release of (a) NH4-N, (b) NO3-N, and (c) T-N from capped and uncapped sediments during the 63-day incubation period.

Figure 4.
T-N, NH4-N, and T-P concentrations in pore water following the completion of the incubation experiments.
Figure 4.
T-N, NH4-N, and T-P concentrations in pore water following the completion of the incubation experiments.

Figure 5.
Effects of capping material and composition on the release of (a) PO4-P and (b) T-P from capped and uncapped sediments during the 63-day incubation period.
Figure 5.
Effects of capping material and composition on the release of (a) PO4-P and (b) T-P from capped and uncapped sediments during the 63-day incubation period.

Figure 6.
Adsorbed-P, NAI-P, Apatite-P, and Residual-P fraction of P present in the sediments beneath the overlying water and capping layer. (a) P content (mg/kg) and (b) P fraction (%).
Figure 6.
Adsorbed-P, NAI-P, Apatite-P, and Residual-P fraction of P present in the sediments beneath the overlying water and capping layer. (a) P content (mg/kg) and (b) P fraction (%).


Table 1.
Properties of water and sediment sampled from Geum river.
| River Water | Sediment | ||
|---|---|---|---|
| Property | Value | Property | Value |
| pH | 7.49 | Water contents (%) | 76.43 |
| EC (µS/cm) | 489 | pH | 6.81 |
| DO (mg/L) | 8.06 | EC (µS/cm) | 250 |
| SS (mg/L) | 230 | IL (%) | 9.98 |
| T-N (mg/L) | 3.67 | T-N (mg/kg) | 3269 |
| NH4-N (mg/L) | 0.14 | NH4-N (mg/kg) | 47.39 |
| NO3-N (mg/L) | 3.67 | NO3-N (mg/kg) | 2.97 |
| T-P (mg/L) | 0.07 | T-P (mg/kg) | 915 |
| PO4-P (mg/L) | 0.03 | SRP (mg/kg) | 68.91 |
| ORP (mV) | -30.7 | ORP (mV) | 5.50 |
Table 2.
Dissolved oxygen (DO) concentration (mg/L), pH, and electric conductivity (EC, μS/cm) under uncapped and capped conditions.
Table 2.
Dissolved oxygen (DO) concentration (mg/L), pH, and electric conductivity (EC, μS/cm) under uncapped and capped conditions.
| NAC/ SA0 | NAC/ SA1 | NAC/ SA3 | OS/ SA0 | OS/ SA1 | OS/ SA3 | MS/ SA0 | MS/ SA1 | MS/ SA3 | |
|---|---|---|---|---|---|---|---|---|---|
| DO (mg/L) | 1.57 ± 1.17 | 2.72 ± 1.28 | 3.47 ± 1.01 | 1.92 ± 1.22 | 2.26 ± 1.08 | 2.92 ± 1.14 | 2.36 ± 1.22 | 2.32 ± 1.11 | 2.83 ± 1.18 |
| pH | 7.34 ± 0.12 | 7.32 ± 0.28 | 7.36 ± 0.15 | 9.11 ± 1.67 | 8.31 ± 0.85 | 7.91 ± 0.46 | 12.16 ± 1.59 | 11.54 ± 1.66 | 10.37 ± 1.70 |
| EC (μS/cm) | 623 ± 77 | 561 ± 45 | 550 ± 42 | 925 ± 180 | 779 ± 197 | 710 ± 163 | 5882 ± 3259 | 2586 ± 1703 | 684 ± 229 |
Table 3.
Nutrient fluxes (mg/m2d) and capping efficiency (CE) (%) under uncapped and capped conditions.
Table 3.
Nutrient fluxes (mg/m2d) and capping efficiency (CE) (%) under uncapped and capped conditions.
| NAC/ SA0 | NAC/ SA1 | NAC/ SA3 | OS/ SA0 | OS/ SA1 | OS/ SA3 | MS/ SA0 | MS/ SA1 | MS/ SA3 | ||
|---|---|---|---|---|---|---|---|---|---|---|
| NH4-N | Flux (mg/m2d) CE (%) | 35.9 | 16.0 55.5 | 6.8 81.1 | 9.8 72.8 | 3.0 91.7 | 2.8 92.2 | 60.9 −69.3 | 49.2 −36.8 | 16.2 54.9 |
| T-N | Flux (mg/m2d) CE (%) | 39.1 | 24.3 37.7 | 22.3 43.0 | 36.0 7.9 | 22.6 42.1 | 19.0 51.4 | 82.0 −109.7 | 54.3 −39.0 | 30.0 23.2 |
| PO4-P | Flux (mg/m2d) CE (%) | 1.31 | 0.70 46.8 | 0.21 84.2 | 0.13 90.4 | 0.03 97.9 | −0.02 101.3 | −0.02 101.5 | −0.01 100.8 | 0.02 98.5 |
| T-P | Flux (mg/m2d) CE (%) | 2.17 | 0.75 65.3 | 0.24 89.1 | 0.89 59.1 | 0.52 76.0 | 0.15 93.3 | 0.15 93.0 | 0.06 97.0 | −0.04 102.0 |
Publisher’s Note: MDPI stays neutral with regard to jurisdictional claims in published maps and institutional affiliations. |
© 2022 by the authors. Licensee MDPI, Basel, Switzerland. This article is an open access article distributed under the terms and conditions of the Creative Commons Attribution (CC BY) license (https://creativecommons.org/licenses/by/4.0/).
Share and Cite
MDPI and ACS Style
Quansah, J.O.; Hong, S.-H.; Lee, C.-G.; Park, S.-J. Application of Activated Seashells and Sand Armor for Disrupting N and P Release from River Sediments. Water 2022, 14, 2875. https://doi.org/10.3390/w14182875
AMA Style
Quansah JO, Hong S-H, Lee C-G, Park S-J. Application of Activated Seashells and Sand Armor for Disrupting N and P Release from River Sediments. Water. 2022; 14(18):2875. https://doi.org/10.3390/w14182875
Chicago/Turabian StyleQuansah, Jude Ofei, Seung-Hee Hong, Chang-Gu Lee, and Seong-Jik Park. 2022. "Application of Activated Seashells and Sand Armor for Disrupting N and P Release from River Sediments" Water 14, no. 18: 2875. https://doi.org/10.3390/w14182875
Note that from the first issue of 2016, this journal uses article numbers instead of page numbers. See further details here.