Article

Overflow Tests on Grass-Covered Embankments at the Living Lab Hedwige-Prosperpolder: An Overview

1
Flood Defence Technology, Deltares, 2629 HV Delft, The Netherlands
2
Department of Hydraulic Engineering, Faculty of Civil Engineering and Geosciences, Delft University of Technology, 2628 CN Delft, The Netherlands
3
Flanders Hydraulics Research, 2140 Antwerp, Belgium
4
Rijkswaterstaat WVL, 8224 AD Lelystad, The Netherlands
5
STOWA, 3800 CD Amersfoort, The Netherlands
*
Author to whom correspondence should be addressed.
Water 2022, 14(18), 2859; https://doi.org/10.3390/w14182859
Submission received: 31 July 2022 / Revised: 31 August 2022 / Accepted: 6 September 2022 / Published: 13 September 2022

Abstract

:
In regions with a temperate climate, a well-maintained grass sod on a clay layer is considered a reliable protection for dams and dikes. In the Living Lab Hedwige-Prosperpolder, on the left bank of the Scheldt river straddling the border between Belgium and the Netherlands, a series of 27 overflow tests with a purpose-built overflow generator has been executed to determine the strength of the protective layer against erosion at various conditions. The goal of this paper is to inform on the executed test program and the initial results. From the results, it was concluded that in general, a high-quality grass cover on the landside dike slope can withstand high overflow discharges well for 12 to 30 h, without severe erosion damage. Anomalies, such as the presence of animal burrows, reed vegetation, and already present deformations can strongly reduce the resistance of the cover layer and may lead to failure within a couple of hours.

1. Introduction

In regions with a moderate climate, like Belgium and The Netherlands, a well-maintained grass sod on a clay layer is considered a reliable protection for dams and dikes [1]. Due to the expansion of the Western Scheldt the loss of nature had to be compensated. For this reason, the Hedwige-Prosperpolder was proposed to be inundated and converted into a wetland. As a consequence, the local dikes bordering the polder lost their water retaining function. This opened up the opportunity to learn more about the strength of the dikes under simulated extreme conditions, and the initiative of the Living Lab Hedwige-Prosperpolder (LL HPP) was born. In both winters of 2020–2021 and 2021–2022, the EU Interreg 2 Seas project, Polder2C’s, performed full scale destructive tests on dikes within the LL HPP and provided engineers with the opportunity to study the actual strength of real dikes.
Overflow tests performed on vegetated covers in the past, performed in Australia [2] and the United States [3], already demonstrated the overflow resistance of grass as summarized in CIRIA report 71 [4]. In more recent overflow tests, discharges up to 550 l/s/m, corresponding to a water depth at the crest of around 30 cm, did not result in any damage of the grass cover [5,6]. Since 2007, wave overtopping tests have been performed to test the effects of intermittent waterflows on the landslide slope with a fully developed grass cover [7,8]. Later on, a wave impact generator was developed to test the impact of waves on a grass sod on the waterside slope [9,10]. However, in all these studies the impact of external factors and defects was either not, or hardly accounted for. At the LL HPP the overflow generator was applied to induce an overflow on grass sections with animal burrows, trees, and repaired sections. The goal of this paper is to inform on the performed test program and the initial results on the overflow test programme executed during tests in the LL HPP. The outcomes of these experiments were compared against a test on a high-quality grass cover to quantify the influence of anomalies.

2. Materials and Methods

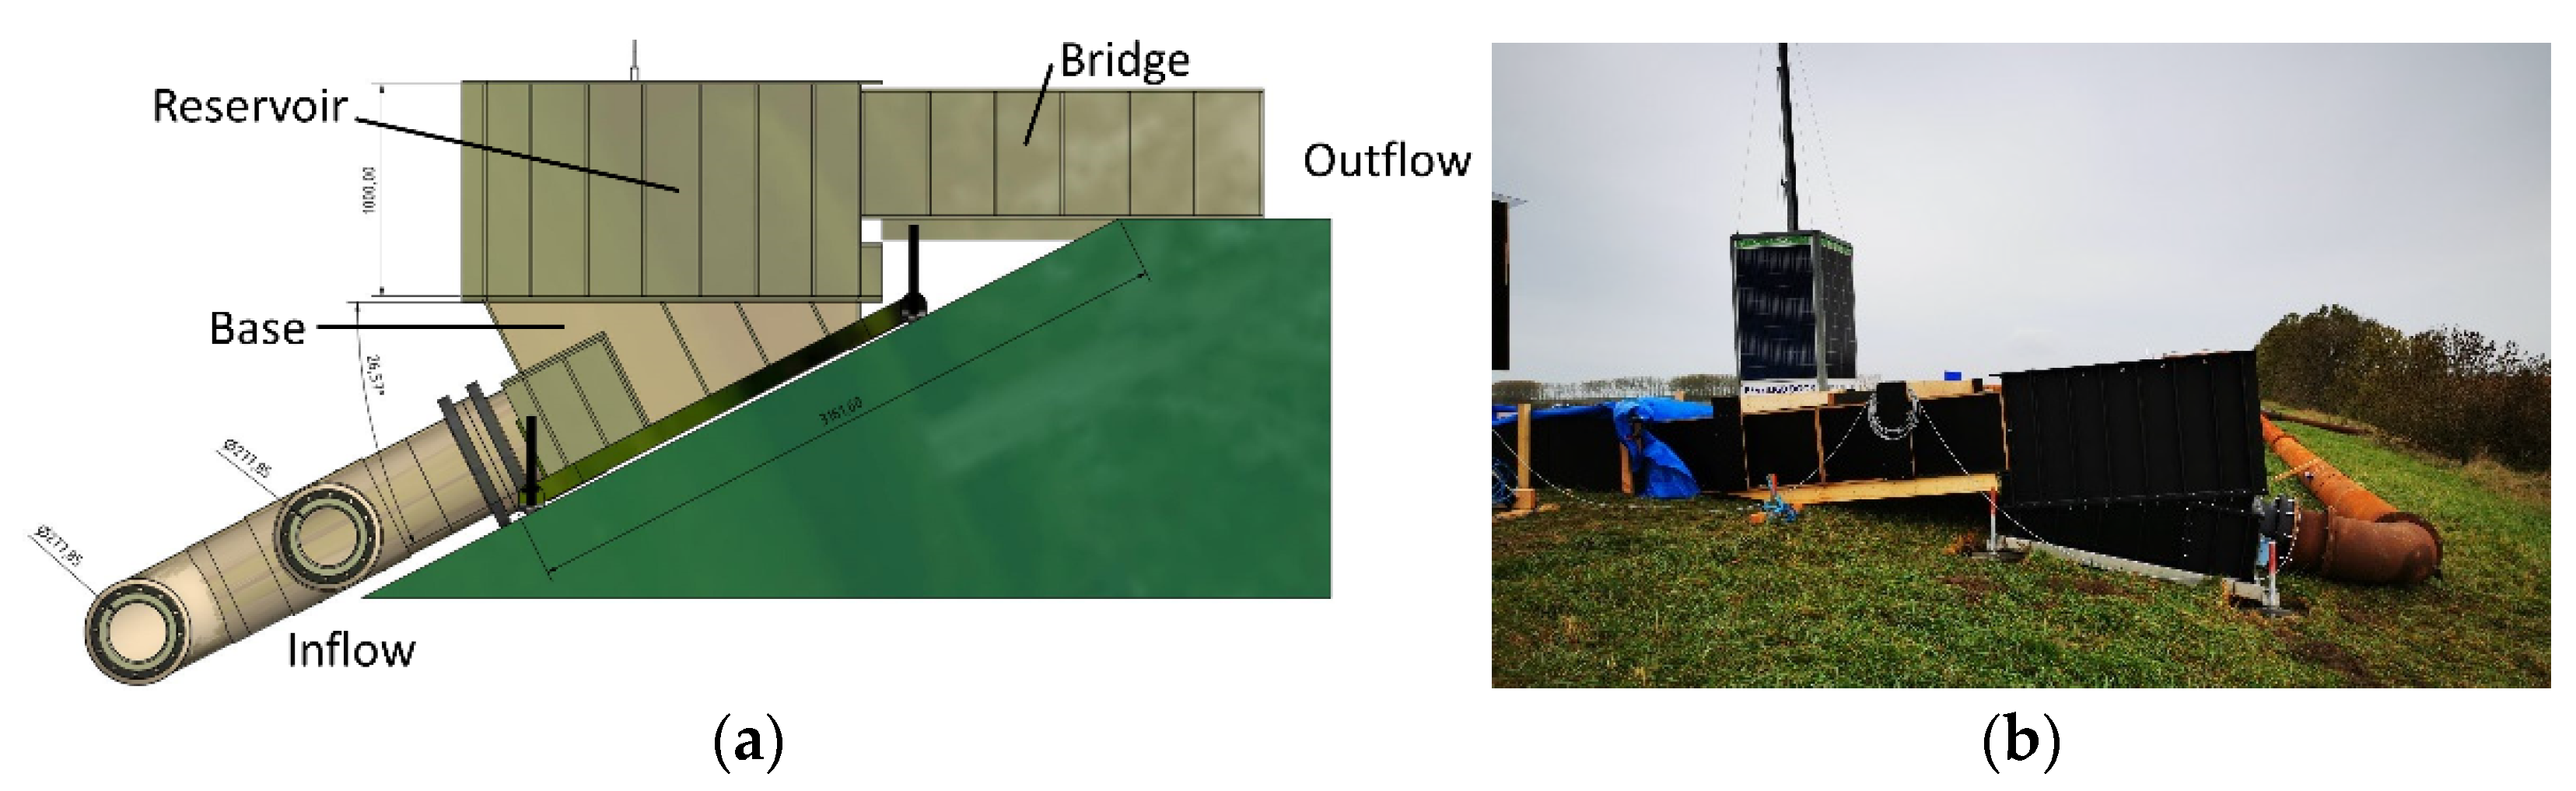
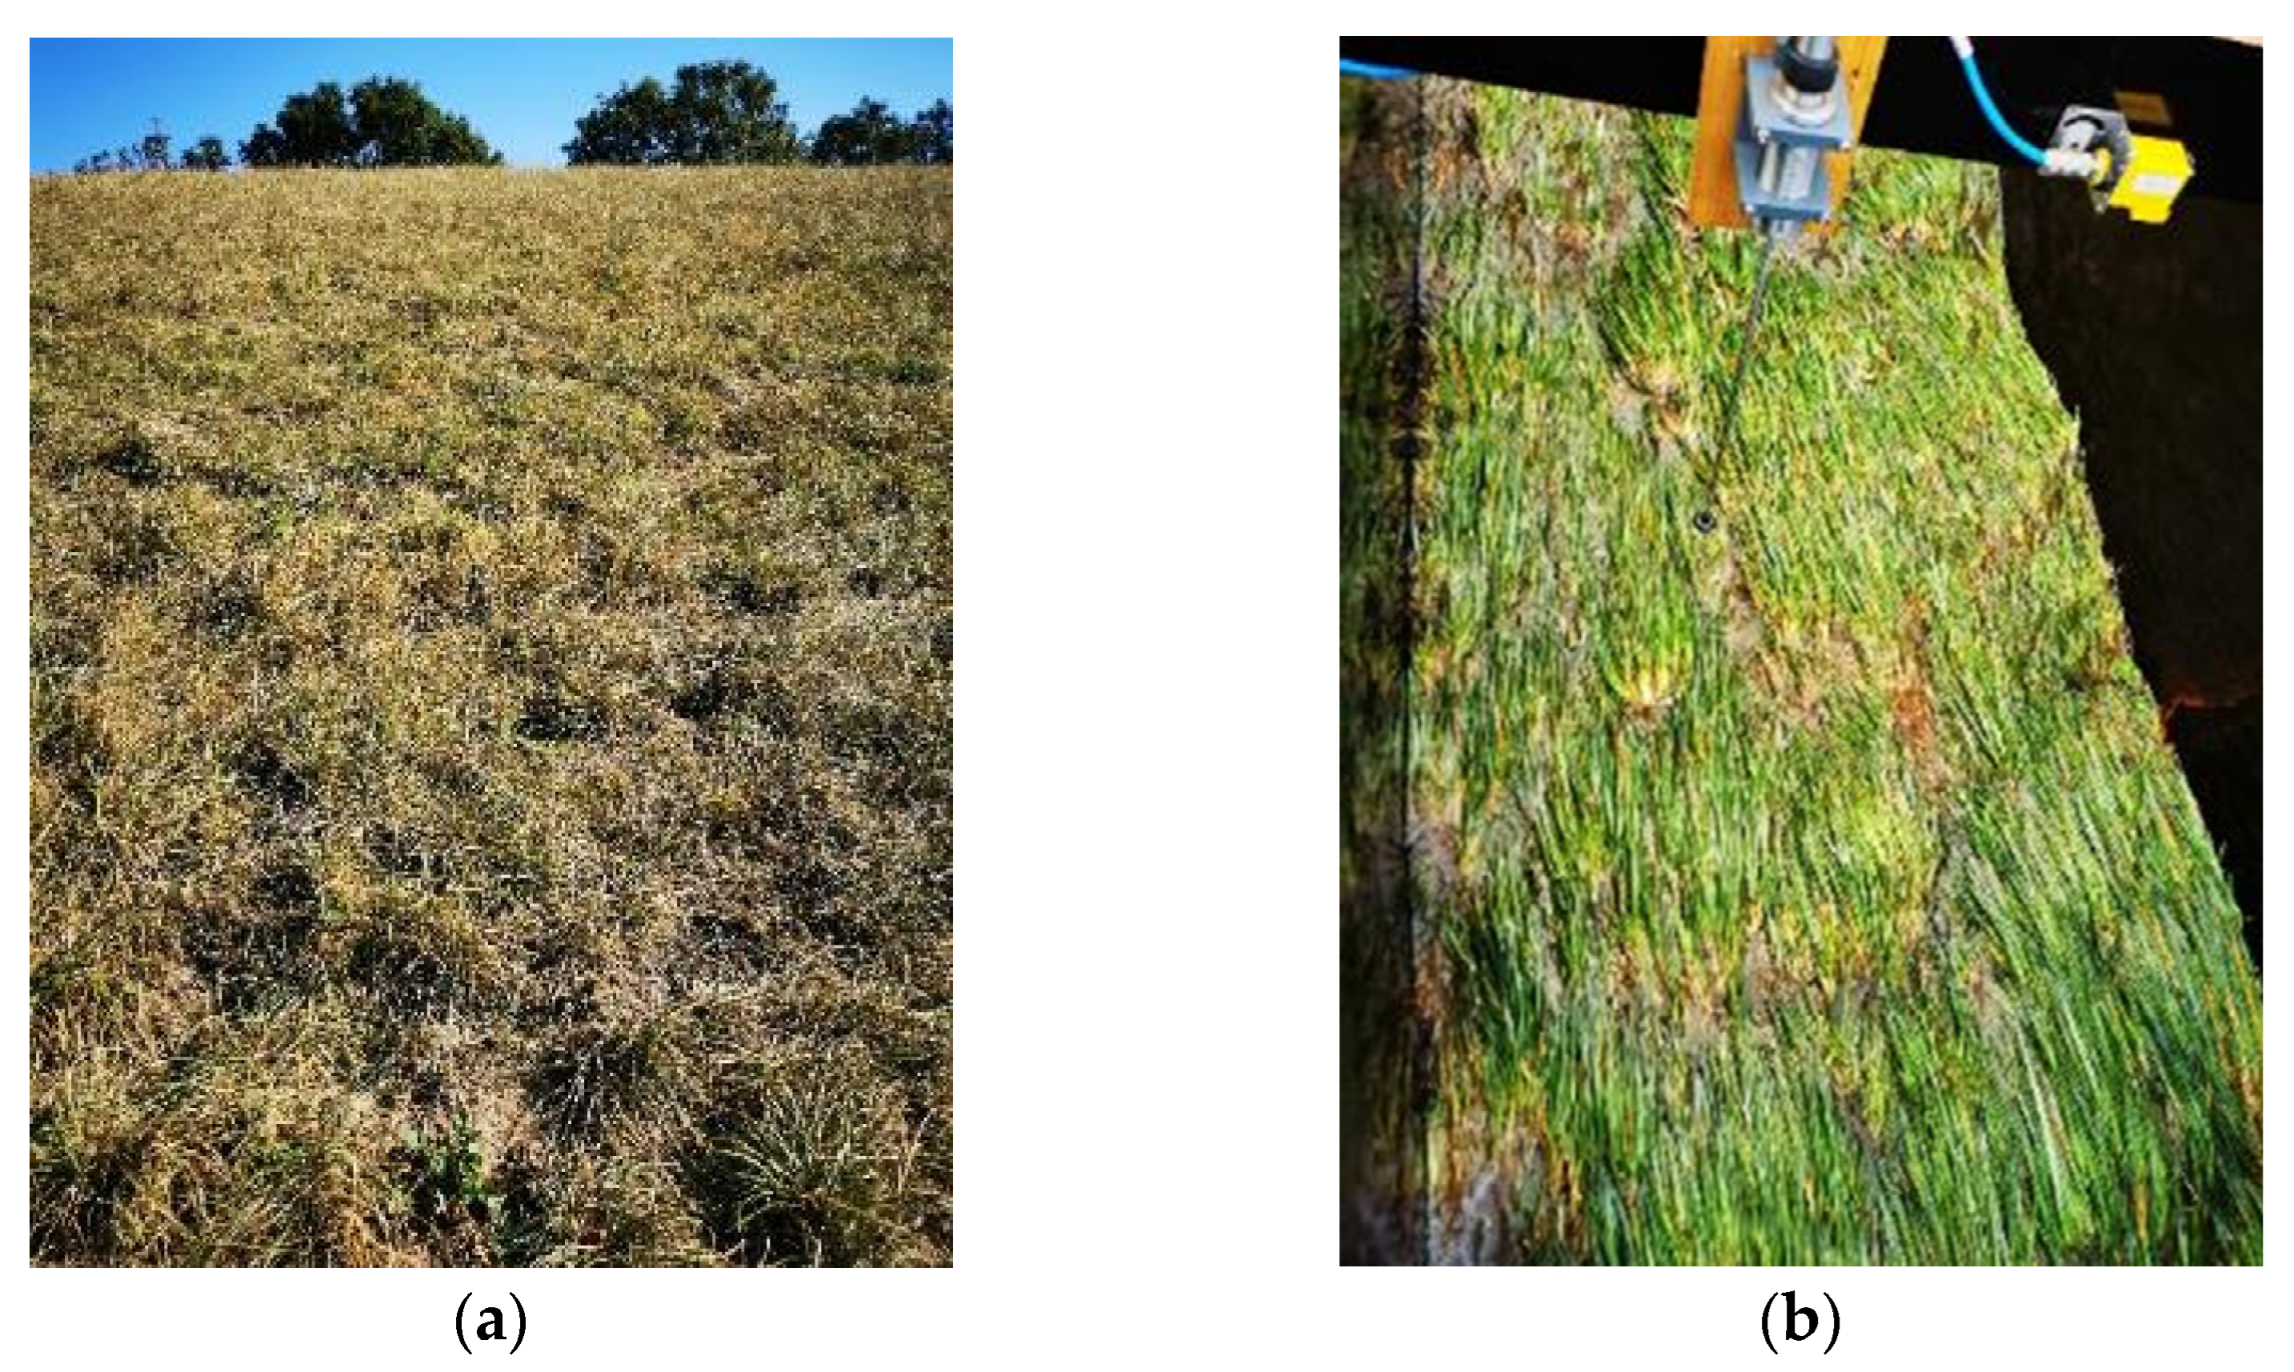
2.1. The Overflow Simulator

For the overflow experiments, an overflow generator was developed at Flanders Hydraulics Research [11]. The purpose of the generator is to uniformly distribute a flow of water over the dike crest over a (design) width of 2 m. The overflow generator has been designed in CAD software (Autodesk Inventor Professional 2020) and constructed of High-Density Polyethylene (HDPE). It is made up of 3 separate elements (a base, a reservoir, and a bridge) to facilitate transport; the elements are easily joined by bolts in the field (see Figure 1a).
The overflow generator allows for pipes, through which water is pumped, to be connected to an inlet structure at the rear base element (see Figure 1b). The water is led through a diffusor plate built into the base element to decrease jet formation whilst the upper part of the generator is filled to a height depending on the inlet discharge. As the water flows away freely, it is led over a bridge structure onto the dike crest and then flows downwards between coated hardboard plates installed on the dike slope (see Figure 2). Sensor and camera frames are placed over the test section to allow for monitoring of the experiment.
During an overflow test, the overflow generator is positioned on the dike slope near the crest; in the case of the Polder2C’s experiments, this was the riverside slope. Using a frequency modulated pump setup (driving a dual Hidrostal I16K-SS in 2020 and spring 2021) or a combination of BBA pumps BA300 and BA500, a predefined discharge was pumped into the overflow simulator. During the Polder2C’s experiments, discharges as low as 50 l/s/m and as high as 550 l/s/m have been applied.

2.2. The Test Setup at the Dike
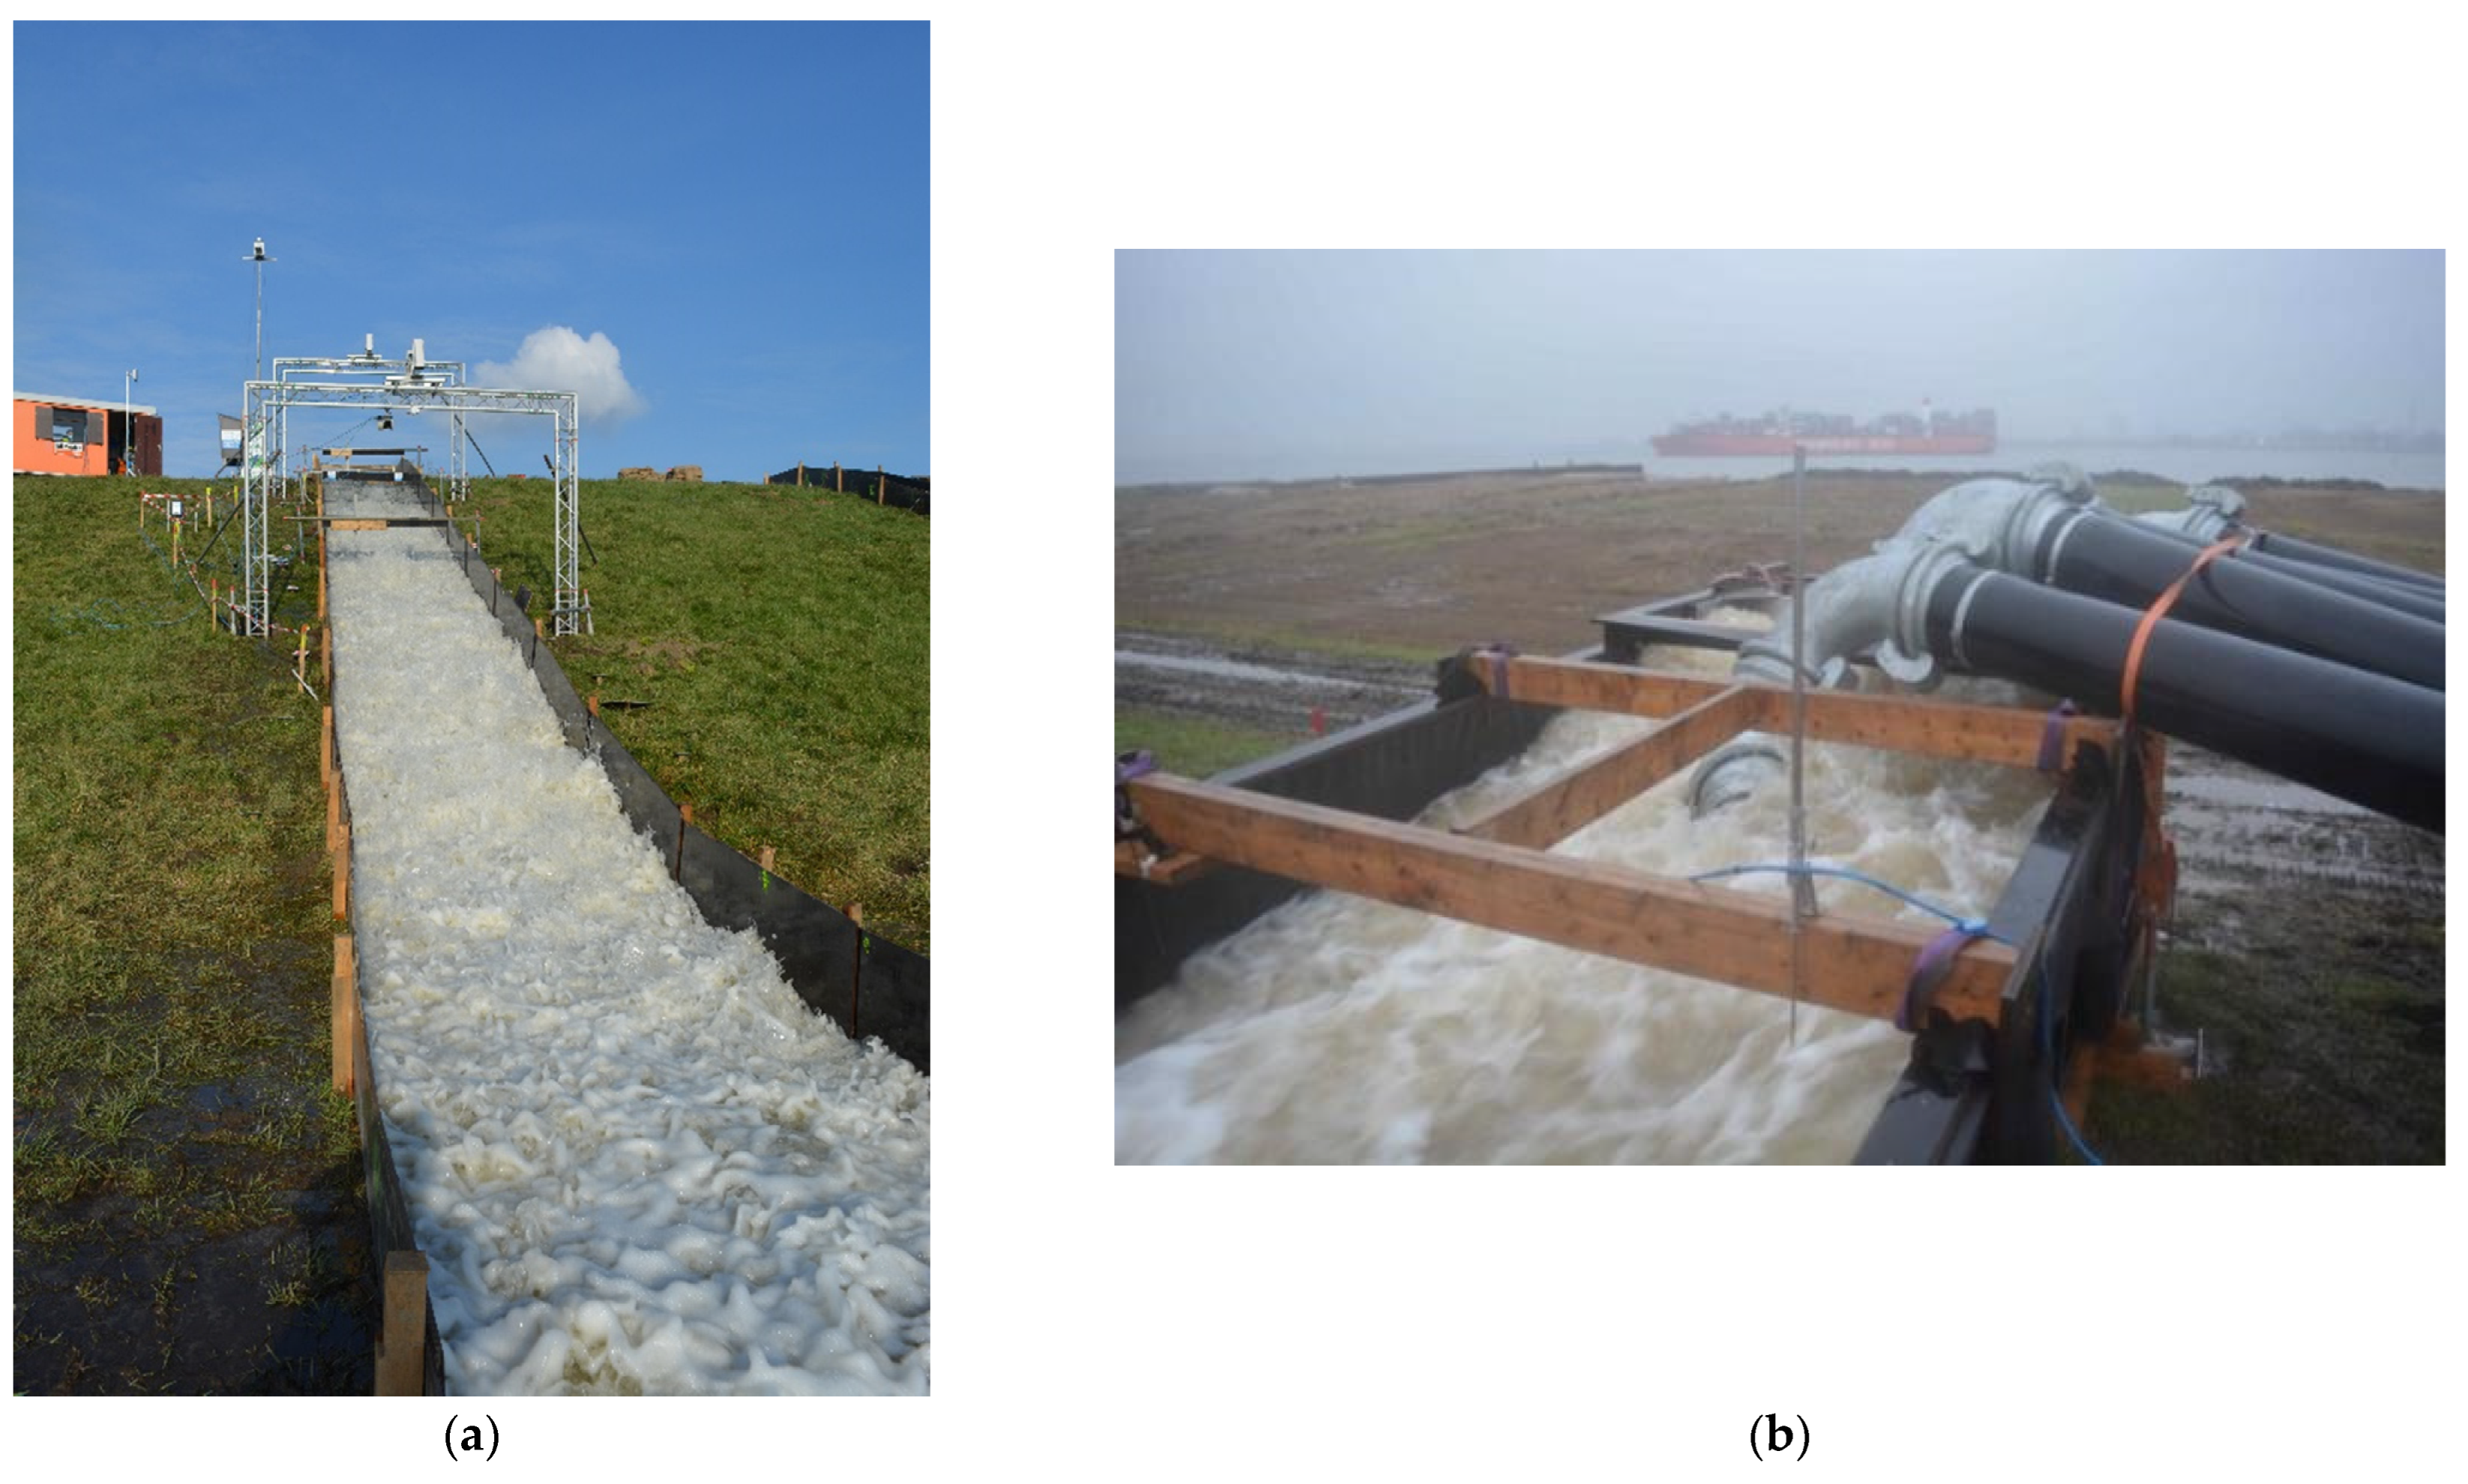
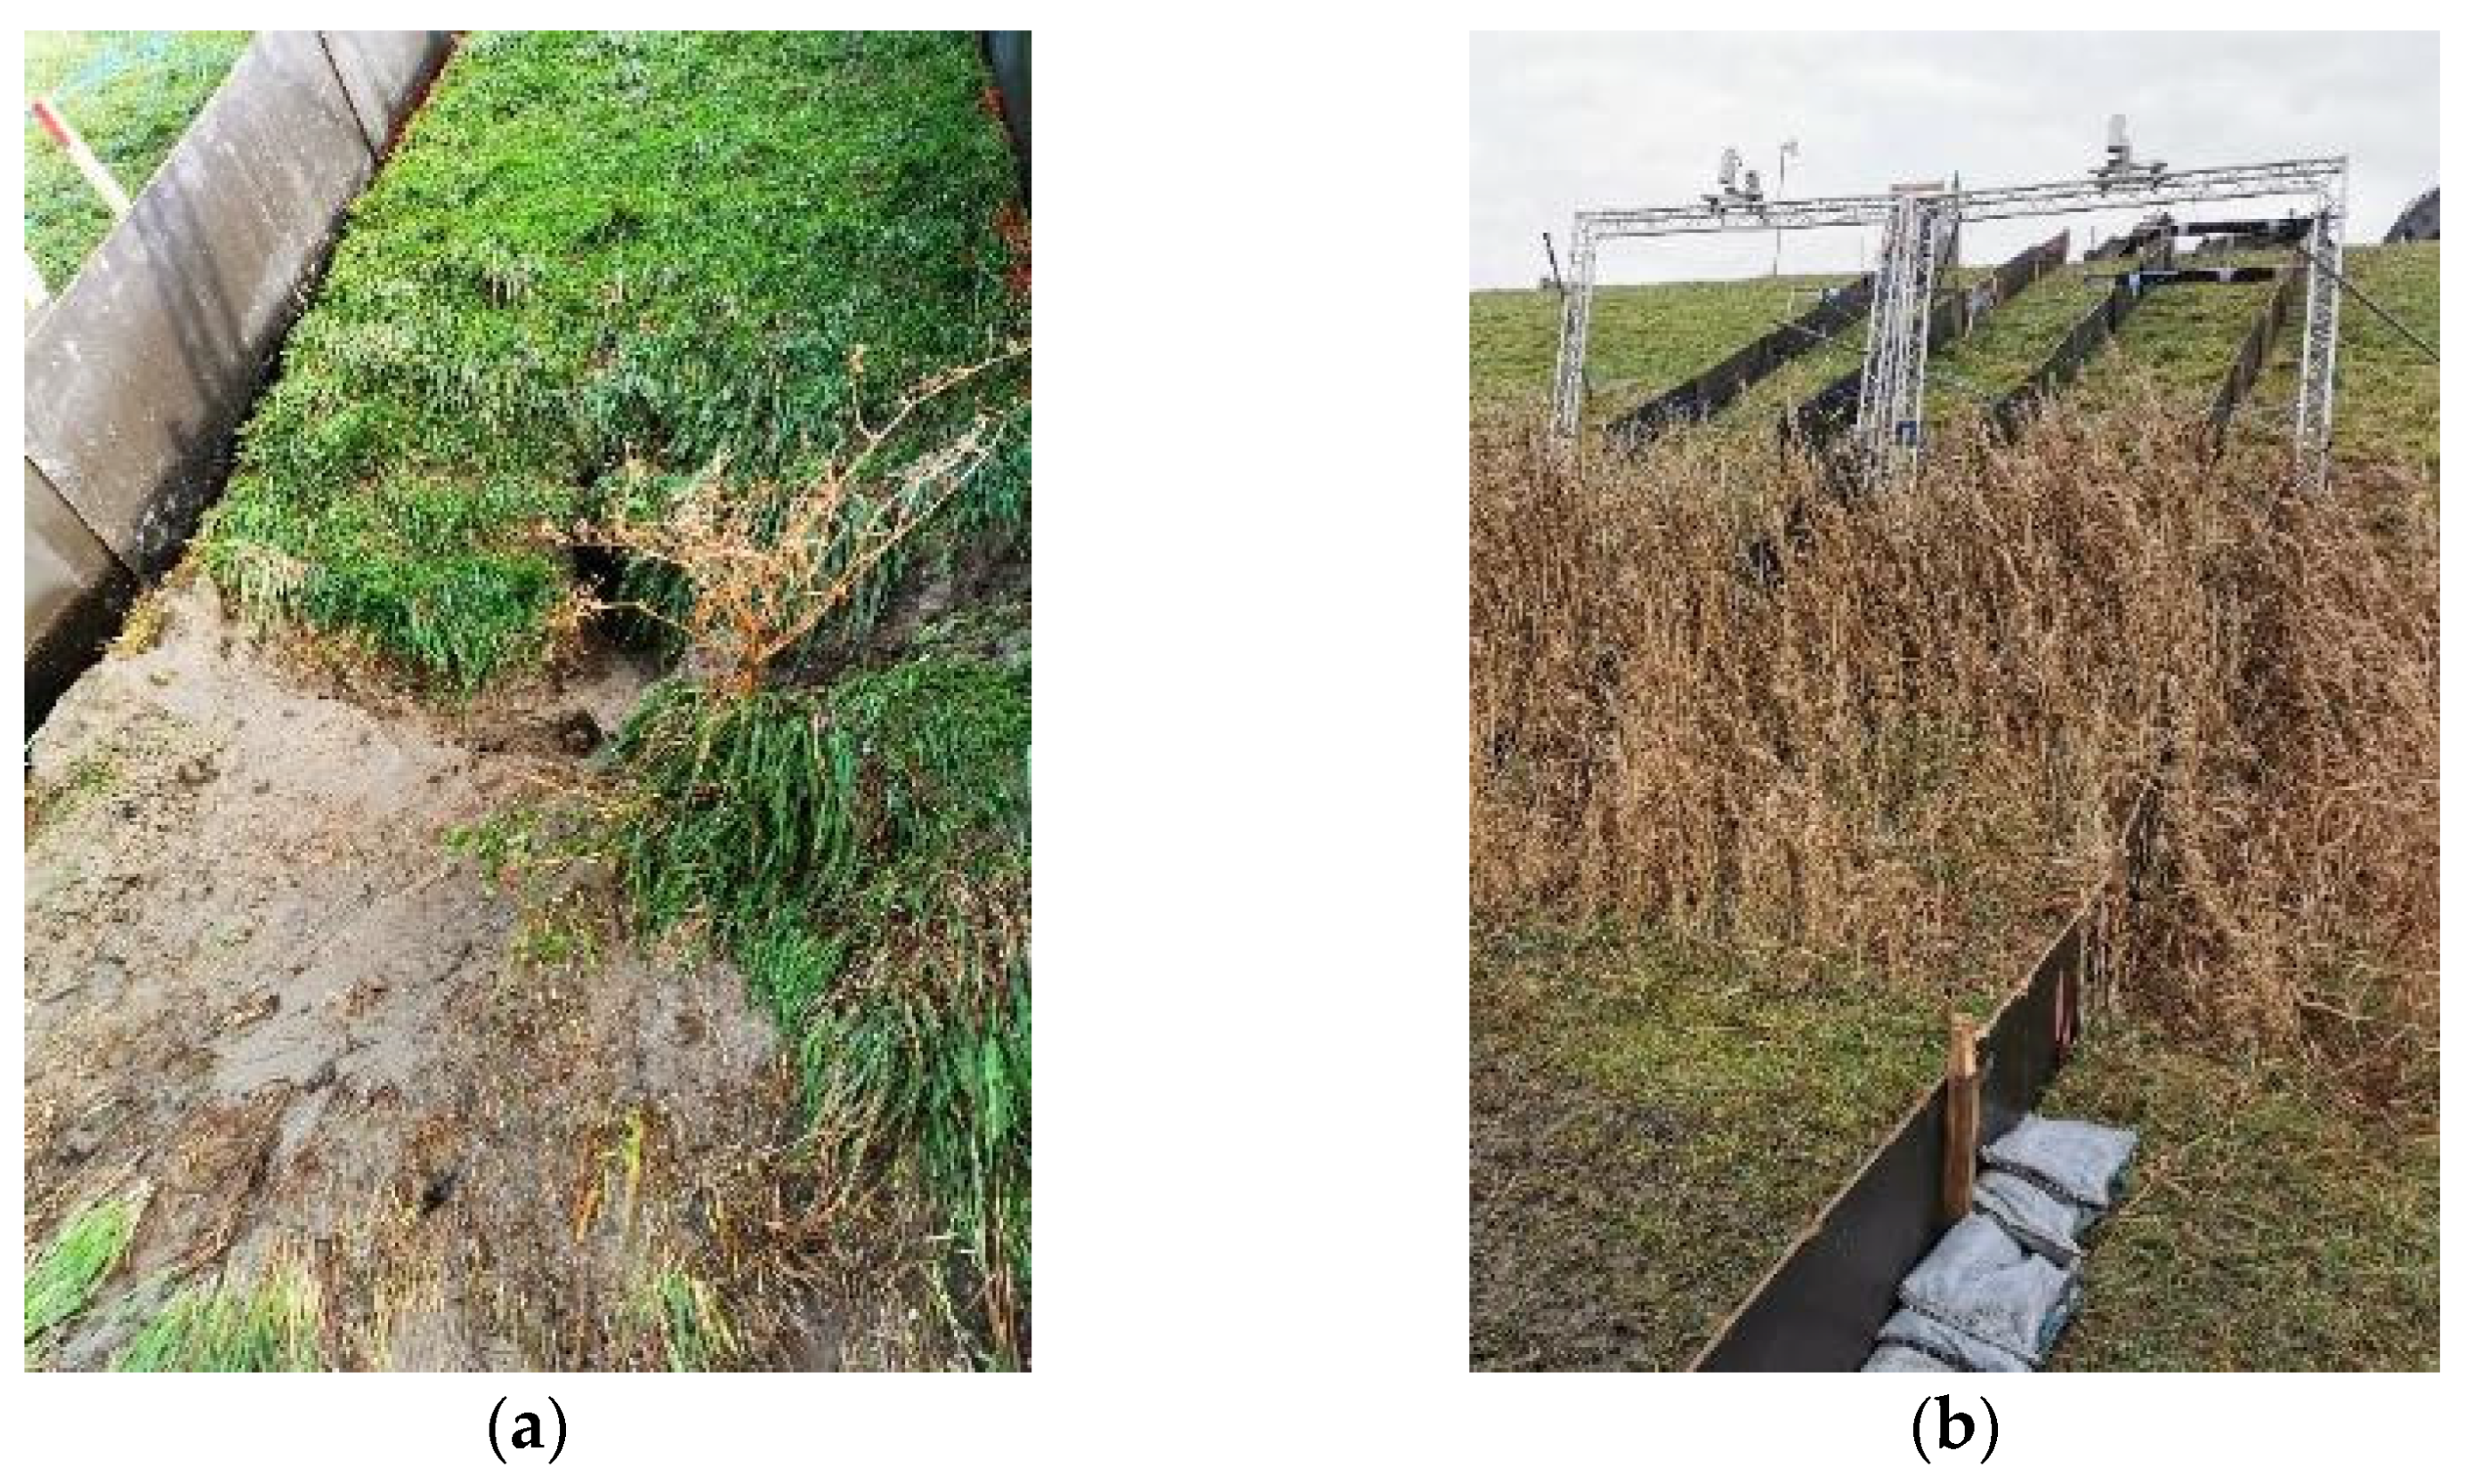
2.2.1. Flow Canal

The flow canal used for directing the water flow over the grass cover of the dike was 2 m wide. At the crest of the dike it was connected to the overflow generator. Both sides of the flow canal were made of coated hardboard plates of 2 × 0.7 × 0.01 m. The plates were hammered and sliced into the ground to a depth varying between 7 and 15 cm deep. The plates were screwed to wooden poles of a size of approximately 0.1–0.1–1.0 m with one pointed end. The poles were hammered into the ground to a depth of approximately 0.2–0.3 m. Figure 3a shows a typical flow canal that was realized on virtually every test section during the overflow experiment. Figure 3b shows the uppermost part at the maximum discharge.
To prevent water leakage at the crest, between the overflow generator and the flow canal over the vegetated cover of the dike, EPDM-sheets were applied in the inner side of the flow canal to guide the flow across the crest of the dike.
Water leakage occurred frequently during the overflow experiments at the outside of the flow canal. Sandbags were used to limit the leakage and prevent erosion at the leakage pathways.

2.2.2. Test Plan and Goals of Each Test

The initial test plan [12] aimed at determining the resistance to failure of different dike covers conditions under various, yet conceivable loading situations. For this reason both baseline (or reference) conditions, and conditions with anomalies and various repair measures were tested. Three types of anomalies were part of the initial study plan:
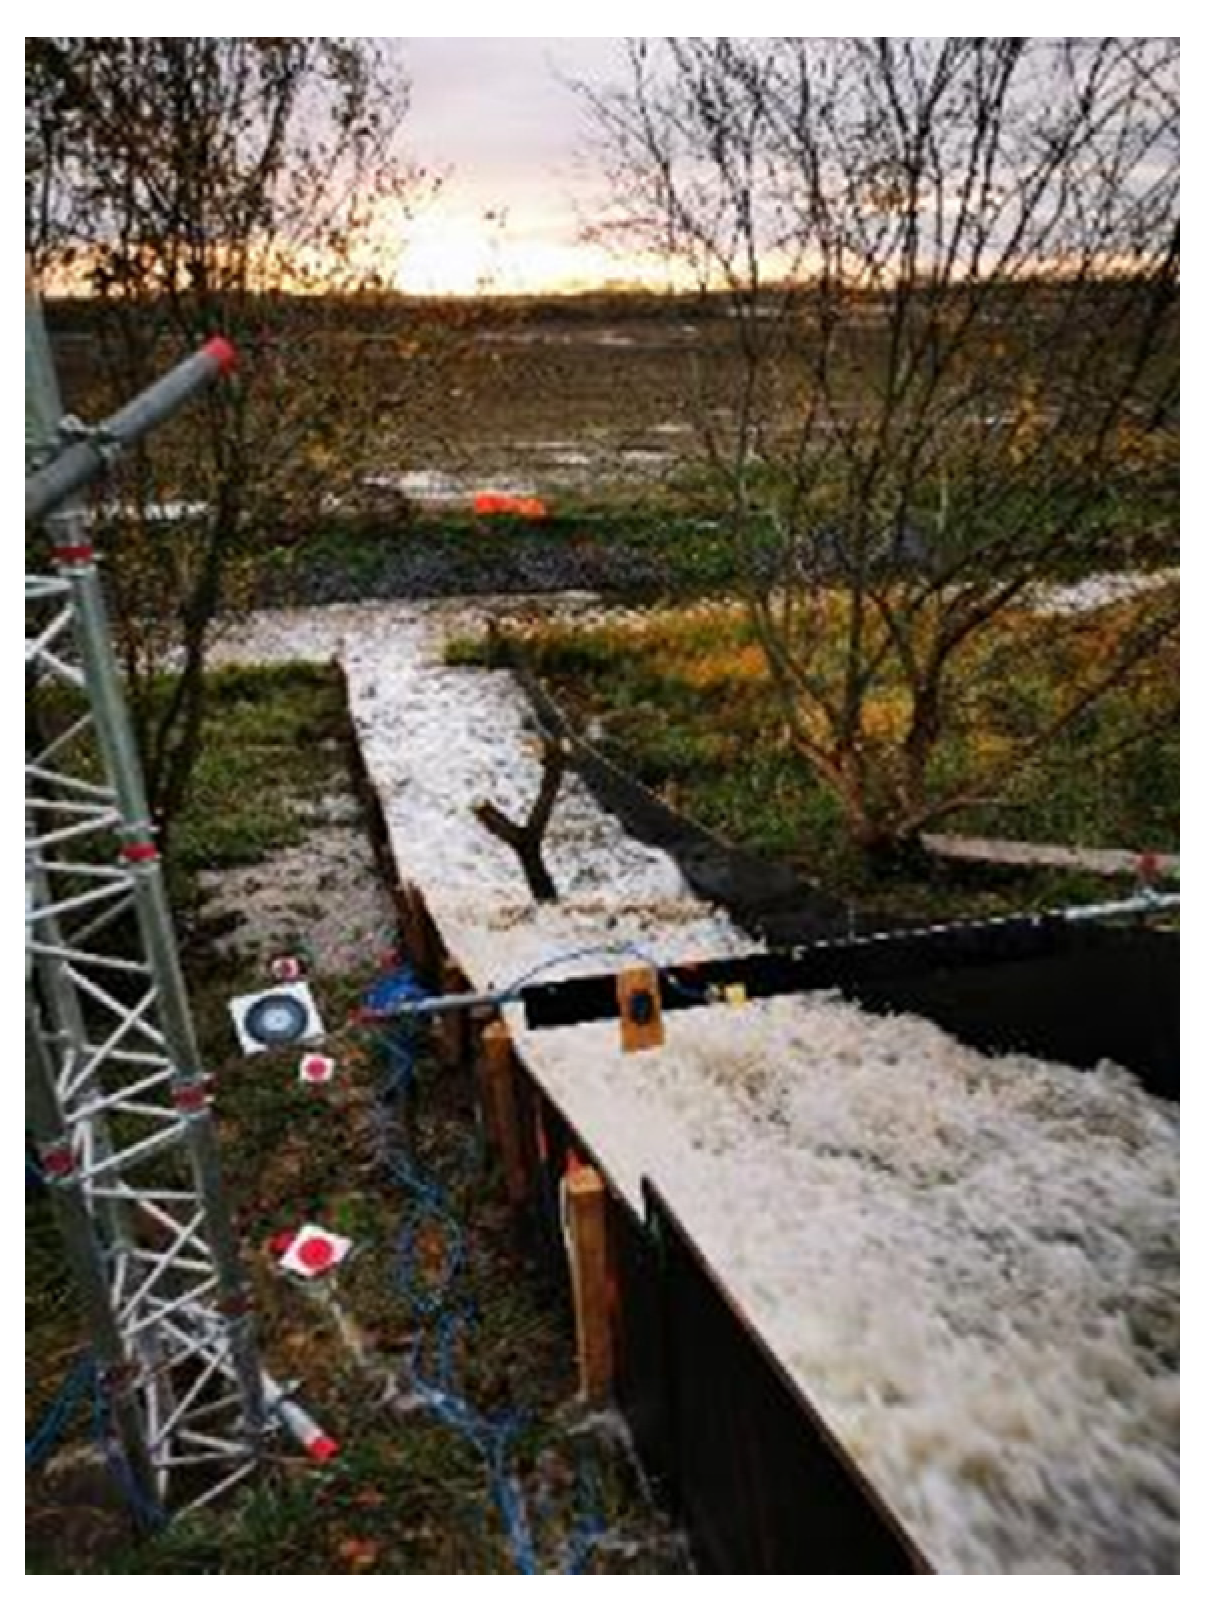
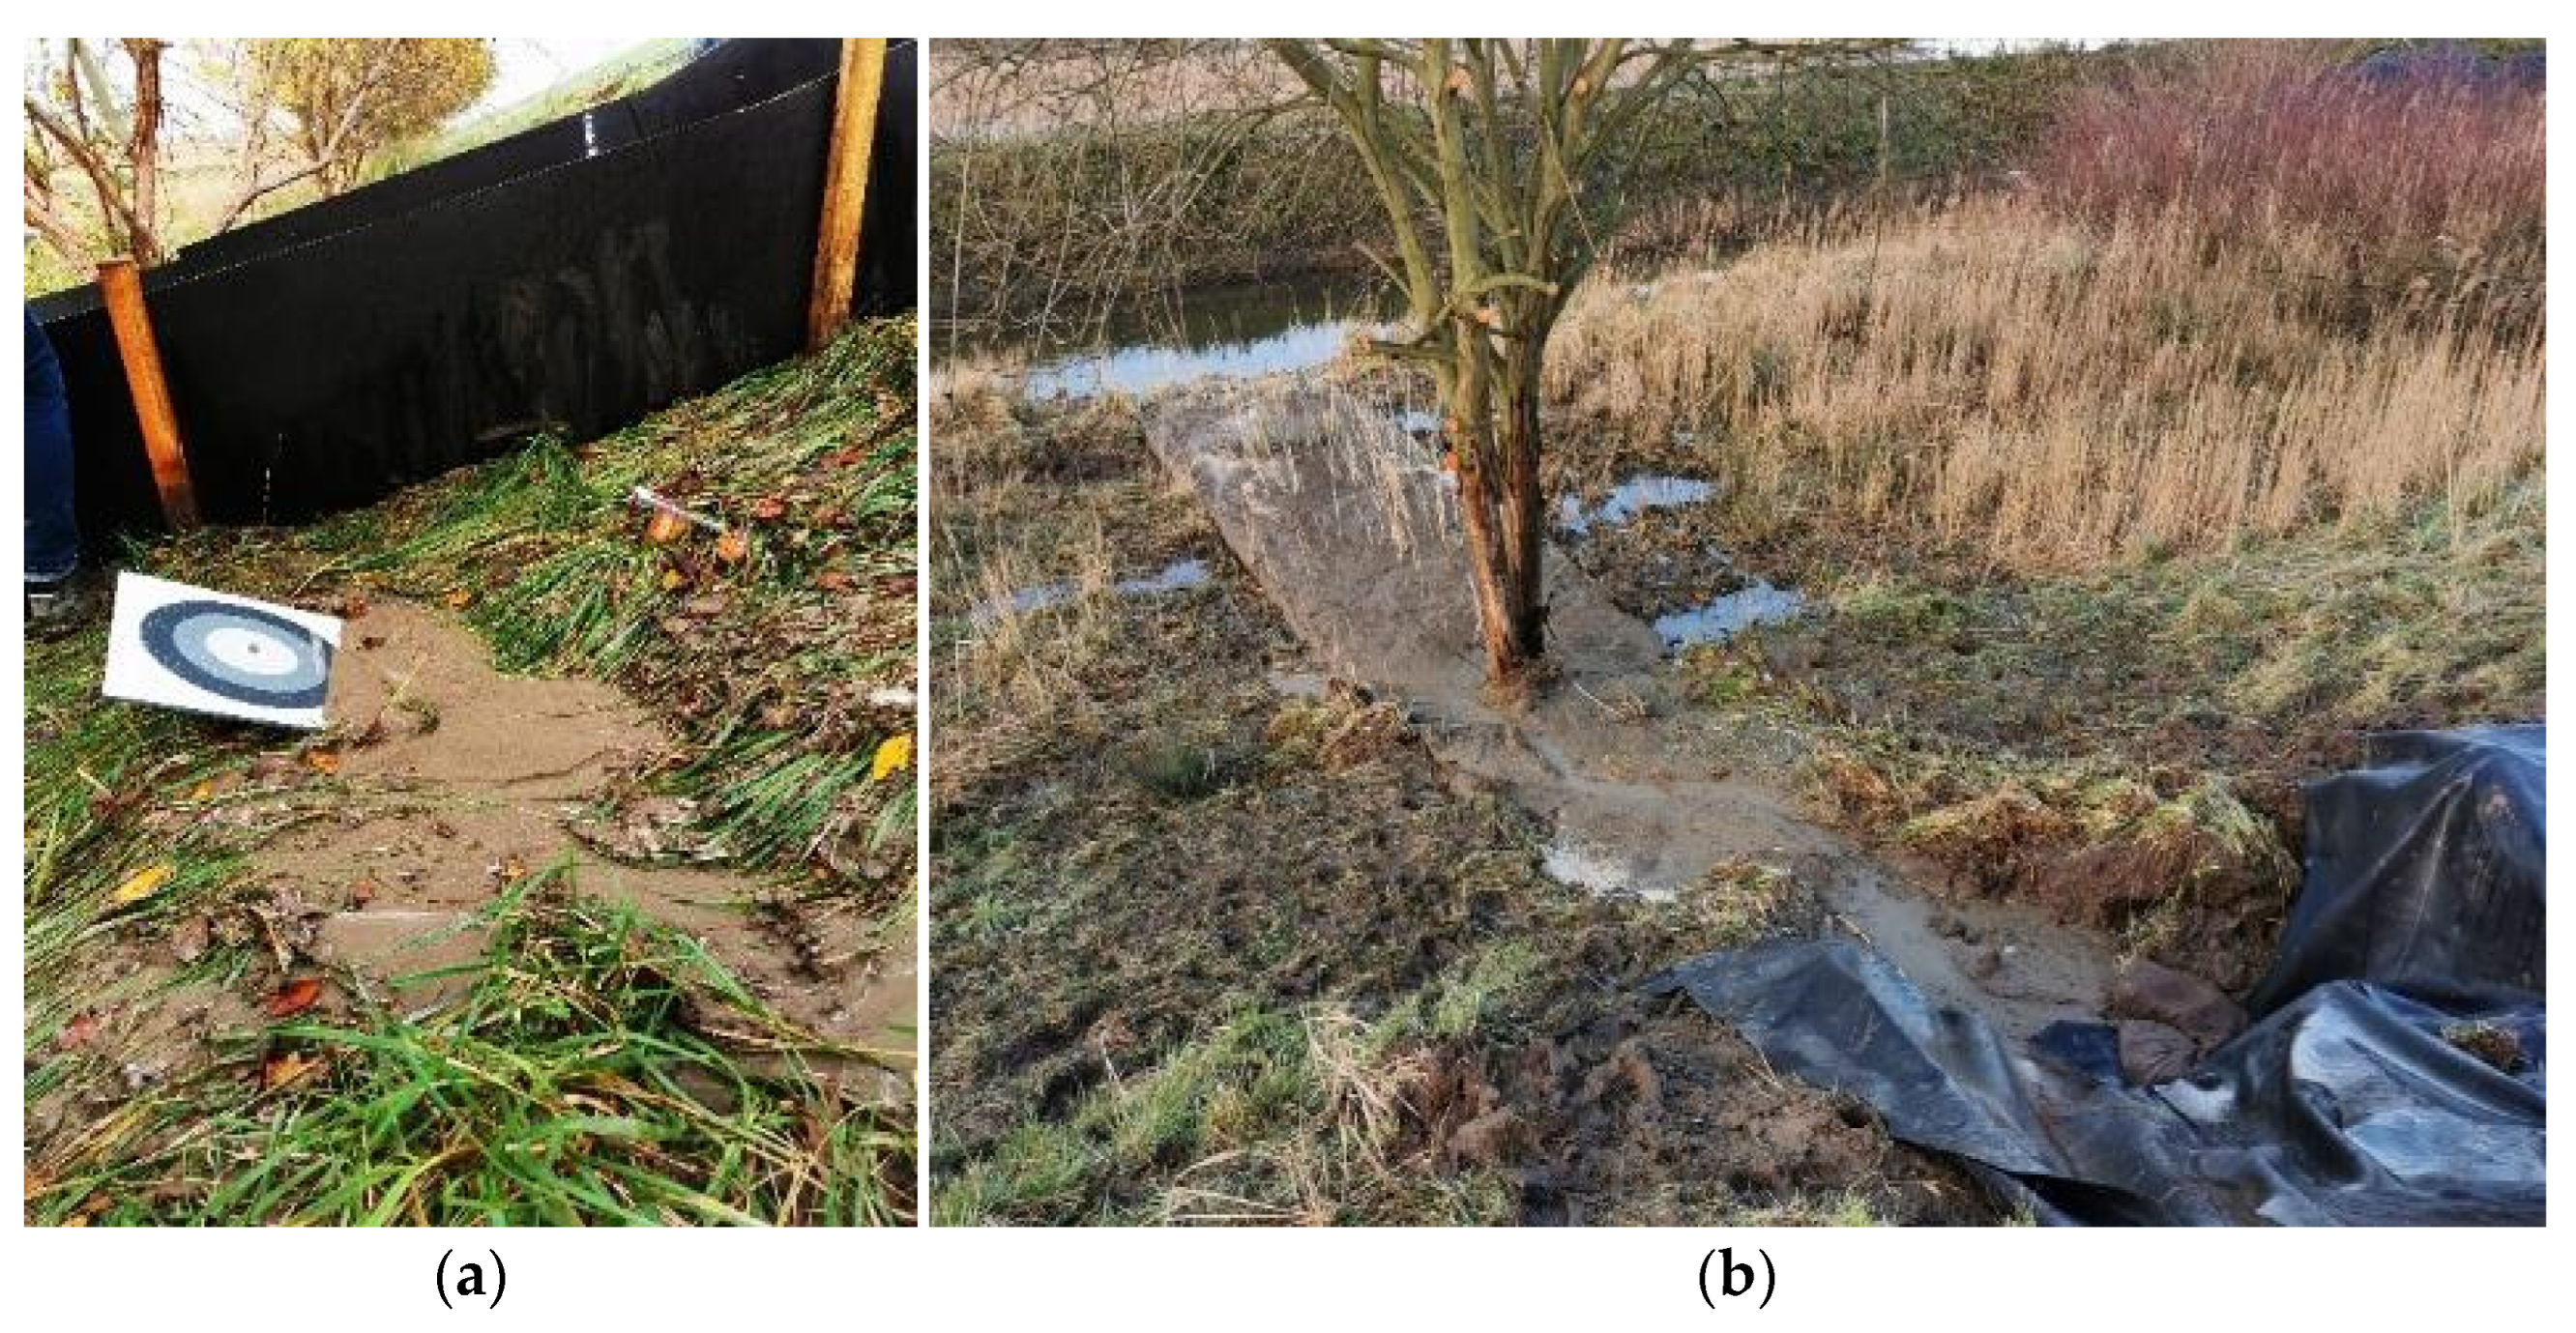
  • the presence of a tree at the toe of a dike in the test section (Figure 4);
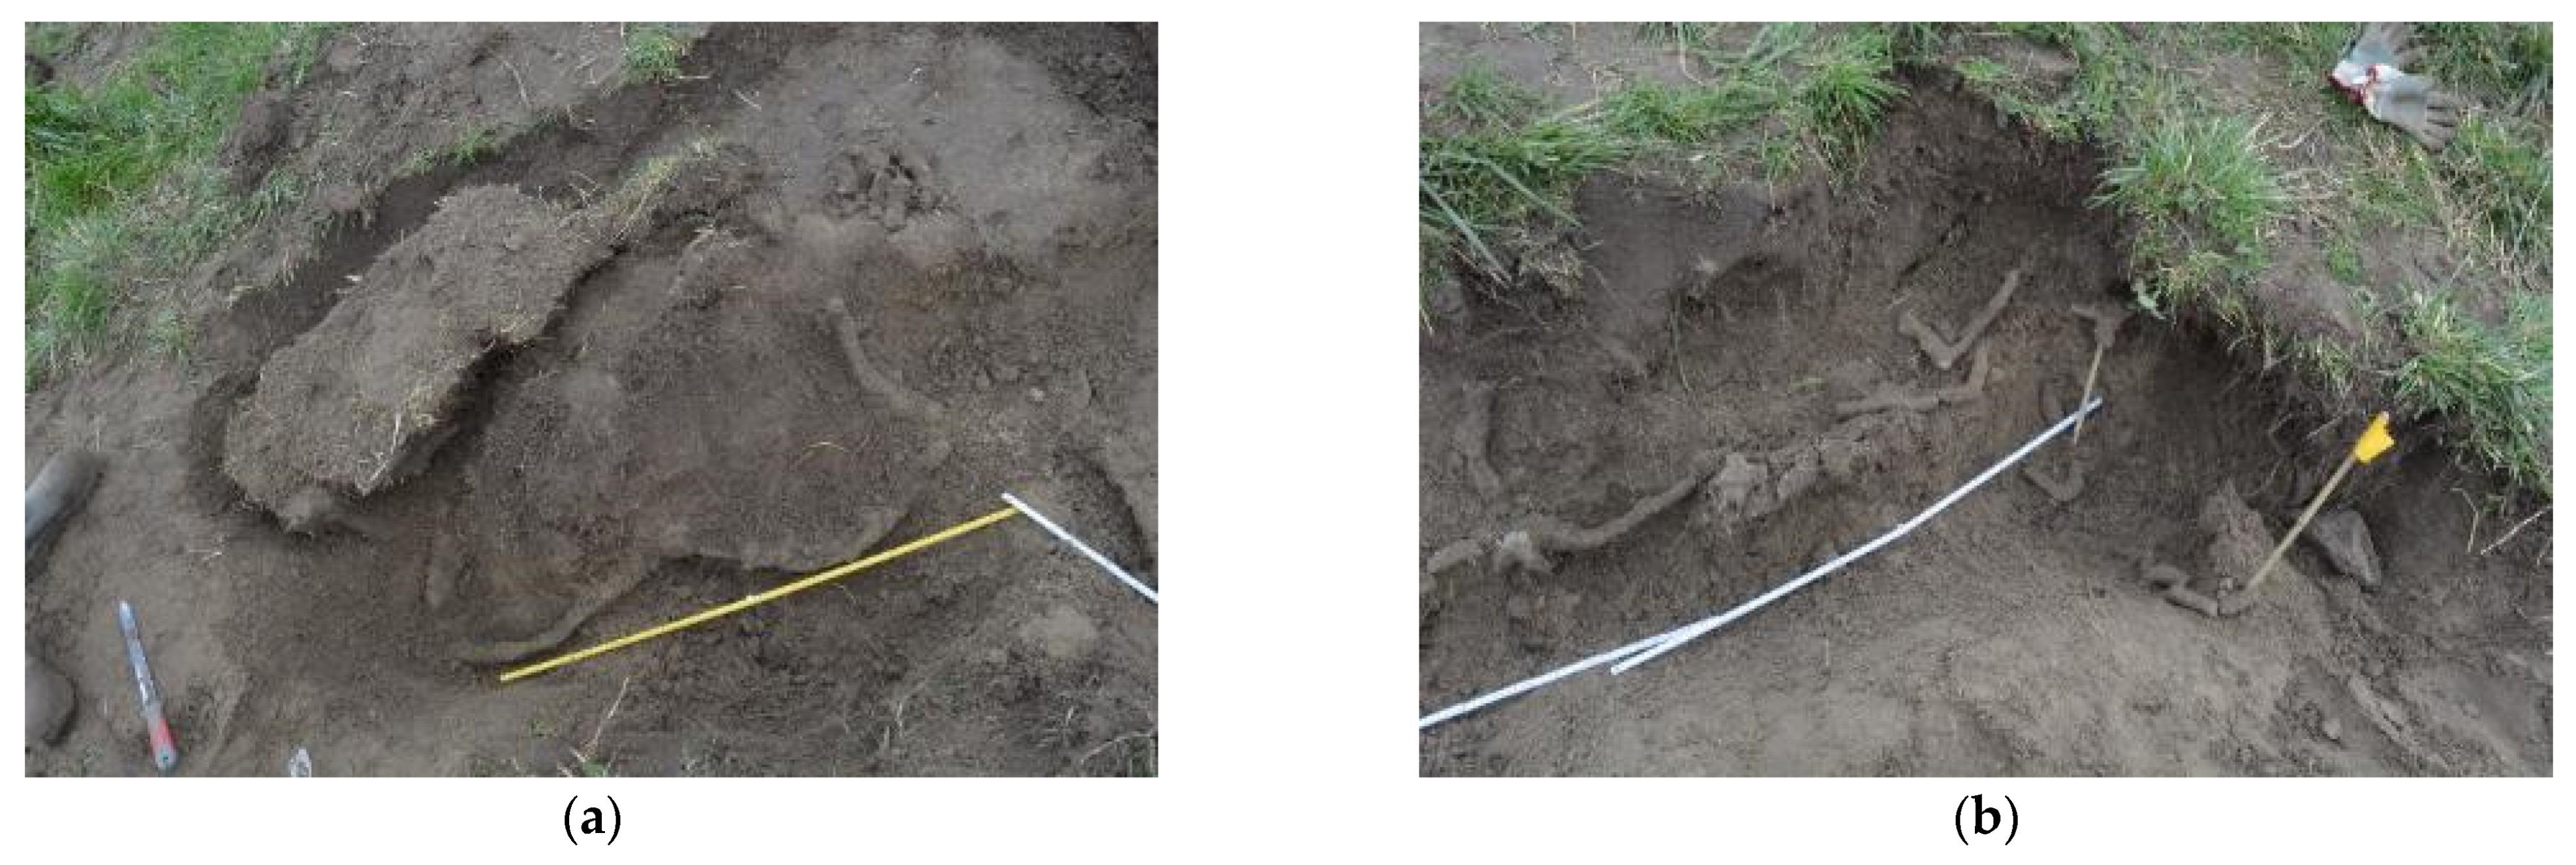
  • a damaged dike profile at the toe, mimicking damage by animals like grazing sheep;
  • hard structures and transitions on the dike (e.g., concrete staircase).
The plan outlined in [12] consists of an initial subdivision in tests with a focus on hydraulics, damage and repairs. The different initial conditions of the dike, the variable test conditions (e.g., duration and discharge) and forced processes (e.g., artificial damage addition, protections, and removal of the grass cover layer) vector the proceedings of the tests, and therefore also the outcome. During the execution, monitoring focused on measuring the hydraulics over the entire test section. Visual observations of damage evolution were made during and in between the ongoing overflow process. By stopping the overflow process, the state of the dike surface could be assessed.
During execution of the experiments, modifications were made to the test plan: some because of the opportunities occurring from damages, some because of existing damage by animal burrows or the presence of a wet spot overgrown with reed, some because of unexpected behaviour. The transition at a hard structure could not be tested.
To enable a large variety of situations to be tested within a limited budget and timeframe, most tests were planned to have a rather short duration, i.e., net 1–3 days (6–18 h) of testing. This is still longer than the local design duration of flood overflow conditions (2 h) and longer than the duration of overflow conditions in the coastal areas of the countries involved. Only a few of the reference tests were planned to continue for a longer time (up to 30 h of flow), to establish high upper bounds (in case of non-failure). In case of failure, the flow was terminated rather quickly, to avoid excessive damage to the still functional dikes.

2.2.3. Measurement Methods and Instruments

Measurements were conducted sensory as well as instrumental. Hereafter a summary of the techniques applied before, during and after the tests. The sensory measurements are in general accordance with fully established practical guidance in this field, for the application to dikes worked out in tools as e.g., detailed in [13].

Sensory Measurements

Sensory observations combined with handheld probes and possibly measuring tape are most common when inspecting a dike. Therefore, prior to the execution of the field experiments the most suitable test sections were determined in which sensory observations played an important role.
  • Looking
Visual inspections were carried out in preparation of the field experiments and during the field experiment. In preparation of the experiments visual observations focussed on determining anomalies of the dike cover. Anomalies were identified as different types of vegetation (mono-culture grass, divers culture of differ herbs, presence of reed, etc.), the intensity and effects of animal activity (present or absent, mice, moles, rabbits, sheep, foxes, etc.), damage to the vegetation (caused by draught, wet conditions, mechanical origins, etc.) and man-made damages.
During the execution of the field experiments, visual observations provided important insight in the progress of the experiment. It yielded insight in unsuspected or unwanted developments of the experiment. Inspection results were noted down for future analyses. Visual observations frequently led to deploying other sensory inspections.
  • Touching
When determining the suitability of inspected locations, touch by hand and handheld-probe was used. Via touch, the soil-material or the length of animal burrows were examined, which led to relevant insights used to determine the suitability of the test site for specific field experiments.
During the experiment, touch also helped to explain specific observation such as waterflows outside of the flow gutter. In some cases animal burrows, and in other the gravel foundation of the road on the crest, were identified by touch to be important infiltration points. Water, infiltrating here, was transported through the permeable sandy core of the dike.
  • Listening
The observation of sounds was primarily used in between periods of waterflow over the crest. During the long-term overflow, water infiltrated into the levee. Infiltration took place via animal burrows, man-made damage but also through the soils of the cover layer. On multiple occasions water was heard flowing through the cover layer of the dike. After detailed additional field inspection and research it was concluded that mole and mice burrows transported significant amounts of water. In at least one case of a previously inflicted damage, repaired with a potential emergency measure, this led to erosion of sand from the levee core.
Instrumental measurements
  • Cameras (IDS uEye UI-5270SE-C-HQ 3,17Mpix ethernet camera) on portals (two large portals incl. Particle Tracking Video (PTV) measurements) tracked the flow along the crest and landside slope of the dike;
  • Cameras for photos and video (incl. high speed camera’s, Krontech Chronos 2.1 Full HD camera and IDS uEye UI-3060CP C USB3 camera) captured the flow pattern from the top and via transparent side panels;
  • Acoustic water level sensors (Banner Engineering Q45ULIU64ACRQ6) monitored the water level at several locations on the crest and the landside slope;
  • Electro-magnetic water current sensors (Valeport Limited Model 802) (small portals, see Figure 2) measured flow velocities at the crest and at two locations over the dike slope;
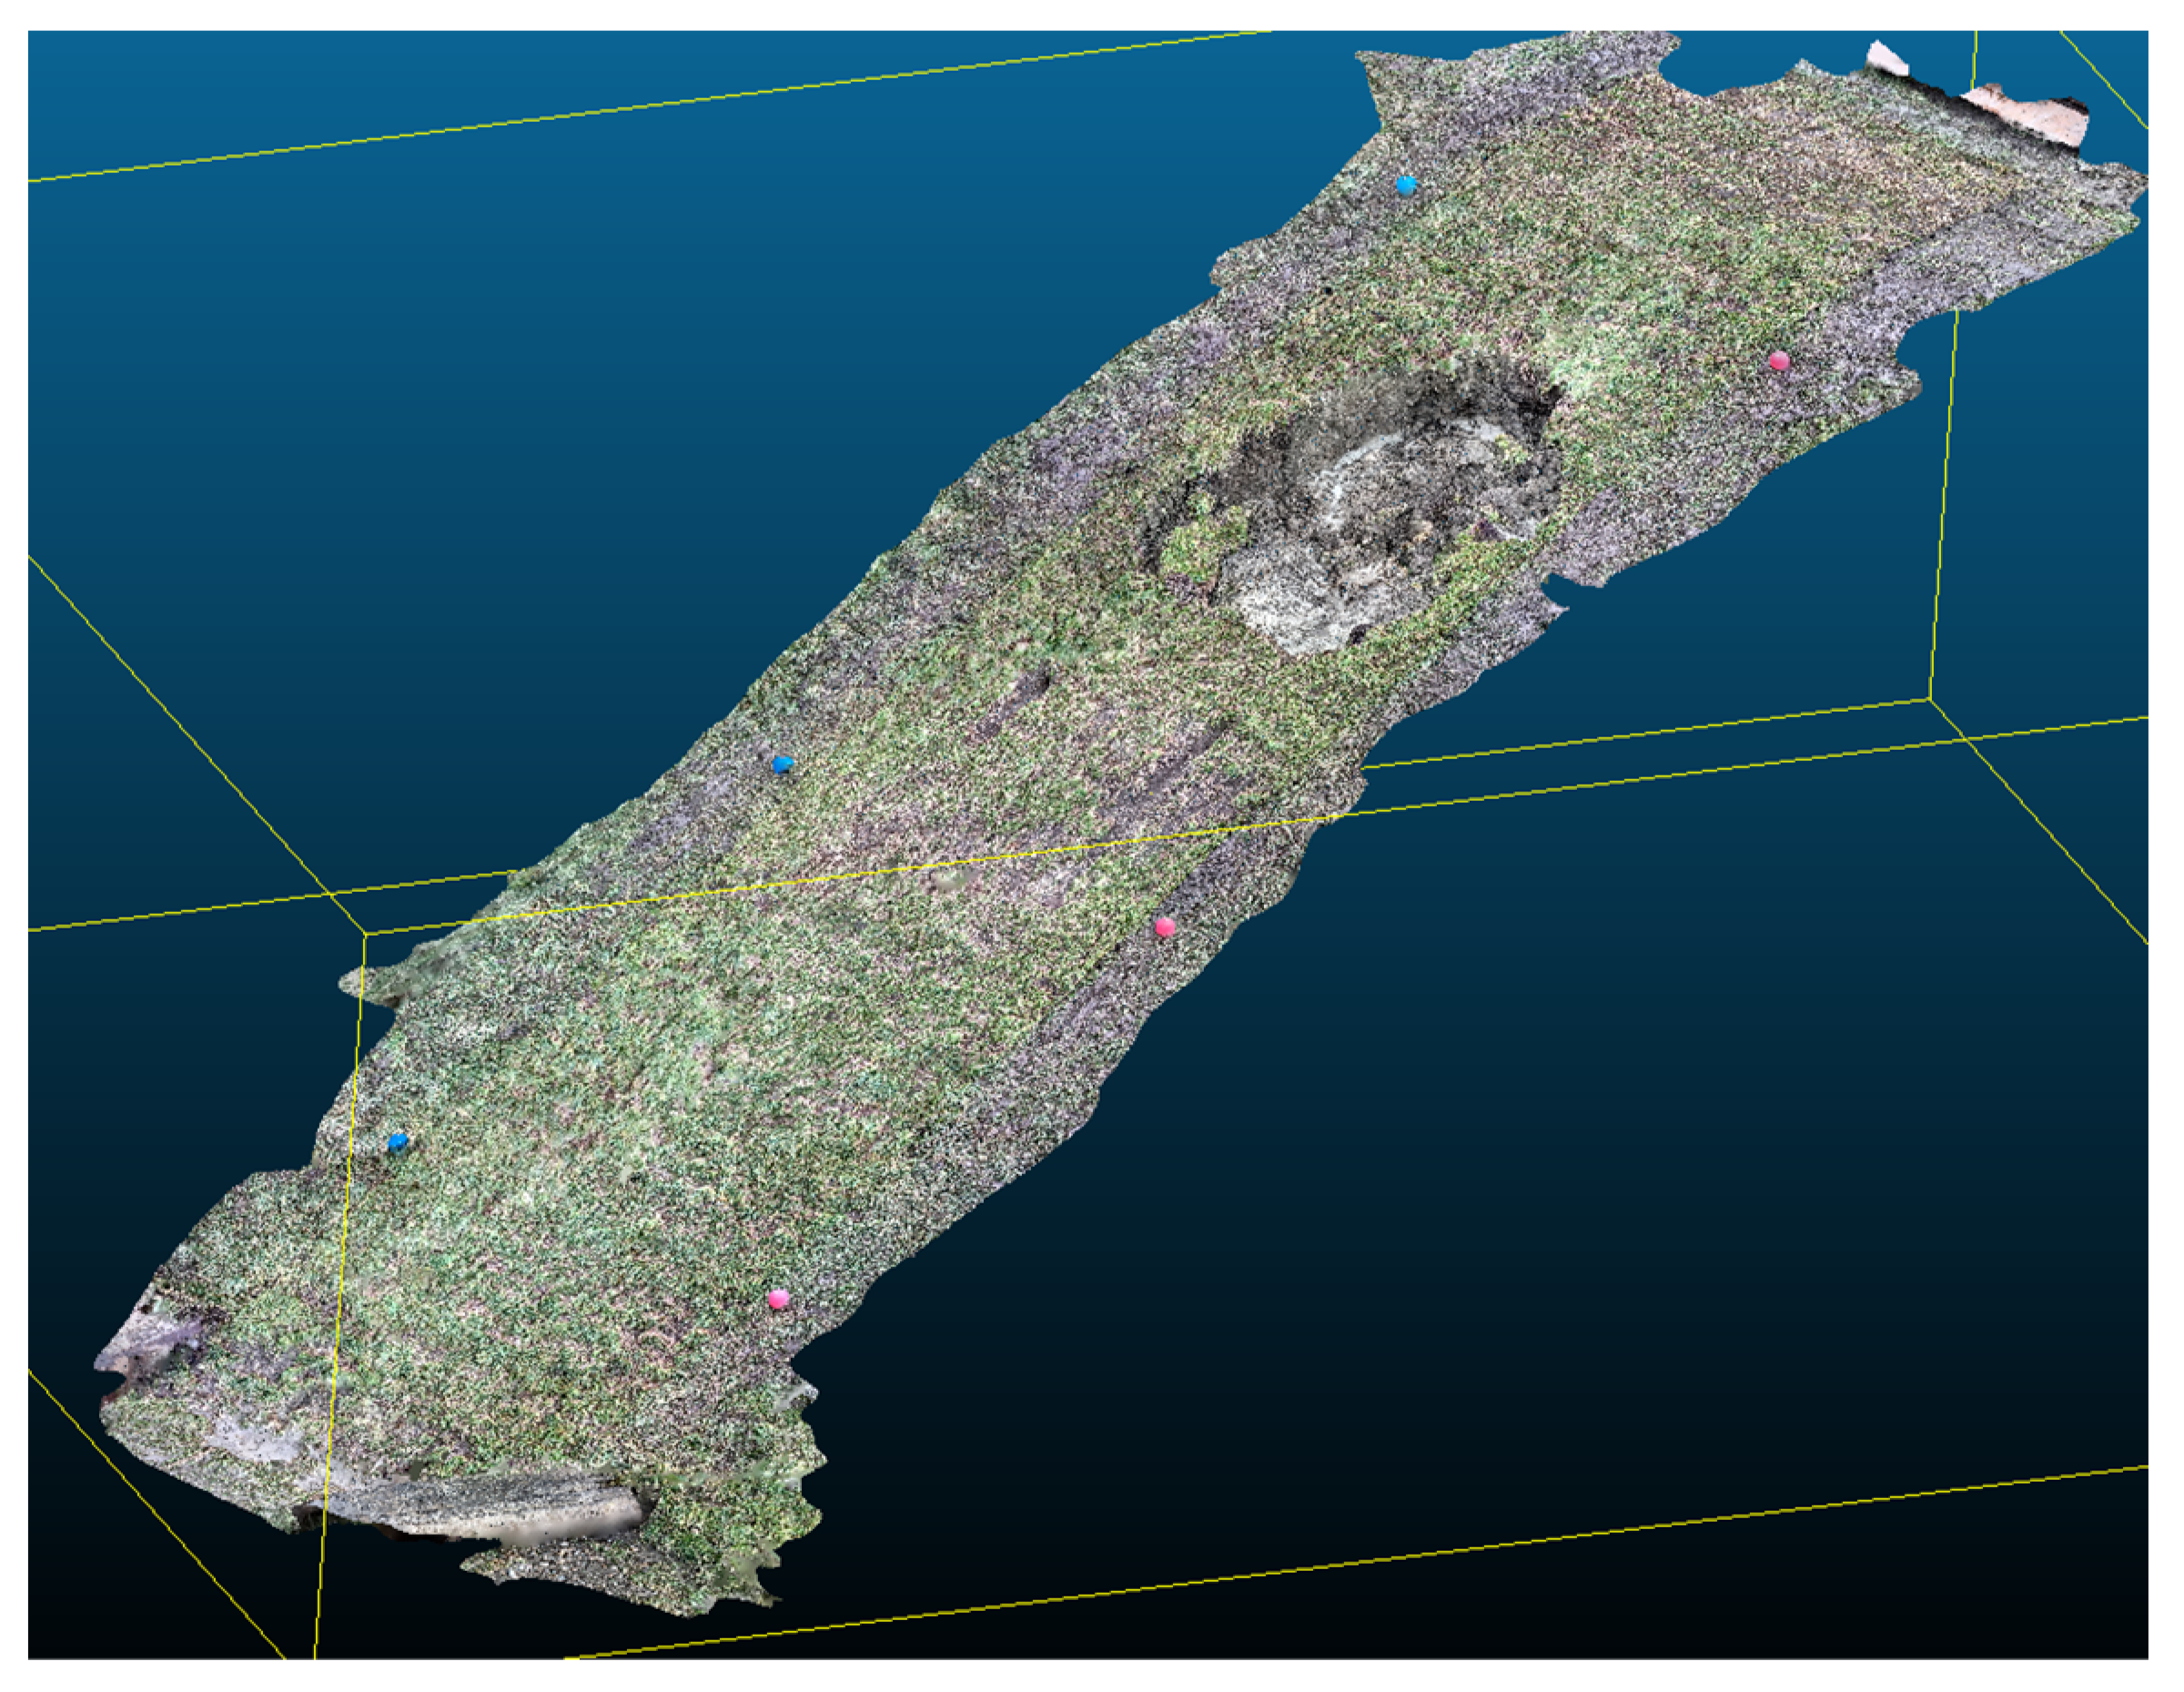
  • 3D-Terrestrial LiDAR (Leica P50) to measure changes in bed profile over the full height of the dike.
  • Handheld LiDAR: As an innovative experiment a handheld LiDAR (iPad Pro 12.9-inch, 5th Generation) was used during multiple field experiments. The goal was to determine whether this device could be used to determine the amount of erosion that took place. To answer this question a base line survey was performed and repeated after and in between flows. The results provided by the Hendheld LiDAR were compared against the results obtained with the 3D-Terrestrial LiDAR.
  • Soil humidity sensors (Irrometer Co. Watermark monitor 900M) in selected test sections (viz sections B-OF09 and N-OF10/11) to measure the degree of saturation at various depths and distances from the flow gutter;
  • RTK GPS (Leica GS14 and Leica GS15) and theodolite (Leica TS30) for topographic referencing the locations of experiments;
  • Handheld probe and measuring tape: Above, the handheld probe was already mentioned. A measuring scale was present on the handheld probe to get a sense of scale and distance when using the probe. Both handheld probes and measuring tape were used in preparation of the test section, e.g., to determine the thickness of the clay cover, and during the field experiments themselves to keep track of the location along the slope.
  • Handheld measuring rod for water level on the crest.
  • Discharge meter (Krohne Optisonic 6000 with UFC300 transmitter) on the supply lines toward the overflow generator.
  • Geophysical measurements under dry conditions with Ground Penetrating Radar (GPR, MALA 500 and 200 MHz models).
  • Geophysical measurements under dry and overflow conditions with Electrical Resistivity Tomography (ERT). Data acquisition consisted of a combined gradient and dipole-dipole electrode configuration. On each line, 82 simple metal electrodes were placed every 10cm. The measurements were performed using the MPT DAS-1 system, with a maximum transmitted voltage, current and power of 480 V, 2500 A and 250 W respectively. During acquisition, two stacks were performed for each transmitter-receiver electrode pairing being measured in order to increase signal-to-noise ratio. A geophysical inversion was then conducted using the pyGIMLI [14] and Res2DINV [15] software packages in order to assess the impact of different inversion options (such as the application of smoothing to regulate the sharpness of transitions between different layers) and to identify common features from these results in order to confidently interpret them. After comparing the two sets of results, the pyGIMLI inversions were selected for interpretation due to their greater geological plausibility and lower misfit.
A typical cross-section showing the general set-up is given in Figure 5. Several sections with artificial burrows were created by drilling holes through the dike cover, which were then subjected to overflow by the overflow generator.

3. Results

3.1. Results during Execution

During the overflow experiments, different sections were subjected to different test-regimes. In Table 1, a summary of the performed tests is given. A test ID starting with a ‘B’ refers to a test in Belgium on the landside slope of the Scheldt dike at the Prosperpolder, while an ‘N’ refers to a test in the Netherlands on the landside slope of the Scheldt dike at the Hedwigepolder. A ‘B’ or ‘C’ at the end of the ID indicates re-testing at the same location, while an ‘I’ or ‘II’ refers to two alternating tests.
The weather conditions played a role in different ways. During a long period of frost early 2021, experiments were postponed for a week. An indirect impact was the effect of freezing and thawing on the state of the dike cover and vegetation itself. Similarly, the long period of drought in the summer of 2020 had an unknown effect on the state of the vegetation when it was tested in October–November 2020.
The reference tests carried out on an undamaged Dutch dike (see for an impression Figure 6) all had more or less the same proceeding: the test duration could be held for tens of hours (up to 30 h) without any critical damage occurring, despite measured flow velocities ranging from 2 to 4.5 m/s. This result is significantly better than the results collected in [4]. During the proceeding of such tests, it was observed that the density of the grass layer decreased while the grass roots were becoming slightly exhumed (centimetre scale). Due to the ‘jumping’ effect of the water over grass sods, decimetric step structures in the soil profile were observed, but this did not lead to any significant downward or headcut erosion. With increasing discharge, this effect appeared to develop faster and become more prominent.
The reference tests carried out on a Belgian dike (see for an impression Figure 7a) showed a similar development. The clay cover of a Belgian dike is typically thinner (~40 cm) compared to a Dutch dike (~80 cm), but this did not affect the result of these reference tests. Figure 7b shows a typical view of the exposed grass roots after multiple hours of overflow. Only in test B-10, erosion of the high-quality grass sod and the underlying clay layer occurred, leading to failure. Note that on the Dutch side, under similar conditions this did not occur (test N-02).
In contrast, the presence of anomalies in the test section showed to have a significant impact on the outcome of the tests and was critical to the stability and strength of the dike cover. The tests performed with the cliff structure and the trees led to dike failure due to the presence of animal burrows, rather than the envisaged anomaly (see Figure 8a). The badly drained location with reed (see Figure 8b) also failed rather quickly (tests N-10, N-11). An even more important observation was that significant dike failure could develop in 1 h of overflow, well within the duration limits of a real-life overflow event.
It was observed in several cases that burrows at or near the dike toe expelled sediment coming from the dike core. This transport of sand undermined the dike clay cover up to the point that it caused the cover layer to collapse. From that point onwards, the outflow of water saturated sands from the dike core, and the overflowing water would quickly transport the exposed sands and further support fast backward headcut erosion, in the order of several meters within minutes. Figure 9a shows outflow of sand next to the test section and the failure induced by animal burrow in a test section that was initially focusing on the effect of the presence of vegetation during overflow (Figure 9b). These observations instigated additional research [16,17].
To learn more about the structure, dimensions and depth of animal burrows, some burrow systems were filled with grout and exposed (Figure 10). These activities led to an increased understanding of the processes at hand [16,18]. The critical factor in the damage to develop appears to be whether the burrows are in contact with the sand core and whether sand can be mobilized from within the core and exported to the outside of the dike. The requirements for this seems to be (1) a burrow system that is connected over meters to decameters distances; (2) a burrow system that reaches deep enough so that the dike clay cover is pierced and contact with the sand is made; (3) a flow of water through the burrow system is generated by the overflow process so that core sands are mobilized. Surprisingly, the artificially made holes, supposed to resemble animal burrows, were generally better resistant to flow, even if they were clearly connected to the sand core, with both an entry pipe and an exit pipe. In test B-11 for instance, the artificial hole was the very last part to collapse.
The experiments also considered damage repair and protection measures, either meant to be temporary or permanent. Repaired sections were re-tested with overflow to assess the strength, endurance, and stability of different repair strategies, including the use of different types of geotextiles, geogrids, and the use of grass sods. The results were rather varied, as the table briefly indicates.

3.2. Results of Data Analyses

During the experiments, data on the flow was acquired with laboratory sensors which were not designed for field conditions. The flow over the landside dike slope was also highly aerated making it more difficult to determine the water depth and flow velocities. Despite that, a number of these sensors operated well; only the flow velocity sensors on the tubes proved to malfunction most of the time.
By measuring the same parameter with a variety of techniques the possibility was created to evaluate the effectiveness of different sensors to be applied to field measurements. At discrete moments in time the handheld Lidar system was used to scan the dike surface. The handheld Lidar system consisted of an application on an iPad. The measurements were compared with the output from the 3D laser scans for comparison. Despite the relative simplistic nature of the handheld LiDAR device, no significant differenced were found compared to the 3D laser scans. Therefore, the results appear useful (see Figure 11).

4. Discussion

During the overflow experiments, the flow over the dike was monitored closely: the same parameters, e.g., water level, flow velocities, were monitored in different ways, paving the path towards comparing their outcomes and evaluating the level of accuracy of the different methods. Flow velocities were measured locally. The average flow velocity at the crest was derived from the discharge and water level at the crest. Even though not all sensors provided good data, still a complete set of accurate measurements was obtained during the experiments.
Besides the extensive data acquisition and the increased understanding of the effects of hydraulic stresses on dike cover strength and stability, a large gain in conducting overflow experiments was obtained. The occurrence of numerous surprises required the Polder2C’s project to adapt and stay flexible in the planning and execution of the experiments. The observed significant impact of animal burrows on the failure process of the dikes led to a re-prioritization of the experiments. Due to the increased focus on the importance of burrows, other items, such as transitions or hard structures in dikes, were not investigated. The influence of animal activity on the test results appeared to be so significant that it justified a more extensive research effort over planned tests on the effects of transitions in dike cover on the erosion protection. It also highlights the importance of managing the negative effects of animal burrows on dike safety. The influence of animal burrows, although significant, were difficult to quantify. In the LL HPP the focus was on improving the understanding of the influence of burrows by performing a survey on the location and extent of the burrows. However, no quantitative measurements could be performed to quantify the amount of sand transported from the animal burrows, or on the flow velocities in the burrows. Since the design of the burrows appears random in nature, and the initial location of the burrows is unknown, it was not possible to set up a proper measurement system. The quantitative impact of animal burrows therefore yet remains difficult to quantify.
A period of frost in 2021 and the warm summer of 2020, affected the state of the dike prior to testing. However, both are natural conditions that could also precede real overflow events. These factors contributed to the results in an unknown way. At a more detailed level, the execution of tests in a living lab is a series of constant adaptations in response to the observations, including re-prioritizing tests. The occurrence of problems with the pump installation, large and undesired leaks of the test sections, undermining of the road structure on the crest or at the dike toe, unavailability of data acquisitions or simply harsh weather conditions create conditions during which the experiment must be halted, inspected, repaired or simply suspended. In this process, it was observed that the moving and construction of sections became an increasingly smooth and swift process. These experiences thus help to become more proficient and successful at conducting dike overflow experiments.

5. Conclusions

In the Living Lab Hedwige-Prosperpolder 27 tests were carried out to test the erosion resistance of grass-covered dikes against overflow. The test program consisted of a variety of test conditions, containing reference sections (with a high-quality grass cover), sections with anomalies (e.g., the presence of vegetation and animal burrows), and repair measures.
In the case of a high-quality grass cover, dikes can withstand high overflowing discharges for long periods of up to tens of hours, giving a significantly better outcome than the often-cited CIRIA-curves [4]. However, where animal burrows, deformation or other anomalies are present, the erosion process can initiate much earlier and progress faster. Observations made during the tests in the Living Lab caused for a re-prioritization of the research questions whereby an increased effort was made to study the impact of animal burrows on the stability of the dike cover. At such locations, the dike can quickly erode when erosion occurs. The initial insight on the role of burrows as a major concern in dike cover integrity during overflow, is that burrowing animals create a hydraulic pathway from where the dike cover can be undermined. Timely detecting and addressing such anomalies pose a challenge for water authorities worldwide. It also shows an important link to how the management of burrowing animals in dikes impact the level of safety. Burrows beneath a clay over could thereby have a significant effect on the overflow resistance of dikes.

Author Contributions

Conceptualization, P.P.; methodology, P.P. and M.v.D.; validation, D.D., P.P. and A.R.K.; formal analysis, D.D.; investigation, P.P., D.D., A.R.K., S.J.H.R. and W.Z.; resources, P.P.; data curation, D.D.; writing—original draft preparation, A.R.K.; writing—review and editing, A.R.K., M.v.D., S.J.H.R. and W.Z.; visualization, D.D.; project administration, P.P.; funding acquisition, P.P. All authors have read and agreed to the published version of the manuscript.

Funding

This research was funded by the Interreg 2 Seas programme 2014–2020 co-funded by the European Regional Development Fund under subsidy contract No [2S07-023], under the Project name Polder2C’s.

Data Availability Statement

The data are not yet publicly available, incomplete data reports are already available on request from the corresponding author. Towards the end of 2022, the data will be publicly available.

Conflicts of Interest

The authors declare no conflict of interest. The funders had no role in the design of the study; in the collection, analyses, or interpretation of data; in the writing of the manuscript; or in the decision to publish the results.

References

  1. Rijkswaterstaat. Schematiseringshandleiding Grasbekledingen; Ministerie van Infrastructuur en Waterstaat: The Hague, The Netherlands, 2021.
  2. Cornish, B.A.; Yong, K.C.; Stone, D.M. Hydraulic Characteristics of Low Cost Surfaces for Farm Dam Bywash Spillways; Water Research Laboratory Report No. 93; University of New South Wales: Sydney, Australia, 1967. [Google Scholar]
  3. US Soil Conservation Service. Handbook of Channel Design for Soil and Water Conservation; Publication SCS-TP61; US Soil Conservation Service: Washington, DC, USA, 1954.
  4. Whitehead, E. A Guide to the Use of Grass in Hydraulic Engineering Practice; Technical Note 71; CIRIA: London, UK, 1976. [Google Scholar]
  5. Ponsioen, L.A. Overflow and Wave Overtopping Induced Failure Processes on the Landside Slope of a Dike. Master’s Thesis, Delft University of Technology, Delft, The Netherlands, 2016. [Google Scholar]
  6. Cantré, S.; Olschewski, J.; Saathoff, F. Full-scale flume experiments to analyse the erosion resistance of embankments made of dredged materials. J. Waterw. Port Coast. Ocean Eng. 2017, 143, 04017001. [Google Scholar] [CrossRef]
  7. Van der Meer, J.W. Workpackage 3: Development of Alternative Overtopping-Resistant Sea Defences, Phase 3: Design, Construction, Calibration and Use of the Wave Overtopping Simulator; EU Interreg IIIB Project ComCoast: Delft, The Netherlands, 2007. [Google Scholar]
  8. Hoffmans, G.; Van Hoven, A.; Steendam, G.J.; Van der Meer, J. Summary of research work about erodibility of grass revetments on dikes. In Proceedings of the Protections 2018, 3rd International Conference on Protection against Overtopping, Grange-over-Sands, UK, 6–8 June 2018. [Google Scholar]
  9. Van Steeg, P.; Klein Breteler, M.; Labrujere, A. Design of wave impact generator to test stability of grass slopes under wave attack. In Proceedings of the 5th International Conference on the Application of Physical Modelling to Port and Coastal Protection, Varna, Bulgaria, 29 September–2 October 2014. [Google Scholar]
  10. Van Steeg, P.; Klein Breteler, M.; Labrujere, A. Use of wave impact generator and wave flume to determine strength of outer slopes of grass dikes under wave loads. In Proceedings of the 34th Conference Coastal Engineering, Seoul, Korea, 15–20 June 2014. [Google Scholar]
  11. Flanders hydraulics research, bouw overloopgenerator voor toepassingen bij dijksterkteproeven in het kader van living lab hedwige prosperpolder. In WL Hoogtepunten 2019–2020; Depot D/2021/3241/225; Flanders Hydraulics Research: Antwerp, Belgium, 2022; Available online: www.vliz.be/imisdocs/publications/80/369580.pdf (accessed on 30 July 2022).
  12. Depreiter, D.; Peeters, P. Polder2C’s, Overflow Test Plan Winter 2021; EU Interreg 2 Seas Project Polder2C’s: Antwerp, Belgium, 2021. [Google Scholar]
  13. Het Waterschapshuis, Digigids 2019. 2019. Available online: https://digigids.hetwaterschapshuis.nl/ (accessed on 30 July 2022).
  14. Rücker, C.; Günther, T.; Wagner, F.M. pyGIMLi: An open-source library for modelling and inversion in geophysics. Comput. Geosci. 2017, 109, 106–123. [Google Scholar] [CrossRef]
  15. Loke, M.H. Res2Dinv v. 3.59 for Windows XP/Vista/7/2010, Rapid 2-D Resistivity & IP Inversion Using the Least-Squares Method; Geoelectrical Imaging 2D & 3D Geotomo Software: Cintré, France, 2010. [Google Scholar]
  16. Van den Berg, F. Burrowing by Animals in Flood Defenses, a Quantitative Analysis of an Overview of Current Knowledge; Report 11206793-002-ZWS-0002; Deltares: Delft, The Netherlands, 2022. (In Dutch) [Google Scholar]
  17. Holscher, R.; Zomer, W.S. Field Research on Burrows and Discontinuities in Embankments, Fact Finding Field Research in the Hedwige-Prosperpolder; STOWA: Amersfoort, The Netherlands, 2021. [Google Scholar]
  18. Idsinga, J. The Investigation of Animal Burrows in Levees, Using Experimental Data to Develop a Probabilistic Model that Aims to Improve the Efficiency of Manual Inspection of Animal Burrows on Levees. Master’s Thesis, Delft University of Technology, Delft, The Netherlands, 2022. [Google Scholar]
Figure 1. (a) Design drawing indicating main parts and (b) actual construction of the overflow generator. The generator is fed through a piping system; a bridge makes the connection to the dike crest.
Water 14 02859 g001
Figure 2. Standard setup of an overflow experiment, view from the landside dike toe. Camera and sensor frames are placed across the 2 m wide test section, prior to execution.
Water 14 02859 g002
Figure 3. (a) Overflow in progress; (b) Overflow generator at maximum discharge of 1100 L/s.
Water 14 02859 g003
Figure 4. Anomaly test section with a tree trunk at the toe of the dike.
Water 14 02859 g004
Figure 5. Schematic cross-section of a typical experiment, indicating the positions of the main instrumentation and constructions (dike dimensions and location of the road at the Dutch side).
Water 14 02859 g005
Figure 6. Dutch reference test section (September 2020).
Water 14 02859 g006
Figure 7. (a) Belgian reference test section (September 2020); (b) Typical view of exposed grass roots after multiple hours of overflow.
Water 14 02859 g007
Figure 8. (a) Burrow entrance halfway the landside slope on a Dutch dike; (b) Sections with softened, saturated soil and reed overgrowth on a Dutch dike.
Water 14 02859 g008
Figure 9. The role of burrows and the outcome of dike cover collapse at the second test with a tree: (a) puddle of sand flowing out at burrows near the dike toe; (b) the aftermath of a collapsed dike slope after sand outflow at the toe. Note that the tree itself is in place and did not appear to influence the process.
Water 14 02859 g009
Figure 10. (a,b) Examples of excavated grouted animal burrows.
Water 14 02859 g010
Figure 11. Example of a 3D view of the Handheld Lidar point cloud data of a damaged section.
Water 14 02859 g011
Table 1. Summary of all overflow tests (* to indicate flow over full, variable width).
IDGoalqmsx
(L/(s.m))
Width
(m)
Duration
(hh:mm)
B-01Establish reference measurements (Belgian side)180221:00
B-02Effect of shorter grass (10 cm instead of 15–30 cm)180218:00
B-03Impact of higher discharge360110:00
B-04Impact of tree near toe16021:27
B-05Impact of erosion cliff from grazing sheep near toe160216:00
B-05BTest robustness of temporary repair measure (EPDM geotextile)750 L/s *2–67:10
B-05CTest robustness of final repair measure (rock bags)11010:35
B-06Test vulnerability of local patches of removed grass180219:45
B-07-IStudents’ Levee Challenge—Cocos mat as repair measure18023:27
B-07-IIStudents’ Levee Challenge—geogrid with thin geotextile as repair measure18023:30
B-08Impact of higher discharge250225:30
B-09Impact of higher discharge375218:07
B-10Impact of higher discharge (with smaller width)54012:04
B-11Impact of tree, small burrows & small erosion cliff from grazing sheep near toe250213:02
N-01Establish reference measurements (Dutch side)175230:30
N-02Clay erosion measurements in step-shaped anomaly550210:30
N-03Reference section for detailed hydraulic measurements330214:30
N-04Reference section for detailed hydraulic measurements330225:00
N-05Impact of fox burrow halfway the landward slope9021:19
N-05BTesting robustness of clay filling as a repair measure37511:15
N-05CTesting a reinforced turf mat (grid structure) on repaired section15014:30
N-06Testing reinforced turf mat (grid structure with seed mixture)10022:00
N-07Testing a geotextile as protection on a barren clay slope200 L/s *2–50:30
N-08Testing grass sods20022:00
N-09Testing use of flat plates to cover part of mole burrows500210:00
N-10Impact of soft soil and reed on lower part of slope20021:00
N-11Impact of soft soil and reed on lower part of slope20020:31
Publisher’s Note: MDPI stays neutral with regard to jurisdictional claims in published maps and institutional affiliations.

