Article

Risk Propagation Evolution Analysis of Oil and Gas Leakage in FPSO Oil and Gas Processing System by Mapping Bow-Tie into Directed Weighted Complex Network

1
College of Shipbuilding Engineering, Harbin Engineering University, Harbin 150001, China
2
College of Mechanical and Electronic Engineering, China University of Petroleum, Qingdao 266580, China
3
Navigation College, Dalian Maritime University, Dalian 116026, China
*
Author to whom correspondence should be addressed.
Water 2022, 14(18), 2857; https://doi.org/10.3390/w14182857
Submission received: 14 July 2022 / Revised: 28 August 2022 / Accepted: 8 September 2022 / Published: 13 September 2022
(This article belongs to the Special Issue Reliability and Safety in Ocean and Coastal Engineering)

Abstract

:
An innovative methodology is proposed to identify potential risk factors and possible accident escalation consequences, and to determine the evolution of an accident from cause to consequence, thereby to identify the most probable path and discover key risk factors along the path rapidly. Based on the principle of a directed weighted complex network (DWCN), the bow-tie (BT) model, risk entropy and the improved ant colony optimization (IACO) algorithm are integrated into this methodology. First, the qualitative analysis of risk evolution based on the BT model is carried out. The evolution development based on accident suppression can be divided into two stages: accident precursor stage and accident evolution stage. Then, a new method for mapping BT into DWCN is proposed. Lastly, the shortest path analysis of risk evolution based on the IACO algorithm is carried out, fuzzy set theory (FST) is introduced to calculate the failure probability of risk factors, and risk entropy is used to represent the uncertainty of risk propagation. Thus, the IACO algorithm can be used to calculate the shortest path of risk evolution. The proposed method is applied to oil and gas leakages in the FPSO oil and gas processing system. The results show that it is an effective method to identify the shortest evolution path and the most vulnerable risk factors.

1. Introduction

Recent decades have seen the increasing demand of oil and gas sources due to continuous economic and social progress. Although new and renewable energy sources are experiencing rapid growth [1], oil and gas are still the major primary energy resources, the demand for which is expected to increase by 35% from 2010 to 2040. Deepwater oil and gas development is playing an increasingly important role in the oil and gas industry [2].
An FPSO is a floating production storage and offloading unit, which can make the development of the small and/or remote fields in deeper water possible [3]. FPSOs receive production fluids from one or more undersea oil reservoirs via risers, and the fluids are then separated at the topside (vessel deck) into oil, gas, and water; then, contaminants are reduced by a separation system. FPSOs can adapt to different water depths, and they are movable and easy to relocate. However, as complex systems integrating all kinds of processing units, FPSOs are usually set up in harsh deep-sea waters for their entire life cycle, which often spans over 10 years. Hence, FPSOs are subjected to extreme environmental loads caused by extreme sea conditions (big waves, currents, etc.), and a relatively high accident likelihood in terms of oil and gas leakage may exist. The dispersing of oil and gas can form a flammable cloud, which can pose a potential fire and explosion risk. In February 2015, an FPSO explosion accident in the Brazilian offshore resulted in nine fatalities, and this accident was close to that of the Macondo disaster in 2010 [4,5]. According to HSE statistics, the proportion of gas leakage in offshore operation is as high as 56%. Due to the high risk of FPSO operation, research on risk evaluation for FPSOs due to oil and gas leakage and subsequent chain effects is very important and can provide theoretical and technical support for improving the ability of risk control for FPSOs in operation [6].

1.1. Literature Review

The existence of risk factors could lead to the occurrence of accidents. After analyzing 75,000 investigation reports of industrial accidents in the United States, Heinrich and Superintendent [7] identified that risk factors related to unsafe human behavior, unsafe environment conditions, and unsafe management are the main causes of accidents. Suraji et al. [8] analyzed 500 accident records in the UK and proposed that the existence of four types of risks, including unreasonable planning, poor quality control measures, non-standard operation, and poor operating conditions, led to the occurrence of accidents. The risk factors leading to accidents are interconnected to form a risk factor network system. Both the domino model and the Swiss cheese model [9] consider that risk factors leading to accidents are related to each other. The risk management model [10] and the STAMP model (systems-theoretic accident model and processes model) [11] also propose that these interrelated risk factors constitute a complex and interrelated risk factor network system. When a risk factor occurs, other risk factors of the system will occur one after another, and finally accelerate the deterioration of the event. Therefore, breaking through the assumption of risk independence and analyzing the network evolution mechanism of risk factors is helpful in identifying key risk factors from the perspective of system security.
Based on risk correlation, there are many models for risk analysis from the perspective of system security, including qualitative and quantitative risk assessment techniques, such as failure mode and effect analysis (FMEA), the hazard and operability study (HAZOP), fishbone diagram analysis (FDA), fault tree analysis (FTA), and event tree analysis (ETA). As two effective risk assessment methods, FTA and ETA can perform qualitative analysis on risk factor identification and quantitative assessment on the possibility of unexpected events [12]. The BT model is a common method that combines FTA and ETA, which considers a common top-level event called a critical event, combined with quantitative risk analysis and accident consequence assessment [13]. In addition, there are risk assessment methods such as the Master logic diagram [14] and Bayesian network (BN) [15]. However, there are certain limitations in the use of these methods in the face of complex risk factor network systems, and they cannot accurately reflect all risk factors and their evolution mechanisms that lead to accidents. For example, the FTA model usually constructs risk factors leading to the accident and its causal relationship structure for a single accident. However, there are many types of chemical products and complex production processes, and the FTA model cannot fully reflect all the risk factors and their correlations that lead to explosion accidents. BN is a directed acyclic network, and the correlation between risk factors constitutes a directed recurrent network [16]. However, BN focuses on assessing the overall risks of all failure paths and cannot directly calculate the failure risk of a single path between any two nodes. In addition, there will be a state explosion problem if the number of causal factors is significant and the relationships among them are complex.
The introduction of a complex network (CN) method provides new ideas and methods for the study of risk factor network systems. Based on CN, the evolution relationship of risk factors in accidents is described by constructing the network topology structure of risk factors [17]. For instance, network diagrams have been developed to capture the complex interdependencies among risks involved in railway accidents [18], which was also studied by Liu et al. [19] with the application of a causal network to mine the fault information. In addition, an evidential network-based hierarchical model was proposed by [20] to investigate the common cause failures and mixed uncertainties for system reliability analysis. Risk-propagating path was modeled by Singh and Maiti [21] to assess the performance of a risk control system, which was similar to the studies for risk analysis involved in domino effects [22]. The cascading effects of risk events were also frequently utilized to study the risk propagation process. Wu et al. [23] proposed a risk propagation model of cascading failure based on discrete dynamical systems. Wang et al. [24] took the risk interaction and propagation effects into consideration to determine the risk priority of failure mode with the PageRank algorithm.
Considering the successful application of CNs in the subway [25], power industry [26], and water supply fields, in this study, the risk propagation of fire and explosion accidents caused by oil and gas leakage is analyzed from the perspective of the network, so that the criticality of the hazardous event can be assessed on this basis. According to studies by Granovetter [27], Serrano and Boguna [28], and McAuley et al. [29], the differences or advantages of the CN applied in this study and traditional risk analysis methods can be summarized by the following three aspects:
  • Compared with traditional methods such as FTA, ETA, and BN, adjacency matrices in CN can more effectively represent and analyze complex correlations between hazardous events, which is beneficial for risk mitigation.
  • The method under CN theory is highly scalable. Most of the risk scenarios studied by traditional methods are limited by existing accident reports. However, in this study, CN can be combined with a path-planning algorithm to simulate the risk propagation paths in various scenarios and solve the shortest propagation paths with different consequences under various initial trigger factors.
  • There are more quantitative analysis perspectives under CN theory that can be used to evaluate hazardous events, such as degree distribution, degree correlation coefficient, betweenness, average path length, eigenvector, clustering coefficient, etc., which are not available in traditional risk analysis methods.

1.2. Innovative Contribution

The purpose of this study is to explore the propagation mechanism of risks involved in unsafe events, from triggering events to fire and explosion accidents, and on this basis, recommendations or countermeasures are more focused on risk mitigation to improve the reliability of oil and gas processing system. To this end, the BT model of gas leakage and oil leakage is established and mapped into CN according to the mapping rules. The method proposed in this study focuses on the risk propagation mechanism in the developed CN, and the applicability of the method is verified by the practical application of fire and explosion accidents caused by oil and gas leakages. The results show that the proposed method can be extended to other types of accidents, such as collision, impact, oil unloading, etc., thereby improving the safety level of FPSOs. The salient features of the proposed method in this study are summarized as follows:
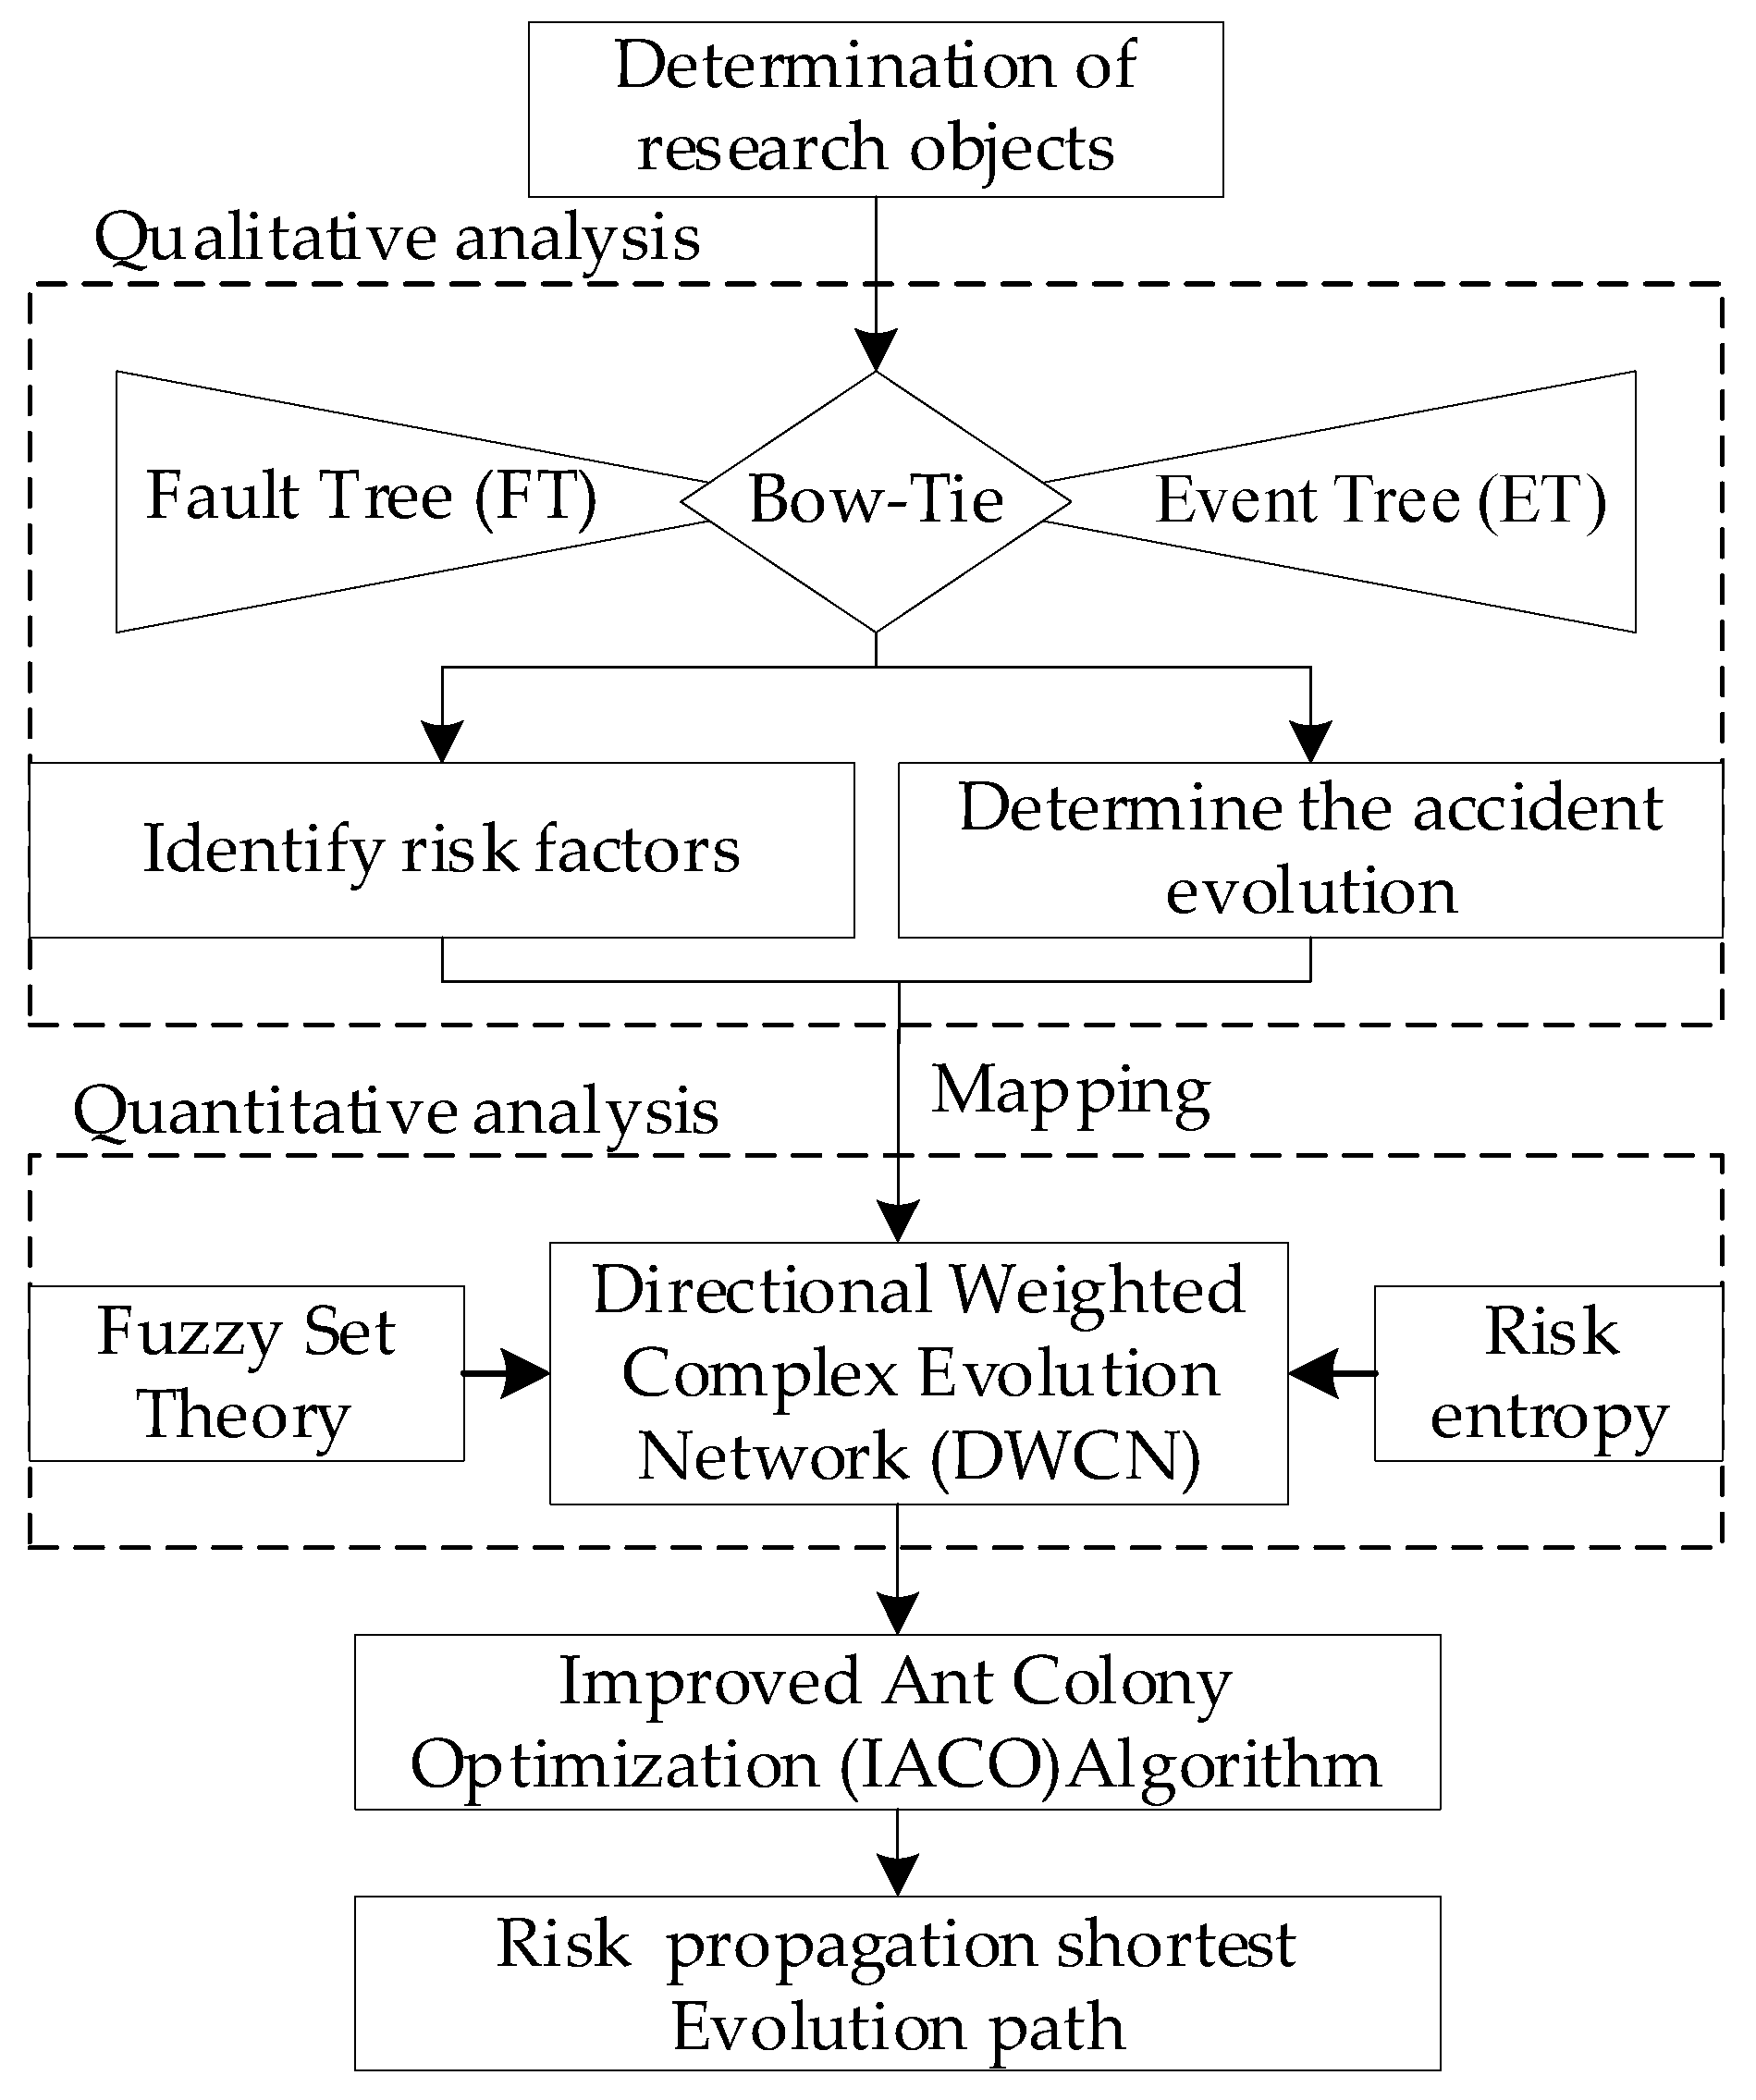
  • A model based on a BT model mapped to CN is explored to deal with the evolution method of fire and explosion accidents caused by oil and gas leakage in FPSO oil and gas processing systems.
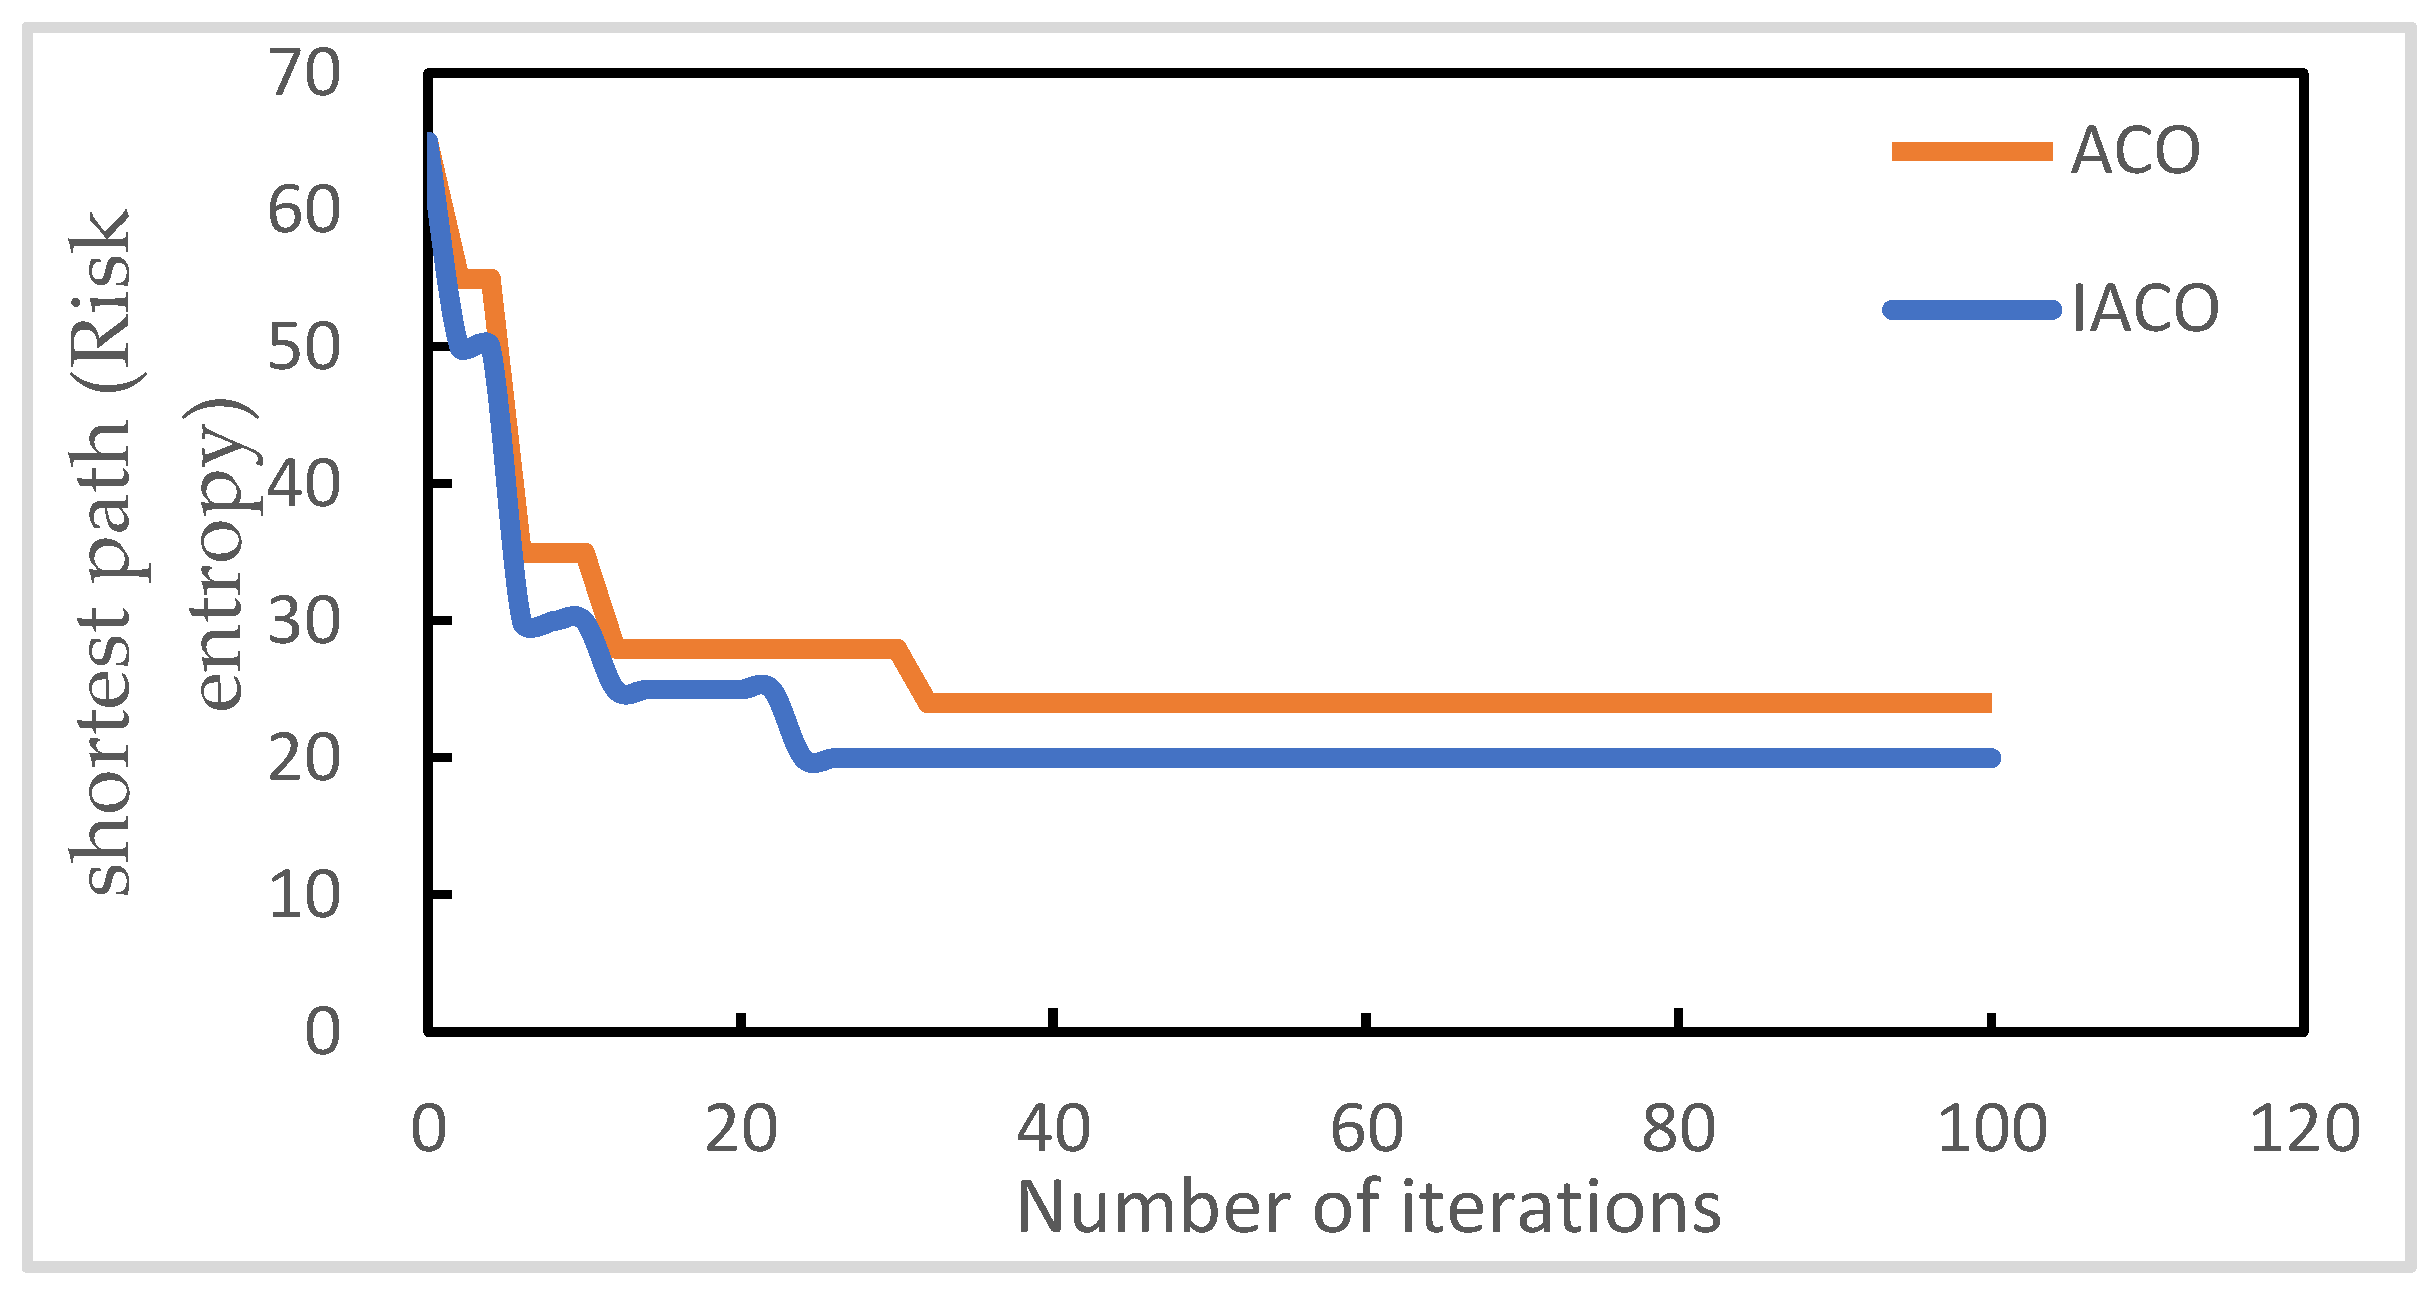
  • A shortest path planning algorithm based on risk graph theory is proposed, i.e., an IACO algorithm, which is extended to solve the shortest path problem with uncertainty.

1.3. Organization

The remaining parts of this paper are organized as follows. A brief description of the proposed method, including the BT model, the method of mapping BT into CN, and the IACO algorithm, is shown in Section 2. The qualitative risk analysis based on the window of opportunity and the quantitative risk of oil and gas leakage risk propagation evolution path based on the CN and IACO algorithm are presented in Section 3. Section 4 compares the proposed method with BN and compares the conventional ACO algorithm and IACO algorithm. Finally, conclusions are drawn in Section 5.

2. Proposed Methodology

The proposed methodology in this study is illustrated in Figure 1, in which the combination of BT, DWCN, and IACO algorithms leads to a comprehensive model for evaluating the risk propagation capacity of hazardous events.
According to Figure 1, the proposed comprehensive model can be developed using 4 steps:
Step 1: The establishment of a BT model of accident evolution. Combined with ETA and FTA, a risk evolution analysis model is established, and corresponding safety barriers are established in the accident evolution path to achieve the purpose of preventing, controlling, and mitigating risk accidents.
Step 2: The mapping of BT into CN. According to the mapping principle of nodes and edges, the CN of an accident chain starting from the triggering event to the consequence event is established.
Step 3: Risk entropy and the determination of edge weights. Considering the random uncertainty and fuzzy uncertainty of risk propagation, the edge weight is represented by the risk entropy, so that the path search algorithm can be introduced to measure the propagation state of accident risk.
Step 4: Shortest path analysis based on IACO algorithm. Aiming at the problem of local optimum in the optimization process, the traditional ACO algorithm is improved; the shortest path calculation of the risk evolution network is realized, and the path with the minimum weight sum between any two nodes is sought.

2.1. The Establishment of BT Model

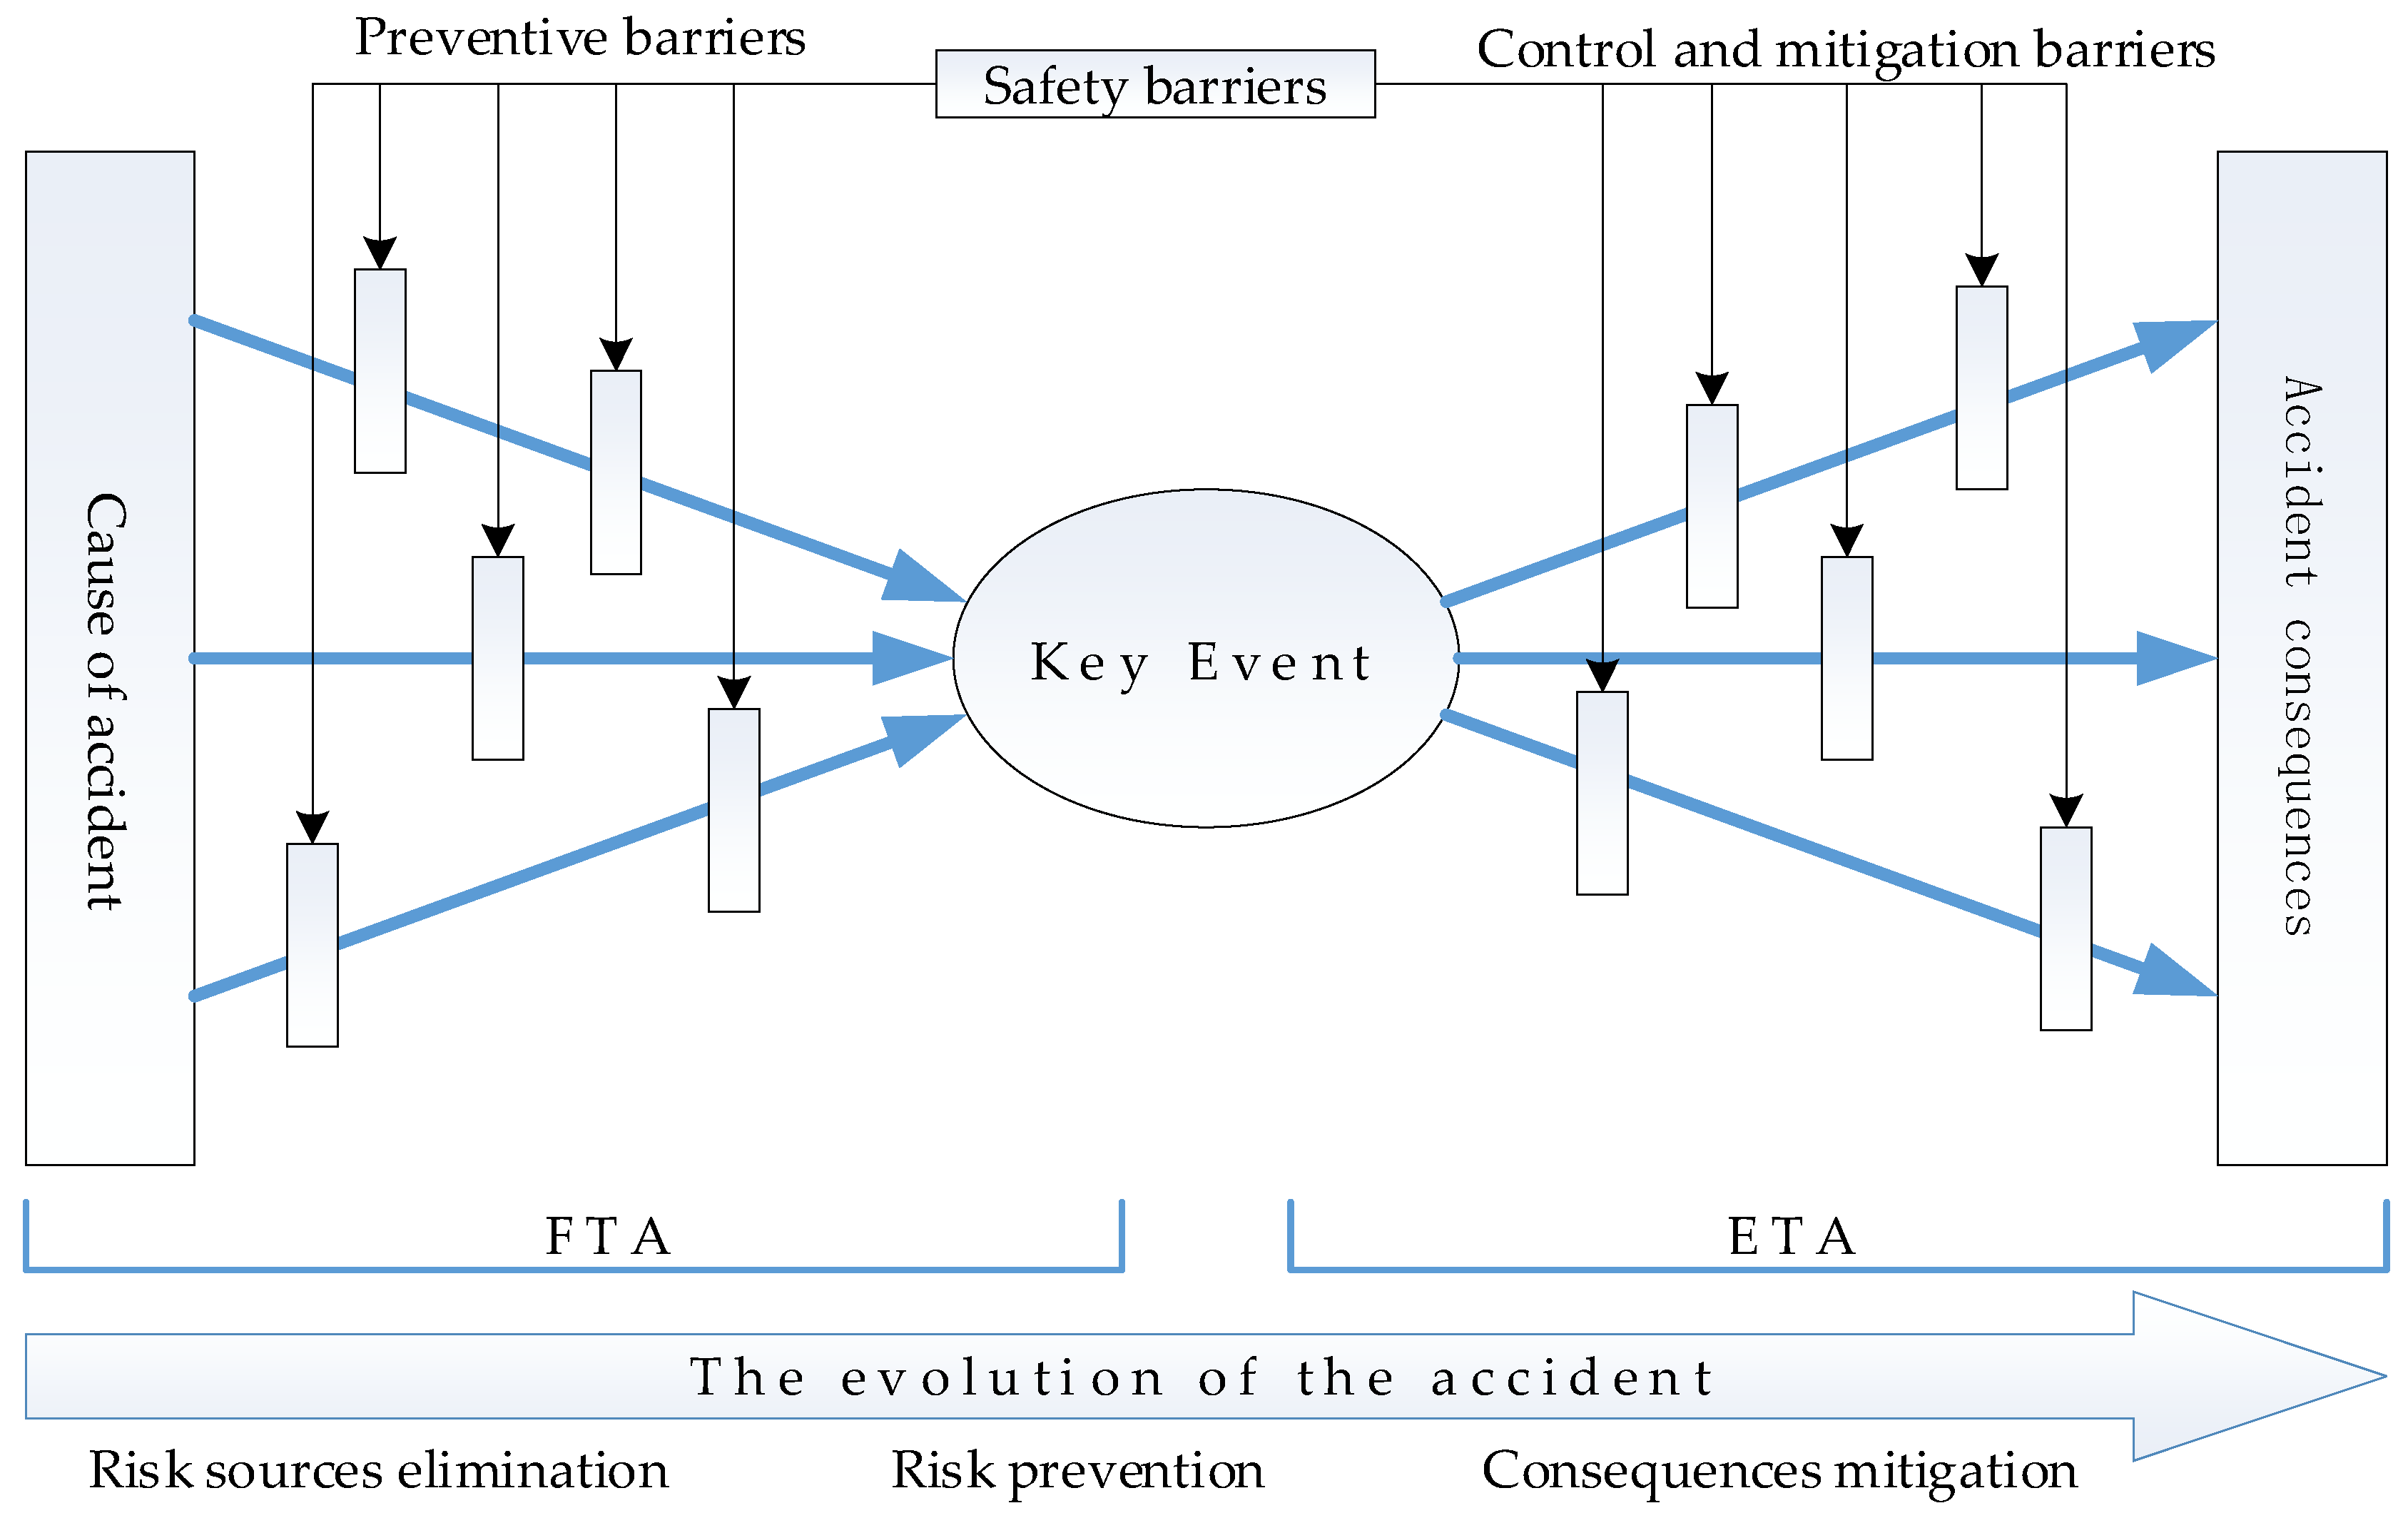
2.1.1. Bow-Tie Analysis Method

Compared with FTA and ETA, the BT model has its unique advantages. It clearly states the combination of the primary event that could lead to the top event and the failure of the safety barrier to escalate the top event to a specific consequence. BT analysis [30] is mainly used for risk assessment, barrier analysis, accident risk management, and to help understand specific risk conditions and systemic risk and prevention. BT method establishes corresponding safety barriers on the evolution path to prevent, control, and mitigate risk accidents. Preventive barriers are used to reduce the likelihood of an accident, while control and mitigation barriers are used to reduce the severity of the consequences and the duration of the accident to limit the escalation of the accident. The principle of accident risk prevention and control based on the BT method is shown in Figure 2. In the process of accident development, corresponding safety barriers should be established to eliminate danger sources, prevent deterioration, and reduce consequences.

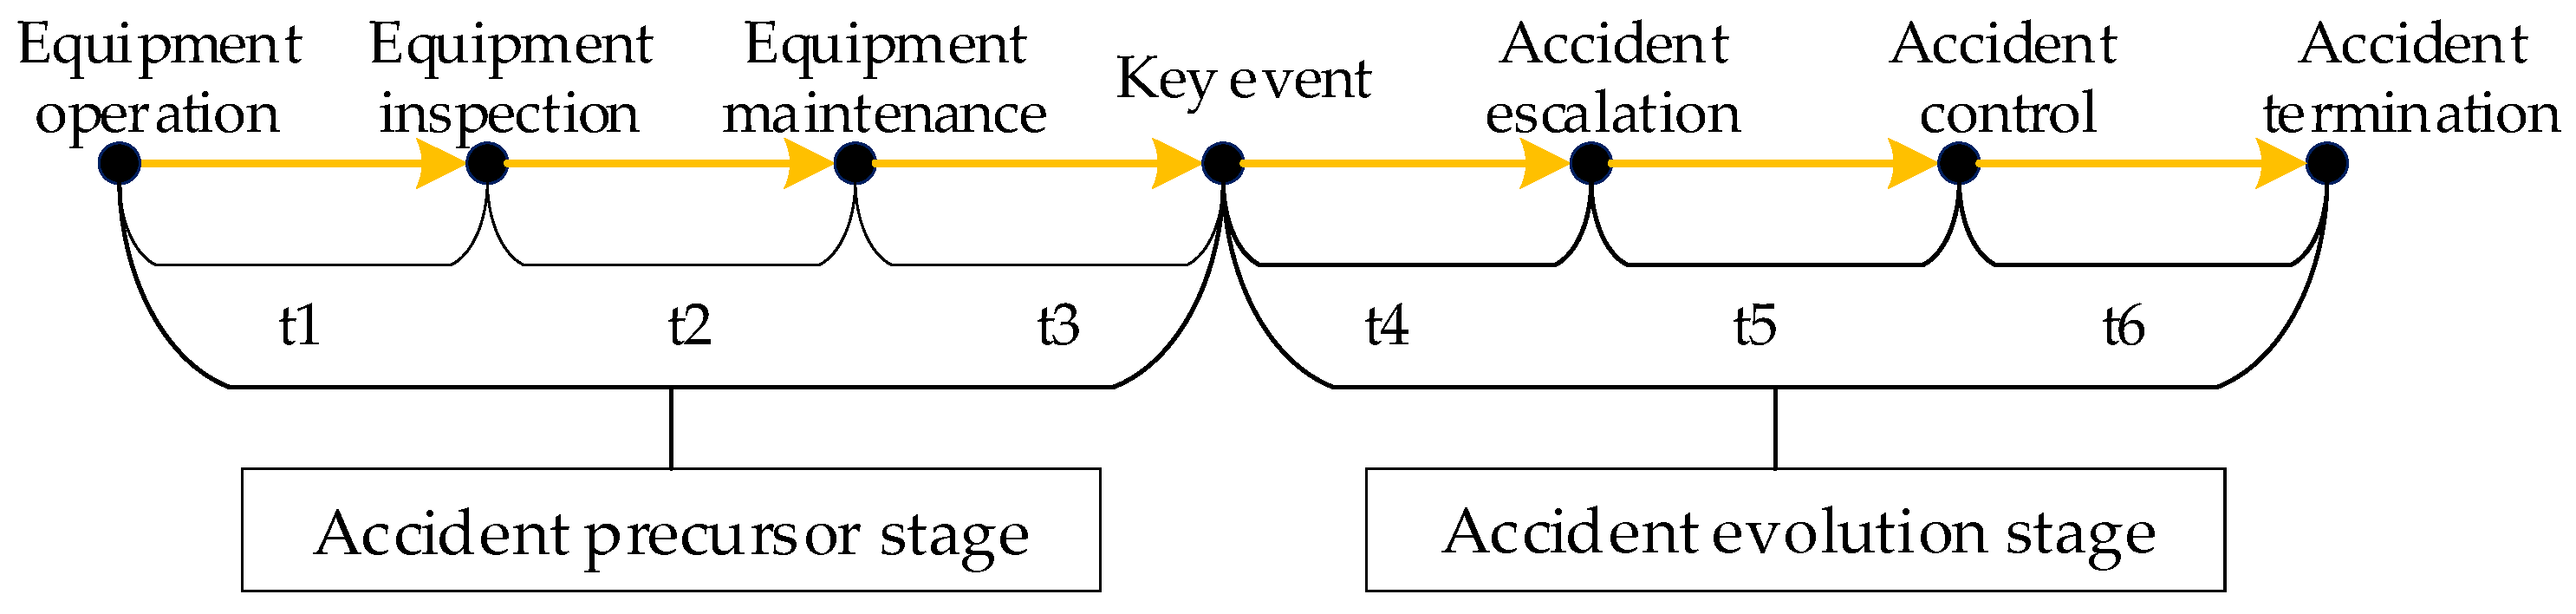
2.1.2. Window of Opportunity during Accident Evolution

The concept of window of opportunity (WO) is mainly used in the medical field to indicate the best time to treat a disease [31,32]. The WO represents the best time to invest in a business and the best time to catch up with competitors [33,34]. In this paper, it is obtained from the BT model that, in the evolution path of suppressing accident escalation, there are two stages that can prevent and control the evolution of accidents, namely accident precursor stage before the occurrence of key events and accident evolution stage of key events into consequence accidents. The accident evolution is shown in Figure 3.
In the accident precursor stage, the main task of the operators is to carry out daily inspections, identify and eliminate dangerous factors. The accident precursor stage mainly includes equipment operation, equipment inspection/supervision, equipment maintenance, etc. Normally, through routine inspection and maintenance, dangerous factors can be discovered and eliminated in a timely and effective manner; thereby, the probability of accidents can be reduced, and the time of the accident precursor stage can be extended. However, due to human factors as well as environmental factors, including the year-round operation of the equipment, the number and frequency of daily inspections cannot keep up with the wear rate of the equipment. In addition, as worker workload and stress increase, inspections and maintenance become less effective, all of which will lead to a reduction in the probability of finding and eliminating risk factors.
In the accident evolution stage, the main task of the operator is to take emergency measures to prevent the accident from escalating. It can be divided into three parts: accident escalation, accident mitigation/control, and accident termination.
Whether and what actions are taken at each stage will cause the accident to develop in different directions. Failure to cut off the development path of the accident quickly and effectively will shorten the WO and cause the accident to rapidly escalate into a disaster.

2.2. BT Mapping into CN

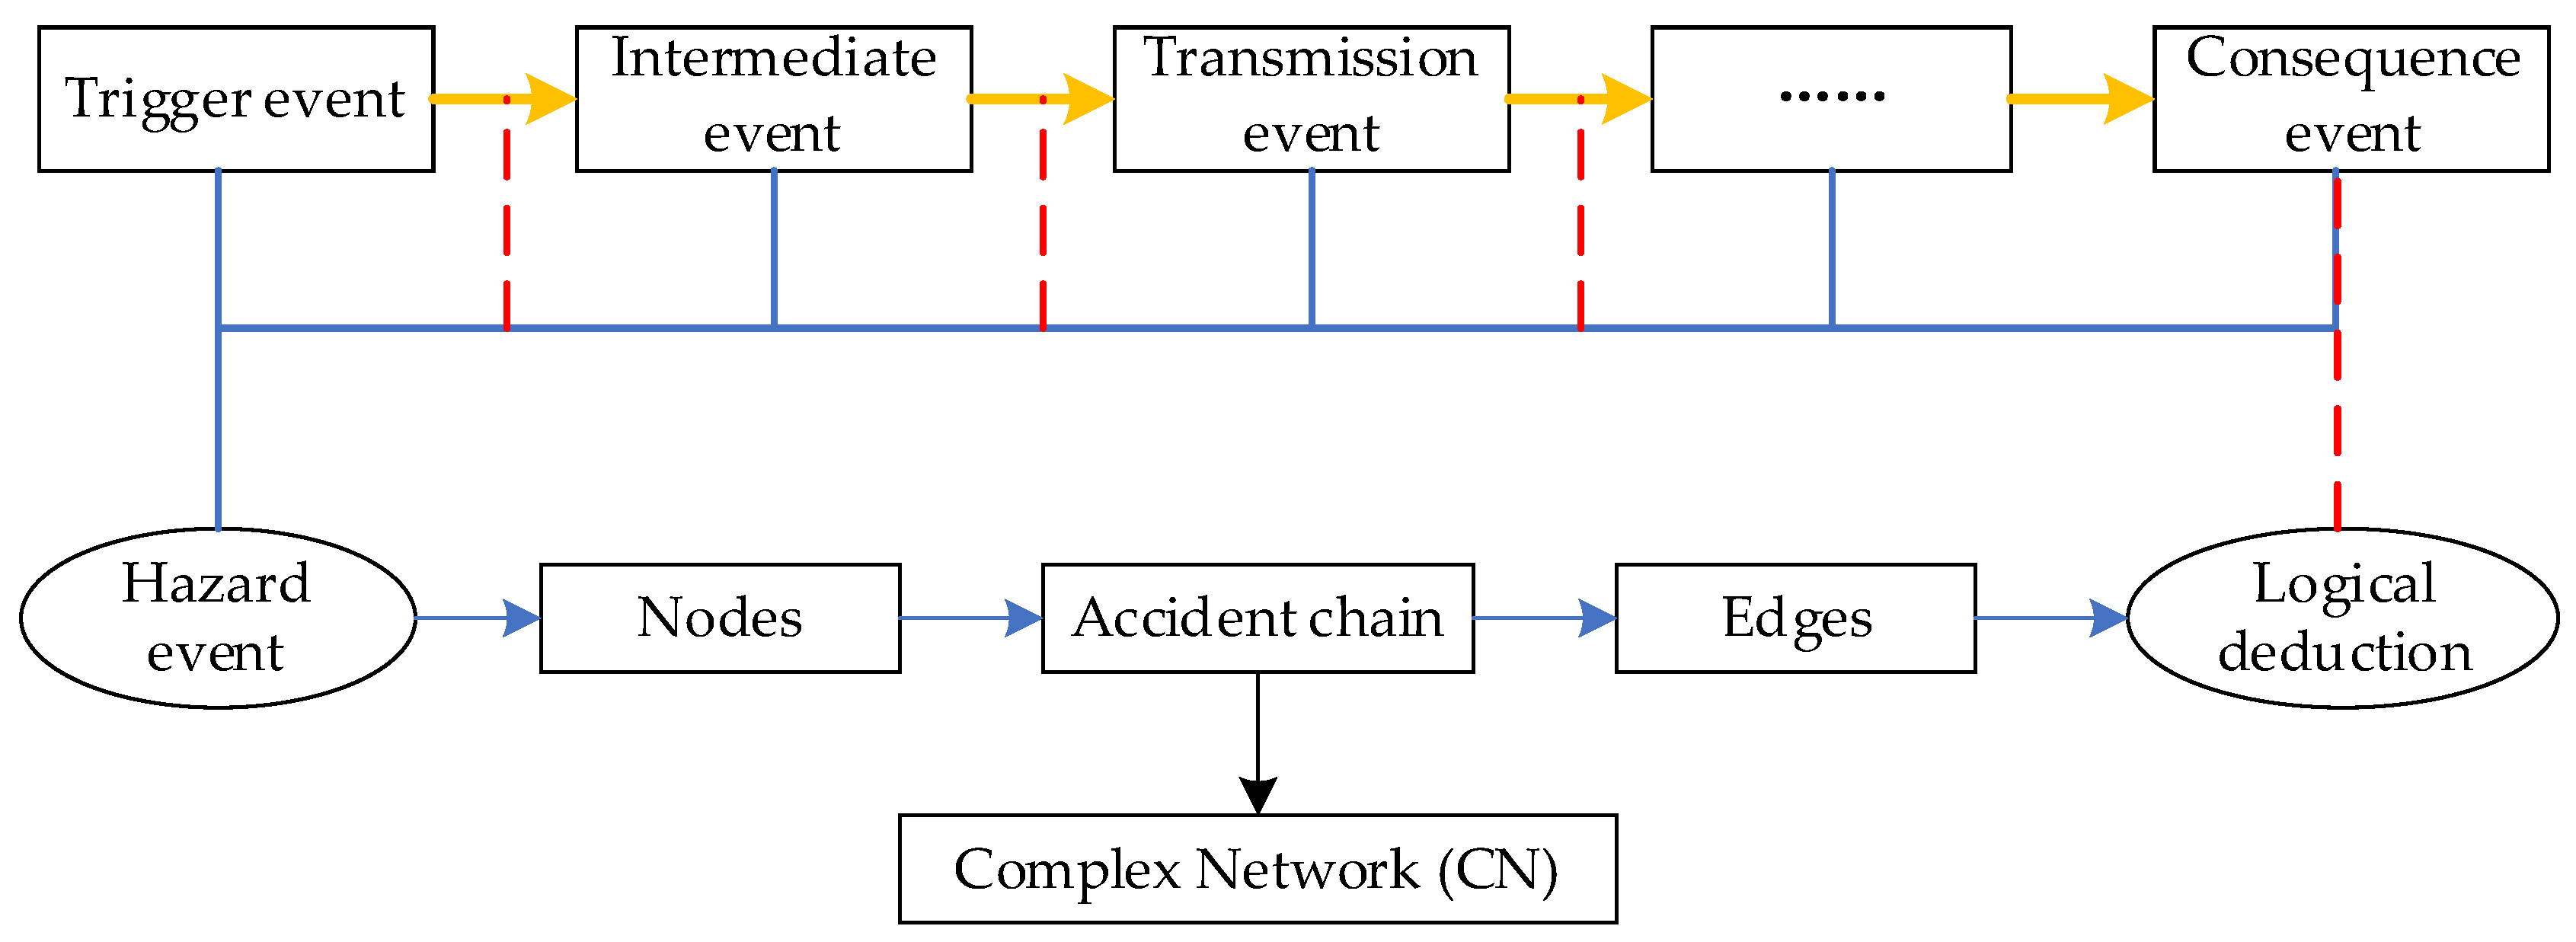
2.2.1. Mapping Principles

According to the FTA and ETA models of the BT model, the accident chain starting with the triggering event and ending with the final consequence event can be extracted. All hazardous events can be divided into initial trigger events (risk sources), intermediate events, transmission events (unsafe behavior/state), and consequence events (accidents). The relationship between them is:
  • Initial trigger event: Also known as risk source, this is the source event, which is the weakest event that triggers the accident, and the occurrence of this event will lead to the possibility of subsequent events.
  • Transmission event: The occurrence of this event will most likely trigger the occurrence of a top-level event. During the risk evolution process, the occurrence of transmission events should be avoided.
  • Consequence event: This is the final consequence event of network evolution, which is the end of risk propagation.
  • Intermediate event: Between the risk source and the transmission event, this is the key factor that triggers the transmission event, and it is also the follow-up event of the risk source.
All the above-mentioned dangerous events are considered nodes in the developed network, and the logical relationships between the identified events are considered directed edges. Therefore, through logical deduction, a CN can be built from a trigger event to a consequence event [35], as shown in Figure 4.
Mapped nodes and edges should follow the guidelines below:
  • Mapped nodes
CNs focus on the result orientation of evolution, so nodes not only represent an event, but also represent the state of the event. In fact, the state of an event is divided into many kinds; the simplest one is occurrence or non-occurrence. In the modeling process of CN, nodes need be specified as the state of events. Multiple nodes need to be defined to distinguish the different state of one event.
2.
Mapped edges
Mapping causal relationships between discrete, categorical nodes requires defining logical edges. Event chains can be developed with the help of causal relationships between these events, so that many event chains can be obtained. The basic rule is to identify the immediate cause and effect of each node. The evolution forms of nodes include straight chain, divergent, centralized, cross, circular, and so on. In the BT, various causal events penetrate, intersect, and shuttle each other, forming a crossed network evolution type.

2.2.2. CN Model

Similar to social networks, typical CNs also consist of nodes and edges [36], i.e., the CN can be expressed as G = V , E , where V = v i | i ϵ I = 1 , 2 , , N is the set of network nodes. The set of edges between two nodes can be represented by E = e i j = v i , v j | i , j ϵ I . The adjacency matrix is an N×N matrix, which can be expressed as:
A i j = a i j × p i j , i j 0 , else
That is, a i j i , j ϵ I = 1 when event i triggers event j, and 0 otherwise. The probability of event i triggering event j is recorded as p i j , and the probability of event i being triggered by event j is recorded as p j i .

2.3. Risk Entropy of CN

The accident-development process is accompanied by the transmission of the node risk state. The difficulty of the transmission is reflected in the edge weight w of the CN. The traditional edge weight is characterized by assigning a certain value [37], while the risk propagation is uncertain and needs to be represented by probability. However, the CN path search algorithm is based on the traversal addition operation, and the probability is not additive; entropy is additivity.
Therefore, fuzzy set theory (FST) and entropy are introduced here. FST can effectively represent subjective, fuzzy, and imprecise data and information, in which the fuzzy numbers that experts are invited to score will represent the probability value of the main event; the fuzzy numbers in linguistic terms can then be transformed into fuzzy failure probabilities of factors. The probability is then converted into risk entropy, thereby representing the conduction weight between nodes. The steps are as follows:
Step 1: Judgments made by experts in the form of language expressions are first transformed into fuzzy numbers (Table 1) and then aggregated into a fuzzy number called fuzzy possibilities (FPs). Assume that the judgment of any two experts on the possibility of a certain risk transmission corresponds to the trapezoidal fuzzy numbers A = a 1 , a 2 , a 3 , a 4 and B = b 1 , b 2 , b 3 , b 4 . M is the total number of experts, W E i is the influence weight of expert E i , and the event conduction possibility R A G = R A G 1 , R A G 2 , R A G 3 , R A G 4 after aggregate calculation is obtained as:
R A G = C C E 1 E 1 + C C E 2 E 2 + + C C E M E M
Here, C C E i is the consistency coefficient of expert E i , i.e.,
C C E i = β W E i + 1 β R A E i
β 0 ,   1 is the relaxation factor, which represents the importance of W E i , which is taken as 0.5 in this paper.
R A E i = A A E i i = 1 M A A E i
A A E i = 1 M 1 j = 1 j i M S i j E i , E j
S A , B = 1 1 4 i = 1 4 a i b i
Step 2: Defuzzification. The center of gravity (COG) deblurring method is used here to deblur the trapezoidal fuzzy number R A G .
FP S = 1 3 R A G 1 + R A G 2 + R A G 3 + R A G 4 - R A G 4 R A G 3 R A G 1 R A G 2 ( R A G 3 + R A G 4 ) ( R A G 1 + R A G 2 )
Step 3: The probability value obtained by fuzzy reasoning and the random probability value are usually not in the same order of magnitude. In order to combine the two, the Onisawa transformation formula is used to convert the subjective fuzzy language level (FPs) into the objective random probability level (FPr):
FPr = 1 10 K F P S 0 0 F P S = 0 K = 1 - F P S F P S 1 3 × 2.301
where K is a constant value, FPs is the fuzzy probability, and FPr is the fuzzy probability of each conduction path.
Step 4: Transformation of risk entropy. Probability risk entropy with additivity is introduced here to measure the accident risk propagation [38]. Entropy is a state function that was introduced by Clausius in 1867 to complete the quantification of the second law of thermodynamics, which has evolved into a measure of system disorder or uncertainty [39]. Shannon [40] used information entropy to describe the uncertainty of an information source. Drawing on the definition of self-information in information theory, this paper uses self-information to represent the edge weights between nodes, called risk entropy. For the event i triggering event j, its entropy value can be expressed as:
w i j = ln ( p i j )
The calculation of an accident shortest path can be converted into the optimal solution problem. The higher the probability of an event, the smaller the self-information; therefore, the shortest path of an accident is the path with the lowest risk entropy. Finding the shortest path between any two nodes i and j is one of the most important research topics of CN [41]. A path is a sequence of edges with a specific starting node and destination node. When there are multiple paths between two nodes, finding the path with the shortest distance becomes the main goal, that is, to solve the following formula [42,43]:
min ln ( a i j w i j )

2.4. Risk Evolution Shortest Path Calculation Based on IACO Algorithm

It can be seen from Equation (10) that for a DWCN, the shortest path is the path with the smallest sum of edge weights between two nodes in the network graph. When the CN has multiple initial events, the shortest path when multiple events lead to the final accident can be analyzed separately. The problem of finding the shortest path between two nodes is one of the most important research topics in CNs. A path is a sequence of edges with a specific starting point and destination point. When there are multiple paths between two points, finding the fastest evolution becomes the main goal, which is the problem of finding the shortest path.
Metaheuristics can handle additional constraints in reasonable computational time and to provide optimal or near-optimal path solutions in small and large networks. Identifying the shortest path using a meta-heuristic algorithm provides a suitable solution aimed at improving the efficiency of the identification process.
Conventional path planning algorithms include search algorithms based on graph theory (such as Floyd algorithm), the Dijkstra algorithm, the A* algorithm, etc. [44]. Although these algorithms can find the global optimal solution, it will have higher time complexity and space complexity. The sampling-based rapid search random tree (RRT) algorithm is suitable for high-dimensional environments [45] and has the advantages of complete probability and no need for mapping. However, the found path cannot achieve the effect of real-time path planning, and the randomness of the results brought by random search also affects the practical application of the RRT algorithm. At present, meta-heuristic algorithms such as particle swarm optimization (PSO) [46], genetic algorithms (GAs) [47,48], and the ACO algorithm [49,50,51,52] have been widely used in different research fields.
The ACO algorithm is an intelligent algorithm proposed by Marco Dorigo. The ACO algorithm is derived from the process of ant colonies searching for food. Scientists have found that after ants find food, they release a substance called pheromone along their path, which can guide other ants to find food. However, the way ants choose paths is random, and some ants will not choose paths with high pheromone concentrations. The concentration of inductive substances on the valuable path will continue to increase, and the path that has the most ants traveled is the optimal path. Due to the heuristic advantage of the ACO algorithm, it has great advantages in path planning. For solving the fire and explosion risk evolution problem of the FPSO oil and gas processing system caused by the initial trigger event in this paper, the ACO algorithm can effectively solve the shortest path of the risk evolution, and the concentration of the pheromone represents the length of the evolution path. The key transmission factors in the risk evolution process are obtained through the ACO algorithm to provide reference for engineering operators to curb the risk propagation path. Additionally, the shortest path of the risk evolution network is improved based on the ACO algorithm in this paper.
The ACO algorithm consists of a given number of ants, whose main goal is to find bird nests and food sources. Given a directed graph of N nodes, dij represents the distance between node i and node j, the number of ants is set to m, and the tabu table-tabuk of each ant is set to record the node information that the ants have walked through [53]. At the beginning, the ants will continuously select the next position to move from the list of possible positions according to the strength of the pheromone on the path and the heuristic information. After each ant has constructed a solution, the amount of pheromone left on the path by the ant is updated according to the pheromone update rule, and after updating the pheromone, the process is iteratively reread until the termination condition is met. The solution generated by the algorithm will be the best solution found throughout the iterations. At the initial moment, each pheromone is equal, set at τ i j 0 = c (c is a constant).
The probability P i j k t that an ant moves from position i to position j in one iteration is given by [54]:
P i j k t = τ i j α t η i j β t s a l l o w e d k τ i s α t η i s β t , j a l l o w e d k 0 , o t h e r w i s e
allowedk represents the position node set that the ant k at position i can move, that is, the adjacent points of I; τ i j t represents the pheromone concentration between positions; η i j t is heuristic information, which is the reciprocal of the distance between two nodes,   η i j t = 1 / d i j ; the parameters α and β are free parameters, which determine the relative importance of pheromone τ and heuristic information η, respectively [55]; if α = 0, the ant will randomly choose the next position to move (that is, the ant will not consider the experience of the previous ant); if β = 0, the ants will only consider the road segments that ants pass through, which will cause the algorithm to stagnate in some cases. When all ants complete one search, the pheromone concentration on each path is adjusted according to the following formula:
τ i j t + 1 = 1 ρ τ i j t + Δ τ i j t
ρ is the pheromone volatilization factor, which represents the decay degree of pheromone τ i j t with time, ρ 0 , 1 . Δ τ i j t is the pheromone increment, Δ τ i j t = i = 1 m Δ τ i j k t , where Δ τ i j k t represents the ants the pheromone increment brought by ant k to the edge (i, j) in this cycle. If the ant k does not pass the path (i, j), then Δ τ i j k t = 0 ; otherwise, Δ τ i j k t = Q / L k Q is the given parameter, and L k is the path length searched by the kth ant in this cycle.
Compared with other algorithms, although the basic ant colony algorithm can search for a high-quality solution globally, the search efficiency of the algorithm is low in the early stage of calculation because the pheromone on each path is not very different. The basic ant colony algorithm easily falls into a local optimal state in the optimization process, which is mainly due to the excessive positive feedback mechanism that guides lots of ants to the path with higher pheromone, which reduces the probability of choosing other paths. The following improvements are made:
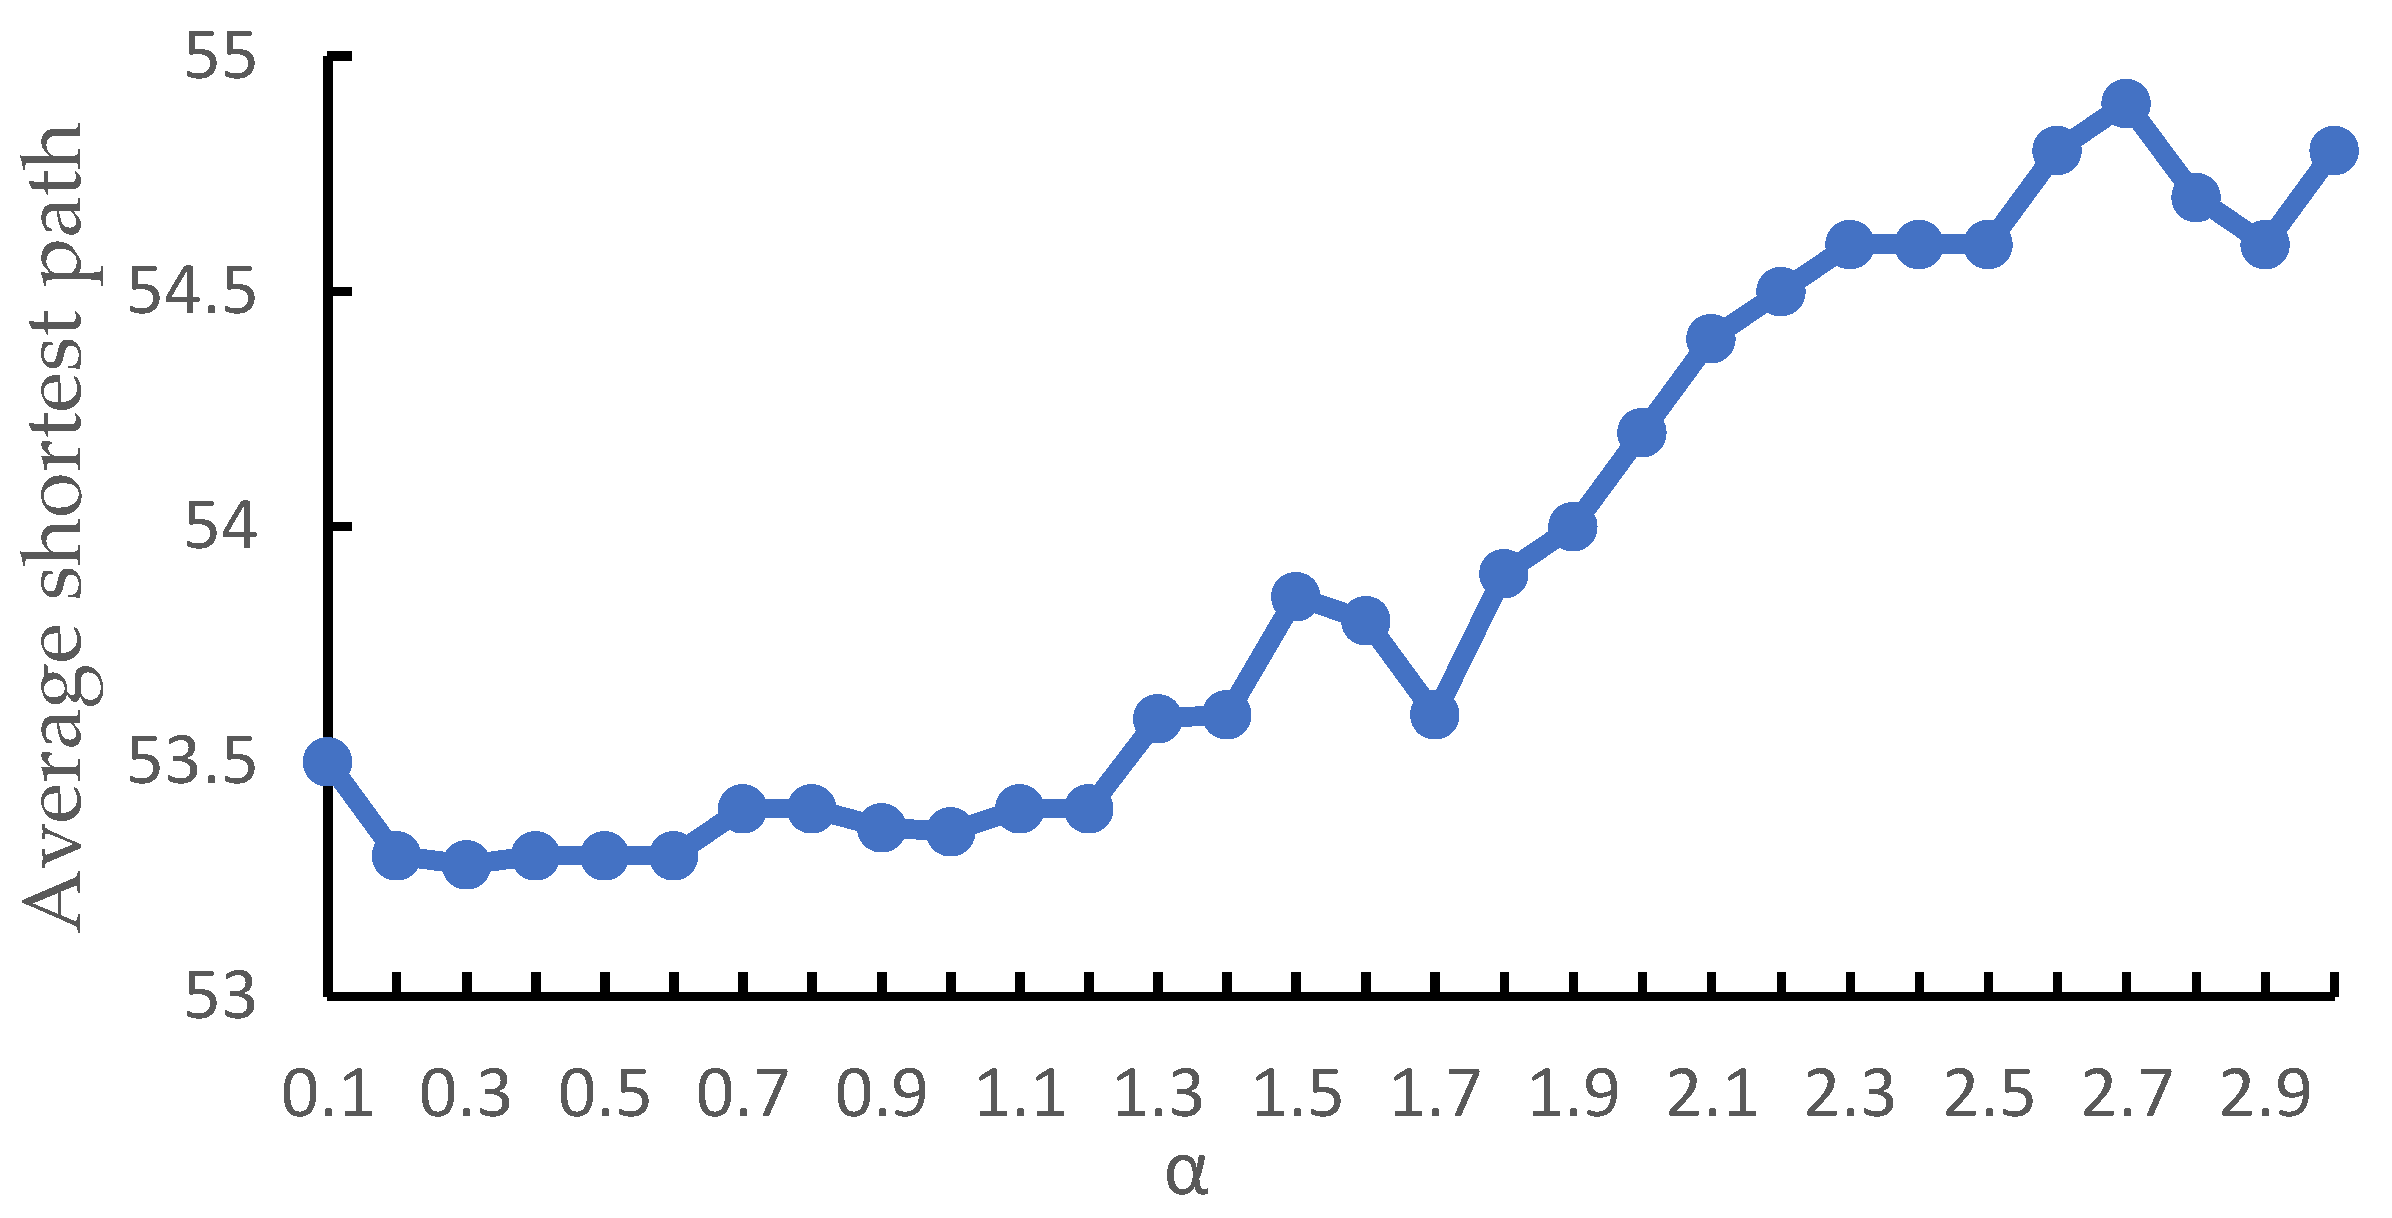
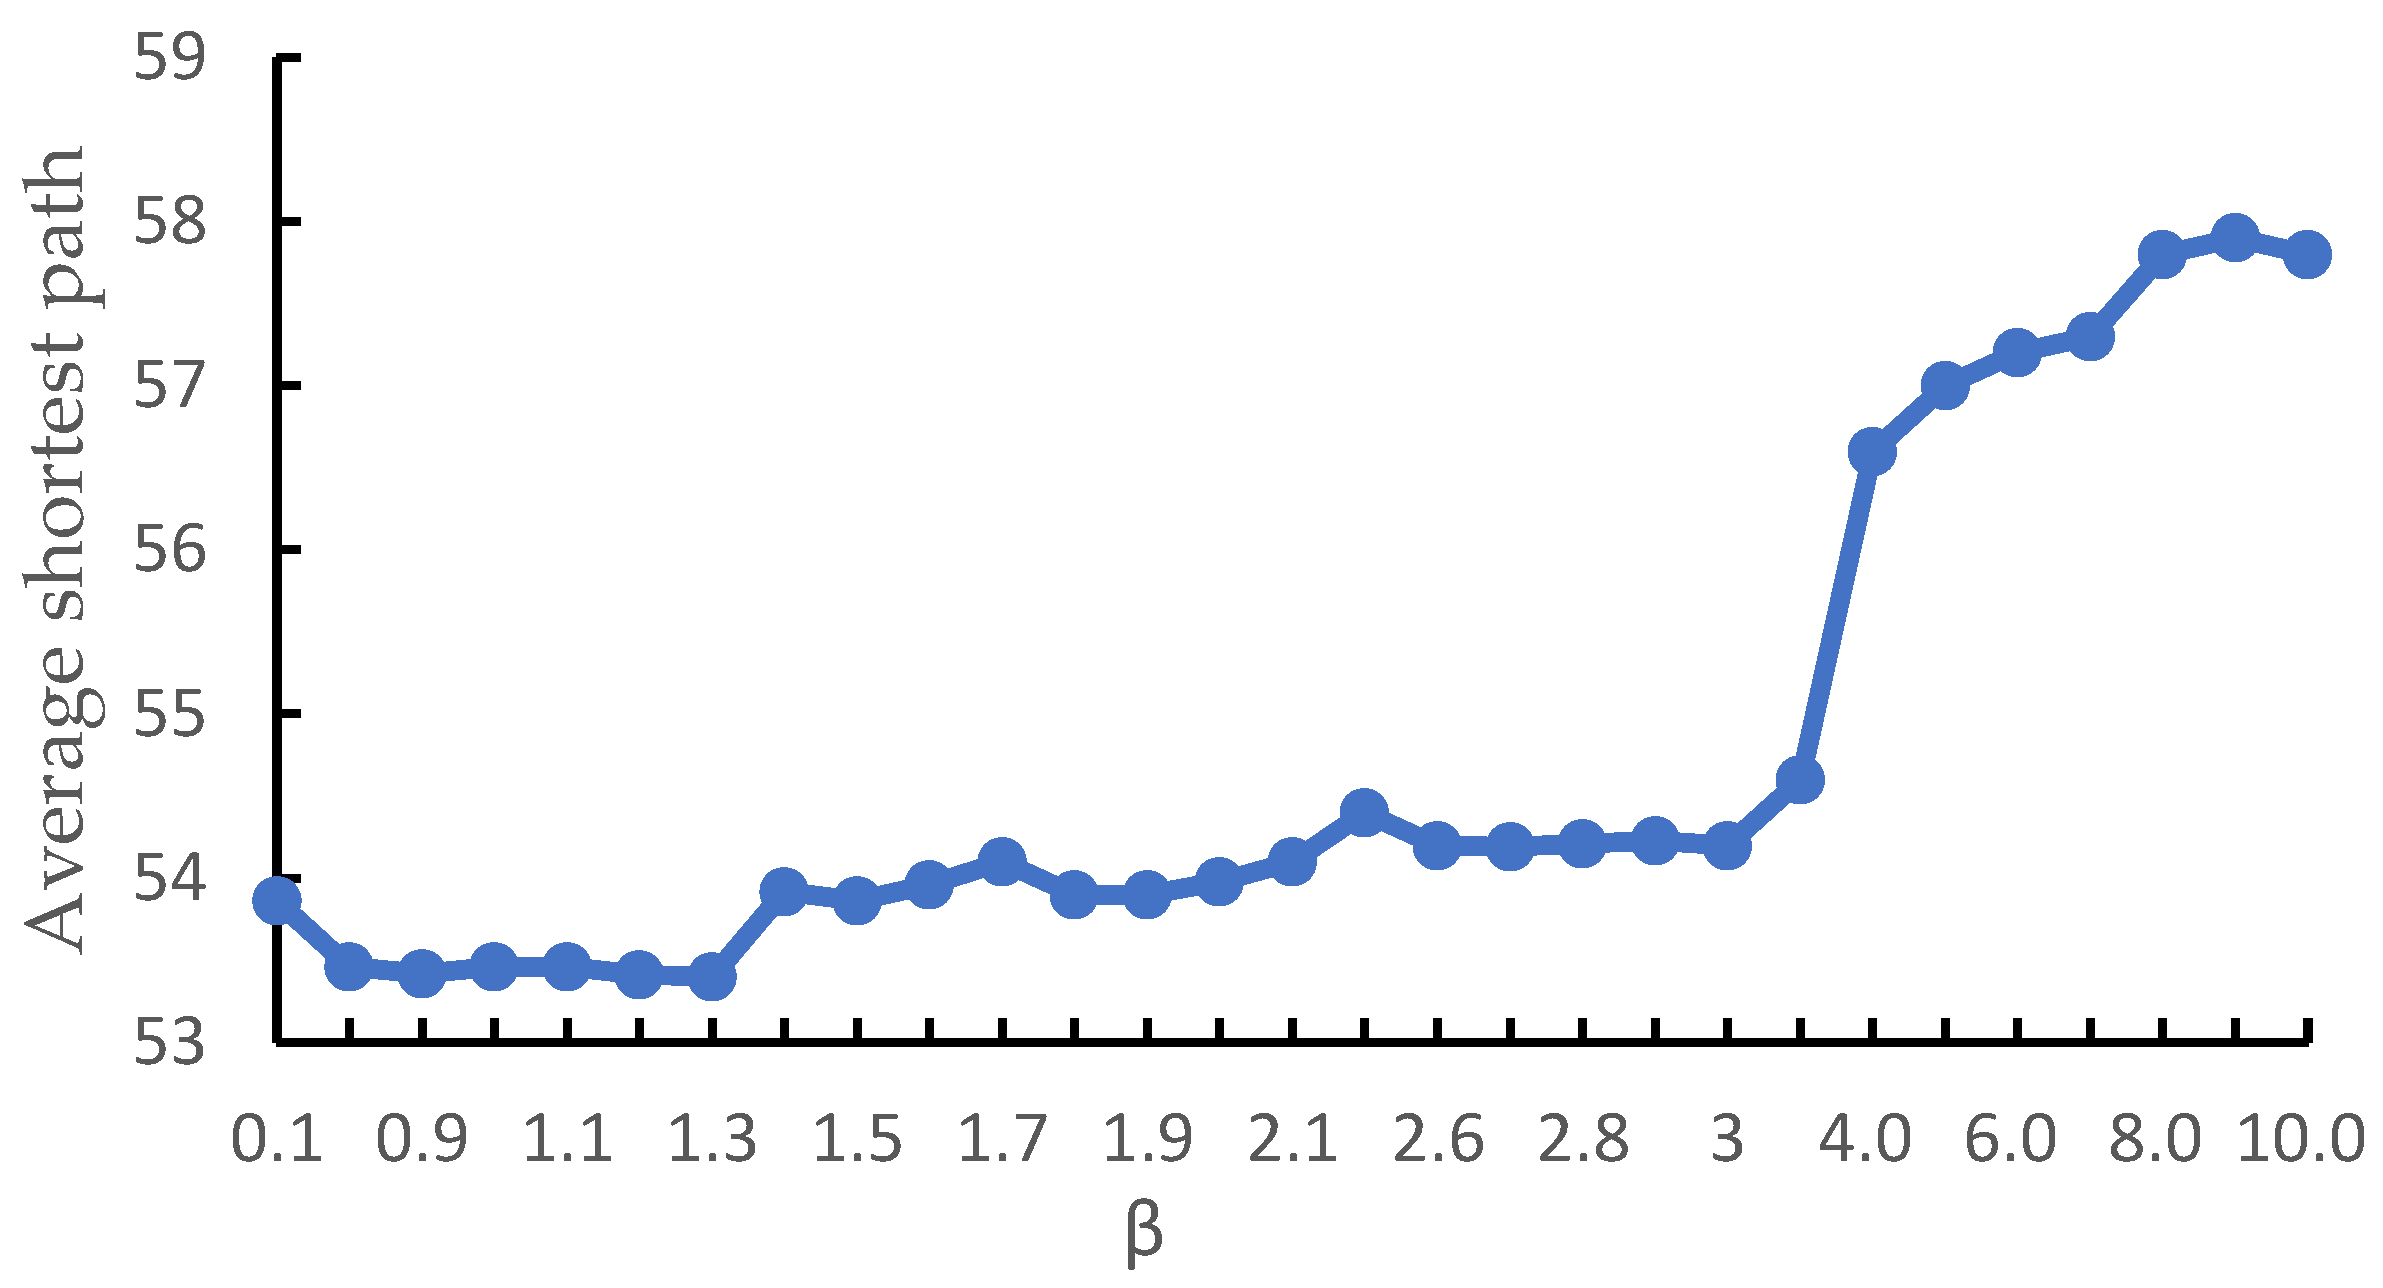
  • The heuristic function is improved
The main factors affecting the shortest path are the probability transfer between nodes and the update of pheromone concentration on the walking path. In general, the reciprocal of the Euclidean distance between node i and the next node j is taken as the heuristic function in the transition probability. In fact, in the initial search, the number of ants on the walking path is small, and the released pheromone is small, which causes the probability of other ants to deviate from the correct search path; thus, a local optimal solution or an invalid solution is formed [56]. Therefore, the Euclidean distance between the next node and the target node is introduced into the heuristic function; thereby, the connection between the current node and the target node is strengthened. The mathematical expression is as follows:
η i j = 1 ( d i j + d j E ) 2
dij represents the distance between the current node i and the next feasible node j; djE is the distance from the next feasible node j to the target node E, so the directionality of the search path is strengthened, the running time is shortened accordingly, and the time efficiency of the algorithm is improved.
2.
Update rules of pheromone concentration be improved
After each iteration of the ACO algorithm from the starting point to the end point, an optimal path will appear in the paths traveled by all ants. This optimal path is the shortest path in this iteration but not necessarily the global optimal path, but the probability of finding the globally optimal path around this path is high. In order to reduce the possibility that the ant colony chooses road sections with less pheromone concentration during the walking process, and in order to increase the value of the shortest path after each iteration, the pheromone concentration weighting is carried out on the section of the optimal path generated by this iteration. Therefore, in later iterations, the optimal path will be inductive to the ant colony:
τ i j t + 1 = 1 ρ τ i j t + ϑ Δ τ i j t ,   P i j P b e s t S , E 1 ρ τ i j t + Δ τ i j t ,   o t h e r w i s e
In the above formula, θ is the undetermined coefficient; in this paper, θ = 2 is set; P b e s t S , E represents the optimal path in this iteration; ρ is the pheromone volatility factor. In a complex risk evolution network, using the ant colony algorithm to solve the shortest path should not take all nodes as the path-finding range. In order to reduce the search range, it is inspired by the shortest straight line between two nodes.

3. Case Study

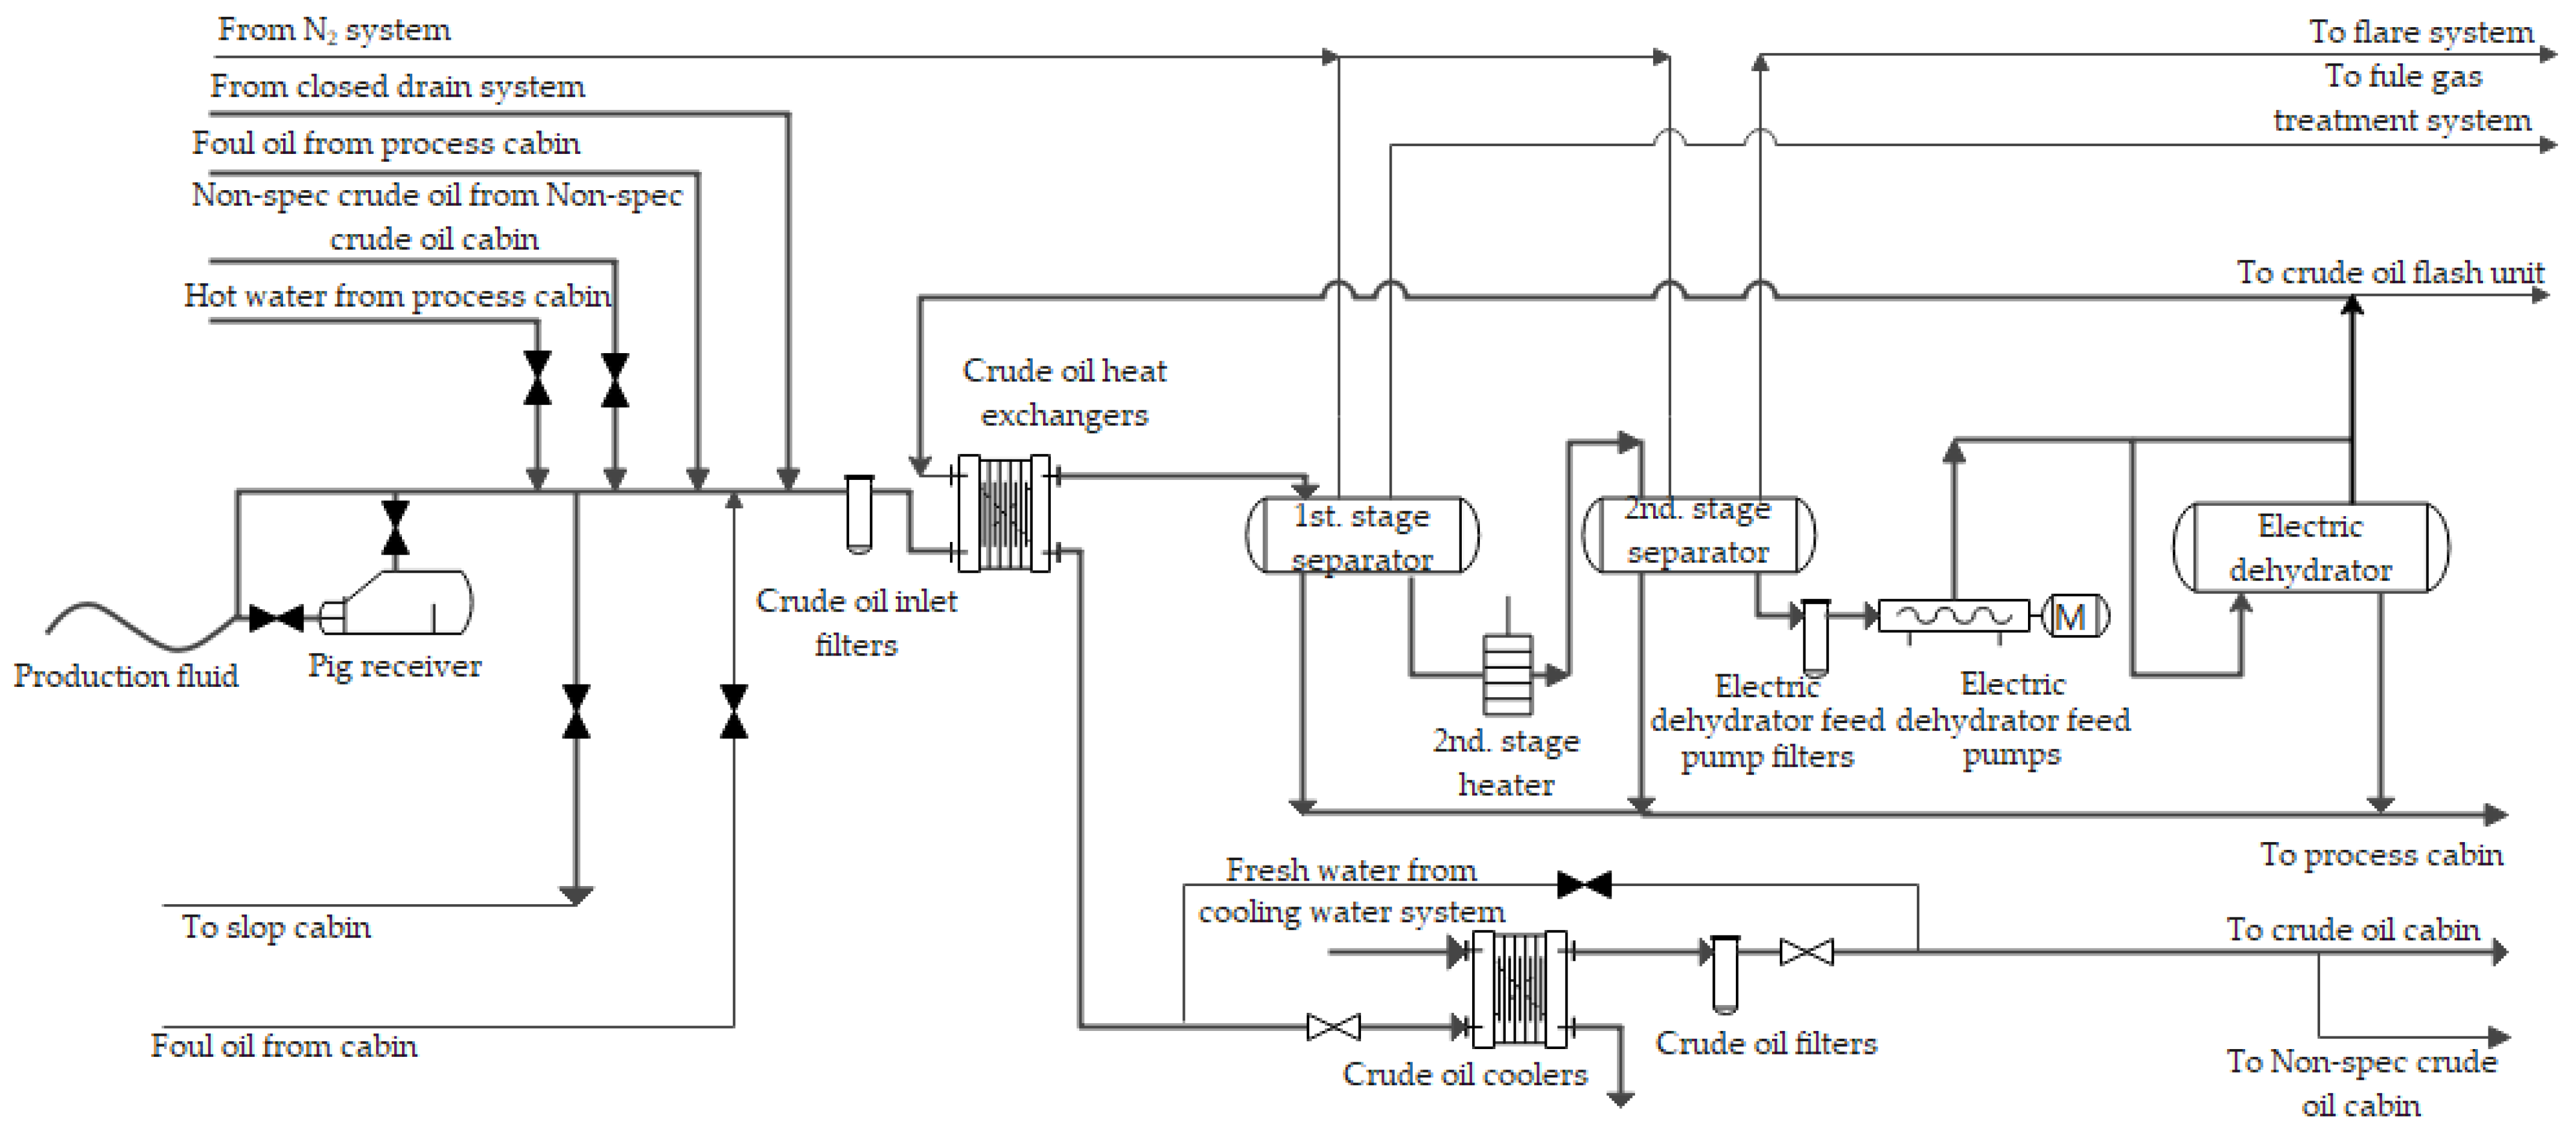
3.1. FPSO Oil and Gas Processing System

FPSOs are large-scale offshore floating production and offloading platforms integrating oil and gas production, processing, storage and export, power supply, and personnel life. FPSOs are composed of more than a dozen major systems such as subsea system, hull system, mooring positioning system, oil and gas processing system, power system, fire monitoring system, oil storage and export system, so on. The oil and gas processing system are an organic whole for the separation and processing of crude oil. A lot of oil and gas processing equipment is involved, including valves, flanges, pipelines, and so on. These are potential sources of oil and gas leakage. The flammable and explosive characteristics of oil and gas make the oil and gas processing system the most important high-risk factor of FPSOs. Additionally, crude oil treatment systems are mainly used to separate different types of substances produced by oil wells and then transport the separated oil, gas, and sewage to other systems for further purification. Its technological process is shown in Figure 5.
From the analysis of the process flow and on-site operation, the most dangerous equipment for gas leakage is the first-stage separator (hereinafter referred to as the separator), and the most dangerous equipment for oil leakage is the second-stage heater (hereinafter referred to as the heater). Therefore, the gas leakage of the separator and the oil leakage of the heater are analyzed as key risk events in this paper.

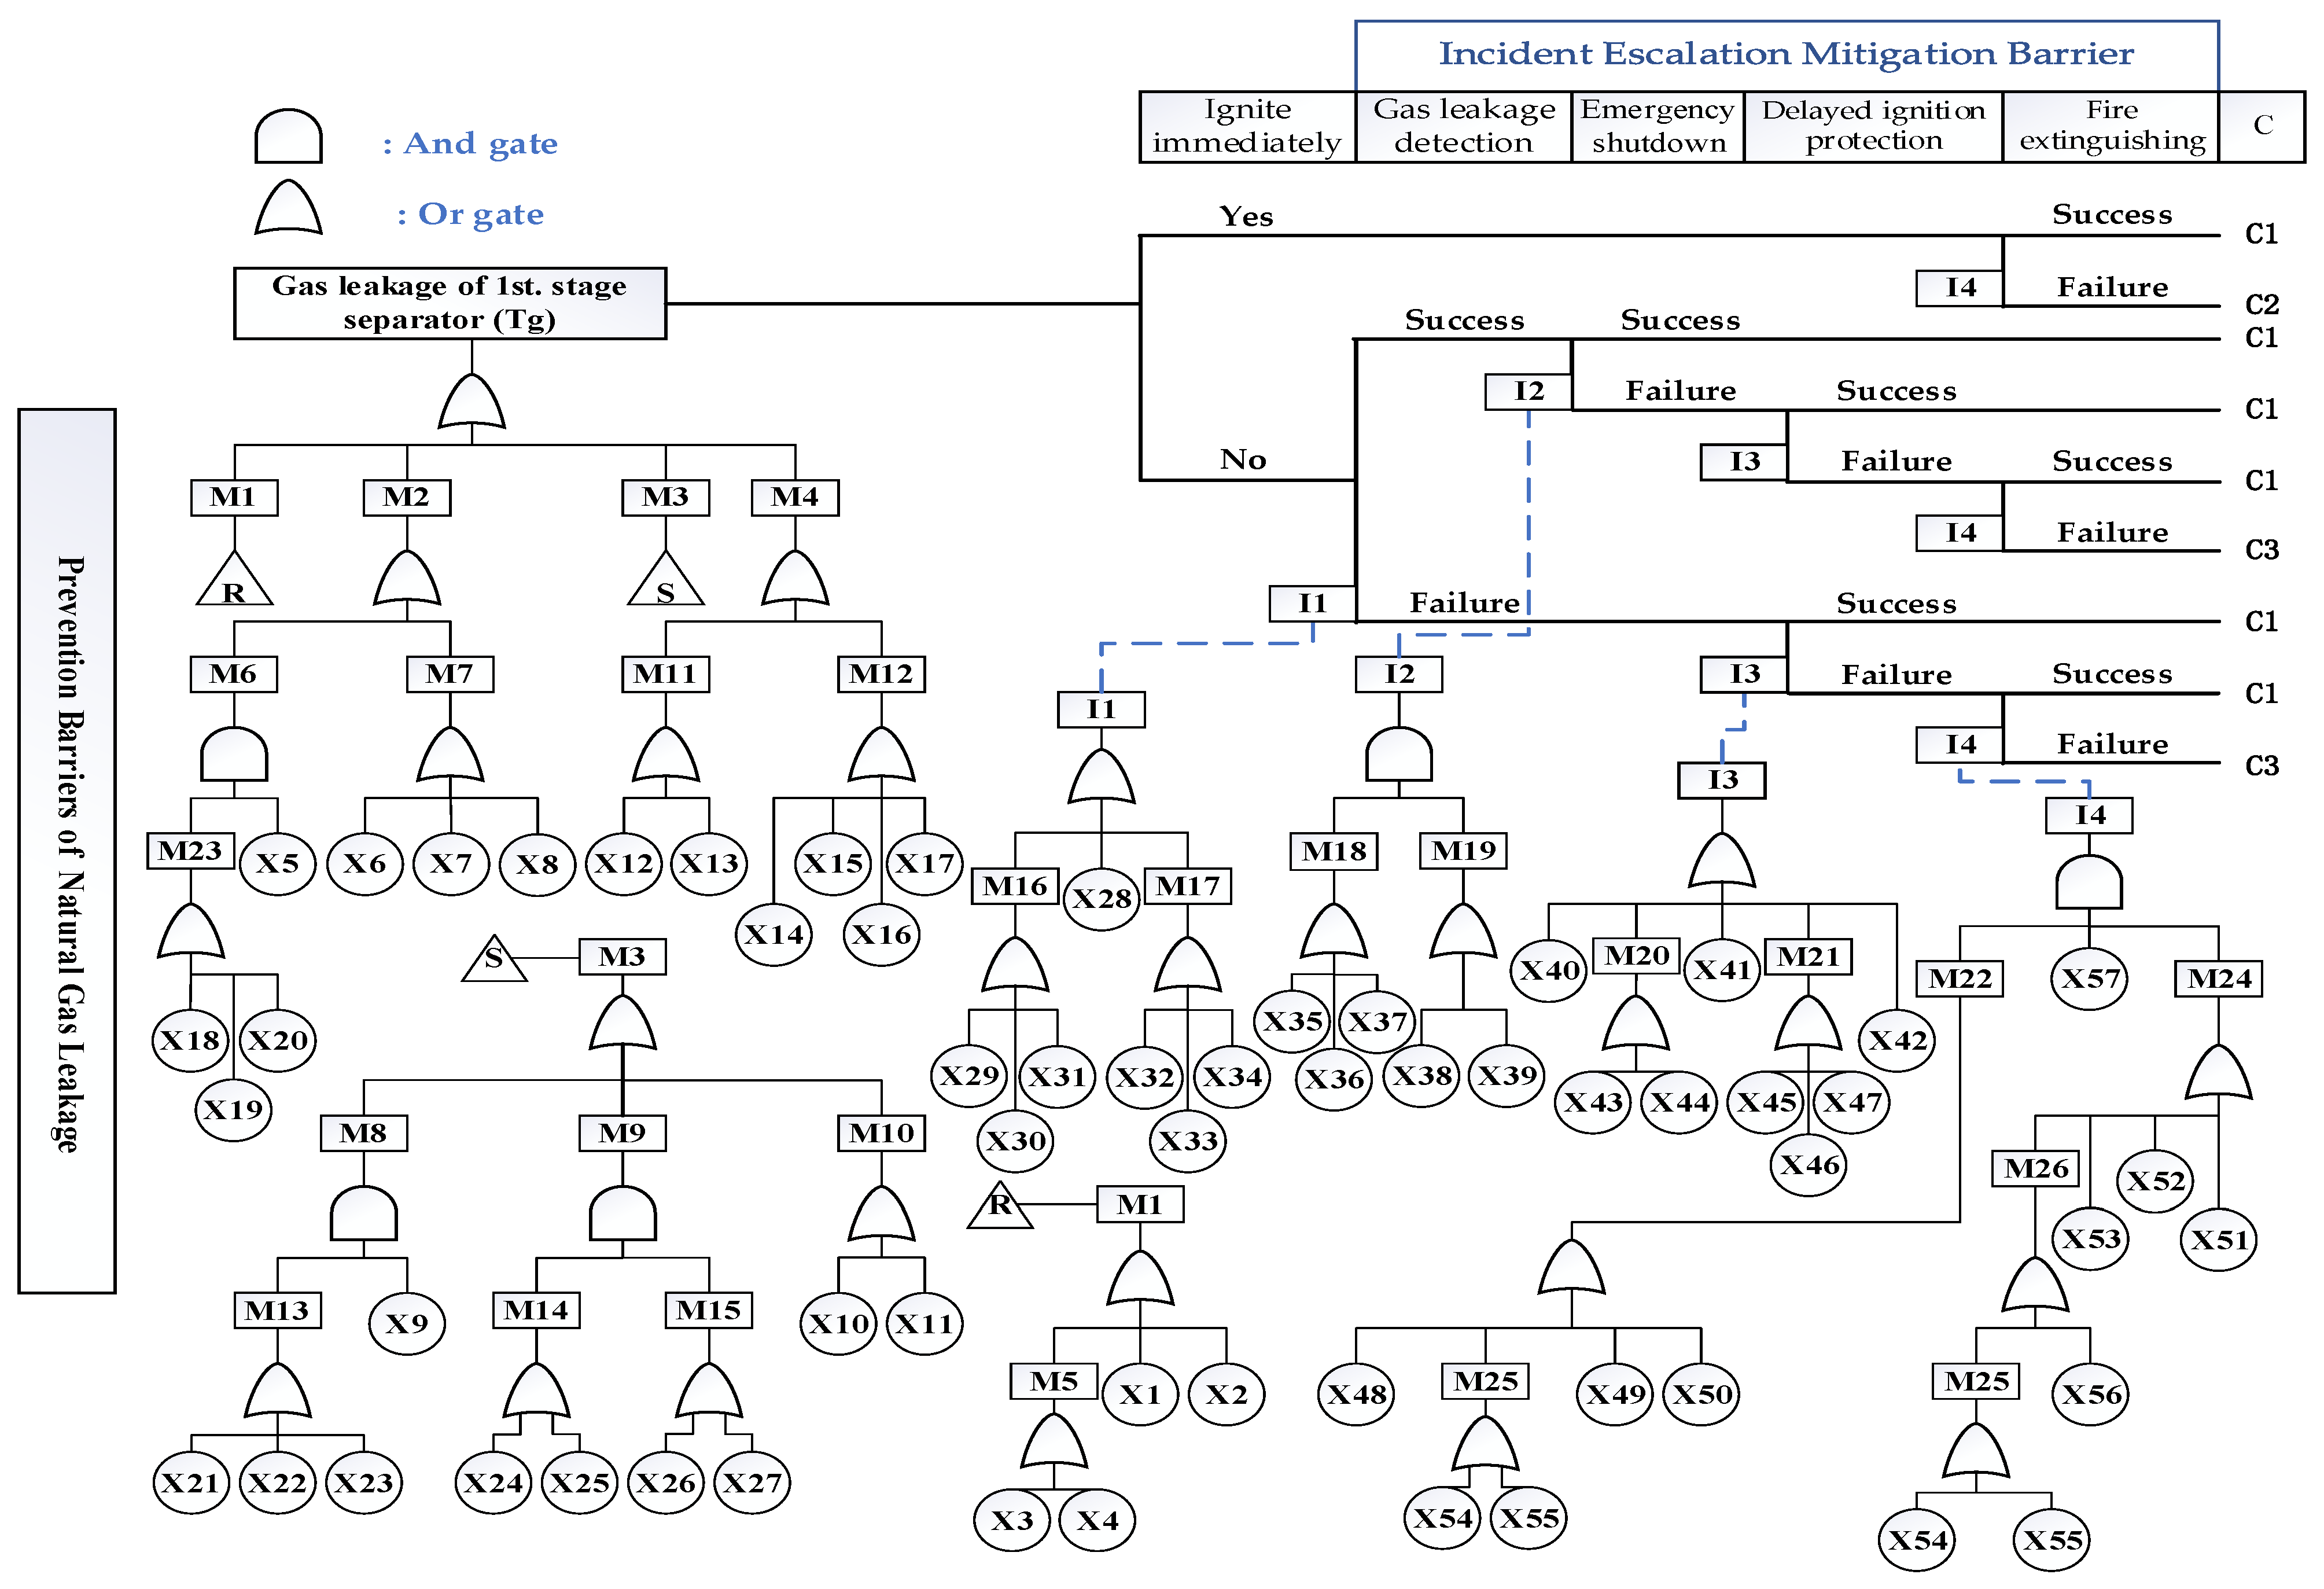
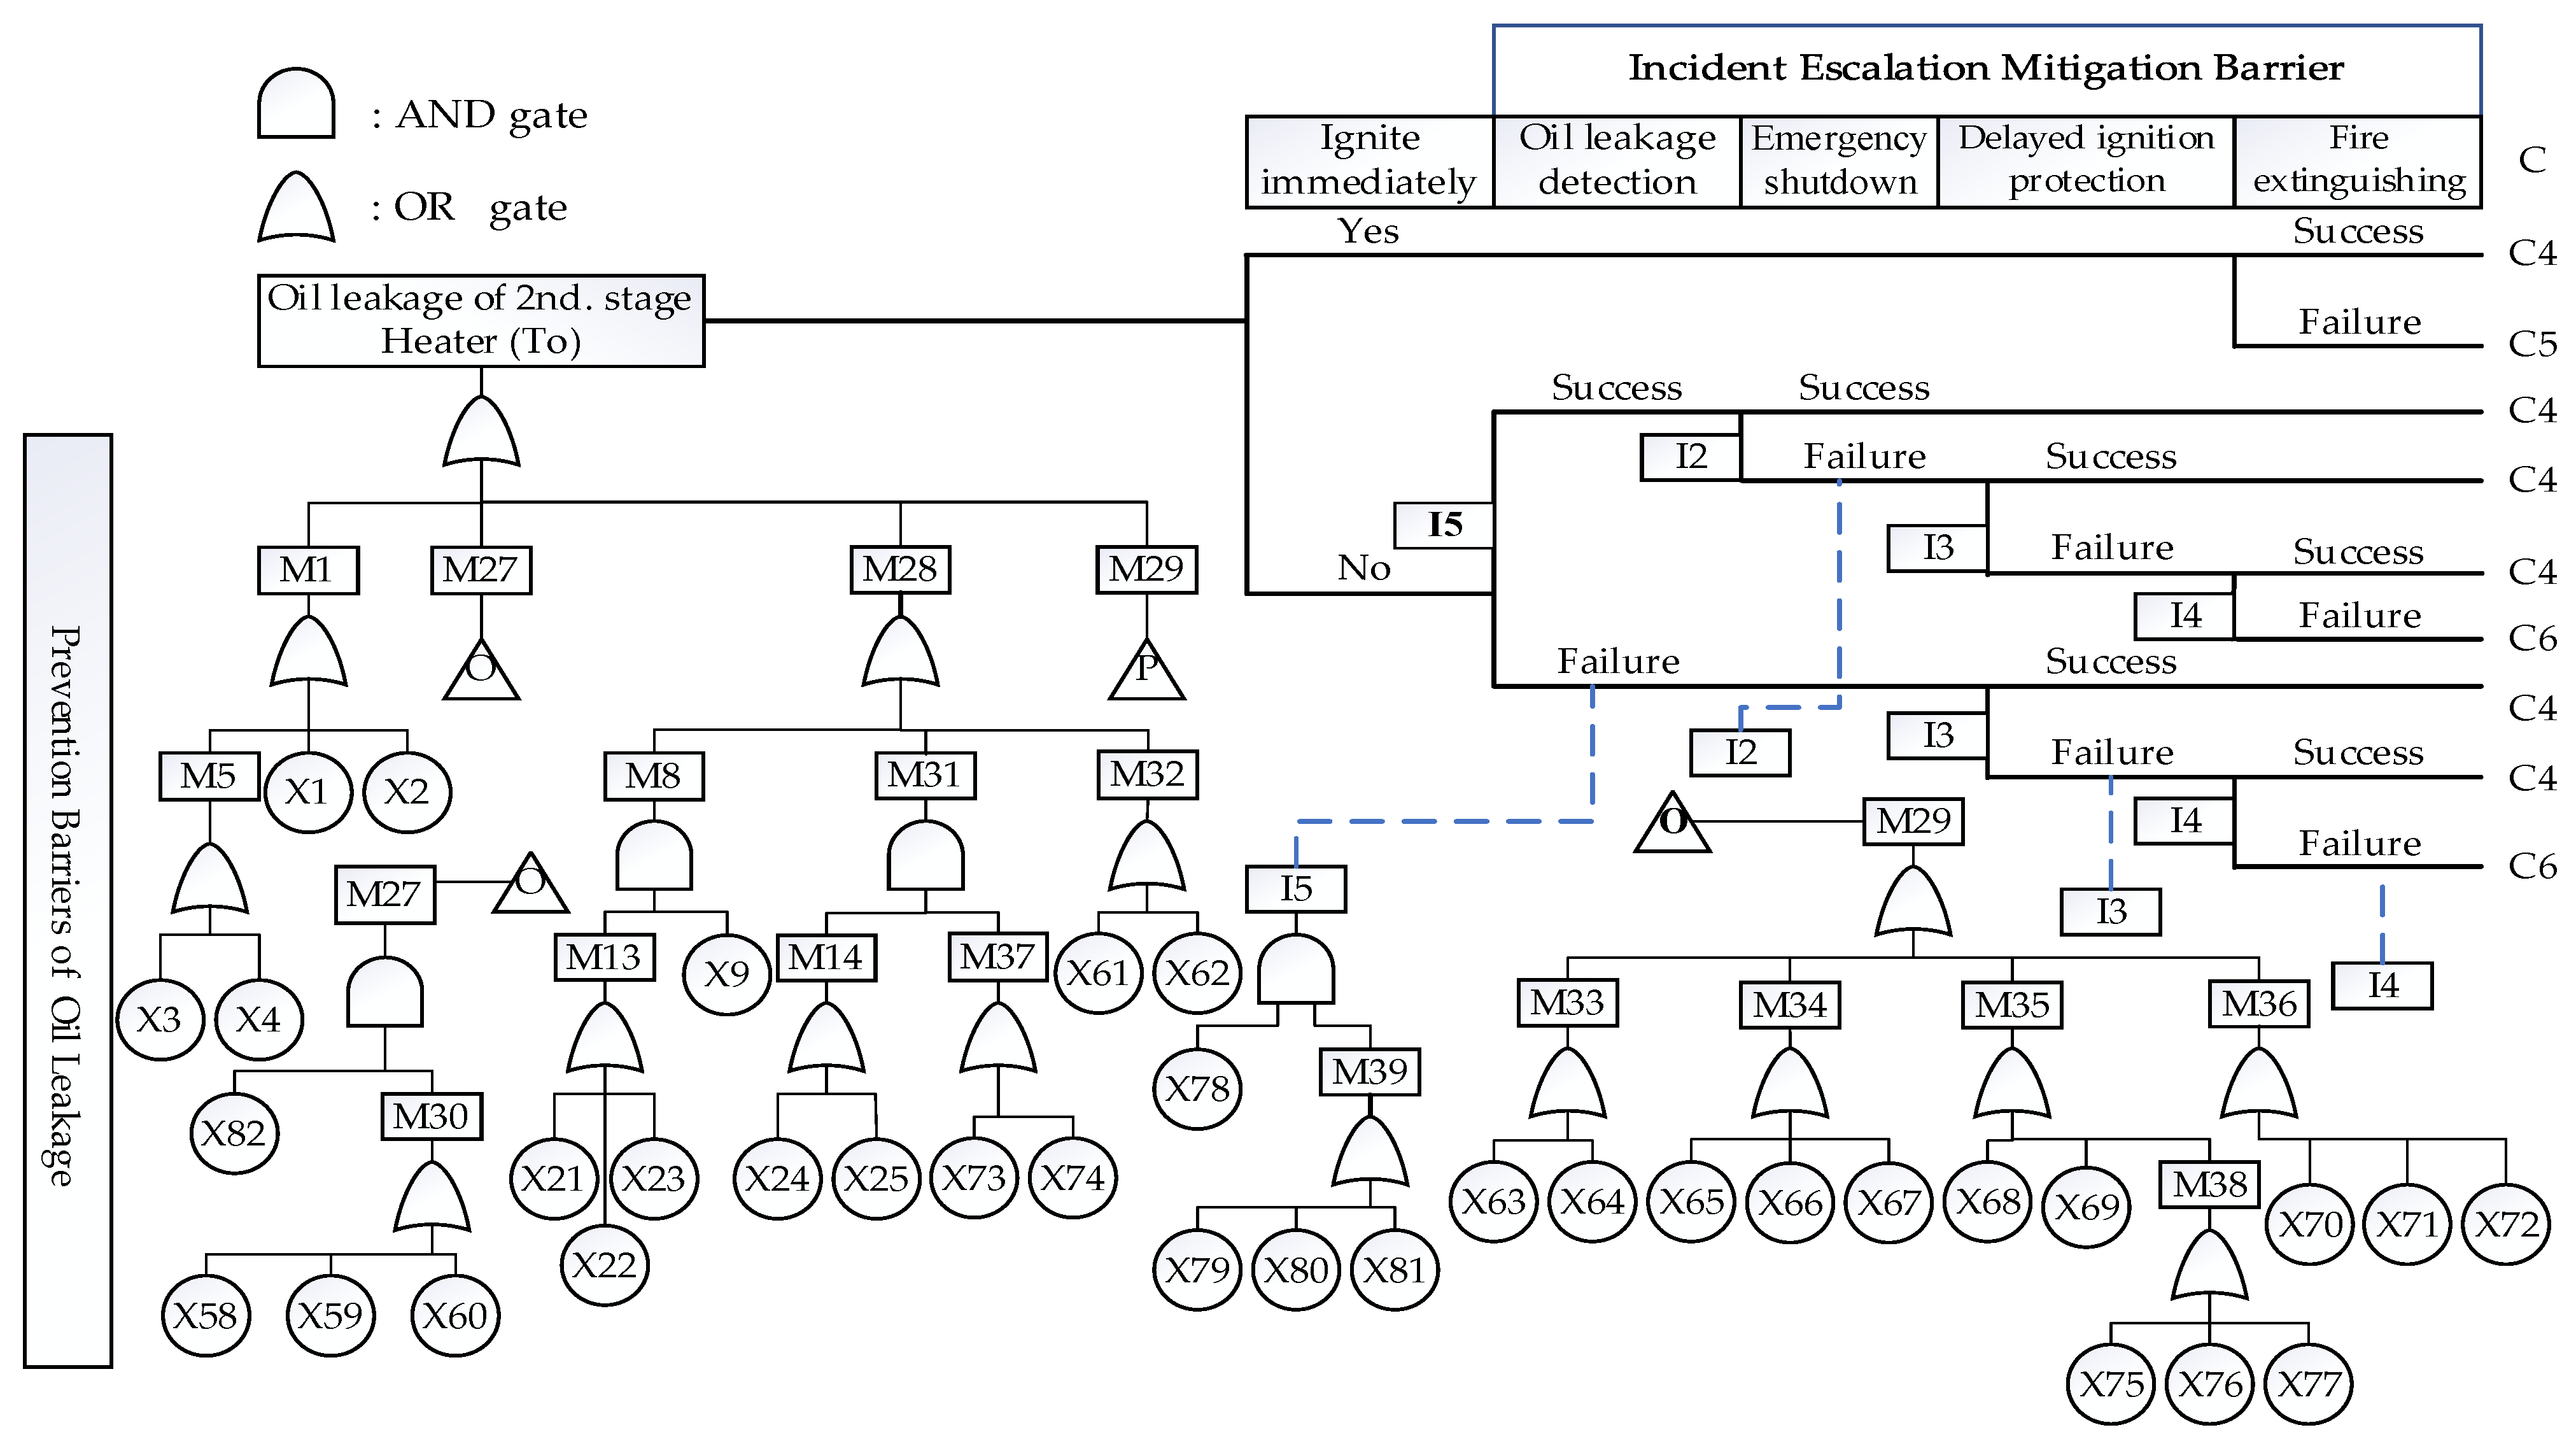
3.2. Qualitative Analysis Based on BT Model

Here, the natural gas leakage of the separator and the crude oil leakage of the heater are regarded as the key events of the BT model. The left side is the FTA of the oil and gas leakage, and the right side is the ETA of the fire and explosion accidents. Additionally, for leakage detection failure, emergency shutdown failure, ignition protection failure, fire extinguishing failure, etc., corresponding accident analysis is carried out. Combined with data records and engineering experience, the causes and resulting events of leakage are summarized, and the BT model of natural gas leakage and the BT model of crude oil leakage are established, as shown in Figure 6 and Figure 7.
“X”, “M”, and “T” constitute the basic events, intermediate events, and top events of FTA, respectively. I1–I5 represent control and mitigation barriers in ETA, and C1–C6 represent accident consequences. The basic event symbol description is shown in Table 2; the intermediate event symbol description is shown in Table 3; the ET control mitigation barrier is shown in Table 4; and the accident escalation consequence description is shown in Table 5.
The initial trigger events leading to oil and gas leakage are diverse. Human factors, equipment factors and environmental factors may eventually evolve into oil and gas leakage. When oil and gas leakage occur, the success or failure of the corresponding protection system will eventually lead to different consequences. Gas leakage of the separator could lead to gas jet fire (JF) and vapor cloud explosion (VCE) and oil leakage of the heater could lead to oil contamination, liquid JF, and pool fire (PF). Different consequence events cause different degrees of harm and require different protective measures:
  • Gas leakage diffusion (C1): when the natural gas is in a state of high concentration, the oxygen in the air will not be sufficient to sustain life, resulting in the death of people by suffocation. Additionally, when natural gas diffuses in the air, there will always be a danger of explosion, which may eventually evolve into a VCE accident.
  • JF (C2/C5): the persistence of the flame depends on the continuation of the leakage, and the burning speed of the flame depends on the amount of gas leakage. The impact of fire is mainly transmitted through thermal radiation. Thermal radiation is the main factor that affects surrounding equipment and personnel.
  • VCE (C3): when the combustible gas leaks and accumulates to form a certain concentration field of combustibles, after encountering the ignition source, a VCE will occur. The overpressure wave generated by the explosion will have a serious impact on human survival and equipment, buildings, etc.
  • Crude oil pollution (C4): after an oil spill spreads, it will cause pollution and corrosion threats to the devices, and accelerate the aging and damage of the devices. Simultaneously, there will always be a fire hazard after oil pollution. Additionally, it may evolve into a PF when it encounters ignition sources.
  • PF (C6): this refers to the fire caused by the leakage of flammable liquid on the ground, and the main damage to the surrounding environment is thermal radiation. PFs not only occur more frequently than other fire forms, but last a long time and are difficult to extinguish.
A single BT model is not sufficient to complete the risk analysis of an FPSO oil and gas processing system. Due to the multiple complexities in the occurrence mechanism and risk evolution of oil and gas leakage, the CN theory will be introduced below. Based on the CN of oil and gas leakage, further analysis of the occurrence of oil and gas leakage events and the evolution of their consequences are carried out.

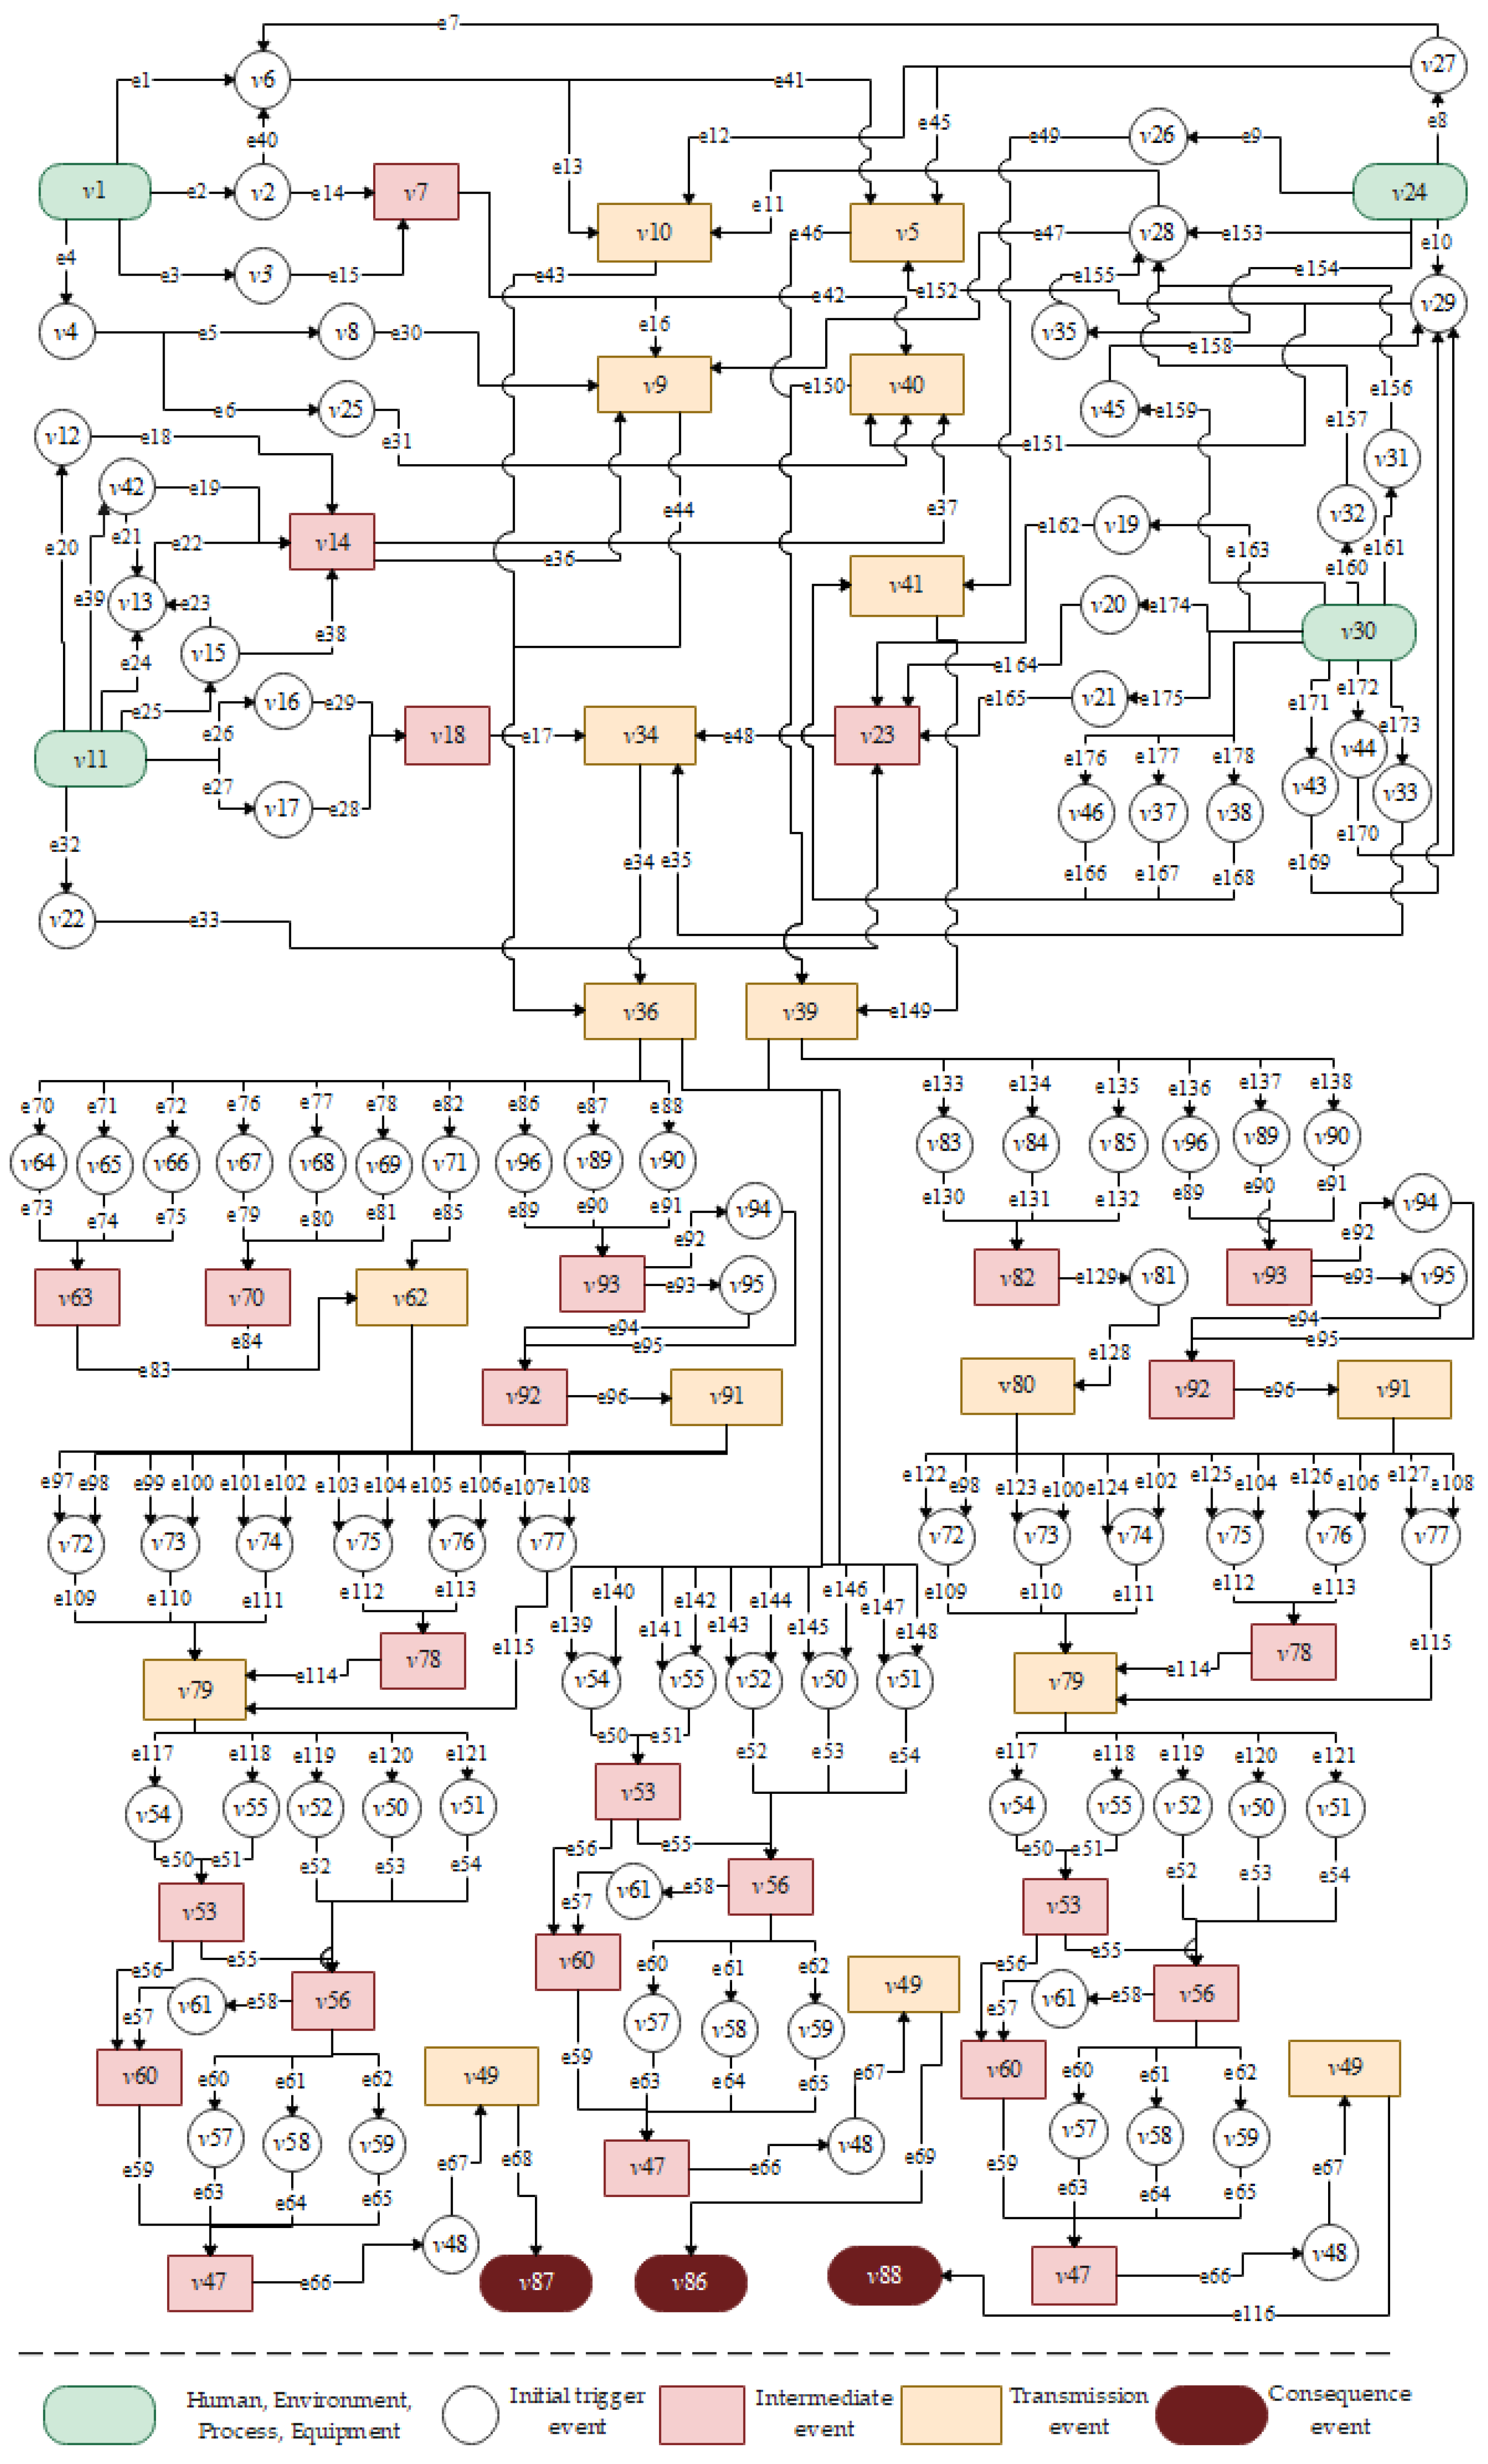
3.3. CN Model of Oil and Gas Leakage Risk Evolution

Combining the relationship of various BT factors, incorporating system status and risk factors, and taking human factors, equipment factors, technological process factors, and environmental factors as initial trigger event factors, a complex evolutionary network is established. Four types of factors run through the entire accident cycle, and the safety protection system is the key barrier to protect the escalation. Taking PFs, JFs, and VCEs as the resulting events, and defining the key factors that directly lead to fires and explosions as conduction events, such as corrosion, leakage, failure of fire protection systems, failure of ignition protection systems, etc., a CN topology model is established caused by the failure of the safety protection system and the initial influencing factors. The CN model is shown in Figure 8. The nodes corresponding to the risk events are shown in Table 6.
As shown in Figure 8, for the various consequences caused by ETA, different propagation evolution paths will lead to different consequences, but the safety protection barriers on the propagation paths are common, such as ignition protection, fire extinguishing, etc. Therefore, its network evolution form is repeatedly established, and the same node is used to represent it. The advantage of this is that key nodes can be analyzed, and the evolution analysis of the shortest path can also be distinguished.
The use of CN can effectively determine the cause, evolution path, and consequences of accidents. In order to quantitatively analyze accident risk and calculate the shortest path, we used FST and risk entropy. FST can effectively represent subjective, vague language and imprecise information, in which the fuzzy numbers that experts are invited to score will characterize the probability value of the main event, and then the fuzzy numbers in linguistic terms can be transformed into fuzzy failures of factors’ probability [57,58]. The probability is converted into risk entropy, thereby representing the edge weight between nodes.
There were 96 nodes and 178 edges in the CN model, and the edge weights were represented by probabilities. In this evolutionary network, when node i has only one parent node j, the edge weight between the two nodes is the failure probability of node i. When a node has multiple parents, the node represents an intermediate event. At this time, according to the rule of AND gate and OR gate in the graph, the edge weight is obtained. In a CN model, edge directions are used to represent risk transmission, and edge weights are used to represent risk values. For example, when the event evolves along the route, the subsequent node is only the evolution path node after the occurrence of the previous node. When the ignition protection failure v79 occurs, the subsequent evolution nodes are smoke sensor failure v50, sprinkler valve failure v51, etc. The edge weight at this time is the probability of occurrence of subsequent nodes. Another example is as follows: when the fire pump failure v54 occurs, the fire water system failure v56 will most likely occur. All edge weight values of risk factors are converted to risk entropy, as shown in Appendix A Table A1.

3.4. The Shortest Path of Risk Evolution

The purpose of accident scenario calculation is to find the shortest path from the initial triggering event to the consequential events. The shortest path of the fire and explosion accident caused by the initial trigger event is equivalent to the path with the smallest risk entropy. Based on the IACO algorithm, through continuously comparing and analyzing the simulation results obtained by different numbers of ants, finally, the number of ants can be set as m = 10. Additionally, the parameters α, β, and ρ are finally set as 1, 1, and 0.1, respectively. The maximum number of iterations is 100, and MATLAB was used to calculate the shortest path of accidents caused by various risk factors. Table 7 lists the shortest paths of leakage and escalation accidents caused by different initial trigger events, and the nodes in each path are the main risk factors for the evolution of the accident.
According to Table 7, the oil and gas leakage path caused by human factors and equipment factors is the shortest. The shortest path leading to a gas leakage accident is v24→v28→v9→v36, with a probability of 1.6E-03, and the shortest path leading to a crude oil leakage accident is v30→v37→v41→v39, with a probability of 1.85E-4, indicating that after several steps, the initial event may lead to leakage. Leakages may be caused by the superposition of fire sources and the failure of fire extinguishing protection, resulting in jet fire, which will cause damage to personnel and equipment and process systems.
It can be seen in Table 7 that different initial events will lead to leakage accidents. In order to avoid leakage accidents, corresponding measures should be taken in the precursor stage, such as strengthening daily inspections, reducing the workload of personnel, and formulating reasonable maintenance plan. In the event of a leakage, the shortest development paths for different accident consequences (PF, JF, and VCE) are almost the same. The failures of the fire water system, foam fire extinguishing system, and dry-powder fire-extinguishing facilities are the main reasons for the failure of the fire-extinguishing barrier. The failures of the emergency shut-off valve and manual valve are the main reasons for the failure of the emergency shut-off barrier. Static electricity and gas detector failure are the main factors leading to the failure of ignition protection and gas leakage monitoring, respectively; when a leakage accident occurs, in order to avoid the escalation of the accident, corresponding measures should be taken to cut off the expansion path of the leakage during the evolution stage of the accident.
Targeted measures should be taken to cut off the development path of the accident and make the accident develop in a relatively favorable direction. For the equipment factor, targeted inspections should be carried out as far as possible in the case of shortages of human resources. Especially for components with high failure frequency (such as separator and heater seals, flanges, welds, etc.), the effectiveness of inspection and maintenance should be improved. For human error, reasonable work arrangements and communication can not only reduce workers’ stress, but also reduce the impact of the harsh working environment. Targeted contingency planning can reduce the probability of decision failure. It can also improve the effectiveness of emergency response, control the direction of accidents within a limited time, and reduce the consequences of accidents.

4. Discussions

BN and the proposed method are both systematic and quantitative approaches for performing accident risk assessment of complex systems. BN focuses on solving the overall risk of accidents and cannot represent the risk of a single path. The proposed method focuses on finding the most probable failure path, with which decision makers can take emergency prevention or mitigation safety measures to cut off the risk propagation. In addition, compared with BN, one of the distinct advantages of the proposed method is that it can identify the shortest failure path between any two nodes in the network.
The parameter selection in the ACO algorithm has a significant influence on the effect of path planning. Simulation experiments are carried out by setting different parameters, and the advantages and disadvantages of the experimental results are analyzed to select the best parameter combination. When the number of ants is too large, the influence of pheromone concentration will be weakened, and when the algorithm converges too fast, the influence of the algorithm on the global search ability will be weakened. Therefore, while keeping other parameters unchanged, it is necessary to continuously compare and analyze the simulation results obtained by different numbers of ants.
α and β are important parameters of the algorithm. Here, we only change one parameter in each group of experiments. Each group of parameters is run 10 times and averaged to analyze the influence of parameters on the results. Additionally, the same starting point v1 and end point v8 are selected for testing; Figure 9 and Figure 10 show the influence of α and β on the experimental results, respectively. It can be seen in Figure 9 that when the heuristic factor α is greater than 1.5, the positive feedback effect is enhanced, the possibility of ants constructing repeated solutions increases, the possibility of stagnation or premature convergence of the algorithm increases, and the algorithm falls into a local optimum. Therefore, a value of [0.1, 1.3] is more appropriate. It can be seen in Figure 10 that when the expected heuristic factor β is small, the ant colony search is relatively blind, and the quality of the solution established is poor. When β is too large, the algorithm begins to fall into a local optimum, and the solution begins to deteriorate. Therefore, a value of [0.5, 2.8] for β is more appropriate. Additionally, when α is greater than β, the empirical factor dominates, and the ants may repeat the walking path, thereby reducing the randomness of the search; when α is less than β, the deterministic factor dominates, and the ants are eager to comprehensively select the path with the smallest path cost and cannot achieve the global optimum. Therefore,   α = 1 and β = 1 are set here. Similarly, the global pheromone update coefficient ρ is directly related to the global search ability and the algorithm convergence speed [59]. In practical situations, α, β, and ρ are not independent, but interact with and synthesize each other.
Taking the shortest path of JF caused by equipment factors as an example, a comparative simulation experiment was carried out for the conventional ACO and the IACO algorithm, and the shortest path iterative convergence is shown in Figure 11.
It can be seen in Figure 11 that the conventional ACO algorithm obtains the shortest path entropy weight of 25.2 when iterating 36 times, and the IACO algorithm obtains the shortest path 19.8 when iterating 24 times. Compared with the conventional ACO algorithm, the number of iterations of the IACO algorithm is reduced by 31%, and the shortest path length is reduced by 21.4%. After the shortest path relationship curve rapidly drops to an optimal value, with the increase in the number of iterations, the length of the optimal path does not change, and the curve shows a horizontal trend. The results show that the IACO algorithm can shorten the detour path when avoiding the unreachable points effectively; at the same time, improvements in the search strategy effectively improve the search ability of the algorithm, the method is feasible and effective, and it has important practical application significance.

5. Conclusions

For identifying the key factors and shortest evolution path quickly, the CN is proposed to visualize the initial trigger events, intermediate events, transmission events and consequential events, as well as the accident development of risk influencing factors. In addition, the edge weights are represented by risk entropy, which overcomes the traditional characterization method and considers the fuzzy and uncertain characteristics of risk propagation to realize the quantitative evaluation of the development process of fire and explosion accidents.
Aiming at the time and space complexity of the conventional path algorithm, a meta-heuristic algorithm is proposed to solve the shortest path problem, and for the efficiency and local optimal problems of the traditional ACO algorithm, an IACO algorithm is proposed to solve the shortest path calculation problem in CN. The results show that human factors and equipment factors are the key initial events causing oil and gas leakage accidents; the failure of fire water systems, foam fire-extinguishing systems, and dry-powder fire-extinguishing facilities are the main reasons for the failure of fire extinguishing barriers; emergency shut-off valve failure and manual valve failure are the main reasons for the failure of the emergency shutdown barrier; and static electricity and gas detector failure are the main factors leading to the failure of ignition protection and gas leakage monitoring, respectively. When a leakage accident occurs, in order to avoid the escalation of the accident, corresponding measures can be taken in the evolution stage of the accident to cut off the leaked expansion path.
The CN risk evolution method makes full use of the advantages of BT and BN by mapping from FTA and ETA and considering the uncertainty of the data. It can solve the probability problem of paths between any nodes, quickly identify the shortest path of accidents and the most vulnerable risk factors, and provide more targeted decision support for accident prevention and control.

Author Contributions

Data curation, L.W.; conceptualization, L.S. and X.M.; formal analysis, H.S.; funding acquisition, J.K.; investigation, L.W.; methodology, X.M.; resources, X.M.; software, L.W.; writing—original draft, L.W.; writing—review and editing, L.S. and J.K. All authors have read and agreed to the published version of the manuscript.

Funding

This work is supported by the National Key Research and Development Program of China (grant number: 2019YFE0105100); The Natural Science Foundation of China (grant number: 51879125).

Institutional Review Board Statement

Not applicable.

Informed Consent Statement

Not applicable.

Data Availability Statement

Not applicable.

Acknowledgments

Thanks to all contributions to the Special Issue, the time spent by each author, and the anonymous reviewers and editorial managers who have greatly contributed to the development of the articles in this Special Issue.

Conflicts of Interest

The authors declare no conflict of interest.

Appendix A

Table A1. Edge Weights of Risk Complex Evolution Network.
EdgeDirectionProbabilityRisk EntropyEdgeDirectionProbabilityRisk Entropy
e1v1~v62.502 × 10−0510.596e90v89~v939.930 × 10−010.007
e2v1~v23.226 × 10−048.039e91v90~v939.910 × 10−010.009
e3v1~v38.467 × 10−047.074e92v93~v941.208 × 10−036.719
e4v1~v41.368 × 10−036.594e93v93~v958.467 × 10−047.074
e5v4~v87.328 × 10−059.521e94v95~v928.890 × 10−010.118
e6v4~v257.328 × 10−059.521e95v94~v929.940 × 10−010.006
e7v27~v63.878 × 10−0510.158e96v92~v919.910 × 10−010.009
e8v24~v273.750 × 10−035.586e97v62~v723.577 × 10−035.633
e9v24~v267.328 × 10−059.521e98v91~v723.577 × 10−035.633
e10v24~v291.287 × 10−036.656e99v62~v731.258 × 10−024.375
e11v28~v103.441 × 10−047.974e100v91~v731.258 × 10−024.375
e12v27~v105.663 × 10−0612.082e101v62~v747.882 × 10−047.146
e13v6~v102.128 × 10−036.153e102v91~v747.882 × 10−047.146
e14v2~v71.001 × 10−049.209e103v62~v751.927 × 10−048.554
e15v3~v71.927 × 10−048.554e104v91~v751.927 × 10−048.554
e16v7~v92.493 × 10−035.994e105v62~v764.802 × 10−047.641
e17v18~v349.632 × 10−034.643e106v91~v764.802 × 10−047.641
e18v12~v141.733 × 10−036.358e107v62~v778.531 × 10−034.764
e19v42~v149.054 × 10−059.310e108v91~v778.531 × 10−034.764
e20v11~v121.309 × 10−024.336e109v72~v795.944 × 10−047.428
e21v42~v139.910 × 10−010.009e110v73~v797.882 × 10−047.146
e22v13~v141.946 × 10−023.939e111v74~v791.967 × 10−023.928
e23v15~v139.850 × 10−010.015e112v75~v789.200 × 10−010.083
e24v11~v136.851 × 10−034.983e113v76~v789.300 × 10−010.073
e25v11~v158.467 × 10−047.074e114v78~v799.660 × 10−010.035
e26v11~v162.502 × 10−0510.596e115v77~v791.780 × 10−048.634
e27v11~v171.001 × 10−049.209e116v49~v888.620 × 10−010.149
e28v17~v188.860 × 10−010.121e117v79~v541.208 × 10−036.719
e29v16~v188.960 × 10−010.110e118v79~v559.054 × 10−059.310
e30v8~v96.387 × 10−035.053e119v79~v522.624 × 10−035.943
e31v25~v405.865 × 10−035.139e120v79~v507.882 × 10−047.146
e32v11~v227.882 × 10−047.146e121v79~v511.636 × 10−036.416
e33v22~v231.044 × 10−024.562e122v80~v723.577 × 10−035.633
e34v34~v369.960 × 10−010.004e123v80~v731.258 × 10−024.375
e35v33~v348.650 × 10−010.145e124v80~v747.882 × 10−047.146
e36v14~v91.733 × 10−036.358e125v80~v751.927 × 10−048.554
e37v14~v402.624 × 10−035.943e126v80~v764.802 × 10−047.641
e38v15~v142.254 × 10−023.792e127v80~v778.531 × 10−034.764
e39v11~v421.927 × 10−048.554e128v81~v801.679 × 10−024.087
e40v2~v65.426 × 10−022.914e129v82~v818.467 × 10−047.074
e41v6~v58.531 × 10−034.764e130v83~v828.840 × 10−010.123
e42v7~v405.944 × 10−047.428e131v84~v829.120 × 10−010.092
e43v10~v369.960 × 10−010.004e132v85~v828.100 × 10−010.211
e44v9~v369.970 × 10−010.003e133v39~v833.226 × 10−048.039
e45v27~v53.878 × 10−0510.158e134v39~v847.882 × 10−047.146
e46v5~v399.793 × 10−022.323e135v39~v855.782 × 10−047.456
e47v28~v99.220 × 10−010.081e136v39~v968.467 × 10−047.074
e48v23~v344.247 × 10−023.159e137v39~v891.287 × 10−036.656
e49v26~v414.745 × 10−023.048e138v39~v901.733 × 10−036.358
e50v54~v539.910 × 10−010.009e139v36~v543.577 × 10−035.633
e51v55~v539.650 × 10−010.036e140v39~v543.577 × 10−035.633
e52v52~v568.960 × 10−010.110e141v36~v556.570 × 10−035.025
e53v50~v568.890 × 10−010.118e142v39~v556.570 × 10−035.025
e54v51~v569.110 × 10−010.093e143v36~v522.493 × 10−035.994
e55v53~v565.617 × 10−022.879e144v39~v522.493 × 10−035.994
e56v53~v606.307 × 10−022.764e145v36~v508.531 × 10−034.764
e57v61~v608.980 × 10−010.108e146v39~v508.531 × 10−034.764
e58v56~v619.120 × 10−010.092e147v36~v513.750 × 10−035.586
e59v60~v479.500 × 10−010.051e148v39~v513.750 × 10−035.586
e60v56~v571.780 × 10−048.634e149v41~v398.900 × 10−010.117
e61v56~v581.383 × 10−048.886e150v40~v399.440 × 10−010.058
e62v56~v594.802 × 10−047.641e151v29~v409.793 × 10−022.323
e63v57~v478.960 × 10−010.110e152v29~v54.383 × 10−023.127
e64v58~v478.550 × 10−010.157e153v24~v281.733 × 10−036.358
e65v59~v479.120 × 10−010.092e154v24~v353.226 × 10−048.039
e66v47~v483.226 × 10−048.039e155v35~v284.907 × 10−047.620
e67v48~v499.220 × 10−010.081e156v31~v281.733 × 10−036.358
e68v49~v879.330 × 10−010.069e157v32~v281.733 × 10−036.358
e69v49~v869.440 × 10−010.058e158v45~v292.760 × 10−035.892
e70v36~v642.015 × 10−036.207e159v30~v452.760 × 10−035.892
e71v36~v651.927 × 10−048.554e160v30~v328.467 × 10−047.074
e72v36~v662.453 × 10−048.313e161v30~v313.750 × 10−035.586
e73v64~v639.330 × 10−010.069e162v19~v238.531 × 10−034.764
e74v65~v639.410 × 10−010.062e163v30~v192.129 × 10−0510.757
e75v66~v639.330 × 10−010.069e164v20~v234.783 × 10−035.343
e76v36~v672.760 × 10−035.892e165v21~v236.552 × 10−059.633
e77v36~v683.878 × 10−0510.158e166v46~v419.793 × 10−022.323
e78v36~v695.225 × 10−035.254e167v37~v415.617 × 10−022.879
e79v67~v707.070 × 10−022.649e168v38~v415.426 × 10−022.914
e80v68~v709.920 × 10−010.008e169v43~v292.760 × 10−035.892
e81v69~v705.426 × 10−022.914e170v44~v292.760 × 10−035.892
e82v36~v711.780 × 10−048.634e171v30~v433.020 × 10−048.105
e83v63~v628.660 × 10−010.144e172v30~v442.493 × 10−035.994
e84v70~v629.330 × 10−010.069e173v30~v338.161 × 10−059.414
e85v71~v629.660 × 10−010.035e174v30~v201.640 × 10−048.715
e86v36~v961.780 × 10−048.634e175v30~v211.001 × 10−049.209
e87v36~v896.552 × 10−059.633e176v30~v461.003 × 10−036.904
e88v36~v906.428 × 10−047.350e177v30~v373.692 × 10−035.602
e89v96~v939.940 × 10−010.006e178v30~v381.287 × 10−036.656

References

  1. Khan, S.A.R.; Zhang, Y.; Anees, M.; Golpîra, H.; Lahmar, A.; Qianli, D. Green supply chain management, economic growth and environment: A GMM based evidence. J. Clean. Prod. 2018, 185, 588–599. [Google Scholar] [CrossRef]
  2. Bucelli, M.; Landucci, G.; Haugen, S.; Paltrinieri, N.; Cozzani, V. Assessment of safety barriers for the prevention of cascading events in oil and gas offshore installations operating in harsh environment. Ocean Eng. 2018, 158, 171–185. [Google Scholar] [CrossRef]
  3. Shimamura, Y. FPSO/FSO: State of the art. J. Mar. Sci. Technol. 2002, 7, 59–70. [Google Scholar] [CrossRef]
  4. Meng, H.; Kloul, L.; Rauzy, A. Production availability analysis of Floating Production Storage and Offloading (FPSO) systems. Appl. Ocean Res. 2018, 74, 117–126. [Google Scholar] [CrossRef]
  5. Vinnem, J.E. FPSO Cidade de São Mateus gas explosion–Lessons learned. Saf. Sci. 2018, 101, 295–304. [Google Scholar] [CrossRef]
  6. Gupta, S.; Chan, S. A CFD based explosion risk analysis methodology using time varying release rates in dispersion simulations. J. Loss Prev. Process. Ind. 2016, 39, 59–67. [Google Scholar] [CrossRef]
  7. Heinrich, H.W.; Superintendent, A. Relation of accident statistics to industrial accident prevention. Proc. Casuallity Act. Soc. 1930, 16, 170–174. [Google Scholar]
  8. Suraji, A.; Duff, A.R.; Peckitt, S.J. Development of causal model of construction accident causation. J. Constr. Eng. Manag. 2001, 127, 337–344. [Google Scholar] [CrossRef]
  9. Reason, J. Human error: Models and management. BMJ 2000, 320, 768–770. [Google Scholar] [CrossRef]
  10. Rasmussen, J. Risk management in a dynamic society: A modelling problem. Saf. Sci. 1997, 27, 183–213. [Google Scholar] [CrossRef]
  11. Leveson, N. A new accident model for engineering safer systems. Saf. Sci. 2004, 42, 237–270. [Google Scholar] [CrossRef] [Green Version]
  12. Shahriar, A.; Sadiq, R.; Tesfamariam, S. Risk analysis for oil & gas pipelines: A sustainability assessment approach using fuzzy based bow-tie analysis. J. Loss Prev. Process Ind. 2012, 25, 505–523. [Google Scholar]
  13. Khakzad, N.; Khan, F.; Amyotte, P. Dynamic risk analysis using bow-tie approach. Reliab. Eng. Syst. Saf. 2012, 104, 36–44. [Google Scholar] [CrossRef]
  14. Papazoglou, I.A.; Aneziris, O.N. Master Logic Diagram: Method for hazard and initiating event identification in process plants. J. Hazard. Mater. 2003, 97, 11–30. [Google Scholar] [CrossRef]
  15. Liu, Z.K.; Ma, Q.; Cai, B.P.; Liu, Y.H.; Zheng, C. Risk assessment on deepwater drilling well control based on dynamic Bayesian network. Process Saf. Environ. 2021, 149, 643–654. [Google Scholar] [CrossRef]
  16. Liao, P.C.; Guo, Z.; Wang, T.; Wen, J.; Tsai, C.H. Interdependency of construction safety hazards from a network perspective: A mechanical installation case. Int. J. Occup. Saf. Ergon. 2020, 26, 245–255. [Google Scholar] [CrossRef]
  17. Hu, X.B.; Gheorghe, A.V.; Leeson, M.S.; Leng, S.; Bourgeois, J.; Qu, X. Risk and safety of complex network systems. Math. Probl. Eng. 2016, 2016, 8983915. [Google Scholar] [CrossRef]
  18. Lam, C.Y.; Tai, K. Network topological approach to modeling accident causations and characteristics: Analysis of railway incidents in Japan. Reliab. Eng. Syst. Saf. 2020, 193, 106626. [Google Scholar] [CrossRef]
  19. Liu, Z.K.; Ma, Q.; Cai, B.P.; Shi, X.W.; Zheng, C.; Liu, Y.H. Risk coupling analysis of subsea blowout accidents based on dynamic bayesian network and NK model. Reliab. Eng. Syst. Saf. 2021, 218, 108160. [Google Scholar] [CrossRef]
  20. Mi, J.H.; Lu, N.; Li, Y.F.; Huang, H.Z.; Bai, L.B. An evidential network-based hierarchical method for system reliability analysis with common cause failures and mixed uncertainties. Reliab. Eng. Syst. Saf. 2022, 2022, 108295. [Google Scholar] [CrossRef]
  21. Singh, K.; Maiti, J. A novel data mining approach for analysis of accident paths and performance assessment of risk control systems. Reliab. Eng. Syst. Saf. 2020, 202, 107041. [Google Scholar] [CrossRef]
  22. Zarei, E.; Gholamizadeh, K.; Khan, F.; Khakzad, N. A dynamic domino effect risk analysis model for rail transport of hazardous material. J. Loss Prev. Process Ind. 2022, 74, 104666. [Google Scholar] [CrossRef]
  23. Wu, Y.P.; Chen, Z.L.; Zhao, X.D.; Gong, H.D.; Su, X.C.; Chen, Y.C. Propagation model of cascading failure based on discrete dynamical system. Reliab. Eng. Syst. Saf. 2021, 209, 107424. [Google Scholar] [CrossRef]
  24. Wang, Q.; Jia, G.Z.; Jia, Y.N.; Song, W.Y. A new approach for risk assessment of failure modes considering risk interaction and propagation effects. Reliab. Eng. Syst. Saf. 2021, 216, 108044. [Google Scholar] [CrossRef]
  25. Zhou, Y.; Li, C.; Ding, L.; Sekula, P.; Love, P.E.; Zhou, C. Combining association rules mining with complex networks to monitor coupled risks. Reliab. Eng. Syst. Saf. 2019, 186, 194–208. [Google Scholar] [CrossRef]
  26. Fang, C.; Marle, F.; Zio, E.; Bocquet, J.C. Network theory-based analysis of risk interactions in large engineering projects. Reliab. Eng. Syst. Saf. 2012, 106, 1–10. [Google Scholar] [CrossRef]
  27. Granovetter, M.S. The strength of weak ties. Am. J. Sociol. 1973, 78, 1360–1380. [Google Scholar] [CrossRef]
  28. Serrano, M.A.; Boguna, M. Clustering in complex networks. I. General formalism. Phys. Rev. E 2006, 74, 056114. [Google Scholar] [CrossRef]
  29. McAuley, J.J.; Costa, L.; Caetano, T.S. Rich-club phenomenon across complex network hierarchies. Appl. Phys. Lett. 2007, 91, 084103. [Google Scholar] [CrossRef]
  30. Xue, L.N.; Fan, J.C.; Zhang, L.B. Bow-tie model for offshore drilling blowout accident. J. Saf. Sci. Technol. 2013, 9, 79–83. [Google Scholar]
  31. Ismail, F.Y.; Fatemi, A.; Johnston, M.V. Cerebral plasticity: Window of opportunity in the developing brain. Eur. J. Paediatr. Neurol. 2017, 21, 23–48. [Google Scholar] [CrossRef]
  32. Langer, M.; Brandt, C.; Zellinger, C.; Loscher, W. Therapeutic window of opportunity for the neuroprotective effect of valproate versus the competitive AMPA receptor antagonist NS1209 following status epilepticus in rats. Neuropharmacology 2011, 61, 1033–1047. [Google Scholar] [CrossRef]
  33. Kwak, K.; Yoon, H. Unpacking transnational industry legitimacy dynamics, windows of opportunity, and latecomers’ catch-up in complex product systems. Res. Policy 2020, 49, 103954. [Google Scholar] [CrossRef]
  34. Yap, X.S.; Truffer, B. Shaping selection environments for industrial catch-up and sustainability transitions: A systemic perspective on endogenizing windows of opportunity. Res. Policy 2019, 48, 1030–1047. [Google Scholar] [CrossRef]
  35. Luo, Q.S.; Yang, G.S. Research on Complex Network Model of Collapse Accident Risk Evolution and Risk Mitigation Countermeasures. J. Eng. Manag. 2020, 34, 28–33. [Google Scholar]
  36. Koromila, I.; Aneziris, O.; Nivolianitou, Z.; Deligianni, A.; Bellos, E. Stakeholder analysis for safe LNG handling at ports. Saf. Sci. 2022, 146, 105565. [Google Scholar] [CrossRef]
  37. Meng, X.K.; Chen, G.M.; Zhu, H.W. Complex network analysis on risk evolution of submarine pipeline leakage. J. Saf. Sci. Technol. 2017, 13, 26–31. [Google Scholar]
  38. Hu, R.M.; Lü, H.T.; Chen, J. Risk evaluation model of security and protection network based on risk entropy and Neyman-Pearson criterion. Acta Autom. Sin. 2014, 40, 2737–2746. [Google Scholar]
  39. Clausius, R. The Mechanical Theory of Heat: With Its Applications to the SteamEngine and to the Physical Properties of Bodies; John van Voorst: London, UK, 1867. [Google Scholar]
  40. Shannon, C.E. A mathematical theory of communication. Bell Syst. Tech. J. 1948, 27, 379–423. [Google Scholar] [CrossRef]
  41. Gao, X.F.; Xianzang, Y.Y.; You, X.T.; Dang, Y.R.; Chen, G.H.; Wang, X.L. Reachability for airline networks: Fast algorithm for shortest path problem with time windows. Theor. Comput. Sci. 2018, 749, 66–79. [Google Scholar] [CrossRef]
  42. Dragan, F.F.; Leitert, A. On the minimum eccentricity shortest path problem. Theor. Comput. Sci. 2017, 694, 66–78. [Google Scholar] [CrossRef]
  43. Mozes, S.; Nussbaum, Y.; Weimann, O. Faster shortest paths in dense distance graphs with applications. Theor. Comput. Sci. 2018, 711, 11–35. [Google Scholar] [CrossRef]
  44. Dijkstra, E.W. A note on two problems in connexion with graphs. Numer. Math. 1959, 1, 269–271. [Google Scholar] [CrossRef]
  45. Lavalle, S.M.; Kuffner, J.J. Randomized kinodynamic planning. In Proceedings of the IEEE International Conference on Robotics and Automation, Detroit, MI, USA, 10–15 May 1999. [Google Scholar]
  46. Mohiuddin, M.A.; Khan, S.A.; Engelbrecht, A.P. Fuzzy particle swarm optimization algorithms for the open shortest path first weight setting problem. Appl. Intell. 2016, 45, 598–621. [Google Scholar] [CrossRef]
  47. Kumar, R.; Kumar, M. Exploring genetic algorithm for shortest path optimization in data networks. Glob. J. Comput. Sci. Technol. 2010, 10, 8–12. [Google Scholar]
  48. Rares, M. Adaptive mutation in genetic algorithms for shortest path routing problem. In Proceedings of the 7th International Conference on Electronics, Computers and Artificial Intelligence (ECAI), Bucharest, Romania, 25–27 June 2015. [Google Scholar]
  49. Wang, Y.; Chen, J.D.; Ning, W.; Yu, H.; Lin, S.M.; Wang, Z.D.; Pang, G.S.; Chen, C. A time-sensitive network scheduling algorithm based on improved ant colony optimization. Alex. Eng. J. 2021, 60, 107–114. [Google Scholar] [CrossRef]
  50. Changdar, C.; Pal, R.K.; Mahapatra, G.S. A genetic ant colony optimization based algorithm for solid multiple travelling salesmen problem in fuzzy rough environment. Soft Comput. 2017, 21, 4661–4675. [Google Scholar] [CrossRef]
  51. Ashour, W.; Muqat, R.; Al-Talli, H. Optimization of Traveling Salesman Problem based on Adaptive Affinity Propagation and Ant Colony Algorithms. Int. J. Comput. 2018, 181, 25–31. [Google Scholar] [CrossRef]
  52. Calle, J.; Rivero, J.; Cuadra, D.; Isasi, P. Extending ACO for fast path search in huge graphs and social networks. Expert Syst. Appl. 2017, 86, 292–306. [Google Scholar] [CrossRef]
  53. Baeza, D.; Ihle, C.F.; Ortiz, J.M. A comparison between ACO and Dijkstra algorithms for optimal ore concentrate pipeline routing. J. Clean Prod. 2017, 144, 149–160. [Google Scholar] [CrossRef]
  54. Fang, Z.X.; Zong, X.L.; Li, Q.Q.; Li, Q.P.; Xiong, S.W. Hierarchical multi-objective evacuation routing in stadium using ant colony optimization approach. J. Transp. Geogr. 2011, 19, 443–451. [Google Scholar] [CrossRef]
  55. Ajeil, F.H.; Ibraheem, I.K.; Azar, A.T.; Humaidi, A.J. Grid-based mobile robot path planning using aging-based ant colony optimization algorithm in static and dynamic environments. Sensors 2020, 20, 1880. [Google Scholar] [CrossRef] [PubMed]
  56. Wang, X.Y.; Yang, L.; Zhang, Y.; Meng, S. Robot path planning based on improved ant colony algorithm with potential field heuristic. Control. Decis. 2018, 33, 1775–1781. [Google Scholar]
  57. Chang, Y.J.; Wu, X.F.; Zhang, C.S. Dynamic Bayesian networks based approach for risk analysis of subsea wellhead fatigue failure during service life. Reliab. Eng. Syst. Saf. 2019, 188, 454–462. [Google Scholar] [CrossRef]
  58. Zarei, E.; Khakzad, N.; Cozzani, V.; Reniers, G. Safety analysis of process systems using Fuzzy Bayesian Network (FBN). J. Loss Prev. Process. Ind. 2019, 57, 7–16. [Google Scholar] [CrossRef]
  59. Zhu, H.D.; Sun, Z.; Wu, D. Path planning for mobile robot in 3D space based on improved ant colony algorithm. J. Cent. Chin. Norm. Univ. Nat. Sci. 2016, 50, 812–817. [Google Scholar]
Figure 1. The proposed methodology for assessing the accident shortest path.
Water 14 02857 g001
Figure 2. The principle of accident risk prevention and control based on the BT method.
Water 14 02857 g002
Figure 3. Window of opportunity during accident evolution stage.
Water 14 02857 g003
Figure 4. Schematic diagram of BT mapping into CN.
Water 14 02857 g004
Figure 5. Process flow program of crude oil treatment system.
Water 14 02857 g005
Figure 6. The BT model of gas leakage.
Water 14 02857 g006
Figure 7. The BT model of oil leakage.
Water 14 02857 g007
Figure 8. Complex evolutionary network model for fire and explosion accident.
Water 14 02857 g008
Figure 9. The effect of α on experimental results.
Water 14 02857 g009
Figure 10. The effect of β on experimental results.
Water 14 02857 g010
Figure 11. Shortest path comparison chart.
Water 14 02857 g011
Table 1. Fuzzy possibilities and qualitative and quantitative characterization.
Linguistic VariablesTrapezoidal Fuzzy NumberQualitative DescriptionProbabilistic Representation
Very Low (VL)(0,0,0.1,0.2)Almost impossible to happen(0, 10−6)
Low (L)(0.1,0.25,0.25,0.4)May happen(10−6, 10−3)
Medium (M)(0.3,0.5,0.5,0.7)Sometimes happen(10−3, 10−2)
High (H)(0.6,0.8,0.8,1)Happen several times(10−2, 10−1)
Very High (VH)(0.9,0.95,1,1)Happen frequently(10−1, 1)
Table 2. Description of the basic events.
ItemEventItemEvent
X1RainstormX42Hitting sparks
X2HurricaneX43Smoking
X3Crane falling hittingX44Thermal processing
X4Touch by mistake while repairingX45Heat generation from pumps
X5Missing detection of separator defectsX46Heat generation from Pipe
X6Joints not tightly sealed X47Heat generation from HT electrical equipment
X7Valves not tightly closed X48Smoke detector failure
X8Flanges not tightly closed X49Sprinkler valve failure
X9Corrosion of internal substanceX50Sprinkler head clogged
X10Stress concentration of separatorX51Foam production unit failure
X11Residual stress of separatorX52Foam gun clogged
X12N2 input line failureX53Pipeline broken
X13N2 system failureX54Fire pump failure
X14Gas pipe blockageX55Damaged fire pipe network
X15Valve cloggedX56Not enough foam
X16Pressure regulating valve failureX57Dry powder fire extinguishing equipment failure
X17Liquid volume too largeX58Improper selection of heater shell
X18Improper selection of separator bodyX59Material defection of heater shell
X19Material defection of separatorX60Weld defection of heater shell
X20Weld defection of separatorX61Residual stress of heater shell
X21Not enough preservativesX62Stress concentration of heater shell
X22Corrosion inhibitor injection line failureX63Heater bolt material defect
X23Corrosion inhibitor injection pump failureX64Heater bolt corrosion failure
X24Wear corrosionX65Gasket material defect
X25Electrochemical corrosionX66Gasket crush rupture
X26Separator anti-corrosion coating failureX67Gasket corrosion failure
X27Separator cathodic protection failureX68Flange material defect
X28Power failure of detector systemX69Flange corrosion failure
X29Gas detector malfunctionX70Relatively low preload.
X30Logic controller failureX71Uneven preload
X31Actuator failureX72Shim deviation
X32Incorrect installation of gas detectorX73anti-corrosion coating failure of heater shell
X33Not removed of gas detector coverX74Cathodic protection failure of heater shell
X34Incorrect installation height of gas detectorX75Flange surface rough
X35Emergency shut-off valve failureX76Flange surface impurity
X36Control program failureX77Flange surface be scratched
X37Executive power failureX78Oil leakage undiscovered
X38Manual valve failureX79Pressure sensor failure
X39Operation errorX80Pressure transmission signal failure
X40LightningX81Pressure alarm failure
X41Static electricityX82Missed detection of defects in heater
Table 3. Description of the intermediate events.
ItemEventItemEventItemEvent
M1Third damagedM14Exposed to corrosive environmentsM27Heater defect
M2Separator defectM15Separator exterior corrosion protection failureM28Heater corrosion perforation
M3Separator corrosion perforationM16Gas detection system failureM29Leakage at heater flange connection
M4Leakage at sealsM17Inability to effectively detect gas leakageM30Defect of heater design and manufacturing
M5External hittingM18Emergency shutdown failureM31Heater external corrosion
M6Separator body defectM19Manual shutdown failureM32Heater stress corrosion
M7Separator not tightly sealed M20Open flameM33Heater bolt failure
M8Internal corrosionM21Equipment hot surfaceM34Heater Gasket Failure
M9Separator external corrosionM22Fire water system failureM35Heater flange failure
M10Separator stress corrosionM23Defect of separator design and manufacturingM36Incorrect heater flange installation
M11N2 supply failureM24Foam fire extinguishing system failureM37External anti-corrosion failure of heater
M12Separator overpressureM25Insufficient water pressureM38Flange surface defect
M13Internal anti-corrosion measures failureM26Insufficient foam mixM39Pressure monitoring failure
Table 4. Control and mitigation barriers description of FTA.
ItemDescription
I1Gas leakage detection failure
I2Emergency shutdown failure
I3Ignition protection failure
I4Fire extinguishing failure
I5Oil leakage detection failure
Table 5. BT model accident escalation consequences.
ItemConsequence
C1Gas leakage pollution
C2Gas jet fire
C3vapor cloud explosion
C4Oil leakage pollution
C5liquid jet fire
C6Pool fire
Table 6. Risk events for fire and explosion accident in oil and gas processing system.
No.Risk EventsNo.Risk Events
v1Environmental factorsv49Fire extinguishing failure
v2Hurricanev50Smoke detector failure
v3Rainstormv51Sprinkler valve failure
v4Environmental corrosionv52Sprinkler head clogged
v5Heater rupturev53Insufficient water pressure
v6Crane fallingv54Fire pump failure
v7Equipment wearv55Damaged fire pipe network
v8Separator exterior corrosion protection failurev56Fire water system failure
v9Separator corrosion perforationv57Foam production unit failure
v10Separator rupturev58Foam gun clogged
v11Process flow factorsv59Pipeline broken
v12Corrosion of internal substancev60Insufficient foam mix
v13Not enough preservativesv61Not enough foam
v14Internal corrosionv62Gas leakage detection failure
v15Corrosion inhibitor injection pump failurev63Gas detection system failure
v16N2 system failurev64Gas detector malfunction
v17N2 input pipe failurev65Logic controller failure
v18N2 supply failurev66Actuator failure
v19Pressure regulating valve failurev67Incorrect installation of gas detector
v20Valve cloggedv68Not removed of gas detector cover
v21Gas pipe blockagev69Incorrect installation height of gas detector
v22Liquid volume too largev70Inability to effectively detect gas leakage
v23Overpressurev71Power failure of detector system
v24Human factorsv72Lightning
v25External anti-corrosion failure of heaterv73Static electricity
v26Incorrect heater flange installationv74Hitting sparks
v27Touch by mistake while repairingv75Smoking
v28Missing detection of separator defectsv76Thermal processing
v29Missed detection of heater defectsv77Equipment hot surface
v30Equipment factorsv78Open flame
v31Weld defection of separatorv79Ignition protection failure
v32Material defection of separatorv80Oil leakage detection failure
v33Separator not tightly sealed v81Leakage undiscovered
v34Separator seal leakagev82Pressure monitoring failure
v35Improper selection of separator bodyv83Pressure sensor failure
v36Separator gas leakagev84Pressure transmission signal failure
v37Heater gasket failurev85Pressure alarm failure
v38Heater flange failurev86JF
v39Heater oil leakagev87VCE
v40Heater corrosion perforationv88PF
v41Heater flange connection failurev89Control program failure
v42Corrosion inhibitor injection pipe failurev90Executive power failure
v43Weld defection of heater shellv91Emergency shutdown failure
v44Material defection of heater shellv92Manual shutdown failure
v45Improper selection of heater shellv93Automatic shutdown failure
v46Heater bolt failurev94Manual valve failure
v47Foam fire extinguishing system failurev95Operation error
v48Dry powder fire extinguishing equipment failurev96Emergency shut-off valve failure
Table 7. The shortest path for the initial event to trigger JF, PF, and VCE accident.
Initial EventsShortest Path to LeakageShortest Path to EscalateRisk
Entropy
Total
Probability
JFv1v1→v2→v6→v10→v36v36→v52→v56→v61→v60
→v47→v48→v49→v86
30.46.15 × 10−14
v11v11→v13→v14→v40→v39v39→v52→v56→v61→v60
→v47→v48→v49→v86
29.02.47 × 10−13
v24v24→v28→v9→v36v36→v52→v56→v61→v60
→v47→v48→v49→v86
19.82.64 × 10−9
v30v30→v37→v41→v39v39→v52→v56→v61→v60
→v47→v48→v49→v86
21.93.06 × 10−10
PFv1v1→v2→v6→v5→v39v39→v96→v93→v94→v92
→v91→v73→v79→v52→v56
→v61→v60→v47→v48
→v49→v88
57.96.82 × 10−26
v11v11→v12→v14→v40→v3953.84.52 × 10−24
v24v24→v29→v40→v3950.88.49 × 10−23
v30v30→v37→v41→v3948.31.1 × 10−21
VCEv1v1→v2→v6→v10→v36v36→v64→v63→v62→v73
→v79→v52→v56→v61→v60
→v47→v48→v49→v87
51.44.94 × 10−23
v11v11→v12→v14→v9→v3649.53.2 × 10−22
v24v24→v28→v9→v3640.72.12 × 10−18
v30v30→v33→v34→v3644.26.4 × 10−20
Publisher’s Note: MDPI stays neutral with regard to jurisdictional claims in published maps and institutional affiliations.

