
A Comparative Study on Water and Gas Permeability of Pervious Concrete

1
Guangxi Construction Engineering Group Holdings Co., Ltd., 19 Pingle Road, Nanning 530201, China
2
College of Civil Engineering and Architecture, Guangxi University, 100 University Road, Nanning 530004, China
3
College of Civil Engineering and Architecture, Guangxi Minzu University, 188 University Road, Nanning 530006, China
*
Author to whom correspondence should be addressed.
Water 2022, 14(18), 2846; https://doi.org/10.3390/w14182846
Submission received: 7 July 2022
/
Revised: 30 August 2022
/
Accepted: 30 August 2022
/
Published: 13 September 2022
(This article belongs to the Special Issue Urbanization, Climate Change and Flood Risk Management)
Abstract
:The water and gas permeability of pervious concrete play essential roles in rainwater infiltration and plant root respiration. In this study, the gas and water permeability of pervious concrete samples were measured and compared. The water permeability was tested using the constant water head method and several water heads were measured for inspection, in which the permeability varied with the application of the pressure gradient. The permeability of gas was measured using a new simple gas permeameter, which was specially manufactured for measuring the gas permeability of pervious concrete under a stable pressure difference. A series of different gas pressure gradients was applied to test whether the gas permeability was a function of the applied pressure. Both the gas and water permeability of pervious concrete were found to decrease with an increased applied pressure gradient, which did not conform to the Klinkenberg effect (gas slippage effect). When comparing the gas permeability and water permeability of pervious concrete, we found that the water permeability was 4–5 times larger than the gas permeability.
1. Introduction
Permeable pavements are surface materials that are commonly used for underlying surfaces in sponge city construction. They are used as porous structures to reduce surface water after rainfall and also to reduce pavement temperatures by retaining a specific quantity of water through evaporation, thus greatly inhibiting the rise of the ambient air temperature and improving urban thermal environments and residents’ thermal comfort in hot and humid areas [1,2,3,4]. Permeable pavements function in a way that decreases the runoff from storms by draining water from the surface and permitting plants and soil to respire. One kind of permeable pavement is pervious concrete and its interlinked hollow spaces permit water to be drained from the pavement and provide gas transport between the soil and the air. Whether these functions can be fulfilled depends on the permeability of the pervious concrete. While permeability signifies the capacity to allow fluid transport within internal pores, it cannot be measured directly; instead, it is measured by states, such as flux and pressure.
Darcy’s law has been used to comprehensively measure the water permeability of pervious concrete, while reports on gas permeability in the literature are limited. For the water permeability test, constant/variable head methods are the most widely used among the laboratory tests specified by ASTM C1701M [5]. The water pressure gradient of pervious concrete is low enough to support a laminar flow [6,7,8,9] and the relevant velocity is measured to estimate permeability. However, the validity of these two methods is still unclear. It has been found that the permeability coefficients measured by the falling head method are 100–300% higher than those measured by the constant head method, although the former is more convenient to use [10]. A similar report by Qin et al. [11] confirmed that permeability coefficients from the constant pressure heating method under a low pressure (i.e., 2 cm) were much closer to those from the falling head method. Therefore, when the permeability of an unsaturated permeable pavement is used as the design input for computer models, the permeability may be greatly overestimated [2].
For the gas permeability test, Qin et al. [12] invented a simplified method to measure flowing gas to test the permeability of highly porous media and found that gas permeability ranged from 10−8 to 10−4 m2. However, the difference between the gas and water permeability of pervious concrete remains unknown. There is no reason that the gas and water permeability of pervious concrete would correlate similarly to those of normal concrete. For instance, for normal concrete, gas permeability has been found to be greater than water permeability due to the gas slippage effect [13,14,15]. This effect is substantial on fluid transport within normal concrete, but it is not necessarily notable on fluid transmission inside pervious concrete because the pores of the two kinds of concrete are several orders of magnitude different [16]. Thus, it is worth measuring the gas permeability of pervious concrete and examining how this permeability is different from water permeability.
This study measured the gas and water permeability of pervious concrete by performing experiments. Two kinds of Portland concrete mixtures were prepared and their cores were tested for water and gas permeability. The water permeability was measured using the constant water head method. The measurements were conducted under a group of various water heads to check whether the applied pressure was a function of permeability. Gas permeameters for normal concrete were adapted to measure the permeability of pervious concrete but they were found to be unsuitable. In order to test the gas permeability of pervious concrete under a stable pressure, a novel and simplified equipment was designed. The gas permeability and water permeability were compared and their differences were also examined.
2. Experiments
2.1. Sample Preparation
The prepared pervious concrete specimens were designed according to CJJ/T135-09 [17]. They consisted of the following raw materials: Portland cement (Type I 42.5R), coarse aggregate and water. Generally, the key parameters of the mixture design of pervious concrete include a single-particle aggregate, target porosity and water–binder ratio (w/c) [3]. In this study, two kinds of mixture proportion designs were developed, with water–binder ratios of 0.25 and 0.28, respectively. In the experiments, the coarse aggregate that was adopted limestone particles with a single gradation of 4.75–9.5 mm, a density of 2726 kg/m3 and a crushing index of 8.0%. The cement/aggregate ratio was 1:4. In addition, to enhance the workability of the fresh mixture, a water reducing agent of 2% relative to the cement mass was supplemented to fabricate all pervious samples. The mixture proportions of the pervious concrete samples are shown in Table 1.
The mixtures used in the experiments were mixed with an automatic roller mixer. The coarse aggregate was cast into the mixer and then the assessed absorbed water was sprinkled on the aggregate for 1 min to wet the surface of the aggregate. Cement was also added into the mixer with the wet aggregate for another 1 min. Finally, the quantity of the water that was required for the anticipated w/c ratio was put into the mixer.
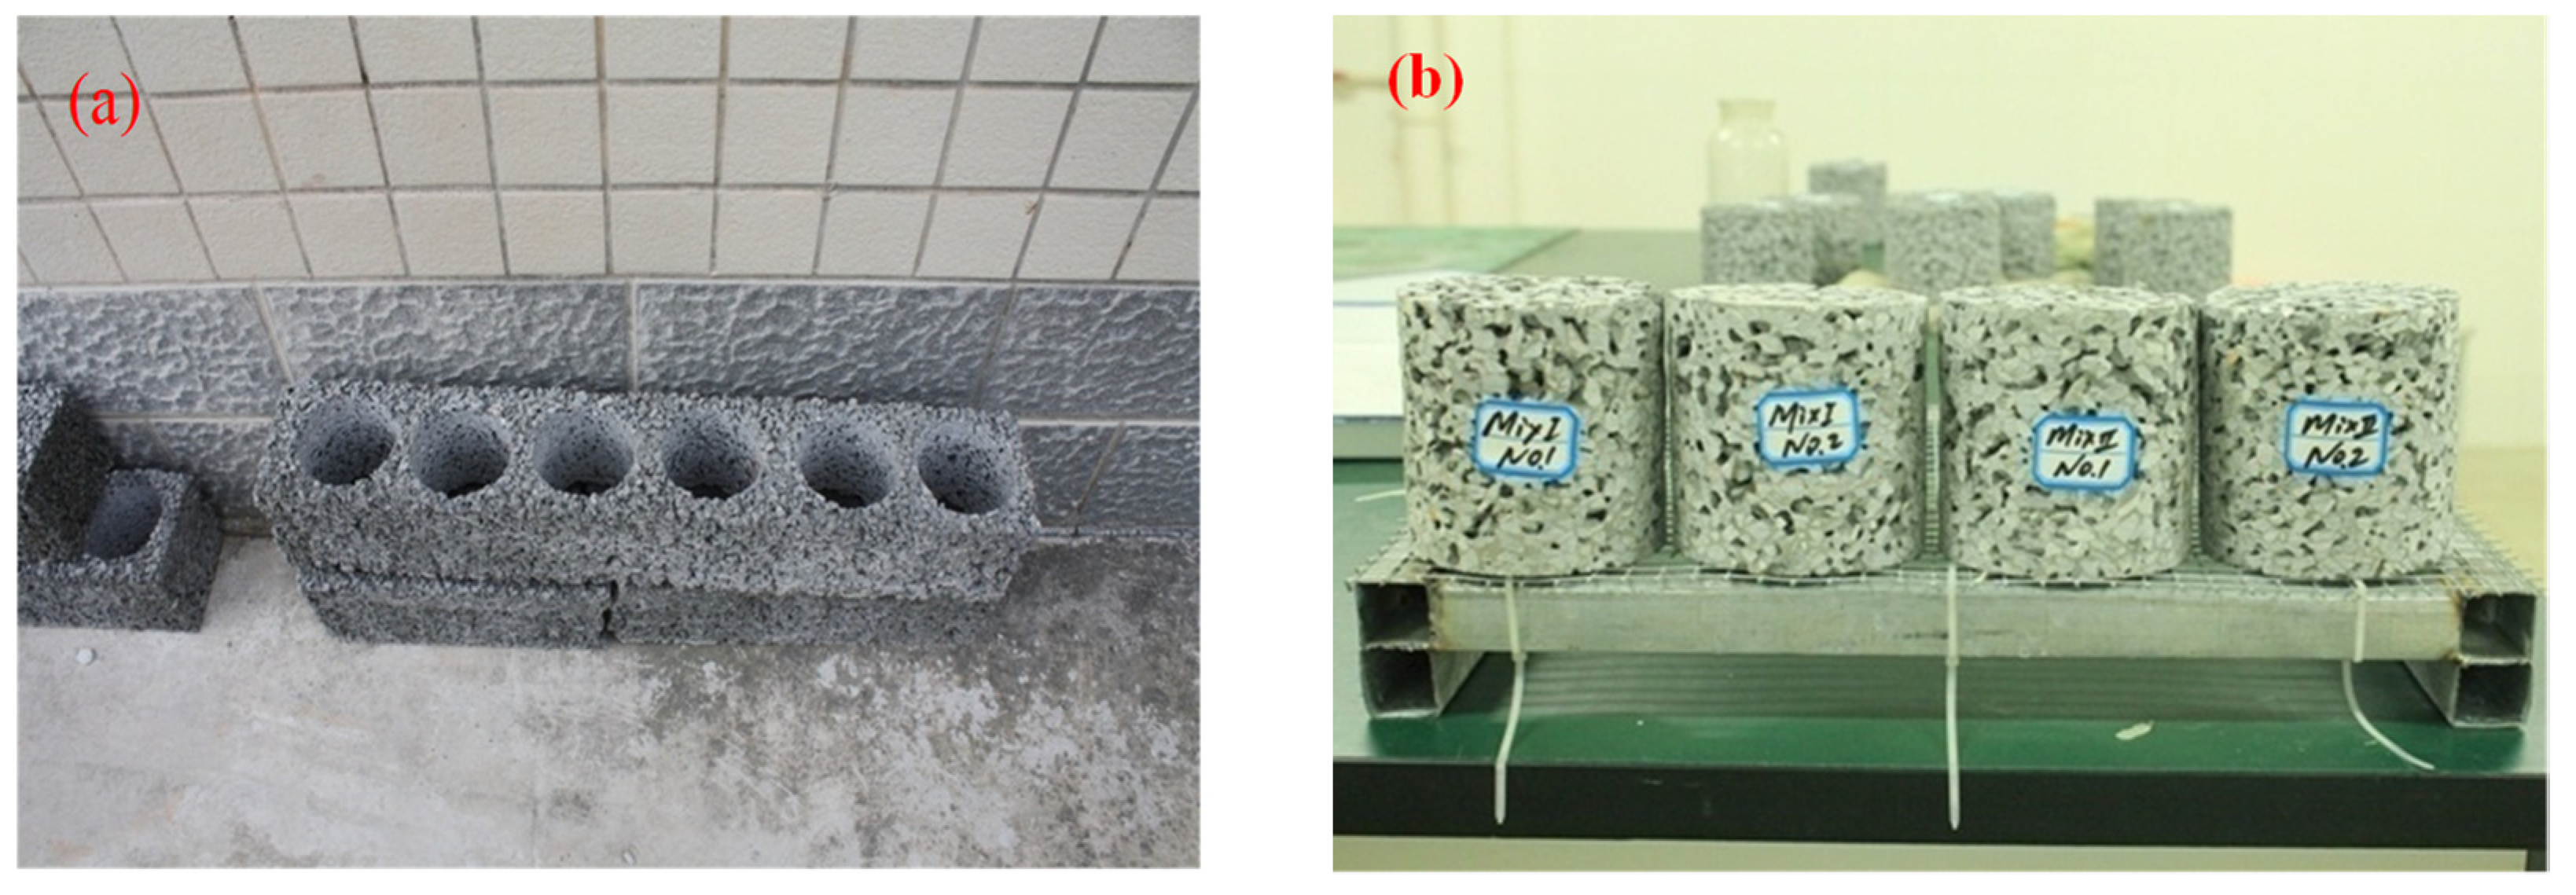
The fresh mixtures were poured into a slender wooden mold with a size of 150 × 150 × 860 mm3. All mixtures were layered and inserted layer by layer to ensure the uniformity of the specimens and produce good continuous pores. Without any vibratory compaction, the mixture in the mold was leveled with a scraper. All samples were de-molded after 48 h and then cured in a standard room at 20 °C and with a relative humidity of more than 95%. To avoid the impact of vibration inhomogeneity, cylinders with a diameter of 100 mm and a height of 100 mm were drilled from the pervious samples after they had cured for 28 days using a core drilling machine and 25 mm was cut off the top and bottom surfaces of the cylinder samples for treatment. Every cured block was drilled for six cores with a diameter of Φ100 mm × 100 mm (Figure 1).
The debris was removed from the samples using vacuum cleaning. Then fundamental tests, such as porosity and density, were performed on these samples. The open porosity of the pervious concrete φ was calculated using Equation (1):
in which m1 is the weight of the sample with underwater buoyancy (kg), m2 is the weight of the dried sample (kg), ρ is the water density (1.0 g/cm3) and V is the sample volume (m3).
2.2. Water Permeability Test
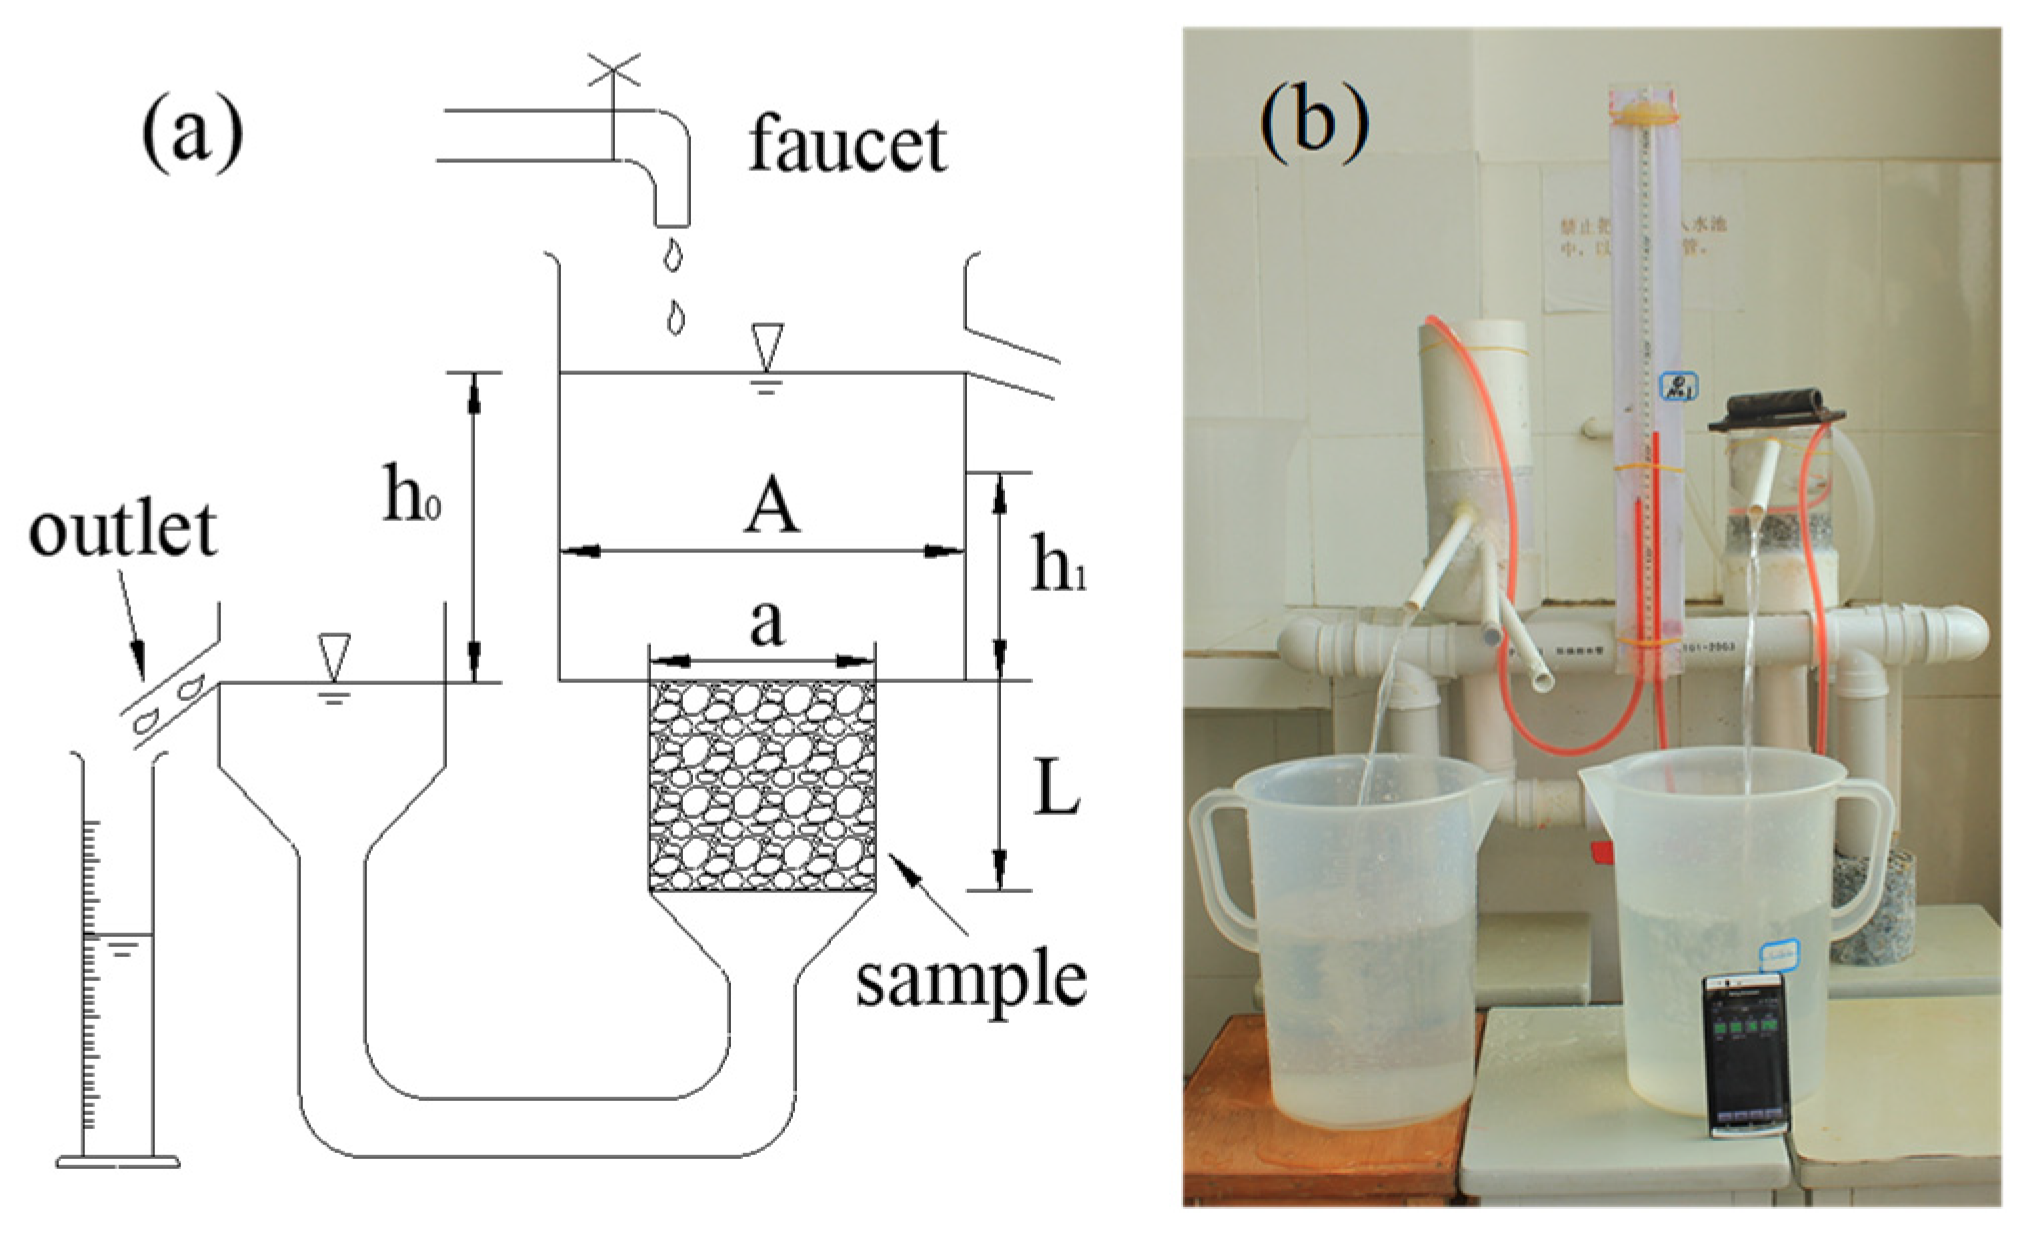
The water permeability of the pervious concrete was tested using the constant water head method. The device is schematically shown in Figure 2a. A faucet supplied sufficient water at the inlet to maintain a constant water head difference across the sample, while the surplus water was drained from an open slot at the inlet. This difference could be regulated by lifting or dropping the inlet’s water head to the desired level. Under this pressure gradient, water flowed through the sample and drained from the outlet.
In order to make sure that the inner pores were sufficiently wet, the specimens were put in a container with stirred water for 24 h. They were then combined in the apparatus (Figure 1b). To prevent water leaking through the sides of the samples, catalyst silicone rubber was used to seal the samples. The test was stopped if any water percolated along the side walls or leaked from the pipe.
The test only began when there were no air bubbles left in the samples. Air bubbles were taken out repeatedly from the outlet of the water head. A rod with a diameter that was smaller than the inner diameter of the outlet pipe was injected into the outlet to drain the water; then, the rod was dragged out suddenly to change the pressure difference. This sudden variation in the pressure gradient helped embedded air bubbles to evacuate from the samples. This process was continued until no apparent air bubbles were present in the top surface of the samples.
When the test began, a container was put under the setup to collect the water draining from the outlet. Supposing that a volume of drained water Ql (m3) was collected during the time interval ∆t, the permeability coefficient kl (m2) of the pervious concrete could be calculated using Equation (2):
where μl is the water viscosity (Pa.s), ρ is the water density (kg/m3), g is the gravitational force (m/s2), h is the difference between the water head inlet and outlet (h = 0.1 m), L is the sample length (m) and A is the cross-sectional area of the pervious concrete sample (m2).
2.3. Gas Permeability Test
2.3.1. Gas Permeameter for Normal Concrete
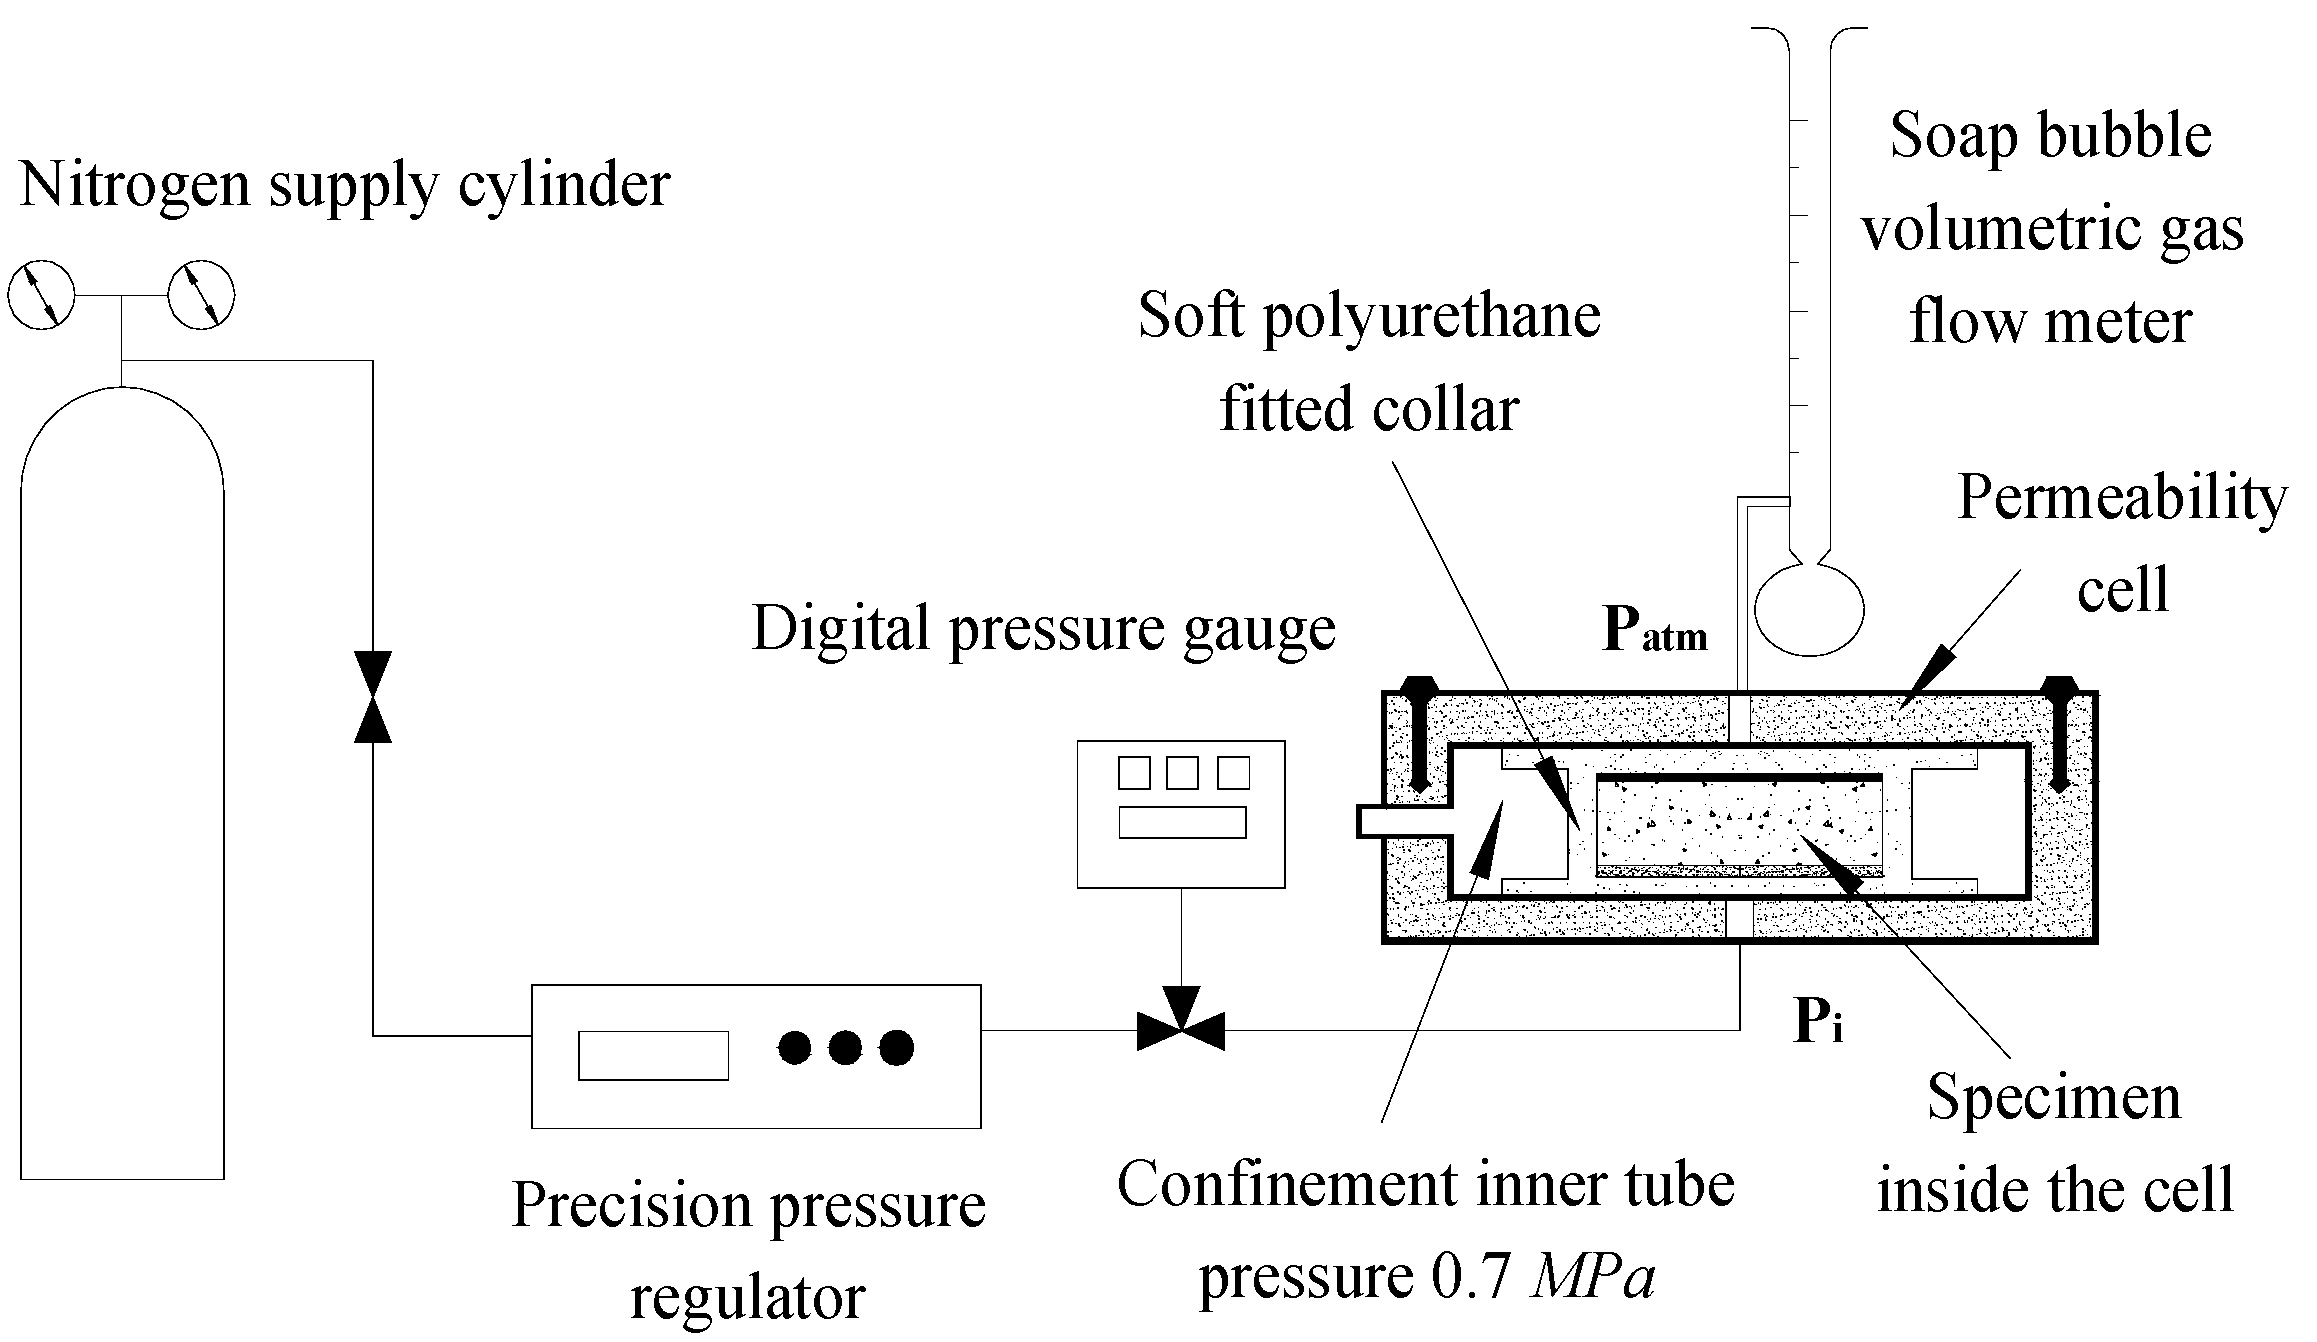
The gas permeability of normal concrete is usually determined by measuring a steady gas flow through a concrete specimen [18,19,20]. A constant gradient is applied across the sample while the resulting flux is measured. This steady flow method typically adopts an experimental schematic layout as shown in Figure 3. A pressure gauge and a pressure cell are used to regulate a stable pressure on the inlet side, while the outlet may be open to the atmospheric pressure. At the outlet, a soap bubble volumetric gas flowmeter is installed to collect the air seeping through the sample. Collecting a measurable volume of gas at the outlet requires hours and even days because gas flows slowly through normal concrete samples. Considering that a volume of gas Qg (m3/s) is collected during the time interval t (s), the apparent gas permeability kg (m2) of pervious concrete is calculated using:
where μg represents the dynamic viscosity of the gas (Pa.s), Pi represents the gas pressure at the inlet (Pa) and P0 represents the gas pressure at the outlet, which is normally set as the atmospheric pressure (1.03 × 10⁻⁵ Pa).
Supposing that a normal concrete sample has an apparent permeability of 10−18 m2, a length of 10 cm, a diameter of 10 cm and an assumed gas pressure at the inlet of 2 Patm (~0.2 Mpa) [21], collecting 10 cm3 of gas would require 15,420 s (4.3 h). In reality, more time is required to complete a testing cycle because the test cannot commence until a steady flow is attained. The testing time could range from 5–7 days [22]. If a sample is to be tested under different pressure gradients, it would require several months. Precautions must be taken to prevent evaporation losses from the soap bubble volumetric gas flowmeter during these long testing times.
Here, we attempted to adapt this apparatus to test the gas permeability of pervious concrete. The relative pressure Pi − Patm needed to be set as low as possible because the gas flow rate through pervious concrete is orders of magnitude faster than that through normal concrete. The minimum difference was set as 100 Pa because digital pressure gauges have an accuracy of 100 Pa. Assuming the same sample geometry and a gas permeability of 10−10 m2, the gas collected by the gas flowmeter would have been 42 cm3/s. This rate would be too fast to be recorded correctly by the soap bubble volumetric gas flowmeter. Actual gas flow rates tend to be higher than this value (42 cm3/s) because greater relative pressures (>100 Pa) are expected during the test and gas permeability tends to be greater than 10−10 m2. Therefore, the steady flow method indicated in Figure 3 is widely used to calculate the permeability of normal concrete but is unsuitable to measure the permeability of pervious concrete.
2.3.2. A Novel Device for Testing the Gas Permeability of Pervious Concrete
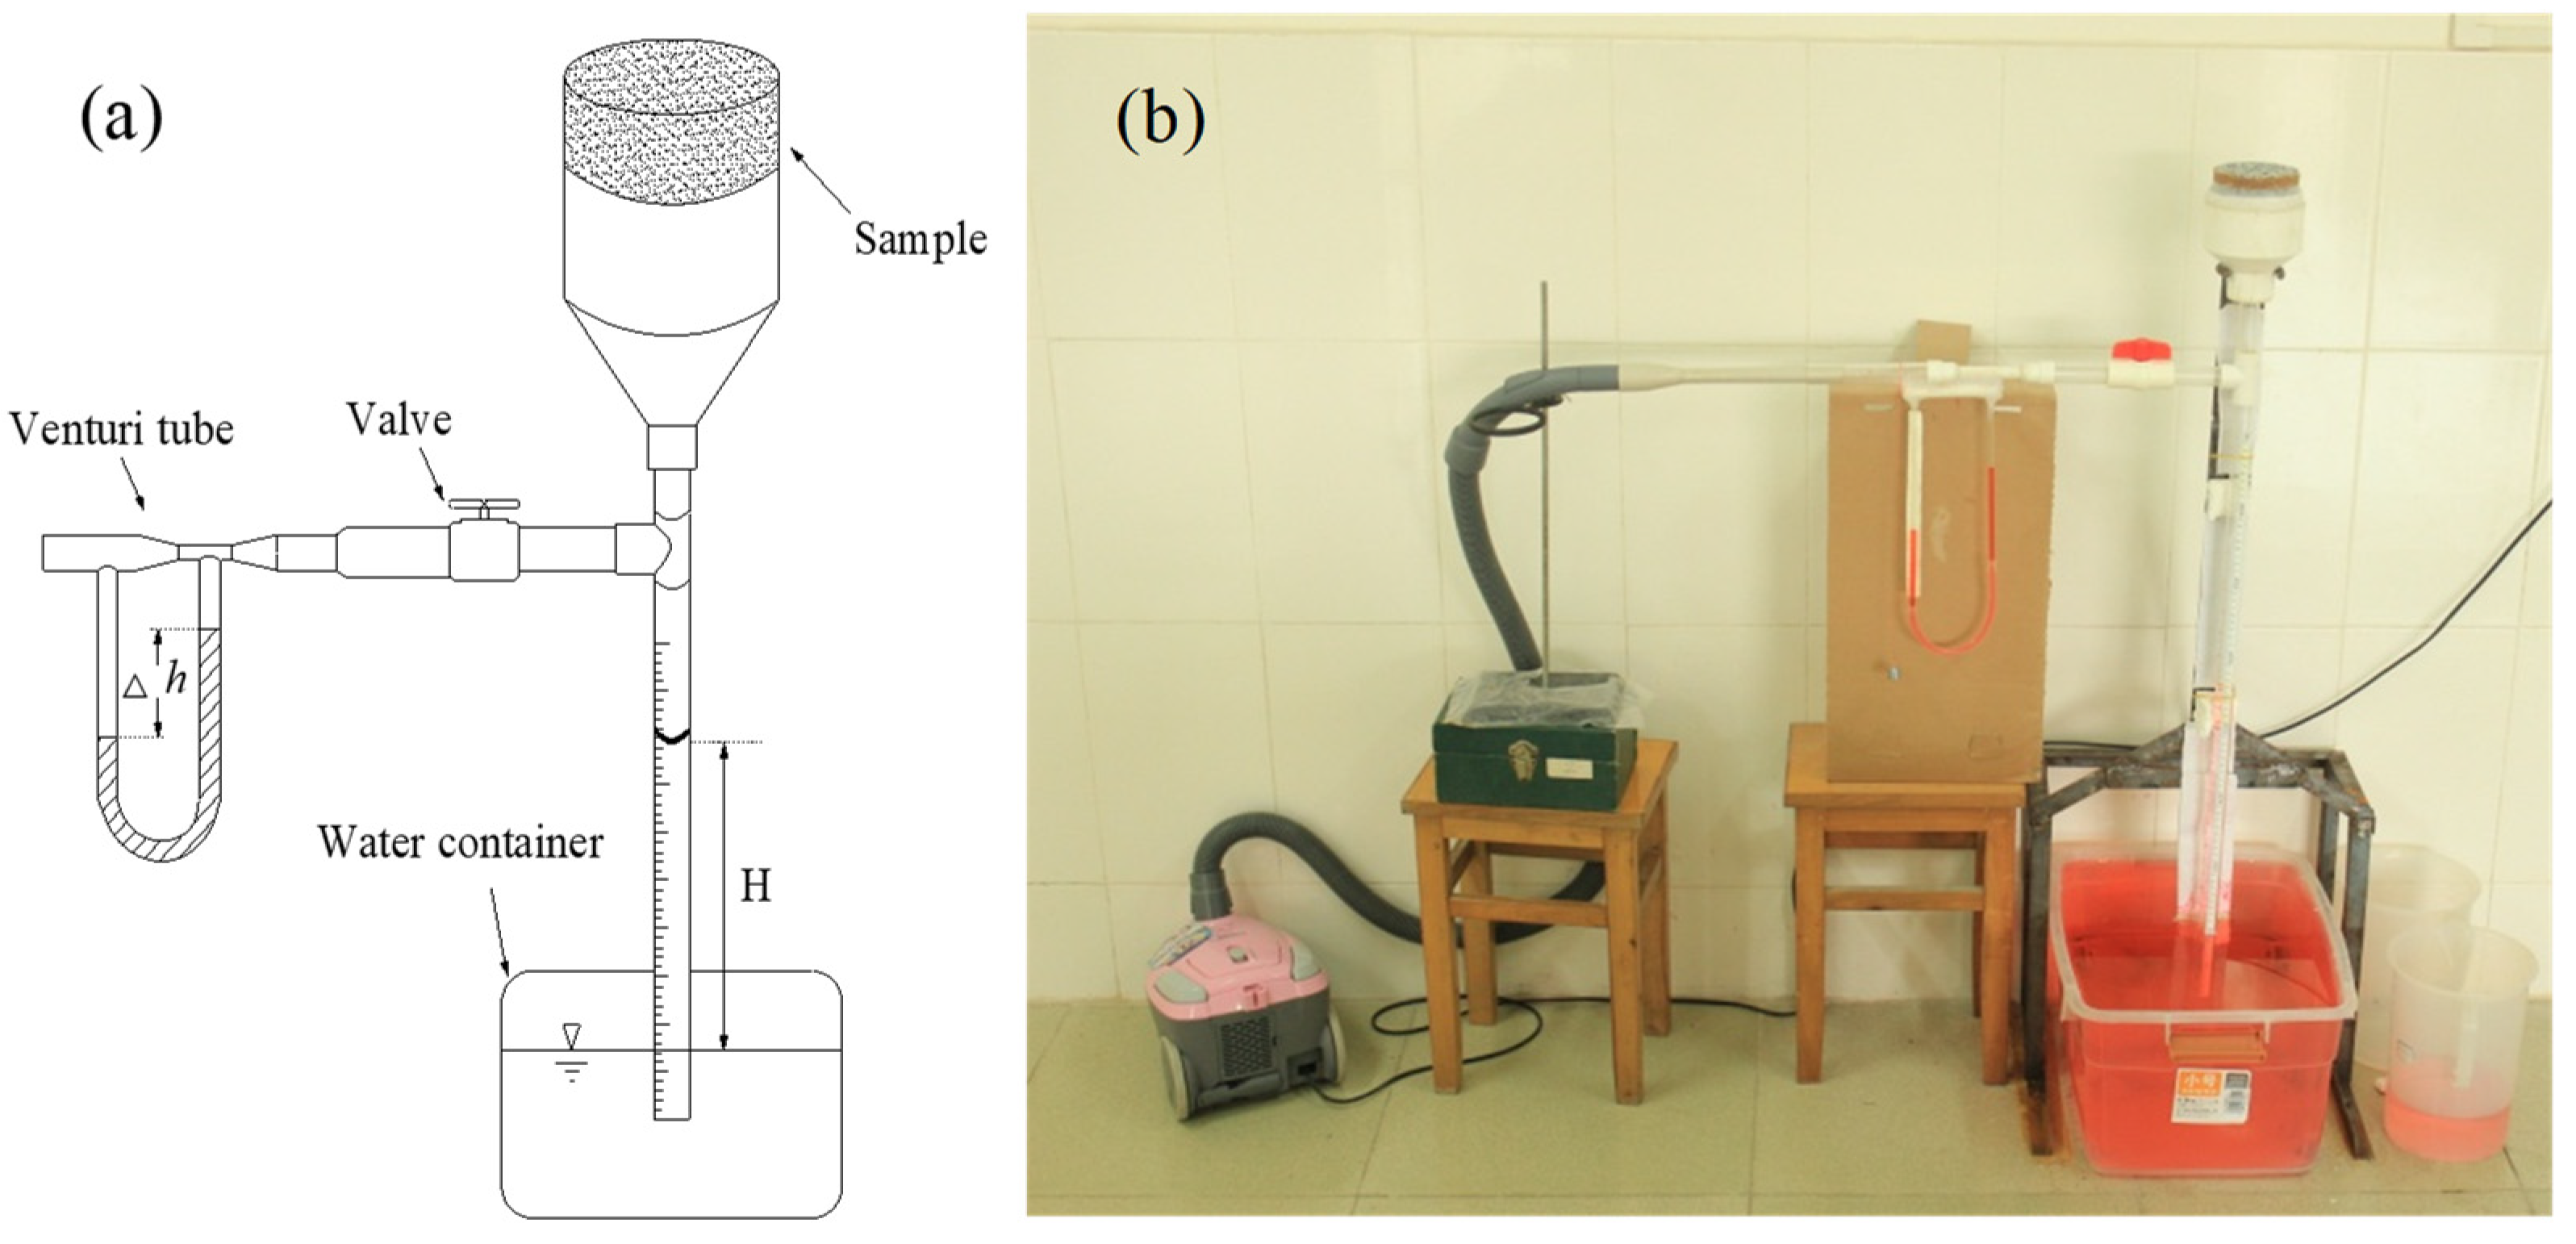
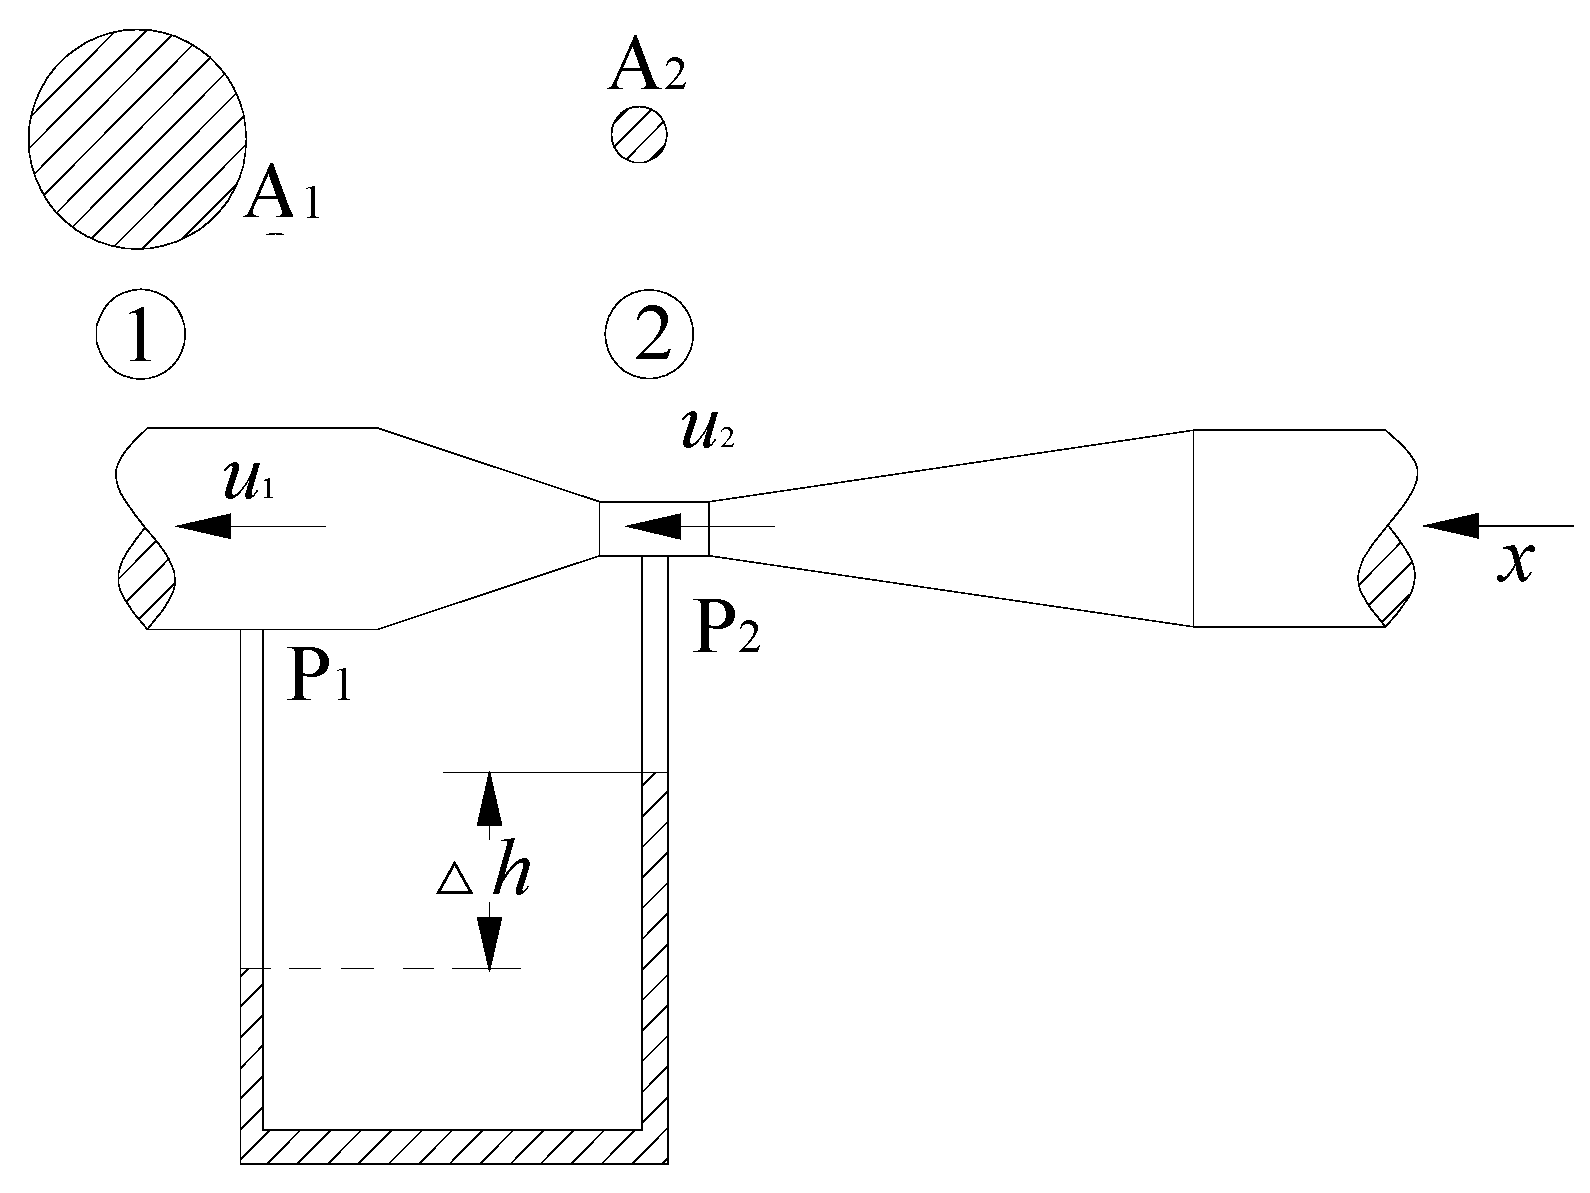
As shown in Figure 4, an air permeameter was designed to test the gas permeability of pervious concrete. It consisted of three sections: a pressure gradient indicator, a sample section and a venturi tube for estimating the associated gas flux. It did not require any permeability cells, pressure regulators or pressure gauges, but a gas pressure gradient was required to force air inside the sample using a vacuum pump. Before creating the vacuum, the air flow rate was measured using the venturi tube. In the tube (Figure 5), the gas flow obeyed the following equations:
Solving for u1 and noting that P1 − P2 = ρl g∆h, we obtained:
where ρl and ρg are the densities of water and gas (kg/m3), respectively, ∆h is the head difference read from the venturi tube (m), A1 and A2 are the cross-sectional areas of the larger and smaller sections of the venturi tube (m2), respectively, and CD is the coefficient of the longitudinal friction loss that was induced by the gas compressing in the tube’s narrow section [23].
As shown in Figure 4, the air that flowed through the samples was quite identical to the air that passed through the venturi tube and the gas flow rate inside the samples was:
Since the difference in the applied pressure was considerably small and, therefore, the gas compressible components were negligent, the apparent gas permeability kg (m2) could be computed as:
where h is the water head reading from the capillary tube (m). Note that in Equations (2) and (8), the water head difference h could be different but it signified the pressure gradient across the samples, so the same variable h was used.
Equation (8) was only applicable in the case when the gas flow through the sample was laminar. In the lab study, the gas flow rate had to be sufficient to maintain a measurable water head in the capillary tube and the water head difference to be readable in the venturi tube. Therefore, turbulent flow was categorized as the air flow inside the samples. The apparent gas permeability and the pressure gradient could be expressed as Equation (9), according to the Forchheimer law:
where cF is a drag constant of dimensionless form, which is approximately equal to 0.55 according to Ward’s work [24]. The gas that flowed from the side with a large pressure is signified by the negative sign on the right hand side. In Equation (9), all variables could be measured except the gas permeability kg, which could be solved using the iterative numerical method.
2.4. Testing Information
The cured samples were submitted to gas permeability testing using the assembled apparatus shown in Figure 4. The diameter of the venturi tube was 13.54 mm at the narrow section and 21.16 mm at the wide section. The corresponding frictional loss coefficient (CD = 0.97) was estimated according to [23].
The permeability test was carried out in a room at 29 °C and with an RH of 65~70%. Every sample was dried at 105 °C for 3 h and then left to cool down at room temperature. Afterward, catalyzed silicon rubber was used to seal the circumferential surfaces to prevent gas seeping from the sample walls when the test was being carried out. When the rubber hardened, the samples were collected in the apparatus for gas permeability testing. The test measured gas permeability under different pressures (i.e., different water heads in the capillary tube) in order to observe the correlation between the applied pressure difference and the apparent gas permeability. After that, the samples were disassembled from the gas permeameter and re-assembled at the water permeameter (Figure 2) for the water permeability testing.
3. Results
Figure 6 depicts the relation between the permeability and the applied pressure difference. The range of the apparent water permeability differed from 10−10 to 10−9 m2, which represented the predicted permeability of pervious concrete. Considering that there is seldom water pooling on pervious pavement surfaces, the water head difference across the sample was set to be relatively small. The pressure gradient used during the gas permeability test was set to be relatively large to maintain the measurable head difference in the capillary tube. Although the applied pressures were different, the extrapolation of the gas permeability and water permeability could draw the same conclusion, i.e., the water permeability was several times greater than the gas permeability.
An increase in pressure gradient led to the nonlinear reduction in both water and gas permeability. When the pressure was close to 0 kPa/m, the permeability increased significantly. In the literature [15], for normal concrete, the relationship between the applied pressure and the apparent permeability can be regressed, according to the Klinkenberg effect. According to this phenomenon, the reciprocal mean pressure increases the permeability of porous media linearly but is not dependent on the pressure difference [15].
in which b stands for the Klinkenberg coefficient (Pa), kv represents the inherent permeability of the material (which can be calculated when the applied pressure approaches infinity (m2)) and pm is the average pressure. In these permeability tests, pm was:
where p0 represents the atmospheric pressure (1.03 × 10⁵ Pa). Substituting Equation (11) into Equation (10) and noting that , Equation (12) can be obtained:
According to Equation (12), the apparent permeability should be linearly related to the applied pressure. This linear relationship was not observed in the calculated permeability (Figure 6), which proved that the permeability of pervious concrete failed to follow the Klinkenberg effect.
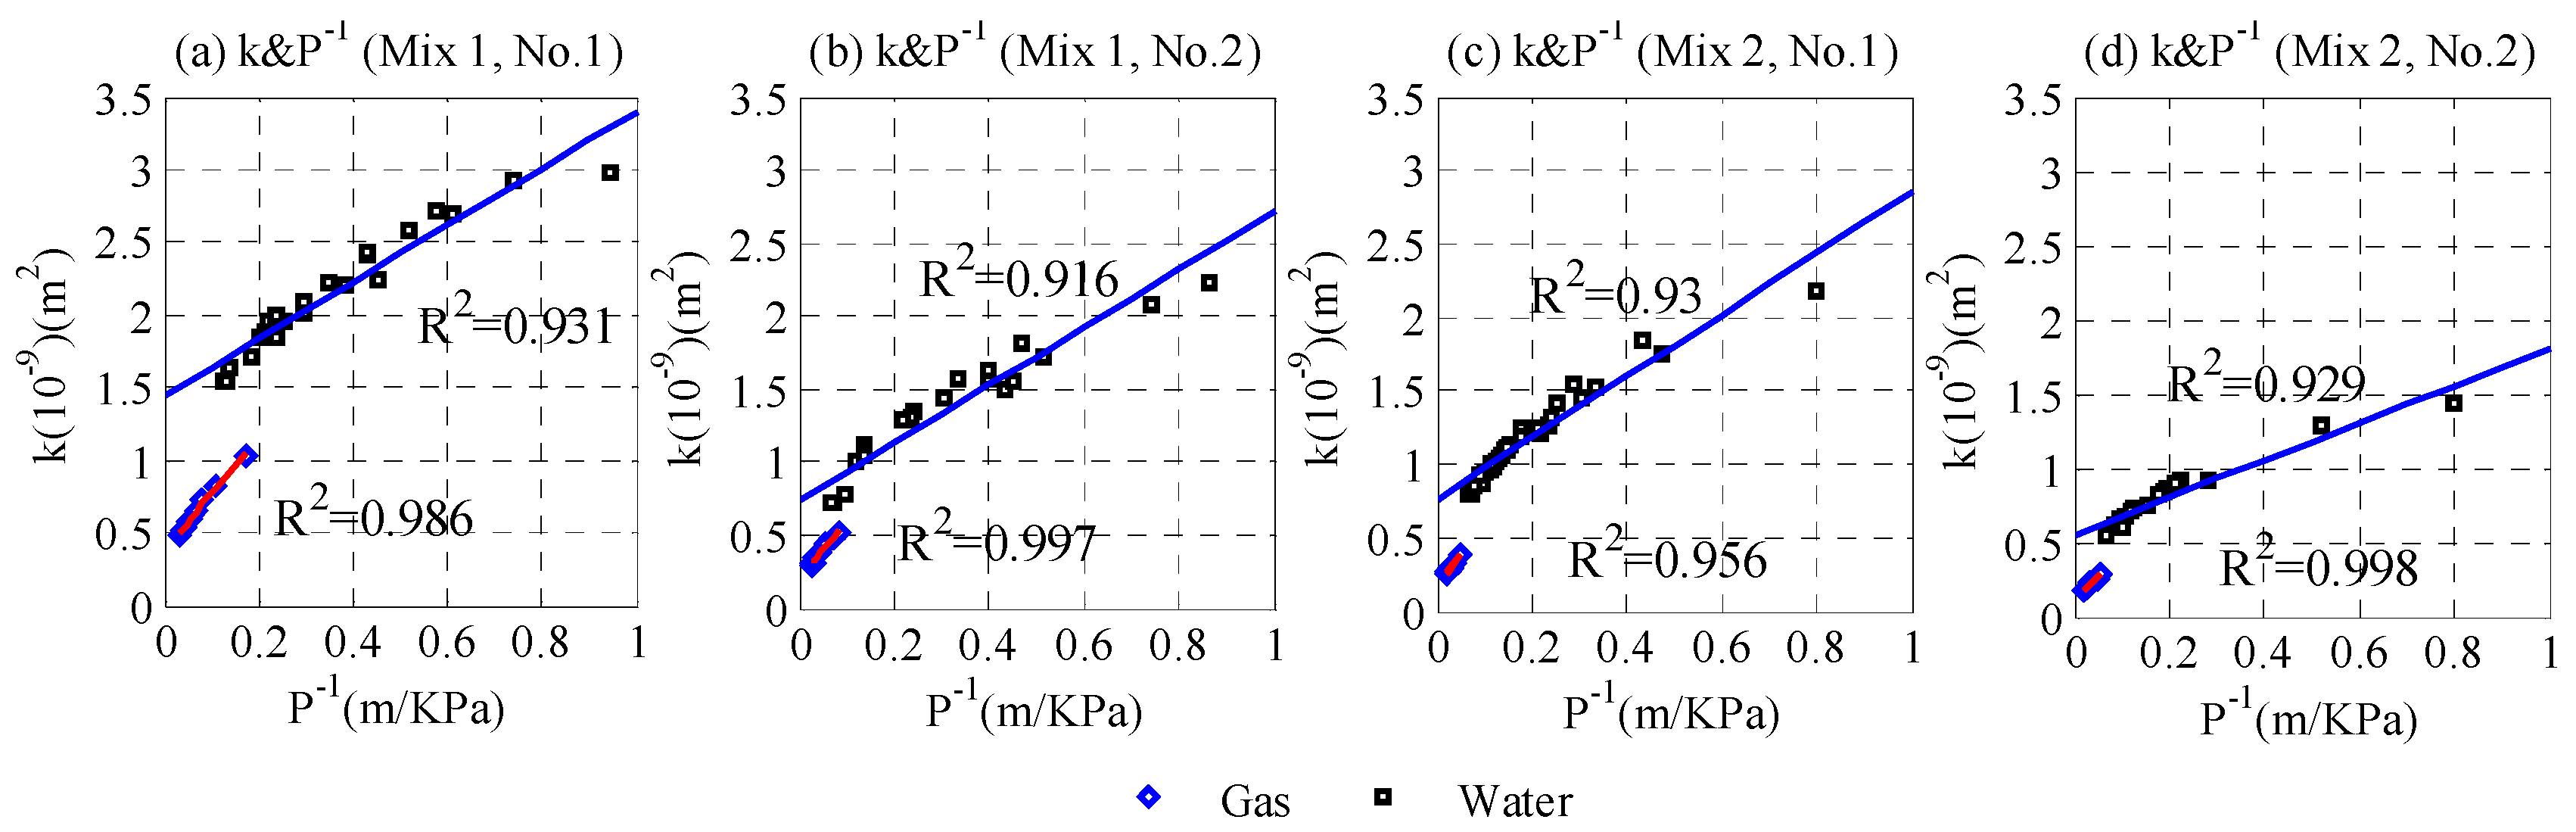
Here, in Equation (10), the applied average pressure was substituted by the differential pressure:
The apparent permeability was only linearly related to the reciprocal of the pressure difference when Equation (13) was satisfied. Figure 7 displays the apparent permeability and pressure differences. Table 2 lists the statistical coefficients (kv, b) and compares the porosity and density. The permeability of the pervious concrete samples accorded with Equation (13), as vindicated by Figure 7 and R2 in Table 2. The intrinsic permeability kv was the permeability when the pressure difference reached infinity. Taking into consideration the fact that an infinite mean pressure is identical to an infinite pressure difference (i.e., is equal to ), the permeability kv in Equation (10) had the same meaning and magnitude as the permeability kv in Equation (13); both were the intrinsic permeability.
The intrinsic permeability kv increased with porosity, which was completely consistent with the research results in the literature [25,26,27]. A linear correlation is shown in Figure 7, which also shows good agreement. However, in this study, the porosity of the pervious concrete samples was limited to a narrow range (25~32%) while the typical permeability of pervious concrete can be around 15~35%, so there was not a good correlation between the intrinsic permeability and porosity. The water permeability of the samples was found to be approximately 4–5 times greater than the gas permeability.
As for the water and gas permeability, the coefficient b decreased with an increase in porosity. This correlation meant that the measured apparent permeability was more strongly dependent on the porosity at a state of lower permeability [15]. The regression coefficient b of the gas permeability seemed to be greater than that of the water permeability (Figure 7), as vindicated in Table 2. This further indicated that the pressure difference influenced the water permeability less than the gas permeability.
4. Discussion
4.1. Difference between Water and Gas Permeability
For the pervious concrete, its water permeability was 4–5 times larger than its gas permeability. This finding was contrary to the findings on the permeability of normal concrete, whose gas permeability is usually larger because of the gas slippage effect. In normal concrete, some internal pores may be larger than the molecular path of water but smaller than the molecular path of gas, i.e., gas can freely pass through these pores while water cannot. This difference results in the gas permeability usually being greater than the water permeability. In addition, for normal concrete, due to the interaction between the water and cement matrix (i.e., the dissolution/precipitation of hydrates and the migration of fine elements), the water permeability decreases significantly over time [28,29,30]. The reacted products change the structure of the pores, thereby reducing the permeability of the concrete.
However, the permeability of pervious concrete basically depends on larger pores, which provide preferential routes for a fluid to seep through. These pores are larger than the molecular paths of both water and gas. While some smaller pores may contribute to the minimal passage of the testing fluid, this contribution is negligible in comparison to the permeability through the larger pores. Therefore, the gas permeability should be the same as or very close to the water permeability; however, this logic was unfortunately not confirmed by our experiments.
A plausible reason could be that the testing fluid reacted chemically and/or physically with the pervious concrete matrix. Under the lab testing conditions, the gas percolating through the matrix might not vary its structure in a notable way and, therefore, was deemed as an unreactive fluid passing through the pervious concrete. However, when water was used as the testing fluid, the percolating water was accompanied by physical and chemical bindings. Water was prone to absorbing on the matrix surface, thereby reducing the local wetting angle. Those wetting surfaces reduced the viscous force and served as preferential routes for water passing through. Because of this wetting effect, the pressure difference influenced the water permeability less than the gas permeability (Figure 7) and because of this, the amount of water perforating through the pervious concrete samples tended to be greater than the amount of gas.
4.2. Standardizing the Permeability Test for Pervious Concrete
Water permeability has been widely measured in pervious concrete using the constant water head method [25,26,31,32]. The water permeability of pervious concrete is usually determined using several water heights, which represent the values that the pavement may encounter in reality. The measured average permeability is representative of pervious concrete. This type of permeability computation leads to different reported permeability values, even for the same sample, because the permeability tends to decrease with the pressure difference. A practical protocol is to test the permeability under a series of water heads and then regress the intrinsic permeability kv and the correlation coefficient b, according to Equation (13) [21,33]. Both of these values can be used as reference parameters to compare the permeability of different pervious concrete samples. The water heads should be kept at low magnitudes, such as < 20 cm. This is because there is very seldom water pooling on in situ pervious concrete surfaces. The purpose of using a low pressure gradient is also to encourage a laminar flow through the sample.
Although the gas permeability of normal concrete has been widely studied [25,31,34], there have been limited reports on the gas permeability of pervious concrete in the literature. This may be because the available experimental devices for measuring the gas permeability of normal concrete are not adapted for testing the permeability of pervious concrete. The gas permeability of pervious concrete can be measured reasonably when the gas flowing through the sample is gauged precisely. Since the gas permeability of pervious concrete nonlinearly decreases with an increase in the pressure gradient, it needs to be measured under a series of pressure gradients. The specific gas permeability at a given pressure difference can be estimated by either inter- or extrapolating the reported dataset.
5. Conclusions
Traditional gas permeameters are designed for normal concrete and are not suitable for pervious concrete. In this study, we introduced a simple experimental device to measure the gas permeability of pervious concrete under a steady flow. A venturi tube was used to measure the gas flow rate through the tested samples. It was found that the apparent gas permeability of a typical pervious concrete sample ranged from 10−10 to 10−9 m2, depending on the applied pressure. The measured gas permeability was found to be lower than the water permeability. This difference could be due to the wetting of internal pores by water, which reduced the surface tension between the fluid and the medium. Because of this reduction in surface tension, the seeping water needed to overcome lower viscous forces than the percolating gas. This phenomenon was contrary to the observations for normal concrete, for which the gas permeability is greater than the water permeability due to the gas slippage effect.
The measured apparent permeability of the pervious concrete samples decreased with increasing applied pressure and it increased linearly with the reciprocal of the pressure difference, which did not obey the Klinkenberg effect. This correlation helped us to characterize the intrinsic permeability, as well as the dependency of the apparent permeability on the porosity. The apparent permeability of a pervious concrete sample with a low porosity depended on the pressure difference more strongly.
It is necessary to standardize the measurement of the permeability of pervious concrete. Water permeability should be tested under a series of different water heads. The heads should be maintained at low pressures because there is seldom a lot of water pooling on concrete surfaces. Gas permeability should also be tested under different pressure gradients.
Author Contributions
Writing—original draft, G.W.; data analysis, K.T.; investigation, T.L.; funding acquisition, writing—review & editing, supervision, Y.Q. All authors have read and agreed to the published version of the manuscript.
Funding
The authors would like to thank the National Natural Science Foundation of China (51508114) and the Guangxi High-Level Innovation Team and Outstanding Scholars Program.
Conflicts of Interest
The author declares no conflict of interest.
References
- Tan, K.; Qin, Y.; Du, T.; Li, L.; Zhang, L.; Wang, J. Biochar from waste biomass as hygroscopic filler for pervious concrete to improve evaporative cooling performance. Constr. Build. Mater. 2021, 287, 123078. [Google Scholar] [CrossRef]
- Wang, J.; Meng, Q.; Zou, Y.; Qi, Q.; Tan, K.; Santamouris, M.; He, B.J. Performance synergism of pervious pavement on stormwater management and urban heat island mitigation: A review of its benefits, key parameters, and co-benefits approach. Water Res. 2022, 221, 118755. [Google Scholar] [CrossRef] [PubMed]
- Tan, K.; Qin, Y.; Wang, J. Evaluation of the properties and carbon sequestration potential of biochar-modified pervious concrete. Constr. Build. Mater. 2022, 314, 125648. [Google Scholar] [CrossRef]
- Wang, J.; Meng, Q.; Tan, K.; Santamouris, M. Evaporative cooling performance estimation of pervious pavement based on evaporation resistance. Build. Environ. 2022, 217, 109083. [Google Scholar] [CrossRef]
- ASTM C1701/C1701M-17a; Standard Test Method for Infiltration Rate of In Place Pervious Concrete. ASTM International: West Conshohocken, PA, USA, 2017. Available online: https://www.astm.org/c1701_c1701m-09.html (accessed on 30 March 2017).
- ASTM-D2434-68; Standard Test Method for Permeability of Granular Soils (Constant Head). ASTM International: West Conshohocken, PA, USA, 2019. Available online: https://www.astm.org/d2434-22.html (accessed on 1 October 2019).
- ASTM-D5084-03; Standard Test Method for Measurement of Hydraulic Conductivity of Saturated Porous Materials Using a Flexible Wall Permeameter. ASTM International: West Conshohocken, PA, USA, 2003. Available online: https://www.astm.org/d5084-16a.html (accessed on 1 November 2003).
- Park, S.B.; Lee, B.J.; Lee, J.; Jang, Y.I. A study on the seawater purification characteristics of water-permeable concrete using recycled aggregate. Resour. Conserv. Recycl. 2010, 54, 658–665. [Google Scholar] [CrossRef]
- Tho-In, T.; Sata, V.; Chindaprasirt, P.; Jaturapitakkul, C. Pervious high-calsium fly ash geopolymer concrete. Constr. Build. Mater. 2012, 30, 366–371. [Google Scholar] [CrossRef]
- Zhang, Y.; Li, H.; Abdelhady, A.; Yang, J. Comparative laboratory measurement of pervious concrete permeability using constant-head and falling-head permeameter methods. Constr. Build. Mater. 2020, 263, 120614. [Google Scholar] [CrossRef]
- Qin, Y.; Yang, H.; Deng, Z.; He, J. Water permeability of pervious concrete is dependent on the applied pressure and testing methods. Adv. Mater. Sci. Eng. 2015, 404136. [Google Scholar] [CrossRef]
- Qin, Y.; Liang, J.; Yang, H.; Deng, Z. Gas permeability of pervious concrete and its implications on the application of pervious pavements. Measurement 2016, 78, 104–110. [Google Scholar] [CrossRef]
- Innocentini, M.D.M.; Pandolfelli, V.C. Permeability of porous ceramics considering the Klinkenberg and Inertial Effects. J. Am. Ceram. Soc. 2001, 84, 941–944. [Google Scholar] [CrossRef]
- Loosveldt, H.; Lafhaj, Z.; Skoczylas, F. Experimental study of gas and liquid permeability of a mortar. Cement Concrete Res. 2002, 32, 1357–1363. [Google Scholar] [CrossRef]
- Klinkenberg, L.J. The permeability of porous media to liquid and gases. In Drilling and Production Practice; American Petroleum Institute: New York, NY, USA, 1941. [Google Scholar] [CrossRef]
- Qin, Y.; Zhang, M.; Mei, G. A new simplified method for measuring the permeability characteristics of highly porous media. J. Hydrol. 2018, 562, 725–732. [Google Scholar] [CrossRef]
- Ministry of Housing and Urban-Ural Construction of the People’s Republic of China. CJJ/T 135: TechnicalSpecification for Pervious Cement Concrete Pavement; Ministry of Housing and Urban-Ural Construction of the People’s Republic of China: Beijing, China, 2009. Available online: https://ishare.iask.sina.com.cn/f/11867439.html (accessed on 29 August 2022). (In Chinese)
- Lafhaj, Z.; Richard, G.; Kaczmarek, M.; Skoczylas, F. Experimental determination of intrinsic permeability of limestone and concrete: Comparison between in situ and laboratory results. Build. Environ. 2007, 42, 3042–3050. [Google Scholar] [CrossRef]
- Dhir, R.K.; Hewlett, P.C.; Chan, Y.N. Near-surface characteristics of concrete: Assessment and development of in situ test methods. Mag. Concrete Res. 1987, 39, 183–195. [Google Scholar] [CrossRef]
- Cather, R.; Figg, J.W.; Marsden, A.F.; O’Brien, T.P. Improvements to the Figg method for determining the air permeability of concrete. Mag. Concrete Res. 1984, 36, 241–245. [Google Scholar] [CrossRef]
- Picandet, V.; Khelidj, A.; Bastian, G. Effect of axial compressive damage on gas permeability of ordinary and high-performance concrete. Cement Concrete Res. 2001, 31, 1525–1532. [Google Scholar] [CrossRef]
- Tsivilis, S.; Tsantilas, J.; Kakali, G.; Chaniotakis, E.; Sakellariou, A. The permeability of Portland limestone cement concrete. Cement Concrete Res. 2003, 33, 1465–1471. [Google Scholar] [CrossRef]
- Katz, J. Introductory Fluid Mechanics; Cambridge University Press: Cambridge, UK, 2010; 432p. [Google Scholar]
- Ward, J.C. Turbulent flow in porous media. ASCE J. Hydraulic Div. 1964, 90, 1–12. [Google Scholar] [CrossRef]
- Montes, F.; Vlavala, S.; Haselbach, L.M. A New Test Method for Porosity Measurements of Portland Cement Pervious Concrete. J. ASTM Int. 2005, 2, 1–13. [Google Scholar]
- Kevern, J.; Schaefer, V.R.; Wang, K.; Suleiman, M. Pervious Concrete Mixture Proportions for Improved Freeze-Thaw Durability. J. ASTM Int. 2008, 5, 1–12. [Google Scholar]
- Schaefer, V.R.; Wang, K. Mix Design Development for Pervious Concrete in Cold Weather Climates. Iowa Department of Transportation. Highway Division, 2006. Available online: www.perviouspavement.org/downloads/Iowa.pdf (accessed on 29 August 2022).
- Edvardsen, C. Water permeability and autogeneous healing of cracks in concrete. ACI Mater. J. 1999, 96, 448–454. [Google Scholar]
- Hearn, N. Self-sealing, autogeneous healing and continued hydration: What is the difference? Mater. Struct. 1998, 31, 563–567. [Google Scholar] [CrossRef]
- Hearn, N.; Morley, C.T. Self-sealing property of concrete--experimental evidence. Mater. Struct. 1997, 30, 404–411. [Google Scholar] [CrossRef]
- Yang, J.; Jiang, G. Experimental study on properties of pervious concrete pavement materials. Cem. Concr. Res. 2003, 33, 381–386. [Google Scholar] [CrossRef]
- Deo, O.; Sumanasooriya, M.; Neithalath, N. Permeability Reduction in Pervious Concretes due to Clogging: Experiments and Modeling. J. Mater. Civ. Eng. 2010, 22, 741–751. [Google Scholar] [CrossRef]
- Alarcon-Ruiz, L.; Brocato, M.; Dal Pont, S.; Feraille, A. Size Effect in Concrete Intrinsic Permeability Measurements. Transp. Porous Med. 2010, 85, 541–564. [Google Scholar] [CrossRef]
- Montes, F.; Haselbach, L. Measuring hydraulic conductivity in pervious concrete. Environ. Eng. Sci. 2006, 23, 960–969. [Google Scholar] [CrossRef]
Figure 1.
The prepared pervious concrete samples (a) cylindrical sample is drilled from the specimen; (b) Drilled samples.
Figure 1.
The prepared pervious concrete samples (a) cylindrical sample is drilled from the specimen; (b) Drilled samples.

Figure 2.
The instrument for measuring the permeability of the pervious concrete samples: (a) schematic outline; (b) laboratory setup.
Figure 2.
The instrument for measuring the permeability of the pervious concrete samples: (a) schematic outline; (b) laboratory setup.

Figure 3.
A schematic diagram of the test device for testing the permeability of normal concrete.

Figure 4.
The developed apparatus to measure the gas permeability of pervious concrete: (a) schematic outline; (b) laboratory setup.
Figure 4.
The developed apparatus to measure the gas permeability of pervious concrete: (a) schematic outline; (b) laboratory setup.

Figure 5.
A schematic diagram of the venturi tube.

Figure 6.
The permeability and pressure gradients of the pervious concrete samples.

Figure 7.
The measured values of the permeability of the pervious concrete samples and the reciprocals of the pressure differences.
Figure 7.
The measured values of the permeability of the pervious concrete samples and the reciprocals of the pressure differences.


Table 1.
The mixture proportions of the pervious concrete samples (kg/m3).
| Sample | Cement | Water | Aggregate | Water Reducer |
|---|---|---|---|---|
| w/c = 0.25 | 523.16 | 130.79 | 1509.00 | 1.40 |
| w/c = 0.28 | 486.35 | 136.18 | 1509.00 | 1.40 |
Table 2.
The permeability of the pervious concrete samples and the regressed coefficients.
| Sample | kv (m2) | b (KPa) | R2 | Porosity | Density | ||||
|---|---|---|---|---|---|---|---|---|---|
| Water | Gas | Water | Gas | Water | Gas | (%) | (kg/m3) | ||
| Mix1 | No.1 | 12.43 | 3.77 | 0.22 | 1.08 | 0.931 | 0.986 | 31.59 | 1731 |
| No.2 | 8.06 | 2.00 | 0.25 | 1.98 | 0.916 | 0.997 | 28.19 | 1767 | |
| Mix2 | No.1 | 7.56 | 1.74 | 0.31 | 2.56 | 0.930 | 0.956 | 26.59 | 1802 |
| No.2 | 4.96 | 1.09 | 0.35 | 3.01 | 0.929 | 0.998 | 25.64 | 1828 | |
Publisher’s Note: MDPI stays neutral with regard to jurisdictional claims in published maps and institutional affiliations. |
© 2022 by the authors. Licensee MDPI, Basel, Switzerland. This article is an open access article distributed under the terms and conditions of the Creative Commons Attribution (CC BY) license (https://creativecommons.org/licenses/by/4.0/).
Share and Cite
MDPI and ACS Style
Wei, G.; Tan, K.; Liang, T.; Qin, Y. A Comparative Study on Water and Gas Permeability of Pervious Concrete. Water 2022, 14, 2846. https://doi.org/10.3390/w14182846
AMA Style
Wei G, Tan K, Liang T, Qin Y. A Comparative Study on Water and Gas Permeability of Pervious Concrete. Water. 2022; 14(18):2846. https://doi.org/10.3390/w14182846
Chicago/Turabian StyleWei, Gang, Kanghao Tan, Tenglong Liang, and Yinghong Qin. 2022. "A Comparative Study on Water and Gas Permeability of Pervious Concrete" Water 14, no. 18: 2846. https://doi.org/10.3390/w14182846
Note that from the first issue of 2016, this journal uses article numbers instead of page numbers. See further details here.