Article

Implications of Bacterial Adaptation to Phenol Degradation under Suboptimal Culture Conditions Involving Stenotrophomonas maltophilia KB2 and Pseudomonas moorei KB4

Institute of Biology, Biotechnology and Environmental Protection, Faculty of Environmental Science, University of Silesia, 40-032 Katowice, Poland
*
Authors to whom correspondence should be addressed.
Water 2022, 14(18), 2845; https://doi.org/10.3390/w14182845
Submission received: 8 August 2022 / Revised: 5 September 2022 / Accepted: 8 September 2022 / Published: 12 September 2022
(This article belongs to the Special Issue Ecotoxicity of Wastewater in Urban and Industrial Areas)

Abstract

:
Despite the well-described abundance of phenol-degrading bacteria, knowledge concerning their degradation abilities under suboptimal conditions is still very limited and needs to be expanded. Therefore, this work aimed to study the growth and degradation potential of Stenotrophomonas maltophilia KB2 and Pseudomonas moorei KB4 strains toward phenol under suboptimal temperatures, pH, and salinity in connection with the activity of catechol dioxygenases, fatty acid profiling, and membrane permeability. The methodology used included: batch culture of bacteria in minimal medium supplemented with phenol (300 mg/L), isolating and measuring the activity of catechol 1,2- and 2,3-dioxygenases, calculating kinetic parameters, chromatographic analysis of fatty acid methyl esters (FAMEs) and determining the membrane permeability. It was established that the time of phenol utilisation by both strains under high temperatures (39 and 40 °C) proceeded 10 h; however, at the lowest temperature (10 °C), it was extended to 72 h. P. moorei KB4 was more sensitive to pH (6.5 and 8.5) than S. maltophilia KB2 and degraded phenol 5–6 h longer. Salinity also influenced the time of phenol removal. S. maltophilia KB2 degraded phenol in the presence of 2.5% NaCl within 28 h, while P. moorei KB4 during 72 h. The ability of bacteria to degrade phenol in suboptimal conditions was coupled with a relatively high activity of catechol 1,2- and/or 2,3-dioxygenases. FAME profiling and membrane permeability measurements indicated crucial alterations in bacterial membrane properties during phenol degradation leading predominantly to an increase in fatty acid saturation and membrane permeability. The obtained results offer hope for the potential use of both strains in environmental microbiology and biotechnology applications.

1. Introduction

Phenol and its derivatives are the most common organic compounds occurring in nature. They may come from natural sources or be the product of human activity. Natural phenolic compounds are formed during plant vegetation, soil microbial activity, soil leachates, decomposition of dead animals and plants, and residues from forest fires [1]. However, coal mining, coke oven plants, refining and processing petroleum, or natural gas are the leading industries in discharging phenolic compounds into various ecosystems [2]. These toxicants are also released into the environment while producing phenolic resins for the construction, automotive and appliance industries, disinfectants, and medicines [3]. Likewise, the effluents of the textile, leather, pulp and paper, paint, and wood processing industries are loaded with high phenol concentrations [4]. According to the report “Global Phenol Market—Industry Trends and Forecast to 2029” by Data Bridge Market Research, the global phenol market was valued at 22.97 billion USD in 2021 and is expected to reach 30.72 billion USD by 2029 [5]. These values correspond to the phenol production of 11.37 million metric tons in 2021 and an estimated 14.07 million metric tons by 2029 [6]. It is worth pointing out that COVID-19 harmed the phenol market. A decline in the demand for phenol was witnessed owing to the limited production and shutdown of industries, such as household products and other chemicals. However, the nylon market is expected to grow in demand after the post-COVID-19 situation [5].
The extensive use of phenol in many sectors of the economy and its release into various ecosystems, such as soil, water, sewage, and leachate, has raised global concern about their adverse effects on living organisms, including microorganisms. Phenol and other related compounds may damage DNA and protein systems in the cells, inhibit the synthesis of ATP by generating reactive oxygen species, cause serious oxidative damage to the lipids, enhance membrane permeability to protons, alter the transmembrane pH gradients, and even cause cell death [7,8,9]. Due to these adverse effects of phenolic compounds on organisms, their effective removal from contaminated sites is a mandatory task.
Several processes have been proposed for treating phenol-contaminated environments. Among them, microbial degradation is the most promising, eco-friendly, economically cheap, and practically feasible compared to the current conventional physicochemical methods [10,11,12]. The particular focus on the microbial degradation of phenol in recent years has resulted in the isolation, culture, adaptation, and enrichment of many microorganisms that can grow on this compound as a sole carbon and energy source. Among bacteria, the following new strains: Pseudomonas fredriksbergsis [13], Bacillus sp. IARI-J-20 [14], Pseudomonas putida P53 and Arthrobacter scleromae P69 [15], Rhodococcus aetherivorans [16], Rhodococcus pyridinivorans [17], and Glutamicibacter nicotianae MSSRFPD35 [11] can aerobically degrade phenol in the concentration range from 225 to 1800 mg/L. Although microbial degradation of phenol is a widely accepted and used practice among bioremediation approaches that can lead to the complete mineralisation of phenol to CO2 and H2O, it has many limitations. The degradative properties of many phenol-degrading bacteria have been characterised in detail under optimal laboratory conditions; however, knowledge of their ability to degrade phenol under suboptimal conditions is relatively scarce. After all, besides chemical stress, bacteria in various ecosystems are systematically exposed to unfavourable abiotic factors, such as temperature fluctuations, changes in acidity, osmotic pressure, dissolved oxygen, salinity, and limited availability of nutrients [18,19]. Therefore, one of the leading trends in soil and wastewater treatment with biological methods should be the screening of microorganisms capable of effectively eliminating pollutants under unfavourable and even extreme physicochemical conditions.
Microorganisms can adapt to the presence of toxic organic compounds, including phenol, by using a whole cascade of adaptive mechanisms. Among them, the essential bacteria responses are alternations in the composition and fluidity of cell membranes, including saturation-rigidification, cis/trans isomerisation, formation of a cyclopropane ring, anteiso/iso branching, synthesis of cardiolipin, production of stress proteins, and using efflux pump [20,21,22,23]. Bacteria also have remarkable adaptive abilities that enable them to survive harsh and highly variable abiotic parameters, including temperature, pH, and salinity changes. These adaptation mechanisms include the expression of heat/cold shock proteins, production of protective compatible solutes, or altered metabolism [24,25,26]. Generally, the primary strategy employed by bacteria in an acidic environment is to maintain a constant cytoplasmic pH value by limiting the influx of protons through highly impermeable cell membranes, modulating the size of membrane channels, and maintaining the integrity and fluidity of cell membranes by changing fatty acid composition [23]. However, alkali-tolerance and alkaliphily include elevated levels of transporters and enzymes that promote proton capture and retention (e.g., the ATP synthase and monovalent cation/proton antiporters), increased acid production, as well as the changes in the cell surface layers leading to cytoplasmic proton retention [27]. In turn, microorganisms’ main adaptive/tolerance mechanisms to stress caused by salinity are accumulating osmolytes, such as proline and glycine betaine, and potassium cations as the most common inorganic solutes [28]. Regarding membrane adaptation, Arthrobacter chlorophenolicus adapted to differences in phenol concentrations and temperature by altering the anteiso/iso ratio of fatty acids in the cell membrane [29]. By comparison, high temperature, pH fluctuations, and salinity caused the increase in cyclopropane fatty acid percentages in Pseudomonas putida KB3, leading to a decrease in membrane permeability [30]. Interestingly, Rhodococcus opacus PWD4, responded to NaCl by increasing the ratio between mycolic acids and membrane phospholipid fatty acids, while under NaCl and 4-chlorophenol treatment, the average chain length and the unsaturation index decreased [31].
The physicochemical properties of wastewater can vary greatly depending on its origin. In a temperate climate, sewage from urban agglomerations is usually characterised by a pH close to neutral or slightly alkaline [32], and most sewage treatment plants’ operating temperature is 10–20 °C, not exceeding 30 °C [33,34,35]. Mining and many sectors of the chemical, food, and pharmaceutical industries have released wastewater characterised by high salinity to various ecosystems in recent years and raised global concern about its negative impact on living organisms. The salt content ranges from 2% to 20%, although oil and gas production can generate wastes with a salt content of up to 40% [36,37]. The presented exemplary physicochemical properties of wastewater assume non-optimal values for the biodegradation processes of aromatic compounds.
Due to the still scarce information on phenol degradation by bacteria in suboptimal culture conditions and defence mechanisms regarding changes in membrane properties, including fatty acid composition and membrane permeability, it was worth investigating these issues to gain new knowledge about the responses of bacteria metabolism to stress-related conditions. Accordingly, the main goals of this work included: (1) studying and comparing the degradative potential of Stenotrophomonas maltophilia KB2 and Pseudomonas moorei KB4 strains toward phenol degradation in suboptimal temperature, pH, and salinity; (2) calculating the main kinetic parameters of phenol utilisation; (3) measuring the activity of catechol 1,2- and 2,3-dioxygenase; (4) evaluating the changes in fatty acid profiles and membrane permeability, and (5) establishing statistical dependencies between measured parameters. Both strains of bacteria were isolated from activated sludge from two separate municipal wastewater treatment plants in Upper Silesia, Poland. S. maltophilia KB2 comes from the sewage treatment plant in Bytom, while P. moorei KB4 derives from the sewage treatment plant in Katowice. These strains are potential candidates for bioaugmentation of environments contaminated with harmful aromatic compounds. S. maltophilia KB2 can degrade phenol and its methylated derivatives, benzoate and its hydroxylated derivatives [38], and it cometabolises monochloro- and mononitrophenols [39,40]. In turn, P. moorei KB4 is capable of cometabolising paracetamol and diclofenac in the presence of glucose [41,42].

2. Materials and Methods

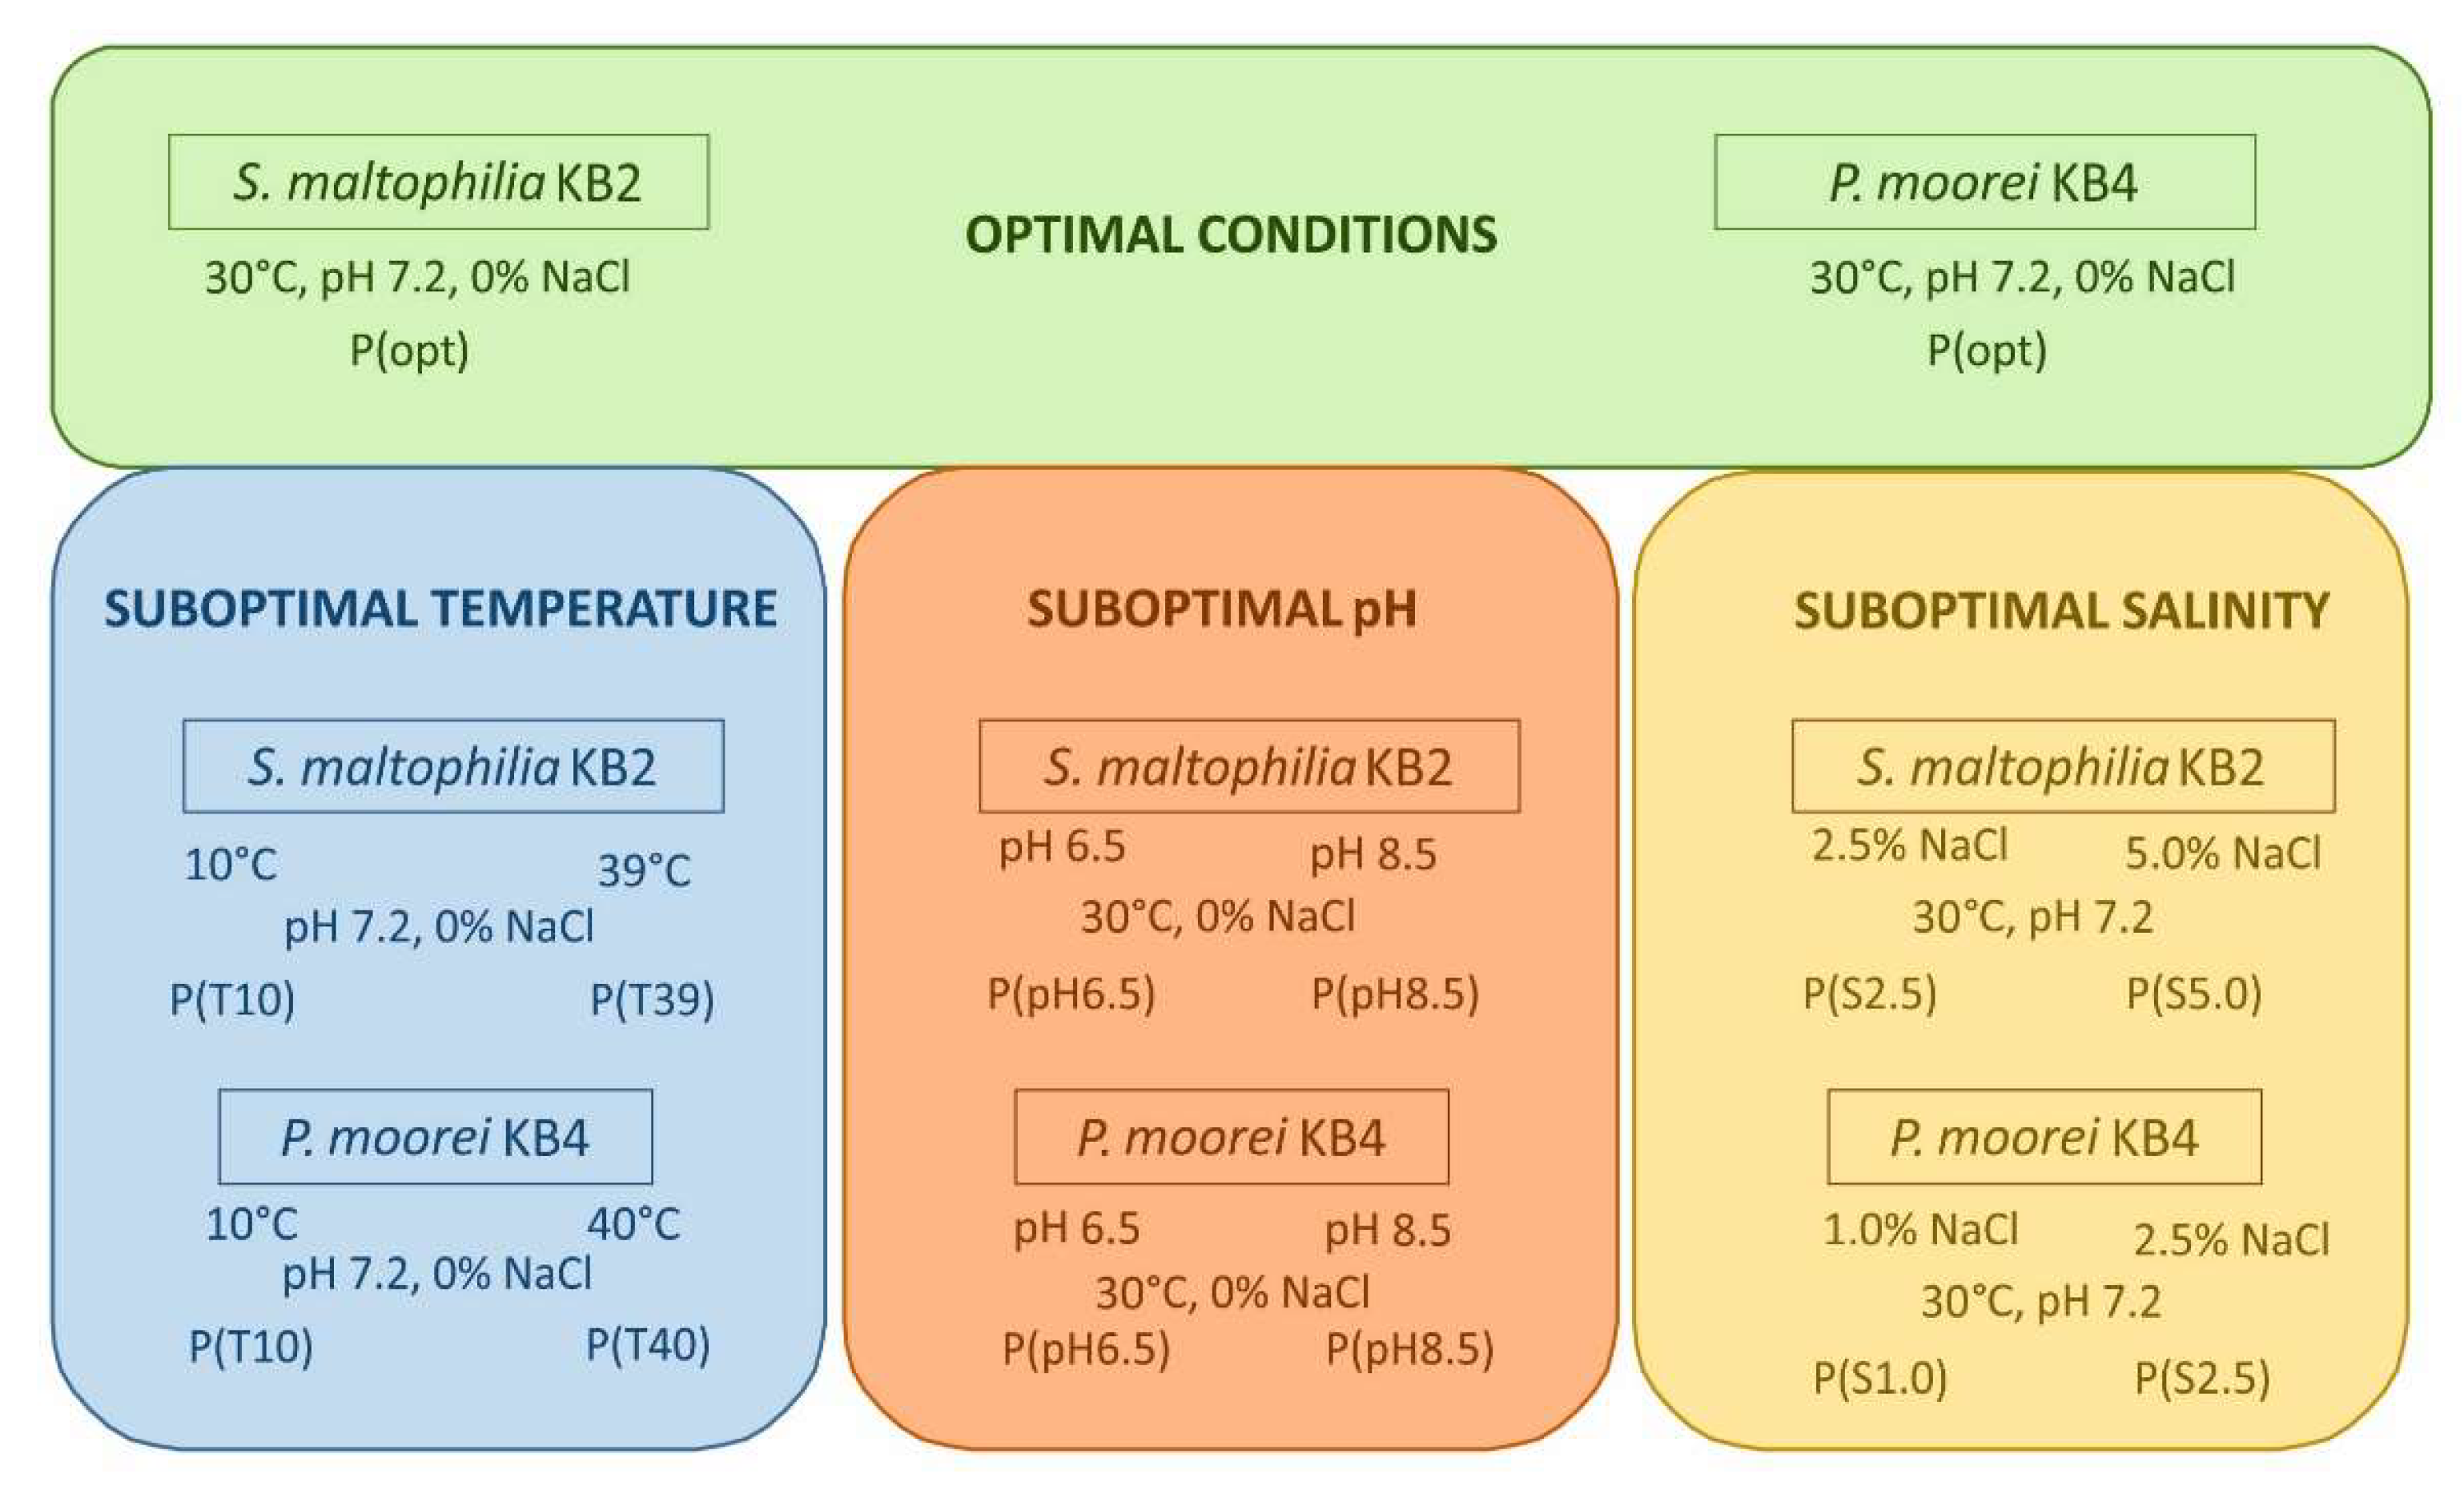
2.1. Bacterial Strains and Experimental Conditions

This study was conducted using two bacterial strains: Stenotrophomonas maltophilia KB2 (VTT E-113197) and Pseudomonas moorei KB4 derived from the VTT Culture Collection in Finland and the Microbial Culture Collection in the Institute of Biology, Biotechnology and Environmental Protection, the University of Silesia, Poland, respectively. To date, all experiments using these strains have been conducted under optimal physicochemical conditions (temperature 30 °C and pH 7.2).
To investigate how the suboptimal circumstances, including temperature, pH, and salinity affect the phenol degradation by the tested strains, the following culture conditions were experimentally established: the lowest temperature was 10 °C, and the highest temperatures were 39 °C for S. maltophilia KB2 and 40 °C for P. moorei KB4; the extreme pH were 6.5 and 8.5, and the suboptimal concentrations of NaCl were 1.0 and 2.5% for P. moorei KB4 and 2.5 and 5% for S. maltophilia KB2. On the basis of previous studies, it was suspected that these conditions would either partially inhibit or slow down the metabolism of the bacteria [30]. A detailed diagram showing the culture conditions of both strains illustrates Figure 1. The growth of bacteria in 250 mL of mineral salt medium [43] enriched with phenol (300 mg/L) under shaking conditions (130 rpm) was measured as the culture optical density (OD600). The initial OD600 of all cultures was 0.12 ± 0.02. When floc formation occurred in a part of P. moorei KB4 cultures, the samples were carefully pipetted immediately before measuring OD600. The bacterial cells were harvested from the exponential growth phase for appropriate analysis, determined individually for each strain and specific culture conditions.

2.2. The Phenol Concentration Determination

The phenol concentration in the bacteria cultures was determined using a colorimetric assay with diazoate p-nitroaniline [44]. Prior to analysis, bacterial cultures were centrifuged (12,000 rpm, 5 min). Next, to 0.5 mL of obtained supernatant the following reagents were added: diazoate p-nitroaniline (0.5 mL), 10% Na2CO3 (0.25 mL), 10% NaOH (0.5 mL) and deionized water (1.25 mL). The blank sample contained 0.5 mL of distilled water instead of the supernatant. The absorbances measured at λ = 550 nm were used to calculate phenol concentration. The calibration curve for phenol concentrations in the range of 0 to 94 mg/L was described by the equation y = 0.691x (R2 = 0.997).

2.3. The Catechol Dioxygenase Activity Determination

During the degradation studies, the activities of catechol 1,2-dioxygenase (EC 1.13. 11.1) (1,2-D) and catechol 2,3-dioxygenase (EC 1.13.11.2) (2,3-D) were measured. The crude extract preparation and measurements of enzyme activities were performed according to Wojcieszyńska et al. [39]. Briefly, in the preliminary stage of isolation of the enzyme fraction, the bacterial cultures were harvested by centrifugation (5000 rpm, 20 min, 4 °C), the pellet was washed with 50 mM phosphate buffer, pH 7.0, centrifuged again, and resuspended with the same buffer. This step permitted the removal of residual phenol. Cell extract was sonicated (6 times for 15 s, with 30 s breaks with a frequency of 20 kHz) of the whole-cell suspension and centrifuged (10,000 rpm, 4 °C, 30 min). The obtained supernatant was used as a crude extract for further enzyme assays. One unit of the specific enzyme activity was calculated as the amount of enzyme required to generate one µmol of product per minute. Finally, the activity of catechol 1,2-D and 2,3-D was expressed as mU/mL.

2.4. Determining the Whole-Cell Derived Fatty Acid Composition

Fatty acid methyl esters (FAMEs) analysis was used to study and compare the composition of whole-cell-derived fatty acids of the tested strains cultured in optimal and suboptimal conditions. Fatty acids were directly extracted from phenol-degrading bacteria in the late exponential phase of growth according to the protocol of Sasser [45]. Briefly, the sample processing included five steps: harvesting bacterial biomass by centrifugation (5000 rpm, 20 min, 4 °C), saponification (5 g sodium hydroxide, 150 mL methanol, and 150 mL distilled water), methylation (325 mL 6N hydrochloric acid and 275 mL methyl alcohol), extraction (200 mL hexane and 200 mL methyl tert-butyl ether) and a base wash (0.8 g sodium hydroxide in 900 mL distilled water).
The isolated FAMEs were separated with a gas chromatograph (Hewlett-Packard 6890) equipped with an HP-Ultra 2 capillary column (25 m, 0.22 mm ID). Hydrogen was used as a carrier gas with a flow velocity of 0.54 mL/min; inlet pressure was 10.7 psi (71.33 kPa), and the injection volume of the sample was 2 µL. The initial oven temperature was 170 °C and ramped (5 °C/min) to 260 °C. FAMEs were detected by a flame ionisation detector (FID) and identified using the MIDI Microbial Identification System software (Sherlock TSBA 6.1 method and TSBA6 library; MIDI Inc., Newark, DE, USA).
Before the final analysis of the results, all isolated fatty acids were divided into two groups: saturated (SAT) and unsaturated (UNSAT) fatty acids. The ratio of SAT to UNSAT fatty acids was calculated for each culture. For statistical data exploration, saturated fatty acids were further divided into straight-chain (St), branched (Br), hydroxy acids (Hy), and cyclopropane (Cy) fatty acids.
The mean fatty acid chain length (Mean FA) was expressed by the following equation, according to Yang et al. [20]:
M e a n   F A = % F A × C / 100
where: % FA is the percentage of fatty acid, and C is the number of carbon atoms. To prevent the alterations caused by fatty acids occasionally detected, the analysis of FAMEs included only fatty acids with a content of at least 1%.

2.5. Measuring the Membrane Permeability

The membrane permeability (MP) of the bacteria was measured using a water solution of crystal violet (0.1 mg/mL) according to the protocol by Halder et al. [46]. Bacterial cells from the late exponential growth phase were centrifuged (5000 rpm, 20 min, 4 °C) and washed with the mineral salt medium. Bacterial biomass was resuspended in the same medium to fit the optical density of approximately 1.0. Next, 0.95 mL of the obtained cell suspension was mixed with 50 µL of crystal violet. The samples were incubated at 30 °C for 10 min and centrifuged (13,000 rpm, 15 min). The MP was calculated according to the equation and expressed as the percentage of crystal violet uptake:
M P = A v i o l e t A s a m p l e A v i o l e t × 100 %  
where: Asample—the optical density of the supernatant measured at a wavelength of 590 nm. Aviolet—the optical density of the crystal violet solution considered as 100% (0.95 mL of mineral salts medium and 50 µL of crystal violet at a concentration of 0.1 mg/mL).

2.6. Data Analysis

The degradation rate constant (k) of phenol was determined using the algorithm,
C t C 0 = e k t
where: C0 was the substrate concentration at time 0, and Ct was the substrate concentration at time t.
The calculations of phenol decomposition parameters omitted the results obtained from the period when the bacterial culture was in the adaptation phase. In the remaining scope, the degradation curve was characterised by an exponential decay described by first-order kinetics.
The average degradation rate (V) of phenol was calculated by dividing the net amount of the degraded compound between t and 0. The theoretical disappearance time (DT50) was calculated from the linear equation obtained from the regression between the phenol concentration and time.
The results were evaluated by analysis of variance, and statistical analyses were performed on three replicates of data obtained from each treatment. The statistical significance (p < 0.05) of differences was treated by one-way ANOVA, considering the effect of treatment, and assessed by post-hoc comparison of means using the lowest significant differences (LSD test).
FAME profiles were subjected to principal component analysis (PCA). Moreover, cluster analysis was applied to evaluate how closely associated different culture conditions were over the whole set of data. PCA analysis and Pearson’s r correlation coefficient (p < 0.05) were calculated to determine the linear dependence of all variable values.
All statistical studies were conducted using MS Office 2019 (Microsoft Inc., Redmond, WA, USA) and the STATISTICA 13.1 software package (TIBCO Software Inc., Palo Alto, CA, USA).

3. Results

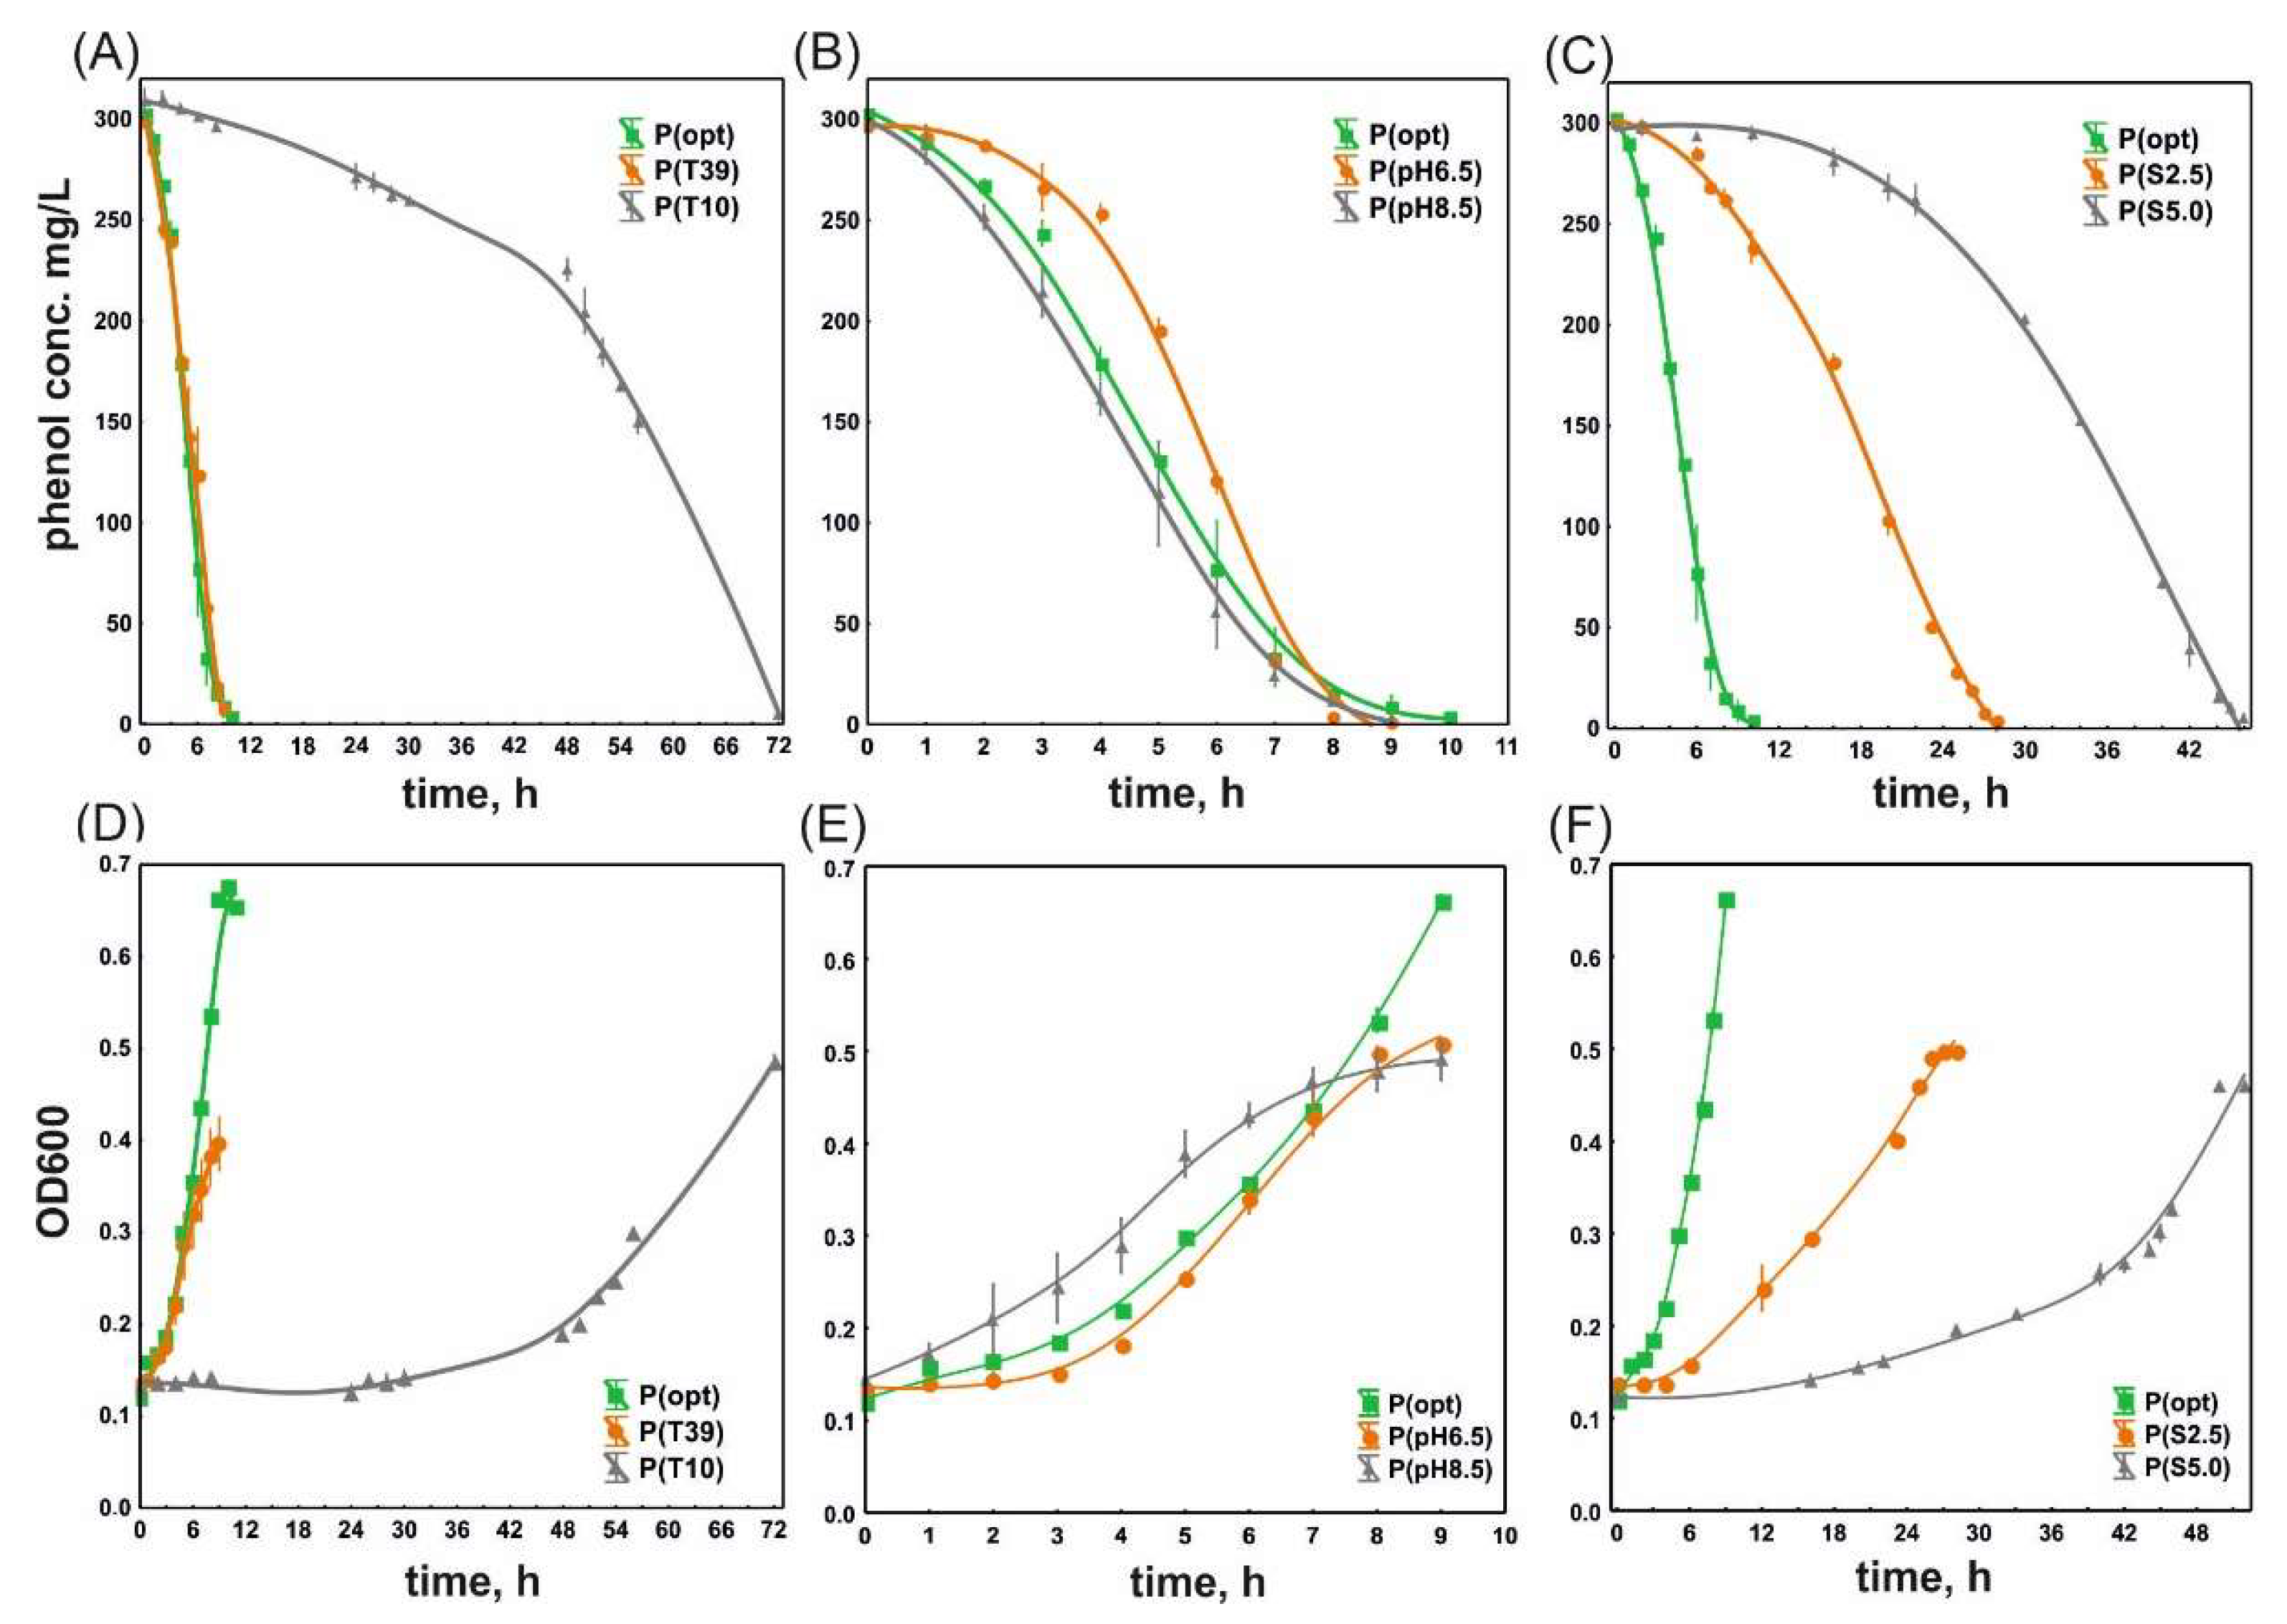
3.1. Phenol Degradation and the Growth of S. maltophilia KB2 and P. moorei KB4 under Optimal and Suboptimal Culture Conditions

The preliminary studies indicated the suboptimal growth conditions for phenol degradation (300 mg/L) by tested bacterial strains. The main difference between both bacterial strains was the sensitivity to salinity. S. maltophilia KB2 grew and degraded phenol in the presence of 5.0% NaCl, while P. moorei KB4 showed this ability in the culture with 2.5% NaCl. The highest temperature tested for S. maltophilia KB2 was 39 °C; however, for P. moorei KB4 it was 40 °C. The other boundary pH conditions were the same for both bacterial strains (6.5 and 8.5).
In the optimal conditions, the time of phenol degradation by both bacteria (Figure 2A–C and Figure 3A–C) and the kinetic parameters of phenol removal (Table 1) were comparable. The time of phenol utilisation by both strains at the optimal and suboptimal temperatures was also similar (10 h), but it was extended to 72 h at 10 °C (Figure 2A and Figure 3A). Interestingly, the salinity strongly influenced the time of phenol removal. S. maltophilia KB2 degraded phenol within 28 h in the presence of 2.5% NaCl (Figure 2C), while P. moorei KB4—during 72 h (Figure 3C), which was reflected in the evident differences in the kinetic parameters of the phenol degradation rate. The disappearance rate (V) of phenol calculated for S. maltophilia KB2 was three times higher, and the disappearance time of 50% of phenol (DT50) was five times longer than for P. moorei KB4 (Table 1). Even at 5% salinity, S. maltophilia KB2 degraded phenol faster (10.07 ± 0.23 mg/L h) than P. moorei KB4 (3.97 ± 0.16 mg/L h) in the presence of 2.5% NaCl. P. moorei KB4 was also more sensitive to the pH of the medium (Figure 2B and Figure 3B). When the pH of the culture was 6.5, it degraded phenol significantly slower (36.16 ± 2.81 mg/L h) than S. maltophilia KB2 (62.33 ± 0.83 mg/L h). It is worth mentioning that when phenol was added to P. moorei KB4 culture, flocs of clumped bacteria appeared after 3 h of incubation under pH 8.5, temperature 10 °C, and salinity (1% and 2.5% NaCl). These flocks disappeared when the phenol was lost in the bacterial culture.
The essential changes in the bacteria growth during phenol degradation were also noticed under optimal and suboptimal conditions. The growth curves of both strains had a similar course at the suboptimal temperatures; however, bacteria reached a log phase only at 10 °C. At 39 and 40 °C, this phase did not appear (Figure 2D and Figure 3D). At pH 6.5, the lag phases of S. maltophilia KB2 (Figure 2E) and P. moorei KB4 (Figure 3E) lasted 3 and 6 h, followed by the growth up to OD600 = 0.5 ± 0.03 and 0.049 ± 0.01, respectively. After 28 h of exposure to 2.5% NaCl, the OD600 of S. maltophilia KB2 cells increased from an initial 0.12 ± 0.02 to 0.49 ± 0.01 (Figure 2F), whereas the growth of P. moorei KB4 was negligible (Figure 3F). The increase in the OD600 of P. moorei KB4 cells to a similar value of 0.45 was only achieved after 72 h of incubation.

3.2. The Activity of Catechol 1,2- and 2,3-dioxygenase in Bacterial Cells under Different Temperatures, pH, and Salinity

Simultaneously with phenol degradation studies, the activity of 1,2-D and 2,3-D in bacterial cells was measured. It was found that phenol induced only catechol 2,3-D in S. maltophilia KB2; however, in P. moorei KB4 exposed to different culture conditions, 1,2-D and 2,3-D were active (Table 2). The highest activities of these enzymes were calculated for both strains cultured at 30 °C and pH 7.2, confirming that these conditions were optimal for phenol degradation. The exposure of S. maltophilia KB2 to all suboptimal conditions caused a significant decrease in catechol 2,3-D activity. The lowest activity of this enzyme (85 ± 50 mU/mL) in bacteria cells was determined at 10 °C. Similarly, the suboptimal conditions caused the decrease in catechol 1,2-D activity in P. moorei KB4 except for pH 8.5 and 2.5% salinity when this enzyme was inactive. Surprisingly, under the above conditions, catechol 2,3-D in these bacteria exhibited a very high activity level (189.2 ± 33.2 and 171.2 ± 62.2 mU/mL, respectively) (Table 2).

3.3. Changes in FAME Profiles of Bacteria under Various Growth Conditions

The detailed analysis of FAME profiles of S. maltophilia KB2 and P. moorei KB4 under different culture conditions indicated that suboptimal high and low temperatures and salinity had the most significant impact on their fatty acid composition. It was established that all tested conditions significantly affected the FAME profiling of S. maltophilia KB2 than P. moorei KB4. The exposure of these cells to 10 °C caused an increase in the content of 12:0, 12:0 3OH and unsaturated 16:1 ω7c and 18:1 ω7c fatty acids. In turn, the presence of 2.5% NaCl increased the abundance of cyclopropane 19:0 cyω8c and 17:0 cy fatty acids (Figure 4A,B). FAME profiles of the cells growing at the highest temperature (40 °C), salinity (5%) and both pH (6.5 and 8.5) were similar and were characterised by lower participation of unsaturated and hydroxylated fatty acids compared to the profiles of the cells cultured in the optimal conditions. The ratio of SAT/UNSAT showed a decrease in the value of this parameter calculated for the cells exposed to the lowest temperature resulting from the decline in the 16:1 ω7c and 18:1 ω7c fatty acids percentages (Table 3). The most significant increase by 4.7-fold in this parameter value was recorded for bacteria exposed to 2.5% NaCl compared to its value for the cells cultured in the optimal conditions. These alternations were also reflected in the mean chain fatty acid length (Table 3). The exposure of bacteria to the high temperature (39 °C) and salinity (2.5%) increased this parameter value from 15.70 ± 0.02 to 16.03 ± 0.02 and 15.99 ± 0.03, respectively.
Comparing, the principal component analysis (PCA) showed that salinity (1 and 2.5%) and high pH (8.5) caused the significant changes in the fatty acid composition of P. moorei KB4 manifested in the increase in the participation of 12:0, 14:0 and 17:0 cy. The low temperature (10 °C) increased the contents of hydroxylated 10:0 3OH, 12:0 2OH, 12:0 3OH fatty acid, while the high temperature (40 °C) increased 18:0 fatty acid abundance (Figure 4C,D). Obviously, the changes found affected the ratio of SAT/ UNSAT. It was the highest (4.79 ± 0.02, 3.66 ± 0.02, and 3.77 ± 0.00) for the cells cultured under 1.0 and 2.5% salinity and pH 8.5, respectively (Table 3). The mean fatty acid chain length analysis indicated a significant increase in this parameter from 15.59 ± 0.12 for the cells cultured in optimal conditions to 16.02 ± 0.06 for the cells exposed to 40 °C and its decrease to 15.05 ± 0.06 for the cells exposed to 1.0% NaCl (Table 3).

3.4. Membrane Permeability of Bacteria under Various Culture Conditions

The bacterial membrane permeability (MP) was measured parallel with the FAME analysis. It is worth emphasising that the MP of the S. maltophilia KB2 under optimal conditions was almost twice as higher as the MP of P. moorei KB4 (Table 4). Under suboptimal conditions, the MP of S. maltophilia KB2 increased significantly during culture with phenol under high and low temperatures (10 and 39 °C) and high pH (8.5). The permeability values under these conditions varied between 57.10 ± 2.09–60.95 ± 3.22% compared to 52.66 ± 2,33% under optimal conditions (Table 4). Contrary, the cells exposed to low pH (6.5) decreased membrane permeability by 8.87%. It was also established that membranes of P. moorei KB4 were more permeable under all suboptimal conditions than their permeability under optimal conditions. The greatest increase in MP of these bacteria by 61.54 and 65.09% concerning the corresponding values under optimal conditions occurred in the cells exposed to 2.5 and 5% salinity. In comparison, the lowest increase of 14.2% was evidenced in the cells incubated at pH 6.5.

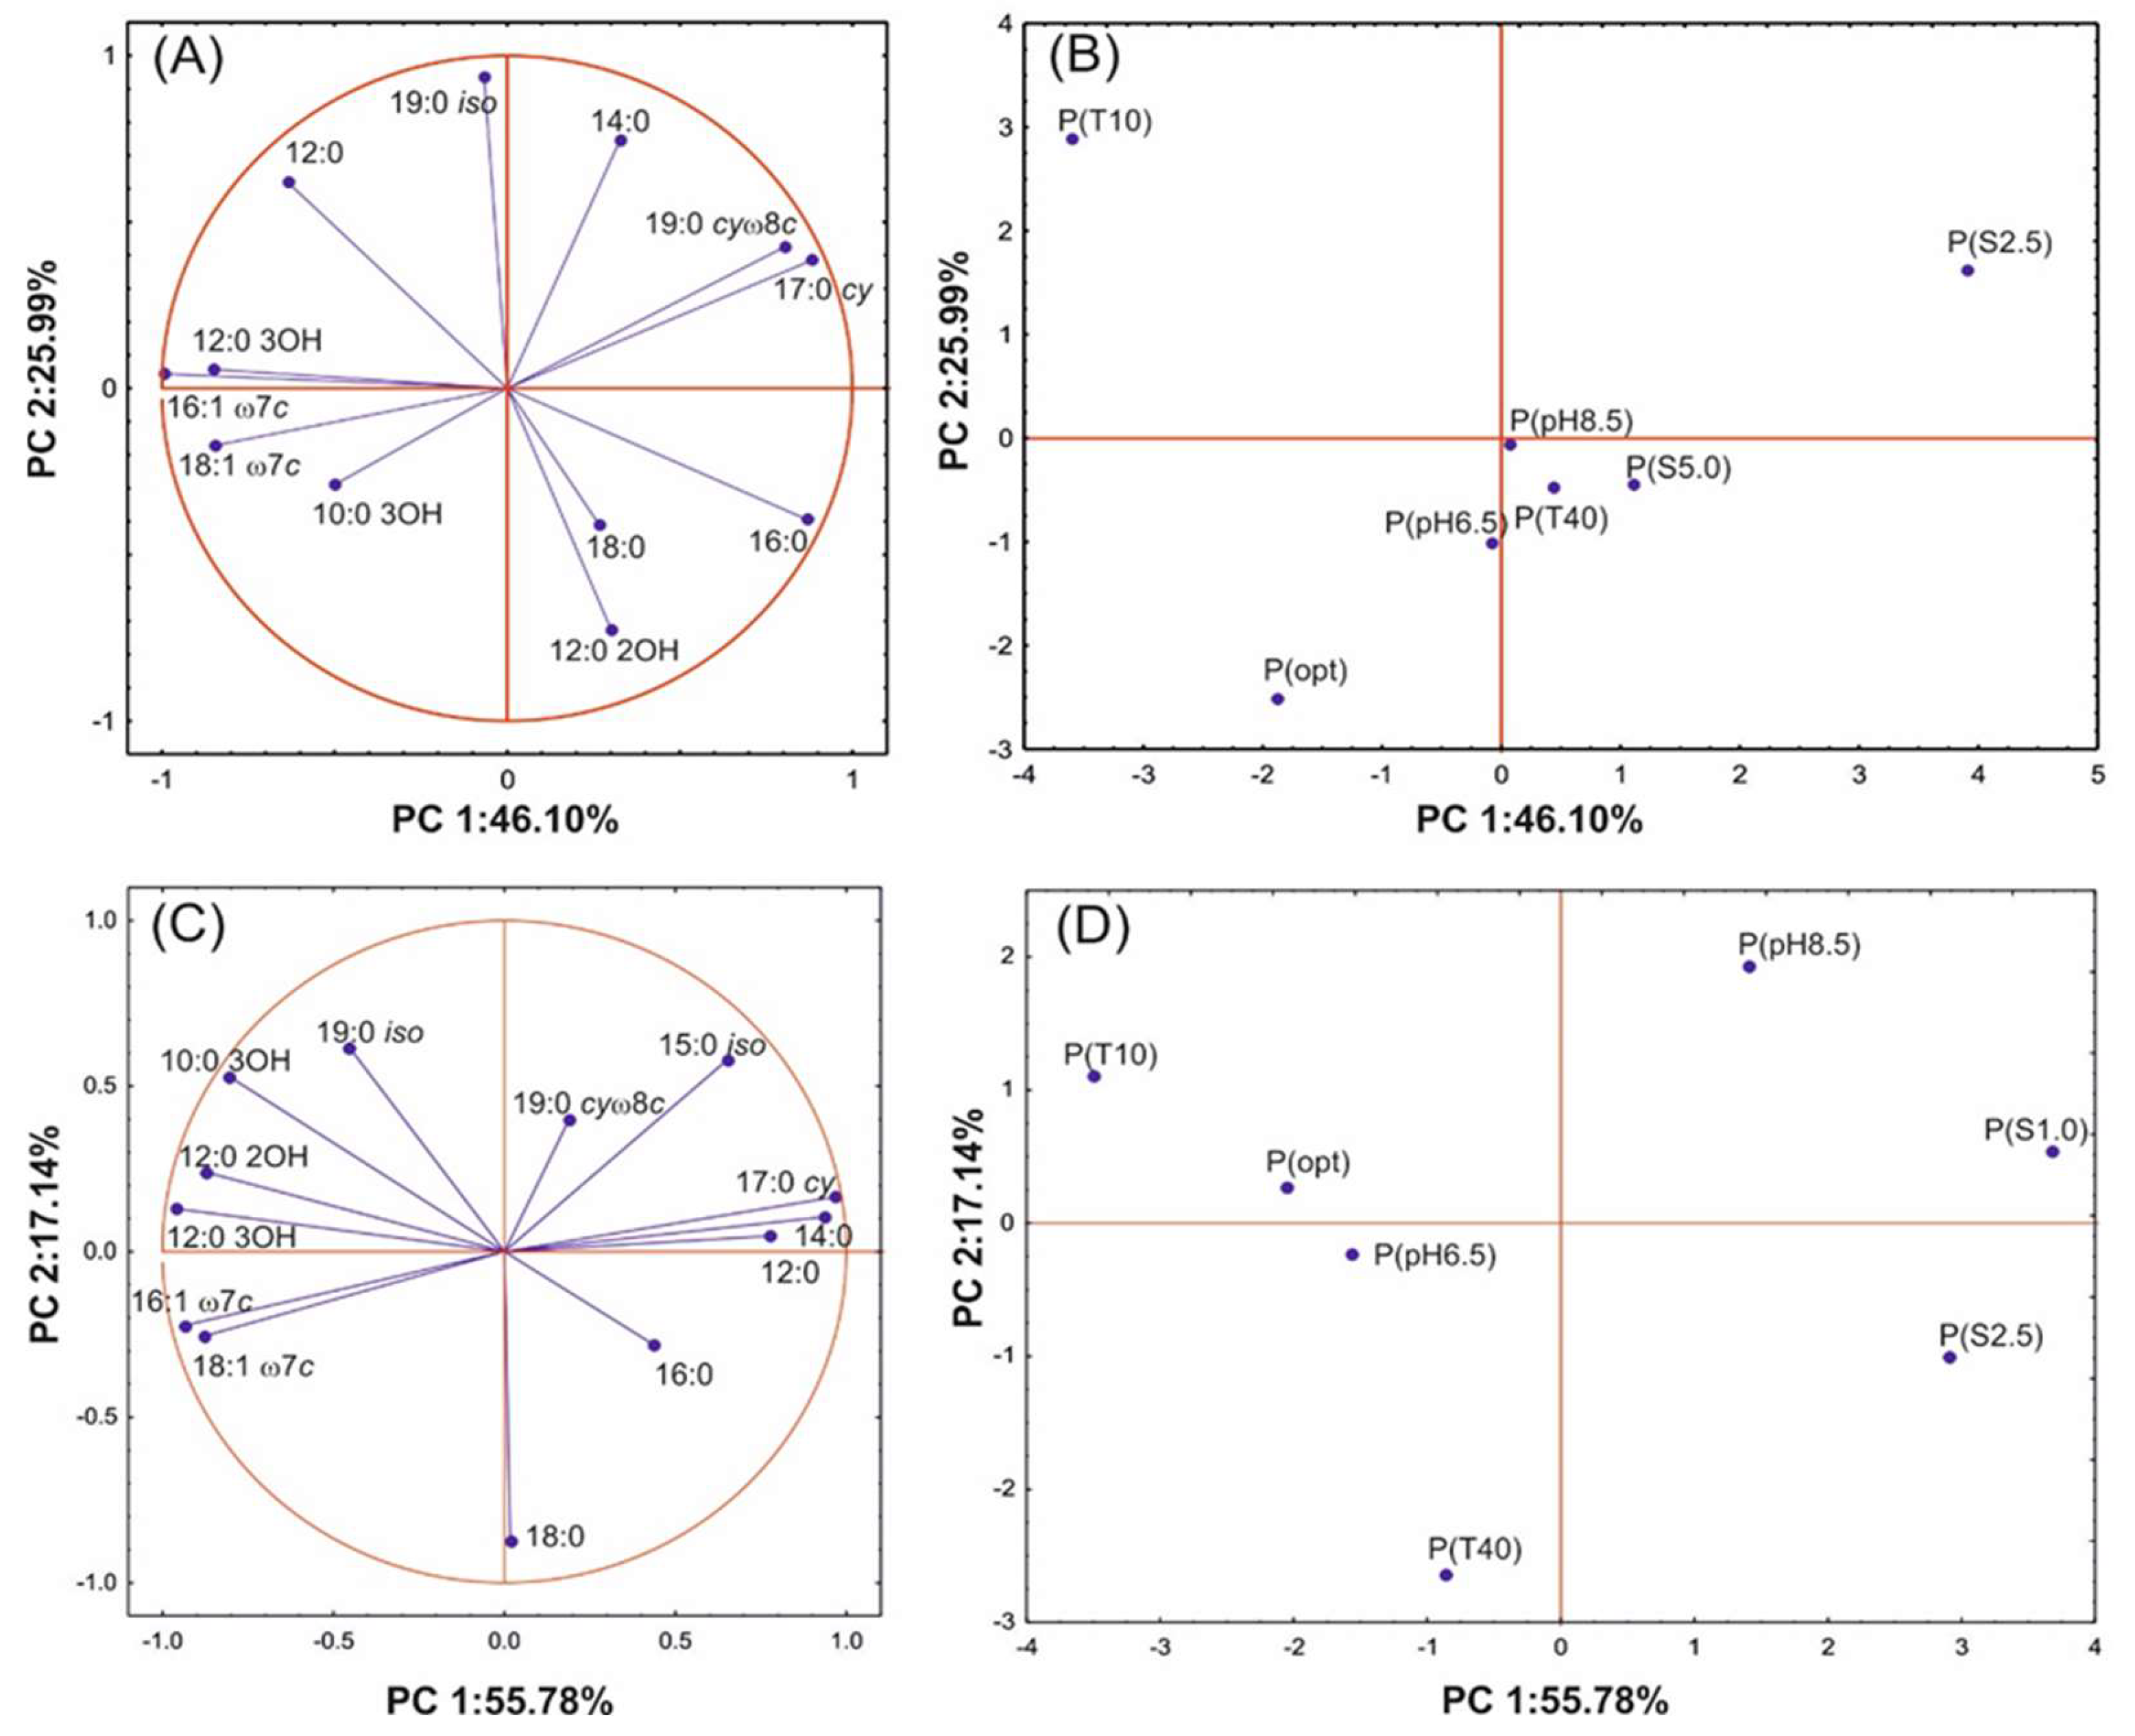
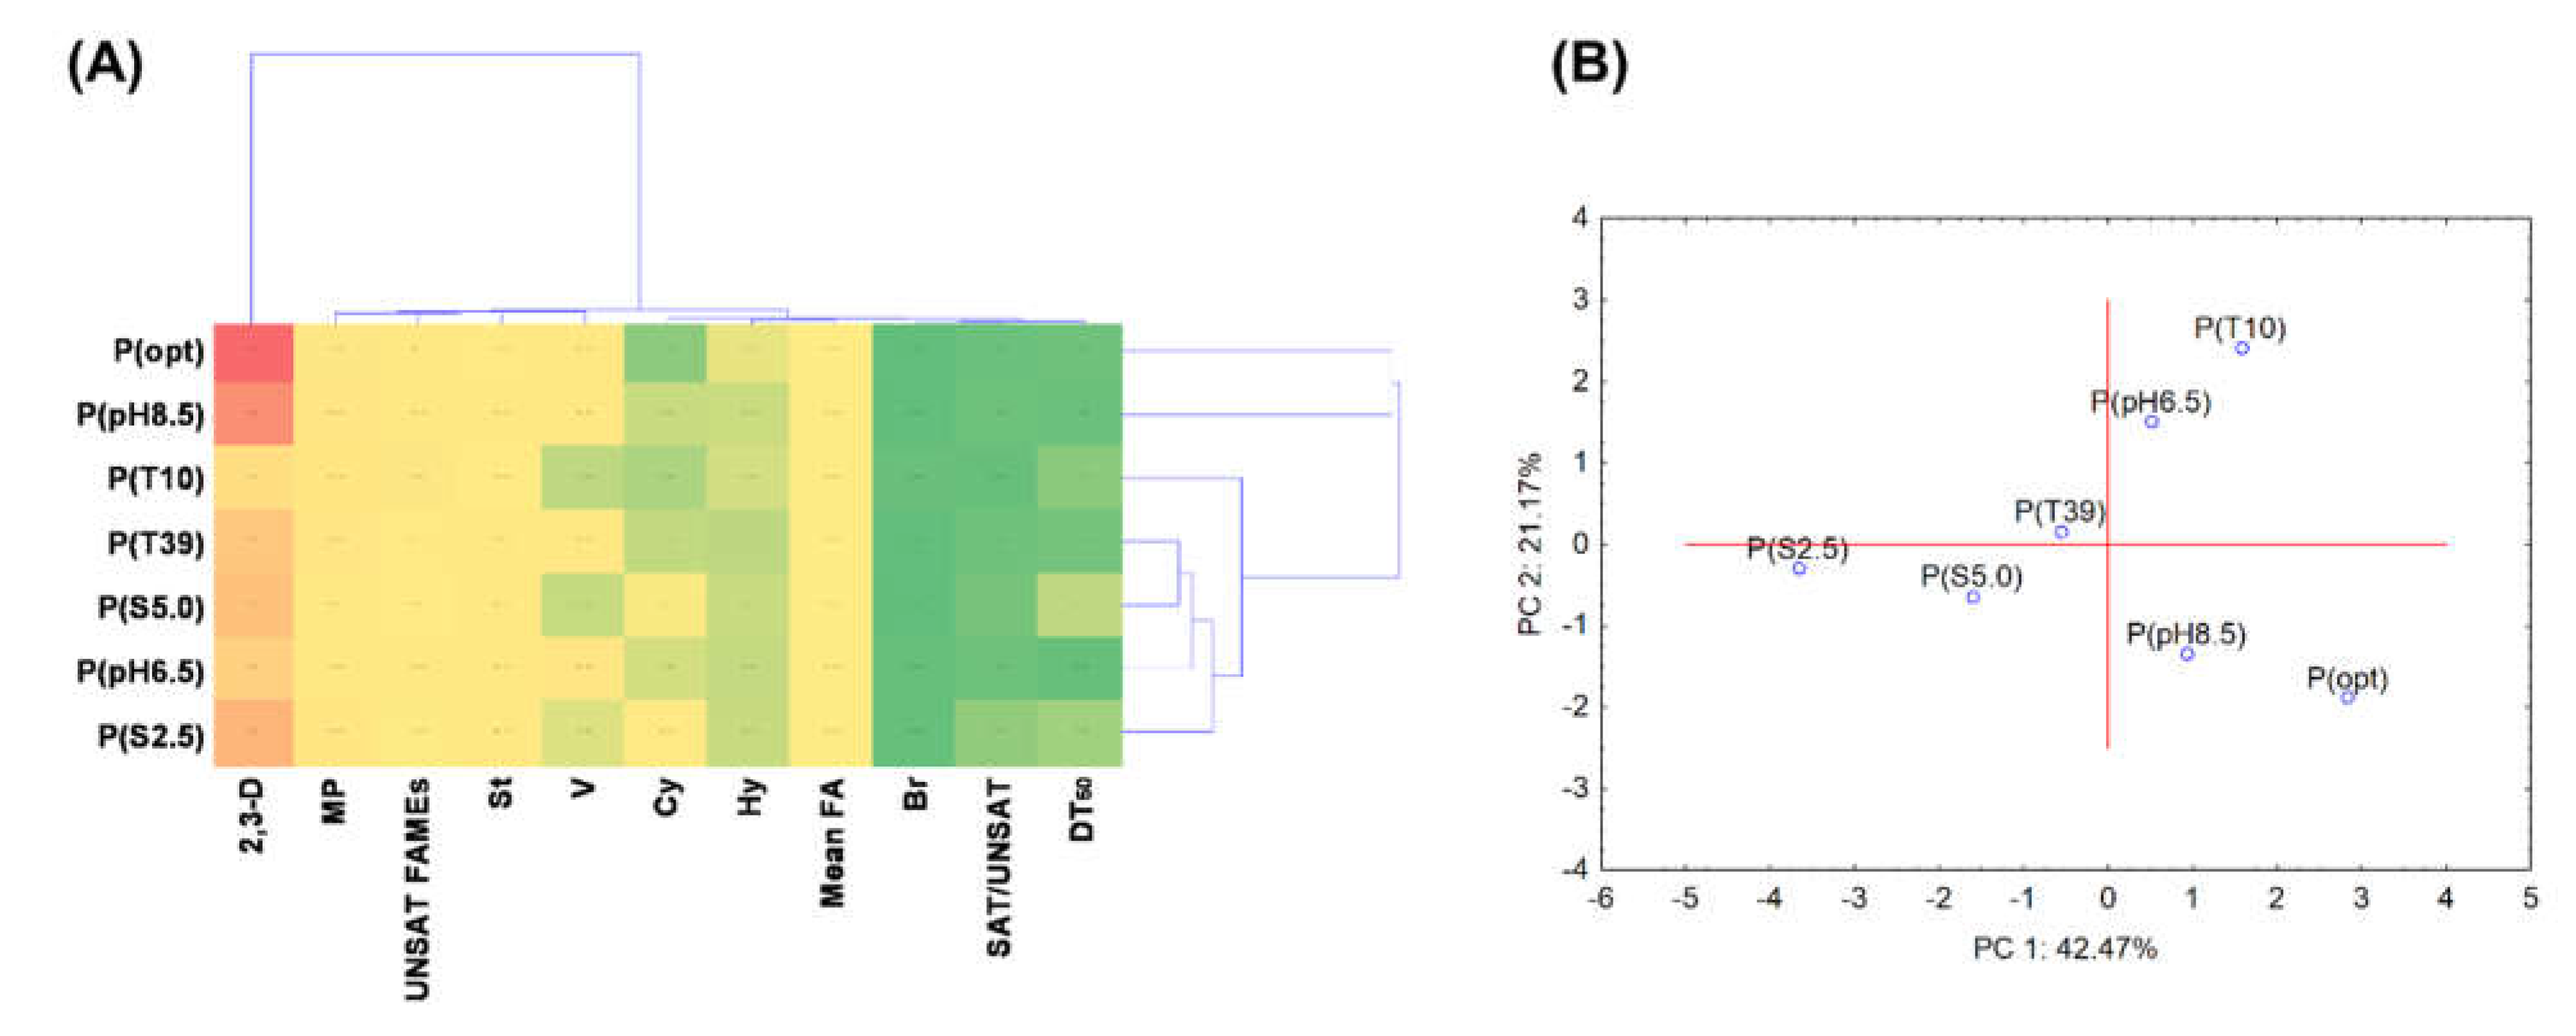
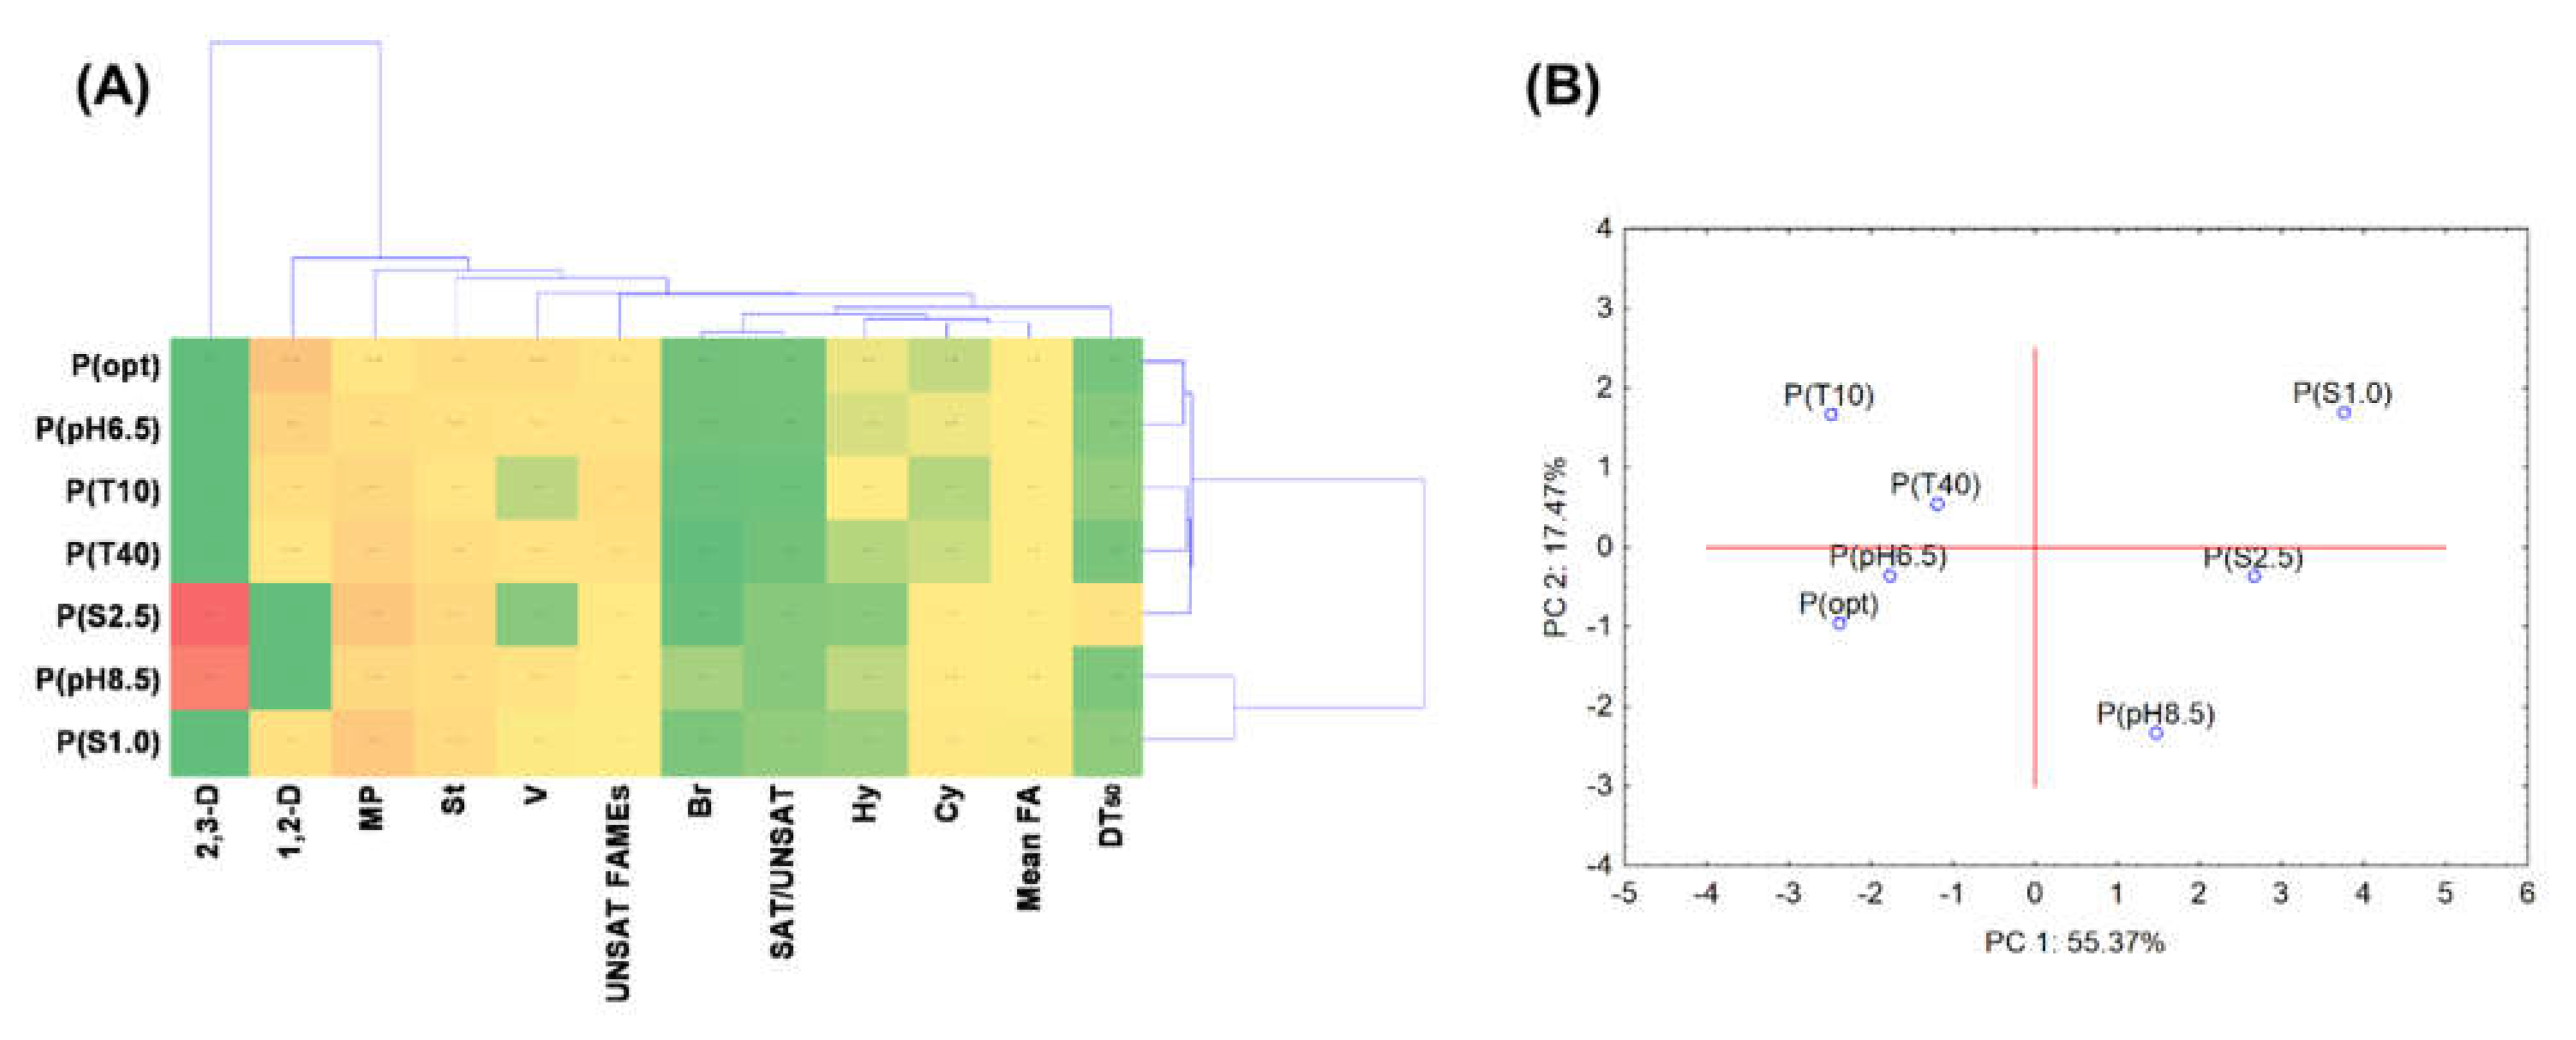
3.5. Statistical Data Exploration

The cluster and PCA analyses with Pearson’s correlation coefficient resulted in a very different picture of the results for each strain. The diagram projection for S. maltophilia KB2 revealed that the most differentiating variable was catechol 2,3-D activity (Figure 5A). By contrast, other analyses formed two thematically similar clusters. The first cluster included unsaturated and straight-chain fatty acids contribution as well as membrane permeability, while the second contained SAT/UNSAT ratio, branched fatty acid participation, and DT50. The results from PCA, including all performed analyses, explained 63.64% variability of the data (Figure 5B). The coordination biplot for S. maltophilia KB2 distinguished P(S2.5) among all tested parameters and P(opt) along the PC1 axis. In general, the effect of suboptimal culture conditions on the examined variables can be ordered: P(S2.5), P(S5.0), P(T39), P(pH6.5), P(pH8.5), and P(T10). The Pearson correlation coefficient showed a strong negative correlation (p < 0.01) for DT50 with V (r = 0.874), whereas a strong positive correlation (p < 0.01) was validated for SAT/UNSAT ratio with Cy (r = 0.979) (Table 5).
Similarly to the S. maltophilia KB2 strain, the cluster analysis for P. moorei KB4 separated 2,3-D activity as the most differentiating parameter (Figure 6A). It is worth underlying that according to the generated dendrogram, catechol 1,2-D, membrane permeability, and straight-chain fatty acid abundance were also discriminating factors for this strain. PCA projection and phenol degradation under different physicochemical conditions explained 72.84% variability of the data. The PCA cluster analysis revealed that pH 8.5 and salinity significantly influenced the obtained data (Figure 6B). Moreover, the Pearson’s correlation matrix indicated a strong correlation for FAME data, especially for SAT/UNSAT ratio with Cy (r = 0.951) and UNSAT fatty acids with Cy (r = −0.940). Conversely to S. maltophilia KB2, no correlation was observed between variables DT50 and V for P. moorei KB4 (Table 6).

4. Discussion

4.1. The Potential of S. maltophilia KB2 and P. moorei KB4 Towards Phenol Degradation under Suboptimal Conditions

Due to the wide prevalence of phenols in various ecosystems and their acute or chronic toxicity to living organisms, even at low concentrations, there is an urgent need to effectively remove them from contaminated soil, water, and bottom sediments. To reduce the still existing environmental problems concerning phenol pollution worldwide, new and innovative strategies are constantly developed and tested under laboratory conditions before their application in practice on a technical scale. Among these strategies, bioaugmentation using the natural ability of microorganisms (bacteria or fungi) to decompose phenolic compounds is widely and successfully applied in the recultivation of phenol-contaminated soil and wastewater [10,47,48]. However, not all microorganisms that can degrade phenol and its derivatives in the established optimal laboratory conditions can be introduced into contaminated sites to enhance the degradation potential of the indigenous microbiome. Many of them are sensitive to changes in temperature, pH, salinity, or the presence of heavy metals, usually weakening or even inhibiting their growth and degradation abilities. Therefore, selecting appropriate strains is not easy and requires careful characterisation of their ability to tolerate the conditions in the target environment, which are crucial to their survival and expression of degradative genes [49]. Therefore, this study investigated how the variable temperature, pH, and salinity affect the degradation of phenol by two bacterial strains S. maltophilia KB2 and P. moorei KB4, with the prospect of using them in the future for bioaugmentation of phenol-contaminated sites in periodically changing environmental conditions.
Although S. maltophilia KB2 and P. moorei KB4 degraded phenol at a concentration of 300 mg/L under optimal conditions (30 °C, pH 7.2) at a similar time and rate; significant differences in their degradative abilities were found under suboptimal circumstances. P. moorei KB4 was more sensitive to changes in pH and salinity than S. maltophilia KB2, resulting in a much longer time of phenol utilisation. An interesting observation was also made for this strain at different salinity and pH regarding the change of phenol degradation pathway from ortho-cleavage to the meta-cleavage path. Under 1% salinity, bacteria produced catechol 1,2-D, whereas, under 2.5% salinity and pH 8.5, only catechol 2.3-D was active. One possible interpretation of this phenomenon is that both enzymes need specific catalytic groups in the ionised or non-ionised state to interact with the substrate without changing its active conformation and enzyme stability. Literature data indicate that the ortho- and meta-pathway induction by the same bacteria depends not only on the culture conditions but also on the concentration of the aromatic substrate. For example, Pseudomonas putida ATCC 49451 activated only the ortho-cleavage pathway at a low initial benzoate concentration (up to 200 mg/L), whereas both ortho- and meta-cleavage pathways were induced at higher concentrations (≥300 mg/L) [50]. This exceptional phenomenon was also confirmed by Hupert-Kocurek et al. [51]. They discerned that Planococcus sp. degraded phenol at 94 and 188 mg/L using catechol 1,2-D, while in the higher concentrations of 282 and 376 mg/L, only 2,3-D was induced. In other studies, Silva et al. [52] reported a much higher activity of catechol 2,3-D than 1,2-D in Gordonia polyisoprenivorans growing at pH 4.0–9.0 and temperature 5–50 °C. Catechol 1,2-D activity under pH below 5.5 and 9.0 was 50% lower than 2,3-D activity. In this study, the phenol degradation rate and the activities of both dioxygenases were also strongly temperature dependent. At extreme temperatures, phenol metabolism was slowed down, and the activity of dioxygenases significantly decreased. It is worth emphasising that the temperature of 4 and 40 °C did not completely inhibit the activity of 1,2-D in P. moorei KB4 cells, which may suggest that the lack of activity of this enzyme at extreme pH or salinity could be the result of disturbances in the ionisation of catalytic groups. Recently, Mei et al. [53] characterised a pH-tolerant Cobetia sp. SASS1 strain is capable of utilising phenol (900 mg/L) over a wide pH range (3.0–9.0) and salinity (0 to 4%) via the ortho-cleavage pathway. It was primarily an effective phenol degrader under salinity conditions, allowing phenol degradation in 35 h in 1% NaCl to proceed. Similarly, a halophilic strain JS3 degraded phenol (800 mg/L) when pH, temperature, and salinity ranged from 4.0 to 9.0, 30 to 40 °C, and 0 to 7%, respectively [54]. In view of these studies, S. maltophilia KB2 has an equally good phenol degradation potential compared to these halophilic strains as it degraded 300 mg/L phenol in 28 h in the presence of 2.5% NaCl. Both S. maltophilia KB2 and P. moorei KB4 strains can also degrade phenol over a wide temperature range, making them potentially useful for treating phenol under temperate climate conditions with large annual and daily temperature fluctuations. In the previous studies by Żur et al. [55], laccase activity in P. moorei KB4 strain was reported, enhancing its degradation potential towards aromatic compounds.
Within phenol degradation, an interesting reaction of P. moorei KB4 at 10 °C, pH 8.5, 1%, and 2.5% NaCl was the autoaggregation of cells observed macroscopically in the form of quite large clumps. They started to appear at the 3rd hour of incubation and disappeared with phenol depletion from the culture. The ability of this strain to self-aggregate during cell immobilisation on bacterial cellulose was also observed by Żur et al. [42]. This phenomenon also appeared in other Pseudomonas species as a response to chemical stress [56] or predation [57]. For example, Pseudomonas putida CP1 cells clumped during the degradation of 2- and 3-chlorophenol at concentrations above 100 mg/L and 4-chlorophenol above 200 mg/L. On the other hand, even in the presence of 800 mg/L phenol, they did not show autoaggregation properties in the culture medium under optimal growth conditions (shaking—150 rpm, temperature—30 °C, and pH 7.0) [58]. Similarly, in this study, Pseudomonas moorei KB4 did not form clumps under optimal conditions. Autoaggregation is also a survival strategy under intense grazing pressure. When Pseudomonas sp. MWH1 was cultured in the presence of the bacterivorous flagellate Ochromonas; the formation of clumps conferred protection against flagellate grazing, whereas bacteria cultured without predation grew as planktonic cells. According to Trunk et al. [59], forming multicellular clumps is a widespread phenomenon that protects bacteria from environmental stress and allows them to counterbalance growing problems. Autoaggregation is generally mediated by self-recognising surface structures, such as proteins and exopolysaccharides, collectively described as autoagglutinins.

4.2. The Effect of Different Temperatures, pH, and Salinity on the Membranes of S. maltophilia KB2 and P. moorei KB4 during Phenol Degradation

Due to the differences in the phenol utilisation between S. maltophilia KB2 and P. moorei KB4 under optimal and suboptimal growth conditions, accompanying changes in fatty acid composition and membrane permeability appeared to be worth investigating. Available literature data indicated a crucial influence of phenol on cytoplasmatic membranes and its transmembrane transport mechanism. It is postulated that the biological activity of phenols relates to specific lipid-phenols interactions and changes in membrane properties. Phenols can alter membrane permeability for ions by causing local changes in lipid packing that subsequently reduce the energy barrier for ion-induced pores. Interestingly, the ability of different phenolic compounds to alter membrane permeability does not correlate with the lipophilicity of these compounds, as indicated by their log P values [60]. The previous studies using S. maltophilia KB2 demonstrated the increase in the content of straight-chain and cyclopropane fatty acids with a simultaneous decrease in unsaturated fatty acid percentages as the bacteria responded to the phenol exposure (300 mg/L) under optimal conditions [40]. Herein, this trend was followed for the cells exposed to salinity. It is worth pointing out that higher salt concentrations than 1% cause cell plasmolysis and dehydration [61]; therefore, both bacterial strains must counteract these processes. Detailed cluster analysis and Pearson’s correlation assigned to S. maltophilia KB2 indicated the increase of the SAT/UNSAT ratio under salinity due to the increase in the abundance of cyclopropane fatty acids. A similar relation was recorded for P. moorei KB4; however, the cluster analysis revealed a stronger correlation between salinity and membrane permeability, suggesting the predominance of the destructive processes in the cells over defence mechanisms. The role of cyclopropane fatty acids in adapting bacterial cells to toxic organic compounds has been discussed in the literature for several decades; however, their dual mechanism of action has been proposed by Poger and Mark [62] in the last decade. Firstly, they stabilise membranes against adverse conditions through induction of a greater degree of order than their unsaturated precursors and limit the rotation of the bonds surrounding the cyclopropane ring. Secondly, they disrupt lipid packing, favour the occurrence of "gauche" defects in the chains and increase the lateral lipid diffusion, enhancing membrane fluidity. Here, cyclopropane fatty acids are more likely to increase the membrane order and sealing to prevent cations from entering the cell interior under salinity conditions. Apart from salinity, the low temperature was the second factor with the most substantial influence on the rate of phenol degradation and bacterial growth. In both strains of bacteria, an increased proportion of unsaturated fatty acids was found, reducing the membranes’ fluidity and, more precisely, lowering lipids’ melting point. Conversely, increasing the membrane’s fluidity ensures good mobility at low temperatures [63,64]. Another essential modification in fatty acid profiling of P. moorei KB4 exposed to low temperature was increased hydroxy fatty acid percentages. This phenomenon is known from the literature [65,66]; however, the interpretation of obtained results is confused. It may be suggested that increasing the membrane polarity supports the uptake of phenol as a carbon and energy source inside the cell, counteracting the slow chemical reaction rates, molecule movements, and limited enzyme activity at low temperatures.

5. Conclusions

The presented results confirmed the ability of S. maltophilia KB2 and P. moorei KB4 to degrade phenol effectively under suboptimal temperature, pH, and salinity. They also indicated the accompanying changes in membrane fatty acid composition and permeability. Despite the considerable diversity of the results, it can be concluded that S. maltophilia KB2 was less sensitive to changes in pH and salinity than P. moorei KB4, resulting in a much faster time of phenol utilisation, higher dioxygenase activity, a more varied pattern of fatty acids and a more significant increase in membrane permeability at low temperature and pH values. The privileged position of S. maltophilia KB2 in phenol degradation in suboptimal conditions does not diminish the degradation potential of P. moorei KB4 and does not preclude its use as an inoculant under certain contamination conditions. Undeniably, the presented findings are valuable as they provide new evidence in adapting bacteria to stressful conditions at a molecular level. Such expanded knowledge is essential in selecting appropriate strains for specific biotechnological purposes and further their practical use, for example, as inoculants in the bioaugmentation of phenol-polluted soil and/or bioreactor systems in sewage treatment plants to minimise contamination levels.
Future perspectives include the implementation of a multi-dimensional analysis in two aspects. The first provides for the bioaugmentation of activated sludge with S. maltophilia KB2 and P. moorei KB4 and the study of their phenol degradation potential and survival in sequential batch reactor conditions, reflecting the operation of the sewage treatment plant. The second line of research assumes an understanding of the molecular mechanisms causing changes in the activity of catechol 1,2-D and 2,3-D in P. moorei KB4, depending on the growth conditions. Undoubtedly, continuing research in this field may cover issues related to the simultaneous treatment of phenolic waste and biohydrogen production. Fusing these processes requires different conditions, including both aerobic and anaerobic; therefore, their optimisation is crucial for biodegradation and production efficiency. Combining environmental cleaning with the production of biofuels complies with the current research trends. For example, biodegradation of olive oil mill wastewater phenolics and high yield of biohydrogen production has already been reported by Papazi et al. [67]. However, such undertaking requires further analysis, mainly to optimise the operating conditions, increase the efficiency of biohydrogen production and reduce financial outlays.

Author Contributions

Conceptualisation, A.N. and A.M.; methodology, A.N. and A.M.; software, A.N., D.W. and A.M.; validation, A.N. and D.W.; formal analysis, A.N., D.W. and A.M; investigation, A.N.; resources, A.N. and A.M.; data curation, A.N. and A.M.; writing—original draft preparation, A.N., D.W. and A.M.; writing—review and editing, A.M.; visualisation, A.N. and D.W.; supervision, A.M.; project administration, A.N.; funding acquisition, A.M. All authors have read and agreed to the published version of the manuscript.

Funding

This research was funded by the Minister of Education and Science, Poland.

Data Availability Statement

Not applicable.

Conflicts of Interest

The authors declare no conflict of interest.

References

  1. Lochab, B.; Shuklaa, S.; Varmab, I.K. Naturally occurring phenolic sources: Monomers and polymers. RSC Adv. 2014, 4, 21712–21752. [Google Scholar] [CrossRef]
  2. Panigrahy, N.; Priyadarshini, A.; Sahoo, M.M.; Verma, A.K.; Daverey, A.; Sahoo, N.K. A comprehensive review on eco-toxicity and biodegradation of phenolics: Recent progress and future outlook. Environ. Technol. Innov. 2022, 27, 102423. [Google Scholar] [CrossRef]
  3. New Jersey Department of Health. Hazardous Substance Fact Sheet. 2015. Available online: https://nj.gov/health/eoh/rtkweb/documents/fs/1487.pdf (accessed on 12 July 2022).
  4. Kurnik, K.; Treder, K.; Skorupa-Kłaput, M.; Tretyn, A.; Tyburski, J. Removal of phenol from synthetic and industrial wastewater by potato pulp peroxidases. Water Air Soil Pollut. 2015, 226, 254. [Google Scholar] [CrossRef] [PubMed]
  5. Image Global Phenol Market-Industry Trends and Forecast to 2029. Available online: https://www.databridgemarketresearch.com/reports/global-phenol-market (accessed on 18 July 2022).
  6. Market Volume of Phenols Worldwide from 2015 to 2021, with a Forecast for 2022 to 2029. Available online: https://www.statista.com/statistics/979265/global-phenol-market-volume (accessed on 18 July 2022).
  7. Campos, F.M.; Couto, J.A.; Figueiredo, A.R.; Tóth, I.V.; Rangel, A.O.; Hogg, T.A. Cell membrane damage induced by phenolic acids on wine lactic acid bacteria. Int. J. Food Microbiol. 2009, 135, 144–151. [Google Scholar] [CrossRef]
  8. Muntathir, A.; Sagheer, A.; Onaizi, A. Review on phenolic wastewater remediation using homogeneous and heterogeneous enzymatic processes: Current status and potential challenges. Sep. Purif. Technol. 2019, 219, 186–207. [Google Scholar] [CrossRef]
  9. Downs, J.W.; Wills, B.K. Phenol toxicity. In StatPearls; StatPearls Publishing: Treasure Island, FL, USA, 2022. Available online: https://www.ncbi.nlm.nih.gov/books/NBK542311/ (accessed on 12 July 2022).
  10. Poi, G.; Aburto-Medina, A.; Mok, P.C.; Ball, A.S.; Shahsavari, E. Bioremediation of phenol-contaminated industrial wastewater using a bacterial consortium—From laboratory to field. Water Air Soil Pollut. 2017, 228, 89. [Google Scholar] [CrossRef]
  11. Duraisamy, P.; Sekar, J.; Arunkumar, A.D.; Ramalingam, P.V. Kinetics of phenol biodegradation by heavy metal tolerant rhizobacteria Glutamicibacter nicotianae MSSRFPD35 from distillery effluent contaminated soils. Front. Microbiol. 2020, 15, 1573. [Google Scholar] [CrossRef]
  12. Zhuang, H.; Fang, F. Bioaugmentation with phenol-degrading bacteria (PDB) as a strategy for improving start-up and stability of sequencing biofilm batch reactor (SBBR) for coal gasification wastewater (CGW) treatment. Pol. J. Environ. Stud. 2020, 29, 3955–3964. [Google Scholar] [CrossRef]
  13. Aljbour, S.H.; Khleifat, K.M.; Al Tarawneh, A.; Asasfeh, B.; Qaralleh, H.; El-Hasan, T.; Magharbeh, M.K.; Al-Limoun, M.O. Growth kinetics and toxicity of Pseudomonas fredriksbergsis grown on phenol as sole carbon source. J. Ecol. Eng. 2021, 22, 251–263. [Google Scholar] [CrossRef]
  14. Zhang, W.; Xia, X. Isolation, kinetics, and performance of a novel phenol degrading strain. Chem. Biochem. Eng. 2019, 33, 485–494. [Google Scholar] [CrossRef]
  15. Abarian, M.; Hassanshahian, M.; Esbah, A. Degradation of phenol at high concentrations using immobilisation of Pseudomonas putida P53 into sawdust entrapped in sodium-alginate beads. Water Sci. Technol. 2019, 79, 1387–1396. [Google Scholar] [CrossRef]
  16. Nogina, T.; Fomina, M.; Dumanskaya, T.; Zelena, L.; Khomenko, L.; Mikhalovsky, S.; Podgorskyi, V.; Gadd, G.M. A new Rhodococcus aetherivorans strain isolated from lubricant-contaminated soil as a prospective phenol-biodegrading agent. Appl. Microbiol. Biotechnol. 2020, 104, 3611–3625. [Google Scholar] [CrossRef]
  17. Barik, M.; Das, C.P.; Verma, A.K.; Sahoo, S.; Sahoo, N.K. Metabolic profiling of phenol biodegradation by an indigenous Rhodococcus pyridinivorans strain PDB9T N-1 isolated from paper pulp wastewater. Int. Biodeterior. Biodegrad. 2021, 158, 105168. [Google Scholar] [CrossRef]
  18. Chandrasekaran, S.; Pugazhendi, A.; Banu, R.J.; Ismail, I.M.; Qari, H.A. Biodegradation of phenol by a moderately halophilic bacterial consortium. Environ. Prog. Sustain. Energy 2018, 37, 1587–1593. [Google Scholar] [CrossRef]
  19. Samimi, M.; Moghadam, M.S. Phenol biodegradation by bacterial strain O-CH1 isolated from seashore. Glob. J. Environ. Sci. Manag. 2020, 6, 109–118. [Google Scholar] [CrossRef]
  20. Yang, X.; Hang, X.; Zhang, M.; Liu, X.; Yang, H. Relationship between acid tolerance and cell membrane in Bifidobacterium, revealed by comparative analysis of acid-resistant derivatives and their parental strains grown in medium with and without Tween 80. Appl. Microbiol. Biotechnol. 2015, 99, 5227–5236. [Google Scholar] [CrossRef]
  21. Bajerski, F.; Wagner, D.; Mangelsdorf, K. Cell membrane fatty acid composition of Chryseobacterium frigidisoli PB4T isolated from Antarctic glacier forefield soils in response to changing temperature and pH conditions. Front. Microbiol. 2017, 8, 677. [Google Scholar] [CrossRef]
  22. Dercová, K.; Murínová, S.; Dudásová, H.; Lászlová, K.; Horváthová, H. The adaptation mechanisms of bacteria applied in bioremediation of hydrophobic toxic environmental pollutants: How indigenous and introduced bacteria can respond to persistent organic pollutants-induced stress? In Persistent Organic Pollutants; Donyinah, S.K., Ed.; IntechOpen: London, UK, 2018; pp. 1–27. [Google Scholar] [CrossRef]
  23. Guan, N.; Liu, L. Microbial response to acid stress: Mechanisms and applications. Appl. Microbiol. Biotechnol. 2020, 104, 51–65. [Google Scholar] [CrossRef]
  24. Maleki, F.; Khosravi, A.; Nasser, A.; Taghinejad, H.; Azizian, M. Bacterial heat shock protein activity. J. Clin. Diagn. Res. 2016, 10, BE01–BE03. [Google Scholar] [CrossRef]
  25. Imhoff, J.F.; Rahn, T.; Kündzel, S.; Keller, A.; Neulinger, S.C. Osmotic adaptation and compatible solute biosynthesis of phototrophic bacteria as revealed from genome analyses. Microorganisms 2021, 9, 46. [Google Scholar] [CrossRef]
  26. Zhang, Y.; Gross, C.A. Cold shock response in bacteria. Annu. Rev. Gen. 2021, 55, 377–400. [Google Scholar] [CrossRef]
  27. Padan, E.; Bibi, E.; Ito, M.; Krulwich, T.A. Alkaline pH homeostasis in bacteria: New insights. Biochim. Biophys. Acta 2005, 1717, 67–88. [Google Scholar] [CrossRef]
  28. Bremer, E.; Kramer, R. Responses of microorganisms to osmotic stress. Annu. Rev. Microbiol. 2019, 73, 313–334. [Google Scholar] [CrossRef]
  29. Unell, M.; Kabelitz, N.; Jansson, J.K.; Heipieper, H.J. Adaptation of the psychrotroph Arthrobacter chlorophenolicus A6 to growth temperature and the presence of phenols by changes in the anteiso/iso ratio of branched fatty acids. FEMS Microbiol. Lett. 2007, 266, 138–143. [Google Scholar] [CrossRef] [PubMed]
  30. Nowak, A.; Żur-Pińska, J.; Piński, A.; Pacek, G.; Mrozik, A. Adaptation of phenol-degrading Pseudomonas putida KB3 to suboptimal growth condition: A focus on degradative rate, membrane properties and expression of xylE and cfaB genes. Ecotoxicol. Environ. Saf. 2021, 221, 112431. [Google Scholar] [CrossRef] [PubMed]
  31. De Carvalho, C.C.C.R.; Fischer, M.A.; Kirsten, S.; Würz, B.; Wick, L.Y.; Heipieper, H.J. Adaptive response of Rhodococcus opacus PWD4 to salt and phenolic stress on the level of mycolic acids. AMB Express 2016, 6, 66. [Google Scholar] [CrossRef] [PubMed]
  32. Popa, P.; Timofti, M.; Voiculescu, M.; Dragan, S.; Trif, C.; Georgescu, L.P. Study of physico-chemical characteristics of wastewater in an urban agglomeration in Romania. Sci. World J. 2012, 2012, 549028. [Google Scholar] [CrossRef]
  33. Funamizu, N.; Takakuwa, T. Simulation analysis of operation conditions for a municipal wastewater treatment plant at low temperatures. In Biotechnological Applications of Cold-Adapted Organisms; Margesin, R., Schinner, F., Eds.; Springer: Berlin/Heidelberg, Germany, 1999; pp. 203–220. [Google Scholar] [CrossRef]
  34. Bandara, W.M.; Kindaichi, T.; Satoh, H.; Sasakawa, M.; Nakahara, Y.; Takahashi, M.; Okabe, S. Anaerobic treatment of municipal wastewater at ambient temperature: Analysis of archaeal community structure and recovery of dissolved methane. Water Res. 2012, 46, 5756–5764. [Google Scholar] [CrossRef] [Green Version]
  35. Ali, S.F.; Gilich, A. Opportunities to decarbonise heat in the UK using urban wastewater heat recovery. Build. Serv. Eng. Res. Technol. 2021, 42, 715–732. [Google Scholar] [CrossRef]
  36. Castillo-Carvajal, L.C.; Sanz-Martin, J.L.; Barragan-Huerta, B.E. Biodegradation of organic pollutants in saline wastewater by halophilic microorganisms: A review. Environ. Sci. Pollut. Res. 2014, 21, 9578–9588. [Google Scholar] [CrossRef]
  37. Zhuo, Y.; Sheng, X.; Cao, G. Treatment of high salinity wastewater using CWPO process for reuse. J. Adv. Oxid. Technol. 2017, 20, 20170024. [Google Scholar] [CrossRef]
  38. Guzik, U.; Greń, I.; Wojcieszyńska, D.; Łabużek, S. Isolation and characterisation of a novel strain of Stenotrophomonas maltophilia possessing various dioxygenases for monocyclic hydrocarbon degradation. Braz. J. Microbiol. 2009, 40, 285–291. [Google Scholar] [CrossRef]
  39. Wojcieszyńska, D.; Guzik, U.; Greń, I.; Perkosz, M.; Hupert-Kocurek, K. Induction of aromatic ring: Cleavage dioxygenases in Stenotrophomonas maltophilia strain KB2 in cometabolic systems. World J. Microbiol. Biotechnol. 2011, 27, 805–811. [Google Scholar] [CrossRef]
  40. Nowak, A.; Greń, I.; Mrozik, A. Changes in fatty acid composition of Stenotrophomonas maltophilia KB2 during co-metabolic degradation of monochlorophenols. World J. Microbiol. Biotechnol. 2016, 32, 198. [Google Scholar] [CrossRef]
  41. Żur, J.; Wojcieszyńska, D.; Hupert-Kocurek, K.; Marchlewicz, A.; Guzik, U. Paracetamol–toxicity and microbial utilization. Pseudomonas moorei KB4 as a case study for exploring degradation pathway. Chemosphere 2018, 206, 192–202. [Google Scholar] [CrossRef]
  42. Żur, J.; Piński, A.; Michalska, J.; Hupert-Kocurek, K.; Nowak, A.; Wojcieszyńska, D.; Guzik, U. A whole-cell immobilization system on bacterial cellulose for the paracetamol-degrading Pseudomonas moorei KB4 strain. Int. Biodeterior. Biodegrad. 2020, 149, 104919. [Google Scholar] [CrossRef]
  43. Mrozik, A.; Piotrowska-Seget, Z.; Łabużek, S. FAME profiles in Pseudomonas vesicularis during catechol and phenol degradation in the presence of glucose as an additional carbon source. Pol. J. Microbiol. 2007, 56, 157–164. [Google Scholar]
  44. Mrozik, A.; Swędzioł, Ż.; Miga, S. Comparative study of phenol degradation with a wild-type and genetically modified P. vesicularis (pBR322). Plasmid stability and FAME profiling. Environ. Prot. Eng. 2015, 41, 137–155. [Google Scholar] [CrossRef]
  45. Sasser, M. Microbial Identification by Gas Chromatographic Analysis of Fatty Acid Methyl Esters (GC-FAME); Technical Note #101; MIDI Inc.: Newark, DE, USA, 1990; p. 101. [Google Scholar]
  46. Halder, S.; Yadav, K.K.; Sarkar, R.; Mukherjee, S.; Saha, P.; Haldar, S.; Karmakar, S.; Sen, T. Alteration of zeta potential and membrane permeability in bacteria: A study with cationic agents. SpringerPlus 2015, 4, 672. [Google Scholar] [CrossRef] [Green Version]
  47. Vijay, P.T.A.; Sahila, M.; Kunhi, A.A.M. Soil bioaugmentation with Pseudomonas aeruginosa S-CSR-0013 eliminates the inhibitory effect of phenol on germination of chickpea (Cicer arietinum) seeds. J. Environ. Sci. Pollut. Res. 2020, 6, 420–425. [Google Scholar] [CrossRef]
  48. Jiang, Y.; Jiang, J.; Wei, X.; Lin, W.; Jiang, L. Bioaugmentation technology for treatment of toxic and refractory organic waste water based on artificial intelligence. Front. Bioeng. Biotechnol. 2021, 9, 696166. [Google Scholar] [CrossRef]
  49. Michalska, J.; Piński, A.; Żur, J.; Mrozik, A. Selecting bacteria candidates for the bioaugmentation of activated sludge to improve the aerobic treatment of landfill leachate. Water 2020, 12, 140. [Google Scholar] [CrossRef]
  50. Loh, K.-C.; Chua, S.-S. Ortho pathway of benzoate degradation in Pseudomonas putida: Induction of meta pathway at high substrate concentrations. Enzym. Microb. Technol. 2002, 30, 620–626. [Google Scholar] [CrossRef]
  51. Hupert-Kocurek, K.; Guzik, U.; Wojcieszyńska, D. Characterization of catechol 2,3-dioxygenase from Planococcus sp. strain S5 induced by high phenol concentration. Acta Biochim. Pol. 2012, 59, 345–351. [Google Scholar] [CrossRef]
  52. Silva, A.S.; Camargo, F.A.O.; Andreazza, R.; Jacques, R.J.S.; Baldoni, D.B.; Bento, F.M. Enzymatic Activity of catechol 1,2-dioxygenase and catechol 2,3-dioxygenase produced by Gordonia polyisoprenivorans. Quím. Nova 2012, 35, 1587–1592. [Google Scholar] [CrossRef]
  53. Mei, R.; Zhou, M.; Xu, L.; Zhang, Y.; Su, X. Characterization of a pH-tolerant strain Cobetia sp. SASS1 and its phenol degradation performance under salinity condition. Front. Microbiol. 2019, 10, 2034. [Google Scholar] [CrossRef]
  54. Jiang, Y.; Yang, K.; Wang, H.; Shang, Y.; Yang, X. Characteristics of phenol degradation in saline conditions of a halophilic strain JS3 isolated from industrial activated sludge. Mar. Pollut. Bull. 2015, 99, 230–234. [Google Scholar] [CrossRef]
  55. Żur, J.; Piński, A.; Wojcieszyńska, D.; Smułek, W.; Guzik, U. Diclofenac degradation—Enzymes, genetic background and cellular alterations triggered in diclofenac-metabolizing strain Pseudomonas moorei KB4. Int. J. Mol. Sci. 2020, 21, 6786. [Google Scholar] [CrossRef]
  56. Klebensberger, J.; Rui, O.; Fritz, E.; Schink, B.; Philipp, B. Cell aggregation of Pseudomonas aeruginosa strain PAO1 as an energy-dependent stress response during growth with sodium dodecyl sulfate. Arch. Microbiol. 2006, 185, 417–427. [Google Scholar] [CrossRef] [Green Version]
  57. Hahn, M.W.; Moore, E.R.B.; Höfle, M.G. Role of microcolony formation in the protistan grazing defense of the aquatic bacterium Pseudomonas sp. Microb. Ecol. 2000, 39, 175–185. [Google Scholar] [CrossRef]
  58. Farrell, A.; Quilty, B. Substrate-dependent autoaggregation of Pseudomonas putida CP1 during the degradation of mono-chlorophenols and phenol. J. Ind. Microbiol. Biotechnol. 2002, 28, 316–324. [Google Scholar] [CrossRef] [PubMed]
  59. Trunk, T.; Khalil, H.S.; Leo, J.C. Bacterial autoaggregation. AIMS Microbiol. 2018, 1–4, 140–164. [Google Scholar] [CrossRef] [PubMed]
  60. Hossain, S.I.; Saha, S.C.; Deplazes, E. Phenolic compounds alter the ion permeability of phospholipid bilayers via specific lipid interactions. Phys Chem Chem Phys 2021, 23, 22352–22366. [Google Scholar] [CrossRef]
  61. Sierra, J.D.M.; Oosterkamp, M.J.; Wang, W.; Spanjers, H.; van Lier, J.B. Impact of long-term salinity exposure in anaerobic membrane bioreactors treating phenolic wastewater: Performance robustness and endured microbial community. Water Res. 2018, 141, 172–184. [Google Scholar] [CrossRef] [PubMed]
  62. Poger, D.; Mark, A.E. A ring to rule them all: The effect of cyclopropane fatty acids on the fluidity of lipid bilayers. J. Phys. Chem. B 2015, 119, 5487–5495. [Google Scholar] [CrossRef] [PubMed]
  63. He, S.; Ding, L.; Xu, K.; Geng, J.; Ren, H. Effect of low temperature on highly unsaturated fatty acid biosynthesis in activated sludge. Bioresour. Technol. 2016, 211, 494–501. [Google Scholar] [CrossRef]
  64. Hassan, N.; Anesio, A.M.; Rafiq, M.; Holtvoeth, J.; Bull, I.; Haleem, A.; Shah, A.A.; Hasan, F. temperature driven membrane lipid adaptation in glacial psychrophilic bacteria. Front. Microbiol. 2020, 11, 824. [Google Scholar] [CrossRef]
  65. Wang, C.; Bendle, J.; Yang, Y.; Yang, H.; Sun, H.; Huang, J.; Xie, S. Impacts of pH and temperature on soil bacterial 3-hydroxy fatty acids: Development of novel terrestrial proxies. Org. Geochem. 2016, 94, 21–31. [Google Scholar] [CrossRef]
  66. Bale, N.J.; Rijpstra, W.I.C.; Sahonero-Canavesi, D.X.; Oshkin, I.Y.; Belova, S.E.; Dedysh, S.N.; Sinninghe Damsté, J.S. Fatty acid and hopanoid adaption to cold in the methanotroph Methylovulum psychrotolerans. Front. Microbiol. 2019, 10, 589. [Google Scholar] [CrossRef] [Green Version]
  67. Papazi, A.; Pappas, I.; Kotzabasis, K. Combinational system for biodegradation of olive oil mill wastewater phenolics and high yield of bio-hydrogen production. J. Biotechnol. 2019, 306, 47–53. [Google Scholar] [CrossRef]
Figure 1. Conditions of bacteria cultures in optimal and suboptimal temperatures, pH, and salinity. Abbreviations: P—phenol (300 mg/L); opt—optimal conditions, T—temperature, pH—pH value; S—salinity.
Water 14 02845 g001
Figure 2. Phenol degradation rates (AC) and the growth curves of S. maltophilia KB2 (DF) under different culture conditions. Abbreviations: P—phenol (300 mg/L); opt—optimal conditions, T—temperature, pH—pH value; S—salinity.
Water 14 02845 g002
Figure 3. Phenol degradation rates (AC) and the growth curves of P. moorei KB4 (DF) under different culture conditions. Abbreviations: P—phenol (300 mg/L); opt—optimal conditions, T—temperature, pH—pH value; S—salinity.
Water 14 02845 g003
Figure 4. The correlation of fatty acids isolated from S. maltophilia KB2 (A) and P. moorei KB4 (C) with PC1 and PC2 and the projection of FAME profiles of S. maltophilia KB2 (B) and P. moorei KB4 (D) growing under different culture conditions on the plane defined by PC1 and PC2.
Water 14 02845 g004
Figure 5. Projection of cluster analysis dendrograms (A) and PCA analysis biplots (B) for S. maltophilia KB2 under different culture conditions.
Water 14 02845 g005
Figure 6. Projection of cluster analysis dendrograms (A) and PCA analysis biplots (B) for P. moorei KB4 under different culture conditions.
Water 14 02845 g006
Table 1. The degradation rate constant (k), disappearance time of 50% of phenol (DT50), and disappearance rate (V) of phenol in batch cultures of S. maltophilia KB2 and P. moorei KB4 under different culture conditions.
Experimentk, /hDT50, hV, mg/L·h
S. maltophilia KB2
P(opt)0.448 ± 0.009 a1.55 ± 0.03 ab51.23 ± 0.98 b
P(T10)0.167 ± 0.024 b4.21 ± 0.65 d9.17 ± 0.33 a
P(T39)0.352 ± 0.095 a2.09 ± 0.66 a39.39 ± 2.70 c
P(pH6.5)1.036 ± 0.104 c0.67 ± 0.06 c62.33 ± 0.83 d
P(pH8.5)0.658 ± 0.053 d1.06 ± 0.09 bc48.99 ± 1.20 e
P(S2.5)0.108 ± 0.002 b6.42 ± 0.10 e12.48 ± 0.12 f
P(S5.0)0.076 ± 0.004 b9.17 ± 0.52 f10.07 ± 0.23 a
P. moorei KB4
P(opt)0.323 ± 0.041 a2.17 ± 0.26 a46.03 ± 8.22 a
P(T10)0.137 ± 0.011 b5.09 ± 0.38 b8.94 ± 0.51 c
P(T40)0.307 ± 0.081 a2.39 ± 0.74 a35.53 ± 2.19 b
P(pH6.5)0.190 ± 0.020 bc3.67 ± 0.38 c36.16 ± 2.81 b
P(pH8.5)0.254 ± 0.040 ac2.78 ± 0.48 a34.97 ± 4.21 b
P(S1.0)0.154 ± 0.018 b4.51 ± 0.49 b15.16 ± 0.13 d
P(S2.5)0.021 ± 0.003 d33.42 ± 0.96 d3.97 ± 0.16 e
Notes: Abbreviations: P—phenol (300 mg/L); opt—optimal conditions, T—temperature, pH—pH values; S—salinity. The means with different letters are significantly different (p < 0.05, LSD test) considering the treatment effect of each bacterial strain.
Table 2. The activity of catechol 2,3-D in S. maltophilia KB2, and catechol 1,2-D and catechol 2,3-D in P. moorei KB4 during degradation of phenol under different culture conditions.
Experiment Experiment
S. maltophilia KB2 P. moorei KB4
2,3-D 1,2-D2,3-D
mU/mL mU/mL
P(opt)769 ± 73 aP(opt)77.42 ± 1.10 a0.0 ± 0.0 b
P(T10)85 ± 50 bP(T10)6.38 ± 1.00 b0.0 ± 0.0 b
P(T39)282 ± 38 cP(T40)4.40 ± 0.30 c0.0 ± 0.0 b
P(pH6.5)229 ± 29 cP(pH6.5)53.90 ± 1.60 e0.0 ± 0.0 b
P(pH8.5)552 ± 61 eP(pH8.5)0.00 ± 0.00 d189.2 ± 33.2 a
P(S2.5)330 ± 30 cP(S1.0)29.04 ± 1.00 f0.0 ± 0.0 b
P(S5.0)290 ± 69 cP(S2.5)0.00 ± 0.00 d171.2 ± 62.2 a
Notes: Abbreviations: P—phenol (300 mg/L); opt—optimal conditions, T—temperature, pH—pH value; S—salinity. The means with different letters are significantly different (p < 0.05, LSD test) considering the treatment effect of each bacterial strain.
Table 3. Mean fatty acid chain length (Mean FA) and the ratio of saturated to unsaturated fatty acids (SAT/UNSAT) for S. maltophilia KB2 and P. moorei KB4 grown on phenol under various culture conditions.
ExperimentMean FASAT/UNSATExperimentMean FASAT/UNSAT
S. maltophilia KB2P. moorei KB4
P(opt)15.70 ± 0.02 a1.05 ± 0.04 aP(opt)15.59 ± 0.12 a1.98 ± 0.16 a
P(T10)15.81 ± 0.04 ac0.77 ± 0.06 bP(T10)15.43 ± 0.07 b1.08 ± 0.06 b
P(T39)16.03 ± 0.02 b1.53 ± 0.01 aP(T40)16.02 ± 0.06 c1.55 ± 0.01 c
P(pH6.5)15.94 ± 0.04 bc1.35 ± 0.20 aP(pH6.5)15.81 ± 0.06 d1.78 ± 0.30 ac
P(pH8.5)15.86 ± 0.05 b1.37 ± 0.00 aP(pH8.5)15.78 ± 0.03 d3.77 ± 0.00 d
P(S2.5)15.99 ± 0.03 b5.01 ± 0.03 cP(S1.0)15.05 ± 0.06 e4.79 ± 0.02 e
P(S5.0)15.81 ± 0.02 a2.23 ± 0.00 dP(S2.5)15.59 ± 0.11 a3.66 ± 0.02 d
Notes: Abbreviations: P—phenol (300 mg/L); opt—optimal conditions, T—temperature, pH—pH; value; S—salinity. The means with different letters are significantly different (p < 0.05, LSD test) considering the treatment effect of each bacterial strain.
Table 4. Membrane permeability (MP) of S. maltophilia KB2 and P. moorei KB4 grown on phenol under various culture conditions.
ExperimentMP, %ExperimentMP, %
S. maltophilia KB2P. moorei KB4
P(opt)52.66 ± 2.33 aP(opt)28.40 ± 1.62 a
P(T10)57.10 ± 2.09 cP(T10)55.03 ± 3.01 c
P(T39)60.95 ± 3.22 cP(T40)68.64 ± 2.22 d
P(pH6.5)43.79 ± 2.95 bP(pH6.5)42.60 ± 3.29 b
P(pH8.5)60.95 ± 1.67 cP(pH8.5)53.85 ± 4.94 c
P(S2.5)53.85 ± 5.02 abP(S1.0)89.94 ± 3.14 e
P(S5.0)49.41 ± 4.60 abP(S2.5)93.49 ± 5.38 e
Notes: Abbreviations: P—phenol (300 mg/L); opt—optimal conditions, T—temperature, pH—pH value; S—salinity. The means with different letters are significantly different (p < 0.05, LSD test) considering the treatment effect of each bacterial strain.
Table 5. Pearson’s correlation matrix for phenol degradation kinetic parameters, catechol 2,3-dioxygenase activity, membrane permeability, and FAME indexes for S. maltophilia KB2 under suboptimal growth conditions.
DT50V2,3-DMean FASAT/
UNSAT
StHyBrCyUNSATMP
DT501.000−0.874 *−0.302−0.0460.5510.338−0.158−0.0760.566−0.554−0.164
V−0.874 *1.0000.425−0.001−0.4490.0140.130−0.137−0.4770.320−0.160
2,3-D−0.3020.4251.000−0.528−0.0560.1250.680−0.662−0.2090.0200.156
Mean FA−0.046−0.001−0.5281.0000.4660.441−0.870 *0.1960.526−0.5010.157
SAT/UNSAT0.551−0.449-0.0560.4661.0000.548−0.311−0.0260.979 **−0.938 **−0.093
St0.3380.0140.1250.4410.5481.000−0.488−0.6160.505−0.795−0.067
Hy−0.1580.1300.680−0.870 *−0.311−0.4881.000-0.084−0.4290.438−0.106
Br−0.076−0.137−0.6620.196−0.026−0.616-0.0841.0000.0780.245−0.382
Cy0.566−0.477−0.2090.5260.979 **0.505−0.4290.0781.000−0.919 **−0.136
UNSAT−0.5540.3200.020−0.501−0.938 **−0.795 *0.4380.245−0.919 **1.0000.150
MP−0.164−0.1600.1560.157−0.093−0.067−0.106−0.382−0.1360.1501.000
Notes: DT50—disappearance time of 50% of phenol, V—phenol degradation rate, 2,3-D—catechol 2,3-dioxygenase, Mean FA—mean fatty acid chain length, SAT/UNSAT—saturated/unsaturated ratio, St—straight-chain, Hy—hydroxylated, Br—branched, Cy—cyclopropane, UNSAT—unsaturated fatty acids, MP—membrane permeability; * level of significance p < 0.05; ** level of significance p < 0.01.
Table 6. Pearson’s correlation matrix for phenol degradation kinetic parameters, catechol 2,3-dioxygenase activity, membrane permeability, and FAME indexes for P. moorei KB4 under suboptimal growth conditions.
DT50V1,2-D2,3-DMean FASAT/UNSATStHyBrCyUNSATMP
DT501.000−0.664−0.5000.705−0.0910.3230.495−0.576−0.2960.454−0.3550.617
V−0.6641.0000.540−0.3280.545−0.305−0.1530.3360.264−0.3720.162−0.757
1,2-D−0.5000.5401.000−0.756 *−0.072−0.502−0.3710.649−0.319−0.6250.450−0.712
2,3-D0.705−0.328−0.756 *1.0000.1420.5110.466−0.5570.4120.630−0.5760.392
Mean FA−0.0910.545−0.0720.1421.000−0.522−0.2390.104−0.033−0.3670.380−0.375
SAT/UNSAT0.323−0.305−0.5020.511−0.5221.0000.823−0.777 *0.5040.951 **−0.975 **0.626
St0.495−0.153−0.3710.466−0.2390.823 *1.000−0.910 **0.1050.785 *−0.875 **0.645
Hy−0.5760.3360.649−0.5570.104−0.777 *−0.910 **1.000−0.077−0.837 *0.794 *−0.826 *
Br−0.2960.264−0.3190.412−0.0330.5040.105−0.0771.0000.472−0.518−0.164
Cy0.454−0.372−0.6250.630−0.3670.951 **0.785 *−0.837 *0.4721.000−0.940 **0.674
UNSAT−0.3550.1620.450−0.5760.380−0.975 **−0.875 **0.794 *−0.518−0.940 **1.000−0.529
MP0.617−0.757 *−0.7120.392−0.3750.6260.645−0.826 *−0.1640.674−0.5291.000
DT50—disappearance time of 50% of phenol, V—phenol degradation rate, 2,3-D—catechol 2,3-dioxygenase, Mean FA—mean fatty acid chain length, SAT/UNSAT—saturated/unsaturated ratio, St—straight-chain, Hy—hydroxylated, Br—branched, Cy—cyclopropane, UNSAT—unsaturated fatty acids, MP—membrane permeability; * level of significance p < 0.05; ** level of significance p < 0.01.
Publisher’s Note: MDPI stays neutral with regard to jurisdictional claims in published maps and institutional affiliations.

