
Investigation of Shock Wave Pressure Transmission Patterns and Influencing Factors Caused by Underwater Drilling Blasting

1
National Inland Waterway Regulation Engineering Research Center, Chongqing Jiaotong University, Chongqing 400074, China
2
The College of River and Ocean Engineering, Chongqing Jiaotong University, Chongqing 400074, China
*
Author to whom correspondence should be addressed.
Water 2022, 14(18), 2837; https://doi.org/10.3390/w14182837
Submission received: 31 July 2022
/
Revised: 8 September 2022
/
Accepted: 9 September 2022
/
Published: 12 September 2022
(This article belongs to the Special Issue Sustainable Development of Inland Waterways)
Abstract
:Underwater blasting technology has been widely used in inland waterway improvement projects. However, due to the particularity and complexity of underwater blasting, it is difficult to predict the transmission patterns of underwater blasting shock waves. Therefore, based on the Guoyuan Port Phase II project in Chongqing, the transmission patterns and influencing factors of underwater drilling blast shock wave pressure were investigated by field monitoring and numerical simulation. In this study, a total of 45 groups of shock wave pressures were measured, and the underwater shock wave pressure transmission formula obtained through data fitting was P = 27.39 × (Q1/3/R)1.25. Furthermore, the shock wave pressure transmission process in water was numerically simulated, and the simulation results were verified using field monitoring data. The results showed that the simulation and measured results were consistent. Finally, the influence of water depth, flow rate, and flow direction on the transmission pattern of shock wave pressure was analyzed, based on a numerical simulation method. The results showed that the more blastholes there are, the smaller the peak pressure of the shock wave. The lower the depth of blasting, the faster the decay of shock wave pressure. The flow rate has less effect on the shock wave pressure. At flow rates of 1, 2, 3, and 4 m/s in the range of 0 to 50 m, the shock wave pressure in the upstream flow decreased by 5.7%, 7.4%, 9.1%, and 10.2%, respectively, compared with that in the downstream flow. This study provides a theoretical basis for safety control of underwater drilling blasting engineering in inland waterways.
1. Introduction
In inland waterway improvement projects, it is often necessary to remove obstructing reefs, to ensure the safe navigability of the waterway. At present, reef removal projects mainly adopt underwater drilling and blasting technology, which blasts reefs from inside using drilling and has the advantages of a good blast effect, high construction efficiency, and high utilization of explosive [1,2]. However, the blast instantly forms high-pressure, high-speed shock waves in water that are characterized by a high peak pressure and long propagation distance, with possible adverse impacts on the surrounding ecological environment and structures [3]. Therefore, it is important to carry out research on the pattern of the transmission of shock waves due to underwater drilling blasting, for the safe control of blast projects in waterways.
The blast shock wave will generate a high pressure around the blast center, which is transmitted outwards in the form of waves. Part of the underwater drilling blasting shock wave is transmitted directly through the underwater rock strata in the form of seismic waves, while the other part rushes out from the drill hole to form an underwater shock wave, which is transmitted through the water [4]. The theory of blasting seismic waves has been studied in previous research [4,5], but there have been few theoretical studies on the shock wave transmission pattern of underwater drilling blasting. The data on underwater blasting shock waves that can be referred to are mostly monitoring data of long-distance underwater shock waves and ground seismic waves in underwater blasting engineering, or from utilizing numerical simulation to research certain single factors [4,6].
Numerous studies on blast shock waves have been conducted, with the research methods mainly divided into field monitoring and numerical simulation. In terms of field monitoring, Tatlısuluoğlu et al. investigated the engineering characteristics of underwater blast shock waves in offshore waters in Turkey [7]. Ma et al. obtained the attenuation pattern of underwater drilling blasting shock waves in rock masses using the underwater blast of a hydropower station as the background [8]. Ge et al. provided a semi-theoretical and semi-empirical equation for underwater shock waves using shallow underwater drilling blasting tests on a seashore [9]. However, due to the complexity of the actual conditions, as well as the long cycle and low success rate of blast monitoring experiments, numerical simulation as a research method has received increasing attention in recent years, as it can, not only shorten the experimental cycle, but also, more importantly, simulate and analyze the effects of different environmental conditions on the shock wave pressure transmission characteristics, by controlling the model variables, and hence obtain a large amount of data, unobtainable from field monitoring [10,11,12]. Moradloo et al. used the three-dimensional finite element method to study the dynamic responses of dams under the action of underwater explosion shock waves [13]. Wang et al. used ANSYS/LS-DYNA to numerically simulate the explosion of TNT explosives in infinite water bodies, and the peak pressures of the underwater explosion shock waves were calculated using finite element analysis method matched values [14]. Most of these studies only focused on the similarity pattern of the underwater blast shock wave pressure. In addition, the current theoretical studies on shock waves from underwater drilling blasting still have room for improvement. As underwater drilling blasting in inland waterways is affected by factors such as a complex flow and terrain conditions, its shock waves may exhibit special transmission patterns [15,16]. However, there are relatively few studies on the transmission patterns of drilling blast shock waves in water and their influencing factors. Therefore, based on field monitoring, this study reveals the transmission patterns of underwater drilling blasting shock waves and their influencing factors through numerical simulation. The research findings provide a theoretical basis for the safe control of underwater drilling blasting projects in inland waterways.
2. Blast Shock Wave Monitoring Scheme
The area of reef removal by blasting was located at the wharf of the Guoyuan Port in Chongqing, China. A millisecond delay underwater drilling blasting technology was used in the project. The drilled blastholes each had a diameter of 100 mm and a depth of 8 m, and were arranged in a single row with a spacing of 2 m. A Φ70 mm emulsion explosive was selected for use in the project. During the project period, the water depth was 15–18 m, and the flow velocity was 1.5–3.0 m/s.
Field monitoring was conducted from July 2021 to October 2021. A Blast Pro blast shock wave tester with a sampling frequency of 4 MHz and a TP-SJB sensor with a range of 5 MPa were used as the monitoring equipment. In the field monitoring experiment, a total of three measuring points were set up, each of which was located on a small work vessel and rigidly connected. The sensors were secured to a segmented steel pipe and then placed vertically underwater, and were confirmed to be located at the horizontal line of the explosion center. The distance from the blast source was controlled by moving the vessel and measuring using GPS. The arrangement of the shock wave sensors is shown in Figure 1.
3. Results and Analysis of the Field Monitoring of Shock Waves
3.1. Field Monitoring Results
A total of 15 field monitoring experiments were conducted (as shown in Table 1), and 45 sets of shock wave pressure data from underwater drilling blasting were obtained for different source distances (8–323 m), explosive weights (6–115 kg), numbers of blastholes (1–12), and water depths (6.2–20.0 m). The field monitoring results showed that the shock wave pressure was in the range of 0.04–12.89 ×10⁵ Pa. The maximum shock wave pressure was obtained with an explosive weight of 100 kg, a measuring point distance of 8 m, and eight blastholes. Previous studies showed that the shock wave of rock blasting in air with the same explosive amount and distance was smaller than that of underwater blasting, which was caused by the difference of medium density between water and air [17].
3.2. Underwater Attenuation Characteristics of Shock Waves
Figure 2 shows the shock wave pressure time history curves of single underwater drilling blasting with an explosive weight of 100 kg, eight blastholes, a blast water depth of 15 m, and distances of 8 m, 10 m, and 12 m from the blast center to measuring points 1, 2, and 3, respectively. As shown in Figure 2, the underwater drilling blasting shock wave had a very high peak pressure, which reached more than 12.89 × 10⁵ Pa at 8 m, under an explosive weight of 100 kg. The peak pressure gradually decreased as the shock wave transmission distance increased. The peak pressure of the shock wave was 11.35 × 10⁵ Pa and 9.69 × 10⁵ Pa at distances of 10 m and 12 m, respectively. The peak pressure at point 2 was attenuated by 11.9% compared with that at point 1, and the peak pressure at point 3 was attenuated by 24.8% and 14.6% compared with those at points 1 and 2, respectively.
The peak pressure of the shock wave was an instantaneous pressure with a very steep rise; that is, the peak was generated extremely rapidly, with less than 1 ms from the initial pressure to the peak pressure. After reaching the peak, the shock wave was attenuated rapidly in an exponential form, a process that took only 1 to 1.5 ms. The attenuation ended with a short negative pressure, which gradually decreased with time and propagation distance. The complete duration of the shock wave was extremely short, less than 20 ms from generation to end.
The shock wave propagates through the medium and its velocity varies with the density of the medium. Water is about 800 times denser than air, so underwater shock waves travel faster and farther than airborne shock waves [18]. Recent studies indicated that the propagation speed of a shock wave in water was about three to four times that in air [19].
3.3. Fitting of the Shock Wave Monitoring Data
The transmission of the pressure of a blast shock wave with distance is generally calculated using the classical pressure equation of Cole et al., as follows [20]:
where P is the pressure of the shock wave, 105 Pa; Q is the explosive weight, kg; R is the distance from the measuring point to the blast source, m; and K and α are empirical coefficients that are influenced by factors such as explosive type, blast method, blasthole structure, and explosion water depth, and are determined according to the actual conditions.
Based on the fitting of the 45 sets of field monitoring data of shock wave pressure, the empirical equation for the variation in the pressure of the underwater drilling blasting shock wave with distance and explosive weight was obtained. In the equation, the empirical coefficients K and α are 27.39 and 1.25, respectively, and the fitting coefficient R2 is 0.93, indicating that fitting Equation (2) had a good correlation with the field monitoring data. Therefore, this equation can accurately reflect the pattern of transmission of the pressure of the shock wave with the distance and the explosive weight. The fitting results are shown in Figure 3.
Previous research results showed that there was a difference between the K value and α value in the empirical formula of underwater blasting shock wave pressure under different blasting methods (as shown in Table 2) [21,22,23]. The results of this study were consistent with previous conclusions and conform to the pattern of shock wave transmission under underwater drilling blasting.
4. Numerical Simulation of Underwater Blast Shock Waves
4.1. Modeling
A geometric model of underwater drilling blasting for reef removal consistent with the engineering field was established (Figure 4), to identify the pattern of the propagation of the blast shock wave pressure in water through numerical simulation. In Figure 4, the blue mesh is the water body, with a length of 100 m, a depth of 16 m, and an initial flow velocity of 2 m/s; the gray part is the air, with a length of 100 m and a height of 2 m; the brown mesh is the blast target reef, with a length of 4 m and a height of 6 m; and the red part is the explosive, with a weight of 48 kg and a drilling depth of 4 m. The meshes consist of 10 × 10 × 10 cm square grids (Figure 5). In this study, a quasi-3D model with a thickness of 0.1 m was used; i.e., a section was cut out from the infinite body under the actual conditions for modeling. After that, the geometric model was imported into ANSYS/LS-DYNA 12.0 (Livermore Software Technology Corporation, Troy, MI, USA) for preprocessing. The model was discretized by 3D solid elements “solid 164” and adopted the cm-g-us unit system. Nonreflecting boundaries were used for the left and right boundaries of the water body, and a reflecting boundary was used for the water–air interface.
4.2. Material Model and Parameters
The materials used for the reefs and blasthole plugs can be equated to concrete; i.e., the concrete constitutive model (* MAT_JOHNSON_HOLMQUIST_CONCRETE) was used for the reefs and plugs in the model [24]. The mechanical property parameters of the reef and plugging material model are shown in Table 3.
The high-energy explosive material model (* MAT_HIGH_EXPLOSIVE_BURN) was used for the explosive, which is described by the Jones-Wilkins-Lee (JWL) equation of state, with the parameters detailed in Table 4 and the following expression [25]:
where P is the pressure; E0 is the initial internal energy density; V is the relative volume, V = ρ0/ρ, in which ρ is the density of the explosive product and ρ0 is the initial density of the explosive; e is the specific internal energy of the detonation product; and A, B, R1, R2, and ω are material constants.
In this study, the water and air were defined as null material models (MAT_NULL), and the water under high pressure was described by the Gruneisen equation of state; the parameters are listed in Table 5, and the equation is expressed as follows [26]:
where ρ0 is the initial density of the material; γ0 is the Gruneisen parameter; E0 is the initial internal energy; C is the intercept of the curve; S1, S2, and S3 are the slope coefficients of the curve; μ is the dynamic viscosity coefficient; and α is the first-order volume correction of γ0 and μ.
4.3. Analysis and Verification of the Simulation Results
Figure 6 shows contour plots for the transmission of the shock wave pressure of the underwater drilling blast. The red parts in the figure are the peak pressure areas of the shock wave.
The contour plots of the underwater shock wave pressure at different times show that, after the detonation of the cylindrical charge in the blasthole, the explosion energy expands rapidly to the two ends and breaks the rock, and then rushes out of the blasthole, being released in the water, and forming a shock wave and propagating into the surrounding water in a spherical form. Before the shock wave is transmitted to the interface between the water and the air, the maximum pressure area of the water body is located directly above the blasthole. As the shock wave is transmitted to the water surface, it is reflected. The reflected wave has a significant weakening effect on the incident wave, forming a negative pressure cut-off area above the blasthole [27], while the shock wave in the horizontal direction is not affected by the boundary, and the peak pressure attenuates naturally, decreasing with increasing transmission distance.
To verify the accuracy of the numerical simulation, simulations were conducted for drilling blasting with explosive weights of 16 kg, 36 kg, 66 kg, and 100 kg under actual conditions. Based on the simulation results, 38 elements with an appropriate spacing were selected from the range 0–200 m upstream of the horizontal line of the explosion center for shock wave pressure analysis and were compared with the data obtained from the field monitoring.
The verification results show that the pressure transmission pattern of the shock wave obtained from the numerical simulation is consistent with the pressure of the shock wave obtained from the field monitoring (as shown in Figure 7). Therefore, the calculation results of the numerical simulation method are reliable, and hence, the model could be used to further investigate the pressure transmission pattern of shock waves under the influence of water depth, flow velocity, and flow direction.
4.4. Factors Influencing the Blast Shock Wave Transmission Characteristics
4.4.1. Number of Blastholes
The pressures of the blast shock wave under the same water depth, the same explosive weight, and different numbers of blastholes were obtained using the numerical model. The results are shown in Figure 8. When the numbers of blastholes was 1, 2, 3, and 4, the peak pressures at the center of the explosion were 36.33, 20.13, 17.02, and 10.04 × 10⁵ Pa, respectively, indicating that the peak pressure of the shock wave varied significantly with the number of blastholes, and that the more blastholes there are, the smaller the peak pressure of the shock wave.
4.4.2. Water Depth
With the other influencing factors remaining unchanged, underwater drilling blasting models with blast water depths of 5 m, 10 m, and 16 m were established, and the calculation results were analyzed. Figure 9 compares the results of the peak pressure transmission patterns of the shock wave at three blast water depths.
The results show that when the same weight of explosive was detonated at different water depths, there were no significant differences in the peak pressure transmission pattern of the shock wave within 10 m from the blast source. Greater than 10 m away from the blast source, the attenuation rate of the peak pressure of the shock wave increased with decreasing blast water depth, and when blasting occurred near the water surface, the peak pressure of the shock wave was attenuated particularly rapidly. In the ranges of 0–50 m, 10–50 m, 20–50 m, and 30–50 m from the blast source, the peak pressures of the shock wave with a blast water depth of 10 m were, on average, 9.8%, 13.3%, 17.7%, and 20.5% lower than those with a blast water depth of 16 m, respectively; the peak pressures of the shock wave with a blast water depth of 5 m were, on average, 33.4%, 45.0%, 56.8%, and 63.5% lower than those with a blast water depth of 10 m, respectively.
According to the simulation diagram of the shock wave pressure, it is speculated that this change was mainly caused by the reflection effect of the water surface on the shock wave; the closer the distance from the water surface, the larger the reflected wave from the water surface, and the more pronounced the offsetting effect on the shock wave [28]. In addition, the impact of the reflected wave was more significant due to the lower peak pressure of the shock wave at a greater distance [29].
4.4.3. Water Velocity
This study also established underwater drilling blasting models with water velocities of 0 m/s, 1 m/s, 2 m/s, 3 m/s, and 4 m/s, to investigate the transmission pattern of the shock wave along the flow direction at different flow velocities. The simulation results are shown in Figure 10.
Figure 10 shows that the peak pressure transmission pattern of the shock wave varied little with the flow velocity and had no obvious correlation with the flow velocity. This is mainly because a uniform flow was considered for the water body in the model constructed in this study; i.e., the changes in factors such as water turbulence, water density, and sediment concentration caused by changes in flow velocity were not considered [1]. This also occurred because the flow of inland waterways is approximately stationary considering its velocity (1–3 m/s) relative to the shock wave transmission velocity, and thus, the velocity had little influence on the shock wave transmission pattern.
4.4.4. Flow Direction
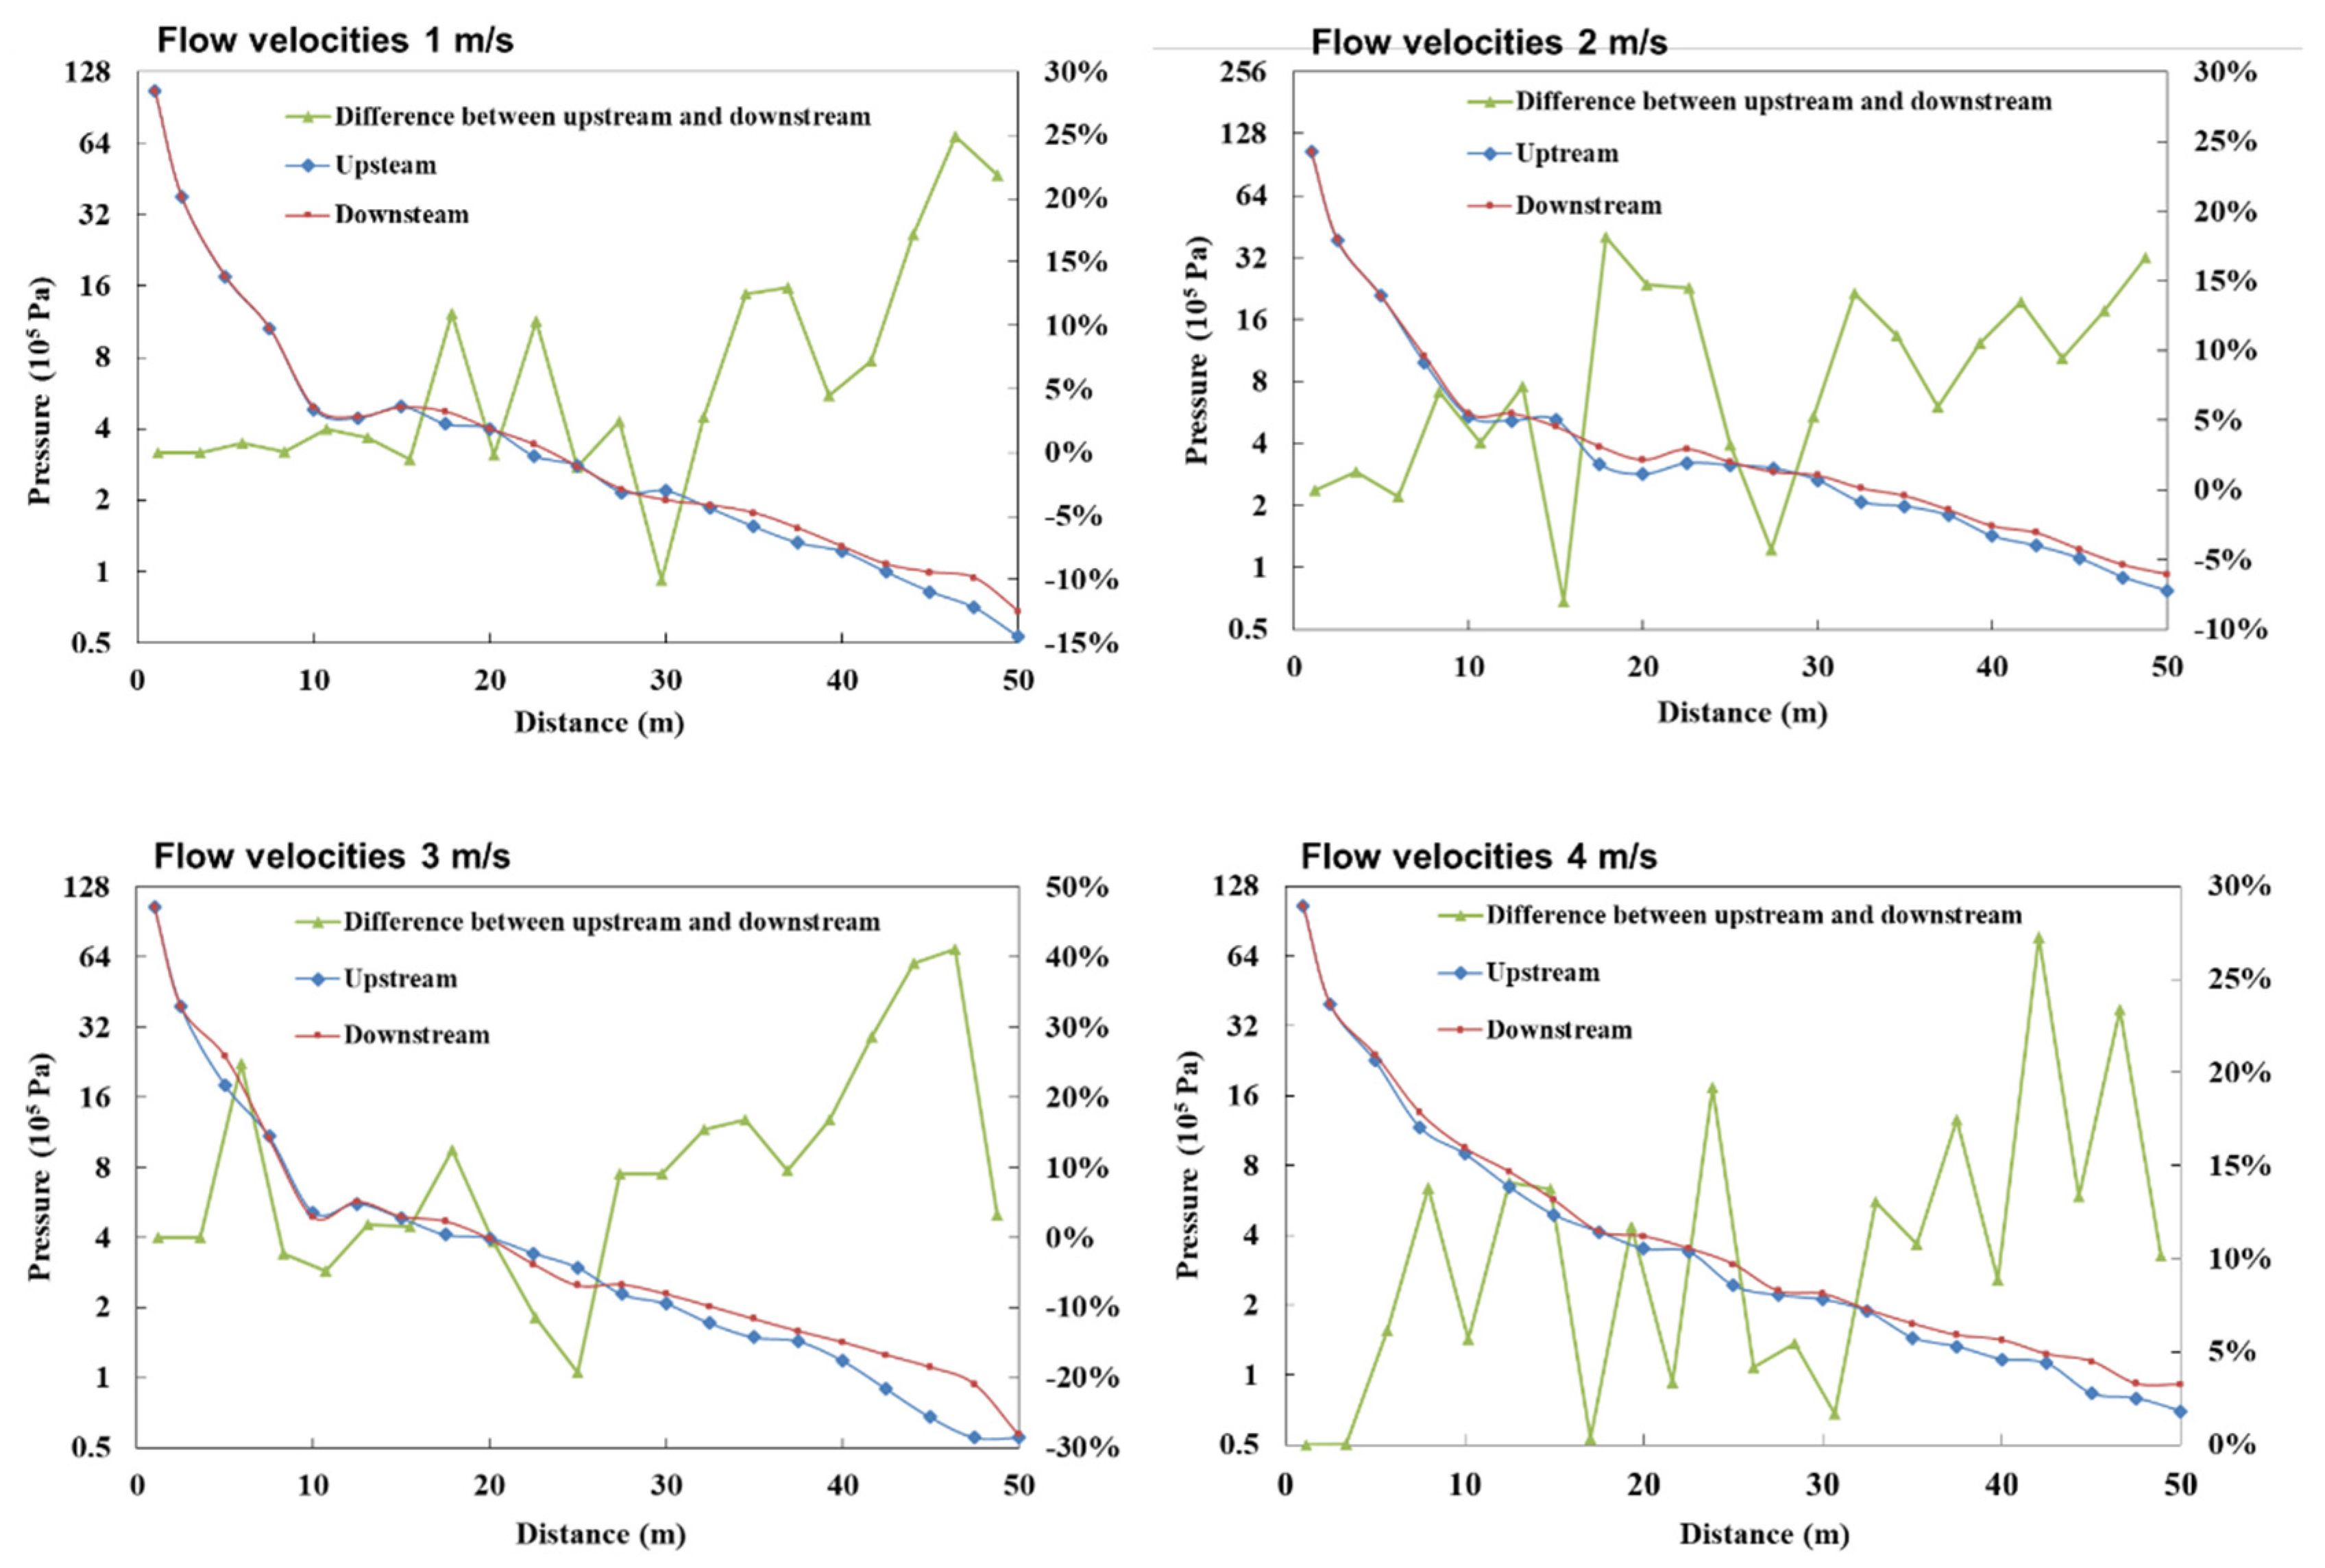
The model built in this study was symmetric. To investigate the influence of the flow direction on the transmission from the shock wave, 21 elements with symmetrical positions and distances were selected in the upstream and downstream, respectively, for comparison of the peak pressure transmission patterns of the shock wave, as shown in Figure 11.
The results show that the peak pressure attenuation rate of the upstream shock wave was slightly greater than that of the downstream shock wave. In a water body with flow velocities of 1 m/s, 2 m/s, 3 m/s, and 4 m/s, the peak pressure of the upstream shock wave was attenuated compared to that of the downstream shock wave. Specifically, the degree of attenuation was approximately 5.7%, 7.4%, 9.1%, and 10.2% within the distance range of 0 to 50 m; the degree of attenuation was approximately 0.6%, 3.1%, 3.5%, and 5.1% within the distance range of 0 to 10 m; the degree of attenuation was approximately 1.6%, 6.4%, 5.1%, and 8.3% within the distance range of 10 to 30 m; and the degree of attenuation was approximately 14.4%, 11.8%, 17.1%, and 16.3% within the distance range of 30 to 50 m, respectively.
Therefore, the degree of attenuation of the peak pressure of the upstream shock wave compared to that of the downstream shock wave is proportional to the flow velocity, and the attenuation degree becomes more pronounced with increasing propagation distance, showing a certain linear correlation. This is mainly because the transmission direction of the upstream shock wave is opposite to the direction of the water movement, so the kinetic energy of the water body offsets the energy of the shock wave to some extent, and the higher the flow velocity, the greater the kinetic energy of the water body and the more pronounced the offsetting effect [30]. In addition, as the transmission distance increases, the energy of the shock wave itself is gradually attenuated, the ratio of the energy offset by the kinetic energy of the water body to the energy of the shock wave gradually increases, and hence, its offsetting effect becomes more obvious [30].
This study analyzed the transmission patterns and influencing factors of underwater drilling blasting shock waves through field monitoring and numerical simulation. Based on the conclusions of this study and combined with the blasting safety regulations (GB6722-2003), construction engineers can more accurately determine the blasting construction safety distance of human and aquatic organisms, according to the explosive weight and hydrological factors, in inland waterway regulating engineering.
5. Conclusions
- (1)
- Based on the field monitoring data, an accurate empirical equation for the peak pressure of the underwater drilling blasting shock wave was fitted as P = 27.39 × (Q1/3/R)1.25, which is accurate in estimating the shock wave pressure with different explosive weights and blast source distances in underwater drilling blasting projects.
- (2)
- The transmission characteristics of the drilling blasting shock wave in water were numerically simulated using the software ANSYS/LS-DYNA. The results showed that the shock wave propagates into the surrounding water in a spherical form and reflects when reaching the water surface, and the reflected wave has a significant weakening effect on the incident wave.
- (3)
- The numerical simulation results showed the following: With a fixed weight of explosive, the more blastholes there are, the smaller the peak pressure of the shock wave; the smaller the blast water depth is, the more quickly the peak pressure of the shock wave is attenuated; the flow velocity has little influence on the shock wave transmission, while the flow direction has a certain influence, where the pressure of the shock wave is slightly lower in the upstream direction than in the downstream direction, and the higher the flow velocity is, the greater the difference and the more pronounced the degree of decrease with increasing distance.
Author Contributions
Conceptualization, W.L.; data curation, Y.W. and X.Y.; funding acquisition, W.L.; methodology, Y.W. and X.Y.; resources, W.L. and H.D.; supervision, W.L.; validation, Y.W. and H.D.; visualization, W.L. and H.D.; writing—original draft, Y.W. and X.Y.; writing—review and editing, W.L. and H.D. All authors have read and agreed to the published version of the manuscript.
Funding
This research was supported by National Natural Science Foundation of China (52279058, 51779164), Natural Science Foundation of Chongqing, China (cstc2021jcyj-jqX0009, cstc2021jcyj-msxm2522), Science and Technology Project from Yichang Waterway Engineering Bureau of Yangtze River (YG04-CF-QT-2021024), Science and Technology Project from Chongqing Urban Administration (2021).
Institutional Review Board Statement
Not applicable.
Informed Consent Statement
Not applicable.
Data Availability Statement
Not applicable.
Conflicts of Interest
The authors declare no conflict of interest.
References
- Gu, W.; Wang, Z.; Liu, J.; Xu, J.; Liu, X.; Cao, T. Water-Depth-Based Prediction Formula for the Blasting Vibration Velocity of Lighthouse Caused by Underwater Drilling Blasting. Shock Vib. 2017, 2017, 7340845. [Google Scholar] [CrossRef]
- Peng, Y.; Wu, L.; Chen, C.; Zhu, B.; Jia, Q. Study on the Robust Regression of the Prediction of Vibration Velocity in Underwater Drilling and Blasting. Arab. J. Sci. Eng. 2018, 43, 5541–5549. [Google Scholar] [CrossRef]
- Bach, L.; Nielsen, M.H.; Bollwerk, S.M. Environmental Impact of Submarine Rock Blasting and Dredging Operations in an Arctic Harbor Area: Dispersal and Bioavailability of Sediment-Associated Heavy Metals. Water Air Soil Pollut. 2017, 228, 198. [Google Scholar] [CrossRef]
- Wang, Z.-X.; Gu, W.-B.; Liang, T.; Zhao, S.-T.; Chen, P.; Yu, L.-F. Monitoring and Prediction of the Vibration Intensity of Seismic Waves Induced in Underwater Rock by Underwater Drilling and Blasting. Def. Technol. 2022, 18, 109–118. [Google Scholar] [CrossRef]
- Peng, Y.; Wu, L.; Su, Y.; Zhu, B.; Chen, C.; Li, B. Review of research on safety control of seismic wave and shock wave induced by underwater blasting. Geosystem Eng. 2017, 20, 172–179. [Google Scholar] [CrossRef]
- Seo, S.-I.; Sagong, M.; Son, S.-W. Global response of submerged floating tunnel against underwater explosion. KSCE J. Civ. Eng. 2015, 19, 2029–2034. [Google Scholar] [CrossRef]
- Tatlısuluoğlu, A.; Beji, S. Blast Pressure Measurements of an Underwater Detonation in the Sea. J. Mar. Sci. Appl. 2021, 20, 706–713. [Google Scholar] [CrossRef]
- Ma, Y.; Liu, C.; Wang, P.; Zhu, J.; Zhou, X. Blast Vibration Control in A Hydropower Station for the Safety of Adjacent Structure. Appl. Sci. 2020, 10, 6195. [Google Scholar] [CrossRef]
- Ge, S.; Zu, Y.C.; Yuan, L.; Ming, S.Z.; Jian, Y.W. Experimental and numerical investigation of the centrifugal model for underwater explosion shock wave and bubble pulsation. Ocean Eng. 2017, 142, 523–531. [Google Scholar] [CrossRef]
- Zhang, S.; Wang, G.; Wang, C.; Pang, B.; Du, C. Numerical simulation of failure modes of concrete gravity dams subjected to underwater explosion. Eng. Fail. Anal. 2014, 36, 49–64. [Google Scholar] [CrossRef]
- Schiffer, A.; Tagarielli, V.L. The response of circular composite plates to underwater blast: Experiments and modelling. J. Fluids Struct. 2015, 52, 130–144. [Google Scholar] [CrossRef]
- Koli, S.; Chellapandi, P.; Rao, L.B.; Sawant, A. Study on JWL equation of state for the numerical simulation of near-field and far-field effects in underwater explosion scenario. Eng. Sci. Technol. 2020, 23, 758–768. [Google Scholar] [CrossRef]
- Moradloo, A.J.; Adib, A.; Pirooznia, A. Damage analysis of arch concrete dams subjected to underwater explosion. Appl. Math. Model. 2019, 75, 709–734. [Google Scholar] [CrossRef]
- Wang, G.; Wang, Y.; Lu, W.; Zhou, W.; Chen, M.; Yan, P. On the determination of the mesh size for numerical simulations of shock wave propagation in near field underwater explosion. Appl. Ocean Res. 2016, 59, 1–9. [Google Scholar] [CrossRef]
- Wang, T.; Guo, X.; Fu, H.; Guo, Y.; Peng, X.; Wu, Y.; Li, J.; Xia, Y. Effects of Water Depth and Ice Thickness on Ice Cover Blasting for Ice Jam Flood Prevention: A Case Study on the Heilong River, China. Water 2018, 10, 700. [Google Scholar] [CrossRef]
- Li, X.F.; Li, H.B.; Zhang, G.K. Damage assessment and blast vibrations controlling considering rock properties of underwater blasting. Int. J. Rock Mech. Min. 2019, 121, 104045. [Google Scholar] [CrossRef]
- Balakrishnan, V.; Pradhan, M.; Dhekne, P.Y. Investigating rock fragmentation in distributed spherical air-gap blasting technique. Powder Technol. 2020, 362, 101–110. [Google Scholar] [CrossRef]
- Nakagawa, A.; Manley, G.T.; Gean, A.D.; Ohtani, K.; Armonda, R.; Tsukamoto, A.; Yamamoto, H.; Takayama, K.; Tominaga, T. Mechanisms of Primary Blast-Induced Traumatic Brain Injury: Insights from Shock-Wave Research. J. Neurotrauma 2011, 28, 1101–1119. [Google Scholar] [CrossRef]
- Chemin, A.; Fawaz, M.W.; Amans, D. Investigation of the blast pressure following laser ablation at a solid–fluid interface using shock waves dynamics in air and in water. Appl. Surf. Sci. 2022, 574, 151592. [Google Scholar] [CrossRef]
- Cole, R.H.; Weller, R. Underwater explosions. Phys. Today. 1948, 1, 35. [Google Scholar] [CrossRef]
- Zhang, P.; Ye, X.; Gu, W.; Liu, W.; Yang, T.; Cui, Y. Testing and analysis of shock waves from explosion of spherical charges at shallow water bottom. Eng. Blasting 2000, 1, 15–20. [Google Scholar]
- Li, H.; Zhao, L.; Ning, Y.; Li, B.; Ju, X.; Zhang, Y.; Chen, G. Testing and analyzing pressure product by submarine explosion with spherical charges. Eng. Blasting 2005, 1, 16–21. [Google Scholar]
- Sun, Y.; Long, Y.; Shao, L.; Xie, X.B. Experimental investigation of shock wave in water of underwater drilling blasting. Eng. Blasting 2007, 13, 15–19. [Google Scholar]
- Chen, X.; Xu, L.; Zhu, Q. Mechanical behavior and damage evolution for concrete subjected to multiple impact loading. KSCE J. Civ. Eng. 2017, 21, 2351–2359. [Google Scholar] [CrossRef]
- Jing, L.; Wang, Z.; Zhao, L. Dynamic response of cylindrical sandwich shells with metallic foam cores under blast loading—numerical simulations. Compos. Struct. 2013, 99, 213–223. [Google Scholar] [CrossRef]
- Xue, Y.; Si, H.; Chen, G. The fragmentation mechanism of coal impacted by water jets and abrasive jets. Powder Technol. 2020, 361, 849–859. [Google Scholar] [CrossRef]
- Sugiyama, Y.; Tanaka, T.; Matsuo, A.; Homae, T.; Wakabayashi, K.; Matsumura, T.; Nakayama, Y. Numerical simulation of blast wave mitigation achieved by water inside a subsurface magazine model. J. Loss Prevent. Proc. 2016, 43, 521–528. [Google Scholar] [CrossRef]
- Ohl, C.D. Cavitation inception following shock wave passage. Phys. Fluids 2002, 14, 3512–3521. [Google Scholar] [CrossRef]
- Wang, Z.; Lu, Y.; Hao, H. Numerical Investigation of Effects of Water Saturation on Blast Wave Propagation in Soil Mass. J. Eng. Mech. 2004, 130, 551–561. [Google Scholar] [CrossRef]
- Hempen, G.L. Air-Screen Reduction of Water-Borne Energy from Underwater Blasting; University of Missouri-Rolla: Rolla, MO, USA, 1993. [Google Scholar]
Figure 1.
Diagram of the field monitoring.

Figure 2.
Time history curve of shock wave pressure.

Figure 3.
Shock wave monitoring data fitting.

Figure 4.
Schematic diagram of the model.

Figure 5.
Schematic diagram of reef grid division.

Figure 6.
Diagram of shock wave pressure transmission.

Figure 7.
Verification of simulation results.

Figure 8.
Transmission pattern of shock wave pressure with different numbers of holes.

Figure 9.
Transmission pattern of shock wave pressure under different water depths.

Figure 10.
Transmission pattern of shock wave pressure at different flow velocities.

Figure 11.
Shock wave pressure upstream and downstream.


Table 1.
The results of field monitoring.
| Number of Monitoring | Monitoring Points | Total Amount of Explosive (kg) | Distance from the Blasting (m) | Hole Number | Depth of Water (m) | Pressure (105 Pa) |
|---|---|---|---|---|---|---|
| 1 | 1 | 6 | 70 | 1 | 12.8 | 0.49 |
| 2 | 6 | 90 | 1 | 12.8 | 0.16 | |
| 3 | 6 | 100 | 1 | 12.8 | 0.13 | |
| 2 | 1 | 8 | 39 | 1 | 12.8 | 1.48 |
| 2 | 8 | 70 | 1 | 12.8 | 0.30 | |
| 3 | 8 | 222 | 1 | 12.8 | 0.21 | |
| 3 | 1 | 12 | 50 | 1 | 15.0 | 0.52 |
| 2 | 12 | 90 | 1 | 15.0 | 0.24 | |
| 3 | 12 | 110 | 1 | 15.0 | 0.23 | |
| 4 | 1 | 16 | 34 | 2 | 12.8 | 0.86 |
| 2 | 16 | 50 | 2 | 12.8 | 0.69 | |
| 3 | 16 | 80 | 2 | 12.8 | 0.39 | |
| 5 | 1 | 20 | 30 | 3 | 15.0 | 1.34 |
| 2 | 20 | 50 | 3 | 15.0 | 0.80 | |
| 3 | 20 | 80 | 3 | 15.0 | 0.38 | |
| 6 | 1 | 20 | 34 | 3 | 12.8 | 1.71 |
| 2 | 20 | 44 | 3 | 12.8 | 0.92 | |
| 3 | 20 | 56 | 3 | 12.8 | 0.47 | |
| 7 | 1 | 34 | 67 | 5 | 20.0 | 0.98 |
| 2 | 34 | 87 | 5 | 20.0 | 0.59 | |
| 3 | 34 | 90 | 5 | 20.0 | 0.23 | |
| 8 | 1 | 36 | 80 | 5 | 9.0 | 0.82 |
| 2 | 36 | 90 | 5 | 9.0 | 0.71 | |
| 3 | 36 | 252 | 5 | 9.0 | 0.07 | |
| 9 | 1 | 38 | 67 | 7 | 13.9 | 0.50 |
| 2 | 38 | 67 | 7 | 13.9 | 0.71 | |
| 3 | 38 | 67 | 7 | 13.9 | 0.43 | |
| 10 | 1 | 44 | 86 | 5 | 20.0 | 0.35 |
| 2 | 44 | 207 | 5 | 20.0 | 0.14 | |
| 3 | 44 | 323 | 5 | 20.0 | 0.04 | |
| 11 | 1 | 48 | 57 | 4 | 6.2 | 0.69 |
| 2 | 48 | 77 | 4 | 6.2 | 0.38 | |
| 3 | 48 | 200 | 4 | 6.2 | 0.15 | |
| 12 | 1 | 66 | 20 | 5 | 15.0 | 3.53 |
| 2 | 66 | 30 | 5 | 15.0 | 2.45 | |
| 3 | 66 | 40 | 5 | 15.0 | 1.16 | |
| 13 | 1 | 100 | 8 | 8 | 15.0 | 12.89 |
| 2 | 100 | 10 | 8 | 15.0 | 11.35 | |
| 3 | 100 | 12 | 8 | 15.0 | 9.69 | |
| 14 | 1 | 105 | 18 | 9 | 20.0 | 4.82 |
| 2 | 105 | 19 | 9 | 20.0 | 4.58 | |
| 3 | 105 | 20 | 9 | 20.0 | 4.23 | |
| 15 | 1 | 115 | 17 | 12 | 20.0 | 5.33 |
| 2 | 115 | 18 | 12 | 20.0 | 5.25 | |
| 3 | 115 | 19 | 12 | 20.0 | 5.18 |
| Coefficient | Blasting Pattern | |
|---|---|---|
| K | α | |
| 415~555 | 1.05~1.15 | Blasting in water |
| 203~319 | 1.21~1.34 | A single charge blasting in water |
| 31.0~51.0 | 1.10~2.00 | Underwater drilling blasting |
Table 3.
Physical parameters of the reef and plug.
| Material | Density ρ (g·cm−3) | Elasticity Modulus E (GPa) | Compressive Strength σ (MPa) | Tensile Strength σmtl (MPa) | Poisson Ratio v |
|---|---|---|---|---|---|
| Reef | 2.65 | 68.69 | 160 | 5.6 | 0.25 |
| Hole stemming | 1.75 | 0.00016 | 5.00 | 0.30 | 0.20 |
Table 4.
Explosives state equation parameters.
| Parameter | Density ρ (g·cm−3) | Explosive Velocity (m·s−1) | A (GPa) | B (GPa) | R1 | R2 | ω | E0 (GJ·m−3) | Pcj (GPa) |
|---|---|---|---|---|---|---|---|---|---|
| Value | 1.63 | 4500 | 216.7 | 0.184 | 4.2 | 0.9 | 0.15 | 4.1 | 18.5 |
Table 5.
Water and air state equation parameters.
| Material | ρ0 (kg·m−3) | C (km·s−1) | S1 | S2 | S3 | μ (10−4) | γ0 | E0 |
|---|---|---|---|---|---|---|---|---|
| Water | 1.02 | 1.647 | 1.92 | −0.096 | 0 | 8.9 | 0.35 | 0 |
| Air | 0.00129 | 0.344 | 0 | 0 | 0 | 0.18 | 1.40 | 0 |
Publisher’s Note: MDPI stays neutral with regard to jurisdictional claims in published maps and institutional affiliations. |
© 2022 by the authors. Licensee MDPI, Basel, Switzerland. This article is an open access article distributed under the terms and conditions of the Creative Commons Attribution (CC BY) license (https://creativecommons.org/licenses/by/4.0/).
Share and Cite
MDPI and ACS Style
Wan, Y.; Li, W.; Du, H.; Yang, X. Investigation of Shock Wave Pressure Transmission Patterns and Influencing Factors Caused by Underwater Drilling Blasting. Water 2022, 14, 2837. https://doi.org/10.3390/w14182837
AMA Style
Wan Y, Li W, Du H, Yang X. Investigation of Shock Wave Pressure Transmission Patterns and Influencing Factors Caused by Underwater Drilling Blasting. Water. 2022; 14(18):2837. https://doi.org/10.3390/w14182837
Chicago/Turabian StyleWan, Yu, Wenjie Li, Hongbo Du, and Xiao Yang. 2022. "Investigation of Shock Wave Pressure Transmission Patterns and Influencing Factors Caused by Underwater Drilling Blasting" Water 14, no. 18: 2837. https://doi.org/10.3390/w14182837
Note that from the first issue of 2016, this journal uses article numbers instead of page numbers. See further details here.