
Changes in the Stability Landscape of a River Basin by Anthropogenic Droughts

Department of Land, Air, and Water Resources, University of California, Davis, CA 95616, USA
*
Author to whom correspondence should be addressed.
Water 2022, 14(18), 2835; https://doi.org/10.3390/w14182835
Submission received: 6 August 2022
/
Revised: 31 August 2022
/
Accepted: 6 September 2022
/
Published: 12 September 2022
(This article belongs to the Special Issue Assessing Hydrological Drought in a Climate Change: Methods and Measures)
Abstract
:As water resources enter the era of the Anthropocene, the process of anthropogenic droughts arises as the interplay between climate cycles and human-centered water management in rivers. In their natural conditions, rivers exhibit a natural hydrologic variability, wet and dry cycles, that are a vital property for promoting ecological resilience. Human activities alter the temporal variability of streamflow, a resilience property of river systems. We argue that anthropogenic droughts in river basins can lead to changes in the resilience properties of the system depicted in stability landscapes. This study aims to analyze anthropogenic droughts and the changes provoked to the stability landscapes of the streamflow system of a river basin. We use 110 years of regulated and naturalized streamflow data to analyze the hydrologic variability (wet periods and droughts) of a river system. First, we determined the streamflow drought index (SDI), and the results were assessed using probability distribution functions to construct stability landscapes and explore the resilience properties of the system. The transboundary basin of the Rio Grande/Rio Bravo (RGB) is used as a case study. Our main findings include evidence of resilience erosion and alterations to the properties of the stability landscape by the human-induced megadrought in the RGB, which resulted from extensive anthropogenic alteration and fragmentation of the river system. The novelty of this research is to provide a baseline and move forward into quantifying ecological resilience attributes of river basins in water resources planning and management.
1. Introduction
As social-ecological systems (SES), river basins are inherently bound to a fundamental property of ecological resilience: dynamism, expressed by the temporal variability of the natural flow regime. Historic cycles of flooding and drought in the natural flow regime are integral components of most intact running water ecosystems [1] as these exert dominant controls on ecosystem structure and function [2]. As water resources are well into the era of the Anthropocene, climate change and human dominance pose pressing challenges to the hydrologic cycle and its components, putting the integrity and resilience of river basins at higher risk. The human influence on the global hydrological cycle is now the dominant force behind changes in water variability across the world and in regulating and triggering hydrologic resilience changes in the Earth system. Globally, extreme weather or climate events are expected to become more frequent and increase in intensity and duration, due to climate change and are largely exacerbated by the persistent pressures of human water demands in creating such extreme environmental conditions. The complex and interrelated processes between natural and human-induced changes drive the development of anthropogenic droughts [3,4,5,6]; a compound multidimensional and multiscale phenomenon governed by the combination of natural water variability, climate change, human decisions and activities, and altered micro-climate conditions due to changes in land and water management [3]. The growing frequency of precipitation extremes, especially droughts, will have profound consequences on the hydrologic variability of the streamflow systems and the natural flow regime, creating selective pressures in the environment and society. In return, this will affect the resilience of river basins and the capacity of systems to withstand shocks and perturbations without modifying their functional identity and adapting to changing conditions [7].
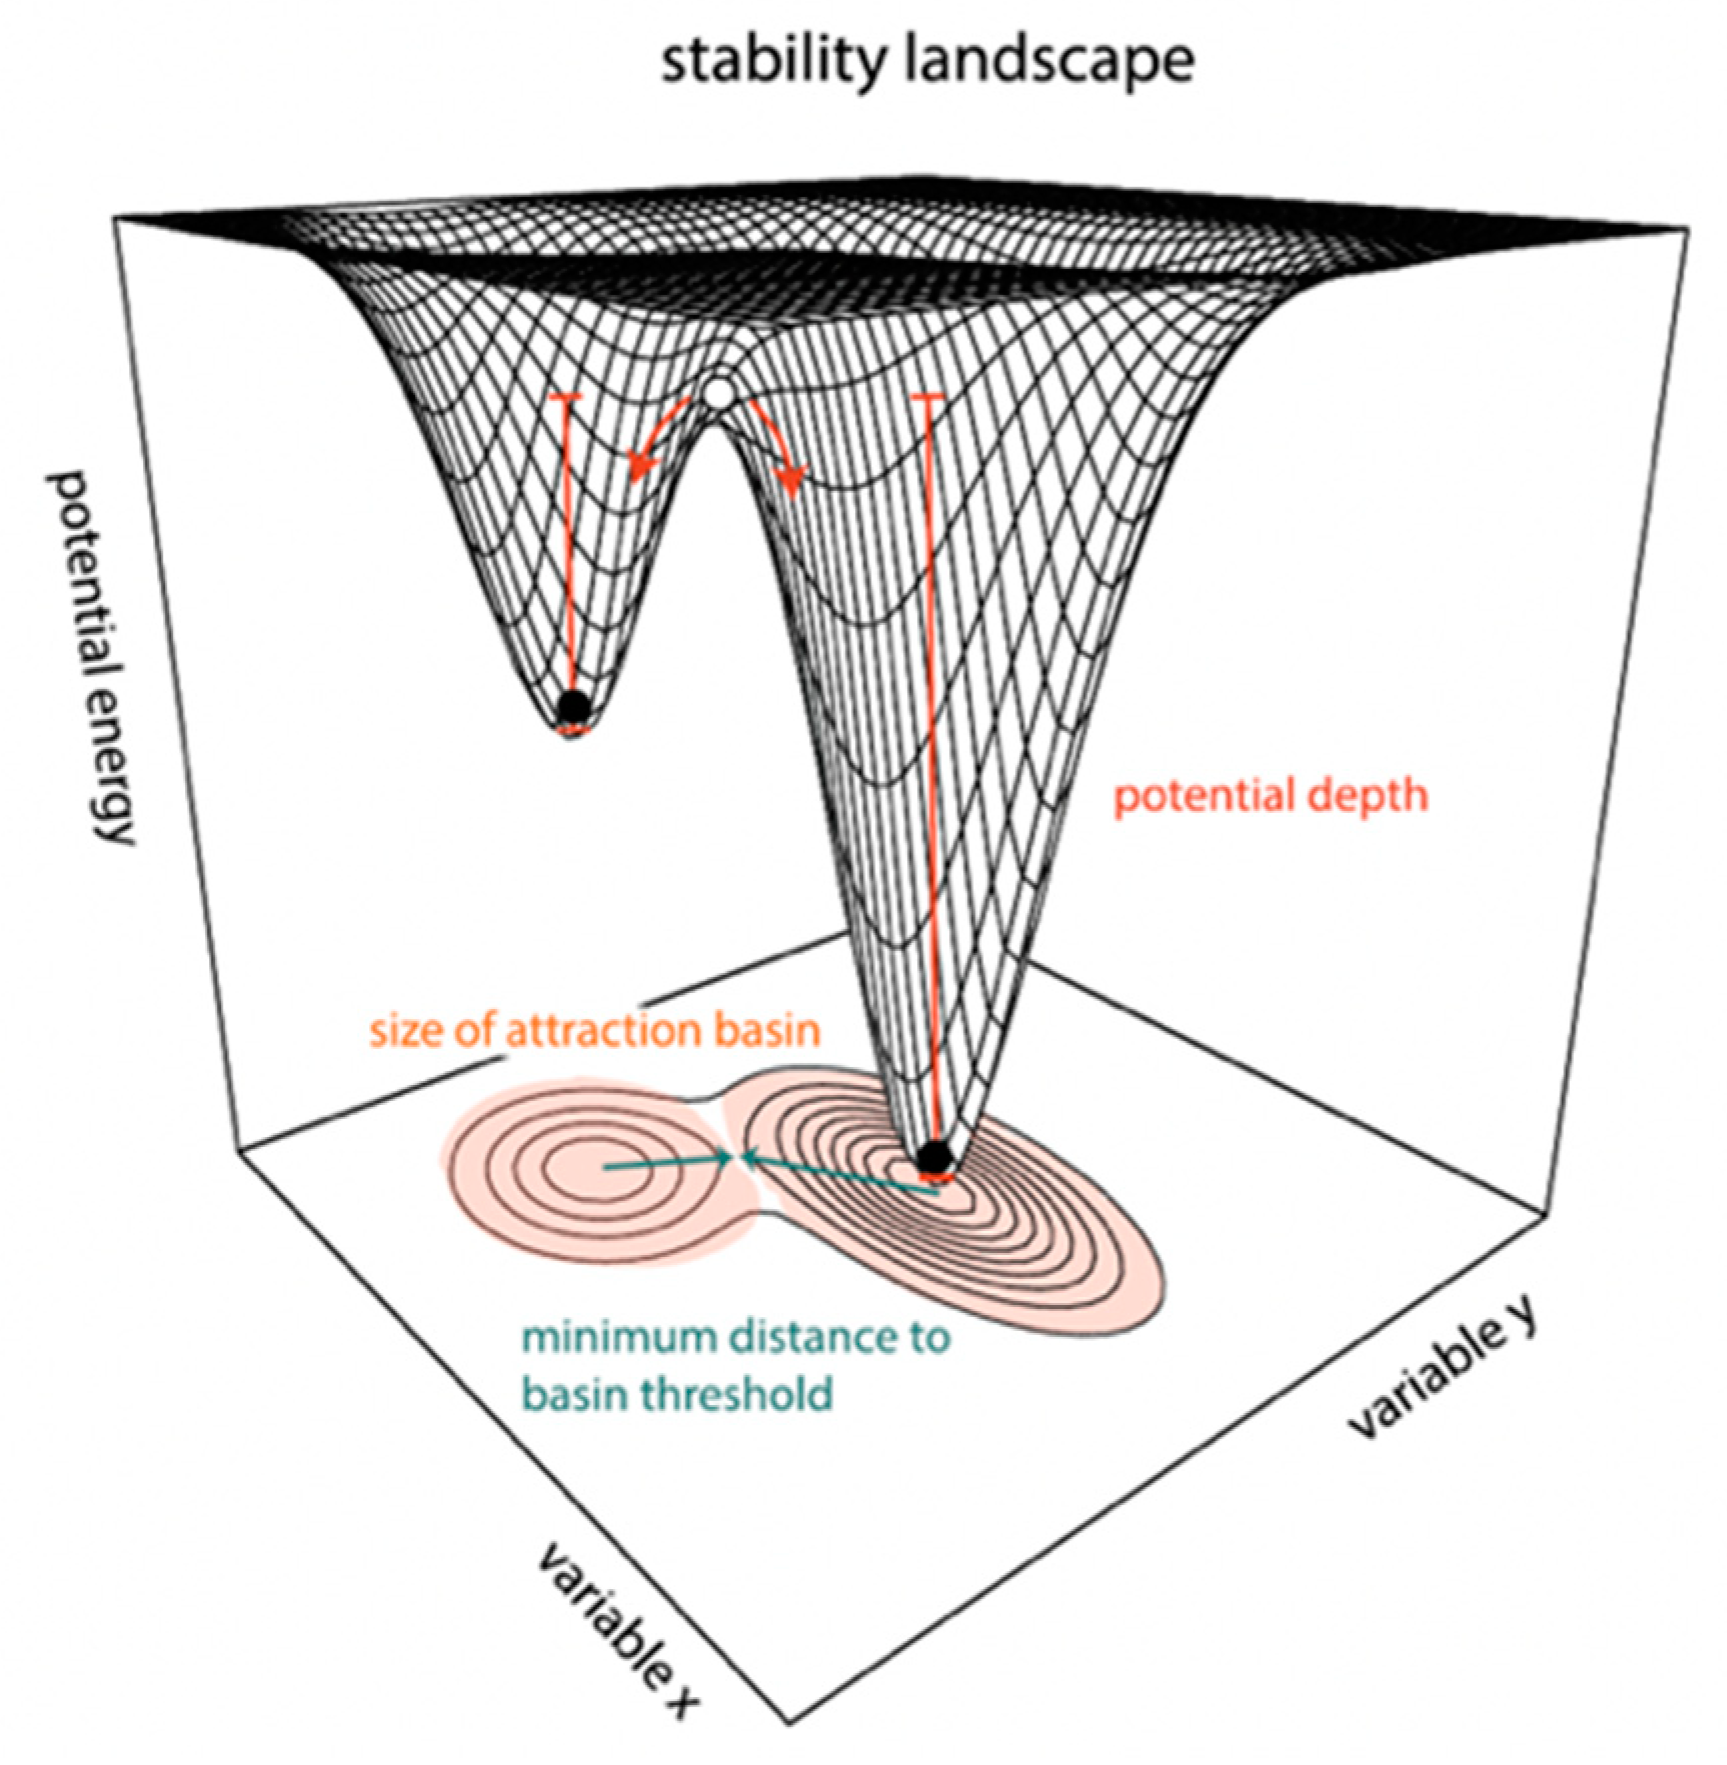
Resilience theory applied to water systems can offer a perspective on the understanding of anthropogenic droughts as one of the central disturbances of streamflow dynamics and the potential changes in hydrological resilience across all scales, from local watersheds to regional and transboundary basins. Catastrophic disturbances such as anthropogenic megadroughts can cause shifts in ecosystems into alternative states, through which many ecosystems can lose their functionality and identity. This phenomenon can be assessed by determining the relationships between natural drivers and processes that allow for ecosystem functioning (e.g., streamflow) and anthropogenic pressures (e.g., water use, land use change, and management practices. To see how resilience is affected by changes in hydrologic conditions, we may construct stability landscapes [8] which are good approximations for understanding resilience concepts [9]. The metaphor of stability landscapes in resilience theory depicts the various stable states of a system as a series of “basins of attraction,” which are regions in state space in which a system tends to remain (Figure 1—retrieved from Dakos and Kefi, 2002 [10]) and have been used to explain the dynamics of several ecosystems and the components of resilience including resistance, latitude, precariousness, and panarchy [11]. Stability landscapes help understand the properties of dynamical systems and have been used to represent resilience characteristics of shallow lakes [12], urban water systems [13], tropical forest and savanna [14], climate states [15], plant patterns in drylands [16,17], and river management [18].
A stability landscape with several basins of attraction corresponds to the various stable states in which a system will exist. As streamflow in river basins is modified by exogenous drivers (precipitation, exchange rates) and endogenous processes (infrastructure, management practices), the streamflow system may move from one basin of attraction to another when substantial disturbances occur (e.g., hurricanes, dry spells, ENSO patterns, management practices) and affect the state variables. State variables include temporal or spatial characteristics, and when these occur, the set of variables will persist in one of many possible configurations, which may shift to a different configuration or equilibrium after a perturbation [9]. However, changes in environmental conditions that affect processes between state variables, such as river fragmentation or changes in the natural flow regime, will alter the shape of the stability landscape as these pressures directly affect state variables.
We argue that the evidence of anthropogenic drought in river basins can lead to changes in the stability landscape, such as changes in position, width, depth, and configuration of the basins of attraction. The problem is that, for most systems, its quantification is challenging to operationalize, and we usually do not know the shape of the stability landscape, but in principle, we could derive their shapes [10,19] to assess the resilience properties of resistance, latitude, precariousness, and panarchy. The objective of this study is to assess anthropogenic droughts and the changes provoked to the stability landscapes of the streamflow system of a river basin. This study assessment is twofold: (1) analyze the hydrologic variability (floods and droughts) of a river system by comparing the natural and regulated flow regimes using long-term streamflow data, and (2) construct stability landscapes and explore properties of resilience in terms of changes in the basins of attraction of the natural and anthropogenic state. The transboundary basin of the Rio Grande/Rio Bravo, located half in the United States (U.S.) and the other half in Mexico, will be used as a case study given its arid, water-limited, and drought-prone landscape, its binational context, and its long history of human manipulation. This research identifies the current anthropogenic state of a transboundary basin in comparison to its natural state and approximates the metaphor of stability landscapes and basins of attraction using streamflow as a representation of the resilience conditions of river basins which can be used in any local, regional, or international scale worldwide.
2. Materials and Methods
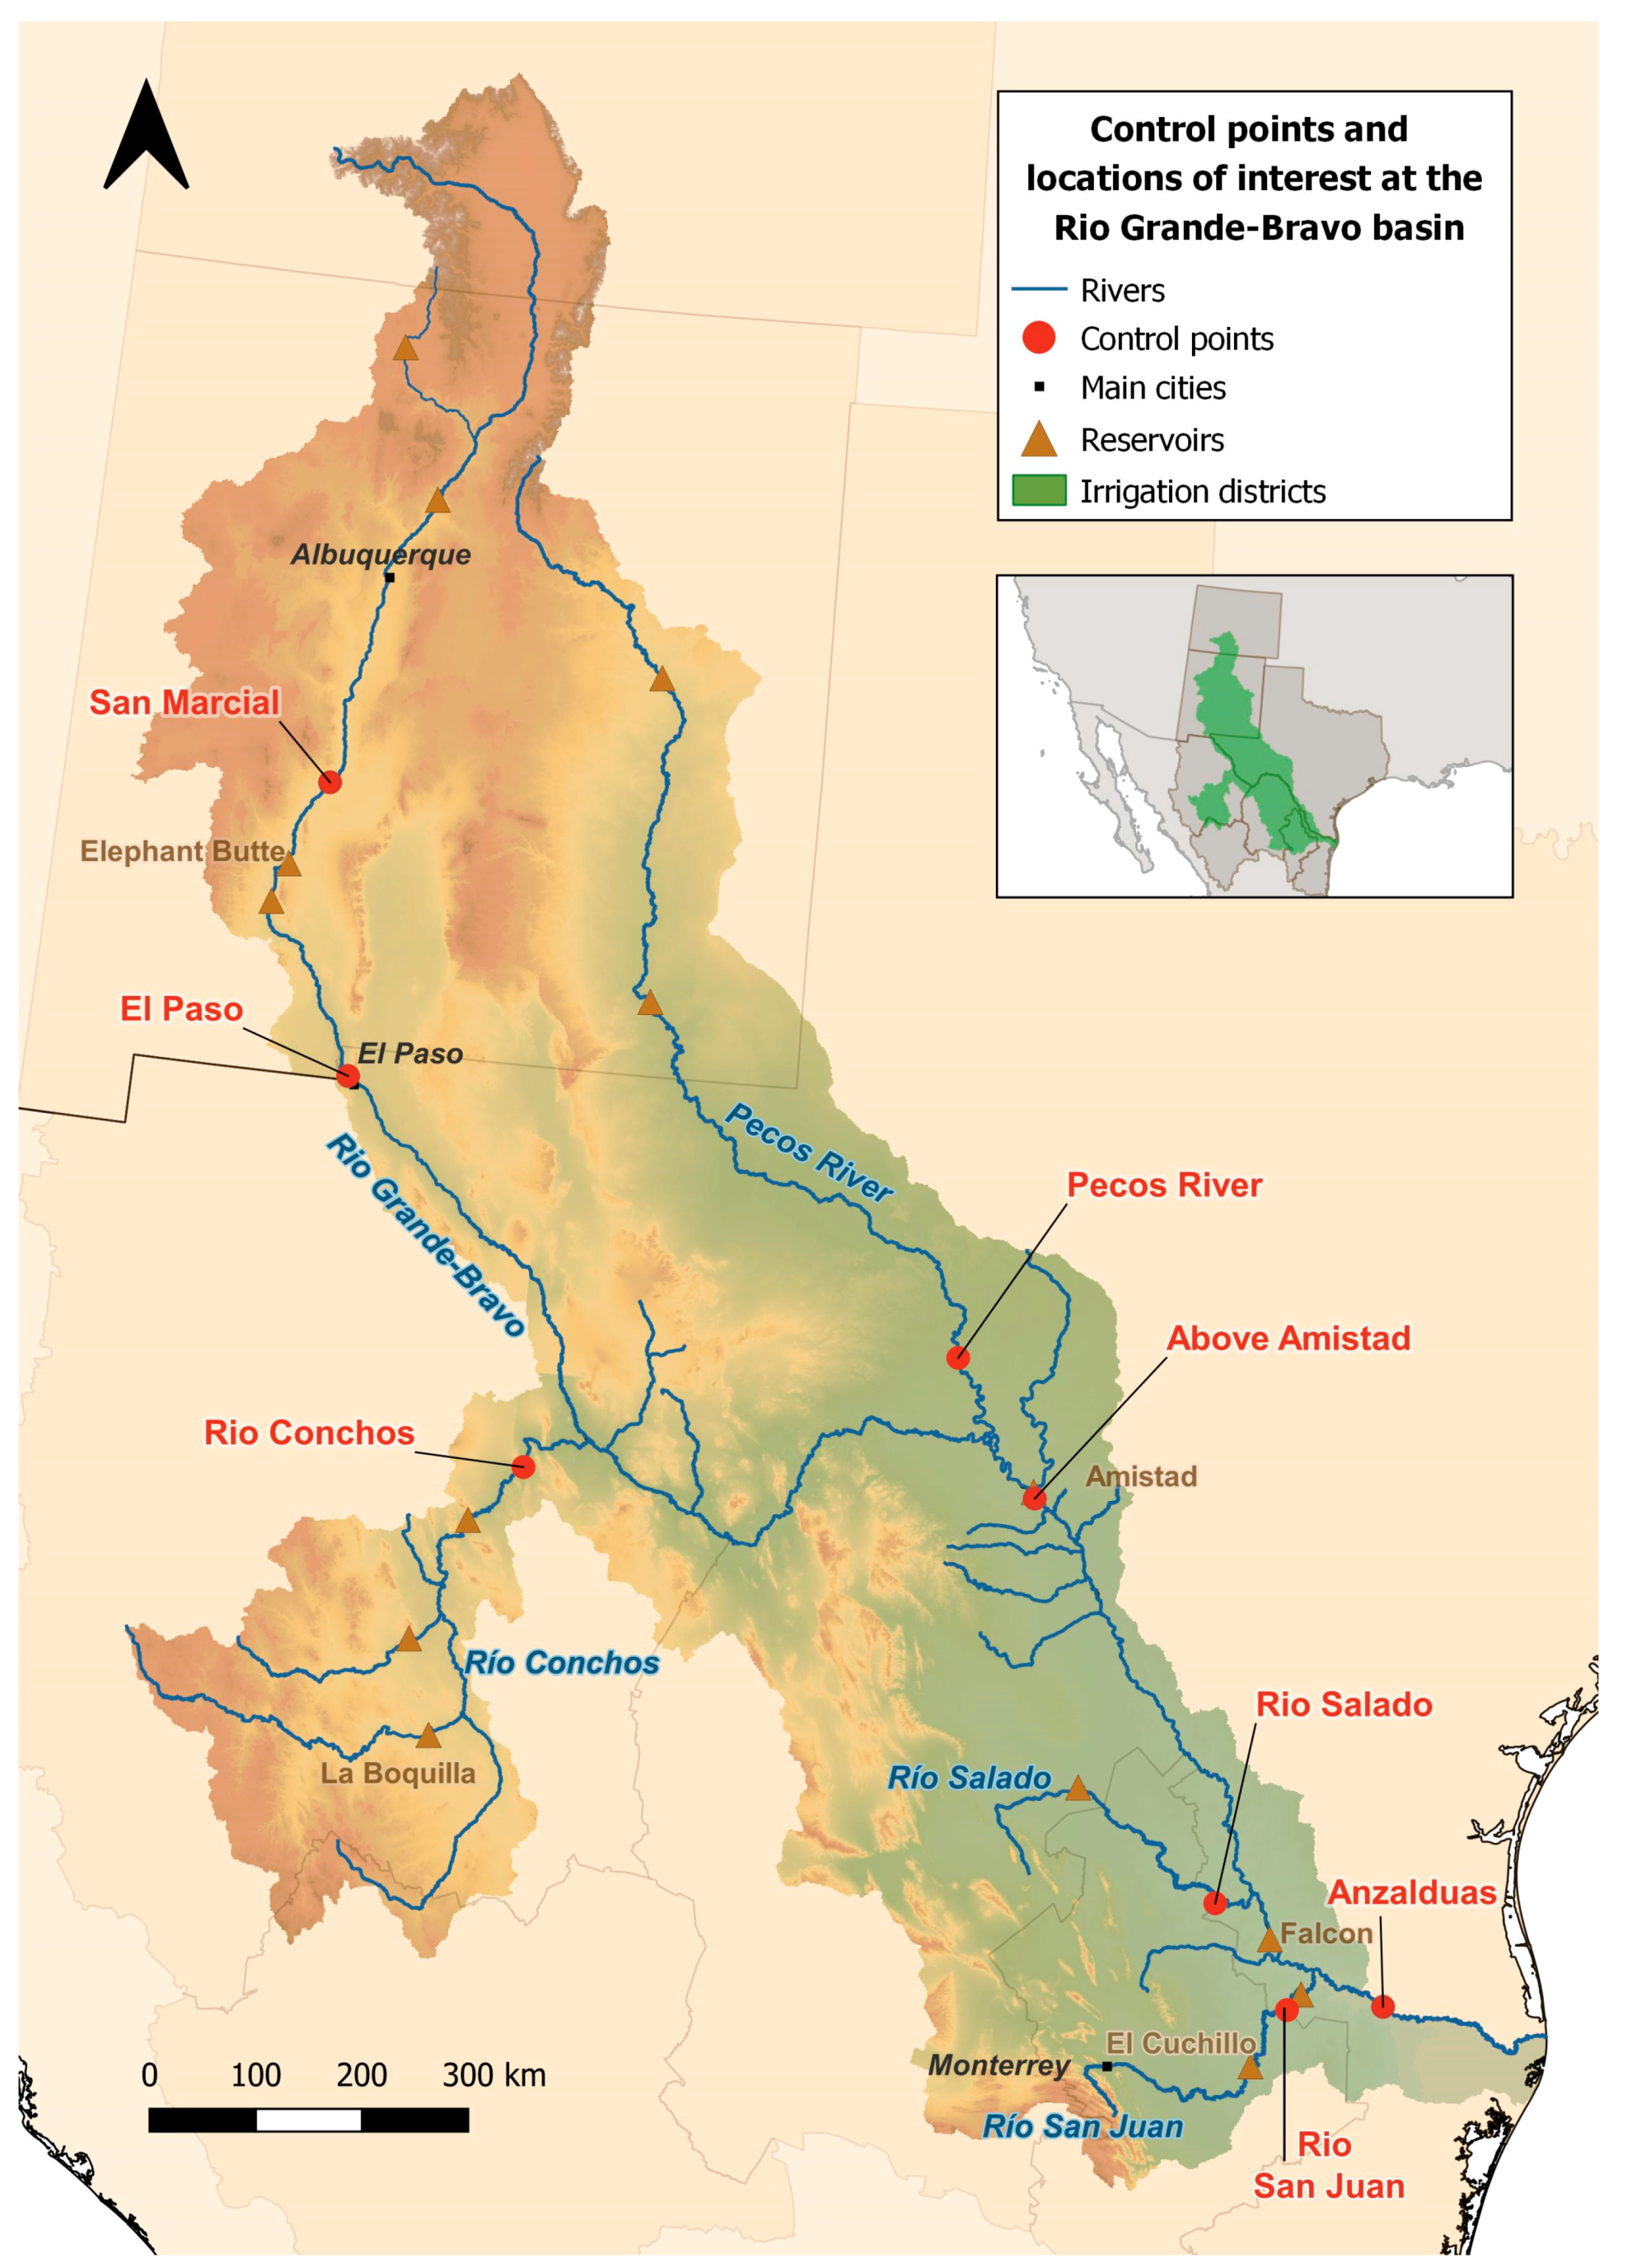
To analyze the basin-wide dynamics, this study uses 110 years of monthly streamflow from 1900 to 2010 at eight control points (i.e., hydrologic gauge stations) to portray the natural and anthropogenic states of the RGB. Four control points are selected in the mainstem of the river basin: San Marcial, El Paso, Above Amistad Dam, and Anzalduas. And four at the outlet of the main sub-basins: Rio Conchos, Pecos River, Rio Salado, and Rio San Juan (Figure 2). The overall methodology includes (1) data collection of historical streamflow data, including inflows and outflows of the river system; (2) converting gaged or observed flows to naturalized flows using a water mass balance; (3) performing a hydrologic drought assessment for the observed and naturalized flows to observe the hydrologic variability of the river basin; and (4) developing of stability landscapes to compare resilience attributes between the naturalized and anthropogenic states of the river basin.
2.1. Case Study
The transboundary Rio Grande/Bravo (RGB) basin is a water-scarce basin full of extreme climate conditions, from heavy snowfall and tropical storms to prolonged minimal precipitation, which ranges from 190 to 2250 mm per year and an average temperature range of −2 °C to 25 °C. As one of the largest drainage basins in North America, the Rio Grande-Rio Bravo (RGB) extends approximately 557,000 km2 between the United States of America (U.S.) and Mexico. The RGB provides water to eight states, three in the U.S. (Colorado, New Mexico, and Texas) and five in Mexico (Chihuahua, Coahuila, Durango, Nuevo León, and Tamaulipas). Snowmelt from the Rocky Mountains and monsoon runoff from the Sierra Madre Occidental flows mostly through arid regions, including the Chihuahuan Desert, North America’s largest desert. The northern branch of the RGB joins the Rio Conchos at La Junta de los Rios near Ojinaga (Chihuahua)/Presidio (Texas) to form the mainstem river. Several other tributaries contribute to streamflow, including but not limited to the Pecos River, which originates in New Mexico and flows through Texas until the mainstem, and other Mexican tributaries such as the Rio Salado and the Rio San Juan, which originate in the states of Coahuila and Nuevo León, respectively. The annual average natural supply of the Rio Grande delivered to the Gulf of Mexico was between 10 and 12 km3 [20].
2.2. Data Collection
Long-term streamflow data are required to represent specific conditions of river basins, including the dynamics and behaviors of hydrologic, climatic, anthropogenic, and seasonal variables over extended periods in a river basin. This analysis requires two streamflow datasets: (1) Observed flow regimes, which represent a clear manifestation of the Anthropocene, including water diversions, withdrawals, and reservoir operations, among others. Observed flow data were obtained from the Mexican National Water Commission (Comisión Nacional del Agua [CONAGUA]), the International Boundary and Water Commission (IBWC), and the U.S. Geological Survey (USGS). (2) Natural flow regimes represent streamflow without anthropogenic impacts, removing the impacts of reservoirs, diversions, return flows, groundwater sources, and any other water management practice and assuming to capture the relevant characteristics of climate and natural river basin hydrology [21]. Naturalized streamflow data sources were retrieved from previous studies, including the Upper RGB at Rio Grande Del Norte, Colorado, to the Rio Grande Above Presidio, Texas [22]. Then for the Lower RGB, daily and monthly naturalized data was retrieved from below Presidio/Ojinaga to Anzalduas, Tamaulipas from 1900–1943 [23,24], and from 1950 to 2008 [25]. Data gaps were calculated using streamflow naturalization.
2.3. Streamflow Naturalization
Streamflow naturalization is used in observed flow regimes for removing anthropogenic influence disturbances such as impoundments of rivers, land-use changes, water extractions, return flows, and other factors from streamflow time series. As the influence of humans continues to have a direct impact on river flows, the natural and anthropogenic parts of observed flows need to be distinguished [26,27]. The method used to naturalize flow is the water balance, which is the most widely used, despite the fact that it is primarily governed by data availability. This approach consists of decomposing flow into a natural part and an influenced part by removing the volume variation induced by the source of influence (e.g., reservoirs) [28] by accounting for the system’s gains and losses for the desired time frame [21]. The mass water balance equation (Equation (1)) is the following:
where is the natural flow, is the observed/gauged flows, is the outflows, is the inflows, and is the change of reservoir storage at a given daily time step t.
Outflows include evaporation losses from the reservoir and streamflow losses, obtained from the Mexican National Data Bank for Superficial Waters (Banco Nacional de Datos de Aguas Superficiales [BANDAS]) and IBWC. Moreover, any consumptive use, including agriculture diversions retrieved by the Agricultural Statistics of the Irrigation Districts in Mexico (Estadísticas Agrícolas de los Distritos de Riego), domestic and industrial water uses obtained by CONAGUA. Inflow data include agriculture and urban returns, flows, precipitation in the reservoir, and streamflow gains obtained by BANDAS and CONAGUA. Furthermore, the change of storage was obtained from BANDAS and IBWC. Lastly, to validate our results, we performed a statistical analysis comparison between our results and available research including the studies of Orive de Alba [29] and Blythe and Schmidt [22]. The goodness of fit criteria used from Moriasi et al. [30] were the coefficient of determination (R2), index of agreement (d), Nash-Sutcliffe efficiency (NSE), and percent bias (PBIAS).
2.4. Streamflow Drought Index
The streamflow drought index (SDI) developed by Nalbantis and Tsakiris [31] is used to characterize the severity of hydrological droughts. To capture decadal changes and long-term droughts in the basin for each control point. First, the cumulative streamflow of the naturalized streamflow data was estimated in a time window of 120 months. Then, the aggregated time series were fitted to probability distribution functions (normal, log-normal, and gamma) using the Kolmogorov–Smirnov (K-S) test; the log-normal distribution function (p-value less than 0.5) was selected based on the goodness of fit at a 95 percent confidence level and the least sum squared error between each probability distribution function (see Supplemental Materials). The software used to test and select the best probability distribution function was the Python package: fitter [32]. At last, the estimation of the cumulative probability is transformed into a standard normal random variable with a mean zero and standard deviation of one, resulting in the values of the naturalized SDI.
where is the standard drought index value, is the cumulative streamflow volume, is the mean, and is the standard deviation of the cumulative streamflow volume for an i-th hydrological year with a period length of k. Consecutively, the observed streamflow data is evaluated by correlating the cumulative observed streamflow volumes with the closest aggregated naturalized volume; then, its corresponding SDI value is assigned. Hydrologic wet states are values between 0 and 3, and dry states between 0 and −3. For this study, eight states of hydrological droughts representing different severities are used (Table 1), which is the criterion of Nalbantis and Tsakiris [31] modified by Garza-Díaz and Sandoval-Solis [33].
2.5. Computation of Stability Landscapes
Properties of the stability landscape in environmental systems are commonly linked to the geometric properties of a potential function [10]. Where minima and maxima respectively correspond to stable and unstable equilibria of the basins of attraction, the slopes of the potential surface are proportional to the rates of change in the system [10]. Even if this method is widely used, finding a potential function for systems with more than one dimension can be difficult [34]. Alternative measures have been applied to other systems, including the use of probability distribution functions (pdf) as it is closely related to the potential function where local minima of the potential function correspond to local maxima in the pdf [35]. Hypothetical three-dimensional stability landscapes for the river basin were computed directly from the pdf of the natural and regulated SDI values. These figures depict the conditional probability of a given SDI value (SDIt) given a previous SDI value (SDIt−1). For instance, given that the system had an SDI of −3 in the previous year (SDIt−1 = −3), what is the probability of having an SDI value of X in the present year. The pdfs dominant modes serve as proxies of the shape of the basins of attraction and are used to reflect the stability landscape properties and how they change over time.
3. Results and Discussion
3.1. Data Validation
Results of the analysis comparison between the streamflow estimations from the period of record of 1900–1943 from Orive de Alba [29] were R2 = 0.9, d = 0.9, NSE = 0.9, and PBIAS = 3.6. In addition, the comparison between Blythe and Schmidt [22] with a period of record is 1900–2010 are R2 = 0.9, d = 0.9, NSE = 0.9, and PBIAS = 1.8. The statistical performance for both comparisons was very good according to the criteria of da Silva et al. [36].
3.2. Hydrologic Variability of the Natural State of a River Basin
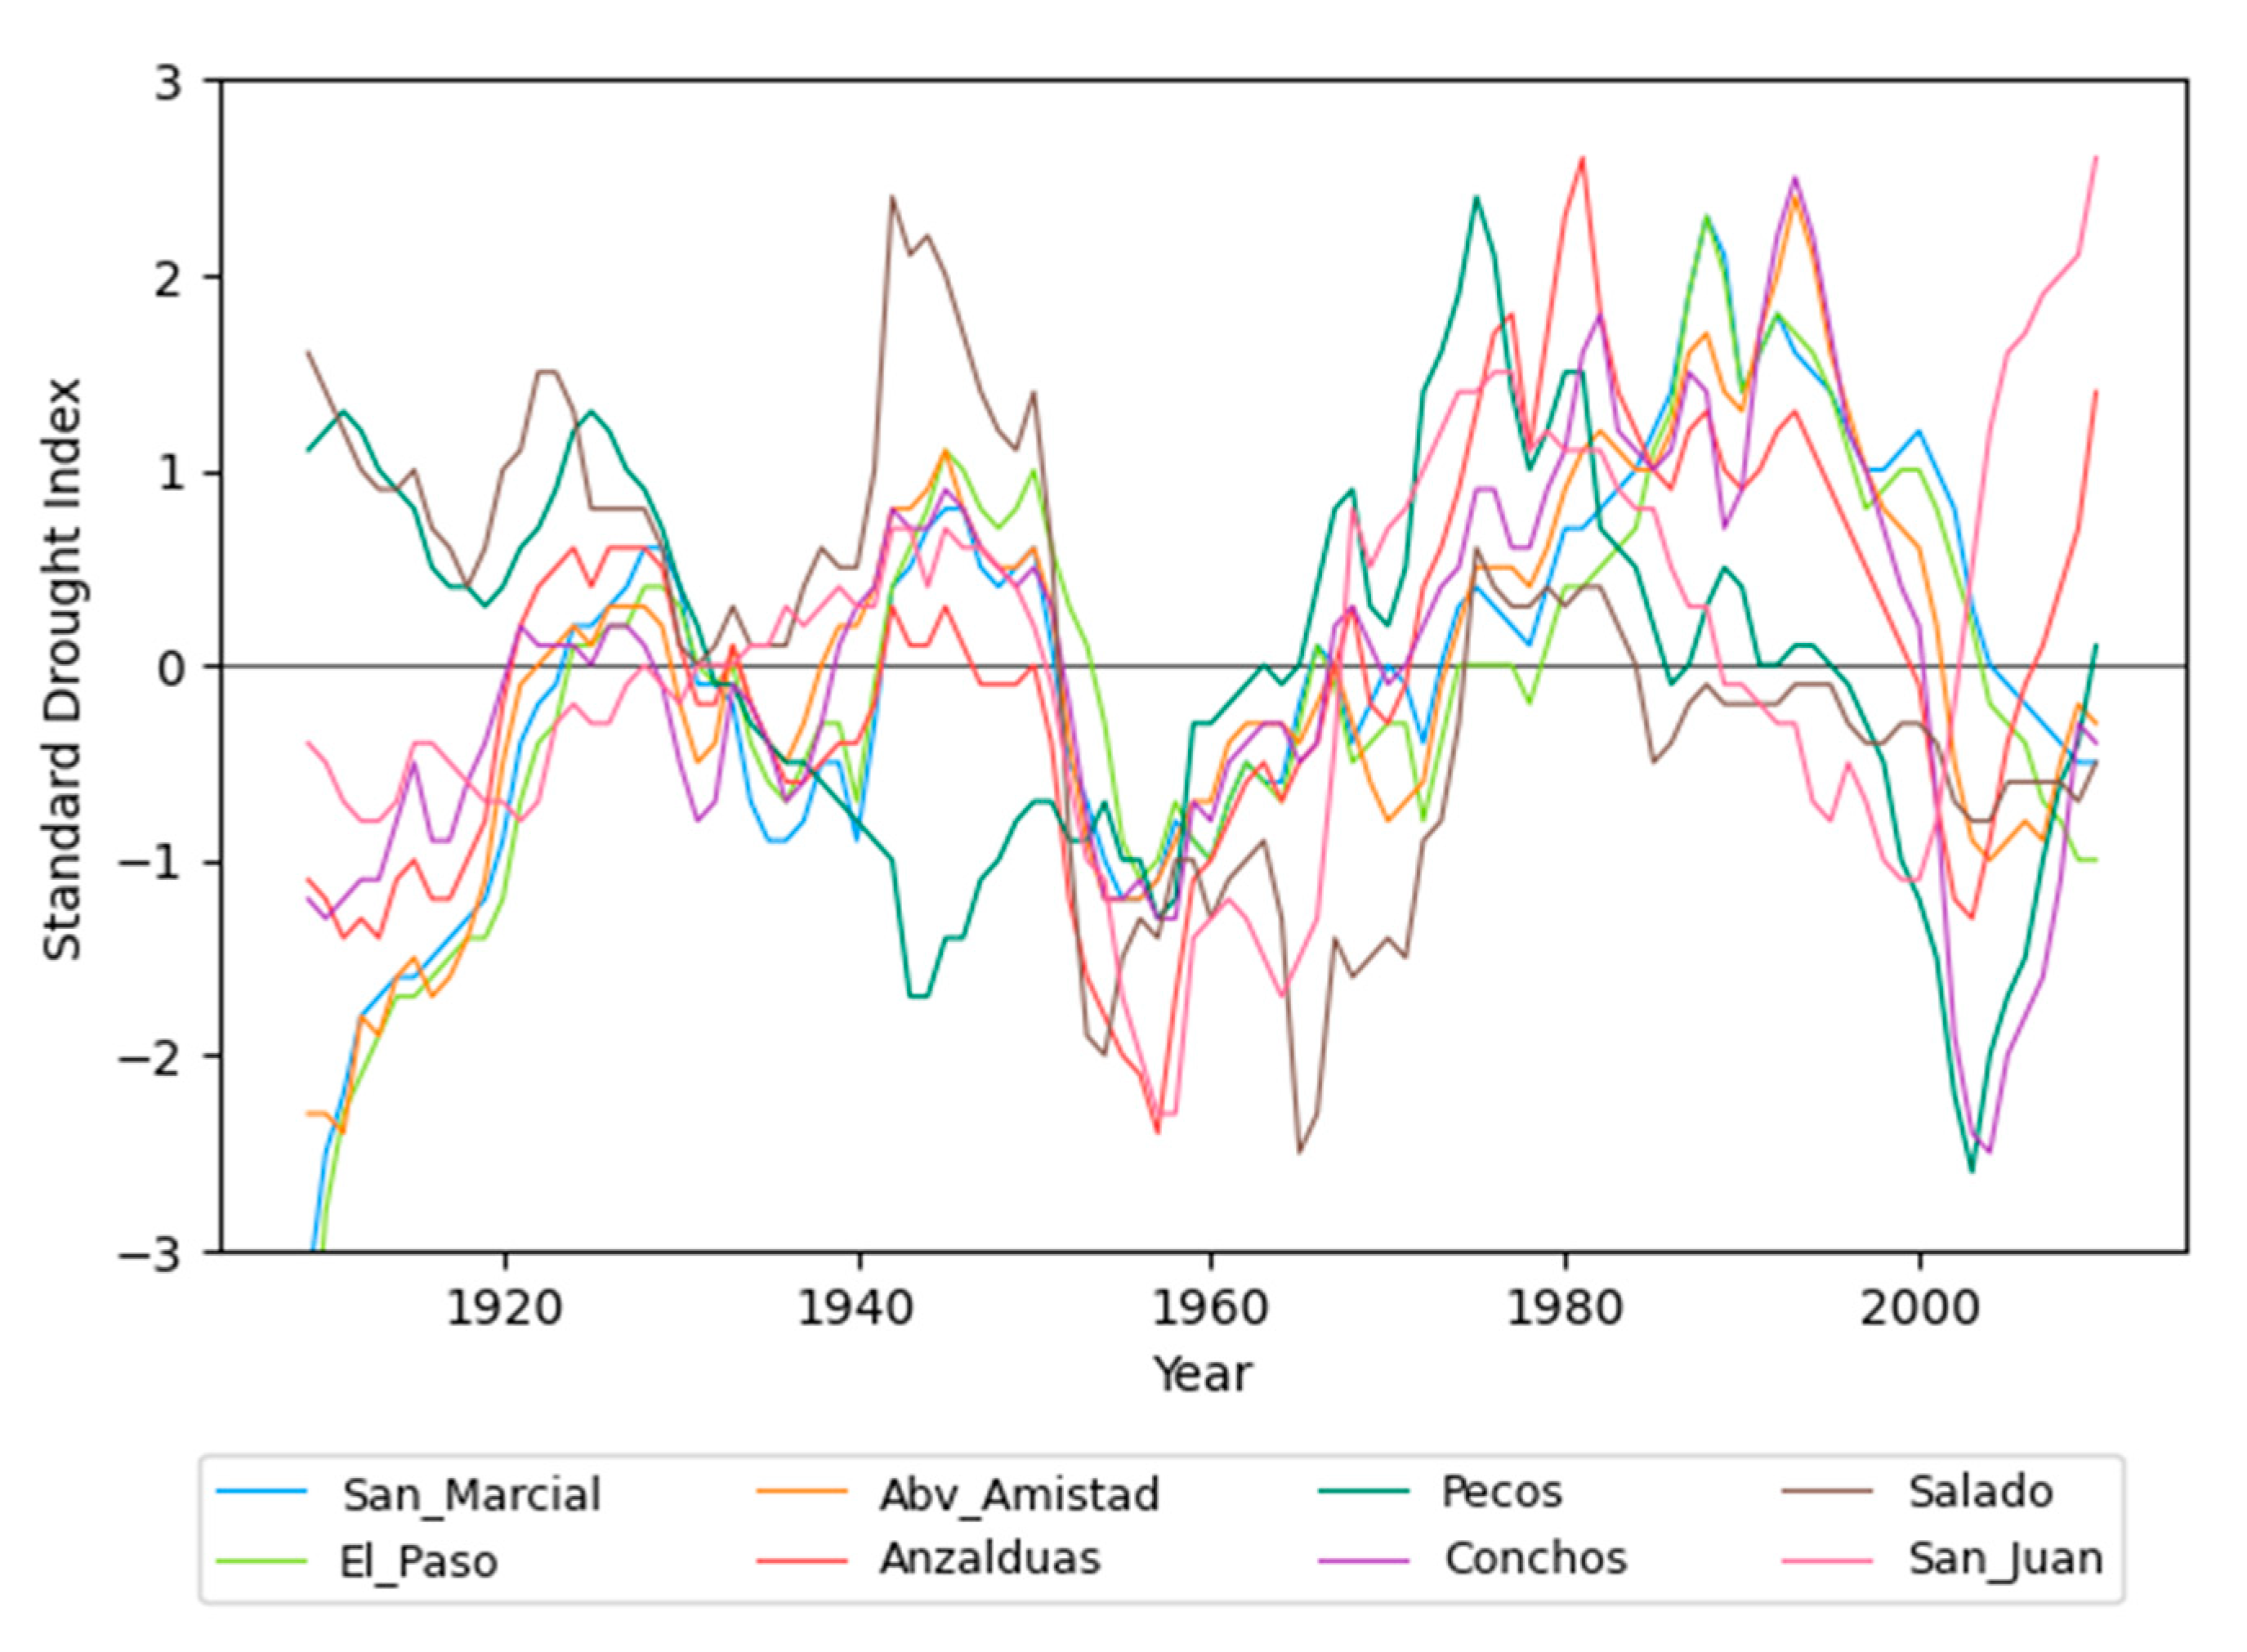
The RGB basin spans a climatic gradient from semi-arid to subhumid; its environment is vulnerable to extreme hydroclimatic events [37]; and to investigate its dichotomy, the hydrologic variability of the natural state of the RGB is depicted in a 120-month SDI analysis (Figure 3) which allowed identification of hydrologic drought and flood events.
Overall, the hydrological behavior of the basin indicates recurrent periods of water stress (Table 2). Droughts in this basin are common and, on average, can span from 10 to 25 years, including consecutive extremely and severely dry periods ranging from 5 to 9 years. In contrast, wet periods tend to be shorter, from 11 to 16 years; extremely and severely wet periods could typically last from 2 to 4 years. Alternating dry and wet cycles could last 24 years in the mainstem of the RGB; these cycles are correlated with ocean-atmosphere climate variability [38].
3.2.1. Synchronous and Asynchronous Wet and Dry Periods
Synchronous and asynchronous wet and dry periods occurred along the RGB mainstem due to the difference in physiographic and climatic main controls in the RGB, snowmelt runoff in the headwaters of the San Juan Mountains, and the strong influence of the North American monsoon gives rise to two different hydroclimate regions: the hydroclimatic snowmelt variability in the headwaters of the RGB (the northern branch, including: San Marcial, El Paso, and Pecos River) and the North American monsoon variability experienced downstream of its confluence with the RGB (the southern branch, including Above Amistad, Anzalduas, Rio Conchos, Rio Salado, and Rio San Juan). This can be shown in the overlap and out of phase of droughts and wet periods that are concurrent in specific decades and regions, and other times are out of phase and independent. For example: synchronous wet periods occurred in the late 70s and the 80s, which were the wettest of the century, and matching droughts years include 1909–1920, the 1930s, 1950s, and 2005–2010. Although in some of these periods, the severity was not as extreme as in other regions. For example, the drought experienced in 1910 by the Rio Conchos was less severe than those in San Marcial or El Paso, or the wettest period was more severe for Anzalduas than El Paso. On the contrary, asynchronous wet and dry periods can also occur; for example: the beginning of the twentieth century was particularly wet for the Pecos River and the Rio Salado, which showed positive SDI values from 1900–1930. After this wet period, these rivers exhibit contrasting dry/wet periods from 1940 to 1950, where the Pecos River has the second driest period on record while the Rio Salado shows its wettest period. In addition, all control points exhibit differences in severities and durations, even if these overlap, indicating that one or more underlying circulation mechanisms influence the entire basin [39].
3.2.2. Occurrence of Droughts
The RGB is vulnerable to extreme hydroclimatic events, especially droughts, which are expected to become more severe in this region by the end of the 21st century. Paleoclimate reconstructions using tree rings have been used in the RGB to reconstruct streamflow. For the Pecos River, a 700-year paleoclimate reconstruction estimated streamflow declines in a multi-century context, setting the drought of 1950–1957 as one of the highest ranked based on magnitude and intensity, slightly less severe as the 11-year drought of 1772–1782 [40]. For the RGB near Del Norte [39] and the Rio Conchos [41], a 344-year (1749–1933) reconstruction of seasonal precipitation and a 243-year (1775–2015) reconstruction of streamflow volume reported an extraordinary drought from 1950 to 1957 and from 1948 to 1958, respectively. These studies coincide with our research where the severely dry period for the natural streamflow system is estimated, from 1950 to 1965, for several control points, including Pecos River and Rio San Juan. The drought of the 1950s has been well documented in rainfall, discharge, and dendro-chronological data and is consistent with drought spells in northern Mexico [42]. However, in our records, the most severe drought in the Rio Conchos was in 2005, and the second driest in the 1950s. Nonetheless, the study of Ortega-Gaucin [43], reports from 1997 to 2008 as an extraordinarily hydrological dry period for the portion of the RGB located in Mexican territory, specifically the severe and extremely dry period from 2000–2008 in the control points of Rio Conchos. Moreover, San Marcial and El Paso experienced extreme and severe drought in the early 1900s, a decade distinguished by predominantly below-average flows in the northern branch of the RGB [39].
3.2.3. Occurrence of Snowfall and Hurricanes
Snowfall and hurricanes significantly affect the water availability throughout the basin. The RGB (San Marcial and El Paso) and Rio Conchos showed an exceptionally wet decade between the 1980s and 1990s, as reported by the northern branch using a 445-year streamflow reconstruction forecast [44] and streamflow data along the RGB mainstem (at Johnson Ranch) and the Rio Conchos [45]. The Rio Salado shows its wettest period in the 1970s, which coincides with estimates of Ortiz-Aguilar [46]. Then the 1900s was extraordinarily wet within the context of the Pecos basin, only broken by the widespread 1950s drought, which was ended by the 1980s wet event. In addition, the 20th century was the wettest in the Pecos basin over the past 700 years [40]. Heavy rains, influenced by tropical storms and hurricanes that hit the RGB from the Pacific and Atlantic Oceans, have increased in frequency. These storms, concentrated in short periods, are responsible for high annual discharge in the RGB. In the Rio Salado and Rio San Juan, the hurricanes Beulah, 1967; Allen, 1980; Barry, 1983; and Gilbert, 1988 [47] resulted in an extremely wet and wet period, respectively. In the 2000s, hurricanes Emily, 2005; Dean, 2007; Dolly, 2008; and Alex, 2010 [47] resulted in a severely wet period for the Rio San Juan basin and in Anzalduas, the outlet of the RGB.
3.2.4. Impacts of Climate Change
Effects of climate change are already altering the RGB streamflow timing and volume through changes in rainfall, snowfall and snowpack, and increased temperatures and evapotranspiration rates [48]. Despite that this study did not distinguish the effects of climate change and human impacts separately; and climate and hydrologic forced models (e.g., rainfall-runoff models) are needed as additional research to distinguish the impact of climate change on the natural streamflow. The intensity and frequency of dry and wet conditions for the natural system in Figure 3 have increased since 1950. Extreme hydroclimatic events, such as intense precipitation and drought, are expected to increase in this region by the end of the 21st century [49,50]. For example, streamflow declines are occurring in tributaries upstream of Albuquerque between 1980 and 2016 [51]. In addition, in the past 40 years, snow drought has impacted the RGB headwaters in Colorado and New Mexico [52]. Moreover, elevated evapotranspiration rates since 1980 in the Rio Conchos, Rio Salado, and Rio San Juan are affecting crop production [53] and changes in air temperature exacerbate water quality issues in border cities of the southern branch of the RGB [54]. Furthermore, there has been an increase in the frequency of tropical cyclones and hurricanes since 1950 generated in the Pacific Ocean [55] resulting in economic losses by flooding and crop destruction.
3.3. The Modern Hydrology: A Perennial Human-Induced Extreme Drought
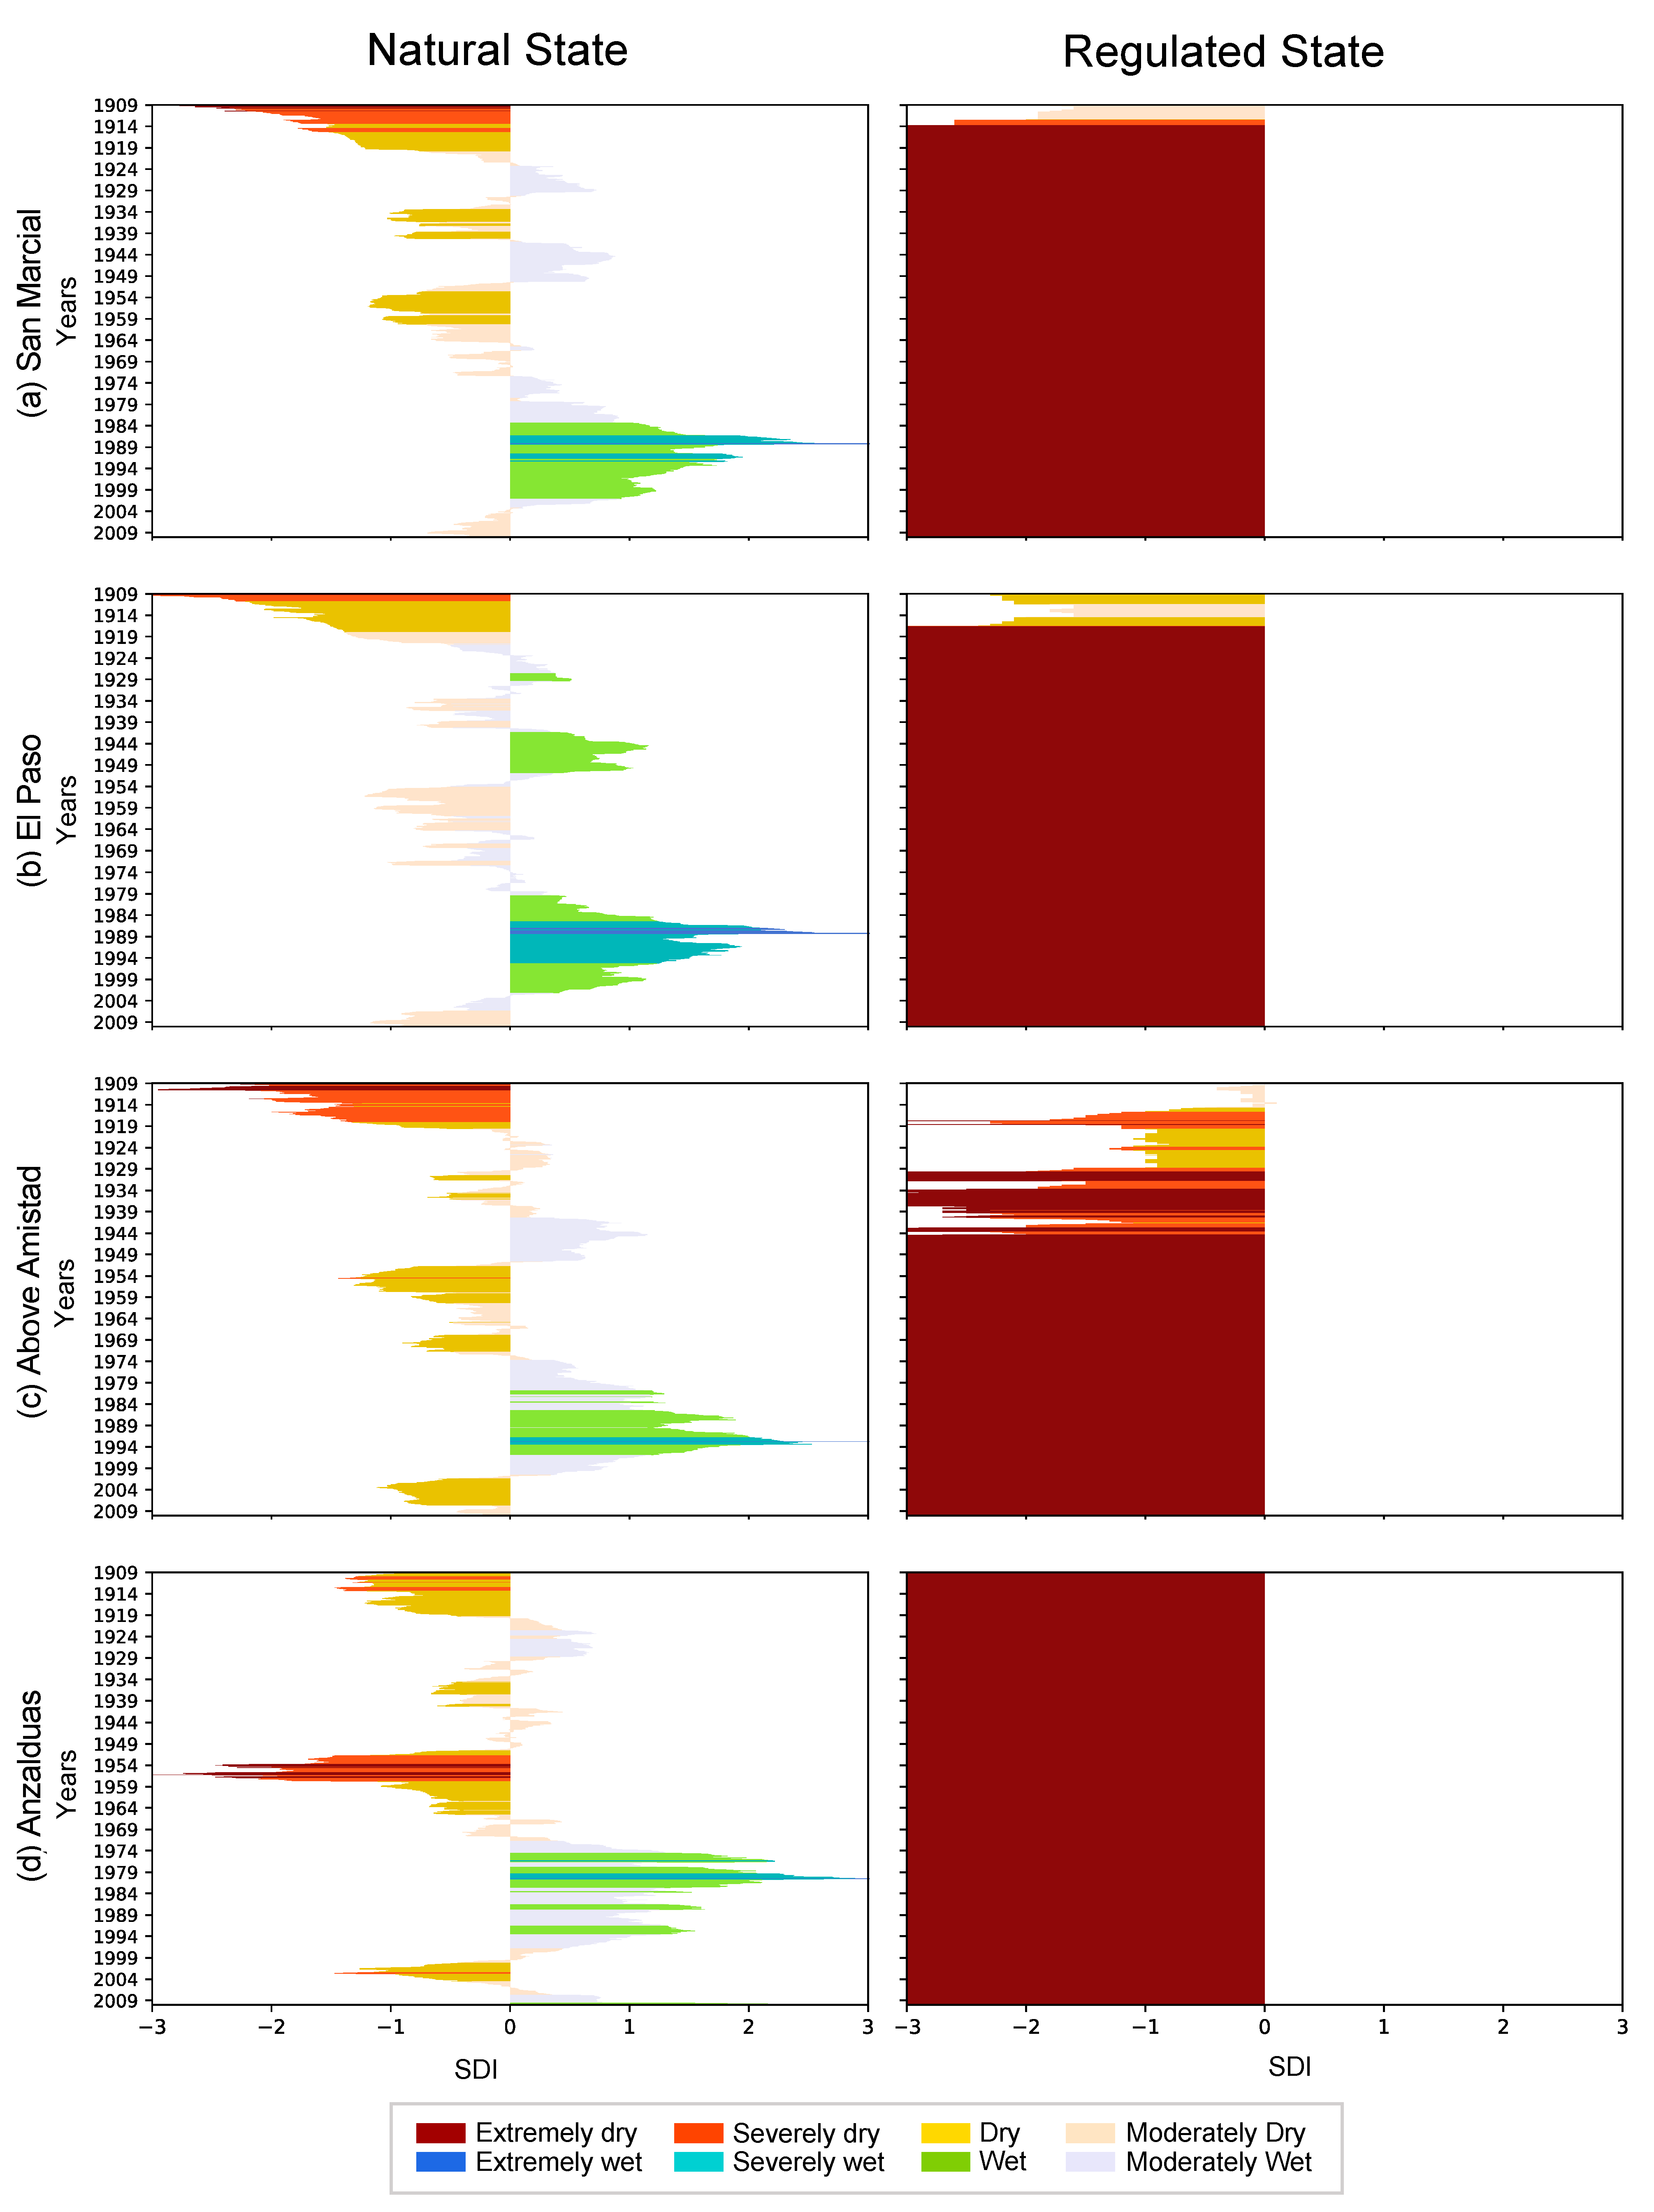
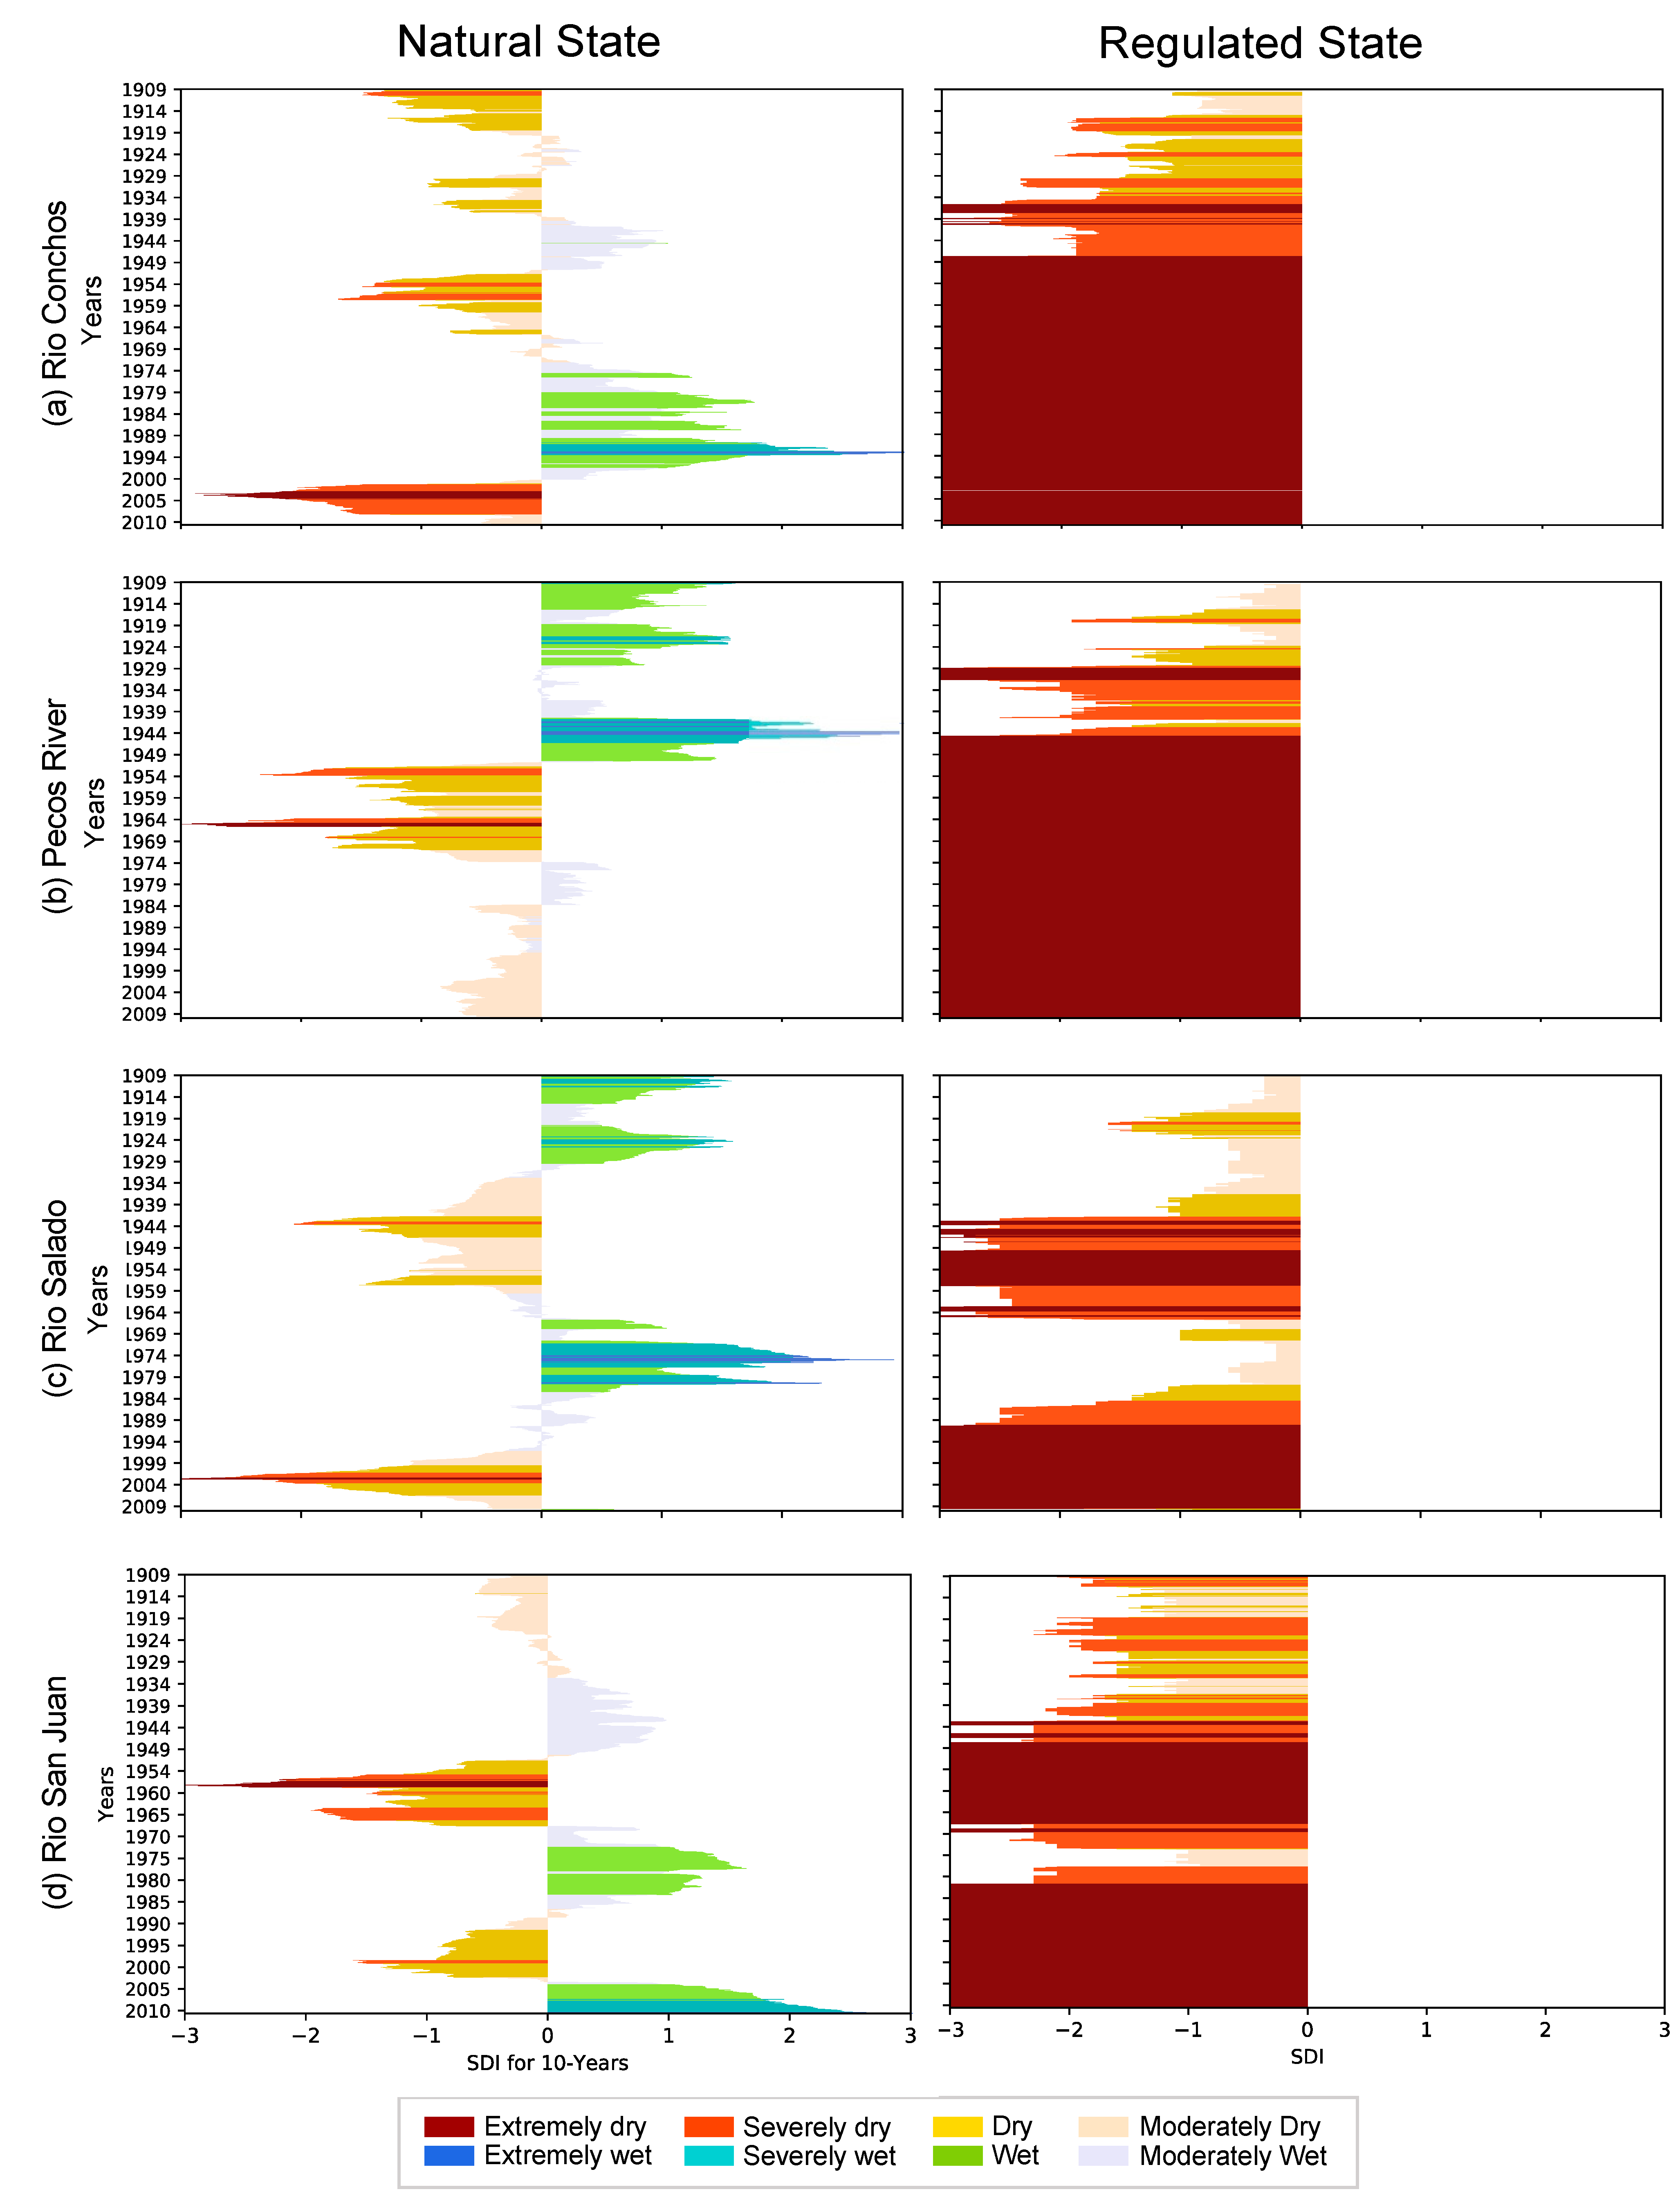
A comparison between the natural and modern streamflow variability in the mainstem of the RGB is shown in Figure 4 and the subbasin control points in Figure 5. The natural hydrology of the RGB exhibits a strong hydrologic variability with alternating dry and wet periods. In contrast, the regulated hydrology lacks the cyclical periods of wet and dry periods highlighted in the natural system; it shows a permanent state of human-induced extreme drought in the basin. The lack of hydrologic variability intensifies the dry states’ severity and frequency, shifting from a possible wet or moderately wet to a dry, moderately dry, or even extremely dry period that could last several years. The loss of this dynamism puts the system in a perennial and extreme dry state for most of the sites for decades, in some regions more severe than others, yet the magnitude and extent of the dry state permeate all regions of the RGB. In the RGB mainstem, perennial extreme dry periods started in San Marcial and El Paso in 1920 (for 90 years), above Amistad in 1939 (for 71 years), and in Anzalduas since the beginning of the 20th century (for 110 years). Anzalduas represents the response of the entire RGB basin given its location near the outlet; it shows that since the early 1900s, water diversions and flow regimes modified the basin as if it was in a perennial drought. For the main tributaries of the RGB, perennial extreme dry periods started in the Pecos River in 1945 (for 65 years) and the Rio Conchos in 1960 (50 years). In the San Juan and Rio Salado basins, they appear to have periods of extreme drought that are separated by periods of dry and moderately dry periods; these can be explained by the1980s wet period in the San Juan and the severely and extremely wet period in the 1970s in the Salado basin.
3.3.1. Causes of the Perennial Human-Induced Drought
At the core of this permanent state of human-induced drought is the interplay of human development and climate. Since the 1870s, the RGB has been subject to a long history of human manipulation [20]. The present perennial drought state is the result of increased water demands (for agriculture, municipal, and industrial), water agreements (at the international, interstate, regional and local scales), water overallocation, and the construction of large water infrastructure (reservoirs, canals, levees) [33,37]. Water resources are often insufficient to meet human and environmental requirements due to the natural water scarcity in the basin and the increased human water demand. The RBG basin provides water for more than 10.4 million inhabitants. Moreover, the basin supports extensive irrigated agriculture, comprising approximately 780 thousand hectares of irrigated land [33] and accounting for 83% of water withdrawals in the RGB [37]. In the U.S., the extent of irrigation activities expanded during the 19th century after the Desert Land Act of 1877 [56,57], prompting a disproportionate expansion of agricultural land, water diversions for irrigation, and water consumption. In the U.S., irrigated agriculture accounts for 80 to 90% of the overall water use. The main crops are forage, cotton, pecans, and vegetables [58]. In contrast, as a result of the Mexican Revolution in 1917, the Mexican Agrarian Reform implemented a prolonged distribution of land, where more than half of the Mexican territory was assigned to farmers [59]. A total of 11 irrigation districts were created, totaling 458 thousand hectares of irrigated land [33], where the states of Chihuahua and Tamaulipas account for 87% of the total irrigated areas. In both countries, the large-scale farming systems require large reservoir projects and extensive channelization, which started in 1916 with Elephant Butte in New Mexico and La Boquilla in Chihuahua. Since then, 27 large dams (greater than 16,000 Mm3 of storage capacity) have been built in the basin, including two international dams: Amistad and Falcon.
As streamflow is reduced by overconsumption and climate change, access to water is becoming a looming crisis, and droughts have become more devastating due to increased use of water resources for human purposes, changes in regulations for water allocation between users, states, or countries. Management actions for concealing water shortages and increasing water supply through more river engineering in one area certainly affect downstream communities. For example, the construction of El Cuchillo Dam in Rio San Juan during the drought of 1990 aimed to supply water for the city of Monterrey in Nuevo Leon. However, this action led to a diminishing water supply for farmers in Tamaulipas. Droughts have also triggered a change in regulations for water allocation, whether in international agreements or state water allocation systems [37]. For instance, the Pecos River Compact [60] between New Mexico and Texas promotes collaboration and sharing of water resources. However, constraining surface water use created an increase in groundwater use, that ultimately ended up in groundwater overdraft that diminished baseflows that downstream users depended on. Droughts have also triggered conflicts among water users, states, and countries. For example, the drought in the late 1990s triggered disputes between farmers and the federal government in Mexico. From 1997 to 2002, Mexico incurred a substantial water debt to the U.S. The Rio Conchos basin was not able to deliver water to U.S. and Mexican downstream water users due to drought and increased water use in the Rio Conchos basin. At that time, the Mexican government resolved this conflict by delivering water to the U.S. from other tributaries and from Mexican water stored in the international reservoirs, leaving without downstream water users in Tamaulipas. The imbalance between supply and demand creates a complex web of governance structure, infrastructure, and user conflicts, which translate into compounding effects for anthropogenic droughts.
3.3.2. The Degradation Toll of the Environment Due to Human Activities
Land use change, reservoir development, straightening of the main river, and over-extraction of water have a high degradation toll on ecosystems by altering the river’s natural flow pattern, timing, temperature, and quantity of river flows. By changing the temporal variation of streamflow in river basins, assemblages of riparian species are profoundly transformed because their life cycle is synchronized with the timing, magnitude, duration, and rate of change, of the natural flow regime. For example, lack of fall monsoonal flooding facilitates the invasion by non-native organisms by shifting regionally endemic species (e.g., generalist red shiner; Cyprinella lutrensis) to dominant generalist fish species (e.g., endemic Tamaulipas shiner; Notropis braytoni) [61]. In addition, other native species have gone locally extinct in some areas of the RGB (e.g., the Rio Grande Monkeyface mollusk; Quadruka couchiana), while others have been listed as endangered species (e.g., the Rio Grande silvery minnow; Hybognathus amarus). In addition, reduced flood flow frequency has enhanced invasive vegetation encroachment and caused channel incision and narrowing [37]. Native ecosystems are adapted to droughts; however, the level and persistence of the current human-induced drought are severely affecting river ecosystems and species throughout the basin. In the 20th century, the flow of the RGB had been reduced by nearly 95% of its natural flow [22,23], and at least 30 springs have gone dry in the states of Chihuahua and Coahuila [62,63].
3.3.3. The Human-Induced Megadrought
The perennial drought state of the RGB can be better described as an anthropogenic megadrought; a compound multidimensional and multiscale phenomenon governed by the combination of natural water variability, human decisions, increased water use for human activities, climate change, and altered microclimate conditions due to changes in land and water management [3]. Since the early 2000s, the Rio Grande/Bravo has been listed among the most at-risk rivers in the world [64]. Other regions in the world are experiencing anthropogenic megadrought, for instance, across Canada, the United States, and Mexico [5], and in South America, a multi-year dry spell has been referred to as the Central Chile Mega Drought [65]. These examples point out that anthropogenic forcing is critical to explain the perennial dry states of regions, given its capability of transforming a dry spell into a full-blown multiyear megadrought [4]. The regulated state in Figure 4 and Figure 5 show that the human-induced megadrought has become the new normal in the RGB, posing environmental and socioeconomic hardship, including the unwanted anthropogenic consequences of altering natural systems beyond their resilience carrying capacity. Prolonged droughts cause major fluctuations in the structure and functioning of the RGB; resilience erosion can trigger changes in the stability landscape of the system or even changes in regimes.
3.4. Stability Landscape Metaphor: Resistance, Latitude, Precariousness, and Panarchy
The resilience of a system can be described using the stability landscape metaphor [11] by characterizing the components that govern a system’s dynamics: resistance, latitude, precariousness, and panarchy. A three-dimensional stability landscapes is used to estimate, visualize, and compare the resilience attributes of the natural and regulated flow regimes (Figure 6). The topology of the stability landscape is portrayed by the occurring valleys and hilltops [11] that delineate the boundaries between the basins of attraction and represent the states where the system exists for a determined period of time. The resistance indicates how easy or difficult the system can be changed between states; it is expressed by the depth of the basin. The latitude is the maximum amount the system can be changed and is depicted as the width of the basin of attraction. Wide basins mean a greater number of system states can be experienced without crossing a threshold, while deep basins indicate greater perturbations are required to change the current state of the system away from the attractor [66]. The precariousness indicates the trajectory of the system at a given time within the stability landscape and how close it is to crossing it. Finally, panarchy acknowledges that systems are dynamic and continually passing through “adaptive cycles” at various scales [67]. Like any metaphor, there are limitations to using stability landscapes as a decision-making tool. Nonetheless, it is a valuable resilience concept that helps us to think about ecosystem dynamics and how human management might affect resilience properties.
3.4.1. The Dynamic RGB Natural Stability Landscape
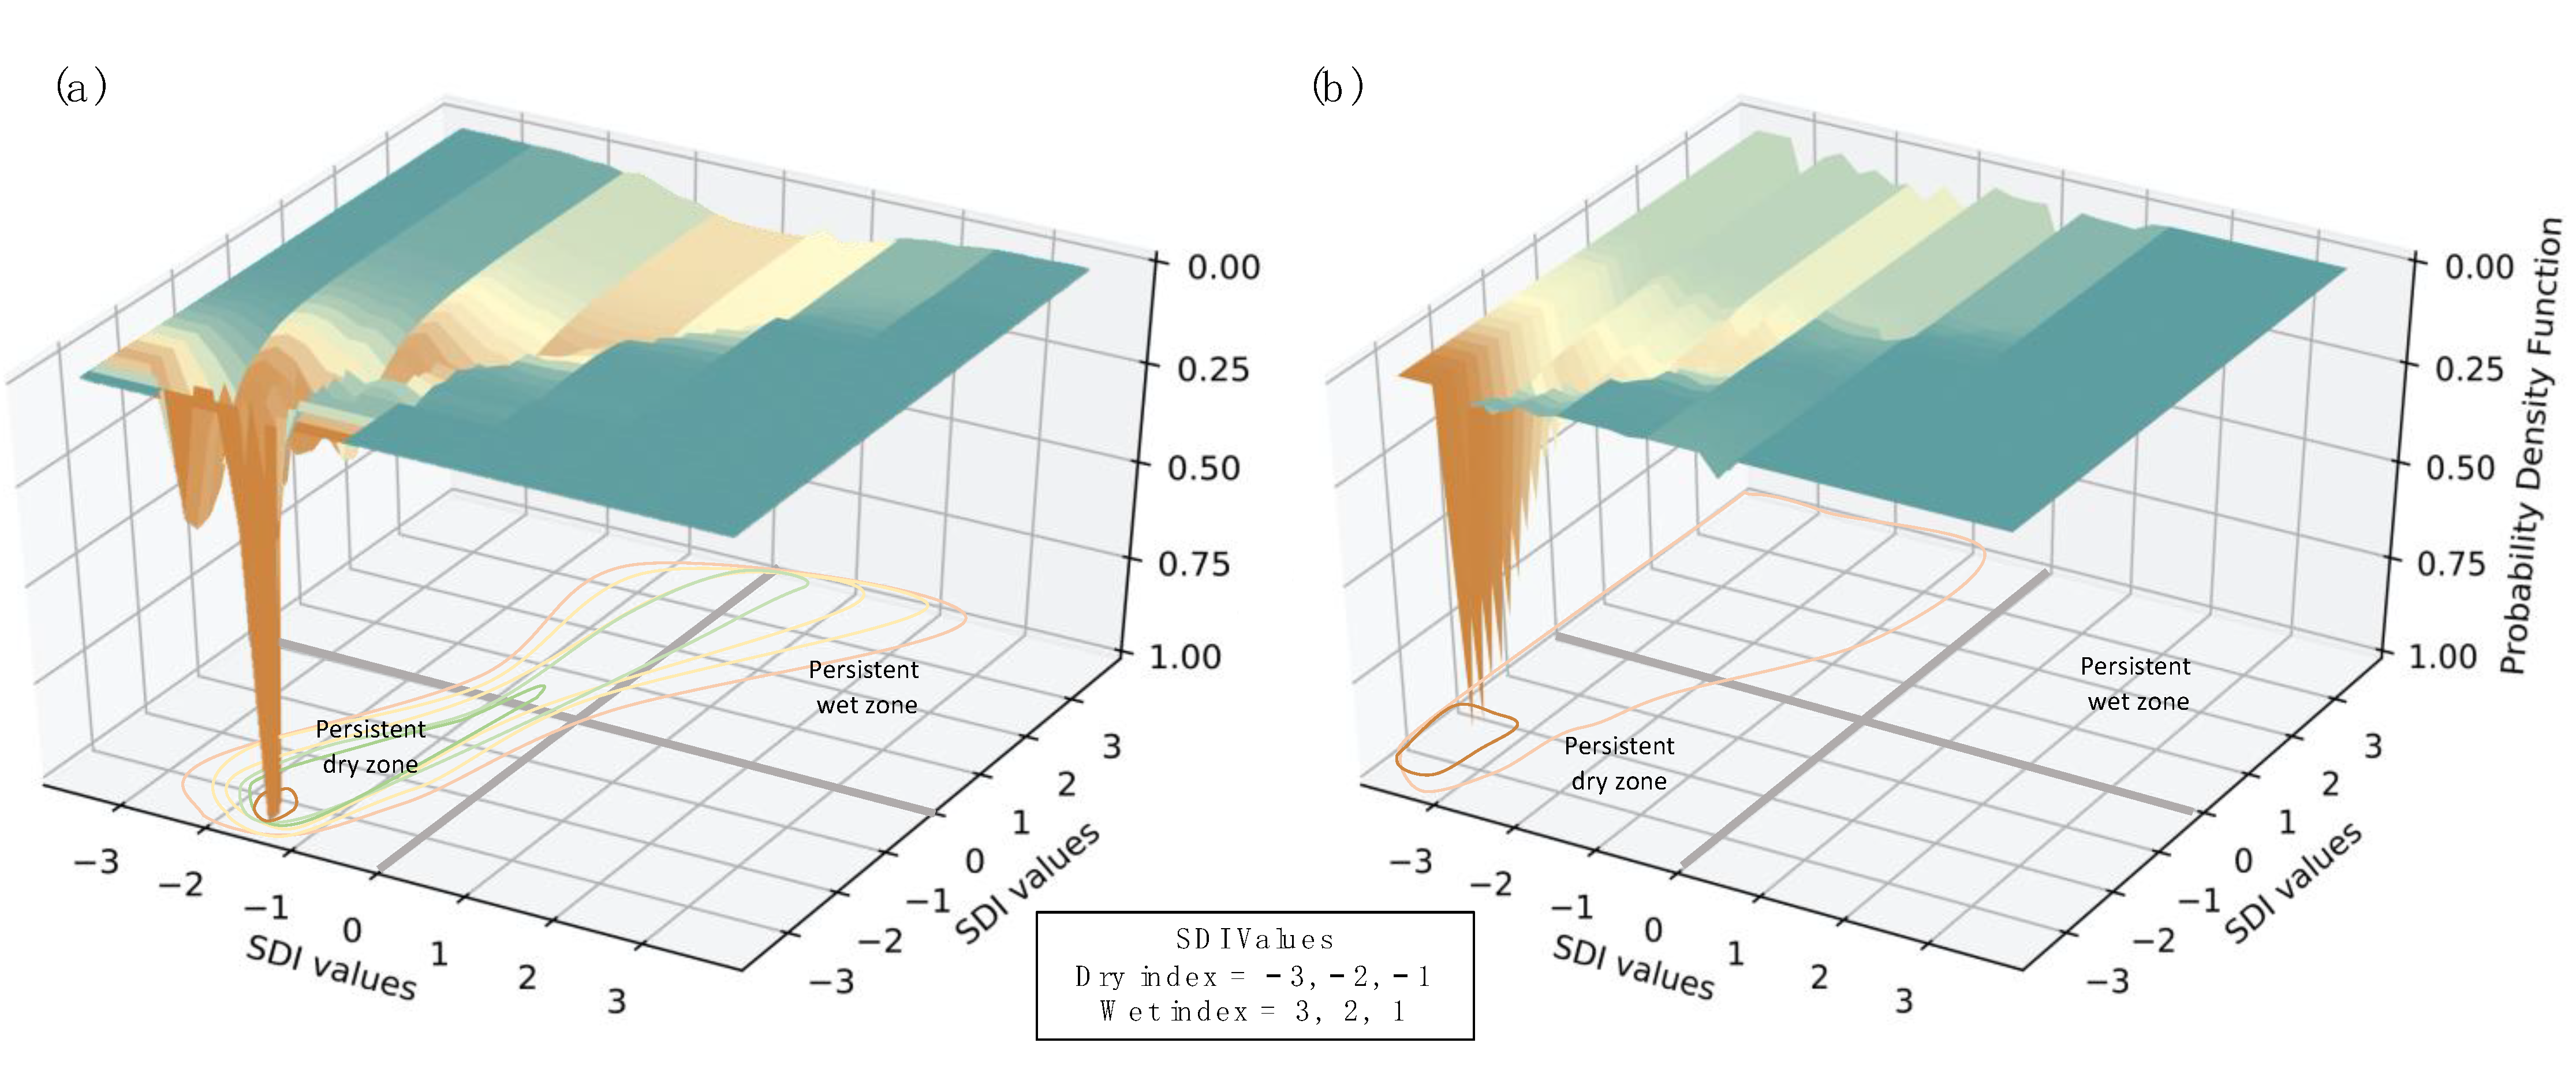
In the natural flow regime (Figure 6A), two states are identified: (1) a dry state portrayed as a constricted-deep basin of attraction located in the persistent dry zone; and (2) a wet state located portrayed as a shallow-wide basin located in the persistent wet zone. Valley bottoms correspond to the highest likelihood value of the system to remain in a given state; they are the modes of the probability density distribution [10]. At a given time, if the system is in a dry state, the system will remain in this state between 15 and 20 years, or if the system has transitioned to a wet state, it will remain in this state between 2 and 5 years. Based on the duration and frequency of both states, the basins of attraction differ in width, depth, and the number of valleys. In general, the RGB basin will tend to remain in a dry state, and greater perturbations are needed to move the system out of the persistent dry zone. In contrast, the RGB basin will remain less time in a wet state, and smaller perturbations will likely move the system away from the persistent wet zone. In essence, the stability landscape of the natural flow regime incorporates a diverse topography with different shapes and valleys where environmental stochasticity in the form of perturbations, such as hurricanes, droughts, tropical depressions, ENSO events, among others, will expose the system to a wide range of dynamics under the two stable states: dry and wet.
3.4.2. The Precarious RGB Regulated Stability Landscape
In contrast, the regulated flow regime (Figure 6B) has only a dry state depicted as a single wide-deep basin of attraction located in the persistent dry zone. Anthropogenic forcing (e.g., increased water use for agriculture) has altered the dynamics of river basins, changing the behavior and functionality of the natural ecosystem and causing alterations in the topology of the stability landscape. In the absence of environmental stochasticity due to the water regulations and streamflow diminishment, the resilience of the natural system erodes, and precariousness increases, moving the system closer to crossing a threshold. Precariousness is the result of management actions under historical conditions that have transformed the system and as a result, the number of states [68]. The anthropogenic megadrought in the RGB is likely the driver that transformed the stability landscape, reducing and shrinking the two states (dry and wet) of the natural stability landscape into the one state (dry) of the regulated system.
The intrinsic nature of coupled human–environmental systems and the adaptive cycles of panarchy in the RGB basin modified the stability landscape eroding its resilience. There is a higher resistance (depth of the basin) in the regulated system (Figure 6B) in comparison with the natural system (Figure 6A), indicating that greater forces and perturbations are required to move the system out of the current dry state. Even if the critically endangered RGB is trapped in an undesirable and unsustainable human-induced megadrought state, our society has the ability to modify the current stability landscape through transformability—the capacity to create a fundamentally new system when ecological, economic, or social structures make the existing system untenable [11]. The challenge is to reduce or avoid the human activities (e.g., modification of flow regime due to water storage in reservoirs that only meet human water needs) that create undesirable basins of attractions and move toward stability landscapes that resemble the natural state (e.g., implementation of environmental flows through dem releases mimicking the natural flow regime). “Different management actions would be required to initiate a transformative change that envisions and restores natural dynamic processes. Reservoir re-operation and environmental flows are strategies targeted to minimize hydrologic alteration by incorporating water releases that include functional flow metrics such as timing, frequency, magnitude, duration, and rate of change of the natural flow regime. Other management actions include environmentally, socially, and climate responsible agriculture, such as adequate selection of crops, deficit irrigation, and the implementation of cover crops which are measures to reduce consumptive water use.”
4. Conclusions
Natural hydrologic variability is vital for promoting ecological resilience, as it governs the water quantity, quality, habitat, and health of riverine ecosystems. In the Anthropocene, the alteration of natural flow variation by human-induced changes is the dominant force in social-ecological systems, causing changes in flow regimes and the resilience properties of river basins. This study demonstrates how human development and human-centered water management regulations are the main drivers of the anthropogenic megadrought in the Rio Grande. In addition, we demonstrate how this process has produced changes in the stability landscape of these river basins, including changes in the topology (resistance and latitude), the trajectory (precariousness), and the dynamic processes of a natural system (panarchy). The stability landscape alteration is depicted as the modification of two basins of attraction, which represent the natural wet and dry hydrologic states, into a single basin of attraction representing a permanent dry state. The implication of the resilience erosion in the RGB indicates that streamflow conditions have changed sufficiently to provide early warning signals of crossing a resilience threshold, meaning that the system could suffer consequences. As a society, we are already experiencing the effects of a water crisis, and current management practices and policies are beginning to migrate into placing aspects of social-ecological resilience analysis at the core of integrated water resources management. Aside from the limitations to operationalizing the concept of stability landscapes, the broader impact of this study is that it sheds light on quantifying ecological resilience attributes in river basins. We believe that a shift toward addressing resilience in river basins is a prerequisite to understanding current systems and reconnecting our societies with adaptable strategies aimed to be in sync with the dynamics of natural resources. Scenario planning and adaptive management are also necessary to overcome undesirable systems and foster flexibility and adaptability. Our ability to understand the dynamic processes of the natural system and modify our outdated vision of highly manipulated systems to obtain maximum yields is the most effective way to manage sustainable, resilient river basins in the face of increasing environmental and social change.
Supplementary Materials
The following supporting information can be downloaded at: https://www.mdpi.com/article/10.3390/w14182835/s1, Information about testing different probability distribution functions for the aggregated naturalized time series data is included.
Author Contributions
L.E.G.-D. and S.S.-S. conceptualized the study; L.E.G.-D. performed the formal analysis and wrote the original paper; S.S.-S. reviewed and edited the paper and supervised the project. All authors have read and agreed to the published version of the manuscript.
Funding
This research was financially supported by The National Council of Science and Technology of Mexico (CONACYT) through the Doctoral Fellowship Grant awarded to the first author Grant Number: CVU-598945.
Institutional Review Board Statement
Not applicable.
Informed Consent Statement
Not applicable.
Data Availability Statement
The data supporting this study’s findings are openly available in HydroShare at: Garza-Diaz, L. E., S. Sandoval Solis (2022). Natural and Regulated Monthly Streamflow Data for the Rio Grande/Rio Bravo Basin, HydroShare, http://www.hydroshare.org/resource/89728c8779c644d7a6ce110406516849, accessed on 1 August 2022.
Conflicts of Interest
The authors declare no conflict of interest.
References
- Lytle, D.A.; Poff, N.L. Adaptation to Natural Flow Regimes. Trends Ecol. Evol. 2004, 19, 94–100. [Google Scholar] [CrossRef] [PubMed]
- Grantham, T.E.; Mount, J.F.; Stein, E.D.; Yarnell, S.M. Making the Most of Water for the Environment: A Functional Flows Approach for California Rivers; Public Policy Institute of California: San Francisco, CA, USA, 2020. [Google Scholar]
- AghaKouchak, A.; Mirchi, A.; Madani, K.; Di Baldassarre, G.; Nazemi, A.; Alborzi, A.; Anjileli, H.; Azarderakhsh, M.; Chiang, F.; Hassanzadeh, E.; et al. Anthropogenic Drought: Definition, Challenges, and Opportunities. Rev. Geophys. 2021, 59, e2019RG000683. [Google Scholar] [CrossRef]
- Sthale, D. Anthropogenic Megadrought. Science 2020, 368, 238–239. [Google Scholar] [CrossRef]
- Williams, A.P.; Cook, E.R.; Smerdon, J.E.; Cook, B.I.; Abatzoglou, J.T.; Bolles, K.; Baek, S.H.; Badger, A.M.; Livneh, B. Large Contribution from Anthropogenic Warming to an Emerging North American Megadrought. Science 2020, 368, 314–318. [Google Scholar] [CrossRef] [PubMed]
- Ashraf, S.; Nazemi, A.; AghaKouchak, A. Anthropogenic Drought Dominates Groundwater Depletion in Iran. Sci. Rep. 2021, 11, 9135. [Google Scholar] [CrossRef]
- Holling, C.S. Resilience and Stability of Ecological Systems. Annu. Rev. Ecol. Syst. 1973, 4, 1–23. [Google Scholar] [CrossRef]
- Scheffer, M.; Carpenter, S.R.; Dakos, V.; van Nes, E.H. Generic Indicators of Ecological Resilience: Inferring the Chance of a Critical Transition. Annu. Rev. Ecol. Evol. Syst. 2015, 46, 145–167. [Google Scholar] [CrossRef]
- Beisner, B.E.; Haydon, D.T.; Cuddington, K. Alternative Stable States in Ecology. Front. Ecol. Environ. 2003, 1, 376–382. [Google Scholar] [CrossRef]
- Dakos, V.; Kéfi, S. Ecological Resilience: What to Measure and How. Environ. Res. Lett. 2022, 17, 043003. [Google Scholar] [CrossRef]
- Walker, B.; Holling, C.S.; Carpenter, S.R.; Kinzig, A. Resilience, Adaptability and Transformability in Social-Ecological Systems. Ecol. Soc. 2004, 9, 5. [Google Scholar] [CrossRef]
- Scheffer, M.; Bascompte, J.; Brock, W.A.; Brovkin, V.; Carpenter, S.R.; Dakos, V.; Held, H.; van Nes, E.H.; Rietkerk, M.; Sugihara, G. Early-Warning Signals for Critical Transitions. Nature 2009, 461, 53–59. [Google Scholar] [CrossRef] [PubMed]
- Blackmore, J.; Plant, R. Risk and Resilience to Enhance Sustainability with Application to Urban Water Systems. J. Water Resour. Plan. Manag. ASCE 2008, 134, 224–233. [Google Scholar] [CrossRef]
- Hirota, M.; Holmgren, M.; Van Nes, E.H.; Scheffer, M. Global Resilience of Tropical Forest and Savanna to Critical Transitions. Science 2011, 334, 232–235. [Google Scholar] [CrossRef] [PubMed]
- Livina, V.N.; Kwasniok, F.; Lenton, T.M. Potential Analysis Reveals Changing Number of Climate States during the Last 60 Kyr. Clim. Past 2010, 6, 77–82. [Google Scholar] [CrossRef]
- Berdugo, M.; Kéfi, S.; Soliveres, S.; Maestre, F. Plant Spatial Patterns Identify Alternative Ecosystem Multifunctionality States in Global Drylands. Nat. Ecol. Evol. 2017, 1, 3. [Google Scholar] [CrossRef]
- Berdugo, M.; Vidiella, B.; Solé, R.V.; Maestre, F.T. Ecological Mechanisms Underlying Aridity Thresholds in Global Drylands. Funct. Ecol. 2022, 36, 4–23. [Google Scholar] [CrossRef]
- Sendzimir, J.; Magnuszewski, P.; Flachner, Z.; Balogh, P.; Molnar, G.; Sarvari, A.; Nagy, Z. Assessing the Resilience of a River Management Regime: Informal Learning in a Shadow Network in the Tisza River Basin. Ecol. Soc. 2008, 13, 11. [Google Scholar] [CrossRef]
- Pillar, V.D.; Blanco, C.C.; Müller, S.C.; Sosinski, E.E.; Joner, F.; Duarte, L.D.S. Functional Redundancy and Stability in Plant Communities. J. Veg. Sci. 2013, 24, 963–974. [Google Scholar] [CrossRef]
- Enríquez-Coyro, E. El Tratado Entre México y Los Estados Unidos de América Sobre Ríos Internacionales: Una Lucha Nacional de Noventa Años; Tomos I y II, Segunda Edición; Comisión Nacional del Agua: Mexico City, Mexico, 1976. [Google Scholar]
- Wurbs, R.A. Methods for Developing Naturalized Monthly Flows at Gaged and Ungaged Sites. J. Hydrol. Eng. 2006, 11, 55–64. [Google Scholar] [CrossRef]
- Blythe, T.L.; Schmidt, J.C. Estimating the Natural Flow Regime of Rivers with Long-Standing Development: The Northern Branch of the Rio Grande. Water Resour. Res. 2018, 54, 1212–1236. [Google Scholar] [CrossRef] [Green Version]
- Gonzalez-Escorcia, Y.A. Determinación Del Caudal Natural En La Cuenca Transfronteriza Del Río Bravo/Grande. Master’s Thesis, Instituto Politécnico Nacional, Mexico City, Mexico, 2016. [Google Scholar]
- Loredo-Rasgado, J. Determinación y Análisis de Los Valores de Huella Hídrica En La Región Hidrológico Administrativa VI/Río Bravo. Master’s Thesis, Instituto Politécnico Nacional, Mexico City, Mexico, 2018. [Google Scholar]
- Silva Hidalgo, H. Modelo Matemático Para La Distribución De Agua Superficial En Cuencas Hidrológicas. Ph.D. Thesis, Centro de Investigación en Materiales Avanzados, S.C., Chihuahua, Mexico, 2010. [Google Scholar]
- Montanari, A.; Young, G.; Savenije, H.H.G.; Hughes, D.; Wagener, T.; Ren, L.L.; Koutsoyiannis, D.; Cudennec, C.; Toth, E.; Grimaldi, S.; et al. “Panta Rhei—Everything Flows”: Change in Hydrology and Society—The IAHS Scientific Decade 2013–2022. Hydrol. Sci. J. 2013, 58, 1256–1275. [Google Scholar] [CrossRef]
- Littlewood, I.G.; Marsh, T.J. Re-Assessment of the Monthly Naturalized Flow Record for the River Thames at Kingston since 1883, and the Implications for the Relative Severity of Historical Droughts. Regul. Rivers: Res. Manag. 1996, 12, 13–26. [Google Scholar] [CrossRef]
- Terrier, M.; Perrin, C.; de Lavenne, A.; Andréassian, V.; Lerat, J.; Vaze, J. Streamflow Naturalization Methods: A Review. Hydrol. Sci. J. 2021, 66, 12–36. [Google Scholar] [CrossRef]
- Orive-Alba, A. Informe Técnico Sobre El Tratado International de Aguas Irrigación En México; Comisión Nacional de Irrigación: Mexico City, Mexico, 1945. [Google Scholar]
- Moriasi, D.N.; Arnold, J.G.; van Liew, M.W.; Bingner, R.L.; Harmel, R.D.; Veith, T.L. Model Evaluation Guidelines for Systematic Quantification of Accuracy in Watershed Simulations. Trans. ASABE 2007, 50, 885–900. [Google Scholar] [CrossRef]
- Nalbantis, I.; Tsakiris, G. Assessment of Hydrological Drought Revisited. Water Resour. Manag. 2009, 23, 881–897. [Google Scholar] [CrossRef]
- Cokelaer, T. Fitter: A Tool to Fit Data to Many Distributions and Best One(s), GitHub Repository 2014. Available online: https://github.com/cokelaer/fitter (accessed on 10 August 2022).
- Garza-Díaz, L.E.; Sandoval-Solis, S. An Ecological Resilience Assessment to Detect Hydrologic Regime Shifts and Thresholds in River Basins. Ecol. Soc. 2022; in review. [Google Scholar]
- Rodríguez-Sánchez, P.; van Nes, E.H.; Scheffer, M. Climbing Escher’s Stairs: A Way to Approximate Stability Landscapes in Multidimensional Systems. PLoS Comput. Biol. 2020, 16, e1007788. [Google Scholar] [CrossRef]
- Srinivasan, V.; Kumar, P. Emergent and Divergent Resilience Behavior in Catastrophic Shift Systems. Ecol. Model. 2015, 298, 87–105. [Google Scholar] [CrossRef]
- Da Silva, M.G.; de Aguiar Netto, A.d.O.; de Jesus Neves, R.J.; Do Vasco, A.N.; Almeida, C.; Faccioli, G.G. Sensitivity Analysis and Calibration of Hydrological Modeling of the Watershed Northeast Brazil. J. Environ. Prot. 2015, 6, 837. [Google Scholar] [CrossRef]
- Sandoval-Solis, S.; Paladino, S.; Garza-Diaz, L.E.; Nava, L.F.; Friedman, J.R.; Ortiz-Partida, J.P.; Plassin, S.; Gomez-Quiroga, G.; Koch, J.; Fleming, J.; et al. Environmental Flows in the Rio Grande—Rio Bravo Basin. Ecol. Soc. 2022, 27, e20. [Google Scholar] [CrossRef]
- Ingol-Blanco, E.M.; McKinney, D.C. Modeling Climate Change Impacts on Hydrology and Water Resources: Case Study Rio Conchos Basin; Center for Research in Water Resources, University of Texas: Austin, TX, USA, 2011. [Google Scholar]
- Woodhouse, C.A.; Stahle, D.W.; Díaz, J.V. Rio Grande and Rio Conchos Water Supply Variability over the Past 500 Years. Clim. Res. 2012, 51, 147–158. [Google Scholar] [CrossRef] [Green Version]
- Harley, G.L.; Maxwell, J.T. Current Declines of Pecos River (New Mexico, USA) Streamflow in a 700-Year Context. Holocene 2018, 28, 767–777. [Google Scholar] [CrossRef]
- Sifuentes-Martínez, A.R.; Villanueva, J.; Teodoro, D.; Allende, C.; Estrada, J. 243 Years of Reconstructed Streamflow Volume and Identification of Extreme Hydroclimatic Events in the Conchos River Basin, Chihuahua, Mexico. Trees 2020, 34, 1347–1361. [Google Scholar] [CrossRef]
- Návar-Cháidez, J.d.J. Water Scarcity and Degradation in the Rio San Juan Watershed of Northeastern Mexico. Front. Norte 2011, 23, 125–150. [Google Scholar]
- Ortega-Gaucin, D.; Ortega-Gaucin, D. Caracterización de las sequías hidrológicas en la cuenca del río Bravo, México. Terra Latinoam. 2013, 31, 167–180. [Google Scholar]
- Lehner, F.; Wahl, E.R.; Wood, A.W.; Blatchford, D.B.; Llewellyn, D. Assessing Recent Declines in Upper Rio Grande Runoff Efficiency from a Paleoclimate Perspective. Geophys. Res. Lett. 2017, 44, 4124–4133. [Google Scholar] [CrossRef]
- Sandoval-Solis, S.; McKinney, D.C. Integrated Water Management for Environmental Flows in the Rio Grande. J. Water Resour. Plan. Manag. 2014, 140, 355–364. [Google Scholar] [CrossRef]
- Aguilar Ortiz, T.L.O. Análisis Histórico De La Sequía Hidrológica En La Cuenca Mexicana Del Río Salado; Instituto Mexicano de Tecnología del Agua: Mexico City, Mexico, 2018; p. 2. [Google Scholar]
- CONAGUA Caracterización Fluvial E Hidráulica De Las Inundaciones En México; Comisión Nacional del Agua: Mexico City, Mexico, 2014; p. 58.
- Llewellyn, D.; Vaddey, S. Upper Rio Grande Impact Assessment; Bureau of Reclamation: Columbia, MI, USA, 2013; p. 169. [Google Scholar]
- Cook, B.I.; Ault, T.R.; Smerdon, J.E. Unprecedented 21st Century Drought Risk in the American Southwest and Central Plains. Sci. Adv. 2015, 1, e1400082. [Google Scholar] [CrossRef]
- Cayan, D.R.; Das, T.; Pierce, D.W.; Barnett, T.P.; Tyree, M.; Gershunov, A. Future Dryness in the Southwest US and the Hydrology of the Early 21st Century Drought. Proc. Natl. Acad. Sci. USA 2010, 107, 21271–21276. [Google Scholar] [CrossRef]
- Rumsey, C.A.; Miller, M.P.; Sexstone, G.A. Relating Hydroclimatic Change to Streamflow, Baseflow, and Hydrologic Partitioning in the Upper Rio Grande Basin, 1980 to 2015. J. Hydrol. 2020, 584, 124715. [Google Scholar] [CrossRef]
- Steele, C.; Elias, E.; Reyes, J. Recent Streamflow Declines and Snow Drought in the Upper Rio Grande Tributary Basins. Univ. Counc. Water Resour. 2019, 1. [Google Scholar]
- Paredes-Tavares, J.; Gómez-Albores, M.A.; Mastachi-Loza, C.A.; Díaz-Delgado, C.; Becerril-Piña, R.; Martínez-Valdés, H.; Bâ, K.M. Impacts of Climate Change on the Irrigation Districts of the Rio Bravo Basin. Water 2018, 10, 258. [Google Scholar] [CrossRef]
- Duran-Encalada, J.A.; Paucar-Caceres, A.; Bandala, E.R.; Wright, G.H. The Impact of Global Climate Change on Water Quantity and Quality: A System Dynamics Approach to the US–Mexican Transborder Region. Eur. J. Oper. Res. 2017, 256, 567–581. [Google Scholar] [CrossRef]
- Corona, D.S.; Solis, S.S.; Peraza, E.H.; Hidalgo, H.S.; Herrera, C.Á. Aproximación e impacto directo de ciclones tropicales a la cuenca del río Conchos, Chihuahua, México. Investig. Y Cienc. De La Univ. Autónoma De Aguascalientes 2017, 25, 53–61. [Google Scholar] [CrossRef]
- Scurlock, D. From the Rio to the Sierra: An Environmental History of the Middle Rio Grande Basin; US Department of Agriculture, Forest Service, Rocky Mountain Research Station: Fort Collins, CO, USA, 1998. [Google Scholar]
- Wozniak, F.E. Irrigation in the Rio Grande Valley, New Mexico: A Study and Annotated Bibliography of the Development of Irrigation Systems; U.S. Department of Agriculture, Forest Service, Rocky Mountain Research Station: Fort Collins, CO, USA, 1998. [Google Scholar]
- Ward, F.A.; Booker, J.F.; Michelsen, A.M. Integrated Economic, Hydrologic, and Institutional Analysis of Policy Responses to Mitigate Drought Impacts in Rio Grande Basin. J. Water Resour. Plan. Manag. 2006, 132, 488–502. [Google Scholar] [CrossRef]
- Warman, A. La Reforma Agraria Mexicana: Una Visión de Largo Plazo. In Land Reform, Land Settlement and Cooperatives—Réforme Agraire, Colonisation et Coopératives Agricoles—Reforma Agraria, Colonización y Cooperativas; FAO Rural Development Division: Mexico City, Mexico, 2006. [Google Scholar]
- U.S. Congress Pecos River Compact. Congress of the United States; U.S. Congress Pecos River Compact: Santa Fe, NM, USA, 1949. [Google Scholar]
- Heard, T.; Perkin, J.; Bonner, T. Intra-Annual Variation in Fish Communities and Habitat Associations in a Chihuahua Desert Reach of the Rio Grande/Rio Bravo Del Norte. West. North Am. Nat. 2012, 72, 1–15. [Google Scholar] [CrossRef]
- Contreras-Balderas, S.; Edwards, R.J.; de Lourdes Lozano-Vilano, M.; García-Ramírez, M.E. Fish Biodiversity Changes in the Lower Rio Grande/Rio Bravo, 1953–1996. Rev. Fish Biol. Fish. 2002, 12, 219–240. [Google Scholar] [CrossRef]
- Contreras-Balderas, S.; Ruiz-Campos, G.; Schmitter-Soto, J.J.; Díaz-Pardo, E.; Contreras-McBeath, T.; Medina-Soto, M.; Zambrano-González, L.; Varela-Romero, A.; Mendoza-Alfaro, R.; Ramírez-Martínez, C.; et al. Freshwater Fishes and Water Status in México: A Country-Wide Appraisal. Aquat. Ecosyst. Health Manag. 2008, 11, 246–256. [Google Scholar] [CrossRef]
- Wong, C.; Williams, C.; Pittock, J.; Collier, U.; Schelle, P. World’s Top 10 Rivers at Risk. Working Papers. 2007. Available online: esocialsciences.com (accessed on 10 August 2022).
- Garreaud, R.D.; Boisier, J.P.; Rondanelli, R.; Montecinos, A.; Sepúlveda, H.H.; Veloso-Aguila, D. The Central Chile Mega Drought (2010–2018): A Climate Dynamics Perspective. Int. J. Climatol. 2020, 40, 421–439. [Google Scholar] [CrossRef]
- Walker, B.; Carpenter, S.; Anderies, J.; Abel, N.; Cumming, G.; Janssen, M.; Lebel, L.; Norberg, J.; Peterson, G.D.; Pritchard, R. Resilience Management in Social-Ecological Systems: A Working Hypothesis for a Participatory Approach. Conserv. Ecol. 2002, 6, 14. [Google Scholar] [CrossRef]
- Gunderson, L.H.; Holling, C.S. Panarchy: Understanding Transformations in Human and Natural Systems; Island Press: Washington, DC, USA, 2002; ISBN 978-1-55963-857-9. [Google Scholar]
- Becken, S. Developing A Framework for Assessing Resilience of Tourism Sub-Systems to Climatic Factors. Ann. Tour. Res. 2013, 43, 506–528. [Google Scholar] [CrossRef]
Figure 1.
A (hypothetical) stability landscape of a two-dimensional system with hilltops and valleys, also known as a marble-in-a-cup or balls-and-cups landscape. Black balls are found at the bottom of the valley and represent stable states. Retrieved from Dakos and Kefi, 2020 [10].
Figure 1.
A (hypothetical) stability landscape of a two-dimensional system with hilltops and valleys, also known as a marble-in-a-cup or balls-and-cups landscape. Black balls are found at the bottom of the valley and represent stable states. Retrieved from Dakos and Kefi, 2020 [10].

Figure 2.
Control points and locations of interest at the Rio Grande-Bravo Basin.

Figure 3.
Streamflow drought index of the naturalized control points of the Rio Grande-Bravo Basin.

Figure 4.
Streamflow drought index (SDI) indicating the hydrologic variability of the natural (left) and the regulated (right) state of four mainstem control points of the Rio Grande-Bravo Basin at (a) San Marcial, (b) El Paso, (c) Above Amistad, and (d) Anzalduas.
Figure 4.
Streamflow drought index (SDI) indicating the hydrologic variability of the natural (left) and the regulated (right) state of four mainstem control points of the Rio Grande-Bravo Basin at (a) San Marcial, (b) El Paso, (c) Above Amistad, and (d) Anzalduas.

Figure 5.
Streamflow drought index (SDI) indicating the hydrologic variability of the natural (left) and the regulated (right) state of four subbasin control points of the Rio Grande-Bravo Basin at (a) Rio Conchos, (b) Pecos River, (c) Rio Salado, and (d) Rio San Juan.
Figure 5.
Streamflow drought index (SDI) indicating the hydrologic variability of the natural (left) and the regulated (right) state of four subbasin control points of the Rio Grande-Bravo Basin at (a) Rio Conchos, (b) Pecos River, (c) Rio Salado, and (d) Rio San Juan.

Figure 6.
Stability landscapes of the Rio Grande-Rio Bravo at Above Amistad control point. (a) Natural flow regime (Figure 5A), two states are identified: (1) a persistent dry zone, characterized by a constricted-deep basin of attraction; and (2) a persistent wet zone, portrayed as one shallow-wide basin. (b) The regulated flow regime shows a single wide-deep basin of attraction pertaining to the persistent dry zone.


Table 1.
Description of hydrologic stated based on a modified streamflow drought index (SDI) criterion by Garza-Díaz and Sandoval-Solis [33].
Table 1.
Description of hydrologic stated based on a modified streamflow drought index (SDI) criterion by Garza-Díaz and Sandoval-Solis [33].
| Description of State | Criterion |
|---|---|
| Extremely dry | −2 < SDI ≤ −3 |
| Severely dry | −1 < SDI < −2 |
| Dry | −0.5 < SDI < −1 |
| Moderately dry | 0 < SDI < −0.5 |
| Moderately wet | 0 < SDI < 0.5 |
| Wet | 0.5 < SDI < 1 |
| Severely wet | 1 < SDI < 2 |
| Extremely wet | 2 < SDI ≤ 3 |
Table 2.
Hydrologic periods of the Rio Grande–Bravo basin. Each hydrologic period is the average of the consecutive number of years that ranges from specific SDI values.
Table 2.
Hydrologic periods of the Rio Grande–Bravo basin. Each hydrologic period is the average of the consecutive number of years that ranges from specific SDI values.
| Control Point | Hydrologic Period (Average of Consecutive Years) | |||
|---|---|---|---|---|
| Dry (−3 to −0.5) 1 | Extremely Dry (−3 to −2) 1 | Wet (0.5 to 4) 1 | Extremely Wet (2 to 4) 1 | |
| San Marcial | 10 | 8 | 11 | 2 |
| El Paso | 13 | 8 | 15 | 2 |
| Above Amistad | 13 | 9 | 16 | 3 |
| Anzalduas | 13 | 6 | 12 | 2 |
| Rio Conchos | 12 | 6 | 16 | 3 |
| Pecos River | 25 | 2 | 16 | 4 |
| Rio Salado | 23 | 5 | 13 | 2 |
| Rio San Juan | 18 | 4 | 15 | 3 |
| Average | 16 | 6 | 14 | 3 |
| Median | 13 | 6 | 15 | 3 |
Note: 1 streamflow drought index (SDI) values.
Publisher’s Note: MDPI stays neutral with regard to jurisdictional claims in published maps and institutional affiliations. |
© 2022 by the authors. Licensee MDPI, Basel, Switzerland. This article is an open access article distributed under the terms and conditions of the Creative Commons Attribution (CC BY) license (https://creativecommons.org/licenses/by/4.0/).
Share and Cite
MDPI and ACS Style
Garza-Díaz, L.E.; Sandoval-Solis, S. Changes in the Stability Landscape of a River Basin by Anthropogenic Droughts. Water 2022, 14, 2835. https://doi.org/10.3390/w14182835
AMA Style
Garza-Díaz LE, Sandoval-Solis S. Changes in the Stability Landscape of a River Basin by Anthropogenic Droughts. Water. 2022; 14(18):2835. https://doi.org/10.3390/w14182835
Chicago/Turabian StyleGarza-Díaz, Laura E., and Samuel Sandoval-Solis. 2022. "Changes in the Stability Landscape of a River Basin by Anthropogenic Droughts" Water 14, no. 18: 2835. https://doi.org/10.3390/w14182835
Note that from the first issue of 2016, this journal uses article numbers instead of page numbers. See further details here.