Article

Initial Deployment of a Mobile Sensing System for Water Quality in Urban Canals

1
Department of Civil and Environmental Engineering, Massachusetts Institute of Technology, Cambridge, MA 02139, USA
2
Senseable City Lab, Massachusetts Institute of Technology, Cambridge, MA 02139, USA
3
Pontifícia Universidade Católica do Paraná, Curitiba 80215-901, PR, Brazil
4
Waternet, P.O. Box 94370, 1090 GJ Amsterdam, The Netherlands
*
Authors to whom correspondence should be addressed.
Water 2022, 14(18), 2834; https://doi.org/10.3390/w14182834
Submission received: 25 April 2022 / Revised: 2 August 2022 / Accepted: 19 August 2022 / Published: 12 September 2022
(This article belongs to the Section Urban Water Management)

Abstract

:
Although water quality has extensively improved over the last decade, recreational uses of the canal network in Amsterdam are limited by variations in water quality associated with stormwater runoff and episodic harmful algal blooms. The current systems for monitoring water quality are based on a stationary network of sampling points, offline testing methods, and online measurements of conventional water quality parameters on board a boat that continuously navigates the urban canal network. Here we describe the development and deployment of online algal sensors on board the boat, including a prototype LED-induced fluorescence instrument for algal identification and quantification. We demonstrate that by using only a single patrol vessel, we are able to achieve enough sampling coverage to observe spatiotemporal heterogeneity of algal and chemical water quality within the canal network. The data provide encouraging evidence that opportunistic measurements from a small number of mobile platforms can enable high-resolution mapping and can be used to improve the monitoring of water quality across the city compared to the current network of fixed sampling locations. We also discuss the challenges of operating water quality sensors for long-term autonomous monitoring.

1. Introduction

Recreational water environments can offer ecological, economic, and human health benefits to cities [1]. For these benefits to be realized, water resource managers must ensure that the water is safe and healthy for public use. Several conditions can arise in water environments that render them unsafe for recreational use including (but not limited to) unsafe levels of chemical contaminants, pathogens, harmful algal blooms (HABs), and fecal contamination [2,3,4]. There are several adverse health outcomes attributed to contaminated recreational water exposure, including gastroenteritis (GE) and fever, as well as skin, ear, and eye irritations. In fecal-contaminated water, exposure can lead to more severe illnesses associated with the transmission of pathogens, such as hepatitis, meningoencephalitis, and typhoid fever [5]. Several common cyanobacteria genera (Microcystis, Anabaena, Planktothrix, Oscillatoria, Nostoc, and Gloeotrichia) are known to produce neuro- and hepatotoxins, which have deleterious effects on the nervous system and liver, respectively [6]. Both local and international health and environmental agencies have developed guidelines for what constitutes safe conditions for human recreation [5,7,8]. To ensure adherence to these guidelines, there is a general need to increase the frequency of measurements and reduce latency in the reporting of water quality data on a system-wide scale.
The city of Amsterdam is known for its dense network of canals. While these waterways are not classified as official European bathing sites and therefore need not adhere to the EU Bathing Water Directive [8], they are often used for recreational swimming including a number of high-profile organized/permitted events. Most of the time, water quality in the River Amstel and the canal zone meets high quality standards as applied in official swimming locations [9] (Ouboter, pers. comm.). In recent years, recreational use of the canal network in Amsterdam has been limited by degradations in water quality associated with stormwater runoff and episodic HABs [2,10]. For example, in 2018 Amsterdam’s annual City Swim event was cancelled due to unsafe levels of Escherichia coli. Additionally, the years 2012 and 2016 saw blooms of a potentially harmful cyanobacteria, Microcystis, with measured cell densities of 40,000 cells mL−1 (unpublished data). The guideline set by the World Health Organization (WHO) classifies a harmful bloom as recreational water with cyanobacterial cell densities ≥ 20,000 cells mL−1 [5]. These recent Microcystis blooms, however, were not reported to have been of a toxin-producing strain (toxin-producing strains are generally only identifiable through PCR methods [6]). The local water authority, Waternet, currently monitors the water chemistry and algal community within the canals and surrounding rivers through a network of fixed sampling stations, offline measurements, and online measurements of conventional parameters such as conductivity and dissolved oxygen on board a boat [11]. However, eutrophication [12,13] and changes in weather patterns (associated with climate change) contribute to increasingly favorable bloom conditions [14,15]. Amsterdam, in particular, struggles with high nutrient levels in its surface water system due to anthropogenic sources, such as sewage leaks and overflows, as well as inputs from nutrient-rich groundwater seepage [16,17,18].
Online monitoring of the algal community can provide a better understanding of the water quality and ecosystem health [19] and potentially provide advance warning of impending algal bloom events. Community composition is routinely measured by manual cell identification (to the genus and even species level) and enumeration using light microscopy (a labor-intensive process) or lab-based particle imaging systems such as FlowCAM [20]. While there has been substantial development of field-deployable imaging flow cytometry [21,22], the instruments remain expensive and the authors are not aware of any applications where they have been deployed unattended over extended time periods (weeks–months).
Fluorescence spectroscopy has proven useful for continuous, in situ monitoring of algal pigments [23,24]. Furthermore, LED-based fluorescence sensors are often low-cost and small enough to be easily transported and deployed in the field. Typically, these sensors consist of a single excitation light source and a photodetector sensitive to a narrow bandwidth of emission wavelengths [25,26]. This enables observation of fluorescence from a single photosynthetic pigment contained in algal cells, such as chlorophyll, phycocyanin, or phycoerythrin. For example, to measure chlorophyll fluorescence several commercial off-the-shelf fluorescence probes contain a single LED with a peak wavelength of approximately 470 nm and a photodetector screened by a narrow-band optical filter with a central wavelength near 680 nm. These wavelengths correspond to the peak absorption and fluorescence emission wavelengths of chlorophyll, respectively. If one is only concerned with monitoring a single algal class with unique absorption and fluorescence profiles, then sensors with single excitation sources will often suffice. However, if one is interested in monitoring multiple algal classes simultaneously via fluorescence, multiple wavelengths must be used for excitation sources and emission detectors. To this end, instruments with several excitation sources in conjunction with either a photodetector or photospectrometer have been employed to measure fluorescence from multiple photosynthetic pigments in mixed field samples [23,24,25,26,27,28,29]. The data collected from such instruments can provide information on the abundance of the major classes of algae, such as Chlorophyta (green algae), Cyanophyceae (cyanobacteria), Bacillariophyceae (diatoms), and Rhodophyta (red algae). For example, Ng et al. [24] demonstrated the effectiveness of a prototype instrument in performing taxonomic discrimination of algae in mixed field samples, suggesting that fluorescence spectroscopy can be practical and effective for field-deployable monitoring of algal community composition and detection of HABs.
Previous field surveys of algae in the Amsterdam canals have shown that a high degree of spatial and temporal variability exists in the diversity and abundance of the major algal classes. The city’s existing network of stationary monitoring sites and intermittent field surveys are unable to fully capture this variability (Ouboter, pers. comm.). Mobile environmental monitoring offers an efficient way to achieve high spatiotemporal coverage of a sampling region [30]. Many studies have employed dedicated vehicles to perform environmental measurements for short-term field campaigns [31,32,33,34,35]. Oceanographers commonly perform field campaigns on large cruise vessels. However, such measurement campaigns require a dedicated vessel, large support staff, and frequent oversight of equipment [21]. An alternative strategy, employed in this research, uses an autonomous sensing system deployed on a patrol vessel that operates throughout the sampling region. This opportunistic mobile monitoring offers the benefit that the vessel is already in service and does not have to be brought online solely for a field campaign. This method leverages the vessel’s existing spatiotemporal coverage to opportunistically collect measurements across a city as it goes about its operational duties. For this method to be practical for a given study, the prospective measurement device must be minimally disruptive to the vessel operations and be able to function unattended for extended periods of time. Such an approach has been utilized by the FerryBox project over the last 15 years. The FerryBox project uses “ships-of-opportunity” including ferries, cargo ships, and research vessels to deploy sensors and instruments to opportunistically measure physical, chemical, and biological parameters in coastal and marine environments [36,37]. The current study differs from the FerryBox project as it targets spatiotemporal phenomena occurring on a much smaller physical scale, utilizing much smaller vessels operating within an urban environment. In these respects, the current study is more closely related to the City Scanner project that measures street-level atmospheric conditions across the urban environment by deploying sensors on municipal trash trucks [38].
The aim of this study is to demonstrate the feasibility and utility of opportunistic mobile sensing of water quality in urban waterways. By employing a multi-excitation LED fluorescence spectrometer side-by-side with a multi-parameter water quality probe, we attempt to monitor the dynamics of the three most abundant algal groups present in the Amsterdam canals: green algae, cyanobacteria, and diatoms. We demonstrate that by using only a single pre-existing municipal utility boat, we are able to achieve enough sampling coverage to observe spatiotemporal heterogeneity of several water quality parameters within the canal network. The data provide encouraging evidence that opportunistic measurements from a small number of mobile platforms can enable high-resolution mapping and can be used to improve modeling and the control of water quality across the city. The challenges associated with operating water quality sensors autonomously and continuously over long durations are also discussed.

2. Materials and Methods

2.1. Study Area Description

The study was conducted in the canals and surrounding surface waters of Amsterdam. Amsterdam is a densely populated urbanized city in the western part of the Netherlands. The water level and quality in Amsterdam are artificially controlled/regulated using a combination of pumping stations, adjustable weirs, and culverts [16]. The southern area of the greater Amsterdam area holds a large number of polders and reclaimed lakes, some of which are several meters below mean sea level (MSL). The regional water system, referred to as the “Boezem”, consists of a series of storage and discharge canals. The major surface water constituents of the Boezem include the Amstel and Vecht Rivers, the Amsterdam–Rhine Canal, the IJ, and the North Sea Canal. The Boezem is used as a temporary storage basin and to transport water to and from the polders [39]. During periods of excess water (i.e., high precipitation), water is pumped from the polders to the Boezem and makes its way to the main rivers. During periods of low precipitation, the Boezem supplies water to the polders [40]. The Boezem connects the greater Amsterdam water system to a branch of the Rhine River, Lek River (upstream), and the North Sea (downstream). In order to push back saline water from the North Sea Canal, the Boezem is frequently flushed with freshwater from the Rhine River. The salinity of the Boezem for the most part mirrors that of its major input, the Rhine River. However, there is also a relationship with precipitation. Salt intrusion from the sea through surface waters as well as saline seepage through ground water into lower-lying polders, also have a role in modulating the salinity of the Boezem [11,39].

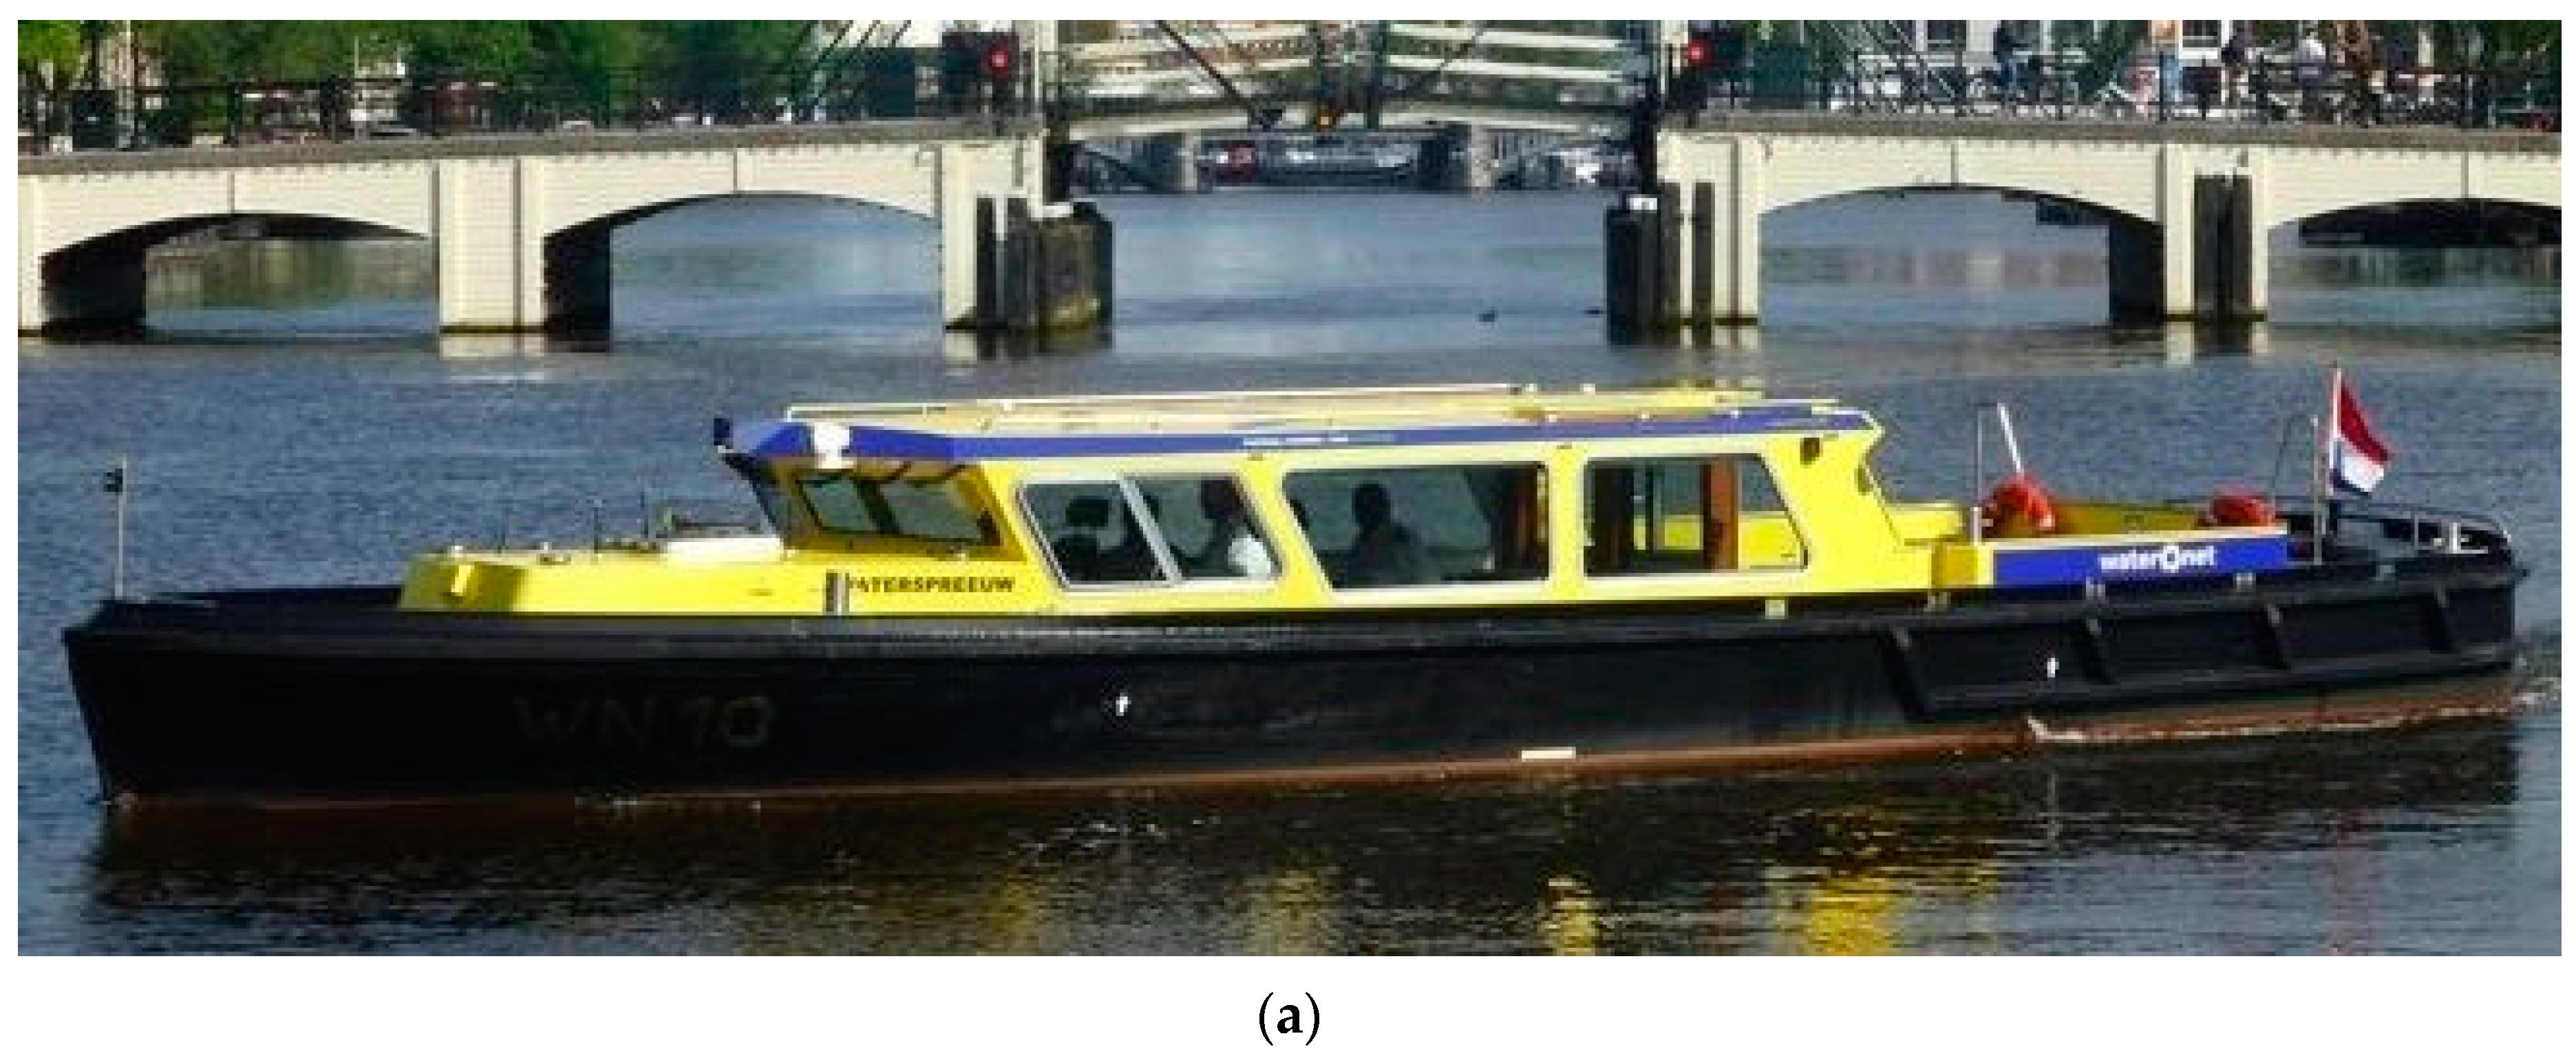
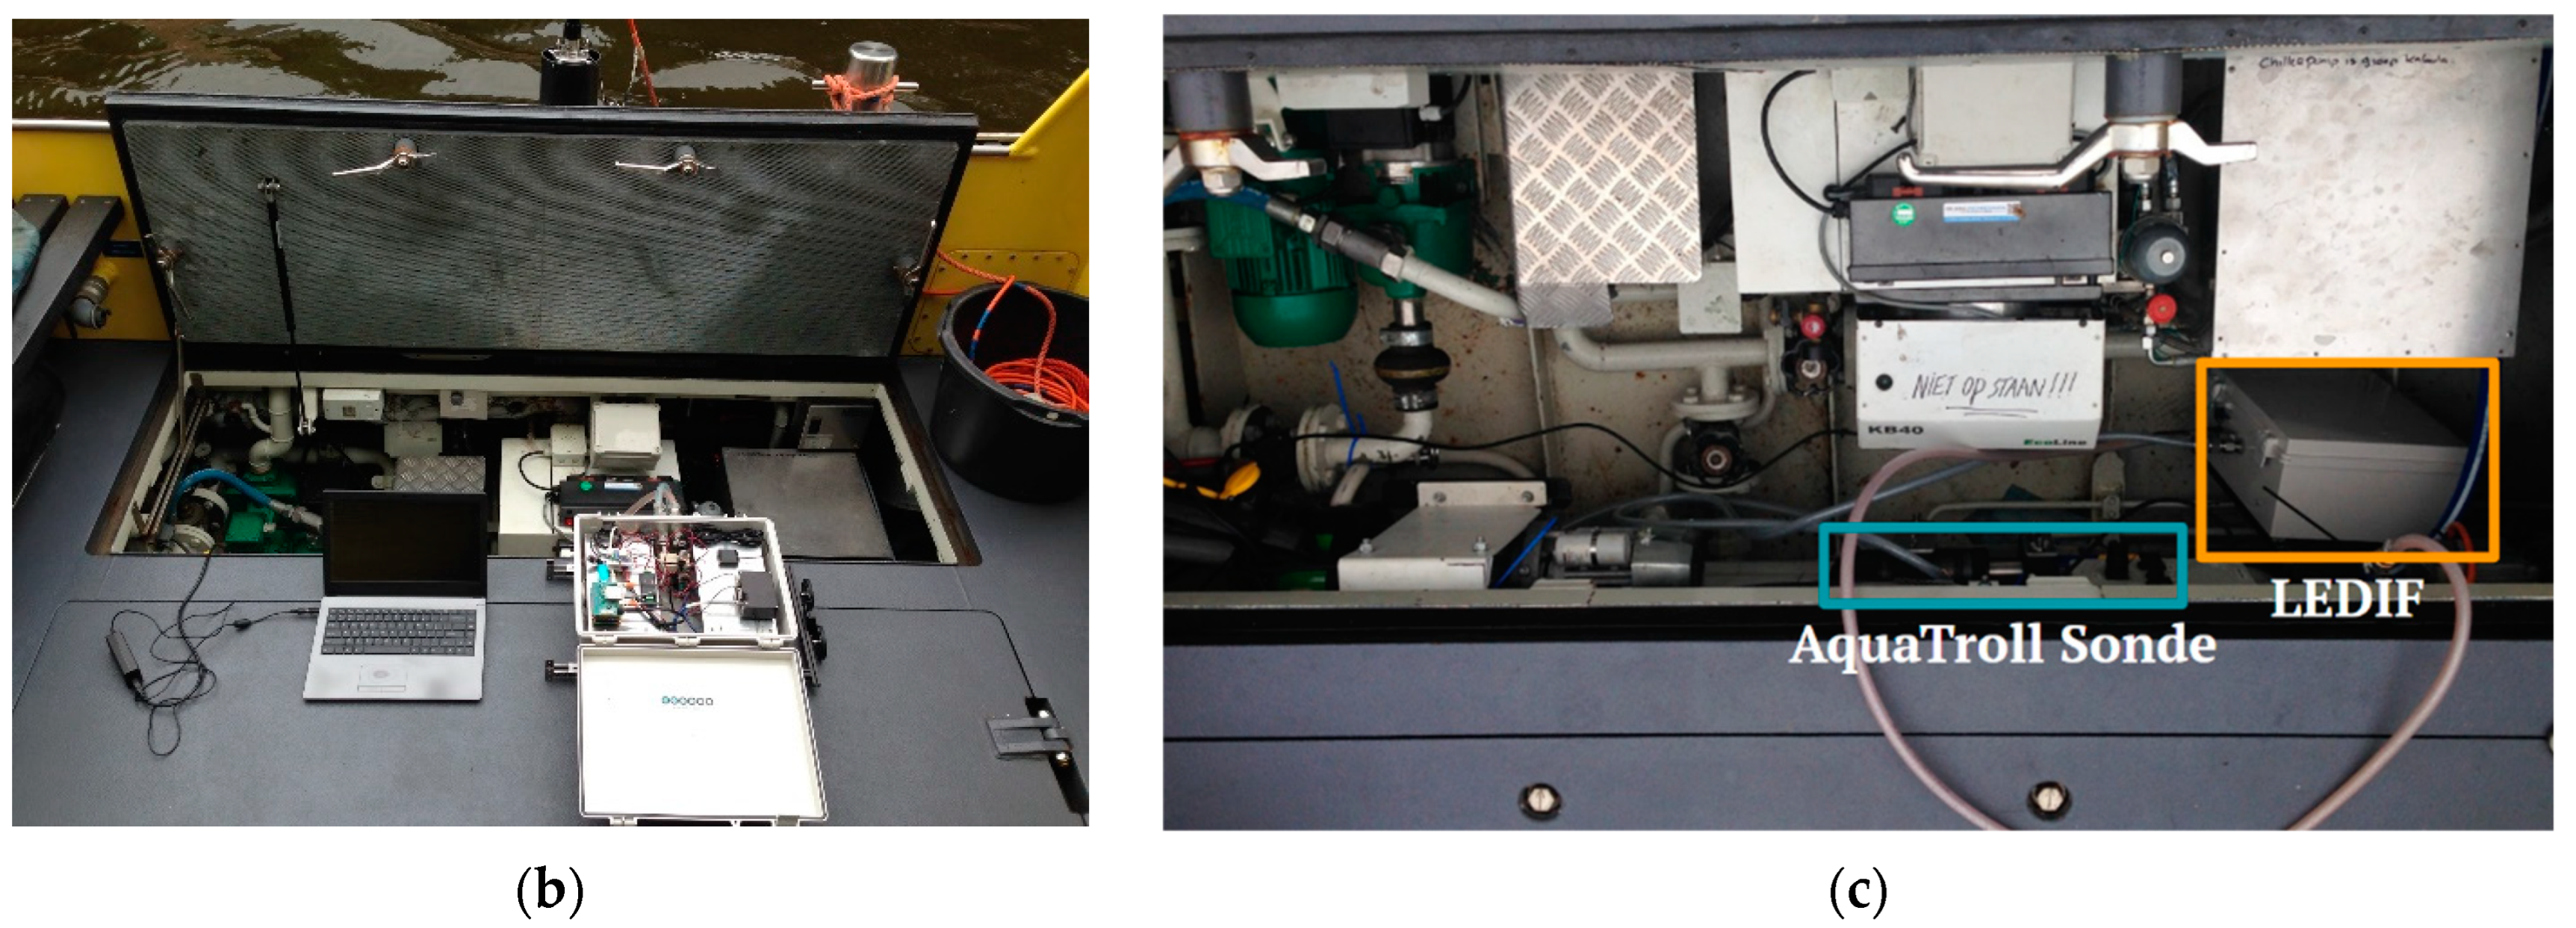
2.2. Measurement Platform and Sampling Protocol

The water vessel chosen for this study was a pre-existing municipal utility boat (Figure 1a). The boat has a diverse set of operational duties which require it to traverse the Amsterdam canal network frequently through a myriad of different routes and schedules. The boat is low enough to navigate nearly every canal in the network. Additionally, through its association with the municipality, it has elevated access to canal regions which are generally closed to the public. These attributes enable it to navigate the canal network in its near entirety. Two algal sensors were integrated together within the hull of the boat for 3 months from 3 June 2019 to 9 September 2019. Both sensors were integrated parallel and upstream of the boat’s engine as part of the engine cooling system. The engine cooling system pumps water from <1 m below the ship’s hull. Just after the water intake, a separate small hose pump pumps a part of the intake water through both the sensors, after which the water flows to the outlet pipe of the cooling circuit (Figure 1b,c and Figure 2). The deployment vessel presented several constraints. For example, the vessel was unable to change the water sampling depth, which may have prevented the study from collecting samples at the optimal depth for some algal groups [41]. Another constraint which the vessel presented was its speed of travel. In an ideal sampling scenario, the boat would complete each measurement at a single location. However, due to the combination of the vessel’s speed, the sensors’ sampling duration and frequency, and the flow-through nature of the water sampling configuration, each measurement corresponded to a spatially averaged data point.
The first sensor, a commercial In-Situ Aqua TROLL multi-parameter sonde, was configured with probes for measuring conductivity, temperature, dissolved oxygen, and phycocyanin. The phycocyanin probe measures fluorescence with an excitation wavelength of 590 nm and detection wavelength range of 640 nm to 690 nm. The sensor reports phycocyanin in both concentration (µg/L) and relative fluorescence units (RFU). The Aqua TROLL’s sampling frequency is one measurement every two seconds.
A prototype multi-excitation fluorescence spectrometer, LEDIF [42] (purchased from Ecosen Solutions Pte. Ltd., Singapore), was used for measuring the fluorescence of the major photosynthetic pigments of algal classes which have been historically observed in Amsterdam field surveys. LEDIF can be configured with up to six excitation LEDs with wavelengths selected based on an application’s target fluorophores. To measure fluorescence from the photosynthetic pigments of interest, the LEDIF was configured with six LEDs of the following wavelengths: 375 nm, 405 nm, 525 nm, 595 nm, 605 nm, and 780 nm. The LEDs were aligned at an angle of 90° to the axis of light collection. To measure absorbance spectra, a broadband light source emitting light in the range of 185 nm to 1100 nm was coupled through an optical fiber and collimating lens to illuminate the flow cell along an axis aligned at 180° to the same light collection system that was used for fluorescence-based measurements. The light from the flow cell was collected using a USB4000 spectrometer (Ocean Optics). The spectrometer measures light intensity across the spectrum from 200 to 850 nm and was configured with an integration time of 10 s. The LEDIF’s sampling frequency is one measurement every two minutes.
The LEDIF device was customized/ruggedized for this study by repackaging it into an IP66-rated enclosure with similarly rated bulkhead electrical connectors. Additionally, the control of the instrument was automated for continuous unattended operation. LEDIF was originally designed to interface with a desktop computer or laptop and be operated by a trained technician. For the purposes of this study, LEDIF had to be able to be operated autonomously for months on end. This was accomplished using a Raspberry Pi 3, which connected to LEDIF via Ethernet and automated the operational commands traditionally entered by a technician. A GPS was integrated into LEDIF for the tracking of latitude, longitude, time, speed, and heading. A 4G LTE cellular modem was also integrated into LEDIF to provide network connectivity for the real-time transfer of measurement data and operational metadata. The network connectivity also allowed for over-the-air firmware updates.

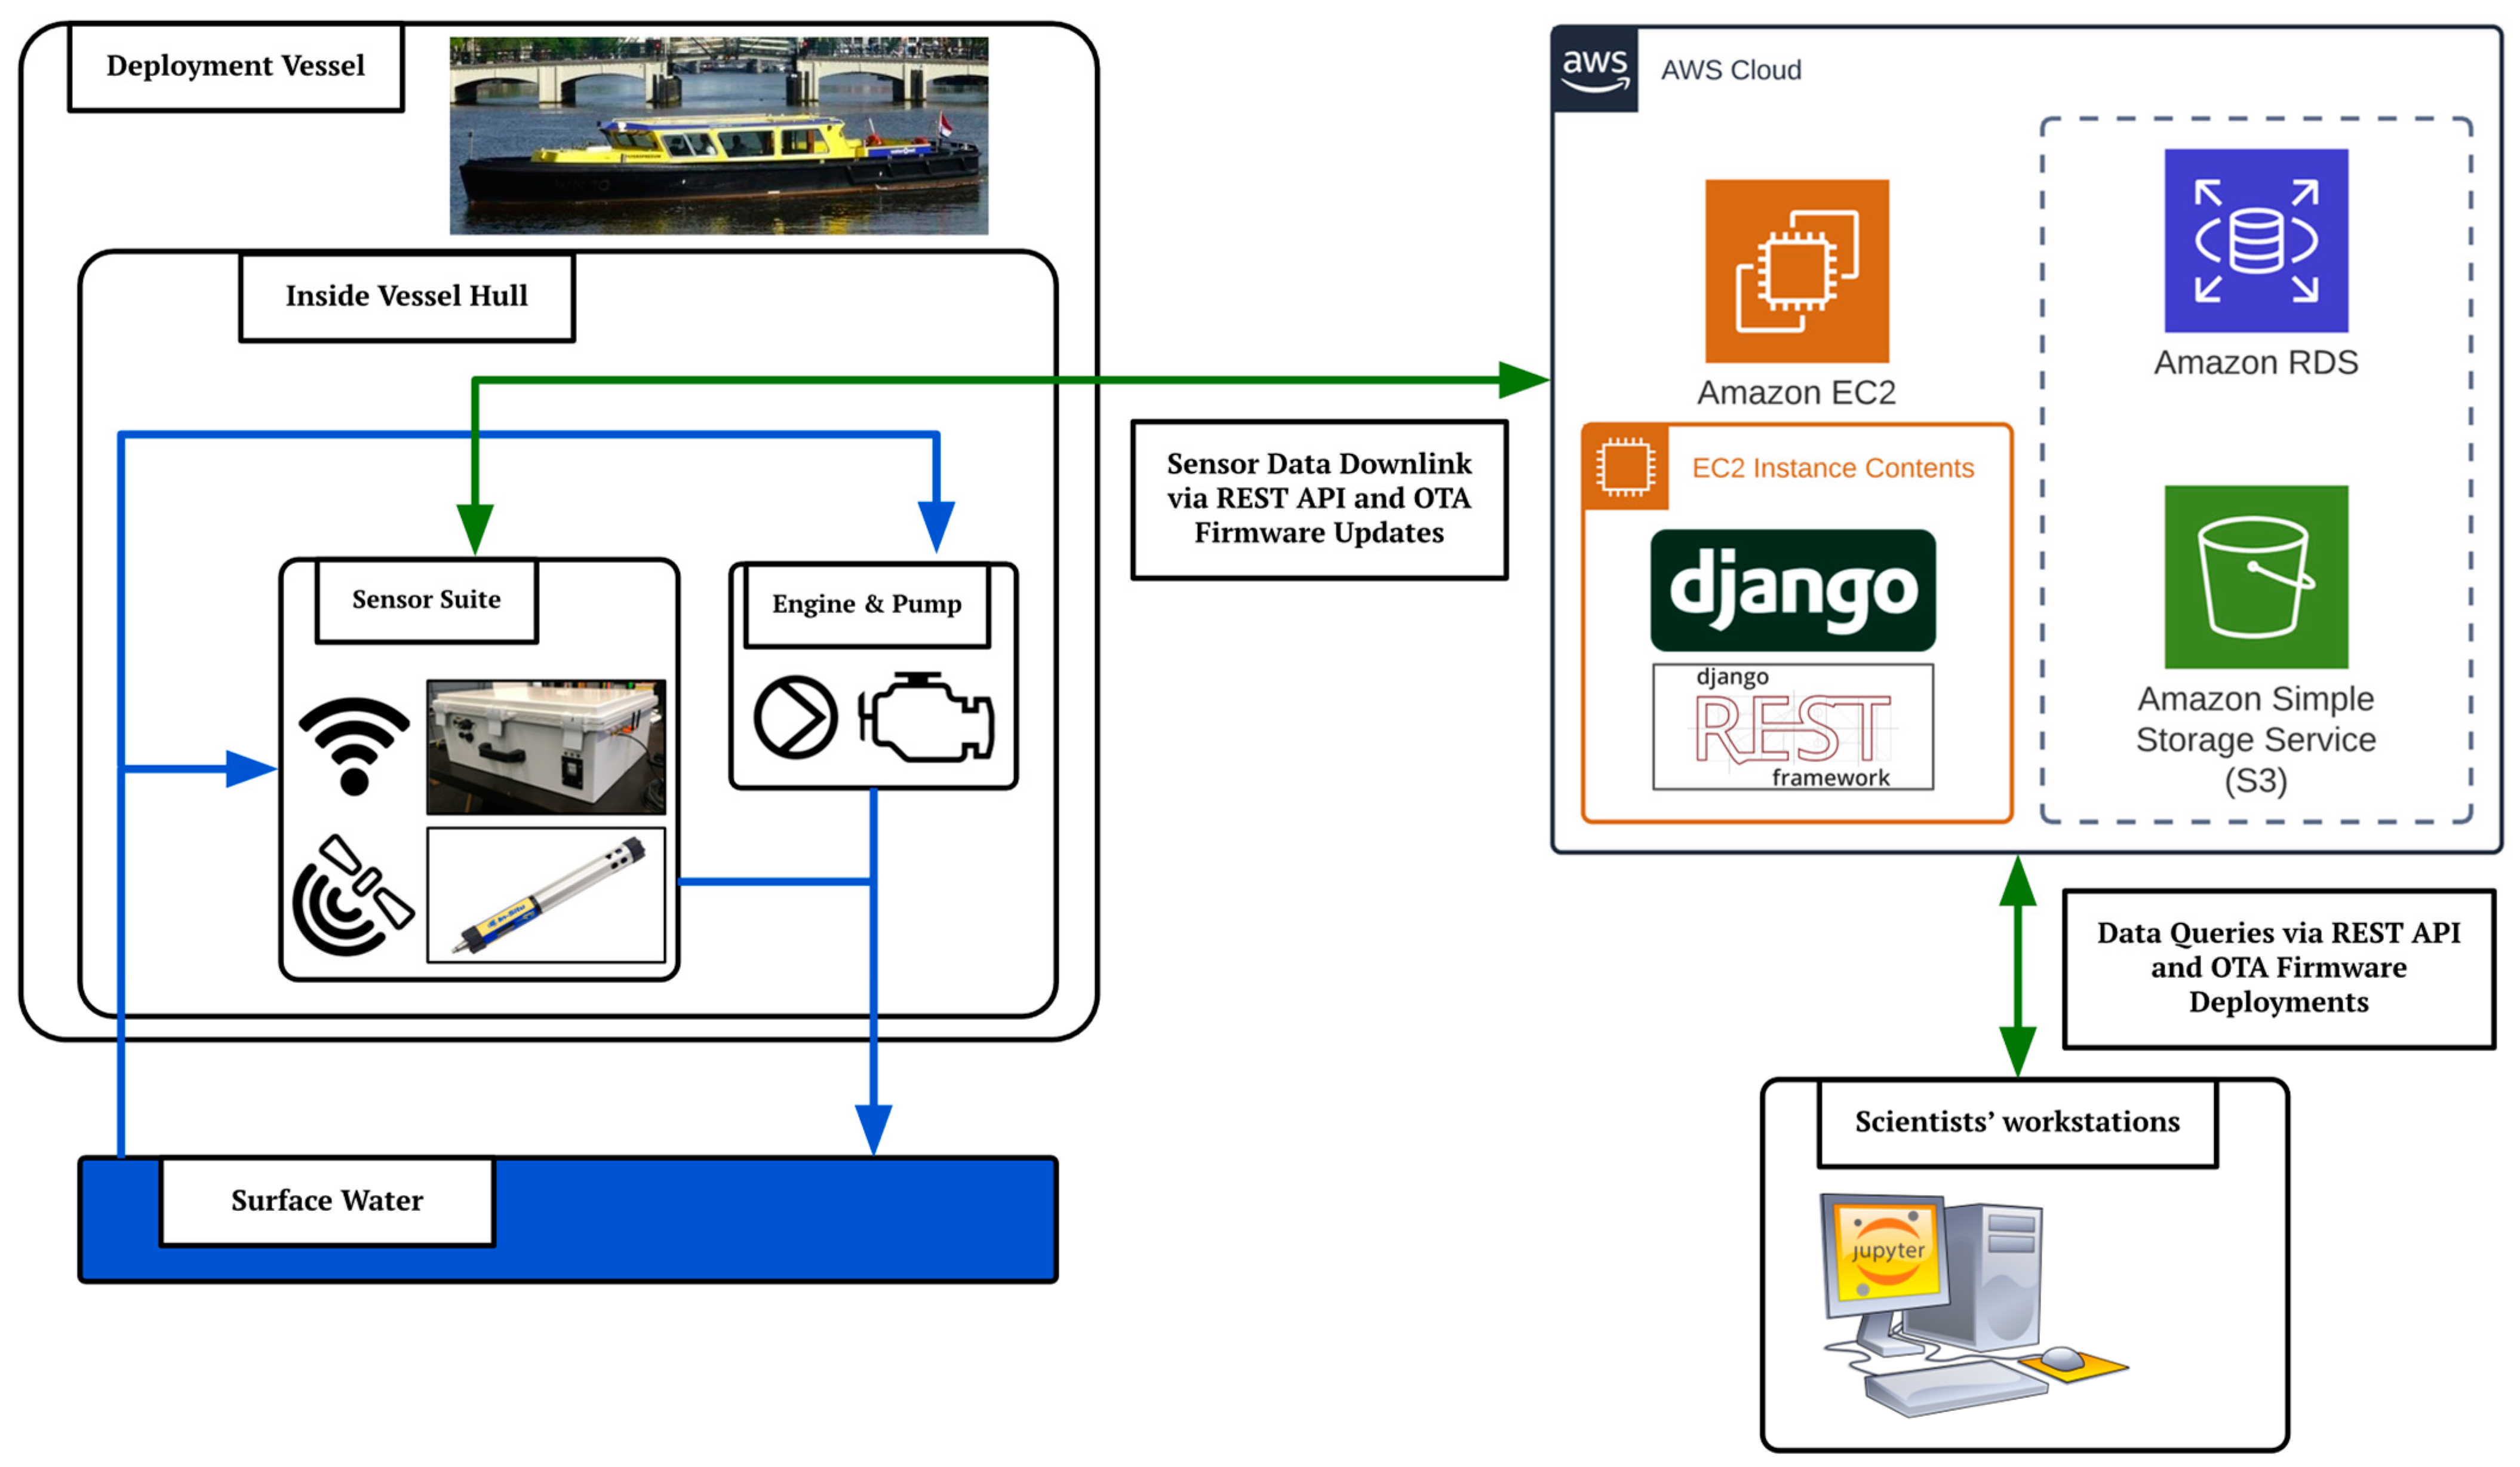
2.3. Internet of Things (IoT) Data Architecture

To enable real-time operational monitoring and transmission of measurement data from the deployed LEDIF, an IoT cloud-based data architecture was developed (Figure 2). This was achieved through cellular network connectivity and a REST API implemented in Python using Django REST Framework. The API was used on the LEDIF end to upload fluorescence measurement data and operational metadata. Once uploaded, the data was stored in a MySQL database. The stored data could then be queried using the same REST API and analyzed in a Jupyter Notebook using Python. This enabled researchers to perform data analysis in Cambridge, MA, as the sensor deployment was ongoing in Amsterdam. A cloud server was used to host the REST API and database. LEDIF’s network connectivity also enabled the deployment of over-the-air (OTA) firmware updates while the sensor was deployed in the field.

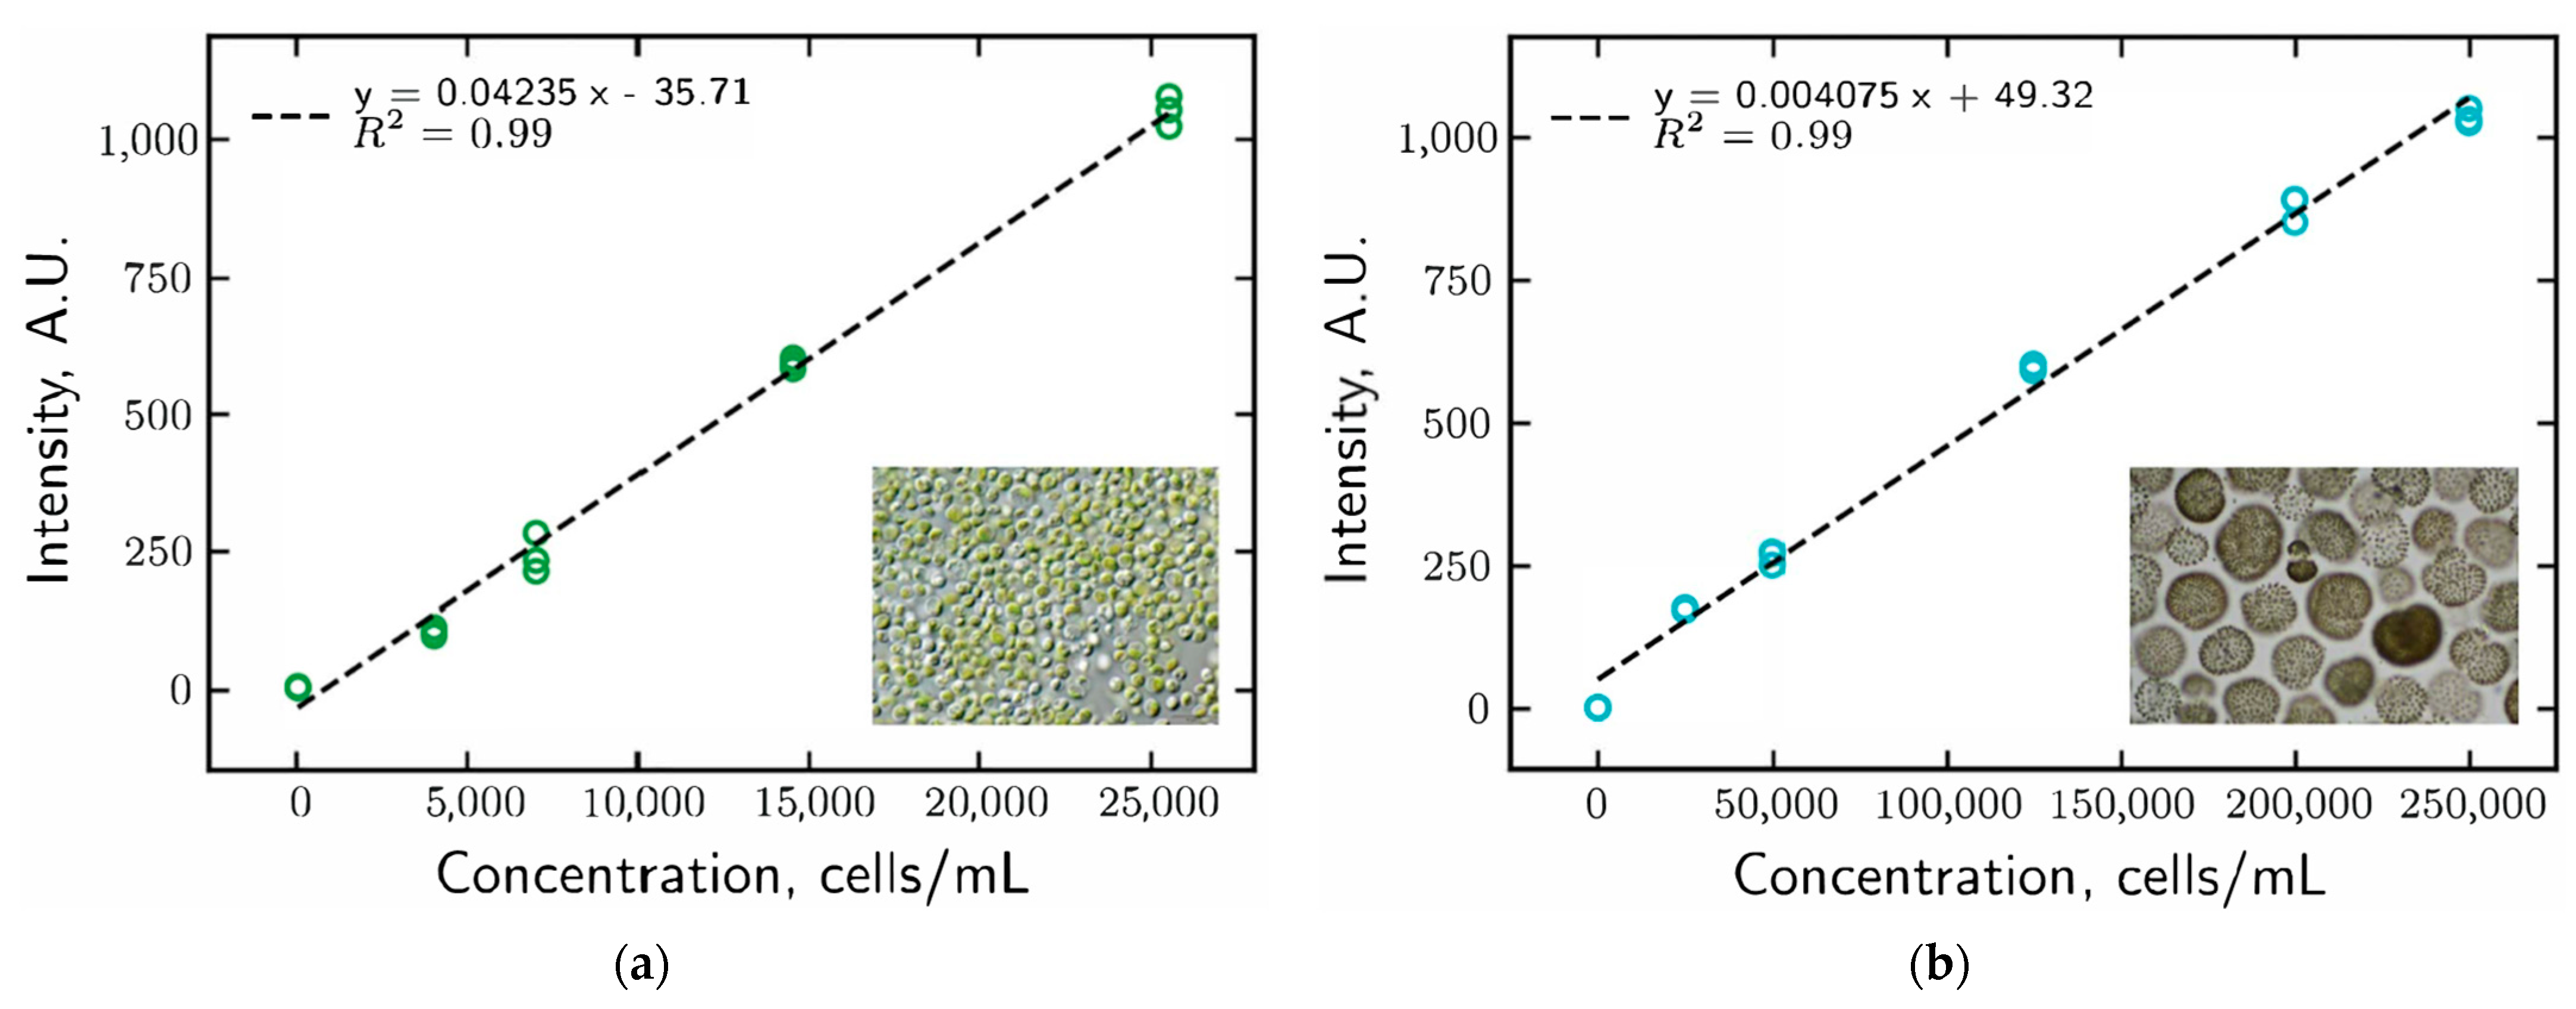
2.4. Instrument Calibrations

The fluorescence response of the LEDIF device was calibrated for two major algal classes prior to the field deployment. The calibrations were conducted according to the protocol described in Ng. et al. [24]. Algal cells of Chlorella sp. and Microcystis sp. were procured from Carolina Biological and stored in an incubator under an ambient temperature of 22 °C and light exposure of 3230 Lux. Cell concentrations were determined using a Guava Technologies easyCyte 12HT flow cytometer. The genera of algae and range of cell densities used in the calibrations were selected based on observations from previous algal surveys in Amsterdam (unpublished data, Waternet). Calibration samples were prepared using deionized water and subjected to magnetic stirring for around 20 min to prepare a uniform solution. For all measurements, an integration time of 10 s was used for the USB4000 spectrometer. The calibrations involving Chlorella sp. were excited with 405 nm light, and the resulting fluorescence signal was integrated from 640 nm to 690 nm, while those for the Microcystis sp. samples used excitation at 595 nm, and the resulting fluorescence signal was integrated from 640 nm to 690 nm. An external pump was used to continuously flow a sample through the flow cell of the LEDIF during a calibration measurement.

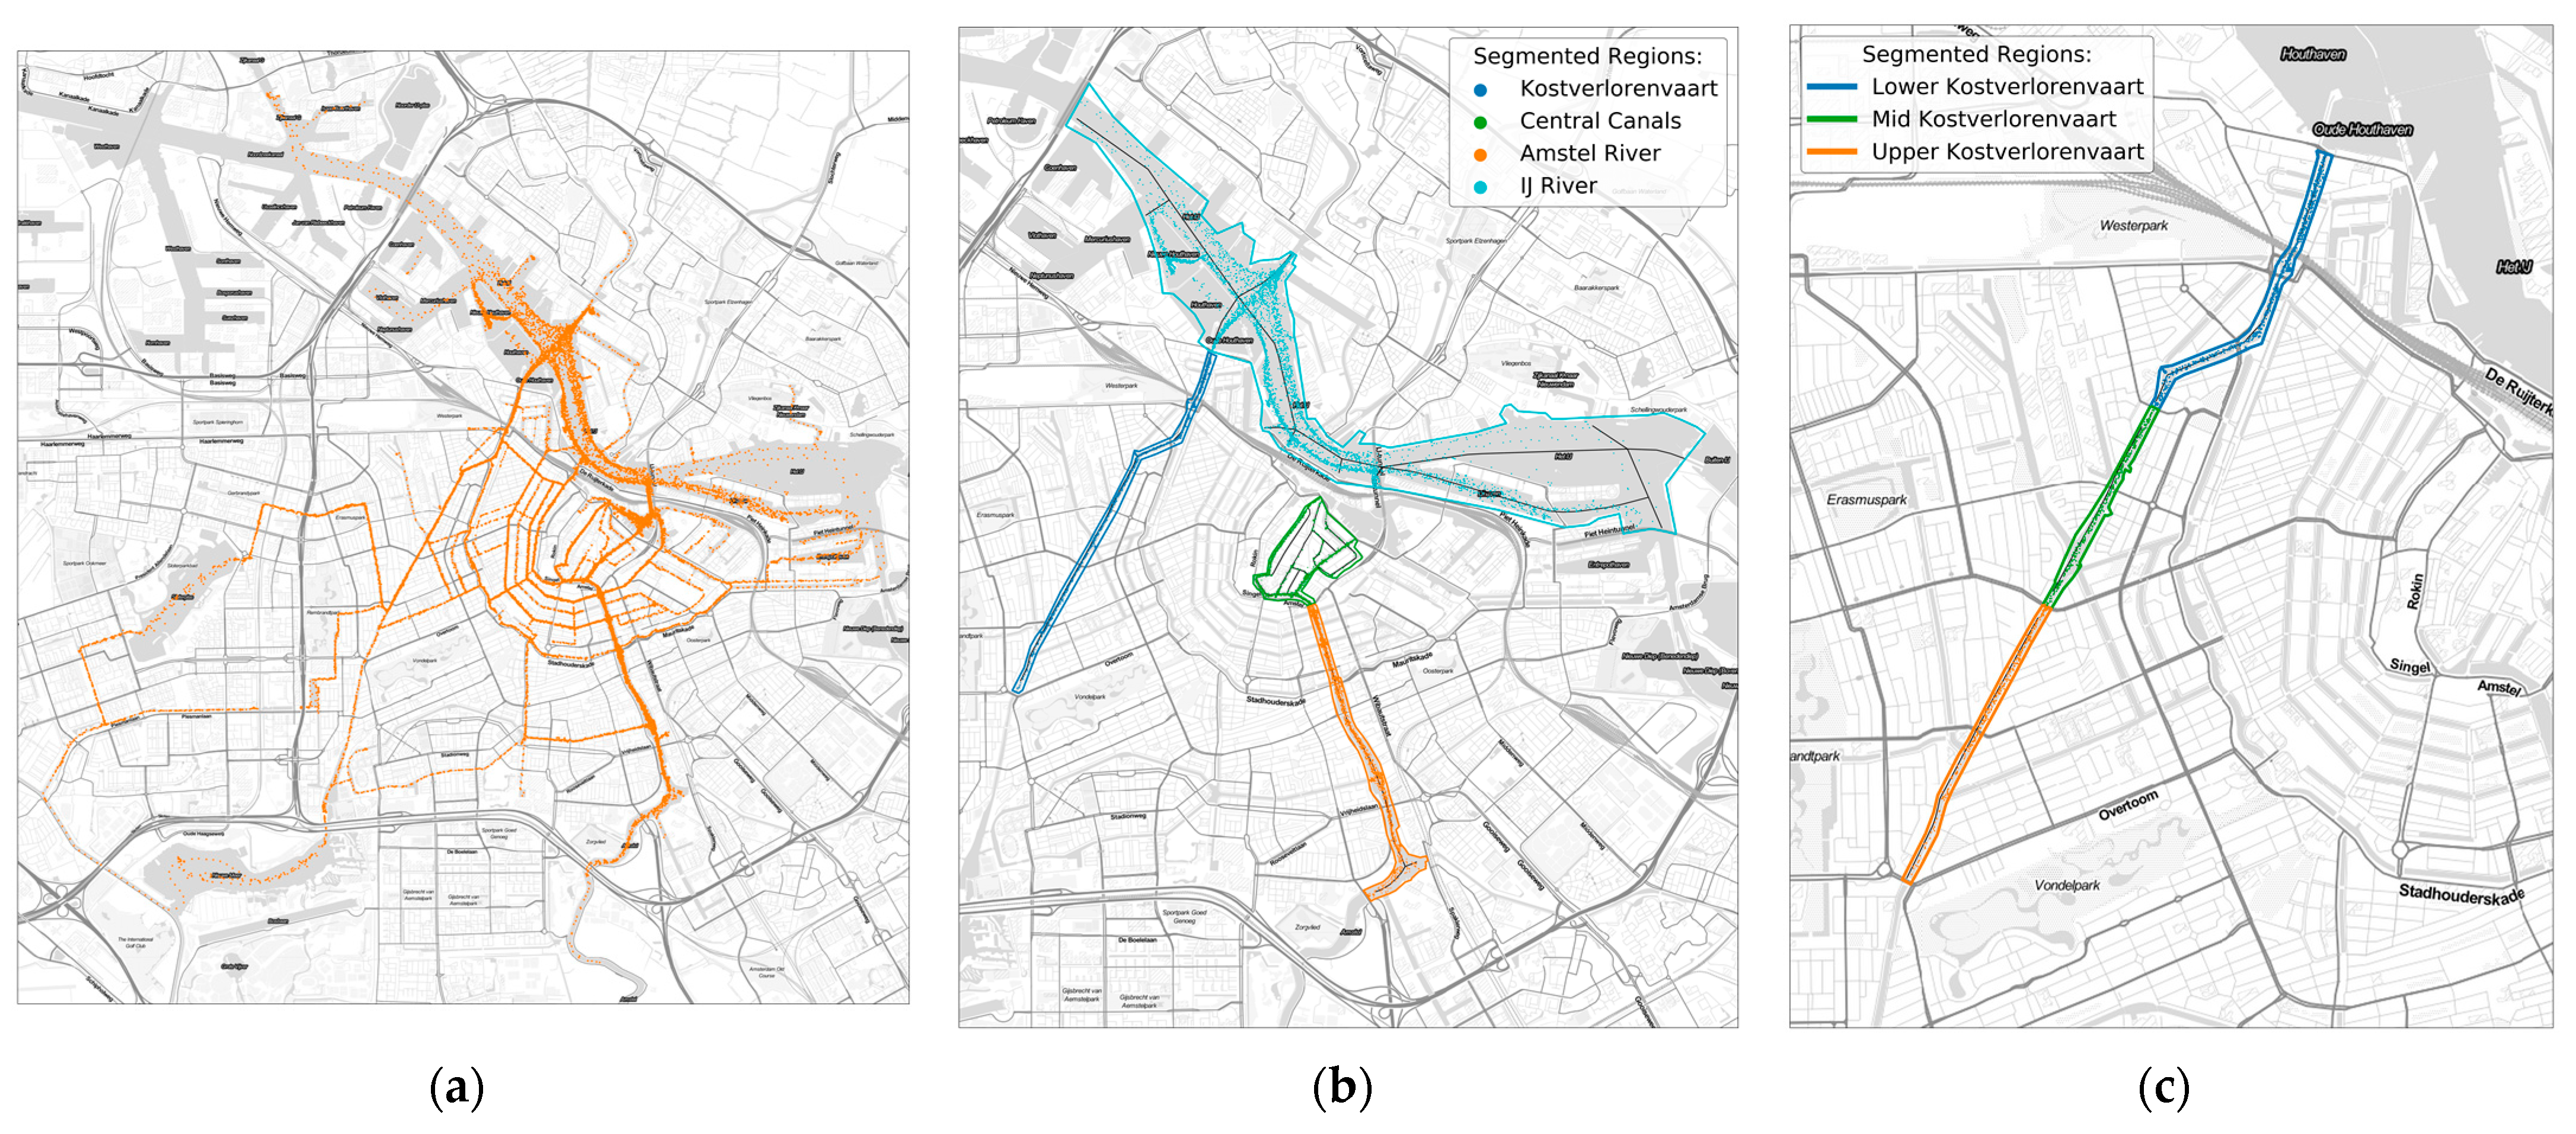
2.5. Spatial Segmentation

For an investigation into the spatial heterogeneity of the various measurement parameters, the study region was segmented into smaller subregions and canal segments based on knowledge of the local hydrological system and with regards to geographically relevant canal regions. For example, the Amstel was segmented into subregions, as it is known to have several significant hydrogeologic and transportation functions which affect the entirety of the canal network. Likewise, the Kostverlorenvaart is another relevant canal situated in Amsterdam-West and connects the Schinkel to the IJ. The boundaries of the segmentation were drawn using ArcGIS and spatial patterns were analyzed using custom software written in Python.

3. Results

3.1. Instrument Calibration

Figure 3 shows the results of the LEDIF calibrations. Both algal species exhibit a strong linear correlation with cell concentration. For Chlorella sp., the fluorescence response is an order of magnitude more sensitive to increases in cell concentration relative to Microcystis sp.

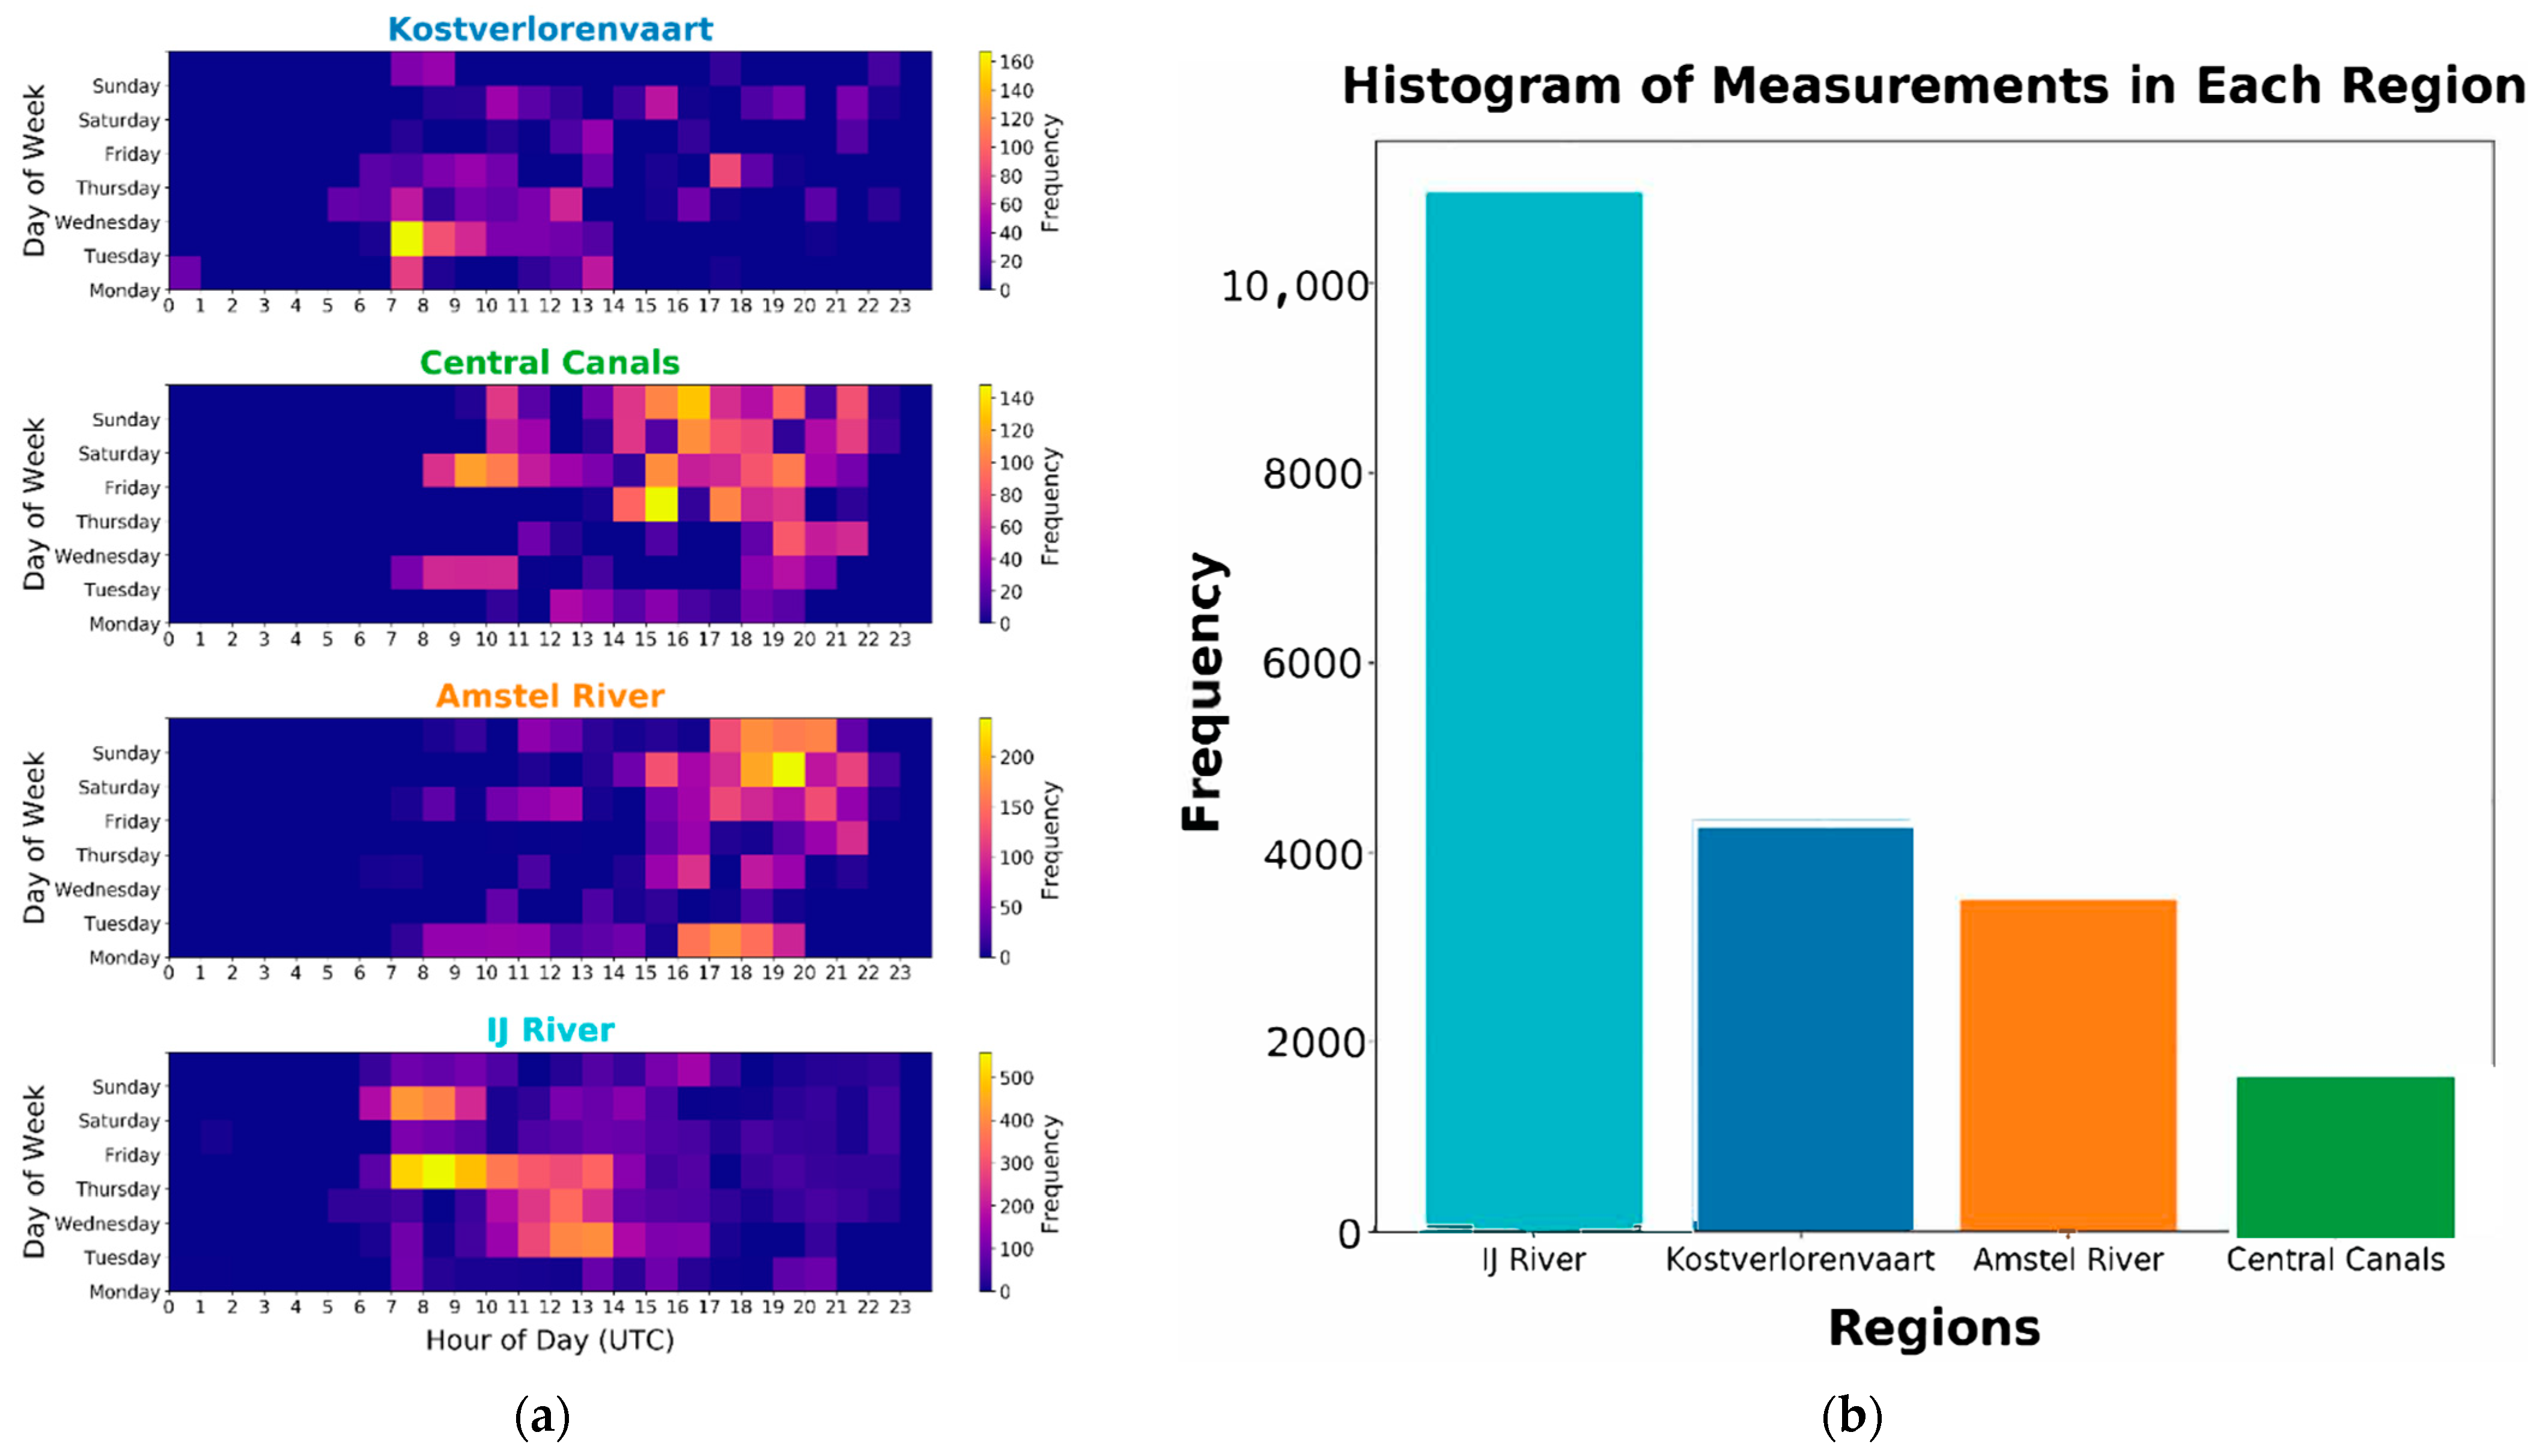
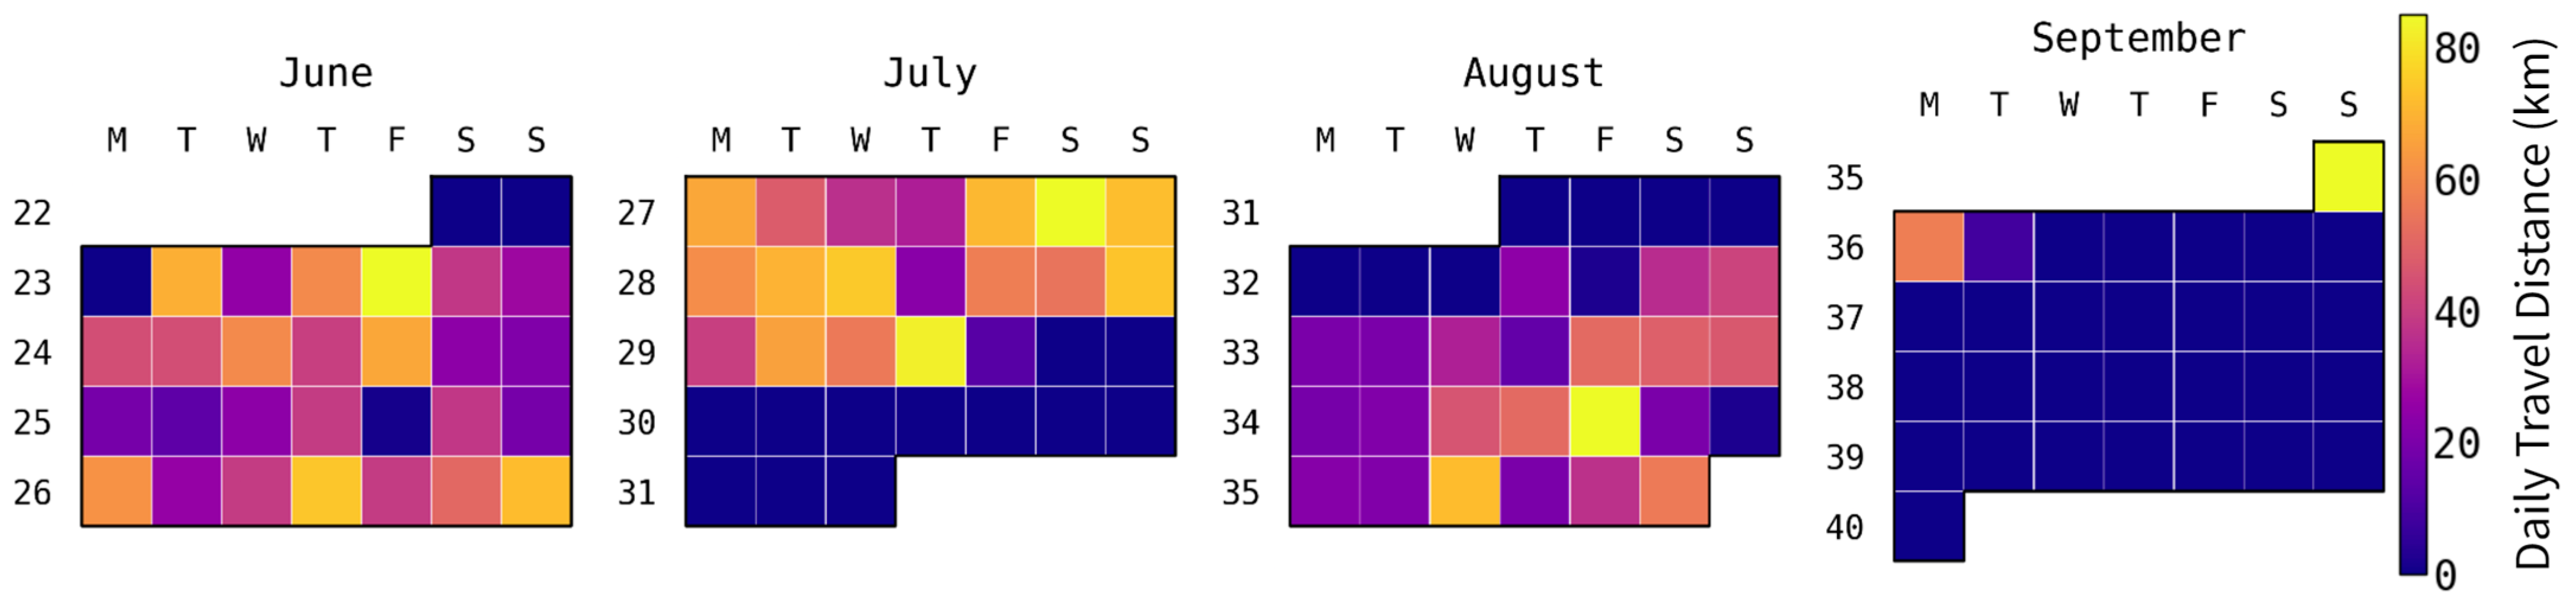
3.2. Spatiotemporal Sampling Coverage

Figure 4a summarizes the spatial coverage of the patrol vessel over the deployment period. The boat traversed nearly every canal in the Amsterdam canal network. The results of the spatial segmentation can be seen for the greater Amsterdam area as well as a sub-canal segmentation for the Kostverlorenvaart in Figure 4b,c, respectively. The vessel’s spatial visitation frequency for each major segmented region is represented in the histogram in Figure 5b. The most frequently sampled segment was the IJ (as the patrol vessel docked on the north side of the river), followed by the Kostverlorenvaart, Amstel River, and central canal network. The vessel’s temporal visitation pattern for each major segmented region is represented in the day of the week and time of day heatmap in Figure 5a. The vessel exhibited distinct temporal visitation patterns for each of the segmented regions. For example, the IJ river was visited most frequently early to mid-day during mid-week, while the central canals were visited most frequently in the late afternoon to evening during the weekends. Figure 6 displays a calendar heatmap of the distance traveled by the boat. It should be noted that there was a three-week period in July where the sensors were disconnected from the power system due to a water leak that affected the engine cooling system. This time period is witnessed by the record in Figure 6 showing zero distance travelled.

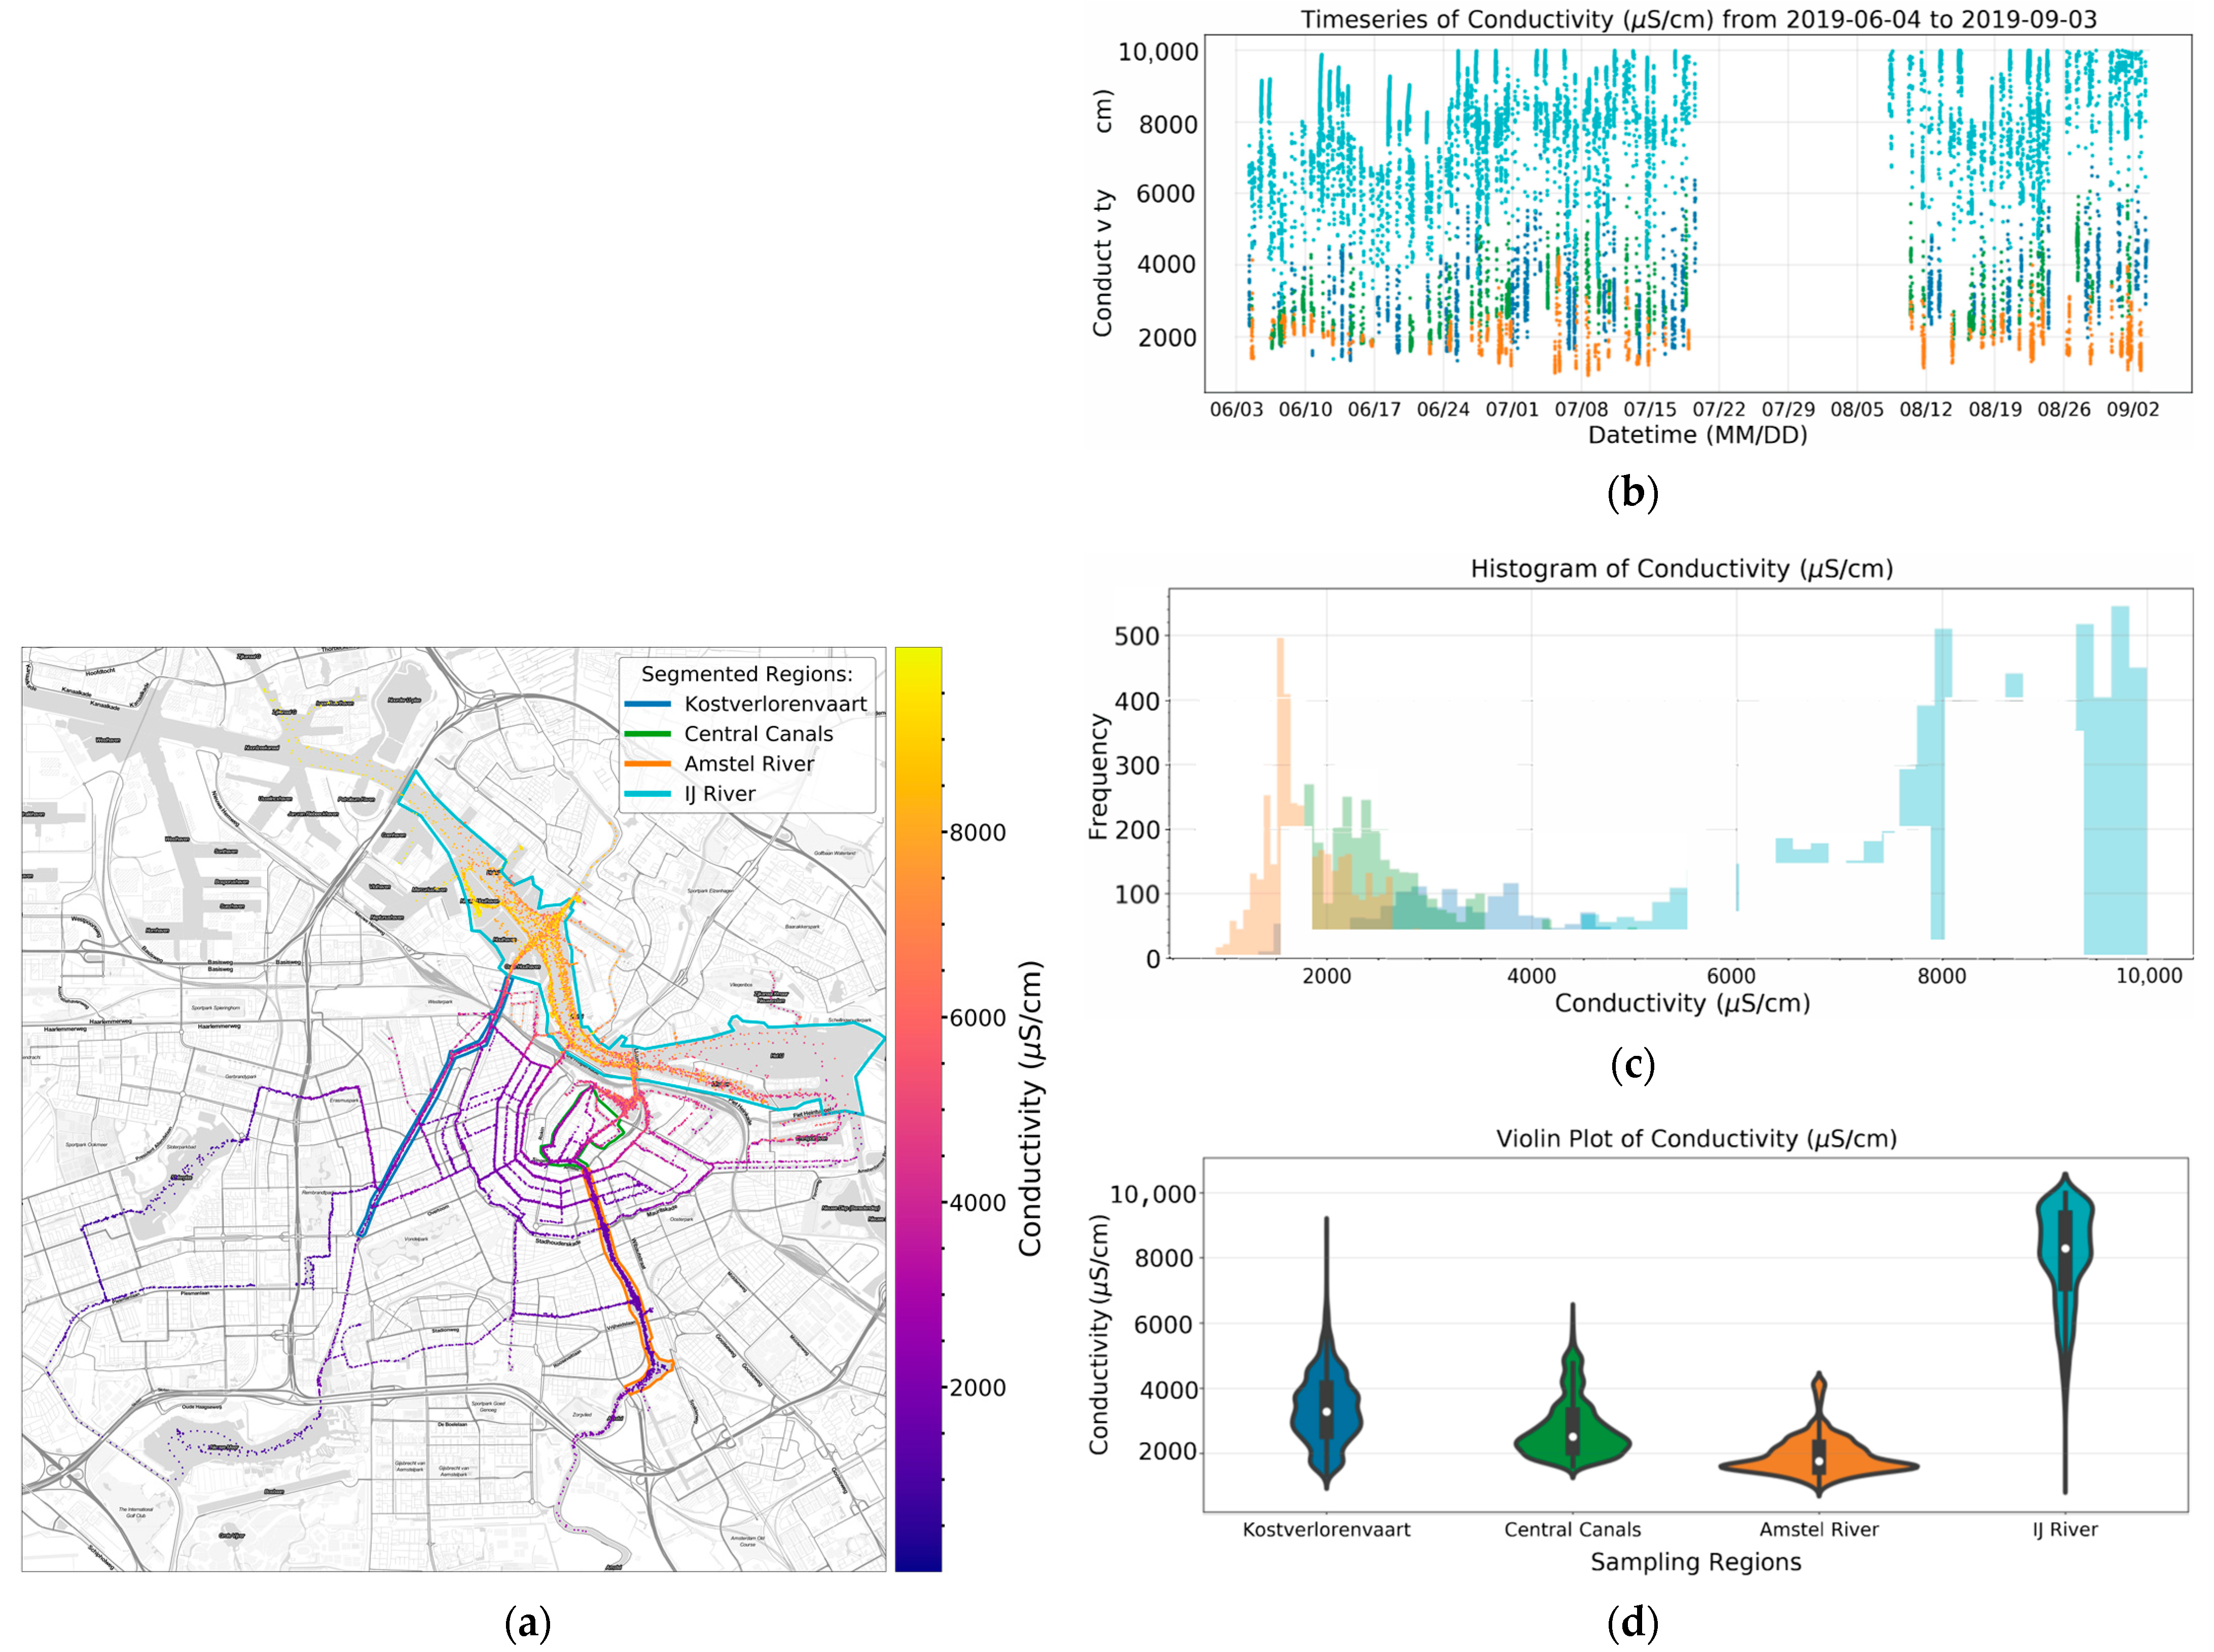
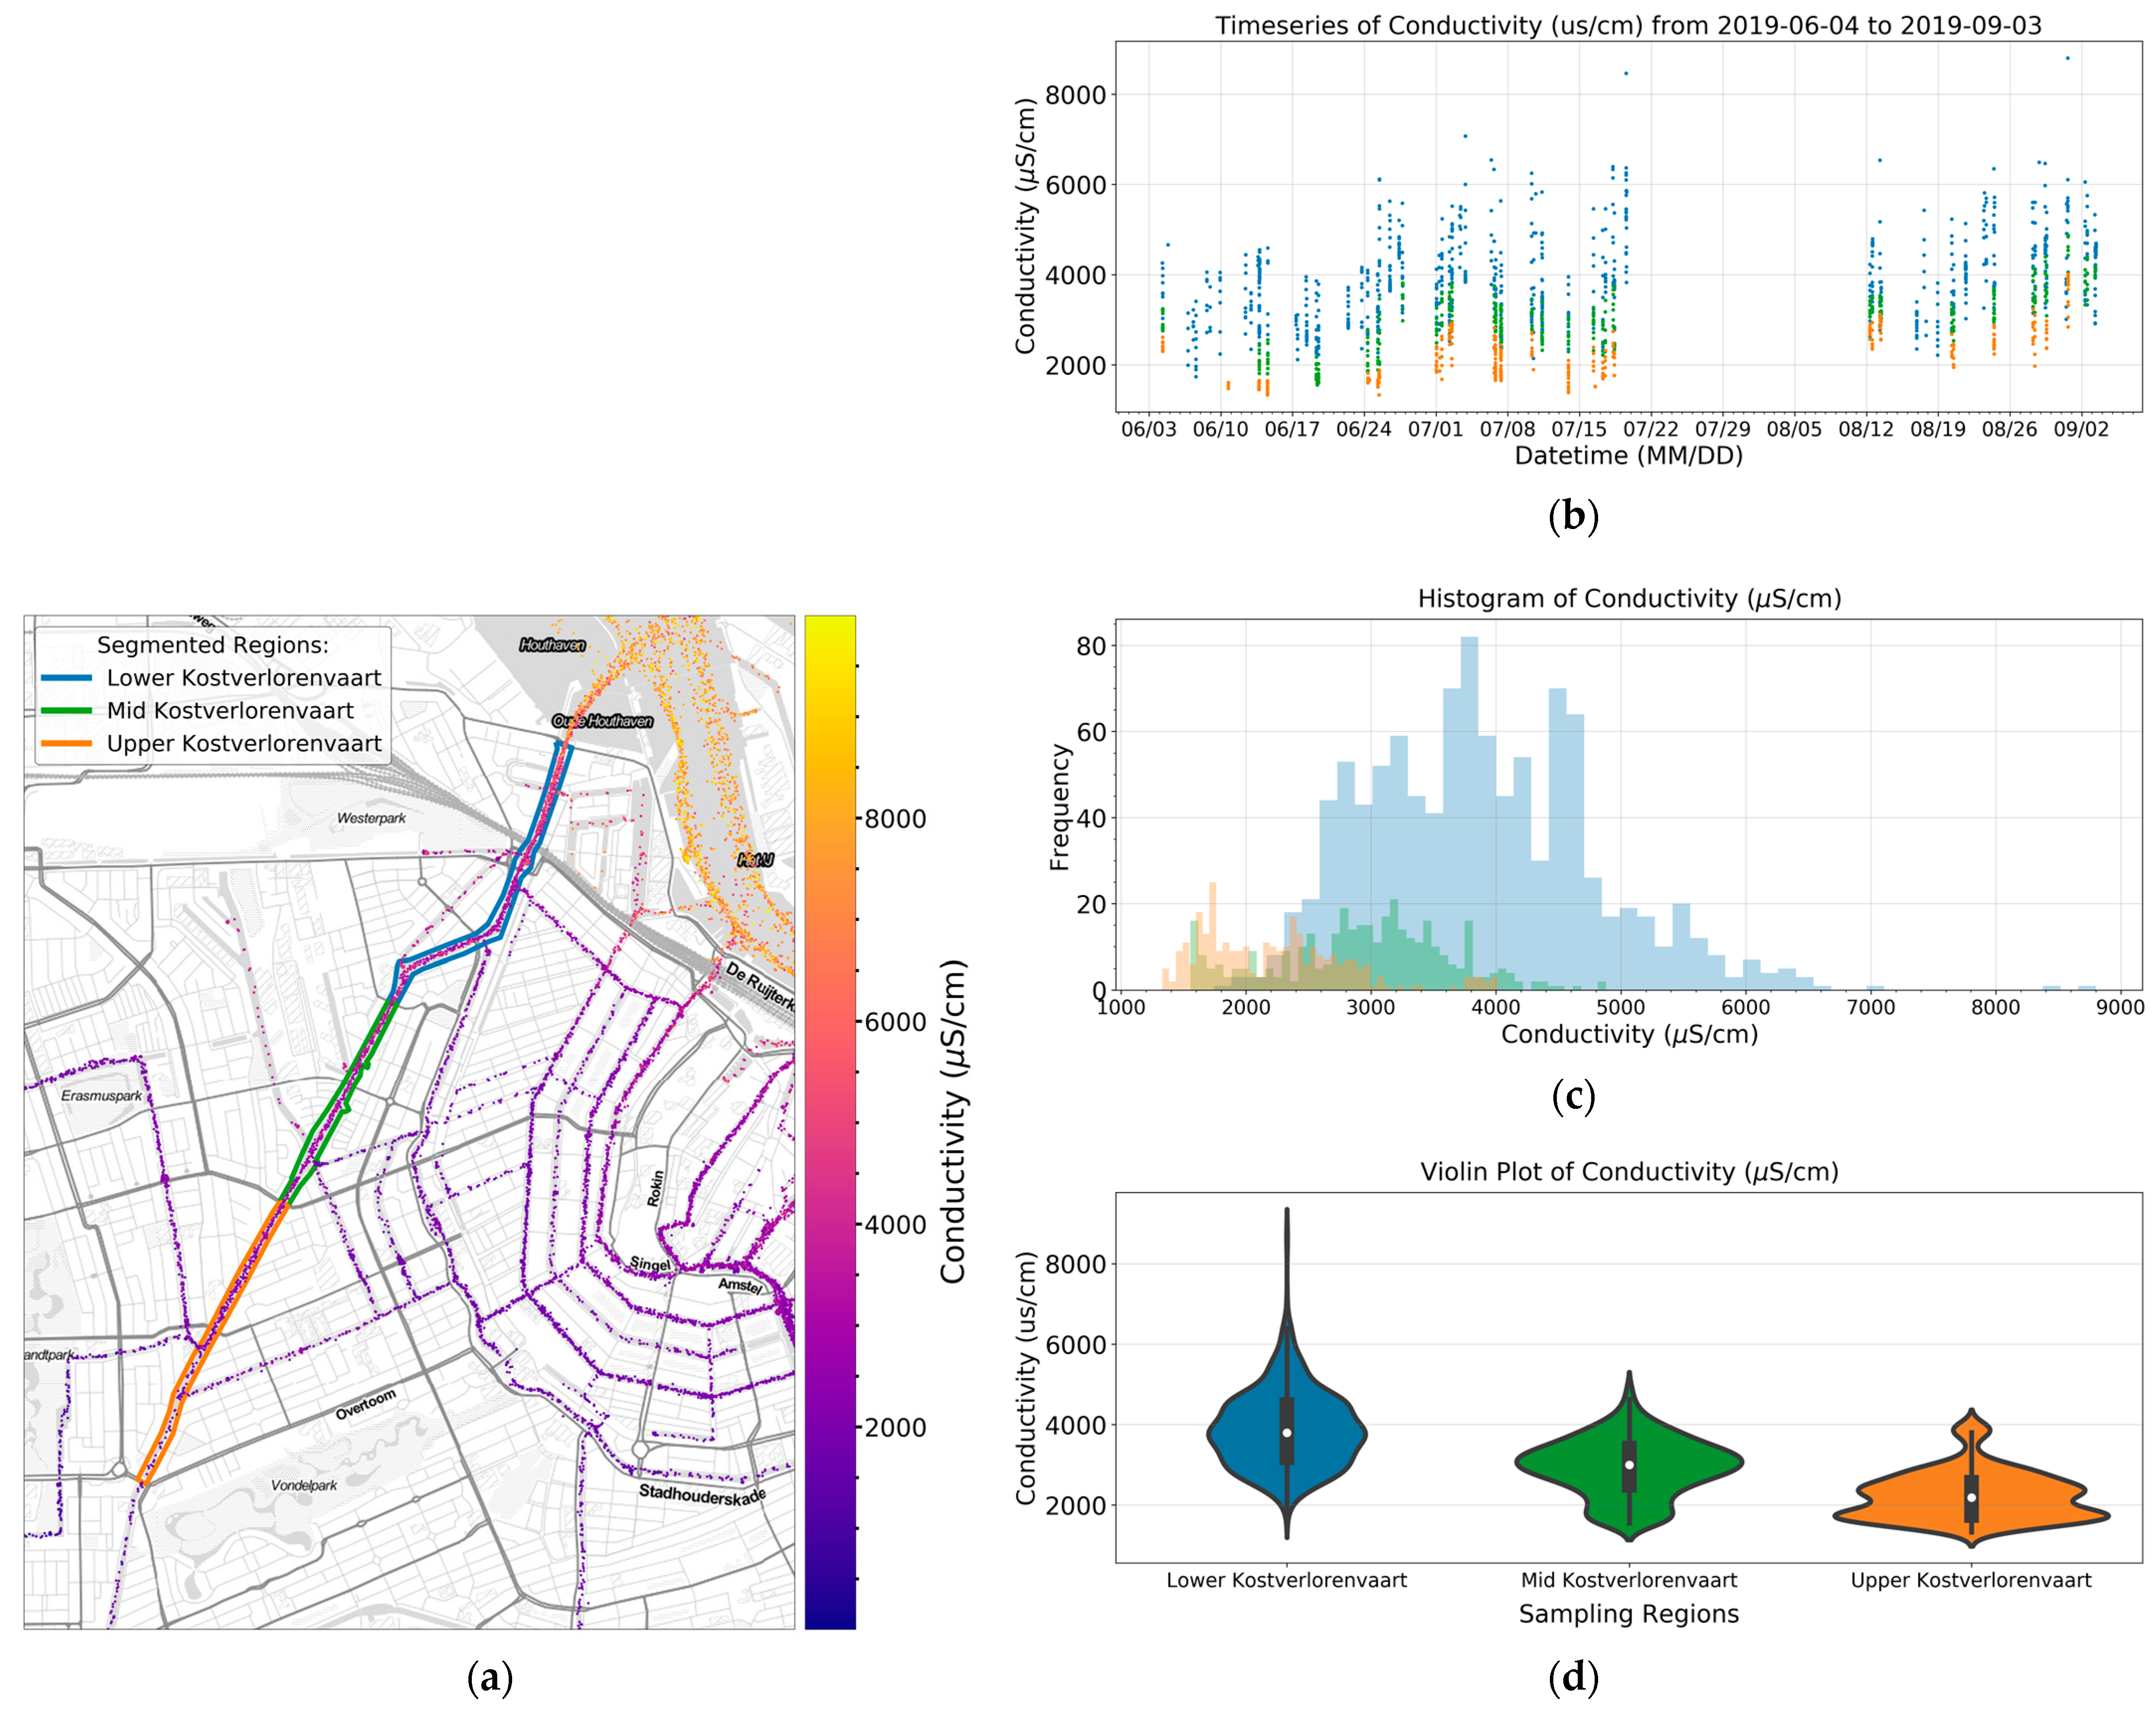
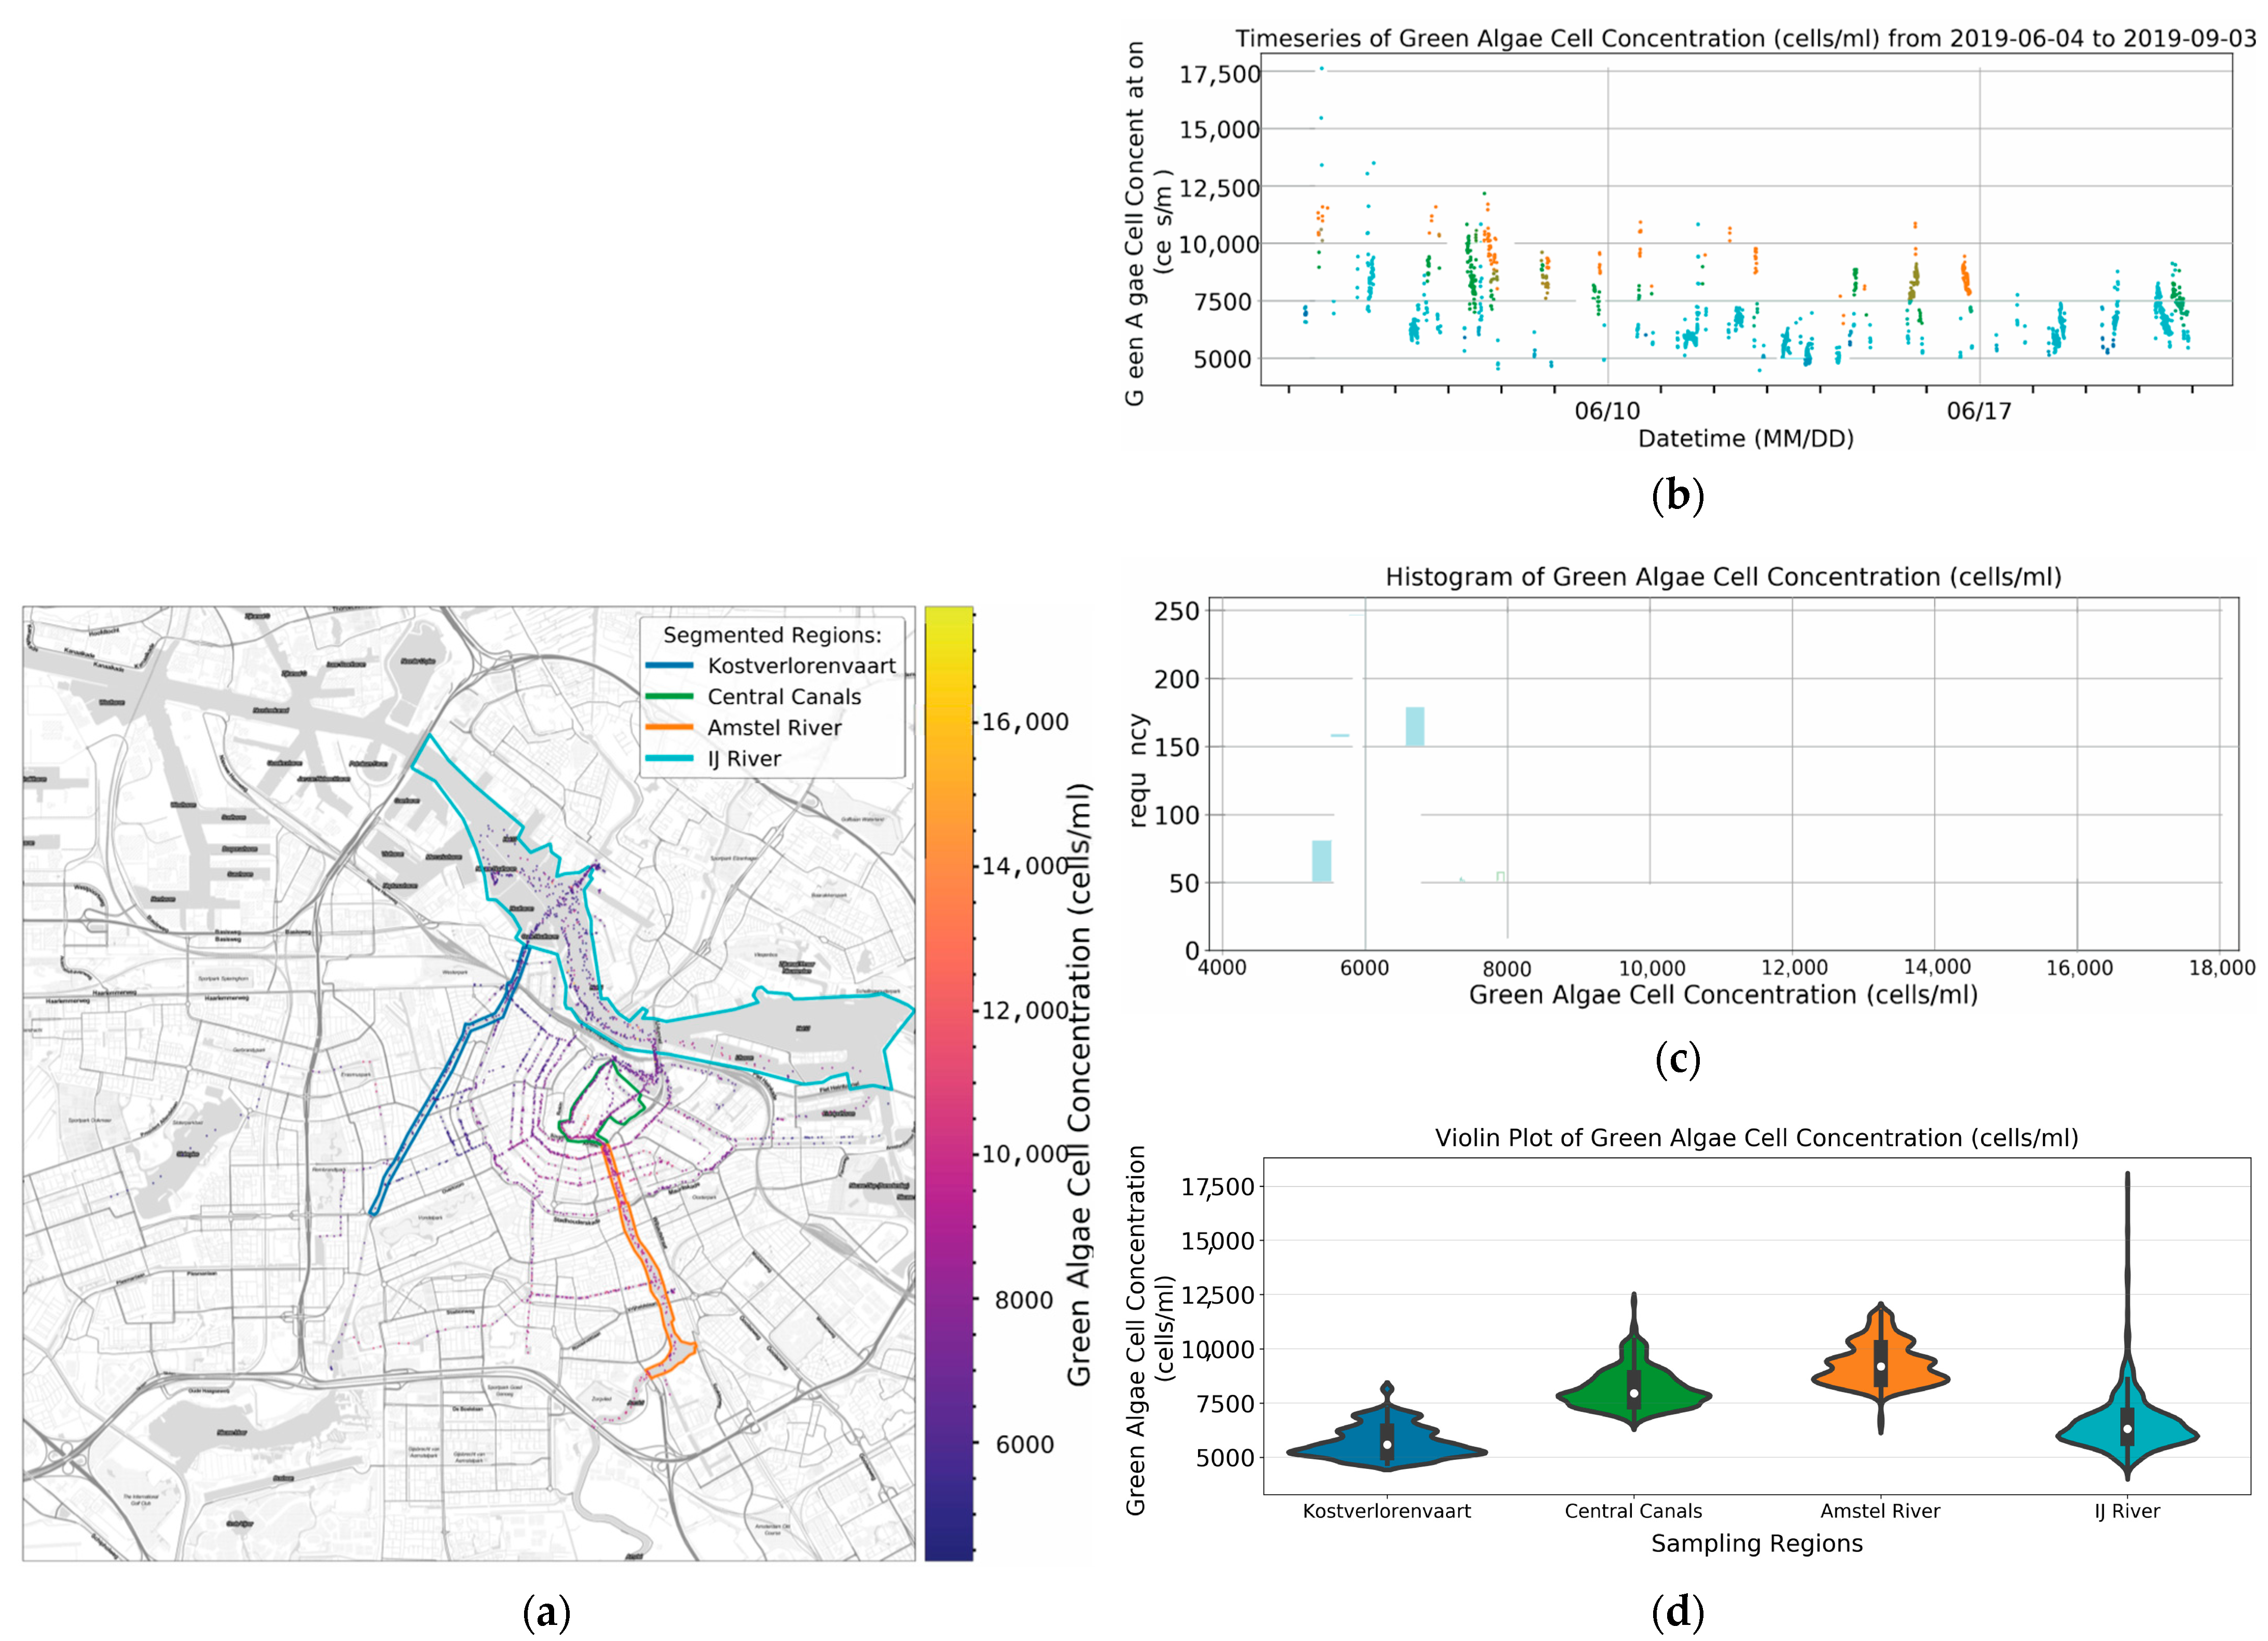
3.3. Spatial Patterns of Water Quality Parameters

Figure 7 summarizes the spatial variability in conductivity observed across the system of waterways. Freshwater conditions (conductivity: ~1000–1500 µS/cm) prevail upstream in the Amstel River and upper reaches of the Kostverlorenvaart (shown in more detail in Figure 8), while most of the canals would be classified as brackish (1500–10,000 µS/cm). The conductivity in the IJ river often exceeds the maximum range of the conductivity sensor (~10,000 µS/cm; Figure 7c). At the sub-canal scale, spatial differences in conductance are clearly seen across a ~4 km stretch of the Kostverlorenvaart canal (Figure 8).
Figure 9 summarizes the interpretation of green algae cell density from the LEDIF device, based on the pre-deployment lab calibrations (Figure 3a), over a three-week period. It should be noted that we did not detect fluorescence associated with blue-green algae (cf. Microcystis, Figure 3b) based on LED excitation at 595nm during this test period. The highest concentrations of green algae (8000–10,000 cells mL−1) occur upstream in the Amstel River and decline markedly at locations within the central canal system. Lower concentrations of green algae are found in the Kostverlorenvaart and the IJ river. While the data are broadly consistent with prior expectations (from the local water management team) of green algae distributions, the lower sampling frequency limits the reported spatial resolution, while biofouling of the LEDIF device limited the interpretation of temporal patterns in the data (time series Figure 9c).

3.4. Deployment Challenges

There are numerous challenges associated with the remote, long-term deployment of an autonomous sensing system. The research team had limited access to the utility vessel during the deployment. While the LEDIF device successfully transferred measurement data and operational logs in real time over the entire three-month deployment period, there was an extended idle period of three weeks caused by water leaking from the connection to the Aqua TROLL probe. The sensors were disconnected during this period to ensure no loss of water for the engine cooling system. A second more significant problem related to a progressive loss of fluorescence signals from the LEDIF device (after about three weeks of continuous operation). We have subsequently found that this was due to biofouling of the quartz optical windows inside the flow cell.
Remote deployment and limited access to the patrol vessel meant that these problems could not be addressed effectively. Interventions to clean the flow cell were only possible after a six-week delay and were unable to restore the LEDIF device.

4. Discussion and Conclusions

In this study, we have demonstrated that by using only a single pre-existing municipal utility boat, we are able to achieve enough sampling coverage to observe spatiotemporal heterogeneity of multiple water quality parameters including algae within Amsterdam’s canal network. However, there are some limitations of this study that restrict the scope of interpretation and the conclusions that can be drawn. While some of the encountered limitations are inherent to the deployment technique of opportunistic mobile sensing, others relate to the selected measurement techniques and core technology of the deployed LEDIF sensor suite. Even with these noted limitations, however, the knowledge generated from this initial proof-of-concept deployment demonstrates that opportunistic mobile sensing is a feasible and effective deployment technique for environmental sensors. Future work is underway to build upon this study and overcome some of the discussed limitations.
Interpretation of the achieved spatiotemporal sampling coverage requires consideration of the uniqueness of the temporal coverage for each segmented city region. If large temporal heterogeneities exist in the measured parameters, the different regions may be incommensurable when analyzing spatial heterogeneities. It was shown that the vessel visits each city region with unique temporal patterns both in terms of the time of day and the day of the week (Figure 5). For certain analyses, it would likely be beneficial to only compare data between spatial regions for measurements taken on the same day or at the same time of day. This is a limitation partially inherent in having only a single measurement vessel; the boat can only be at one place at one time. By utilizing multiple deployment vessels, temporal overlap between regions will be more likely, leading to a more relevant and sound comparison.
For conductivity, there are consistent temporal trends within each segmented city region and no discernible changes between these segments (cf. Figure 7 and Figure 8). This enabled the parameter to be used as a valid test case for investigating the ability to observe spatial heterogeneity between city regions. The observed pattern of increasing conductivity from south (toward the Rhine) to north (toward the North Sea) as well as the observed range of conductivity, both agreed with historical hydrogeological studies of the area. The case of conductivity demonstrates that the selected deployment vessel achieves a sufficiently high spatiotemporal resolution to uncover spatiotemporal heterogeneities of water quality parameters. However, for certain parameters, smaller heterogeneities may exist, requiring more frequent monitoring to fully elucidate differences across space and time. There is potential for a logistical optimization to determine the least amount of measurement vessels and/or measurement frequency to effectively monitor patterns of the relevant water quality parameters.
While this study sheds light on the spatial distribution of green algae in the Amsterdam canals, much remains to be investigated in order to fully characterize the dynamics of the algal community. Limitations exist for the interpretation of the observed green algal cell densities as measured by the LEDIF instrument. Firstly, the cell densities are reported in equivalent cells of Chlorella sp. It is known that the surface waters of Amsterdam contain a diverse community of green algae genera. However, it is not known if the linear relationship between fluorescence and cell density is comparable for the green algal assemblage in the measured surface water. Furthermore, while chlorophyll is less prevalent in other algal classes, such as diatoms or cyanobacteria, it is possible that a portion of the measured fluorescence can be attributed to them. Finally, there is likely extracellular chlorophyll in the surface water whose contribution to the fluorescence signal is unknown. Despite these limitations, there is evidence of observed spatial patterns corresponding with fluorescence from chlorophyll-containing green algae. Further analysis is required to further uncover the spatial and temporal patterns of other major algal classes and relate them to the physical and chemical system behavior. Future studies would benefit by combining high-frequency mobile fluorescence measurements with periodic multimodal ground-truth measurements of algae, such as cell identification and enumeration via flow cytometry, and HPLC analysis of both intra- and extracellular photosynthetic pigments. Calibrations involving a wider variety of algal genera, as well as calibration with algal mixtures, would further strengthen the utility of mobile fluorescence measurements.
This initial proof-of-concept deployment generated significant knowledge about the challenges associated with opportunistic mobile sensing field campaigns. Working with and coordinating across municipal utilities comes with its challenges, especially when it requires them to operate outside of the normal scope of their day-to-day duties. Relationships must be fostered, and communication must be clear and concise. This is especially true when working across language barriers. This non-technical challenge should not be understated when considering municipal vehicles for opportunistic mobile sensing deployments.
The measurement techniques and instruments of our deployed sensor suite were chosen in part to meet the requirement of being minimally invasive to the vessel’s normal operations. While multiple measurement techniques exist that would provide much more insight into the water chemistry and algal dynamics, such as HPLC or flow cytometry, these instruments remain expensive, large, and difficult to operate unattended for months at a time. Finally, real-time network connectivity proved extremely useful for the monitoring of sensor health during the ongoing deployment. Future studies involved in deploying sensors in remote or unserviceable regions should consider integrating an IoT data architecture for the transmission of sensor data and operational metadata. Due to the significant amount of engineering involved in developing such a data architecture, it should not be considered as an afterthought or an add-on to a sensor, rather it should be considered as a requirement early in the design phase.
Work is currently underway to improve and build on the techniques and lessons learned in this study. Future deployments plan to leverage autonomous boats as deployment vessels, which can be deployed in both opportunistic and dedicated sensing modes. Such autonomous boats are already being developed for the canals of Amsterdam to serve a variety of purposes [43]. Chang et al. have recently demonstrated a prototype of a multi-functional miniature autonomous vessel that can collect a water sample (when triggered by anomalous pH measured online) and can detect and collect floating garbage [44]. By deploying water quality sensors on multiple vessels, future studies can hope to achieve even greater spatiotemporal sampling coverage than presented here. Significant engineering effort has already gone into developing the next generation of the LEDIF instrument. The main improvement includes the use of a broadband UV-VIS light source in conjunction with a monochromator, which will enable the collection of high-resolution fluorescence excitation–emission matrices (EEMs). Such an instrument will enable a deeper investigation of complex mixtures of multiple algal classes.
The next-generation LEDIF instrument has been designed to be more resistant and resilient to biofouling through material selection and design choices that make it more easily serviceable. Finally, effort is being dedicated for the design to follow best practices for flow-through sample handling systems [45]. For example, the future sensor suite will have the ability to take a periodic blank measurement and be able to hold a water sample during the collection of a full EEM.
The data from future field deployments will be integrated into the development and evaluation of Waternet’s predictive water quality models. Ultimately, when mobile monitoring is combined with stationary and offline monitoring using higher-fidelity analytical techniques, as well as predictive models, a more comprehensive understanding of the water system will emerge.

Author Contributions

Conceptualization, A.J.W. and C.R.; methodology, A.J.W. and H.F.H.; software, D.M.; validation, D.M.; formal analysis, D.M. and Q.Z.; investigation, D.M., Q.Z. and M.v.d.B.; resources, D.M.; data curation, D.M.; visualization, D.M.; writing, D.M., A.W.C.v.d.H. and A.J.W.; supervision, A.J.W., H.F.H., F.D., A.W.C.v.d.H. and C.R.; project administration, A.J.W. and C.R.; funding acquisition, A.J.W., A.W.C.v.d.H. and C.R. All authors have read and agreed to the published version of the manuscript.

Funding

This research was funded by the Amsterdam Institute for Advanced Metropolitan Solutions through the MIT Senseable City Lab’s Roboat Project.

Data Availability Statement

Data available upon request.

Acknowledgments

The authors would like to express their gratitude to Waternet for their collaboration on this research and specifically for the assistance provided by Maarten Ouboter.

Conflicts of Interest

The authors declare no conflict of interest.

References

  1. White, M.; Smith, A.; Humphryes, K.; Pahl, S.; Snelling, D.; Depledge, M. Blue Space: The Importance of Water for Preference, Affect, and Restorativeness Ratings of Natural and Built Scenes. J. Environ. Psychol. 2010, 30, 482–493. [Google Scholar] [CrossRef]
  2. Schets, F.M.; van Wijnen, J.H.; Schijven, J.F.; Schoon, H.; Husman, A.M.d.R. Monitoring of Waterborne Pathogens in Surface Waters in Amsterdam, The Netherlands, and the Potential Health Risk Associated with Exposure to Cryptosporidium and Giardia in These Waters. Appl. Environ. Microbiol. 2008, 74, 2069–2078. [Google Scholar] [CrossRef] [PubMed]
  3. Sales-Ortells, H.; Medema, G. Screening-Level Microbial Risk Assessment of Urban Water Locations: A Tool for Prioritization. Environ. Sci. Technol. 2014, 48, 9780–9789. [Google Scholar] [CrossRef] [PubMed]
  4. Sales-Ortells, H.; Agostini, G.; Medema, G. Quantification of Waterborne Pathogens and Associated Health Risks in Urban Water. Environ. Sci. Technol. 2015, 49, 6943–6952. [Google Scholar] [CrossRef]
  5. World Health Organization. Guidelines for Safe Recreational Water Environments; Volume 1, Coastal and Fresh Waters; World Health Organization: Switzerland, Geneva, 2003. [Google Scholar]
  6. Hisbergues, M.; Christiansen, G.; Rouhiainen, L.; Sivonen, K.; Börner, T. PCR-Based Identification of Microcystin-Producing Genotypes of Different Cyanobacterial Genera. Arch. Microbiol. 2003, 180, 402–410. [Google Scholar] [CrossRef]
  7. US Environmental Protection Agency 2012 Recreational Water Quality Criteria Documents; Environmental Protection Agency: Washington, DC, USA, 2012.
  8. Directive 2006/7/EC of the European Parliament and of the Council of 15 February 2006 Concerning the Management of Bathing Water Quality and Repealing Directive 76/160/EEC. 2006. Available online: https://eur-lex.europa.eu/LexUriServ/LexUriServ.do?uri=OJ:L:2006:064:0037:0051:EN:PDF (accessed on 2 August 2022).
  9. Peters, S.; Ouboter, M.; Lugt, K.v.d.; Koop, S.; Leeuwen, K.v. Retrospective Analysis of Water Management in Amsterdam, The Netherlands. Water 2021, 13, 1099. [Google Scholar] [CrossRef]
  10. Hintaran, A.D.; Kliffen, S.J.; Lodder, W.; Pijnacker, R.; Brandwagt, D.; van der Bij, A.K.; Siedenburg, E.; Sonder, G.J.B.; Fanoy, E.B.; Joosten, R.E. Infection Risks of City Canal Swimming Events in the Netherlands in 2016. PLoS ONE 2018, 13, e0200616. [Google Scholar] [CrossRef]
  11. Korving, H.; Leloup, M.-J.; Ouboter, M.; Schep, S. Combined Ship-Based and Stationary Monitoring of the Amsterdam Canals. In Proceedings of the International Conference on Hydroinformatics, Hamburg, Germany, 14–18 July 2012. [Google Scholar]
  12. Lee, J.H.; Bang, K.W. Characterization of Urban Stormwater Runoff. Water Res. 2000, 34, 1773–1780. [Google Scholar] [CrossRef]
  13. Yang, Y.-Y.; Toor, G.S. Stormwater Runoff Driven Phosphorus Transport in an Urban Residential Catchment: Implications for Protecting Water Quality in Urban Watersheds. Sci. Rep. 2018, 8, 11681. [Google Scholar] [CrossRef]
  14. Ho, J.C.; Michalak, A.M.; Pahlevan, N. Widespread Global Increase in Intense Lake Phytoplankton Blooms since the 1980s. Nature 2019, 574, 667–670. [Google Scholar] [CrossRef]
  15. Gobler, C.J.; Doherty, O.M.; Hattenrath-Lehmann, T.K.; Griffith, A.W.; Kang, Y.; Litaker, R.W. Ocean Warming since 1982 Has Expanded the Niche of Toxic Algal Blooms in the North Atlantic and North Pacific Oceans. Proc. Natl. Acad. Sci. USA 2017, 114, 4975–4980. [Google Scholar] [CrossRef] [PubMed]
  16. Rozemeijer, J.; Klein, J.; Hendriks, D.; Borren, W.; Ouboter, M.; Rip, W. Groundwater-Surface Water Relations in Regulated Lowland Catchments; Hydrological and Hydrochemical Effects of a Major Change in Surface Water Level Management. Sci. Total Environ. 2019, 660, 1317–1326. [Google Scholar] [CrossRef] [PubMed]
  17. Yu, L.; Rozemeijer, J.; van Breukelen, B.M.; Ouboter, M.; van der Vlugt, C.; Broers, H.P. Groundwater Impacts on Surface Water Quality and Nutrient Loads in Lowland Polder Catchments: Monitoring the Greater Amsterdam Area. Hydrol. Earth Syst. Sci. 2018, 22, 487–508. [Google Scholar] [CrossRef]
  18. Yu, L.; Rozemeijer, J.C.; Broers, H.P.; van Breukelen, B.M.; Middelburg, J.J.; Ouboter, M.; van der Velde, Y. Drivers of Nitrogen and Phosphorus Dynamics in a Groundwater-Fed Urban Catchment Revealed by High-Frequency Monitoring. Hydrol. Earth Syst. Sci. 2021, 25, 69–87. [Google Scholar] [CrossRef]
  19. McCormick, P.V.; Cairns, J. Algae as Indicators of Environmental Change. J. Appl. Phycol. 1994, 6, 509–526. [Google Scholar] [CrossRef]
  20. Sieracki, C.K.; Sieracki, M.E.; Yentsch, C.S. An Imaging-in-Flow System for Automated Analysis of Marine Microplankton. Mar. Ecol. Prog. Ser. 1998, 168, 285–296. [Google Scholar] [CrossRef]
  21. Olson, R.J.; Sosik, H.M. A Submersible Imaging-in-Flow Instrument to Analyze Nano-and Microplankton: Imaging FlowCytobot. Limnol. Oceanogr. Methods 2007, 5, 195–203. [Google Scholar] [CrossRef]
  22. Göröcs, Z.; Tamamitsu, M.; Bianco, V.; Wolf, P.; Roy, S.; Shindo, K.; Yanny, K.; Wu, Y.; Koydemir, H.C.; Rivenson, Y.; et al. A Deep Learning-Enabled Portable Imaging Flow Cytometer for Cost-Effective, High-Throughput, and Label-Free Analysis of Natural Water Samples. Light Sci. Appl. 2018, 7, 66. [Google Scholar] [CrossRef]
  23. Beutler, M.; Wiltshire, K.H.; Meyer, B.; Moldaenke, C.; Lüring, C.; Meyerhöfer, M.; Hansen, U.P.; Dau, H. A Fluorometric Method for the Differentiation of Algal Populations In Vivo and In Situ. Photosynth. Res. 2002, 72, 39–53. [Google Scholar] [CrossRef]
  24. Ng, C.L.; Chen, Q.Q.; Chua, J.J.; Hemond, H.F. A Multi-Platform Optical Sensor for In Vivo and In Vitro Algae Classification. Sensors 2017, 17, 912. [Google Scholar] [CrossRef] [Green Version]
  25. Zieger, S.E.; Mistlberger, G.; Troi, L.; Lang, A.; Confalonieri, F.; Klimant, I. Compact and Low-Cost Fluorescence Based Flow-through Analyzer for Early-Stage Classification of Potentially Toxic Algae and in Situ Semiquantification. Environ. Sci. Technol. 2018, 52, 7399–7408. [Google Scholar] [CrossRef] [PubMed]
  26. Catherine, A.; Escoffier, N.; Belhocine, A.; Nasri, A.B.; Hamlaoui, S.; Yéprémian, C.; Bernard, C.; Troussellier, M. On the Use of the FluoroProbe®, a Phytoplankton Quantification Method Based on Fluorescence Excitation Spectra for Large-Scale Surveys of Lakes and Reservoirs. Water Res. 2012, 46, 1771–1784. [Google Scholar] [CrossRef] [PubMed]
  27. Zieger, S.E.; Seoane, S.; Laza-Martínez, A.; Knaus, A.; Mistlberger, G.; Klimant, I. Spectral Characterization of Eight Marine Phytoplankton Phyla and Assessing a Pigment-Based Taxonomic Discriminant Analysis for the in Situ Classification of Phytoplankton Blooms. Environ. Sci. Technol. 2018, 52, 14266–14274. [Google Scholar] [CrossRef] [PubMed]
  28. Richardson, T.L.; Lawrenz, E.; Pinckney, J.L.; Guajardo, R.C.; Walker, E.A.; Paerl, H.W.; MacIntyre, H.L. Spectral Fluorometric Characterization of Phytoplankton Community Composition Using the Algae Online Analyser®. Water Res. 2010, 44, 2461–2472. [Google Scholar] [CrossRef] [PubMed]
  29. Macintyre, H.L.; Lawrenz, E.; Richardson, T.L. Taxonomic Discrimination of Phytoplankton by Spectral Fluorescence. In Chlorophyll a Fluorescence in Aquatic Sciences: Methods and Applications; Springer: Dordrecht, The Netherlands, 2010; ISBN 978-90-481-9268-7. [Google Scholar]
  30. O’Keeffe, K.P.; Anjomshoaa, A.; Strogatz, S.H.; Santi, P.; Ratti, C. Quantifying the Sensing Power of Vehicle Fleets. Proc. Natl. Acad. Sci. USA 2019, 116, 12752–12757. [Google Scholar] [CrossRef]
  31. Apte, J.S.; Messier, K.P.; Gani, S.; Brauer, M.; Kirchstetter, T.W.; Lunden, M.M.; Marshall, J.D.; Portier, C.J.; Vermeulen, R.C.H.; Hamburg, S.P. High-Resolution Air Pollution Mapping with Google Street View Cars: Exploiting Big Data. Environ. Sci. Technol. 2017, 51, 6999–7008. [Google Scholar] [CrossRef]
  32. Jaffe, J.S.; Franks, P.J.S.; Roberts, P.L.D.; Mirza, D.; Schurgers, C.; Kastner, R.; Boch, A. A Swarm of Autonomous Miniature Underwater Robot Drifters for Exploring Submesoscale Ocean Dynamics. Nat. Commun. 2017, 8, 14189. [Google Scholar] [CrossRef]
  33. Oroza, C.; Tinka, A.; Wright, P.K.; Bayen, A.M. Design of a Network of Robotic Lagrangian Sensors for Shallow Water Environments with Case Studies for Multiple Applications. Proc. Inst. Mech. Eng. Part C J. Mech. Eng. Sci. 2013, 227, 2531–2548. [Google Scholar] [CrossRef]
  34. Nicholson, D.P.; Michel, A.P.M.; Wankel, S.D.; Manganini, K.; Sugrue, R.A.; Sandwith, Z.O.; Monk, S.A. Rapid Mapping of Dissolved Methane and Carbon Dioxide in Coastal Ecosystems Using the ChemYak Autonomous Surface Vehicle. Environ. Sci. Technol. 2018, 52, 13314–13324. [Google Scholar] [CrossRef]
  35. Tinka, A.; Rafiee, M.; Bayen, A.M. Floating Sensor Networks for River Studies. IEEE Syst. J. 2013, 7, 36–49. [Google Scholar] [CrossRef]
  36. Ensign, S.H.; Paerl, H.W. Development of an Unattended Estuarine Nutrient Monitoring Program Using Ferries as Data-Collection Platforms. Limnol. Oceanogr. Methods 2006, 4, 399–405. [Google Scholar] [CrossRef]
  37. Seppälä, J.; Ylöstalo, P.; Kaitala, S.; Hällfors, S.; Raateoja, M.; Maunula, P. Ship-of-Opportunity Based Phycocyanin Fluorescence Monitoring of the Filamentous Cyanobacteria Bloom Dynamics in the Baltic Sea. Estuar. Coast. Shelf Sci. 2007, 73, 489–500. [Google Scholar] [CrossRef]
  38. Anjomshoaa, A.; Duarte, F.; Rennings, D.; Matarazzo, T.J.; Desouza, P.; Ratti, C. City Scanner: Building and Scheduling a Mobile Sensing Platform for Smart City Services. IEEE Internet Things J. 2018, 5, 4567–4579. [Google Scholar] [CrossRef]
  39. Van Rees Vellinga, E.; Toussaint, C.G.; Wit, K.E. Water Quality and Hydrology in a Coastal Region of The Netherlands. J. Hydrol. 1981, 50, 105–127. [Google Scholar] [CrossRef]
  40. Rozemeijer, J.; Siderius, C.; Verheul, M.; Pomarius, H. Tracing the Spatial Propagation of River Inlet Water into an Agricultural Polder Area Using Anthropogenic Gadolinium. Hydrol. Earth Syst. Sci. 2012, 16, 2405–2415. [Google Scholar] [CrossRef]
  41. Kelly, M.G.; Cazaubon, A.; Coring, E.; Dell’Uomo, A.; Ector, L.; Goldsmith, B.; Guasch, H.; Hürlimann, J.; Jarlman, A.; Kawecka, B.; et al. Recommendations for the Routine Sampling of Diatoms for Water Quality Assessments in Europe. J. Appl. Phycol. 1998, 10, 215–224. [Google Scholar] [CrossRef]
  42. Ng, C.L.; Senft-Grupp, S.; Hemond, H.F. A Multi-Platform Optical Sensor for In Situ Sensing of Water Chemistry. Limnol. Oceanogr. Methods 2012, 10, 978–990. [Google Scholar] [CrossRef]
  43. Wang, W.; Shan, T.; Leoni, P.; Fernández-Gutiérrez, D.; Meyers, D.; Ratti, C.; Rus, D. Roboat II: A Novel Autonomous Surface Vessel for Urban Environments. In Proceedings of the 2020 IEEE/RSJ International Conference on Intelligent Robots and Systems (IROS), Las Vegas, NV, USA, 22–25 October 2020; pp. 1740–1747. [Google Scholar]
  44. Chang, H.-C.; Hsu, Y.-L.; Hung, S.-S.; Ou, G.-R.; Wu, J.-R.; Hsu, C. Autonomous Water Quality Monitoring and Water Surface Cleaning for Unmanned Surface Vehicle. Sensors 2021, 21, 1102. [Google Scholar] [CrossRef]
  45. Boss, E.; Ackleson, S.; Balch, B.; Chase, A.; Dall’olmo, G.; Freeman, S.; Haëntjens, N.; Loftin, J.; Neary, W.; Nelson, N.; et al. Inherent Optical Property Measurements and Protocols: Best Practices for the Collection and Processing of Ship-Based Underway Flow-Through Optical Data; IOCCG: Dartmouth, NS, Canada, 2019. [Google Scholar]
Figure 1. The mobile measurement platform. (a) The municipal utility vessel used for a deployment; (b) the LEDIF instrument being prepared for integration into the vessel; (c) the Aqua TROLL multi-parameter sonde and LEDIF integrated in parallel with the vessel’s engine cooling system.
Water 14 02834 g001aWater 14 02834 g001b
Figure 2. System architecture diagram of deployment vessel, backend software and data infrastructure, and frontend software and data analysis interface.
Water 14 02834 g002
Figure 3. LEDIF algal fluorescence calibrations. Inline images of cells via light microscopy. (a) Chlorella sp. fluorescence as a function of cell concentration; (b) Microcystis sp. fluorescence as a function of cell concentration.
Water 14 02834 g003
Figure 4. Maps of the sampling coverage of the field deployment. (a) Map of GPS coordinates for all measurements; (b) map of GPS coordinates for measurements within city-wide segmented areas; (c) map of GPS coordinates for measurements within Kostverlorenvaart segments.
Water 14 02834 g004
Figure 5. Spatial and temporal patterns of vessel movement within study region’s segmented areas. (a) Heatmaps of visitation frequency by day of week and time of day for each segmented region; (b) histogram of measurement data points for each segmented region.
Water 14 02834 g005
Figure 6. Calendar heatmap of the vessel’s daily travel distance over the course of the deployment during the summer of 2019.
Water 14 02834 g006
Figure 7. City-wide spatial pattern of conductivity (µS/cm) within each segmented region. (a) City-wide heatmap of conductivity with segmented regions outlined; (b) overlaid timeseries of conductivity for each segmented region; (c) overlaid histograms of conductivity for each segmented region; (d) violin plot of conductivity for the segmented areas.
Water 14 02834 g007
Figure 8. Kostverlorenvaart spatial pattern of conductivity (µS/cm) within the sub-canal segmented regions. (a) heatmap of Kostverlorenvaart conductivity with segmented regions outlined; (b) overlaid timeseries of conductivity for each segmented region; (c) overlaid histograms of conductivity for each segmented region; (d) violin plot of conductivity for the segmented areas.
Water 14 02834 g008
Figure 9. City-wide spatial pattern of green algae (cells/mL in equivalent cells of Chlorella sp.) within each segmented region. (a) City-wide heatmap of green algae with segmented regions outlined; (b) overlaid timeseries of green algae for each segmented region; (c) overlaid histograms of green algae for each segmented region; (d) violin plot of green algae for the segmented areas.
Water 14 02834 g009
Publisher’s Note: MDPI stays neutral with regard to jurisdictional claims in published maps and institutional affiliations.

