
Water Seepage in Rocks at Micro-Scale
by
 , , ,
, , ,
Yue Wu
1 ,
,
Yan-Zhi Li
1,*,
Wei-Guo Qiao
1,
Zhen-Wang Fan
1,
Shuai Zhang
2,
Kui Chen
3 and
Lei Zhang
1 1
Shandong Provincial Key Laboratory of Civil Engineering Disaster Prevention and Mitigation, College of Civil Engineering and Architecture, Shandong University of Science and Technology, Qingdao 266590, China
2
School of Civil Engineering, Ludong University, Yantai 264025, China
3
State Key Laboratory of Shield Machine and Boring Technology, Zhengzhou 450001, China
*
Author to whom correspondence should be addressed.
Water 2022, 14(18), 2827; https://doi.org/10.3390/w14182827
Submission received: 6 July 2022
/
Revised: 6 September 2022
/
Accepted: 8 September 2022
/
Published: 11 September 2022
(This article belongs to the Section Hydraulics and Hydrodynamics)
Abstract
:To complete groundwater diversion, the complex flow law of groundwater in rocks must be investigated so that groundwater diversion can be improved. This research uses the computer finite element method (FEM), CT scanning calculation method, Avizo method, and digital core technology combined with the Fluent calculation method (FCM) to reconstruct rocks with microscopic pore structures on a computer. The numerical simulation results under different conditions show that: the total pressure change gradually decreases under different pressure gradients. In a seepage channel, the seepage path does not change with the change in seepage pressure, and the seepage velocity is the largest in the center of the pore. The longer the seepage path is, the greater the decrease in seepage velocity. Different seepage directions have similar seepage laws. The research results provide effective guidance for the project to control groundwater.
Keywords:
groundwater; a variety of advanced computer methods; rock mass seepage; FEM; FCM; drainage1. Introduction
During the construction of subways, tunnels, and underground roadways, many factors, such as the geological structure, ground stress, and groundwater, affect engineering safety and the environment [1,2,3]. Groundwater is one of the most important factors. A large quantity of groundwater flows out of rock pores and severely affects traffic safety and engineering construction safety. Groundwater usually contains various harmful impurities that corrode engineering construction materials and pollute the engineering environment. Due to large groundwater reserves in deep underground areas, complex geological conditions, and numerous water inflows in underground engineering, the prevention and control of groundwater disasters received extensive attention and were investigated in research studies [4,5,6,7].
In underground engineering, groundwater mainly flows through pores in rock. Presently [8,9,10,11], cement slurry grouting and water shutoff are commonly employed to plug rock pores [12,13]. This method has two disadvantages. First, the application of this method does not completely eliminate groundwater outflow. Groundwater still flows through tiny cracks in rock that ordinary cement slurry cannot enter [14,15]. Second, groundwater mixes with cement slurry during grouting and changes the slurry properties [16,17]. For example, a large quantity of groundwater dilutes the cement slurry, thereby reducing the setting time of the cement slurry and diminishing the plugging effect.
Therefore, an increasing number of scholars began to explore groundwater drainage [18,19,20]. Groundwater drainage offers two advantages. First, large quantities of groundwater can be drained, thereby reducing pollution and hazards to engineering construction and preventing the flow of groundwater through tiny cracks due to water blocking by grouting, ensuring the safety of the engineering environment [21,22,23,24]. Second, drained groundwater can be stored and used for domestic purposes, such as hydroelectric power generation. Thus, water resources are more effectively conserved and utilized, and water resource management is improved [25]. However, drainage is not an easy task, and the configuration of drainage tubes and other equipment requires planning. If the main part of a drainage pipe and other equipment are placed in an area with low groundwater flow, groundwater flow cannot effectively be diverted from an area with a large groundwater flow. Thus, a large quantity of groundwater cannot be drawn out, and groundwater flow will continue to affect the safety of subways, tunnels, and underground roadways. Therefore, it is necessary to rationally arrange drainage pipes and other equipment to efficiently divert groundwater [26]. The key to rationally arranging drainage pipes and other equipment is to determine the pore structure characteristics of rock and the corresponding law of fluid seepage.
To evaluate pore structure, previous studies mainly utilized a two-dimensional capillary network model, in which each capillary is interconnected. However, this model still has a large gap with the real rock pore structure and can only show some characteristics of the actual pore structure. Wang [27] et al., also analyzed the pore network model. This model completely expresses the topological structure of rock pores, and the characteristic parameters of the pore network model can well reflect the pore structure characteristics of real rocks. The parameters extracted from this model and the actual pore structure parameters can be well fitted, so it is widely employed. With the development of X-ray CT scanning technology, using this method to reconstruct the 3D digital core, and then extracting the pore network model from the 3D digital core, various parameters of the pore structure can be obtained, which is also currently the most accurate and realistic reconstruction of the rock pore structure through state-of-the-art means. The main construction methods include the multidirectional slice scanning method, pore center axis method, Voronoi diagram method, and maximum sphere method. Bakke [28] et al., applied the Voronoi chart method to count the particle radius of sandstone, extracted the pore network model, and carried out the seepage simulation in the discrete element network model based on this model. To solve the problem of the uncertainty of the pore center axis method in the search of pores and throats, Silin [29] et al. proposed a maximum sphere algorithm. On this basis, Blunt [30] further investigated and perfected the maximum sphere algorithm and established the pore model of carbonate rock and sandstone.
In terms of the corresponding seepage law, Zhang [31] chose the N–S equation direct calculation, pore network model simulation, and lattice Boltzmann method to conduct a simulation and comparison, and the Kozeny–Carman equation was selected to fit the permeability calculated by the three methods. It is determined that the calculation results of the direct calculation method based on the N–S equation is higher than those of the other two methods. Du [32] applied a pressure gradient of 6699.6 Pa to the three-dimensional digital core of deep sandstone in his doctoral dissertation research, investigated the relationship between the pressure and velocity in the three directions of X, Y, and Z of the digital core, and discovered that under this pressure gradient, the seepage velocity of each core is in the range of 0.73–1.6 m/s. Wang [33] used Abaqus software to analyze the pressure gradient of 1 MPa on a sandstone digital core model and determined that the average seepage velocity of the velocity field could reach 2.7 m/s and that the outlet mass flow rate under each pressure gradient was in a range between 1 × 10⁻⁵ and 6 × 10⁻⁵ kg/s. Bai [34] utilized Fluent software to carry out 3D digital core pore model seepage. The simulated unidirectional seepage velocity ranged from 2 m/s to 20 m/s under 3 MPa of pressure. The range is 16.58–42.27 m/s. Wei [35] investigated single-phase and two-phase seepage simulations of a sandstone digital core model under a pressure gradient of 1 MPa through the docking technology of Avizo and COMSOL. Lu [36] employed the CFD software Fluent to simulate the seepage simulation of the rock pore model under pressure gradients of 2.5 MPa, 5 MPa, and 7.5 MPa, and discovered that the seepage velocity ranged from 2 m/s to 23 m/s. Gong [37] used Fluent software to set the inlet pressure to 1.01 × 10²~1.01 × 10⁷ Pa and to set the outlet pressure to 0 Pa in order to simulate the seepage flow and obtained the seepage pressure field and velocity field law of water. Hou [38] selected Fluent software to investigate the microscopic seepage characteristics of uranium-bearing sandstone digital cores and simulated the seepage velocity range of 0–500 cm/d in the range of 0–0.045 MPa under a pressure gradient of 0.01 MPa.
In terms of rock mass reinforcement, scholars studied rock mass reinforcement from anchor cables under different conditions, as well as through various other laboratory and field methods [39,40]. Other scholars conducted research on rock strength parameters, conductivity, and the sensitivity of mechanical parameters, and achieved innovative results [41,42,43].
Although the above studies explored the pore structure and seepage law from different perspectives, most of them were carried out through a single technical means. Notably, previous studies did not comprehensively utilize multiple technologies, and the accuracy of the calculation results is still lacking. This study improves this research by combining several advanced technical approaches. In addition, previous studies focused on rocks with smaller depths, and their structures differ from those of deep rocks. In this study, more than 1000 m of underground rocks were extracted.
In this study, a rock sample was obtained from a deep (depth of approximately 1, 100 m) engineering site. The results, such as the type of pore structure, were obtained by casting thin sections. A combination of multiple indoor tests and computer simulation technology was used to analyze the microscopic pore structure of the rock. A fluid seepage computer simulation was carried out to determine the fluid seepage law for the rock. Both the macropores and micropores in the rock were investigated to increase the accuracy and credibility of the results. These results can effectively guide groundwater diversion, thereby ensuring the civil engineering construction safety of subways, tunnels, and underground roadways. It is of great significance to the safety of civil engineering construction.
2. Pore Types and Rock 3D Structure Creation
2.1. Pore Types
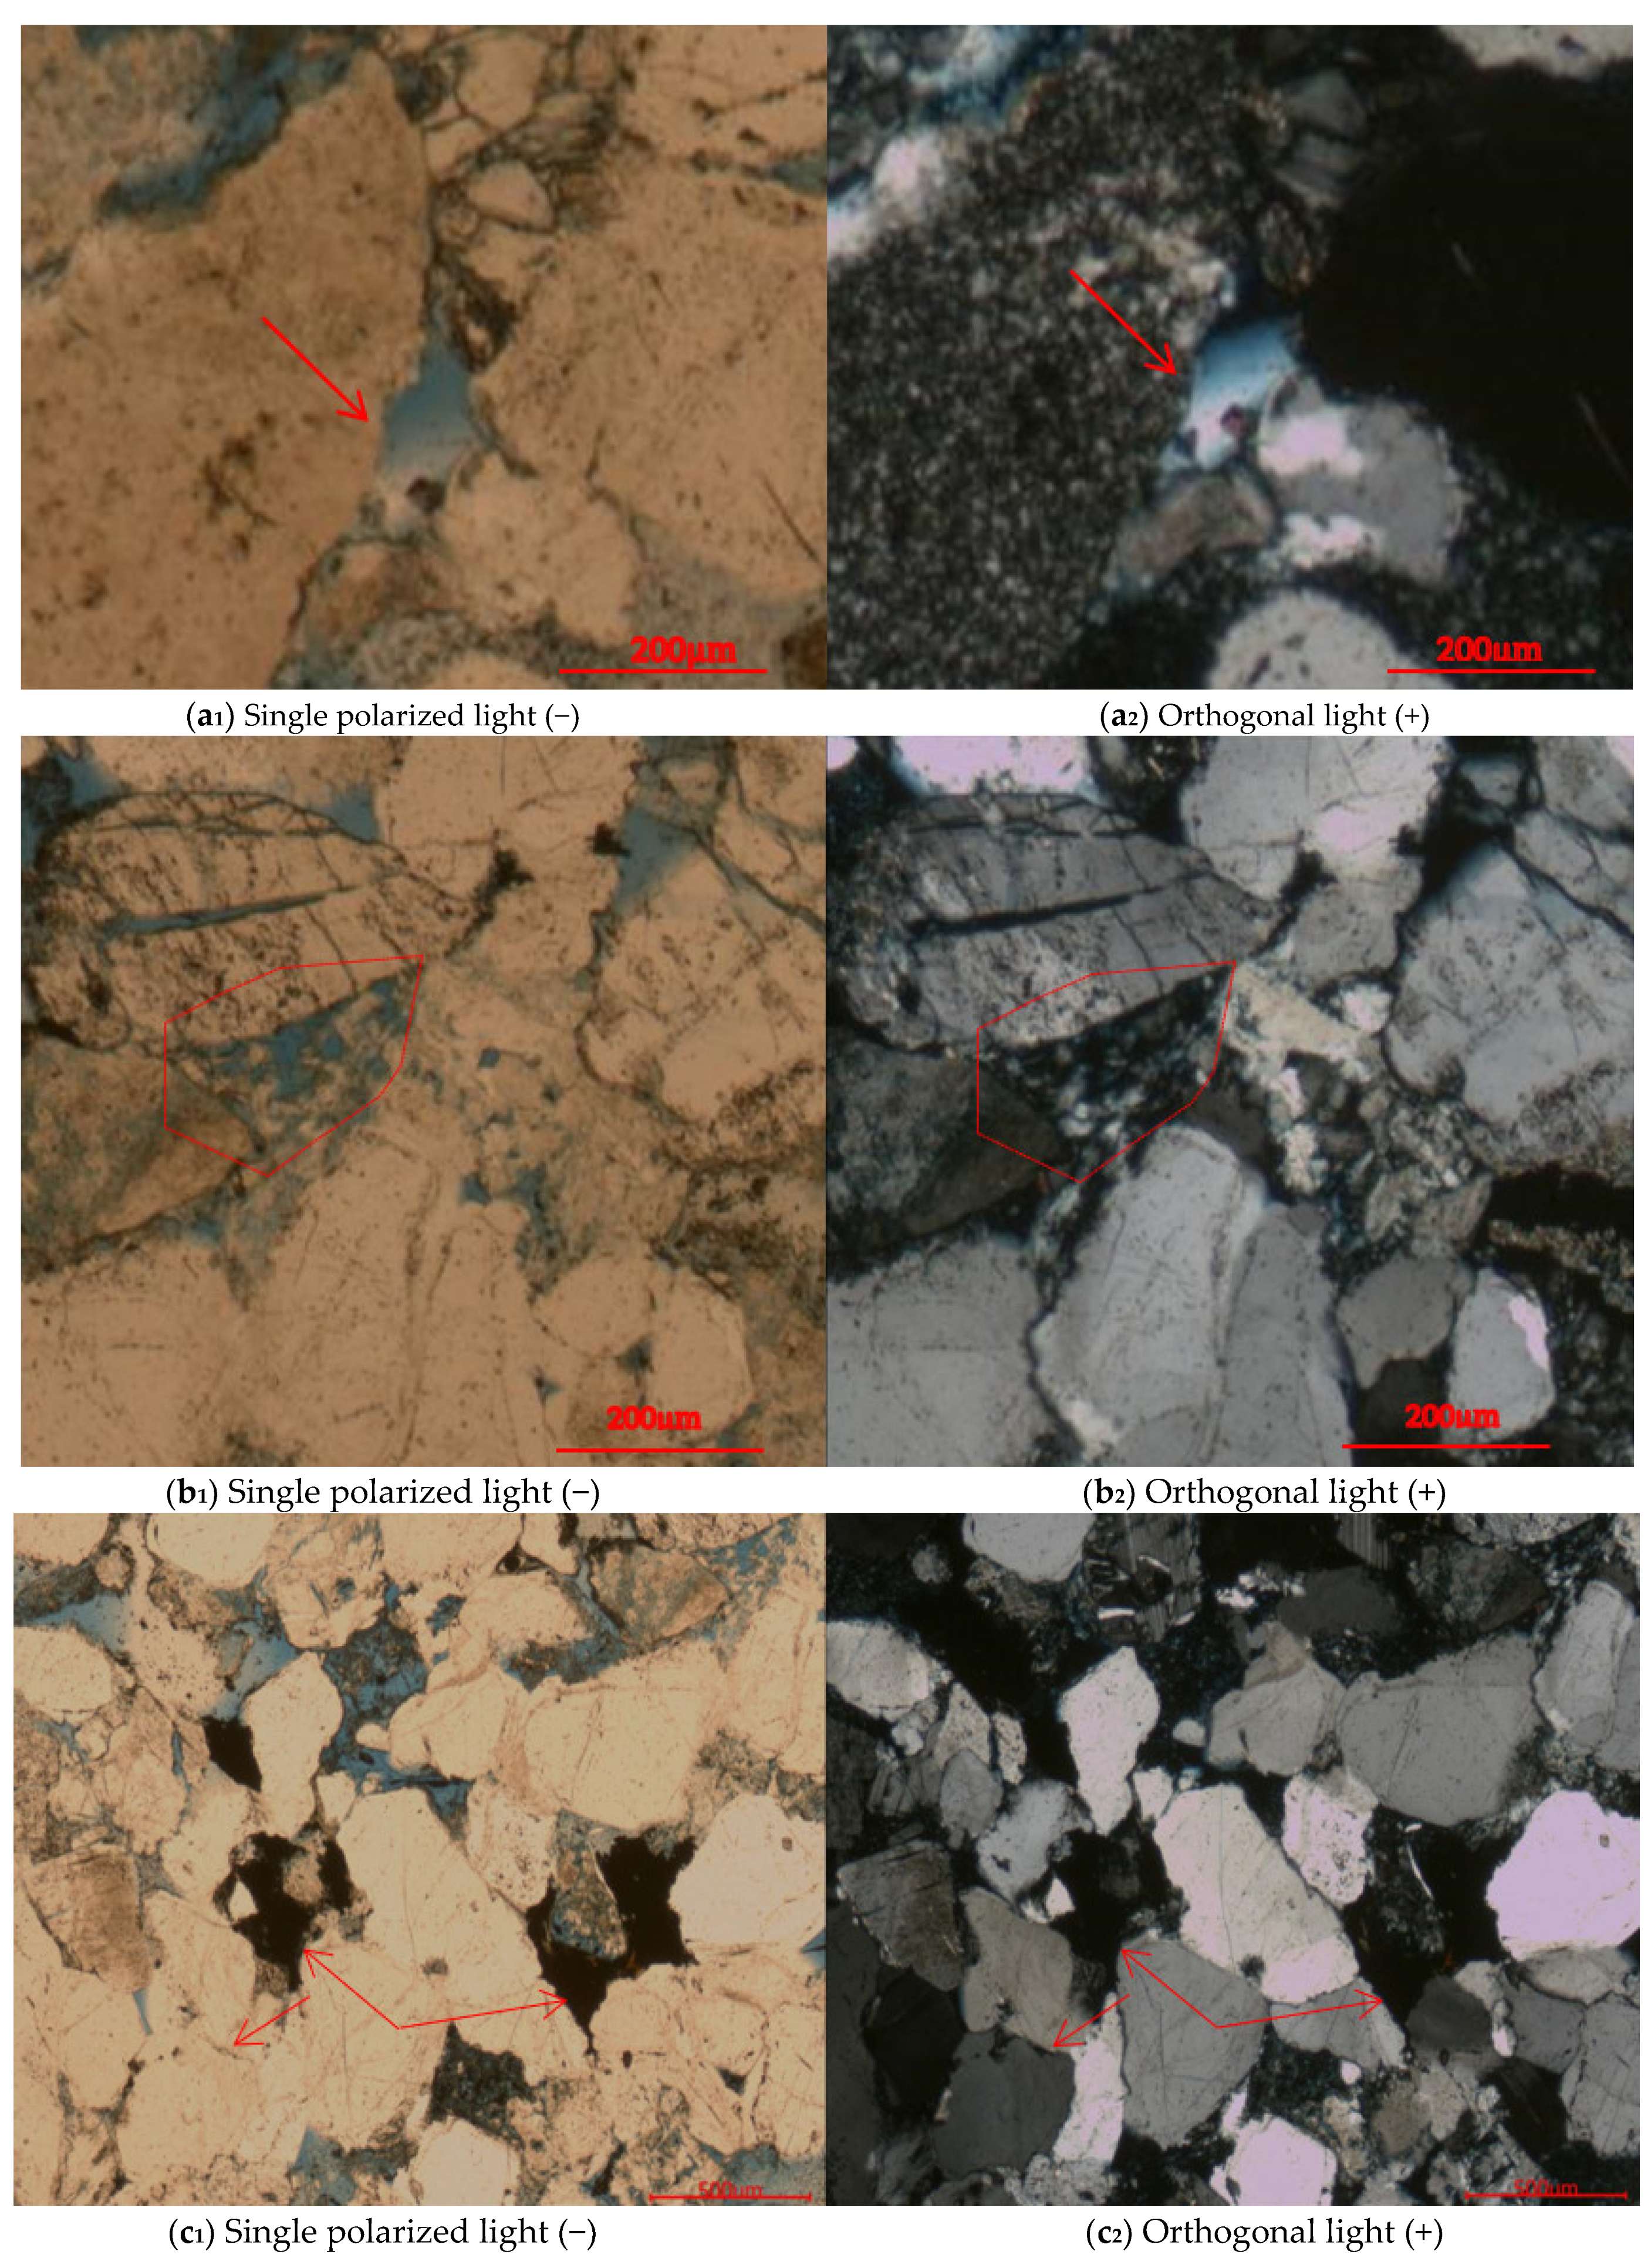
According to the test and analysis of the rock samples based on casting thin section technology (Figure 1), the pore types mainly include residual intergranular pores, intergranular dissolved pores, intragranular dissolved pores, mold pores, and microcracks. Among them, the most important pore types are residual intergranular pores and intergranular dissolved pores.
Presently, it is very common to observe the microscopic pore structure by casting thin slices. This method can be employed to qualitatively describe the two-dimensional characteristics of the microscopic pore structure, including pore throat type and pore throat size. The cast thin section experiment can observe microscopic pores in a large area, and samples can be prepared for each rock area according to the research needs, which increases the flexibility of observation.
Intergranular pores refer to pores surrounded by particles in rock. During diagenesis, the intergranular pores are squeezed under the action of in situ stress and filled with interstitials to form residual intergranular pores. Current research mostly refers to residual intergranular pores. The shapes are mostly triangles, polygons and irregular shapes of varying sizes (a1, a2). The average pore diameter is in the range of 10 μm~150 μm.
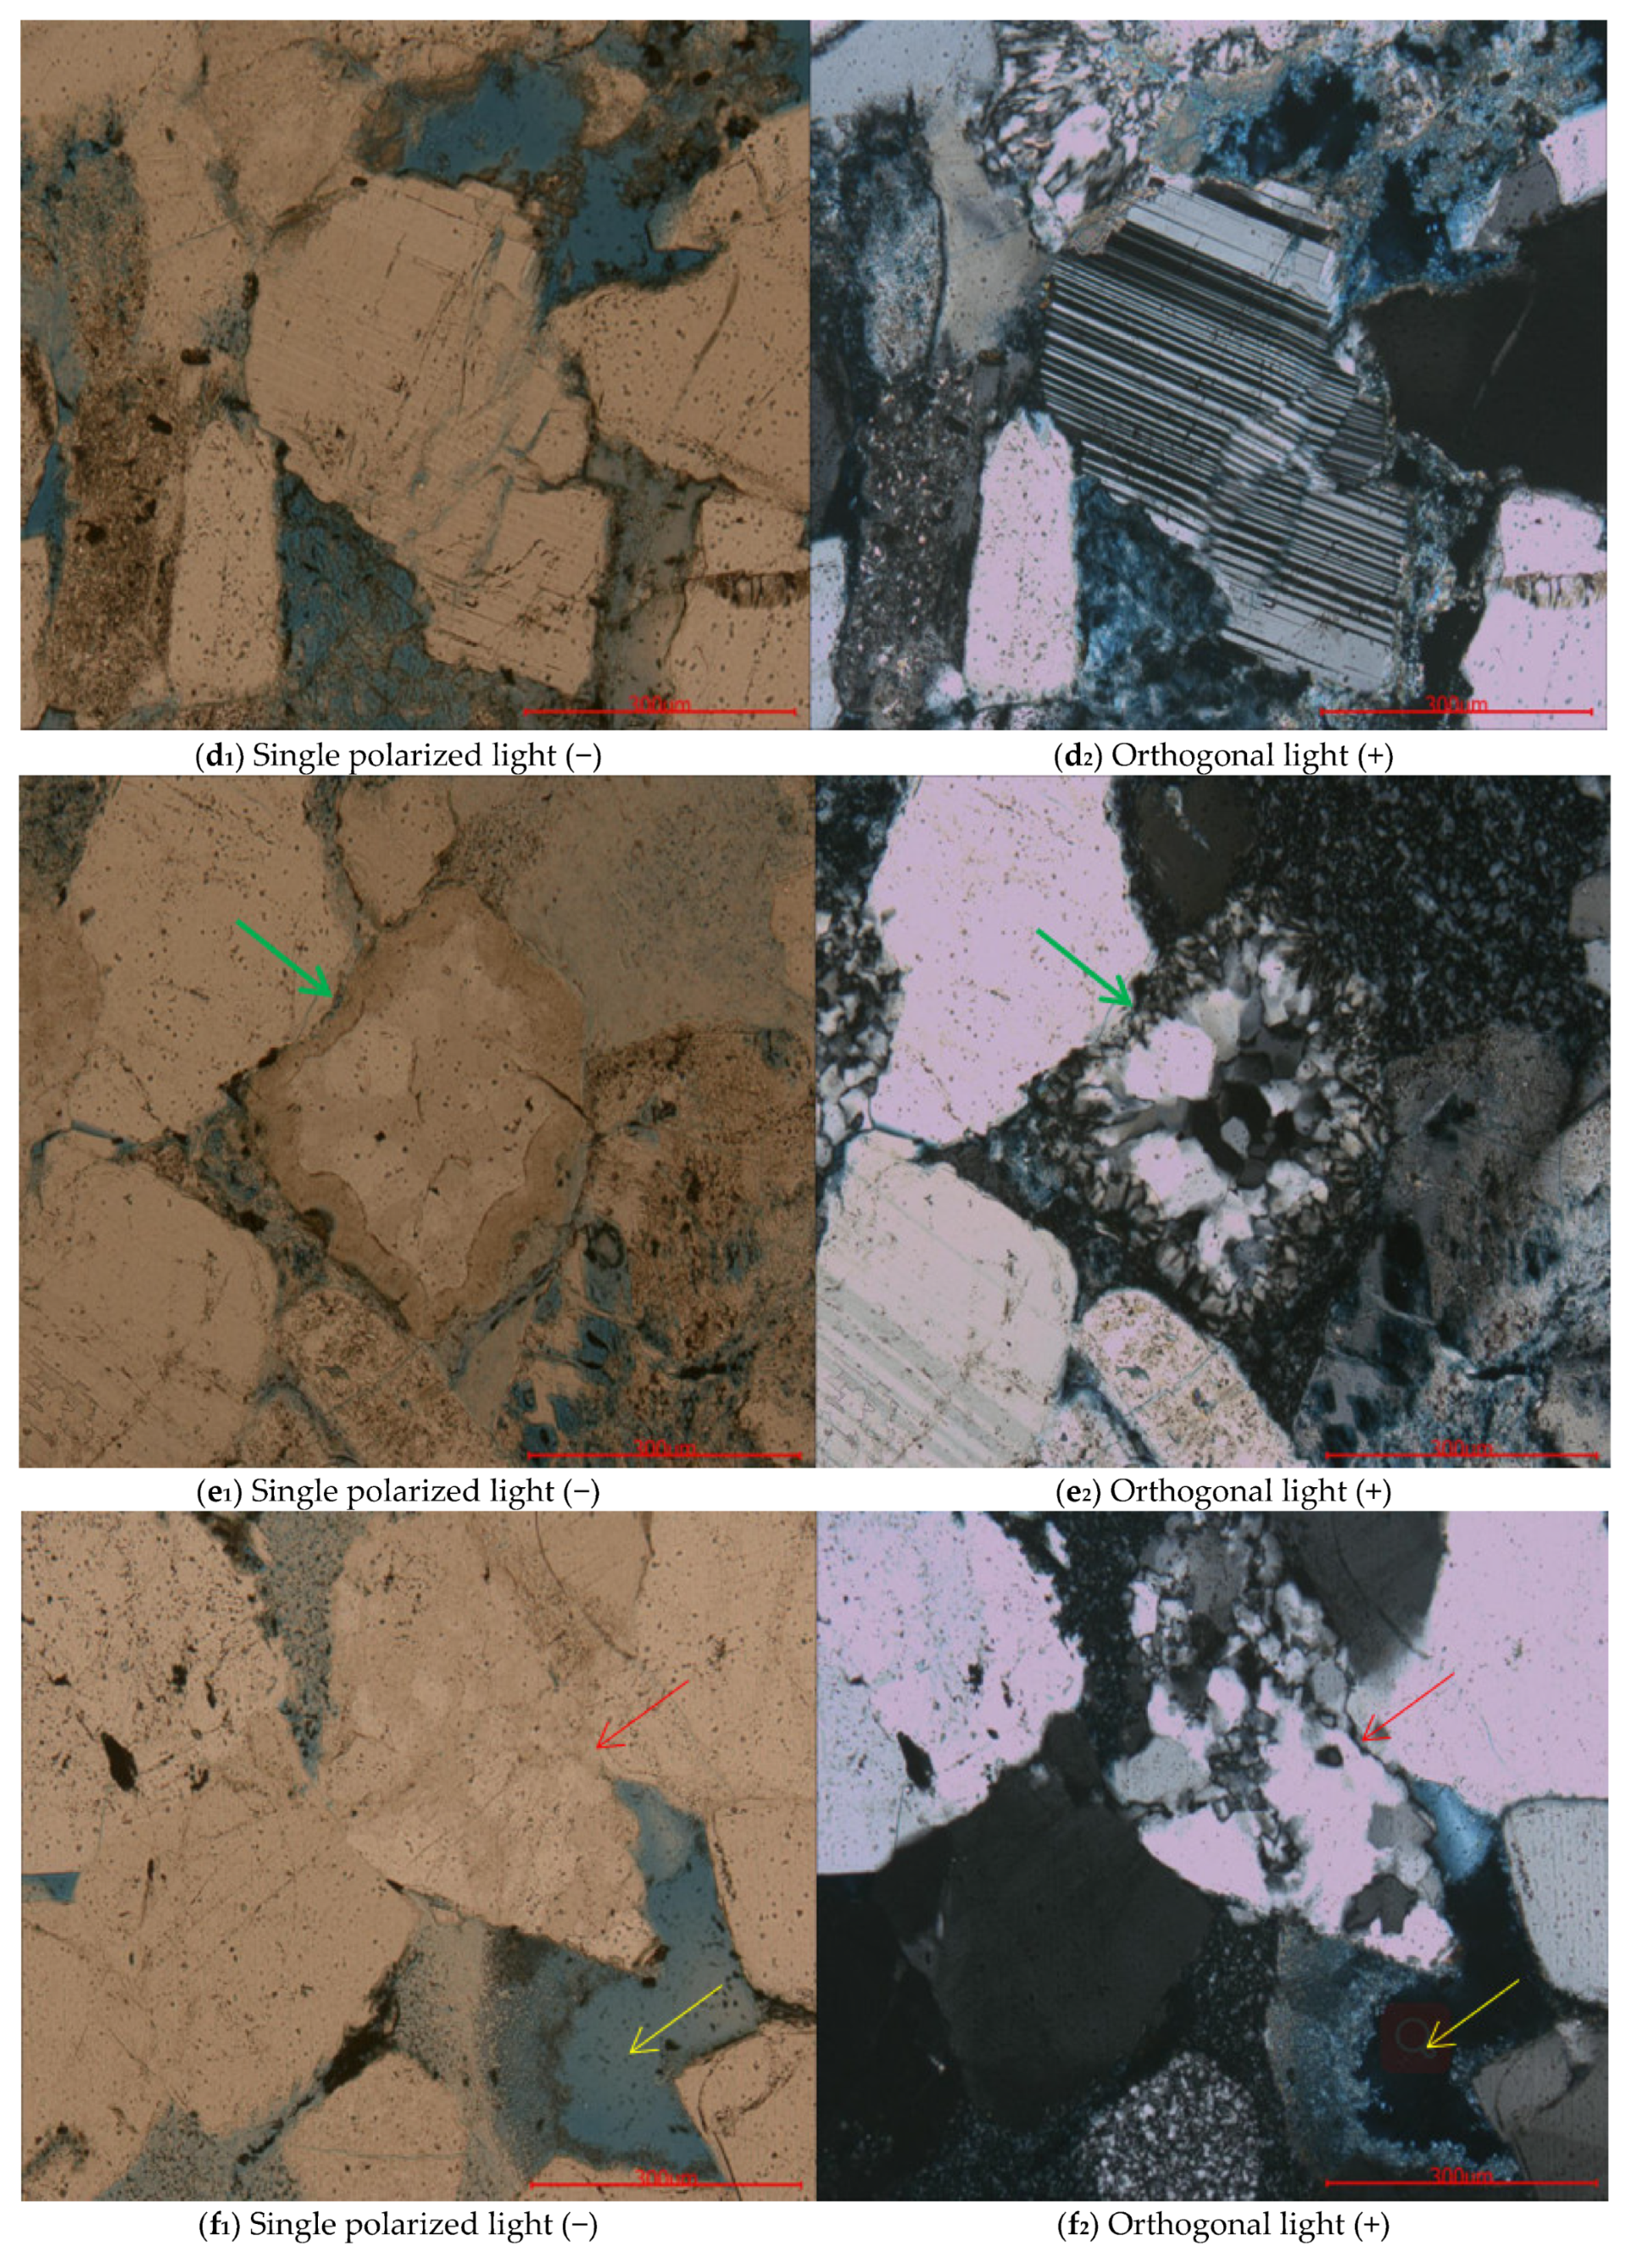
Intergranular dissolution pores show that the edges of the particles are corroded in a bay-like or irregular shape, mainly feldspar dissolution (b1, b2), followed by interstitials ((c1, c2) and (d1, d2)), and rock debris (e1, e2) and the edge dissolution of quartz particles (f1, f2).
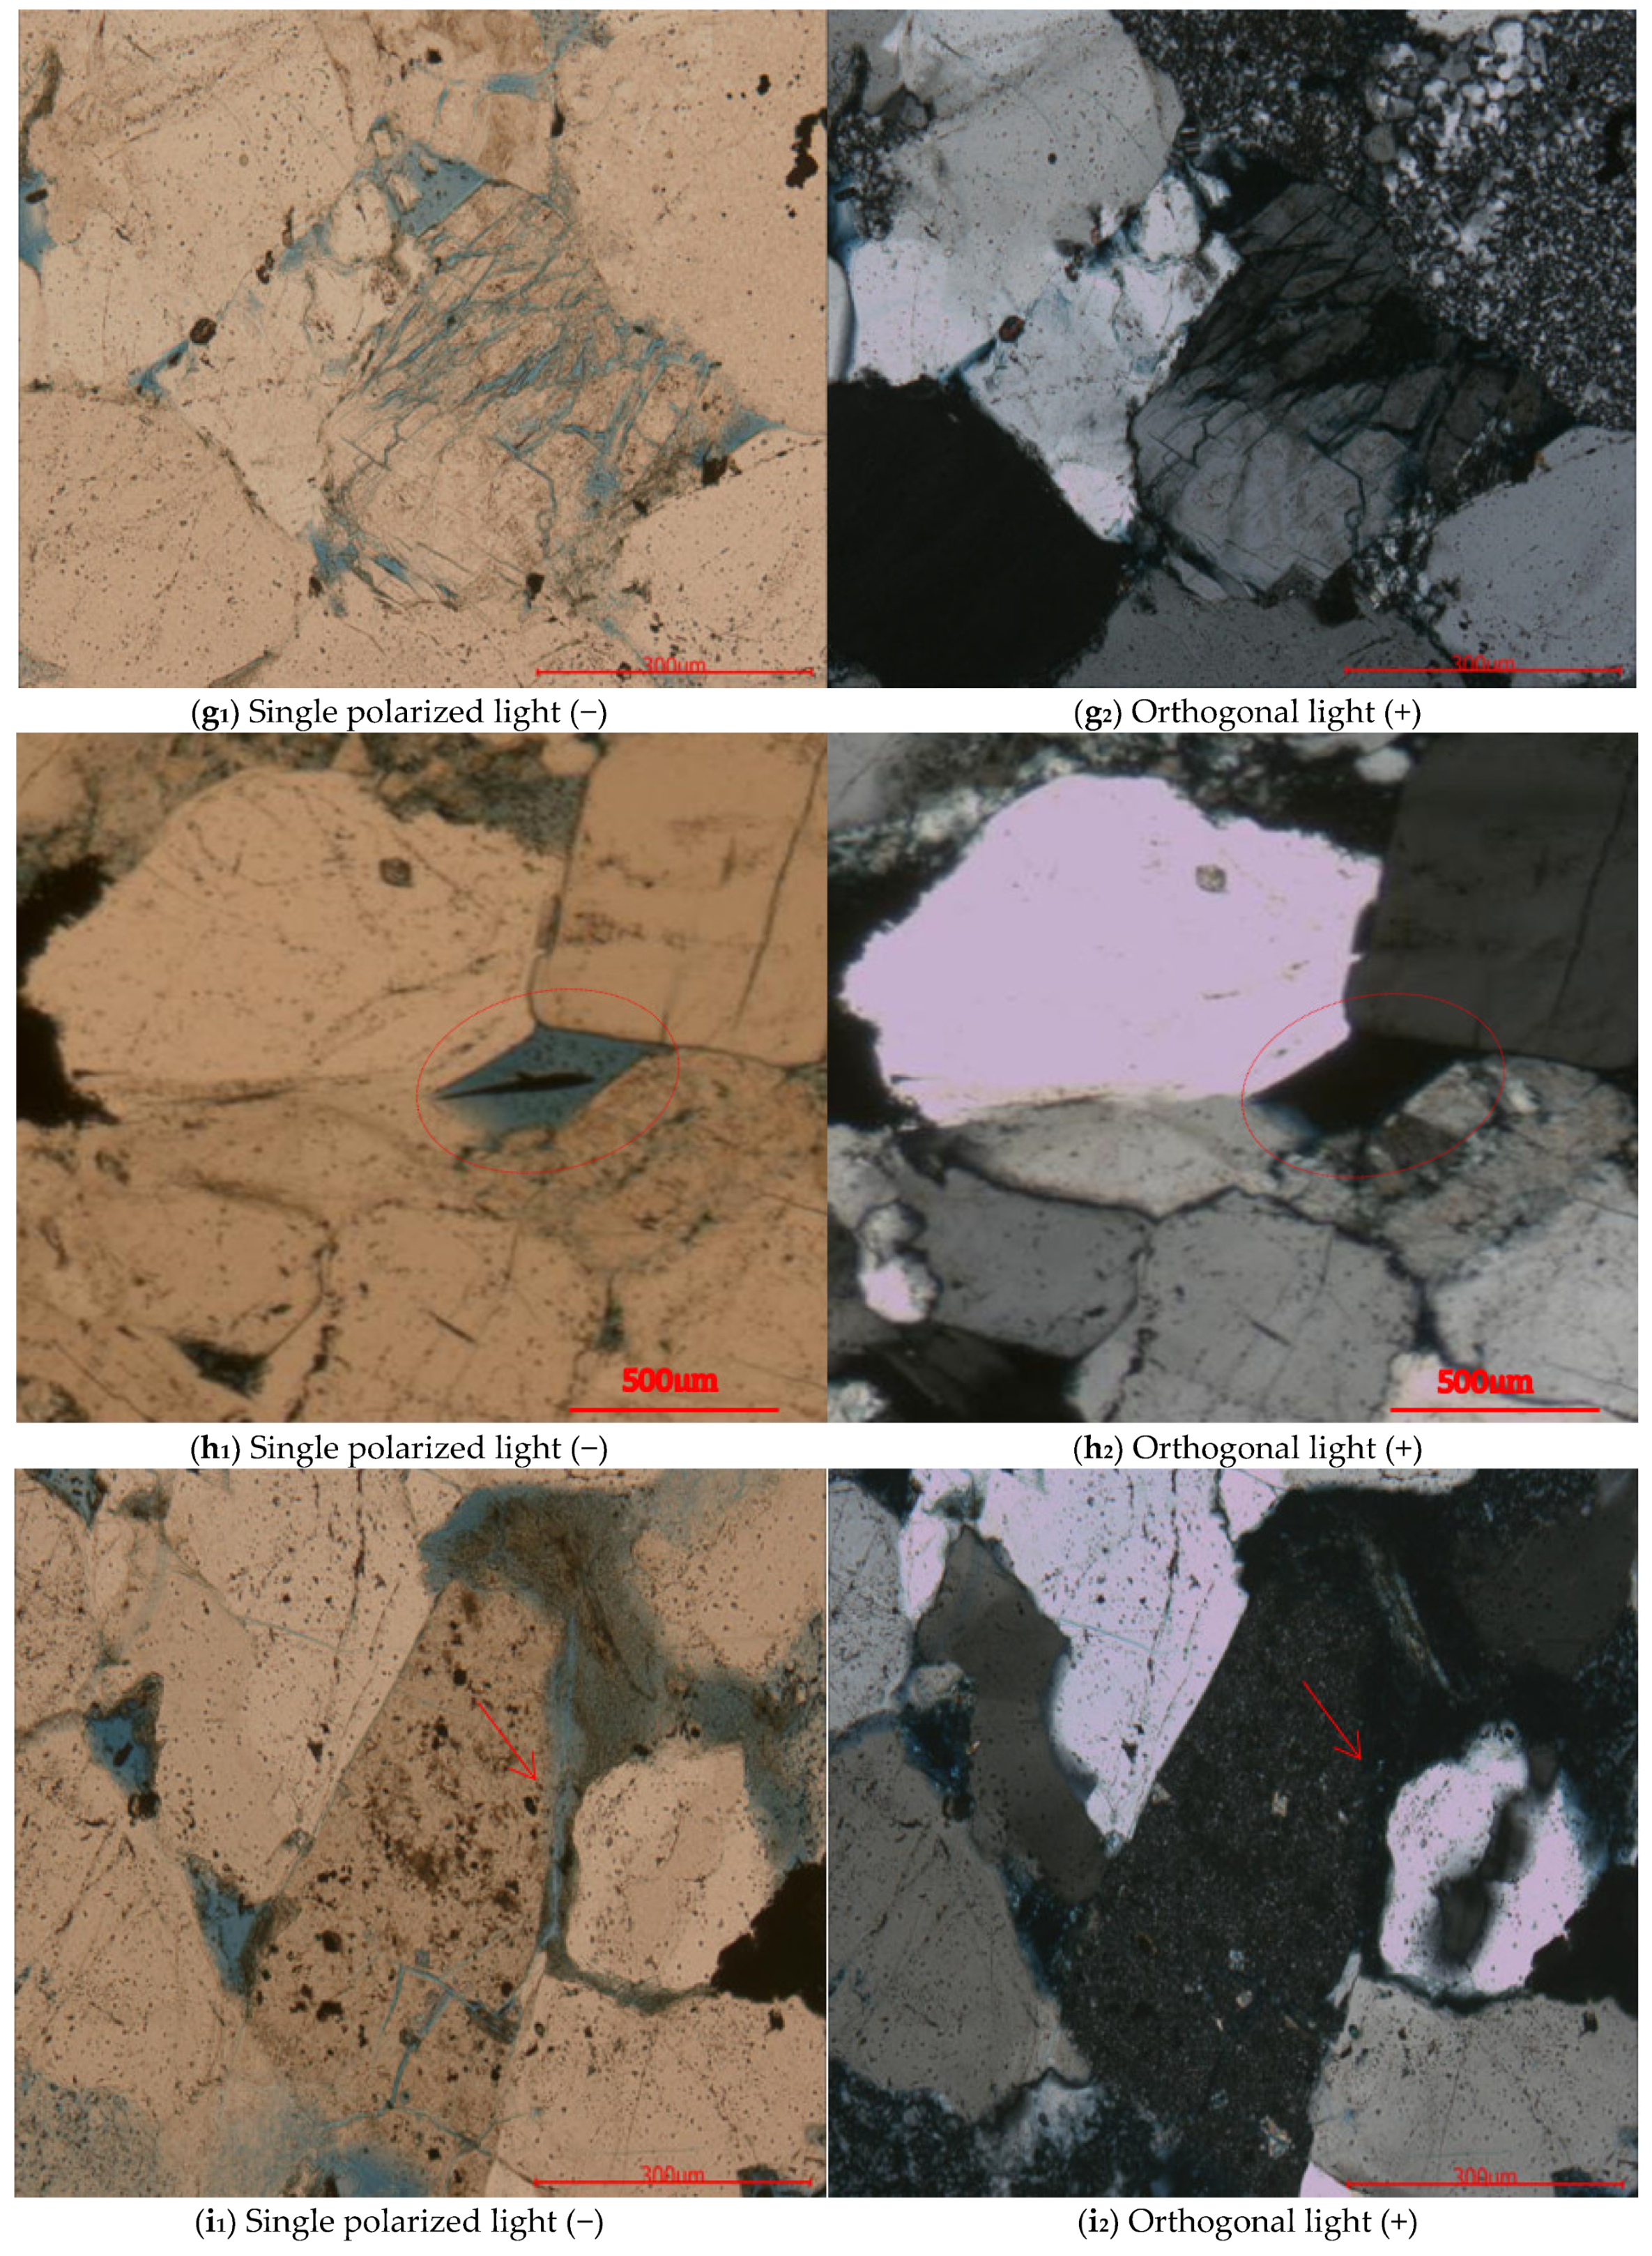
The intragranular dissolved pores are mainly formed by partial dissolution of rock particles (g1, g2). Mold pores are formed after the soluble minerals are completely dissolved (h1, h2), retaining the original shape and contour of the particles.
There are two main types of microcracks: the first type is distributed along the inside of the debris or along the edges of the particles, and the second type is distributed among the particles [44]. The width generally ranges from a few tenths of a micrometer to a few tens of micrometers (i1, i2).
2.2. Rock 3D Structure Creation
Adopting the FEM, CT scanning calculation method, Avizo method, and digital core technology, the rock containing the microscopic pore structure is reconstructed by a computer and it is connected to the FCM.
The FEM used in this study mainly refers to ANSYS software and the comprehensive application of FCM combined with other technologies.
A simple explanation of digital core technology: digital core technology is based on two-dimensional, scanning electron microscopy or three-dimensional, CT scan images, using computer image processing technology to complete the three-dimensional reconstruction of rock through certain algorithms, that is, to create a real, three-dimensional rock structure.
Avizo is software that processes a series of two-dimensional grayscale images scanned by CT, synthesizes three-dimensional models, and reconstructs three-dimensional, digital core models of rock pores.
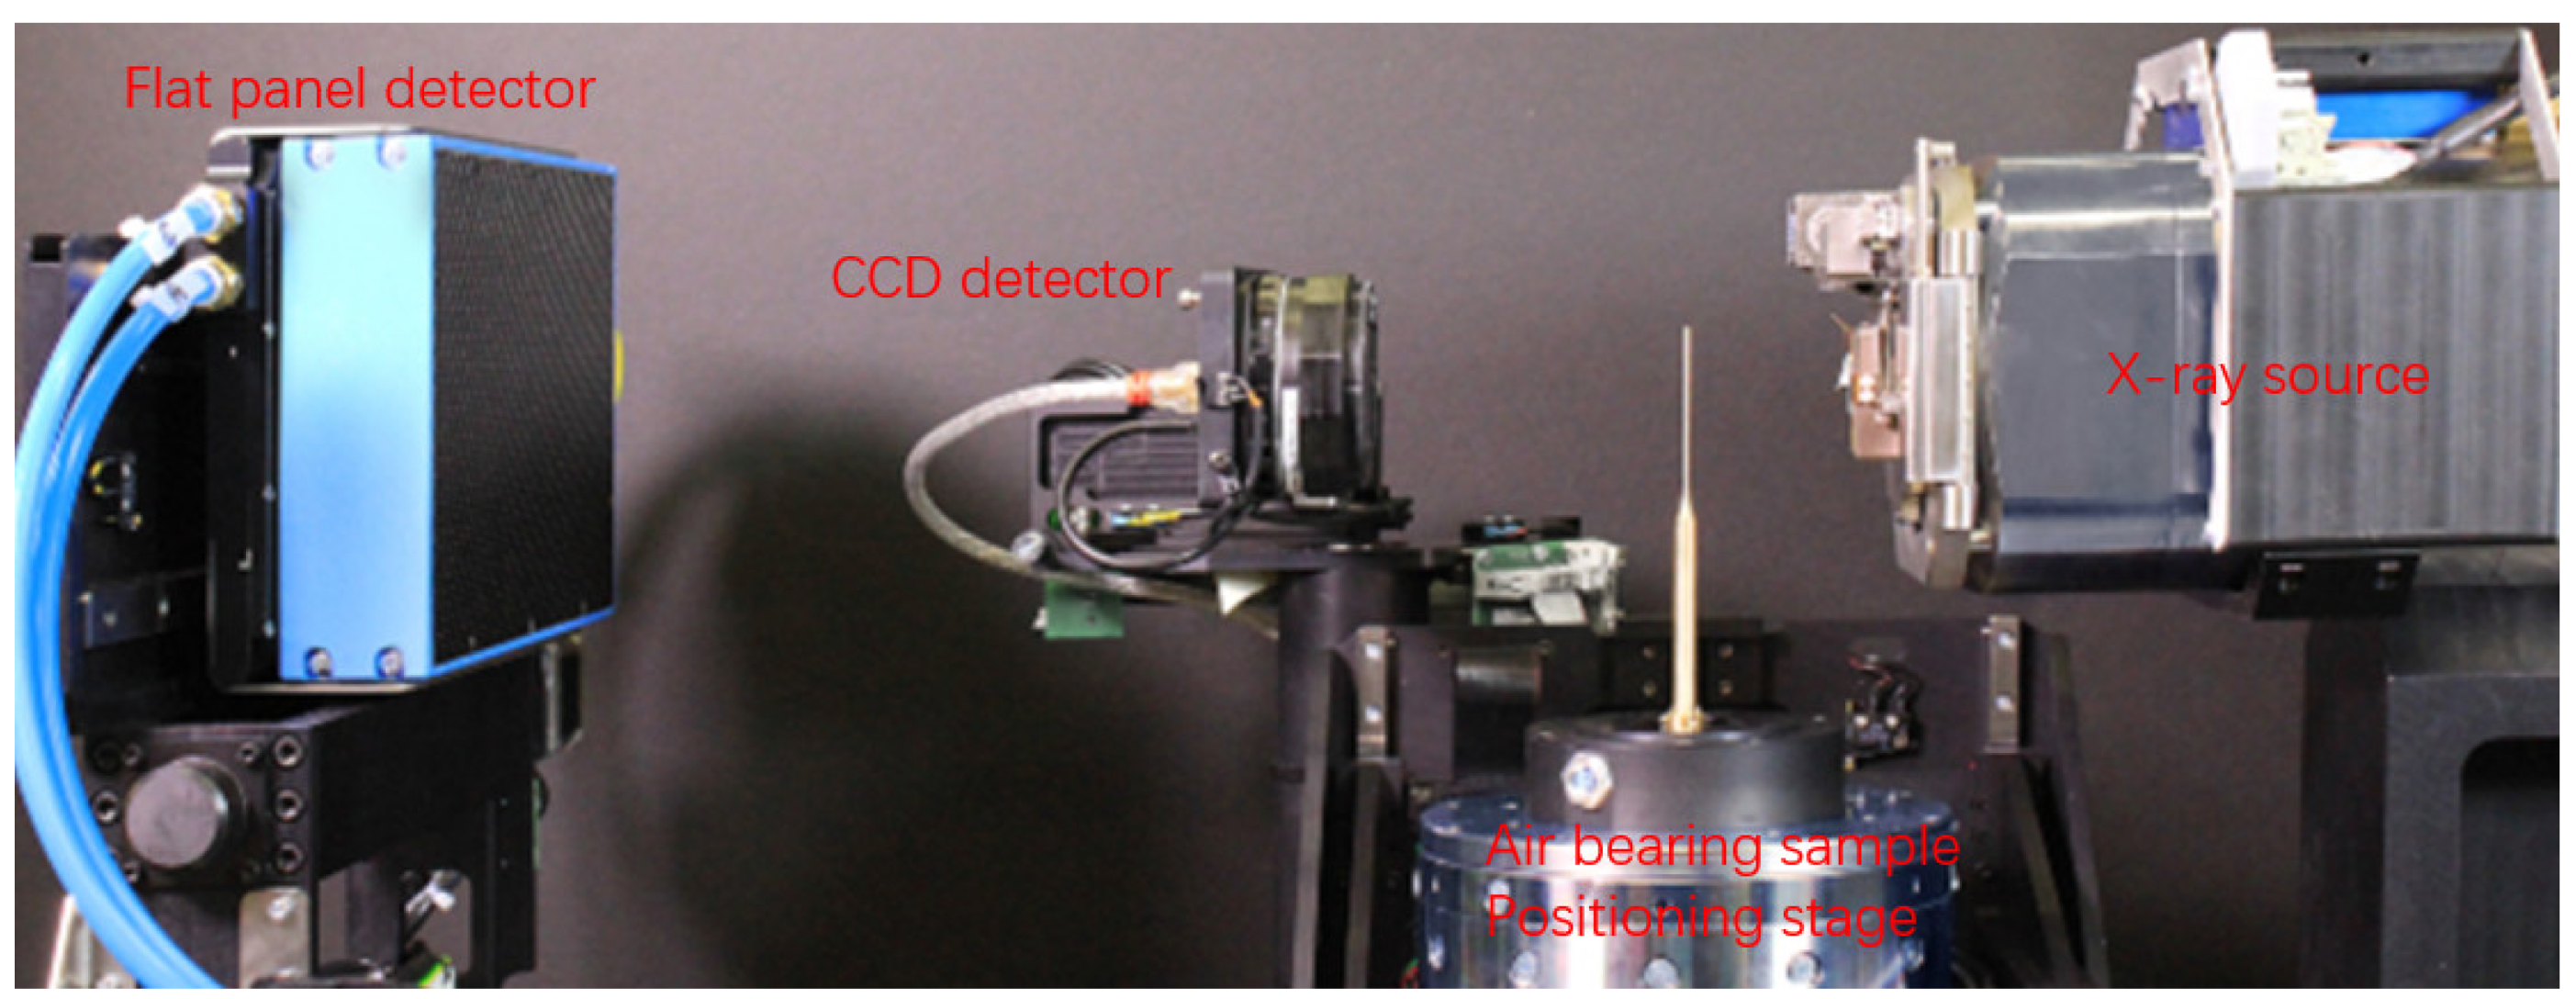
A series of two-dimensional grayscale images were scanned by CT to synthesize a three-dimensional model. The adopted CT scanning equipment is shown in Figure 2.
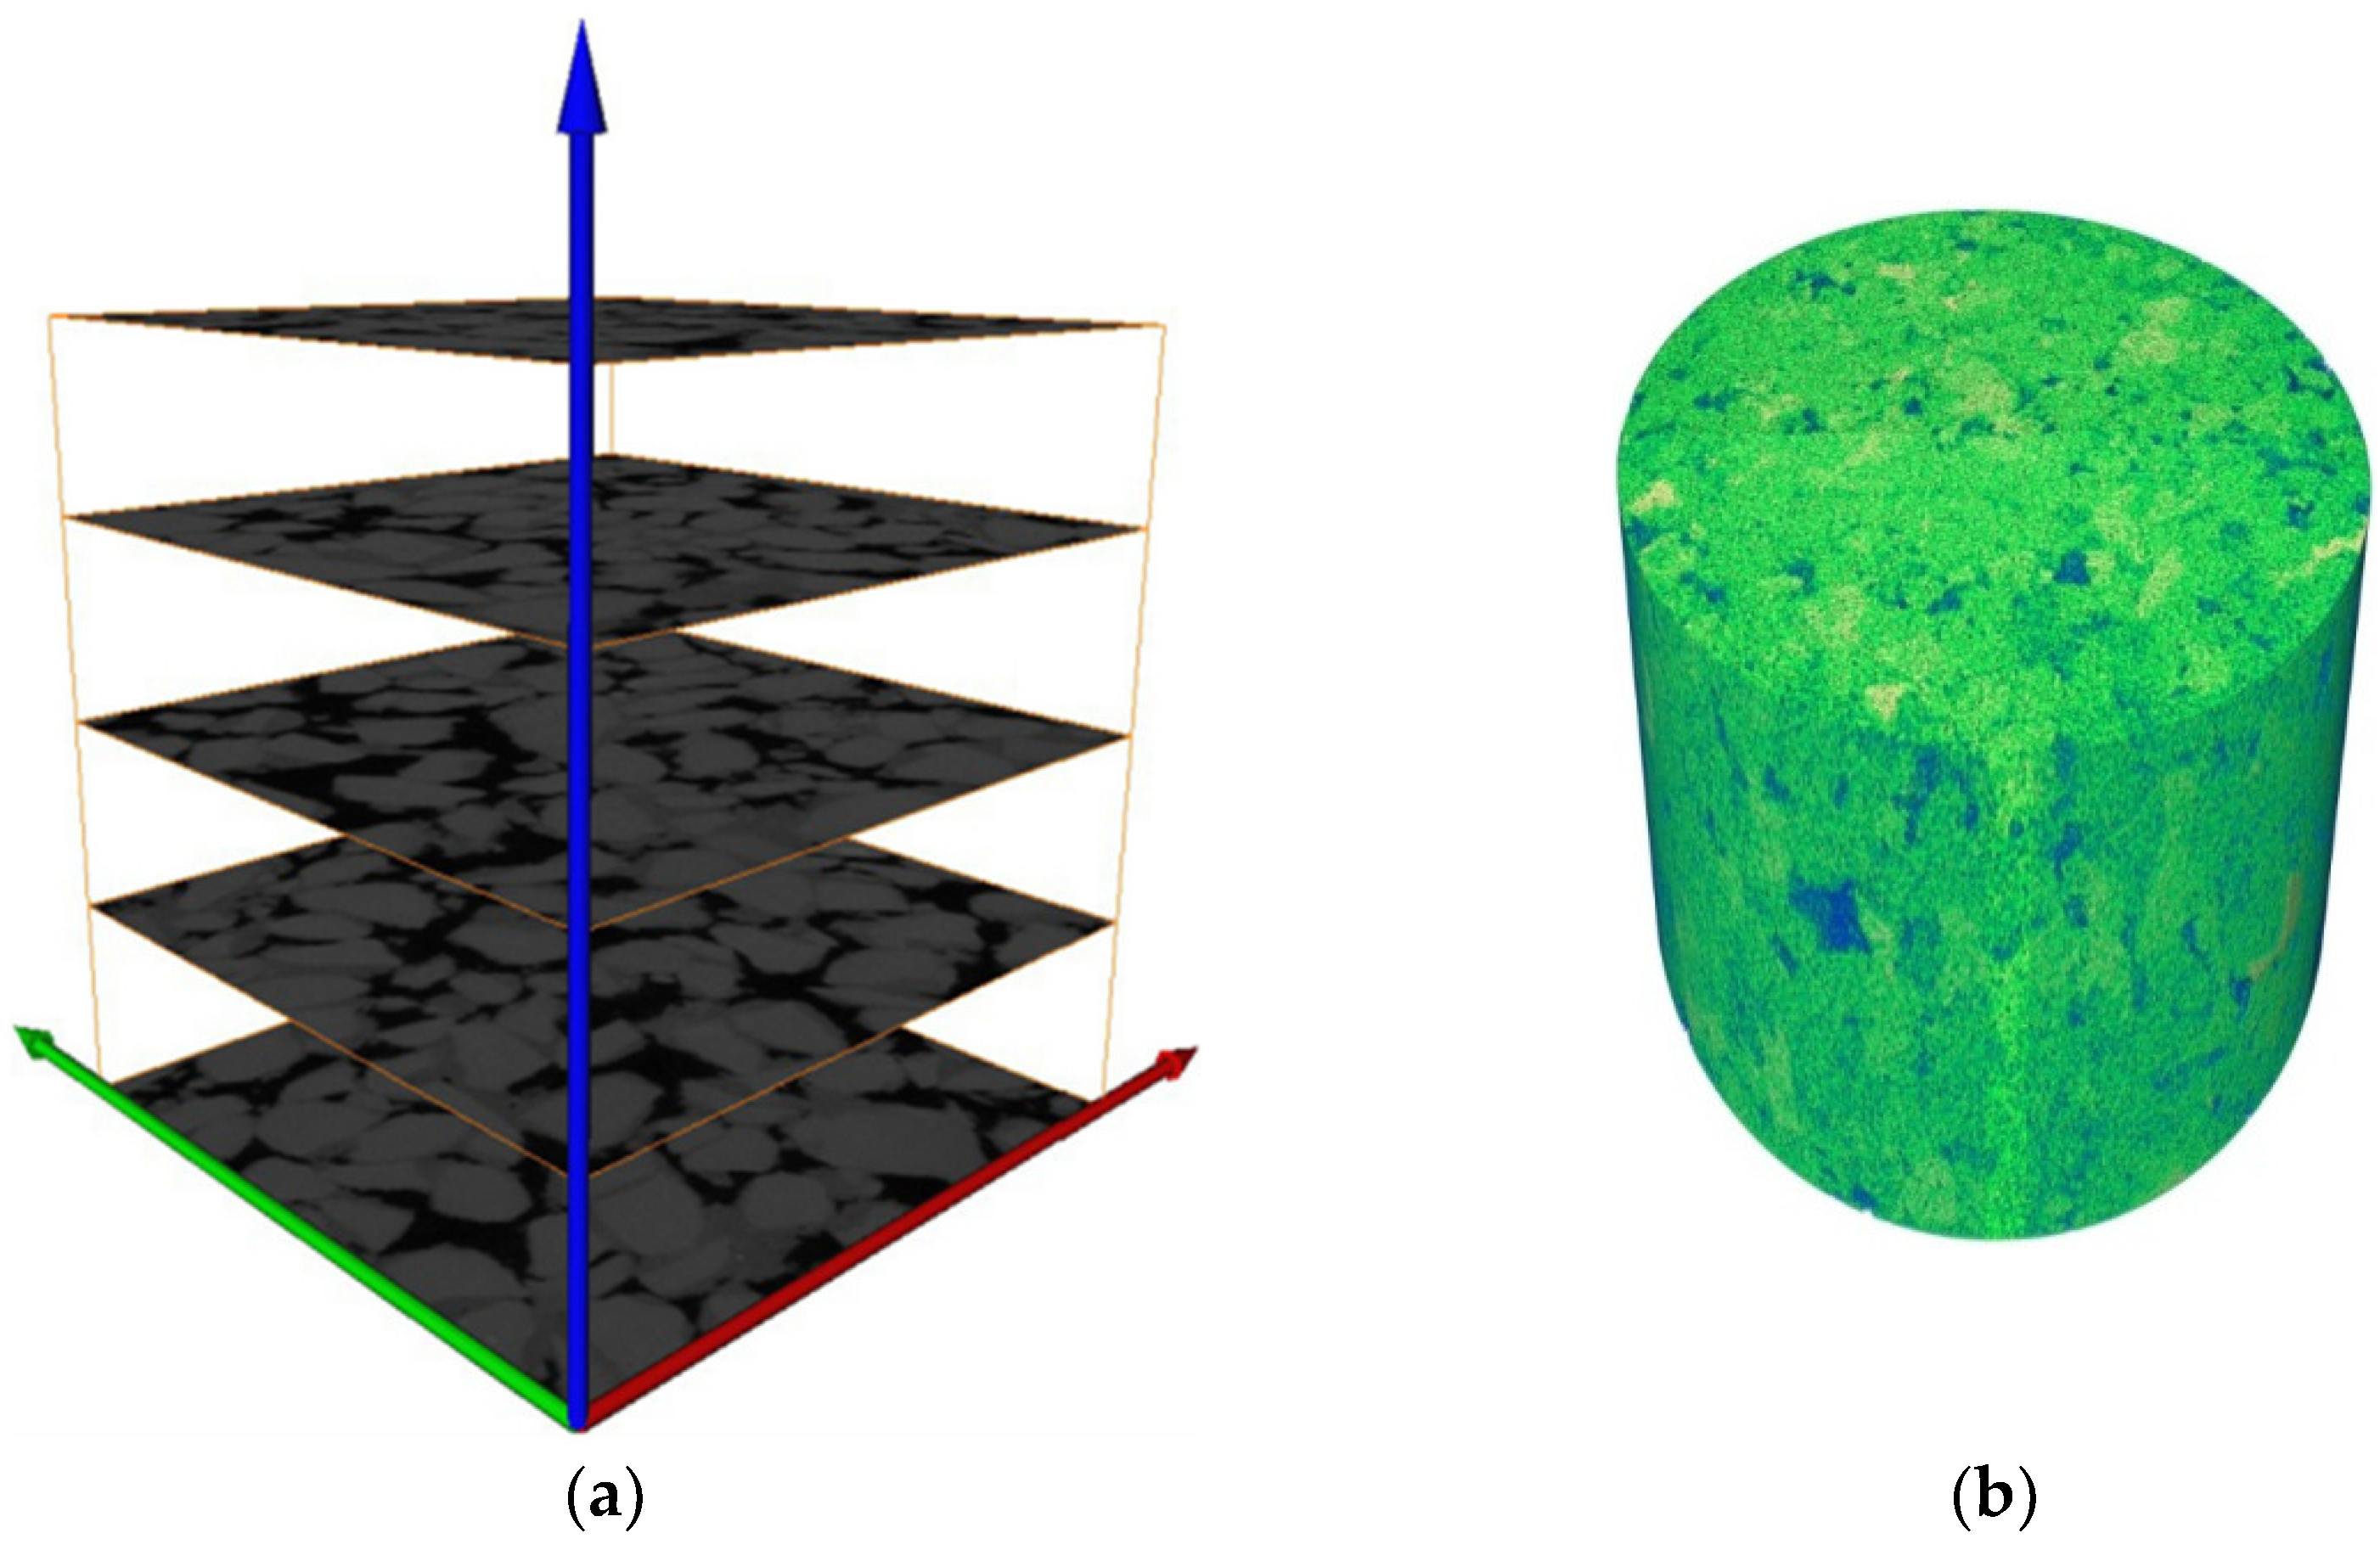
A three-dimensional, digital core model of rock pores is reconstructed, that is, the continuous, two-dimensional, CT data scanned by Avizo software are superimposed, and the pixels are connected to form a three-dimensional data volume, as shown in Figure 3. Next, the three-dimensional data volume is visualized. A flow chart of the reconstruction of a three-dimensional digital core model from the two-dimensional gray image data of the CT scan is shown in Figure 4.
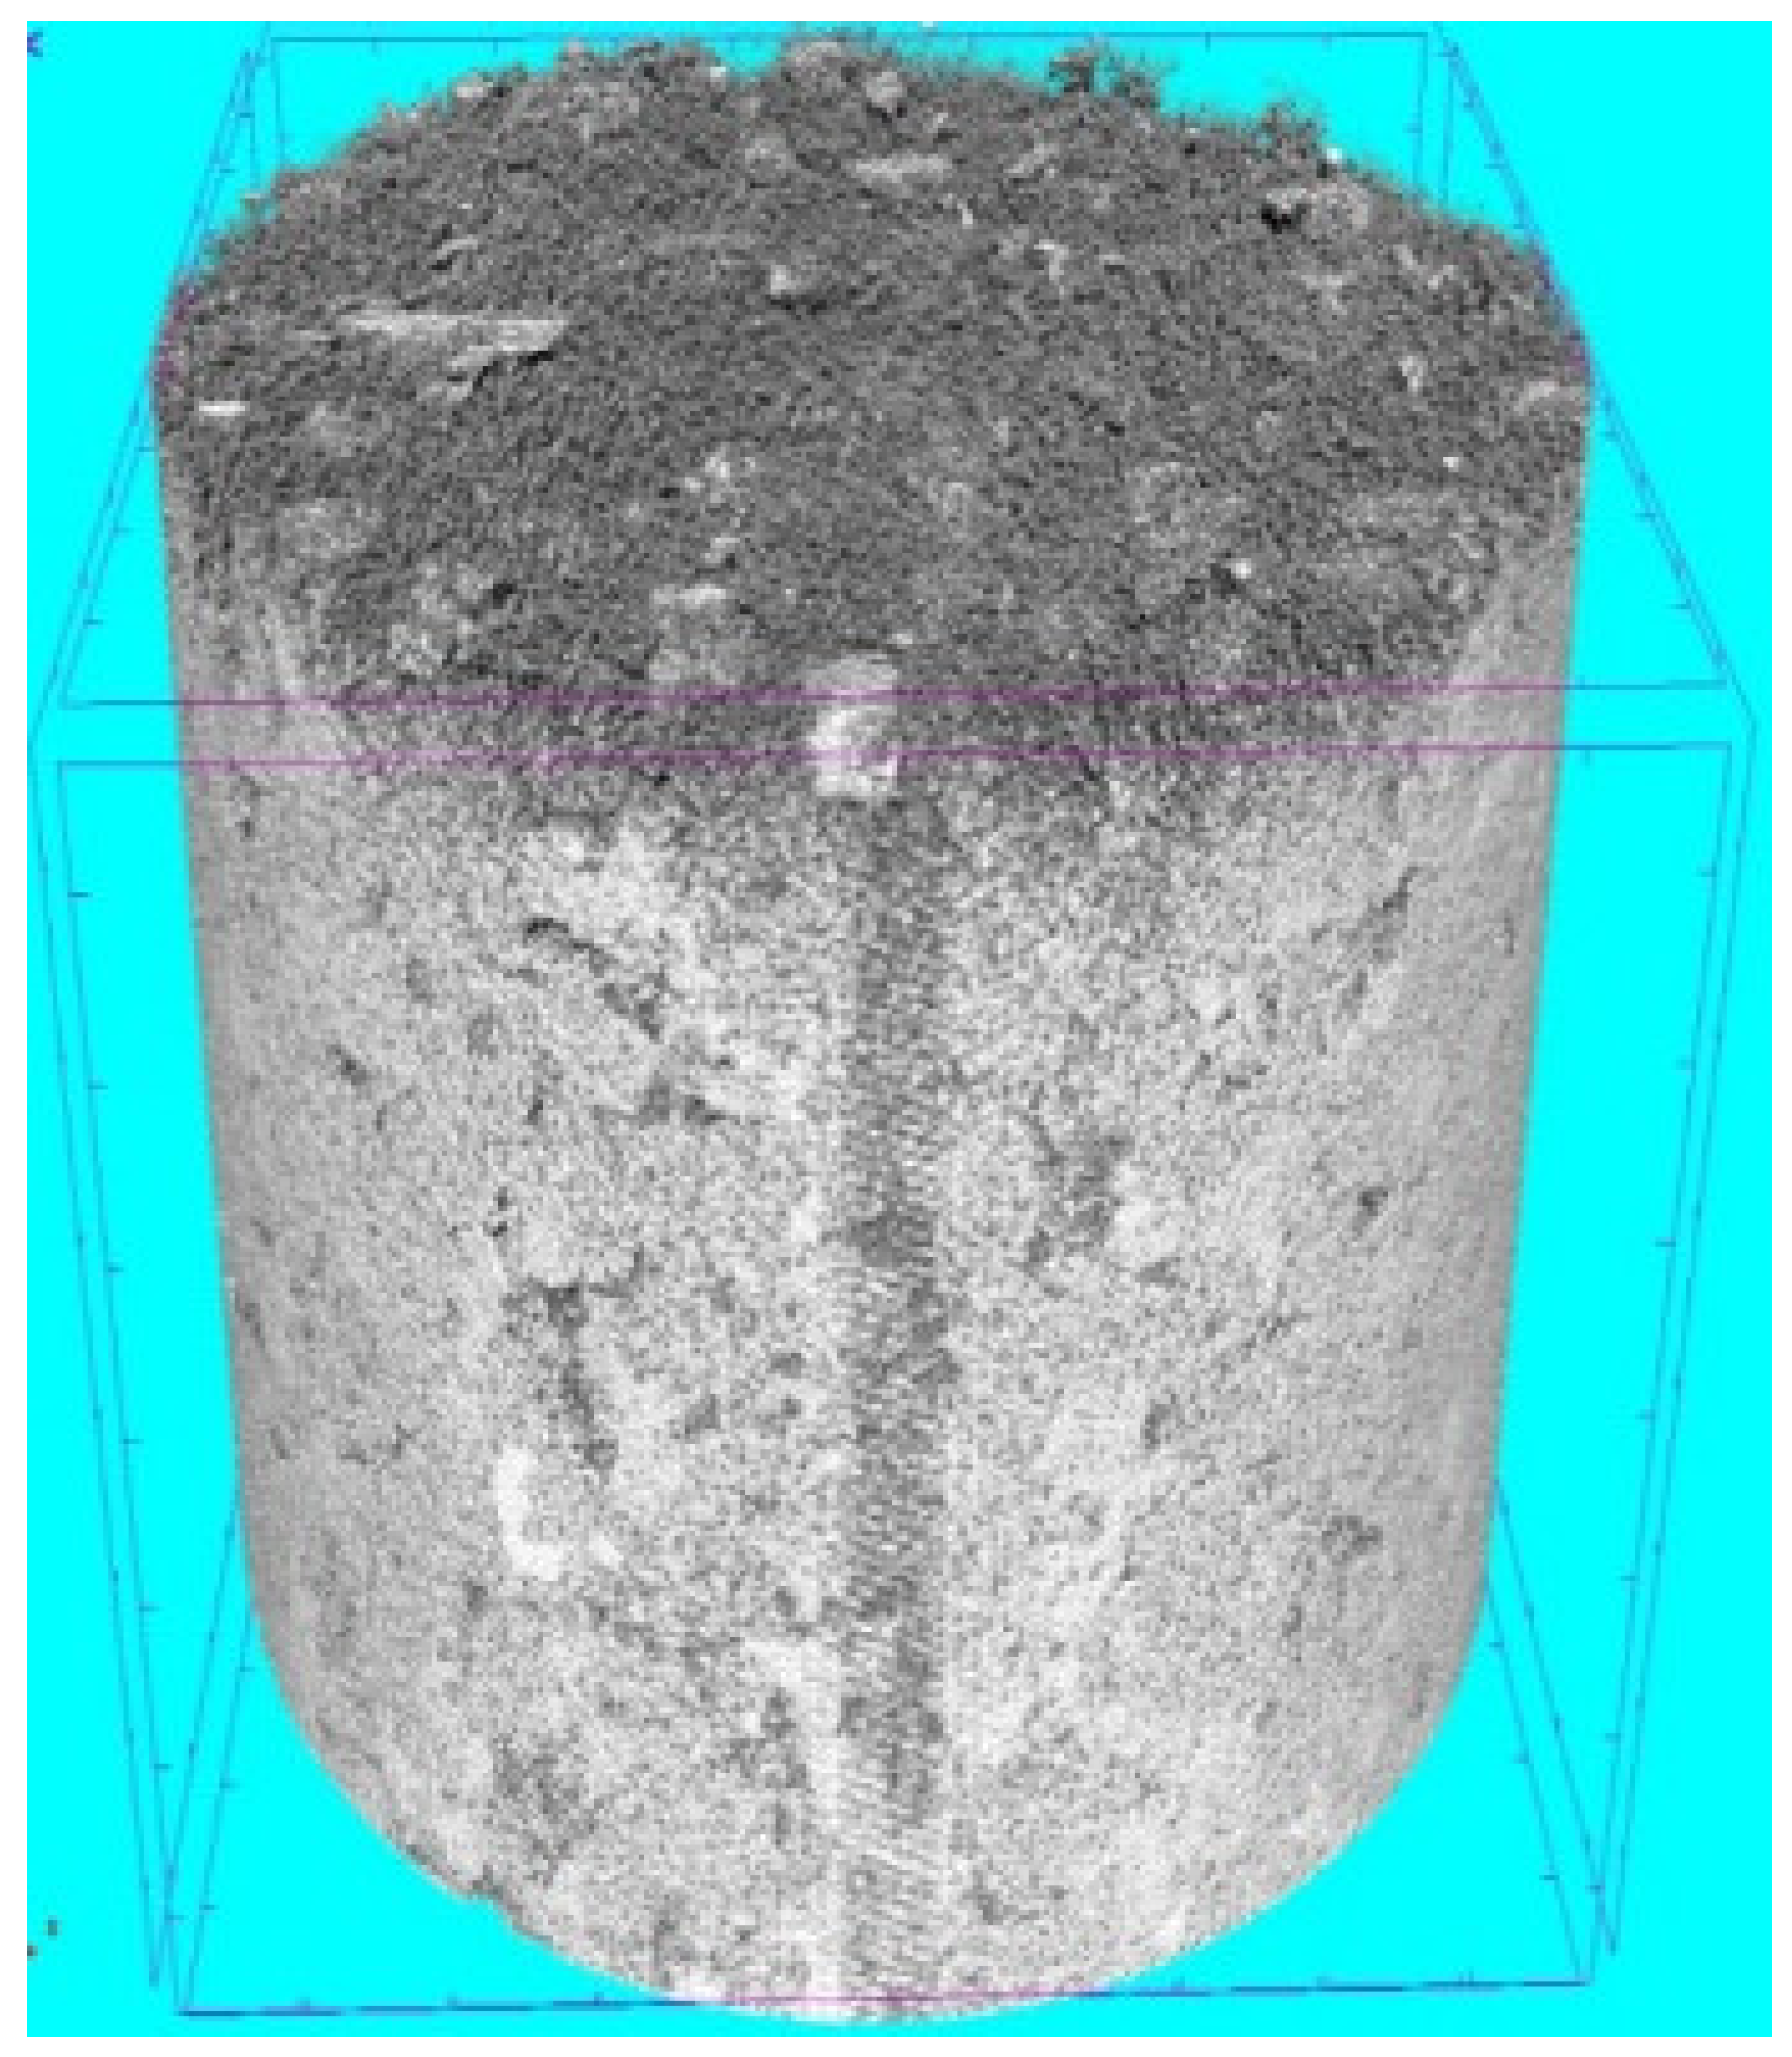
A three-dimensional digital core is created, as shown in Figure 5.
3. Numerical Simulation of Micro Seepage in Rock under Different Conditions
Water was adopted as the medium to simulate unidirectional seepage flow. The FEM and FCM, combined with ANSYS software, were utilized to explore the internal flow of the pore structure at the microscale under different conditions.
3.1. Setting of Boundary Conditions and Assumptions
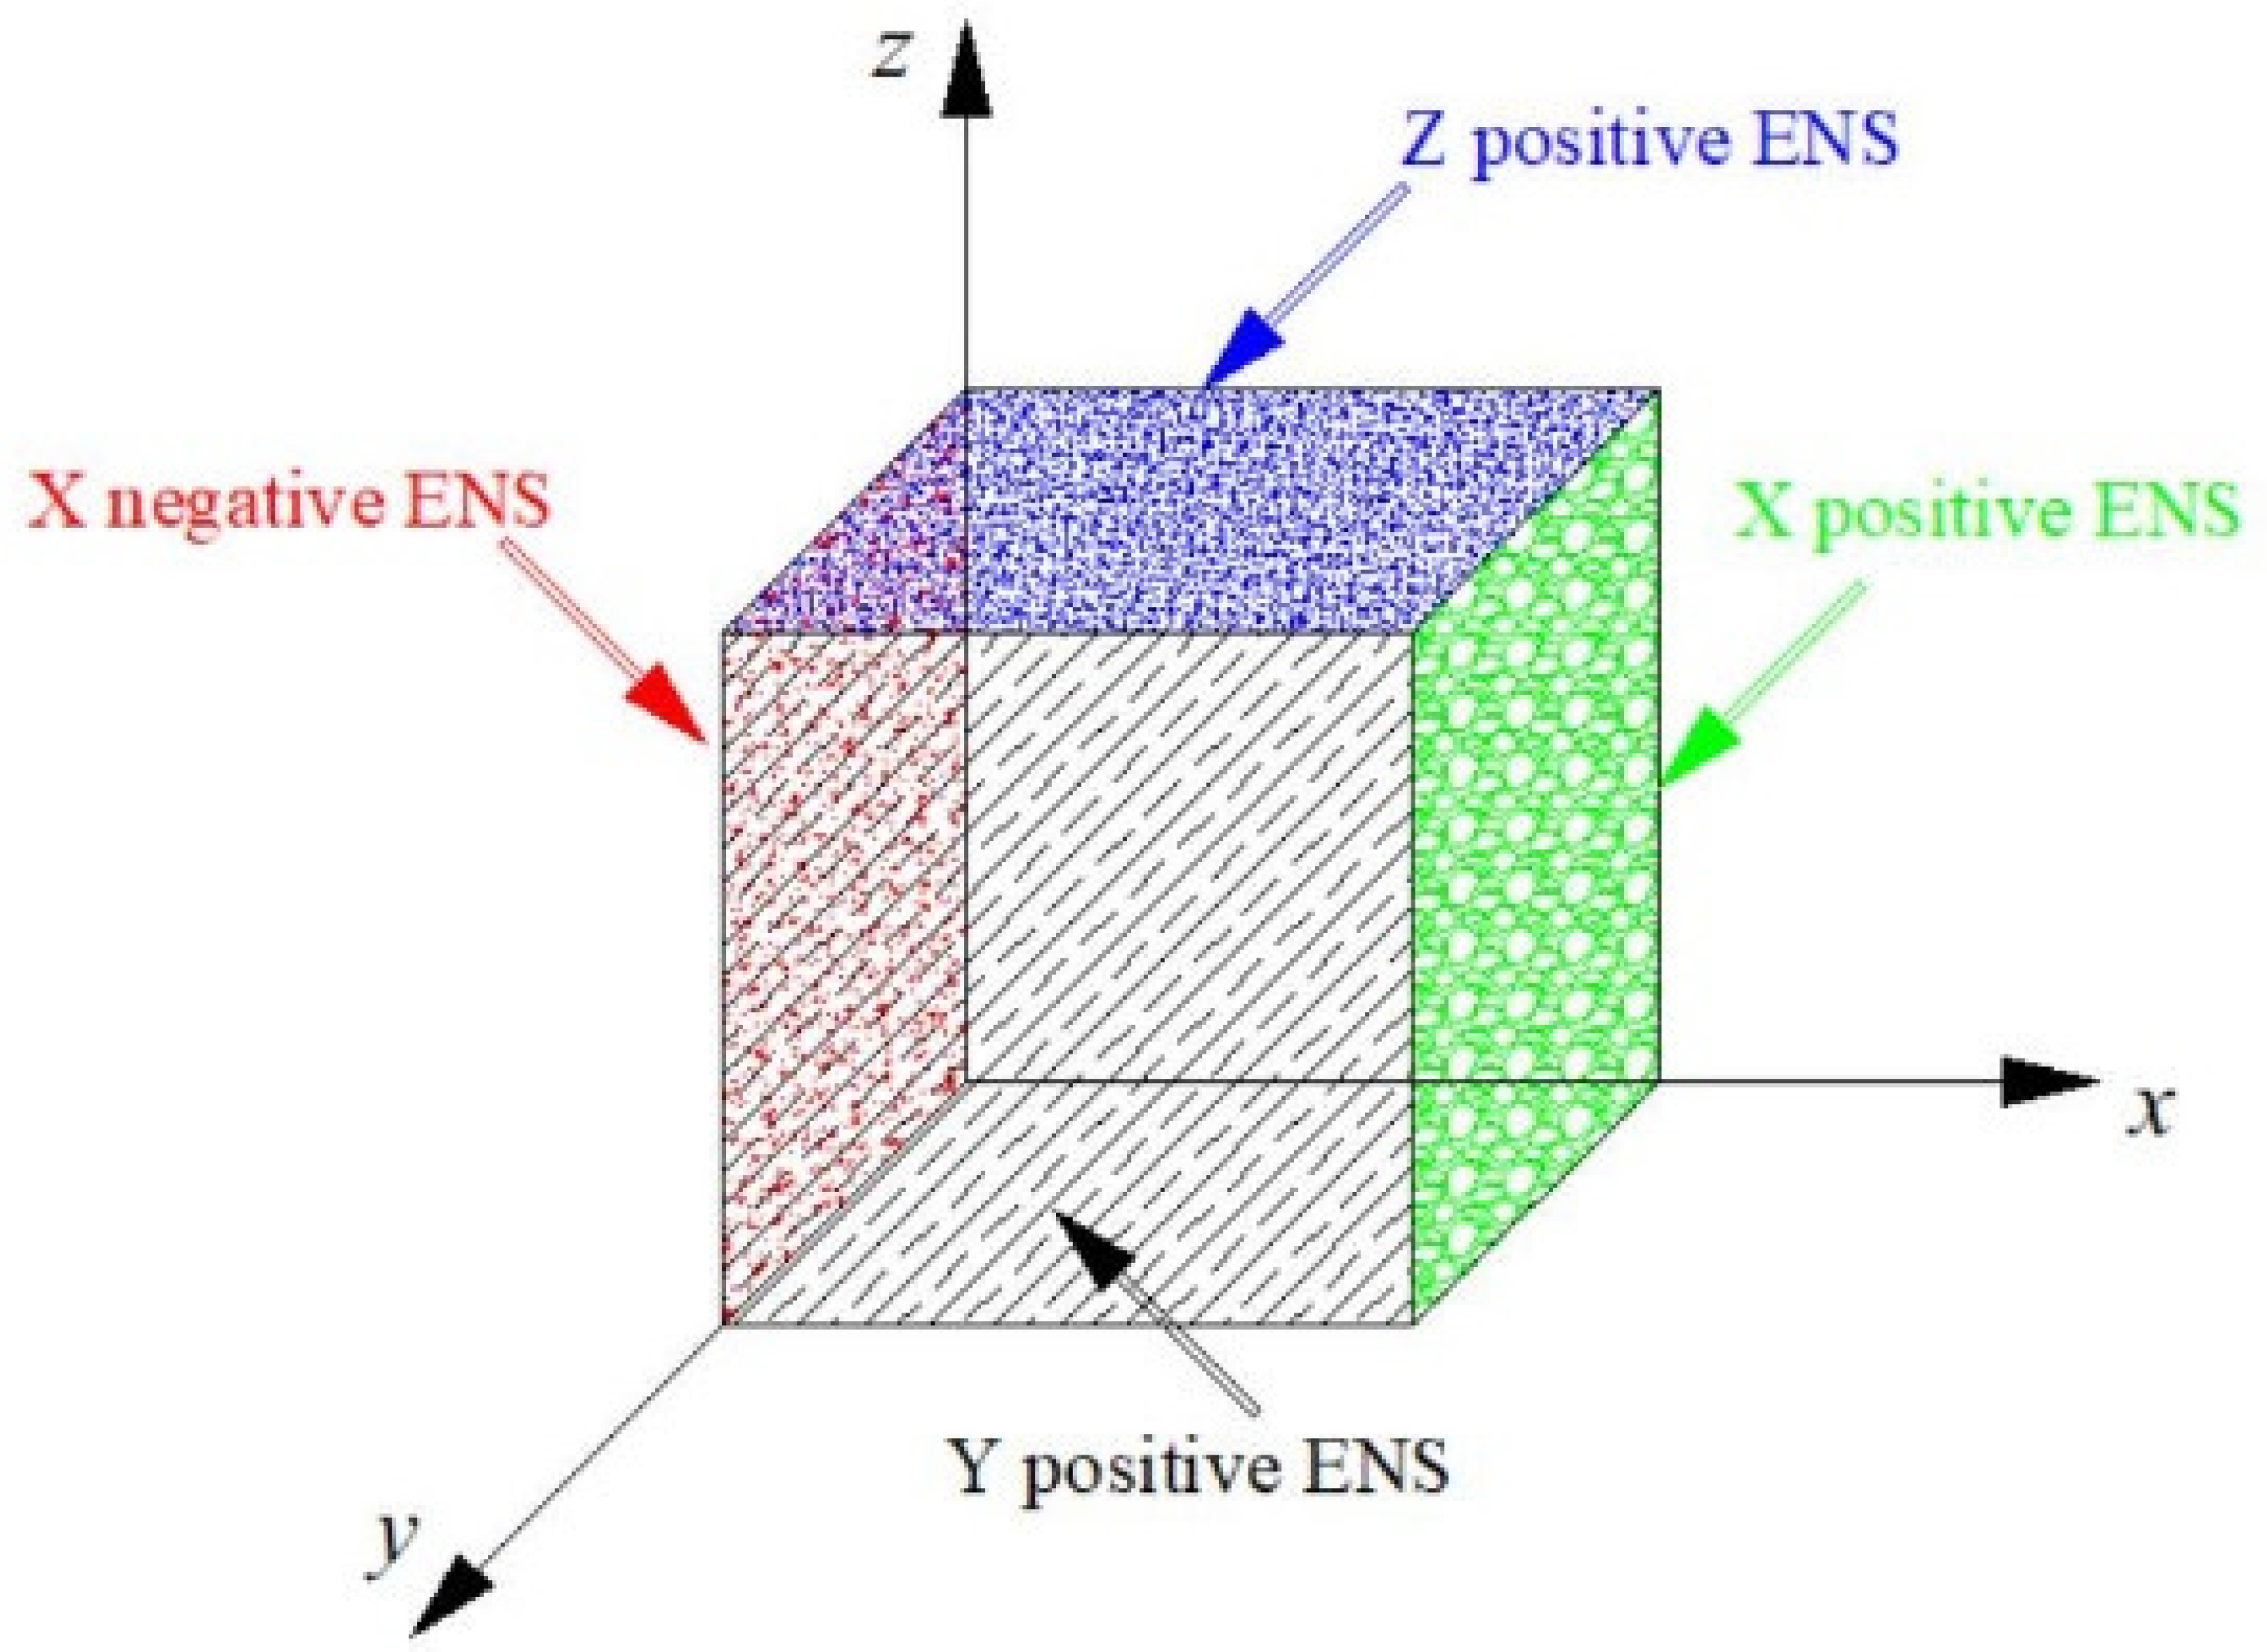
This study is based on the conventional three-dimensional microscopic seepage research method, and does not consider the influence of the pore shape and seepage effect by the change in confining pressure. The entrance surface (ENS), exit surface (EXS), and wall surface (WS) is set to have no slip boundary and no confining pressure influence. A schematic diagram of the different EXSs of the model is shown in Figure 6. The fluid medium adopted in this research is water, and the material properties are set to room temperature. The direction of gravity is always along the positive direction of the pressure difference. The entrance pressures (ENP) are selected as 1 MPa, 3 MPa, 5 MPa, 7 MPa, 9 MPa, 11 MPa, 13 MPa, and 15 MPa, respectively. The various parameters, such as the overall pressure field and velocity field of the seepage model, the pressure, velocity and mass flow rate of each section in the model are analyzed and studied. In this study, different sizes were selected for several studies, and the appropriate unit size of 400 μm was finally selected.
To simplify the simulation and analysis process, the following assumptions are made:
- (1)
- Water only flows in the pores of the rock mass and will not penetrate the rock matrix.
- (2)
- Water is a continuously flowing incompressible fluid, and its temperature is constant during the process of pore flow.
- (3)
- Water is only affected by gravity and pressure.
For practical purposes, some assumptions need to be made. For example being a liquid when flowing is considered an incompressible fluid. While this is not entirely true, since the change is so small, this issue is ignored for better computational research.
3.2. Unidirectional Seepage Simulation of Pore Model under Different Pressures
To explore the unidirectional seepage simulation of the pore model under different pressures, the seepage of the pore model under different ENPs in the X direction is selected as an example. Under the same conditions of the other parameters, the ENPs are 1 MPa (a), 3 MPa (b), 5 MPa (c), 7 MPa (d), 9 MPa (e), 11 MPa (f), 13 MPa (g), and 15 MPa (h). The exit pressure (EXP) is 0 MPa
Figure 7 shows that the pressure change trend of the seepage model under different ENPs is similar, that is, it gradually decreases from the ENS to the EXS. The difference is that the overall pressure reduction rate of the model differs. The overall pressure distribution is gradually transmitted from the X positive ENS and gradually decreases, showing a consistent law as a whole. When the ENP continues to increase, the increase in the high-pressure part and the decrease in the low-pressure part are not obvious. Along the seepage direction of the water flow channel, the overall pressure of the model gradually decreases. In the area where the radius of the pore channel suddenly changes, the pressure changes are relatively large, and the pressure value presents a law of first decreasing and then increasing. In the area where the radius of the pore channel exhibits few changes, the pressure change is relatively small, and there is a steep pressure drop in the corner of the model. The water flow selects a smoother area to pass, and there is minimal water flow in the corner part, which is also confirmed in the streamline diagram of the seepage velocity distribution (Figure 8). Based on the appearance, the overall pressure distribution is uneven, and the high pressure and low pressure areas are staggered, which indicates that the pore structure of the rock is unevenly distributed in space.
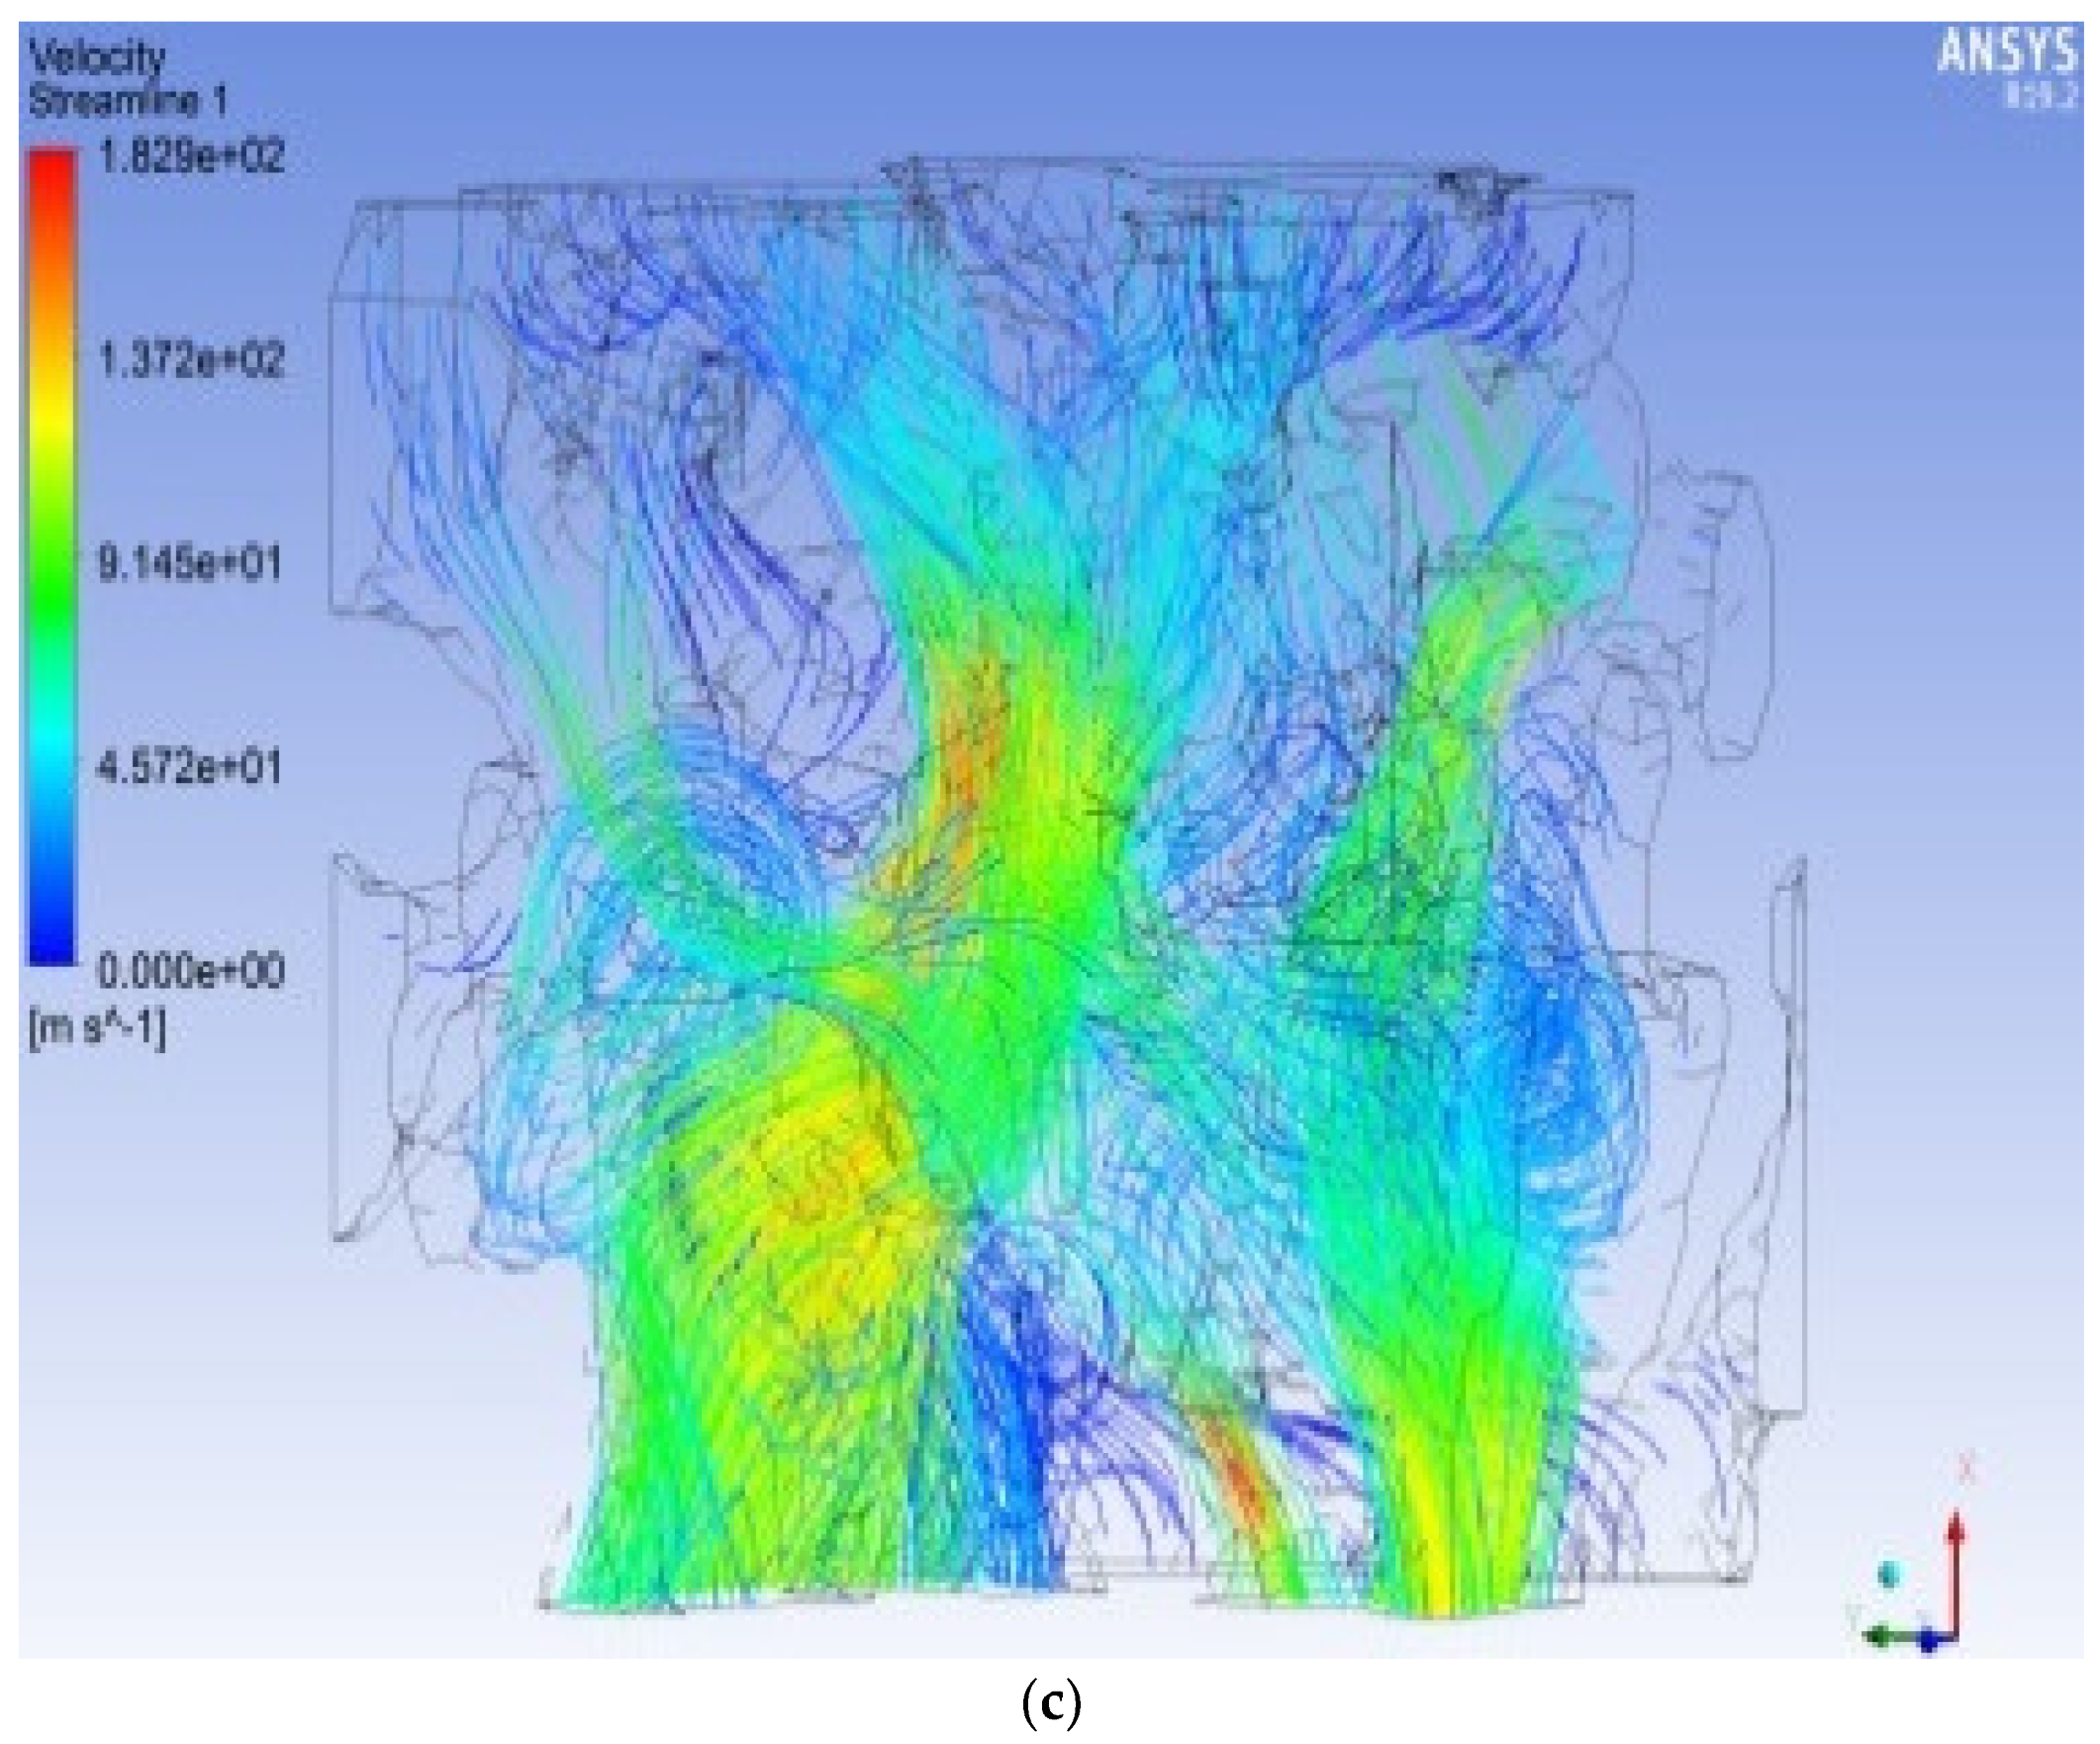
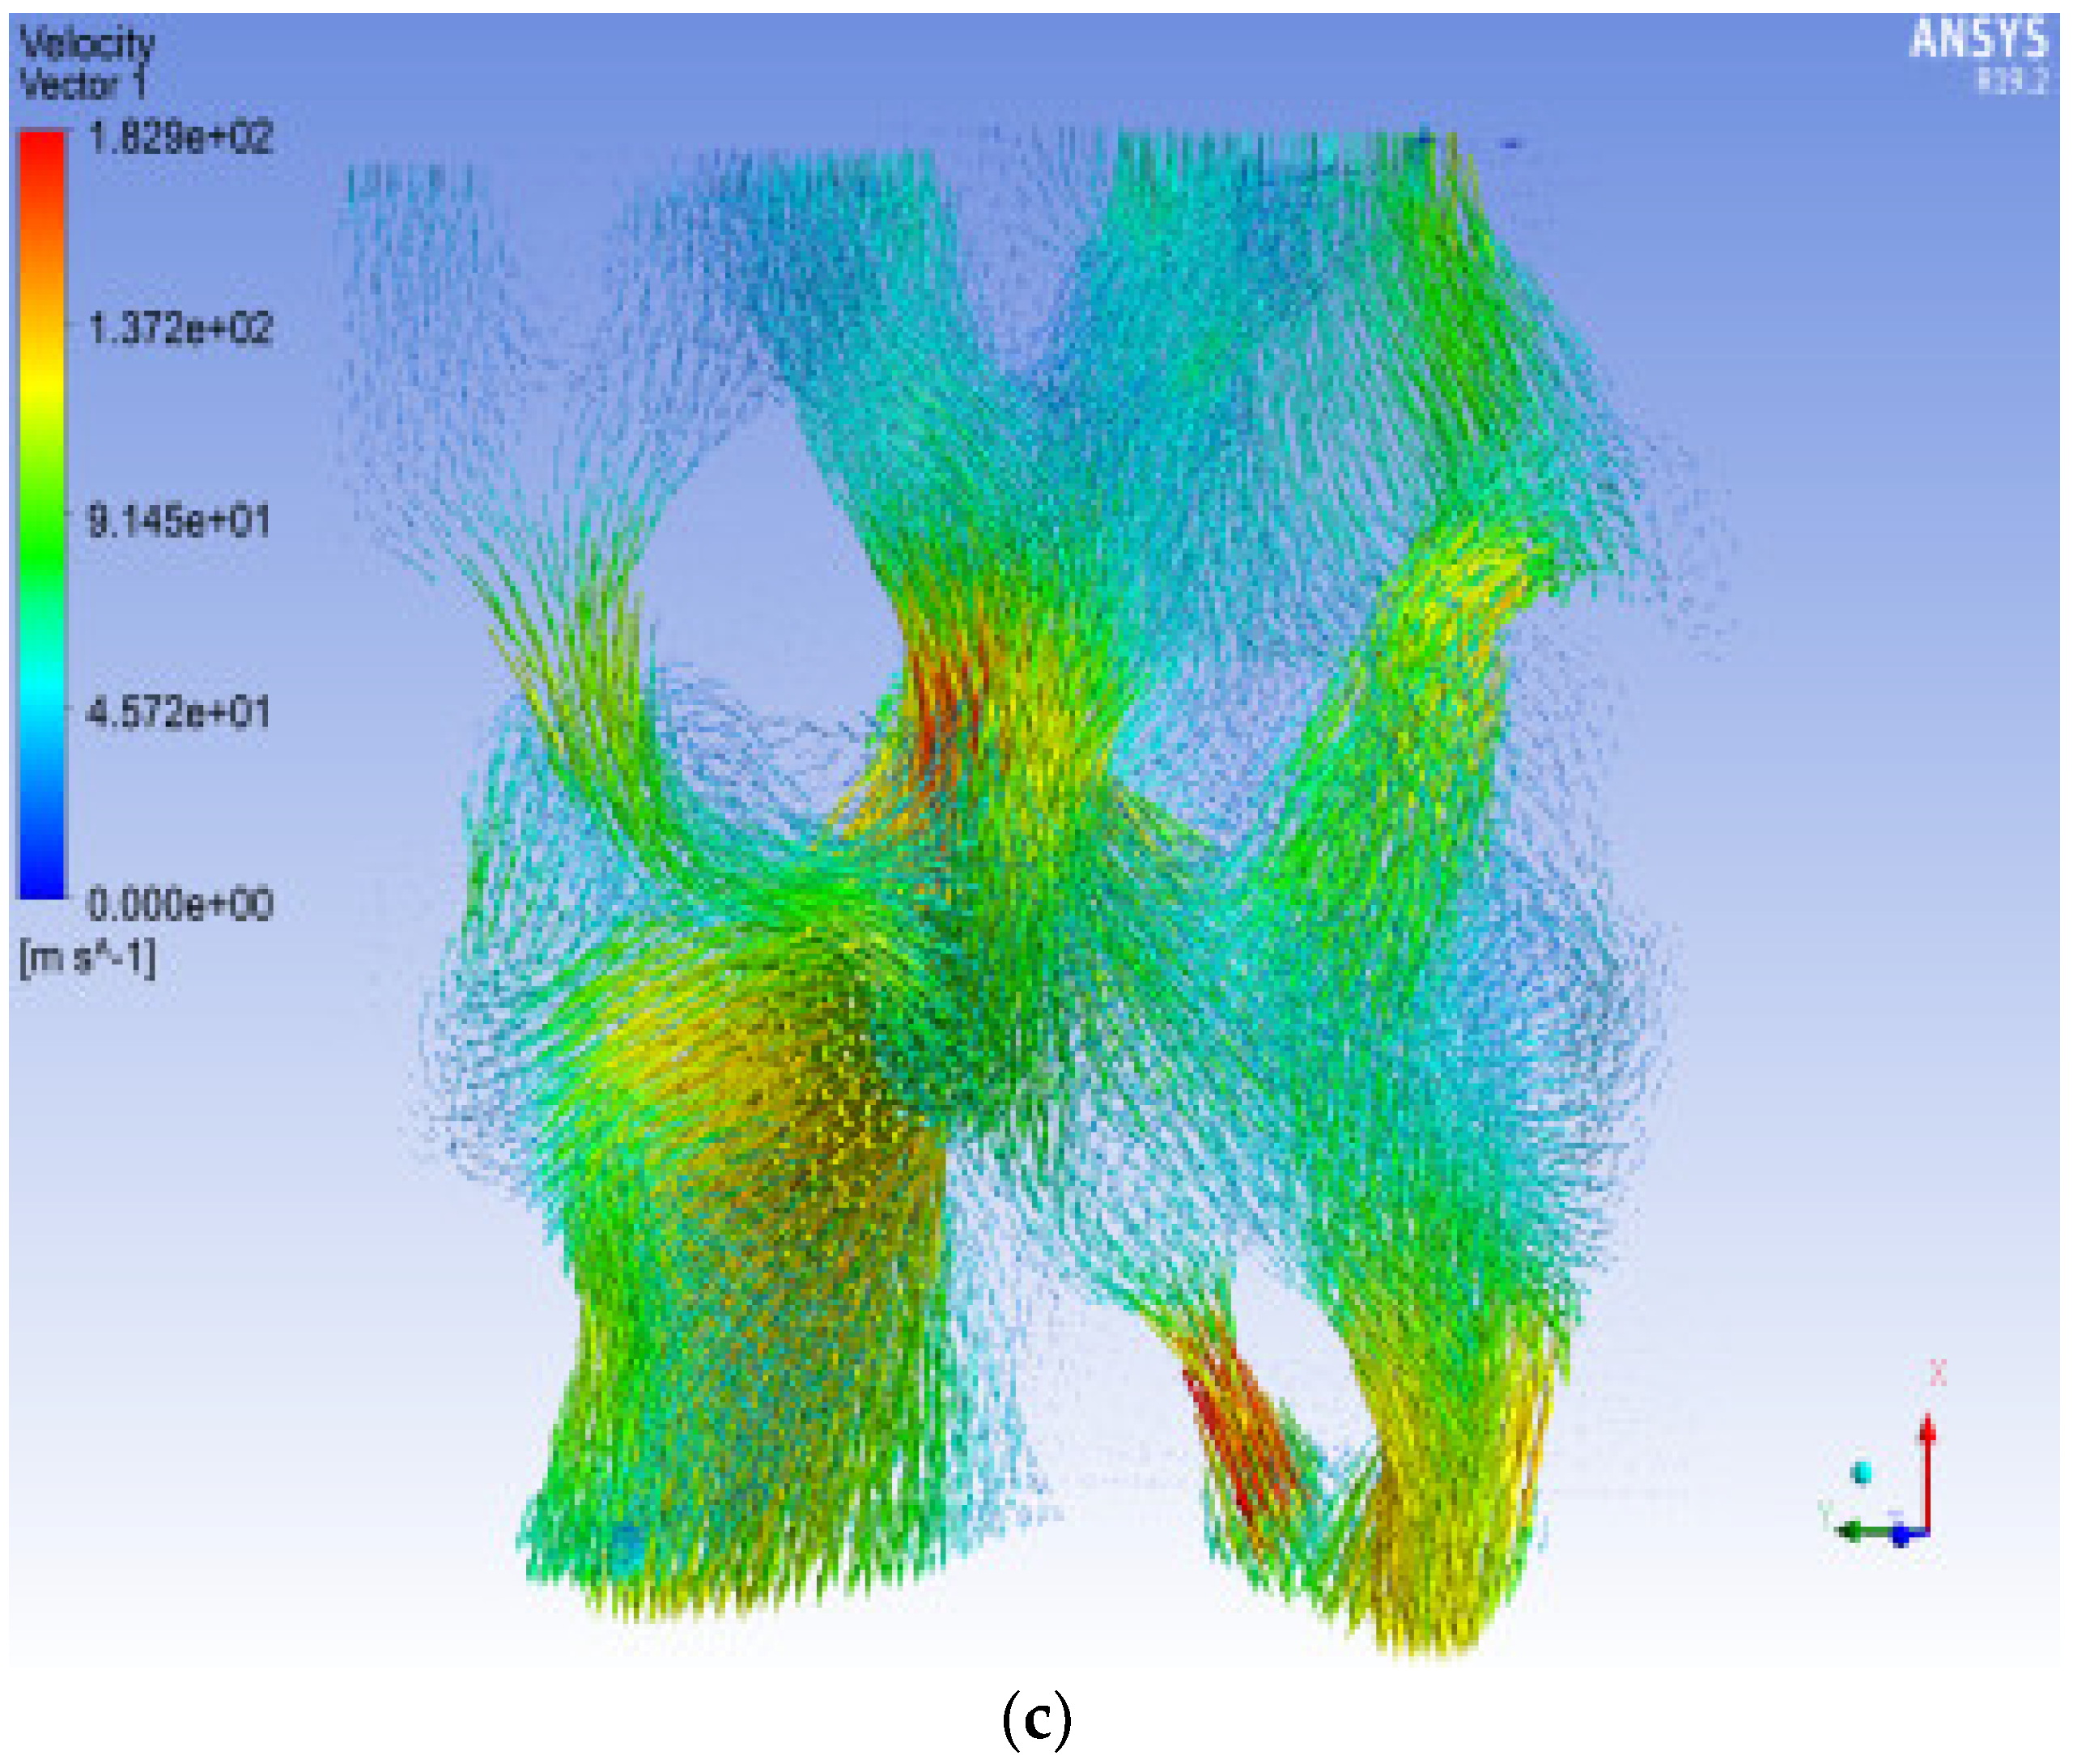
Figure 8 and Figure 9 show that the flow diagram of the seepage velocity distribution and the vector diagram of the seepage velocity intuitively reflect the distribution of the fluid inside the pores. It can be seen that the pores with larger radii are the main streamline area. The dark blue streamline is a streamline with a velocity of basically zero, indicating that there is basically no water flowing through this area. These areas are generally the corners of the model, and the sparse streamlines of these corners are attributed to the residual broken ends formed after the pores are bifurcated or turned. A comparison of the distribution of seepage streamlines under different ENPs reveals that as the ENPs increase, the seepage velocity increases, that the seepage path does not change much, and that the fluid seepage path is still concentrated in the pore channel with a larger radius.
The overall seepage velocity of the same model has the following laws: The velocity in the middle area of the pore model is higher. In addition, during the process of water flow along the pore channel, the flow rate decreases and flow rate increases will continuously alternate, which also reflects the complexity of the pore structure. The change in ENP did not significantly change the path of seepage. A comparison of Figure 8 and Figure 9 shows that the center seepage of the same seepage channel has a greater velocity.
3.3. Simulation Study of Positive Single Channel Seepage Flow
Positive single channel seepage flow refers to a single fluid seepage from the default positive direction.
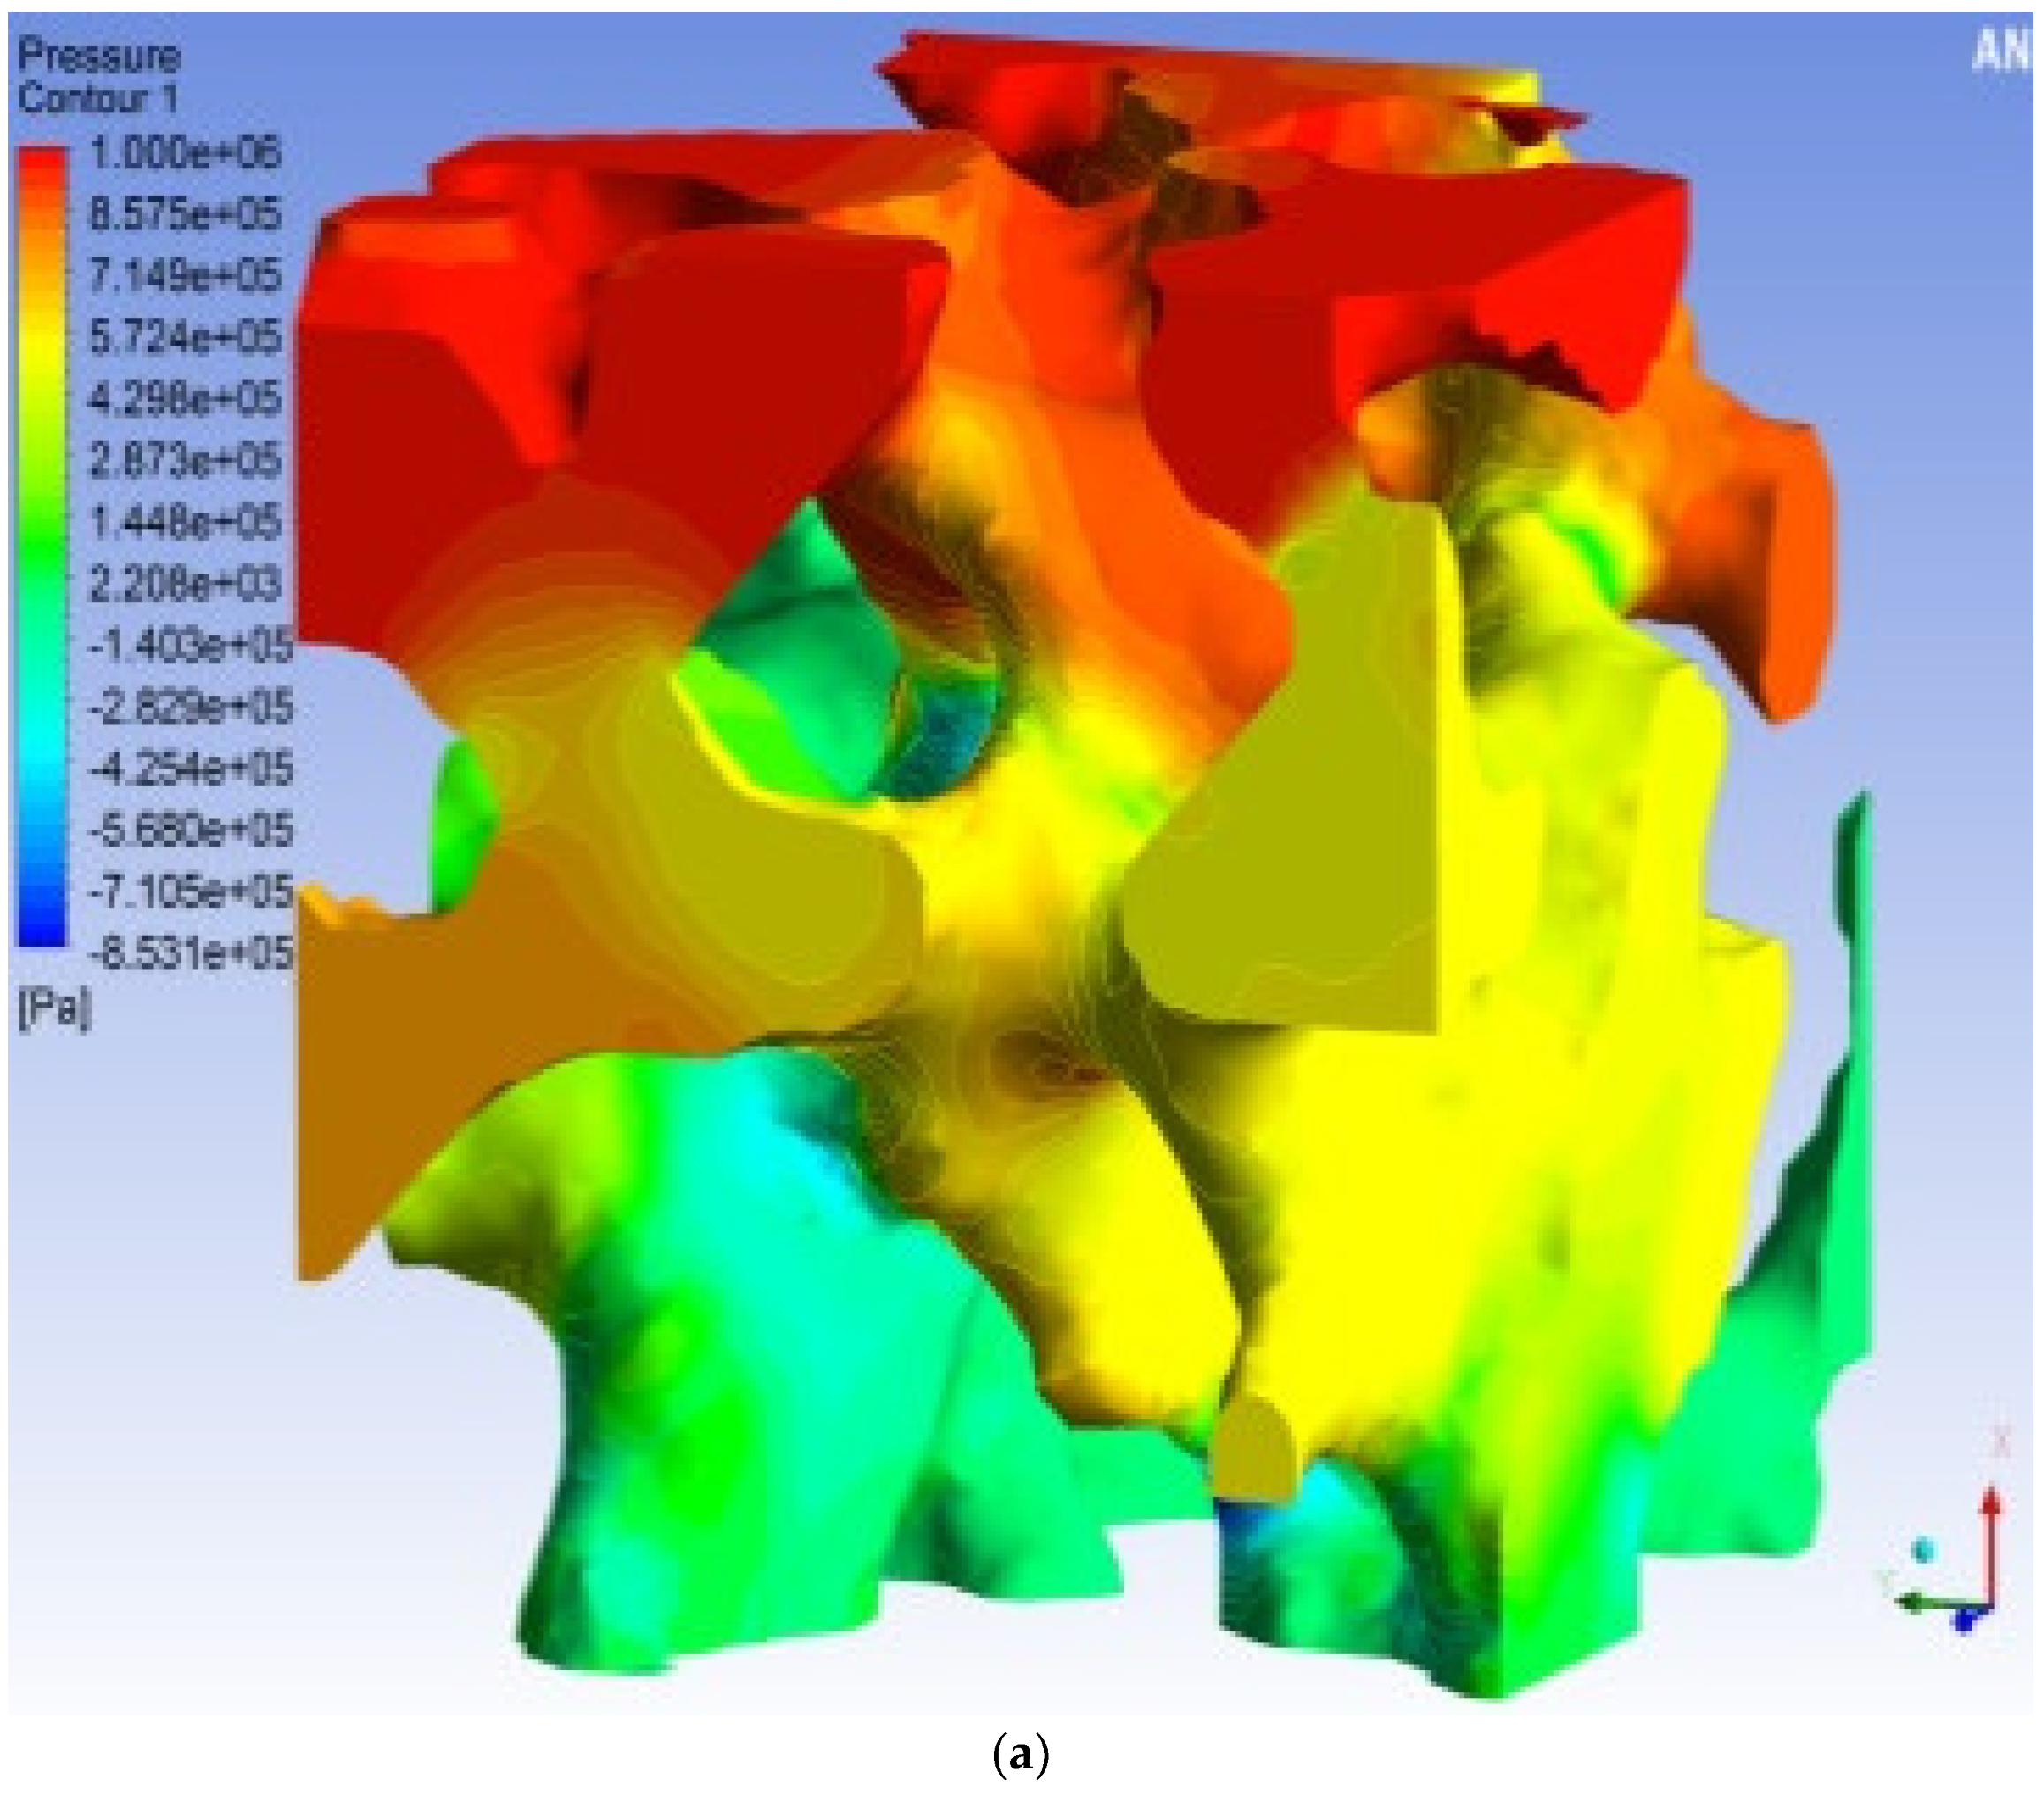
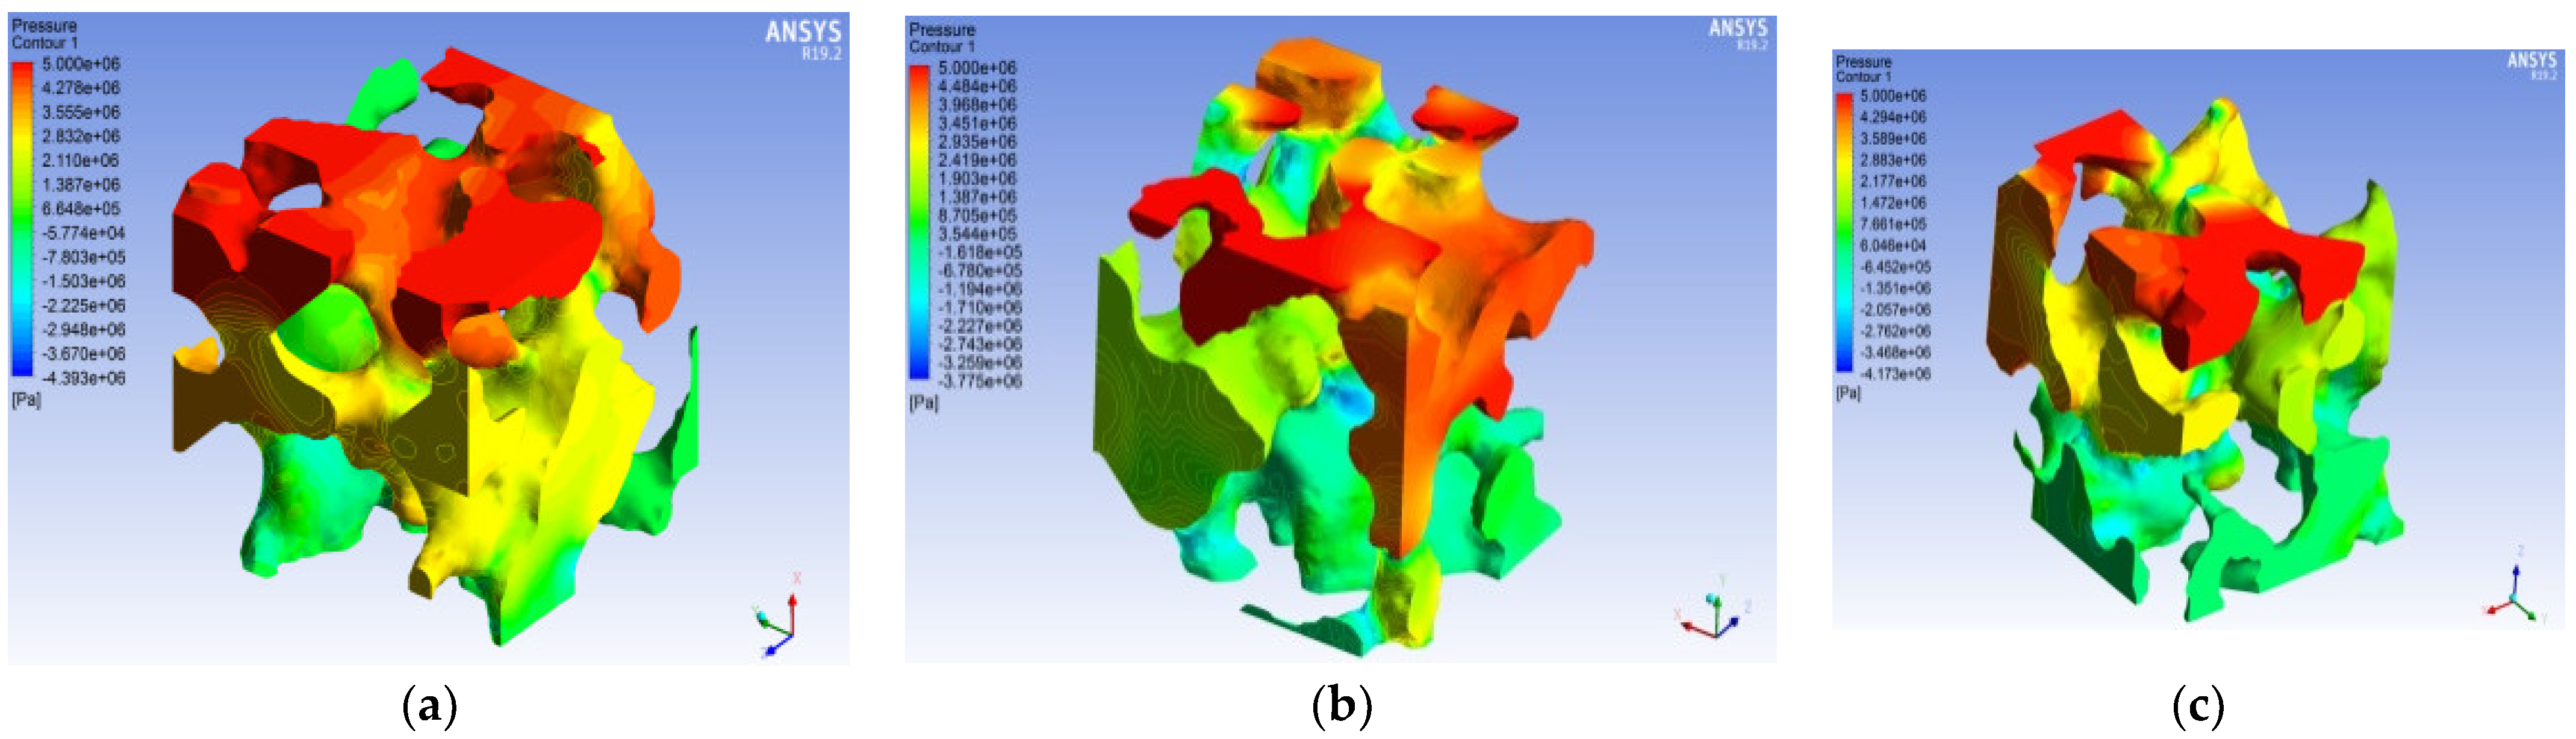
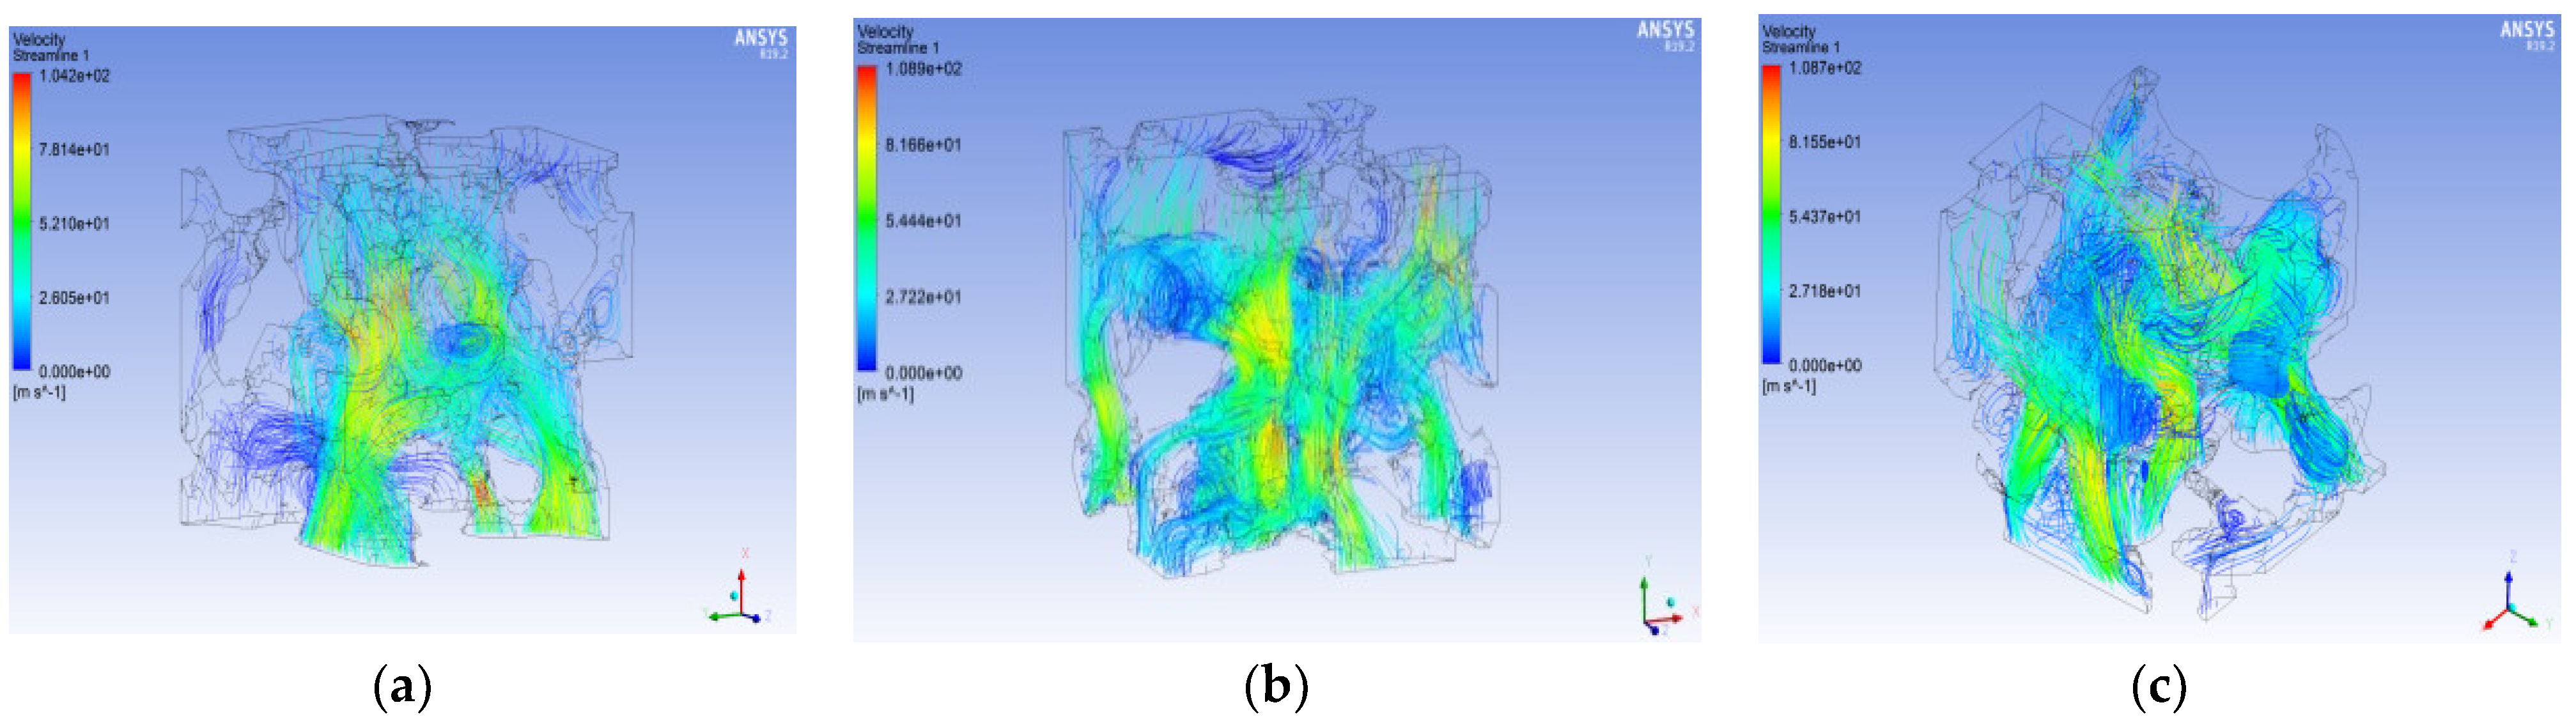
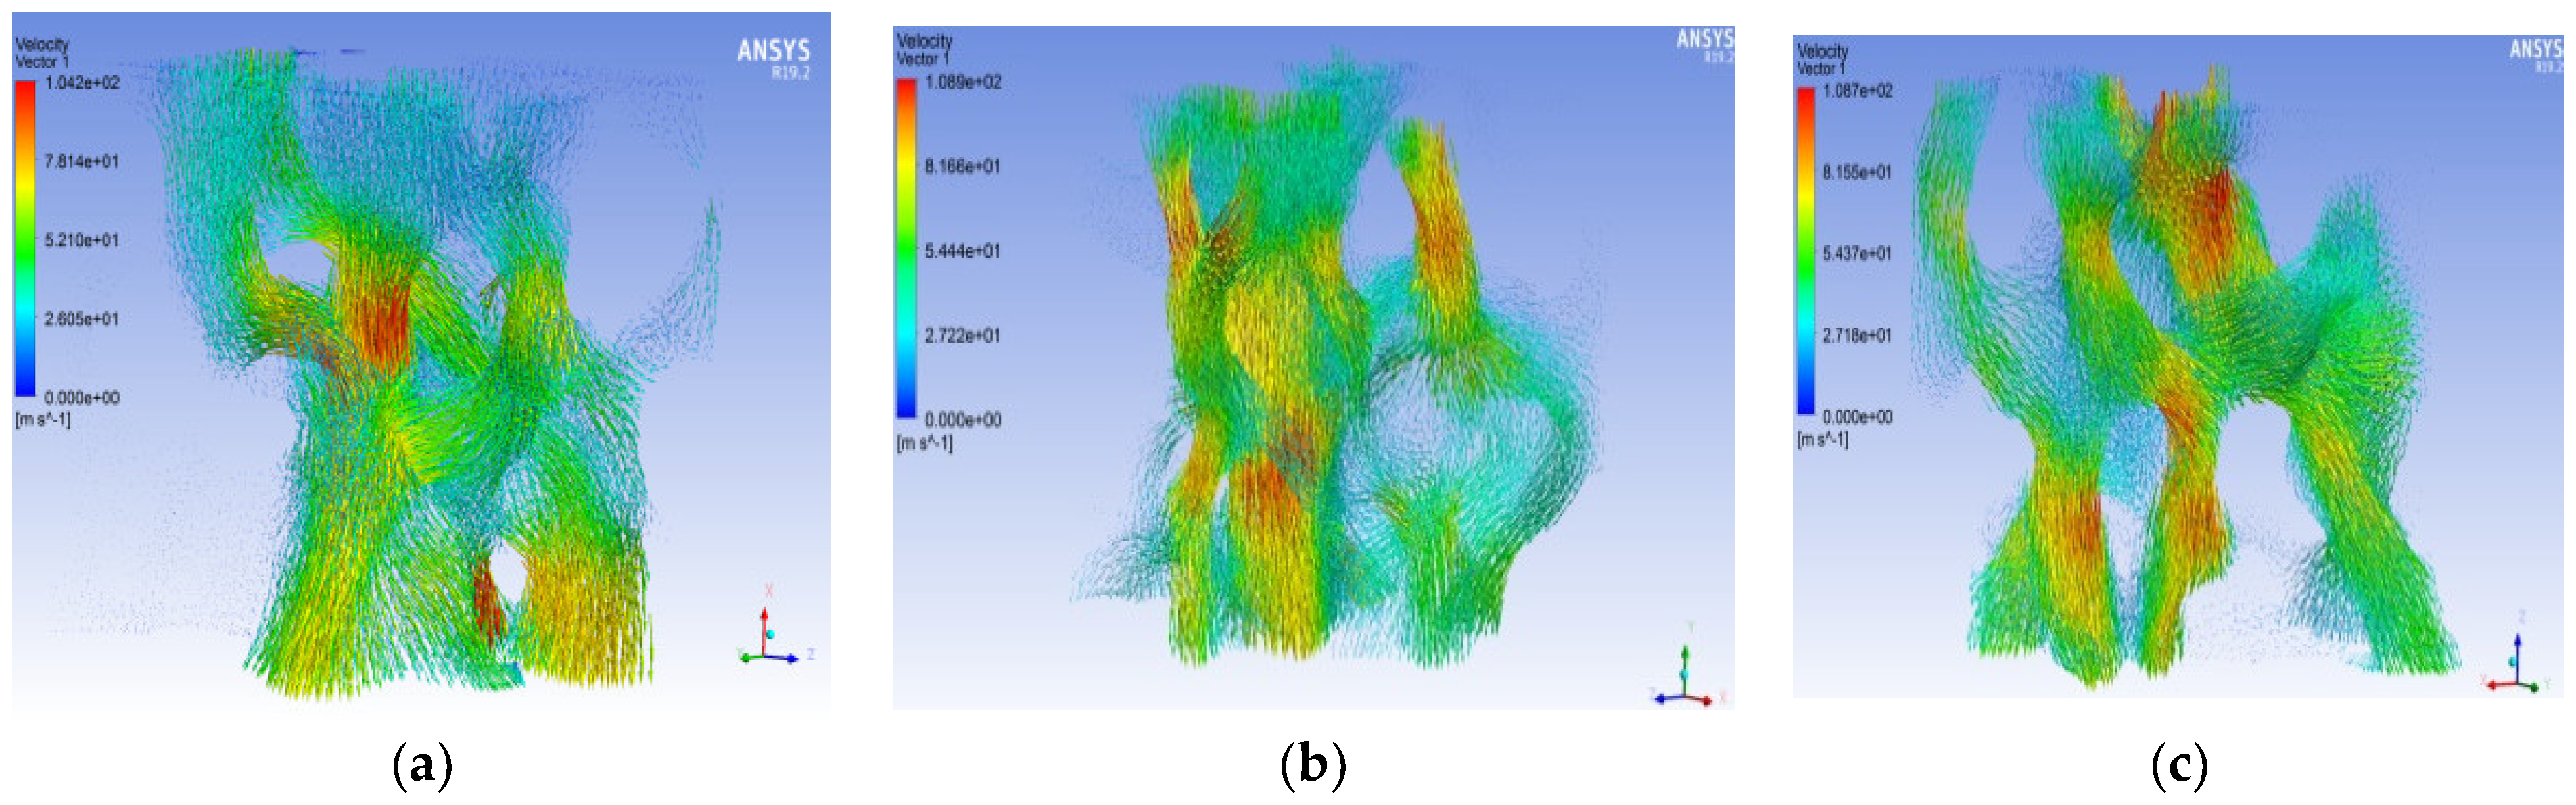
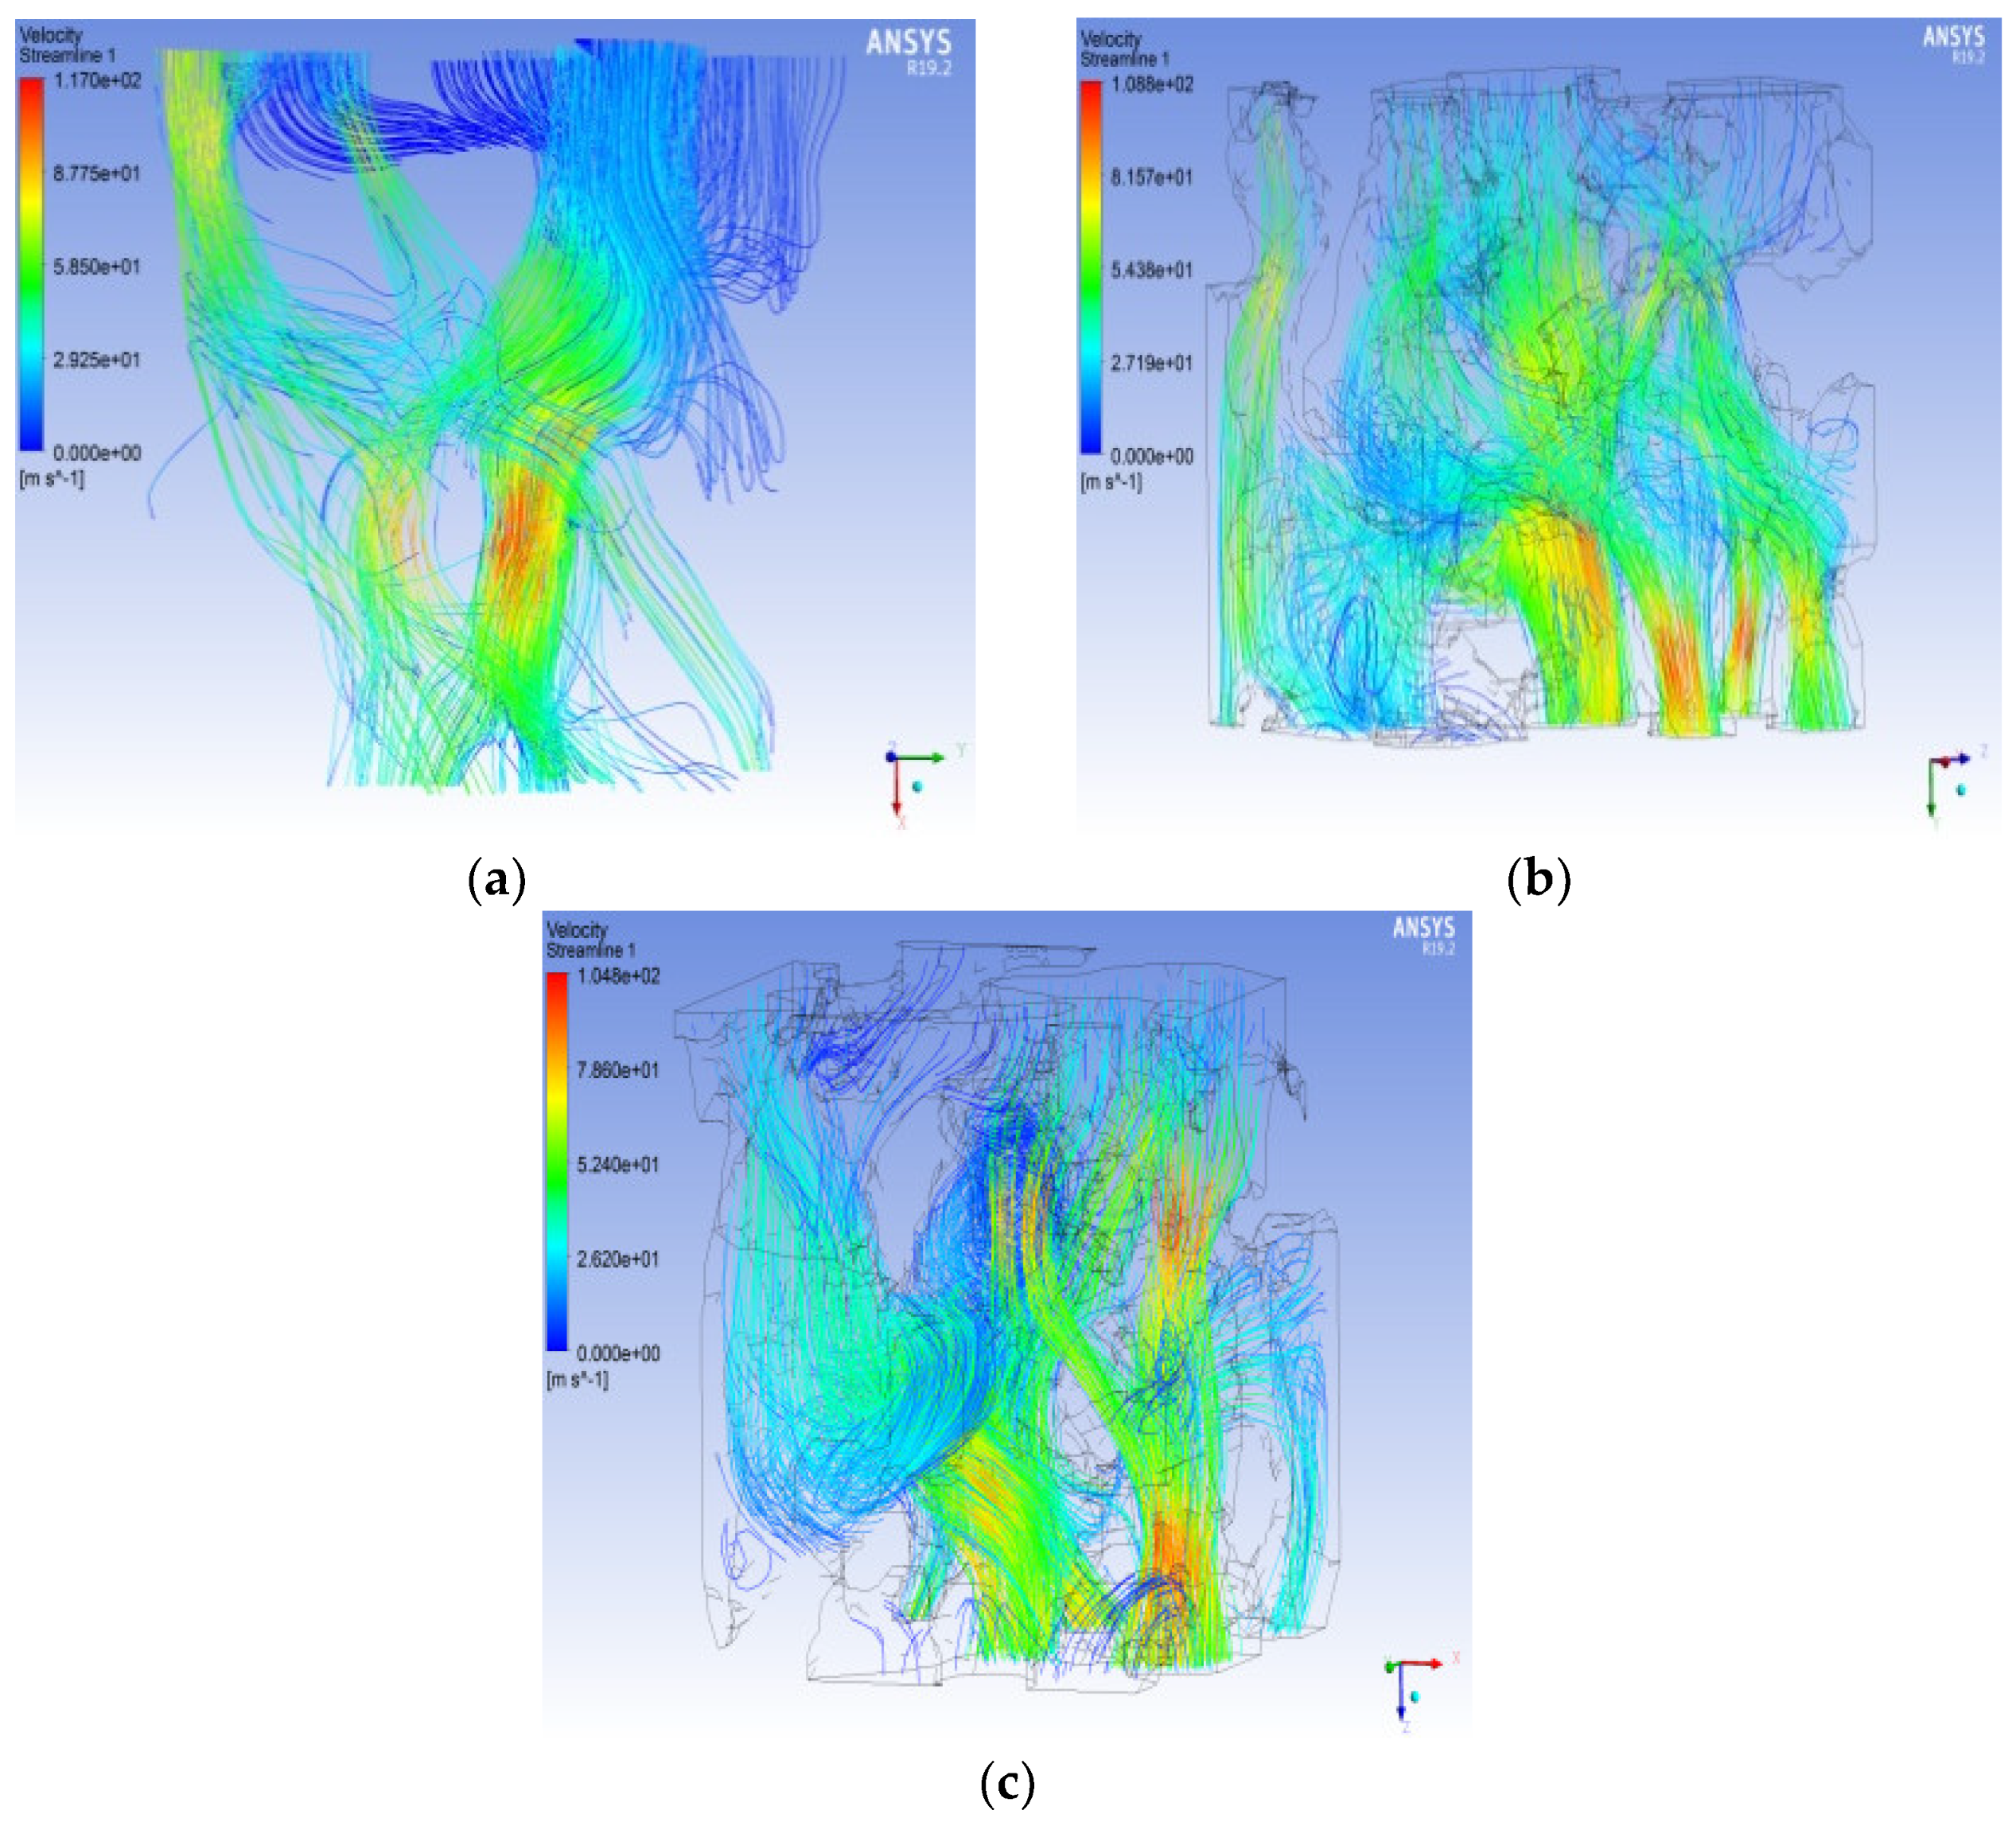
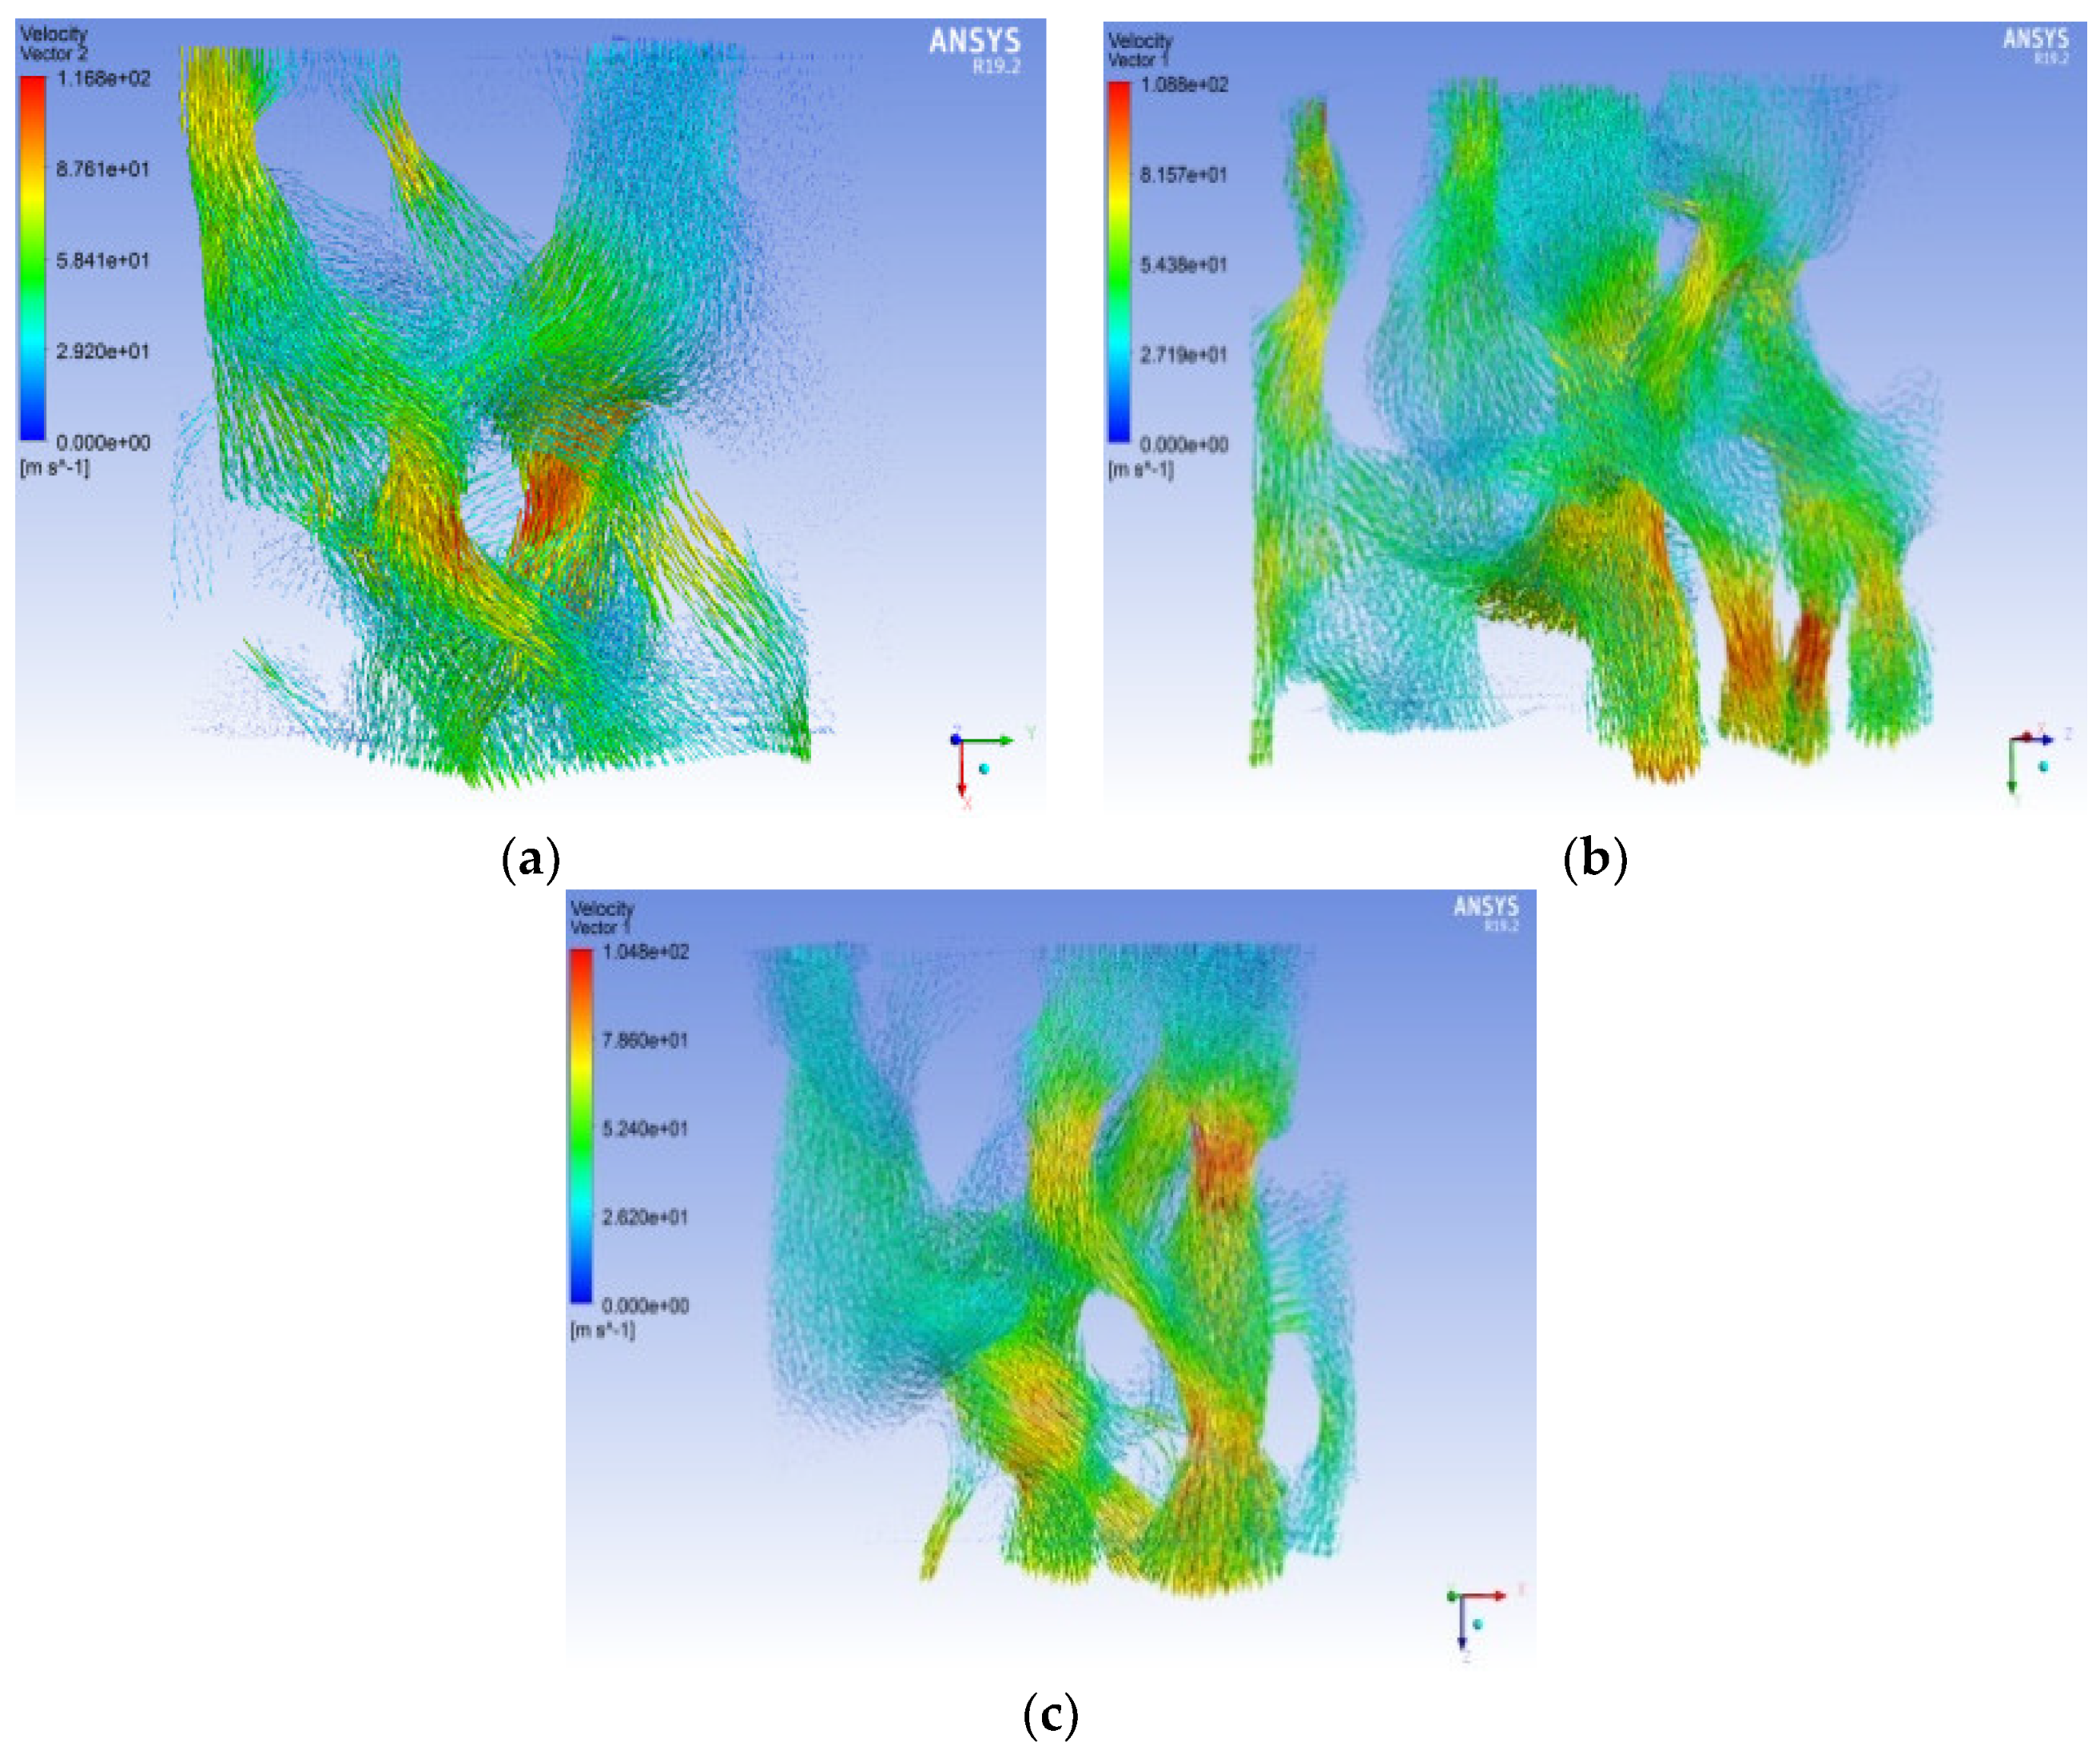
Figure 10, Figure 11 and Figure 12 show the overall pressure distribution cloud diagram, the flow line diagram of the seepage velocity distribution, and the seepage velocity vector diagram of the pore model at an entrance pressure of 5 MPa. The pore model is simulated in the three directions of X, Y, and Z for positive single-channel seepage flow.
As shown in Figure 10, although the ENPs in the three directions of X, Y, and Z are equivalent, due to differences in pore structure, size, and connectivity, the pressure field and velocity in the three directions of model X, Y, and Z differ among the fields. The rate of pressure drop in the three directions of the pressure field varies. The pressure field has the same trend of decreasing pressure from the ENS to the EXS. The maximum value of the overall pressure of the model appears in the area near the ENS, and the trend of pressure decrease in the broken pores is relatively small. It appears that the broken pore pressure is higher than the pore pressure around it. Where the pore channel abruptly narrows, the pressure changes at a rapid rate, showing the law of increasing from large to small. The trend from large to small is more obvious, and the trend from small to large is not obvious, but the overall trend is decreasing. The reason for this trend is mainly the sudden decrease in the size of the pore radius.
As shown in Figure 11 and Figure 12, most of the paths passed by the streamlines in the X, Y, and Z directions are pore channels with a short distance and large radius. The velocity of the flow field is represented as “large in the middle”. In the pore channel, the fluid velocity in the center of the pore is the highest, and the velocity is smaller as it is closer to the WS. For percolation in the X direction, the flow rate of the ENS is smaller than the flow rate of the EXS. There is minimal difference between the flow rates of the ENS and EXS of the percolation in the Y direction. The ENS velocity of the seepage in the Z direction is greater than the EXS velocity.
As shown in Figure 10, the pressure in the corner area at the ENS sharply decreases because these corner areas formed certain negative angles of inclination along the seepage direction. These areas form local dead angles, and the water flow bypasses these areas during the seepage process and chooses a smoother path. There are some “swirling flows” in the model. These seepage flows are caused by a sudden change in the direction of the seepage flow path, causing the formation of seepage contact with the wall. These seepage flows are low-velocity flows near the WS.
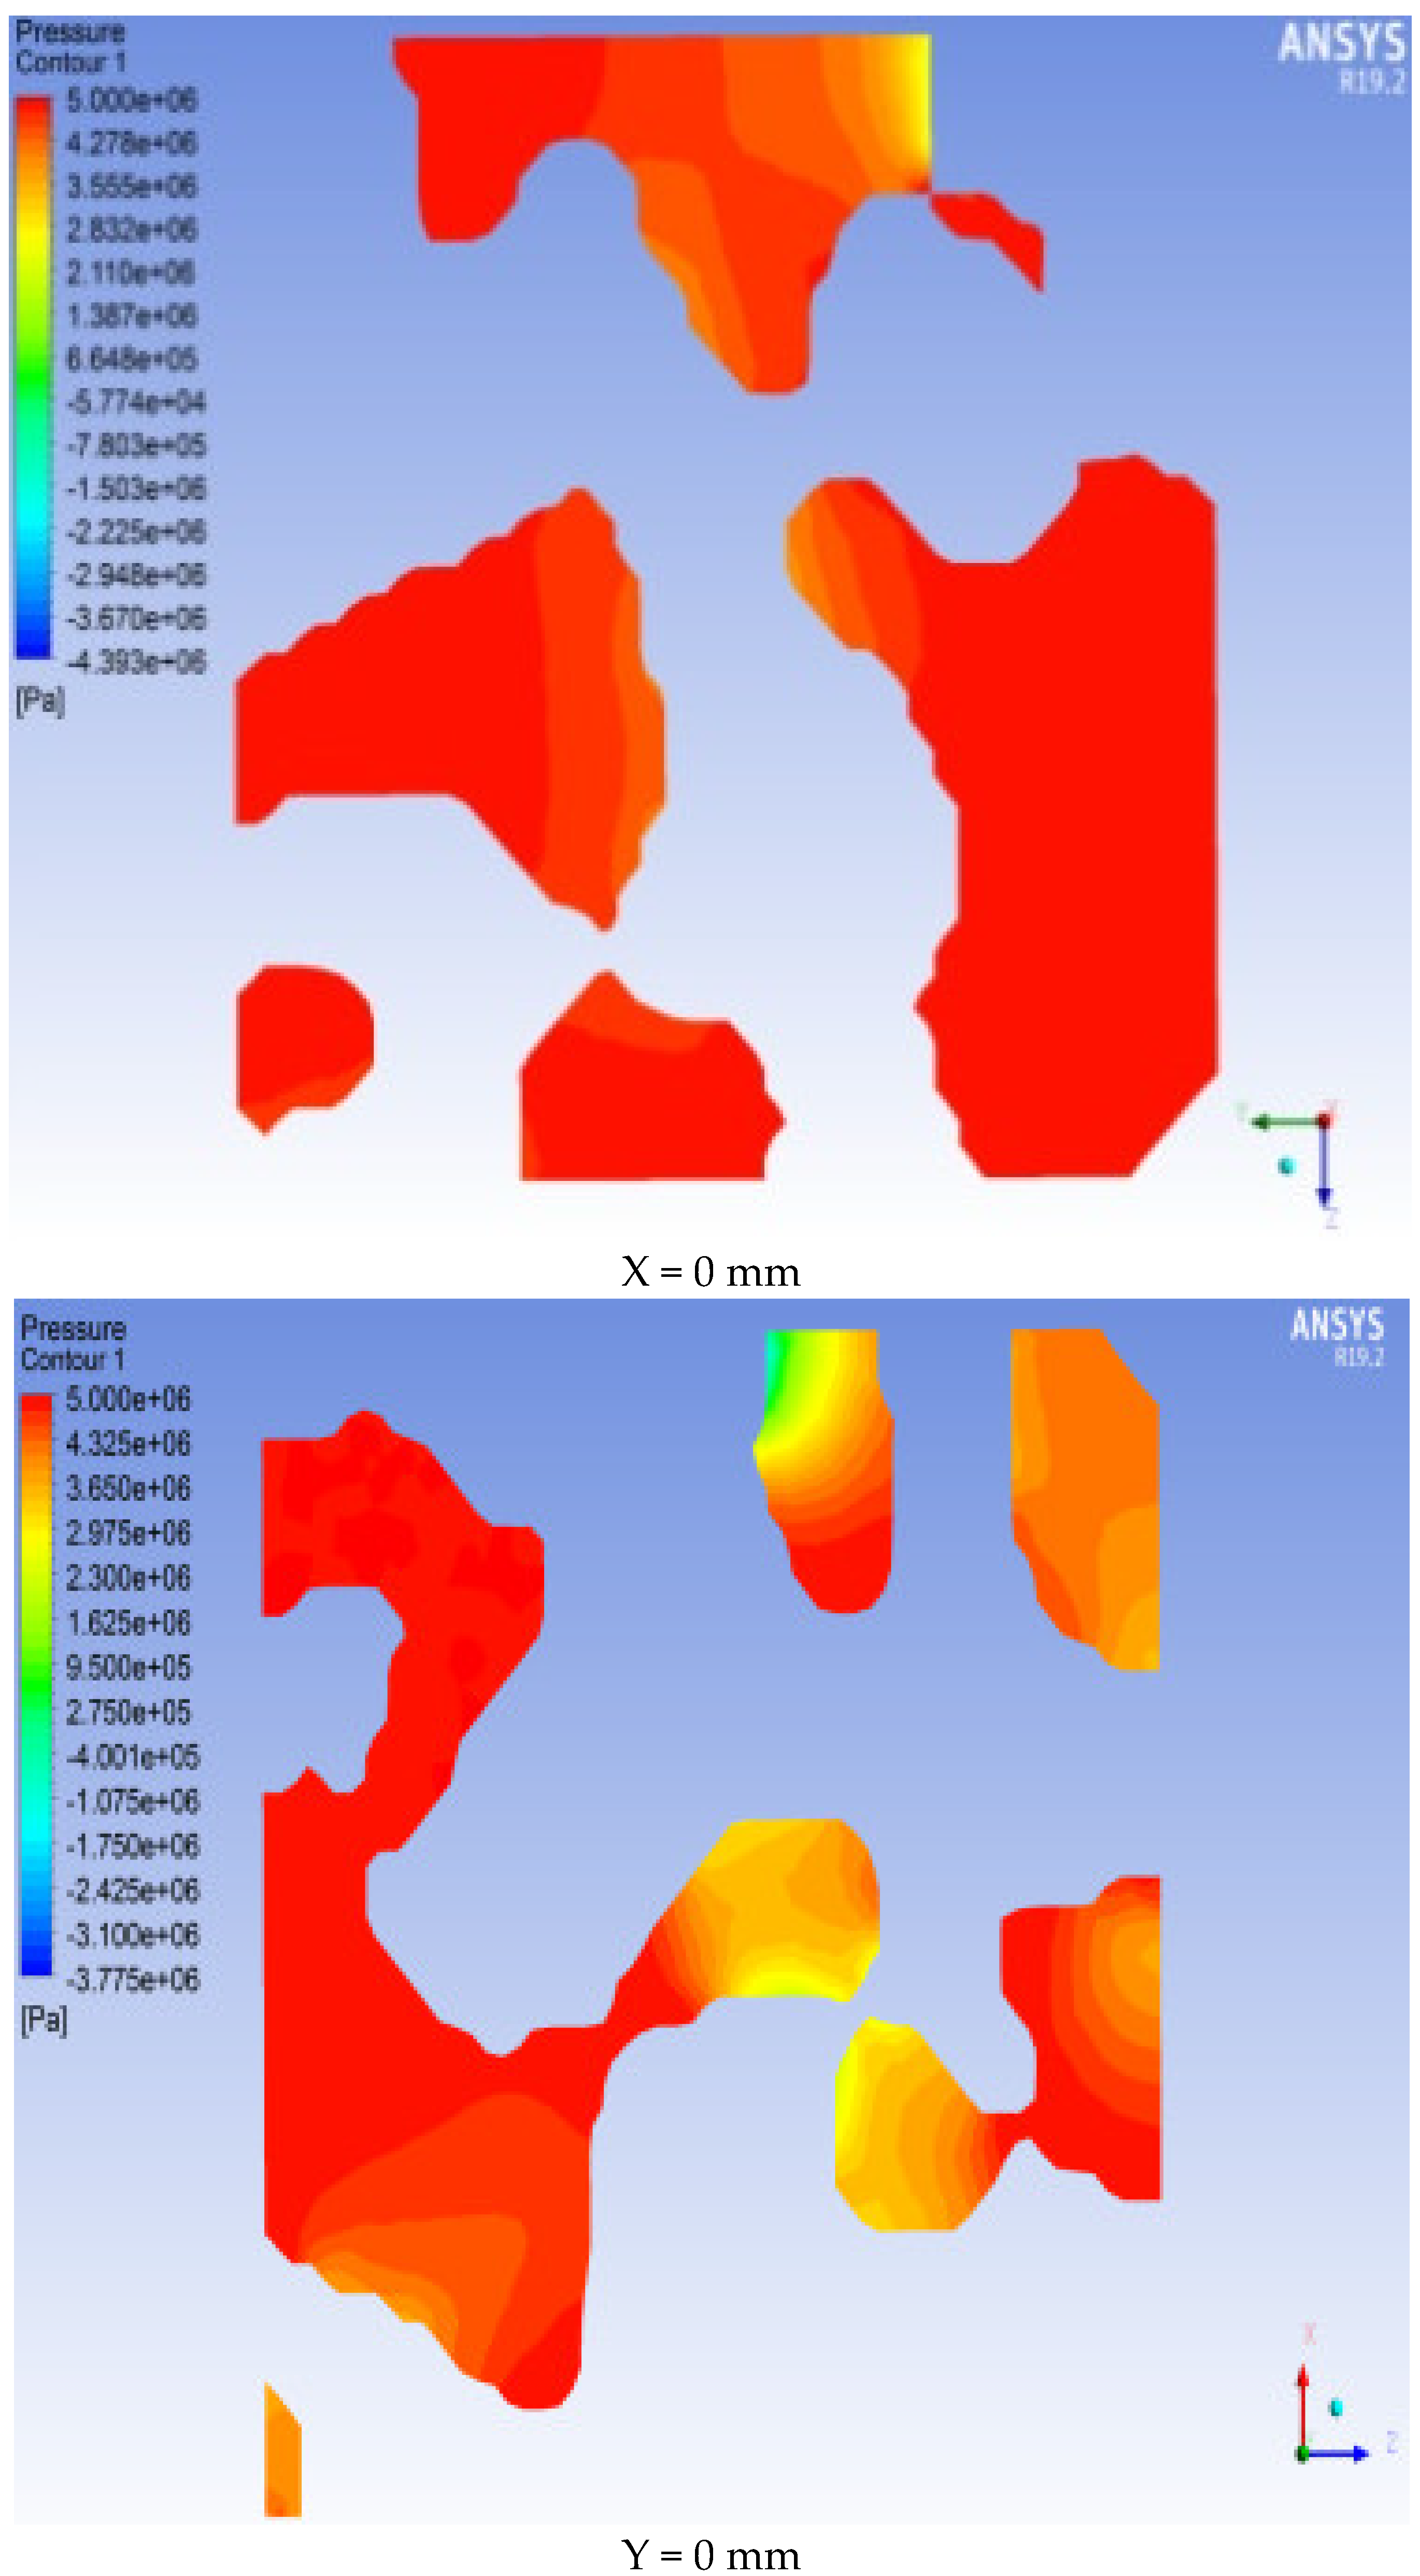
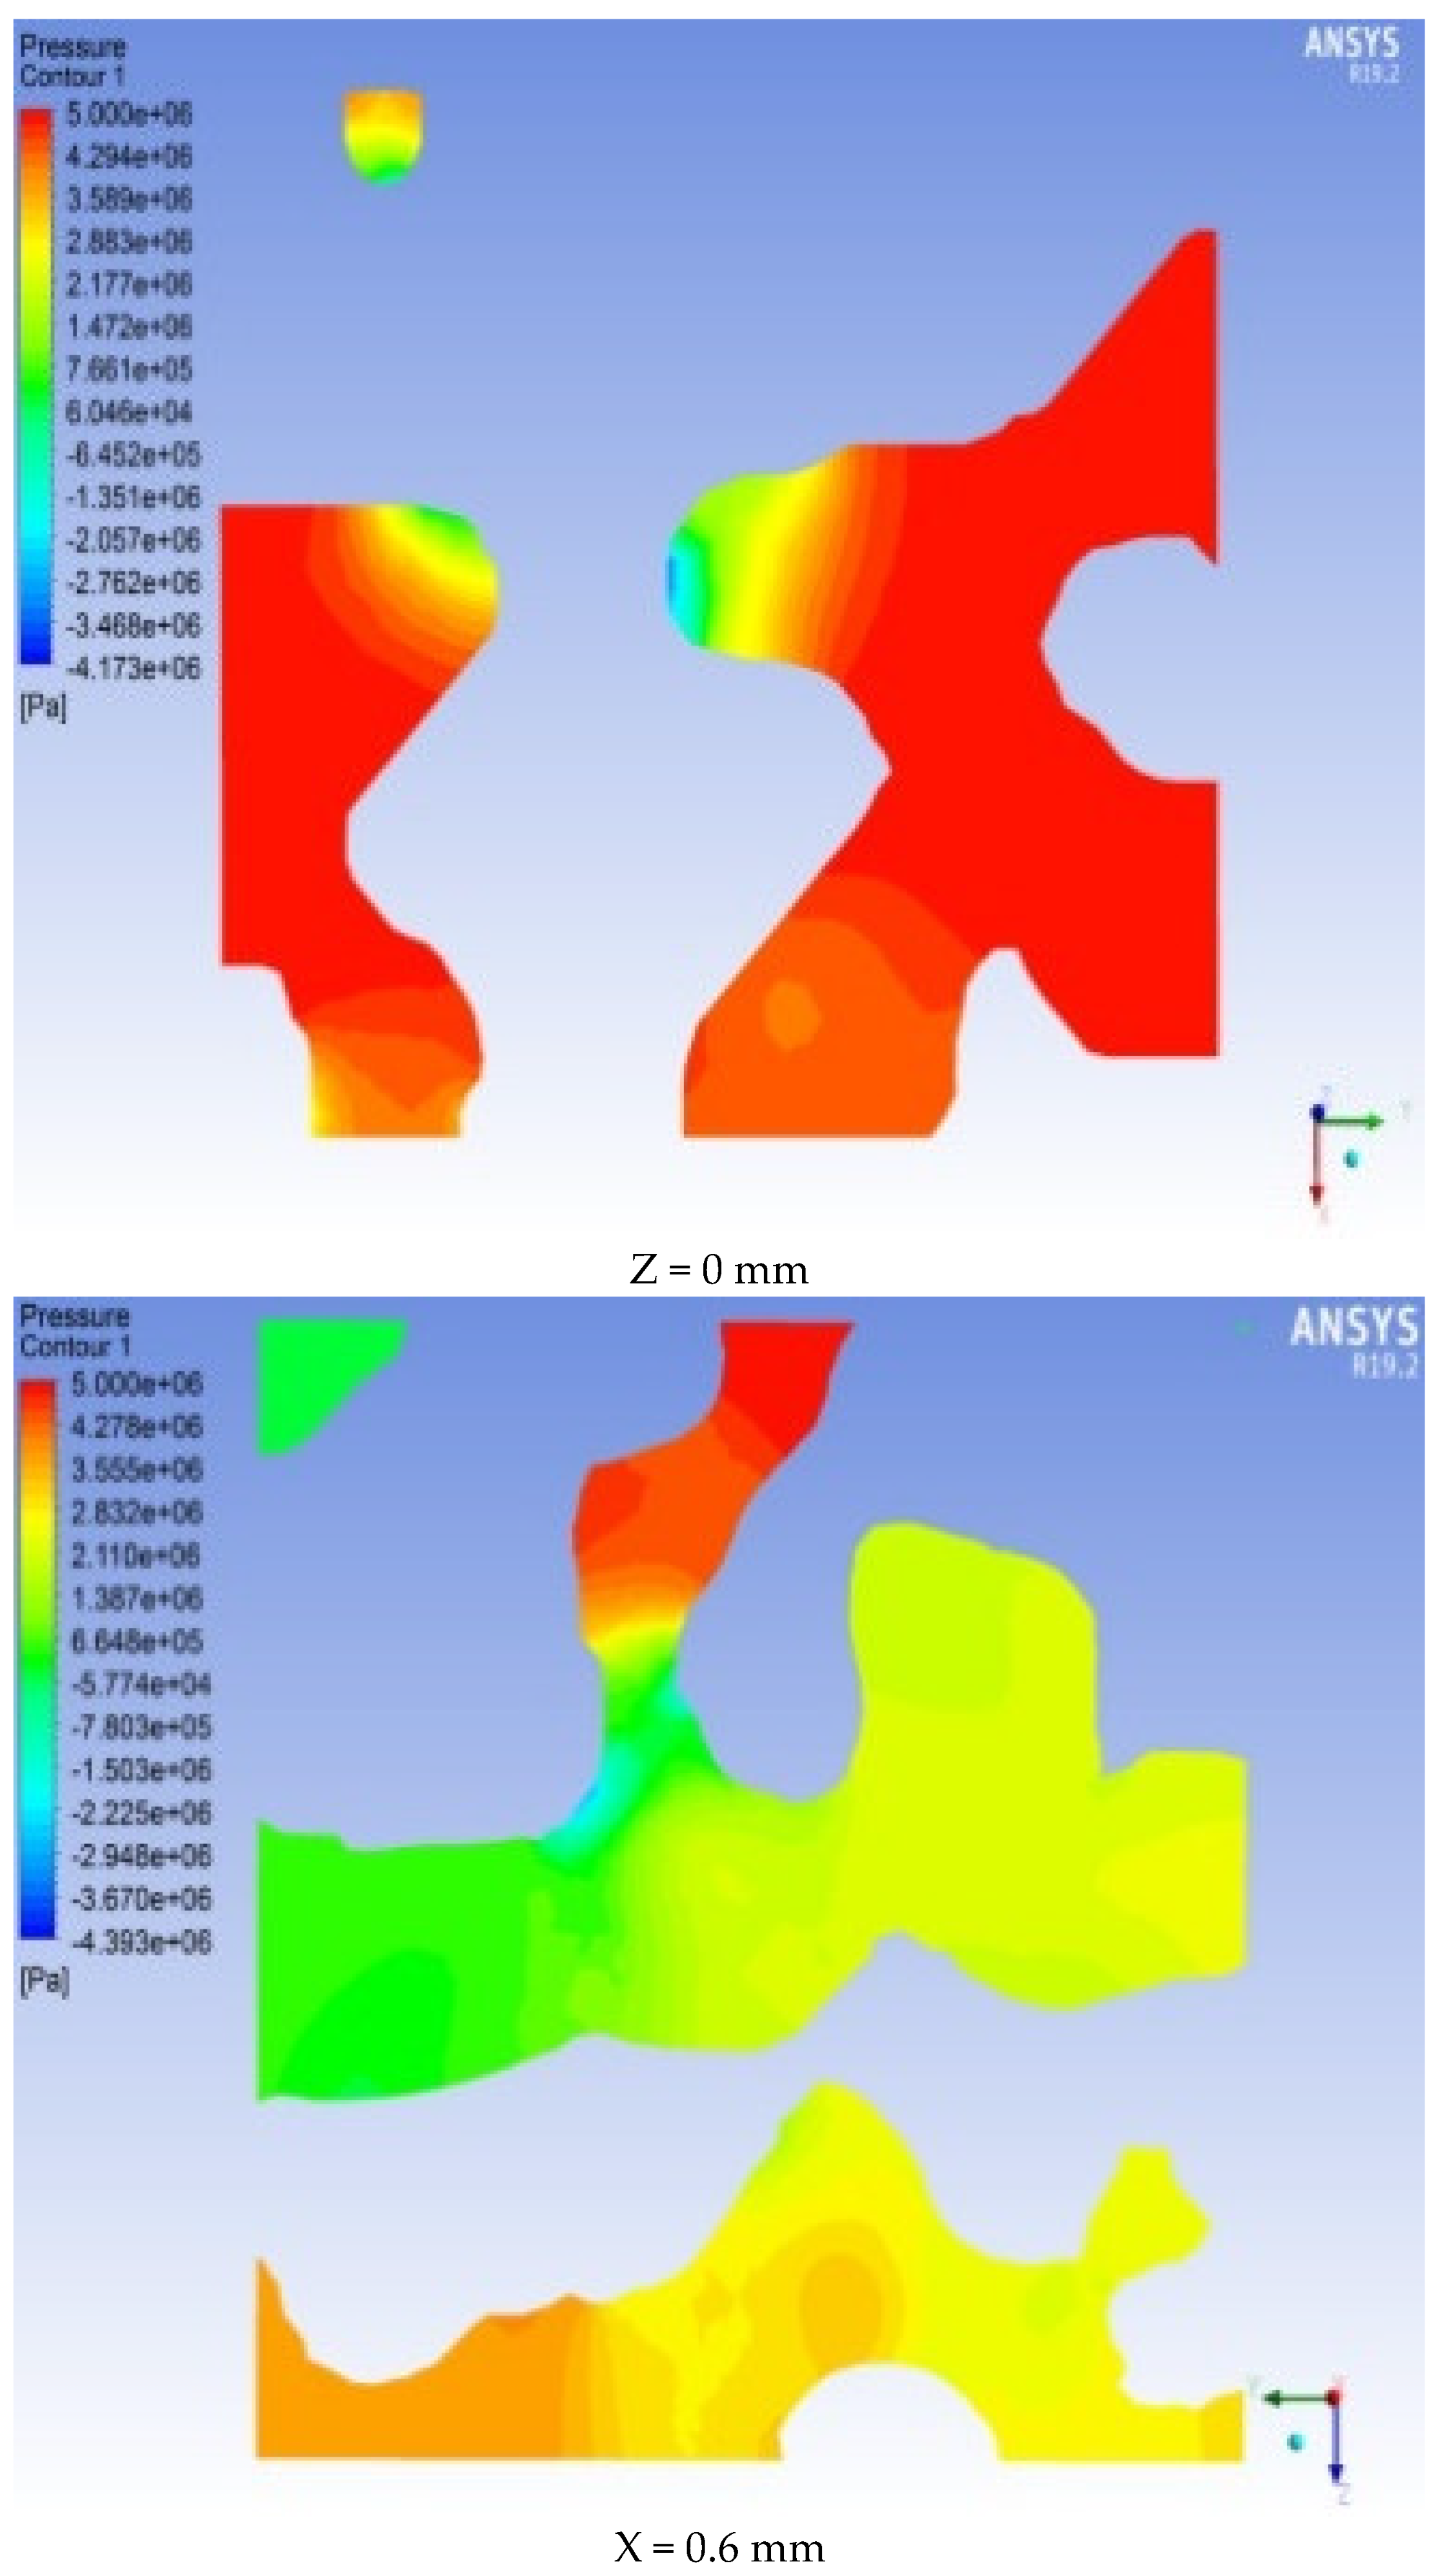
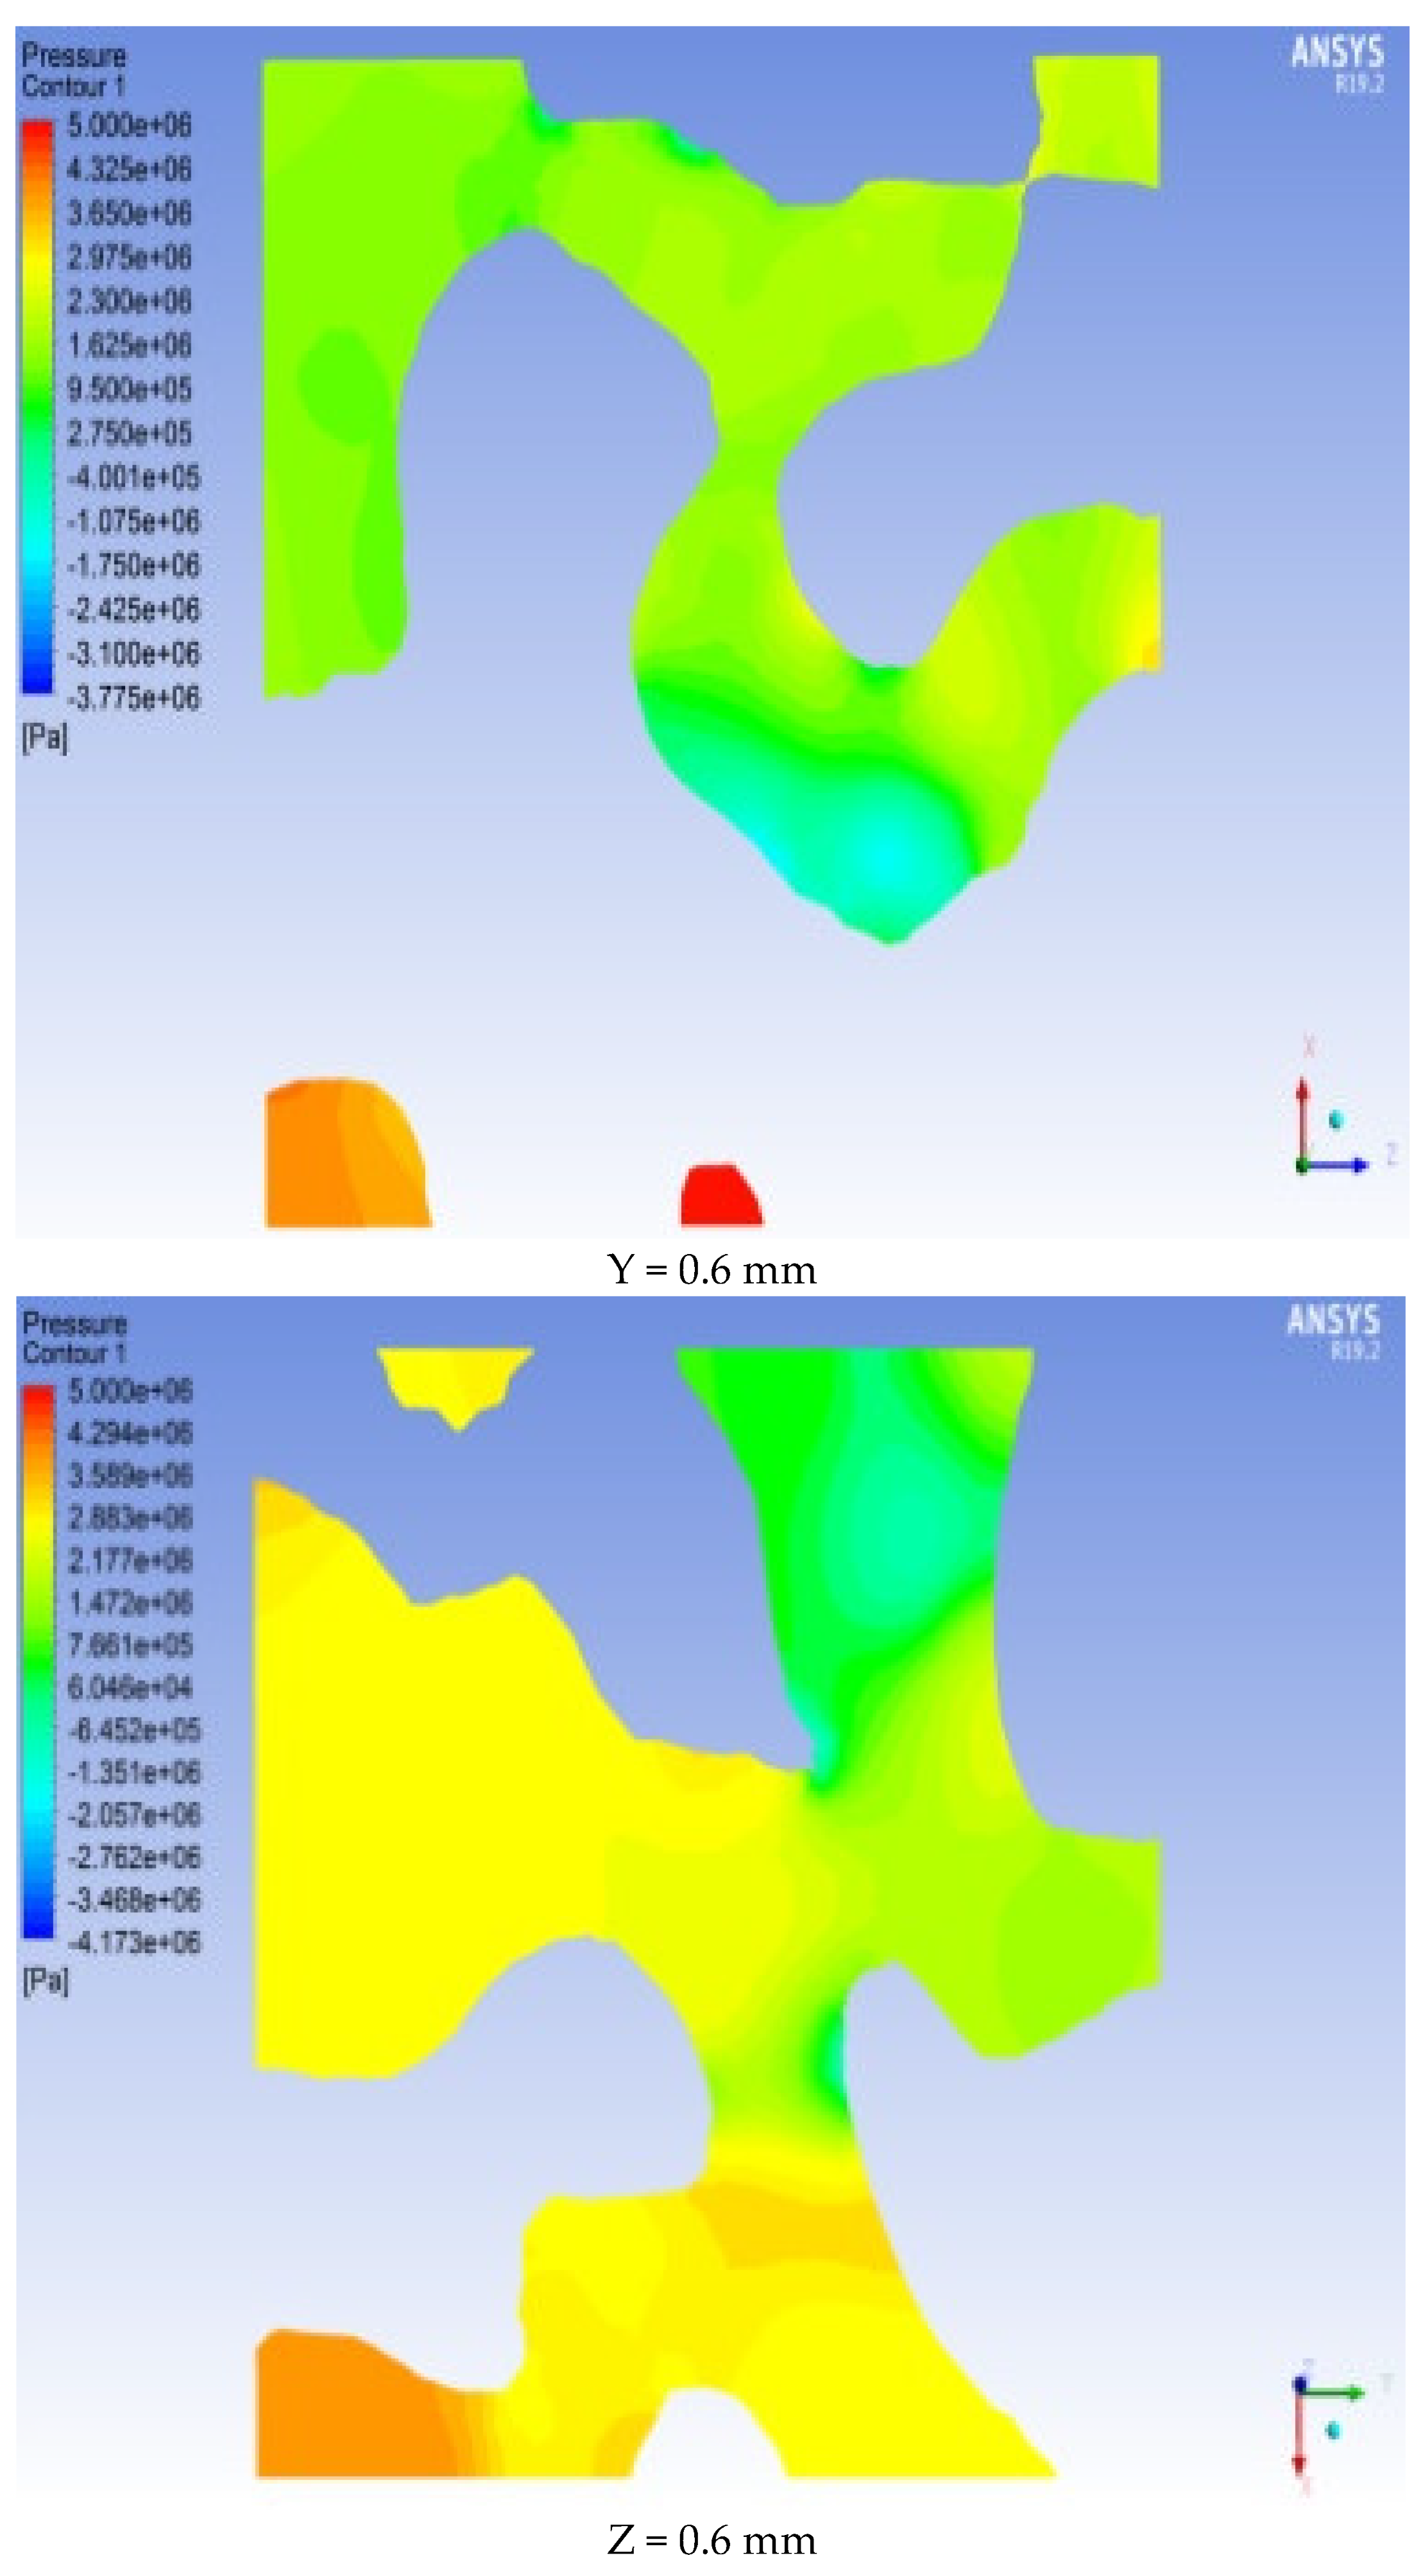
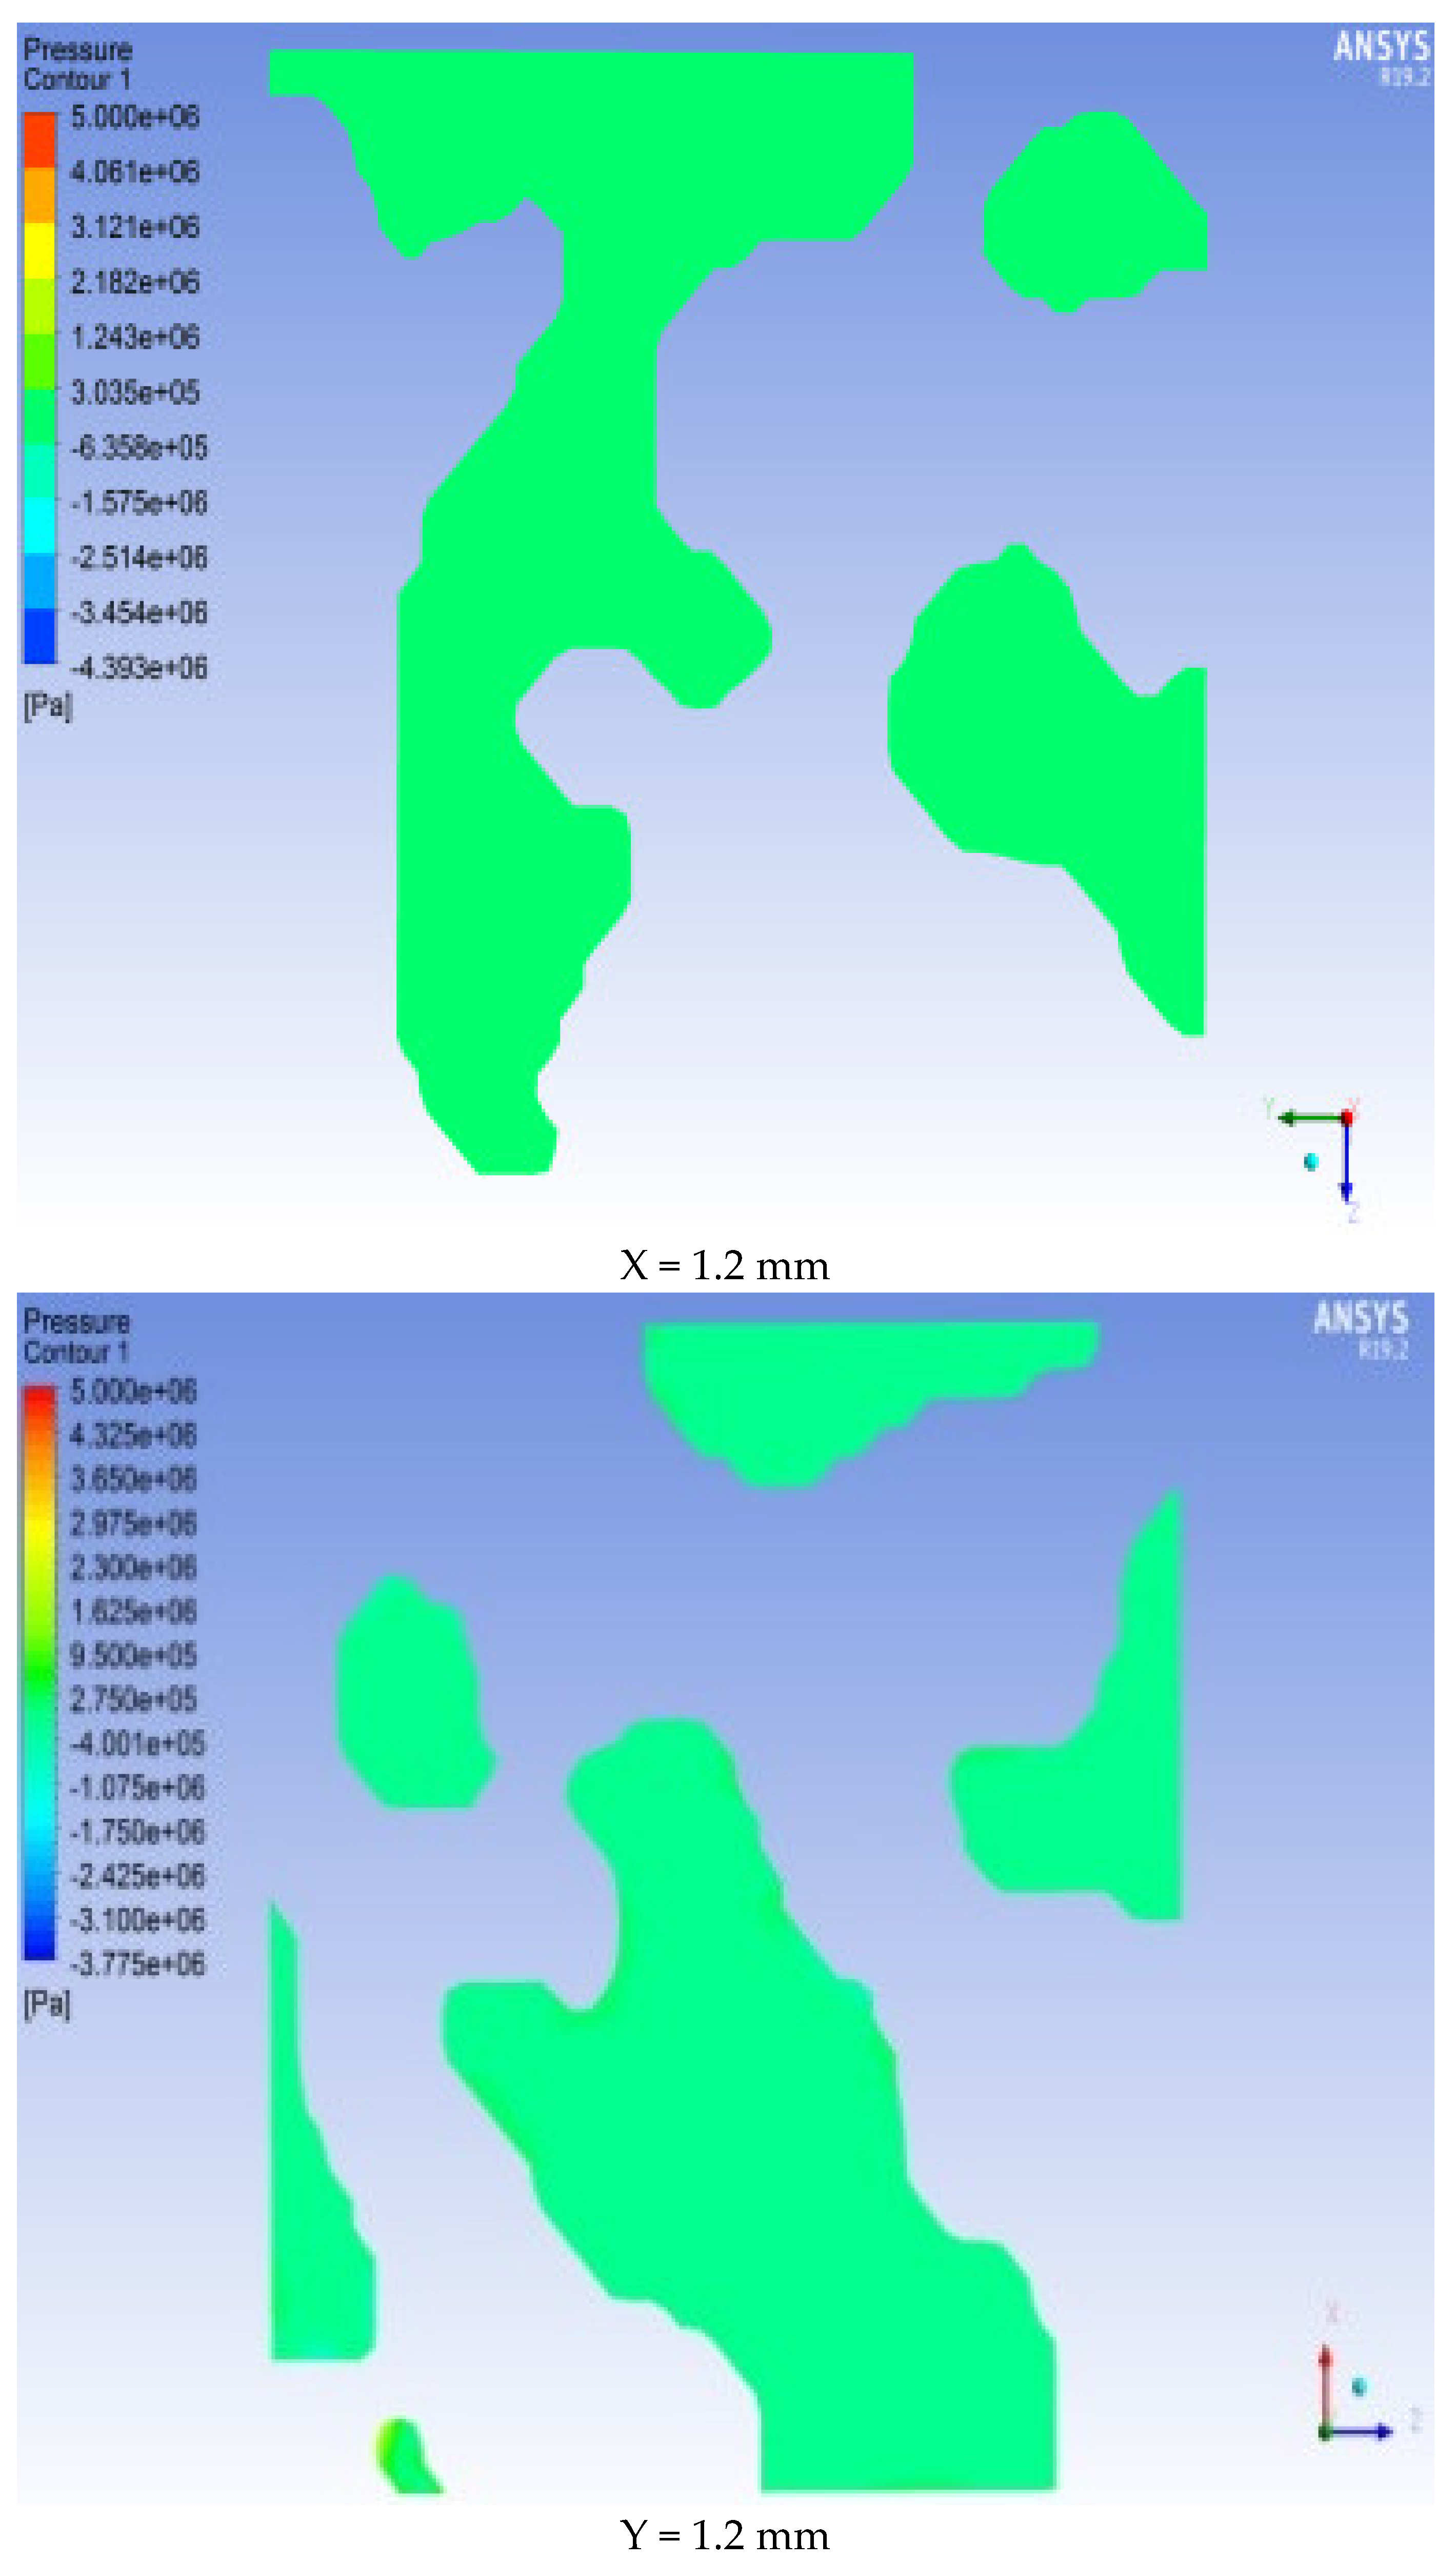
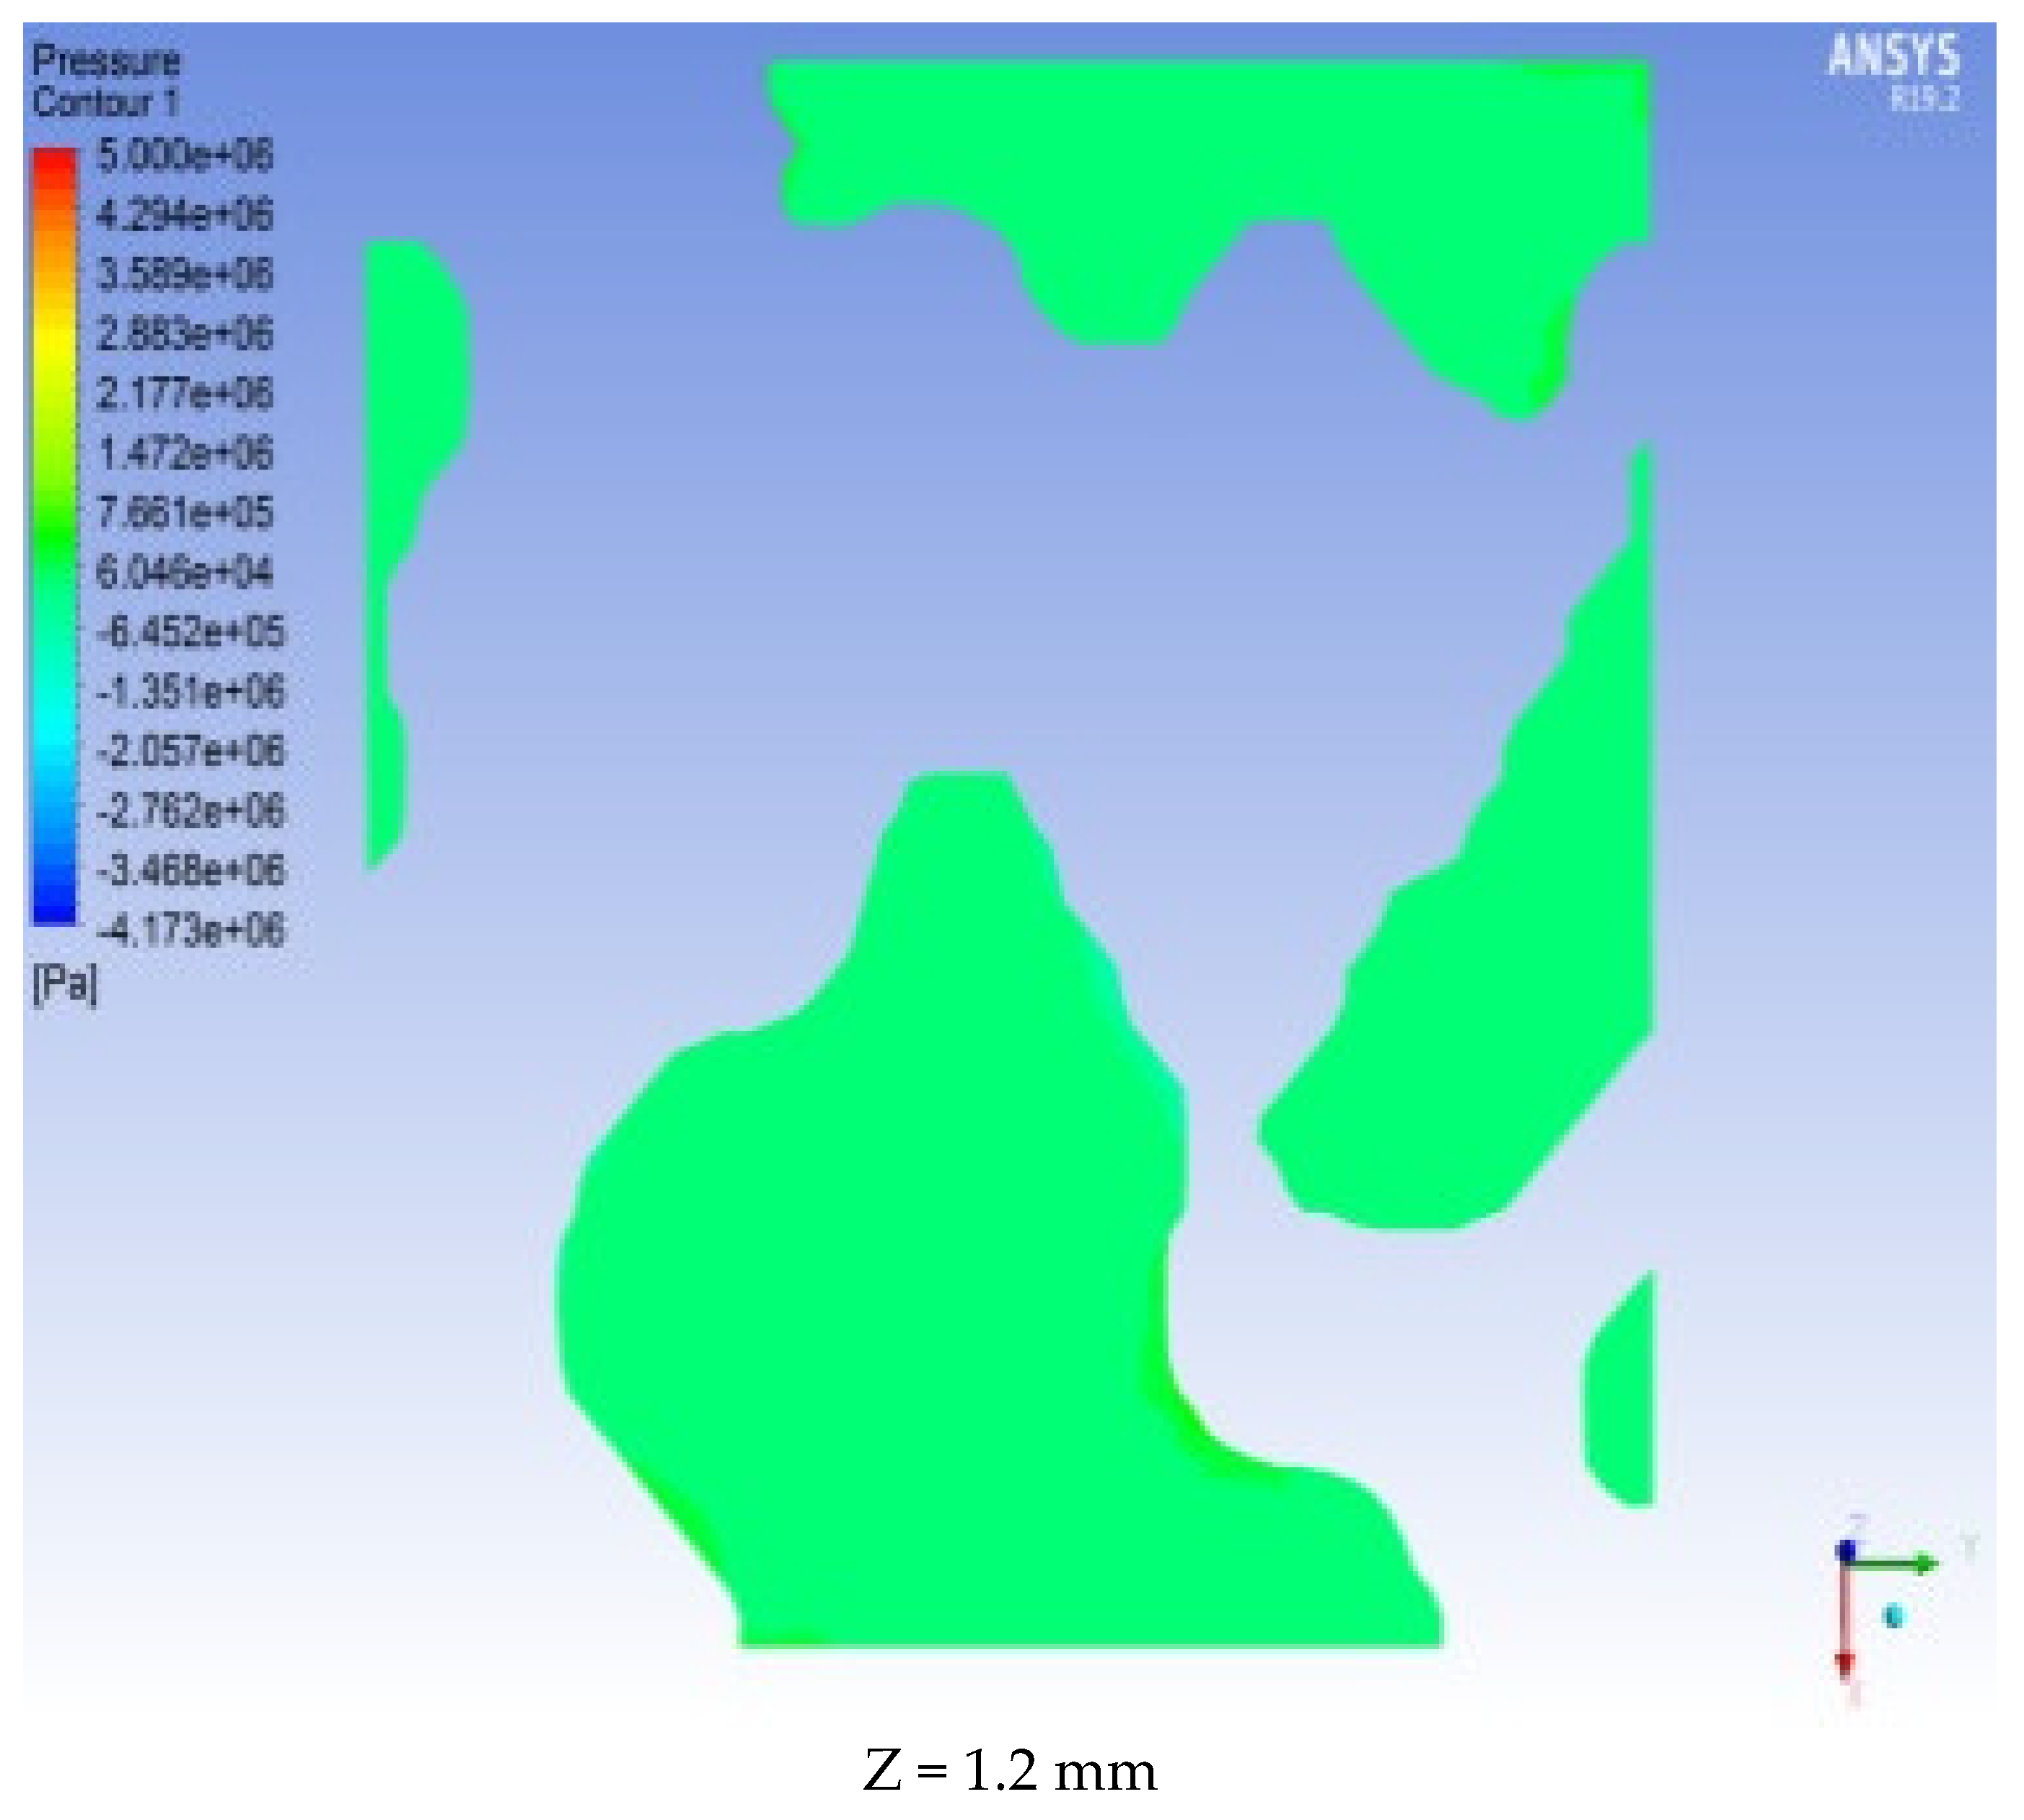
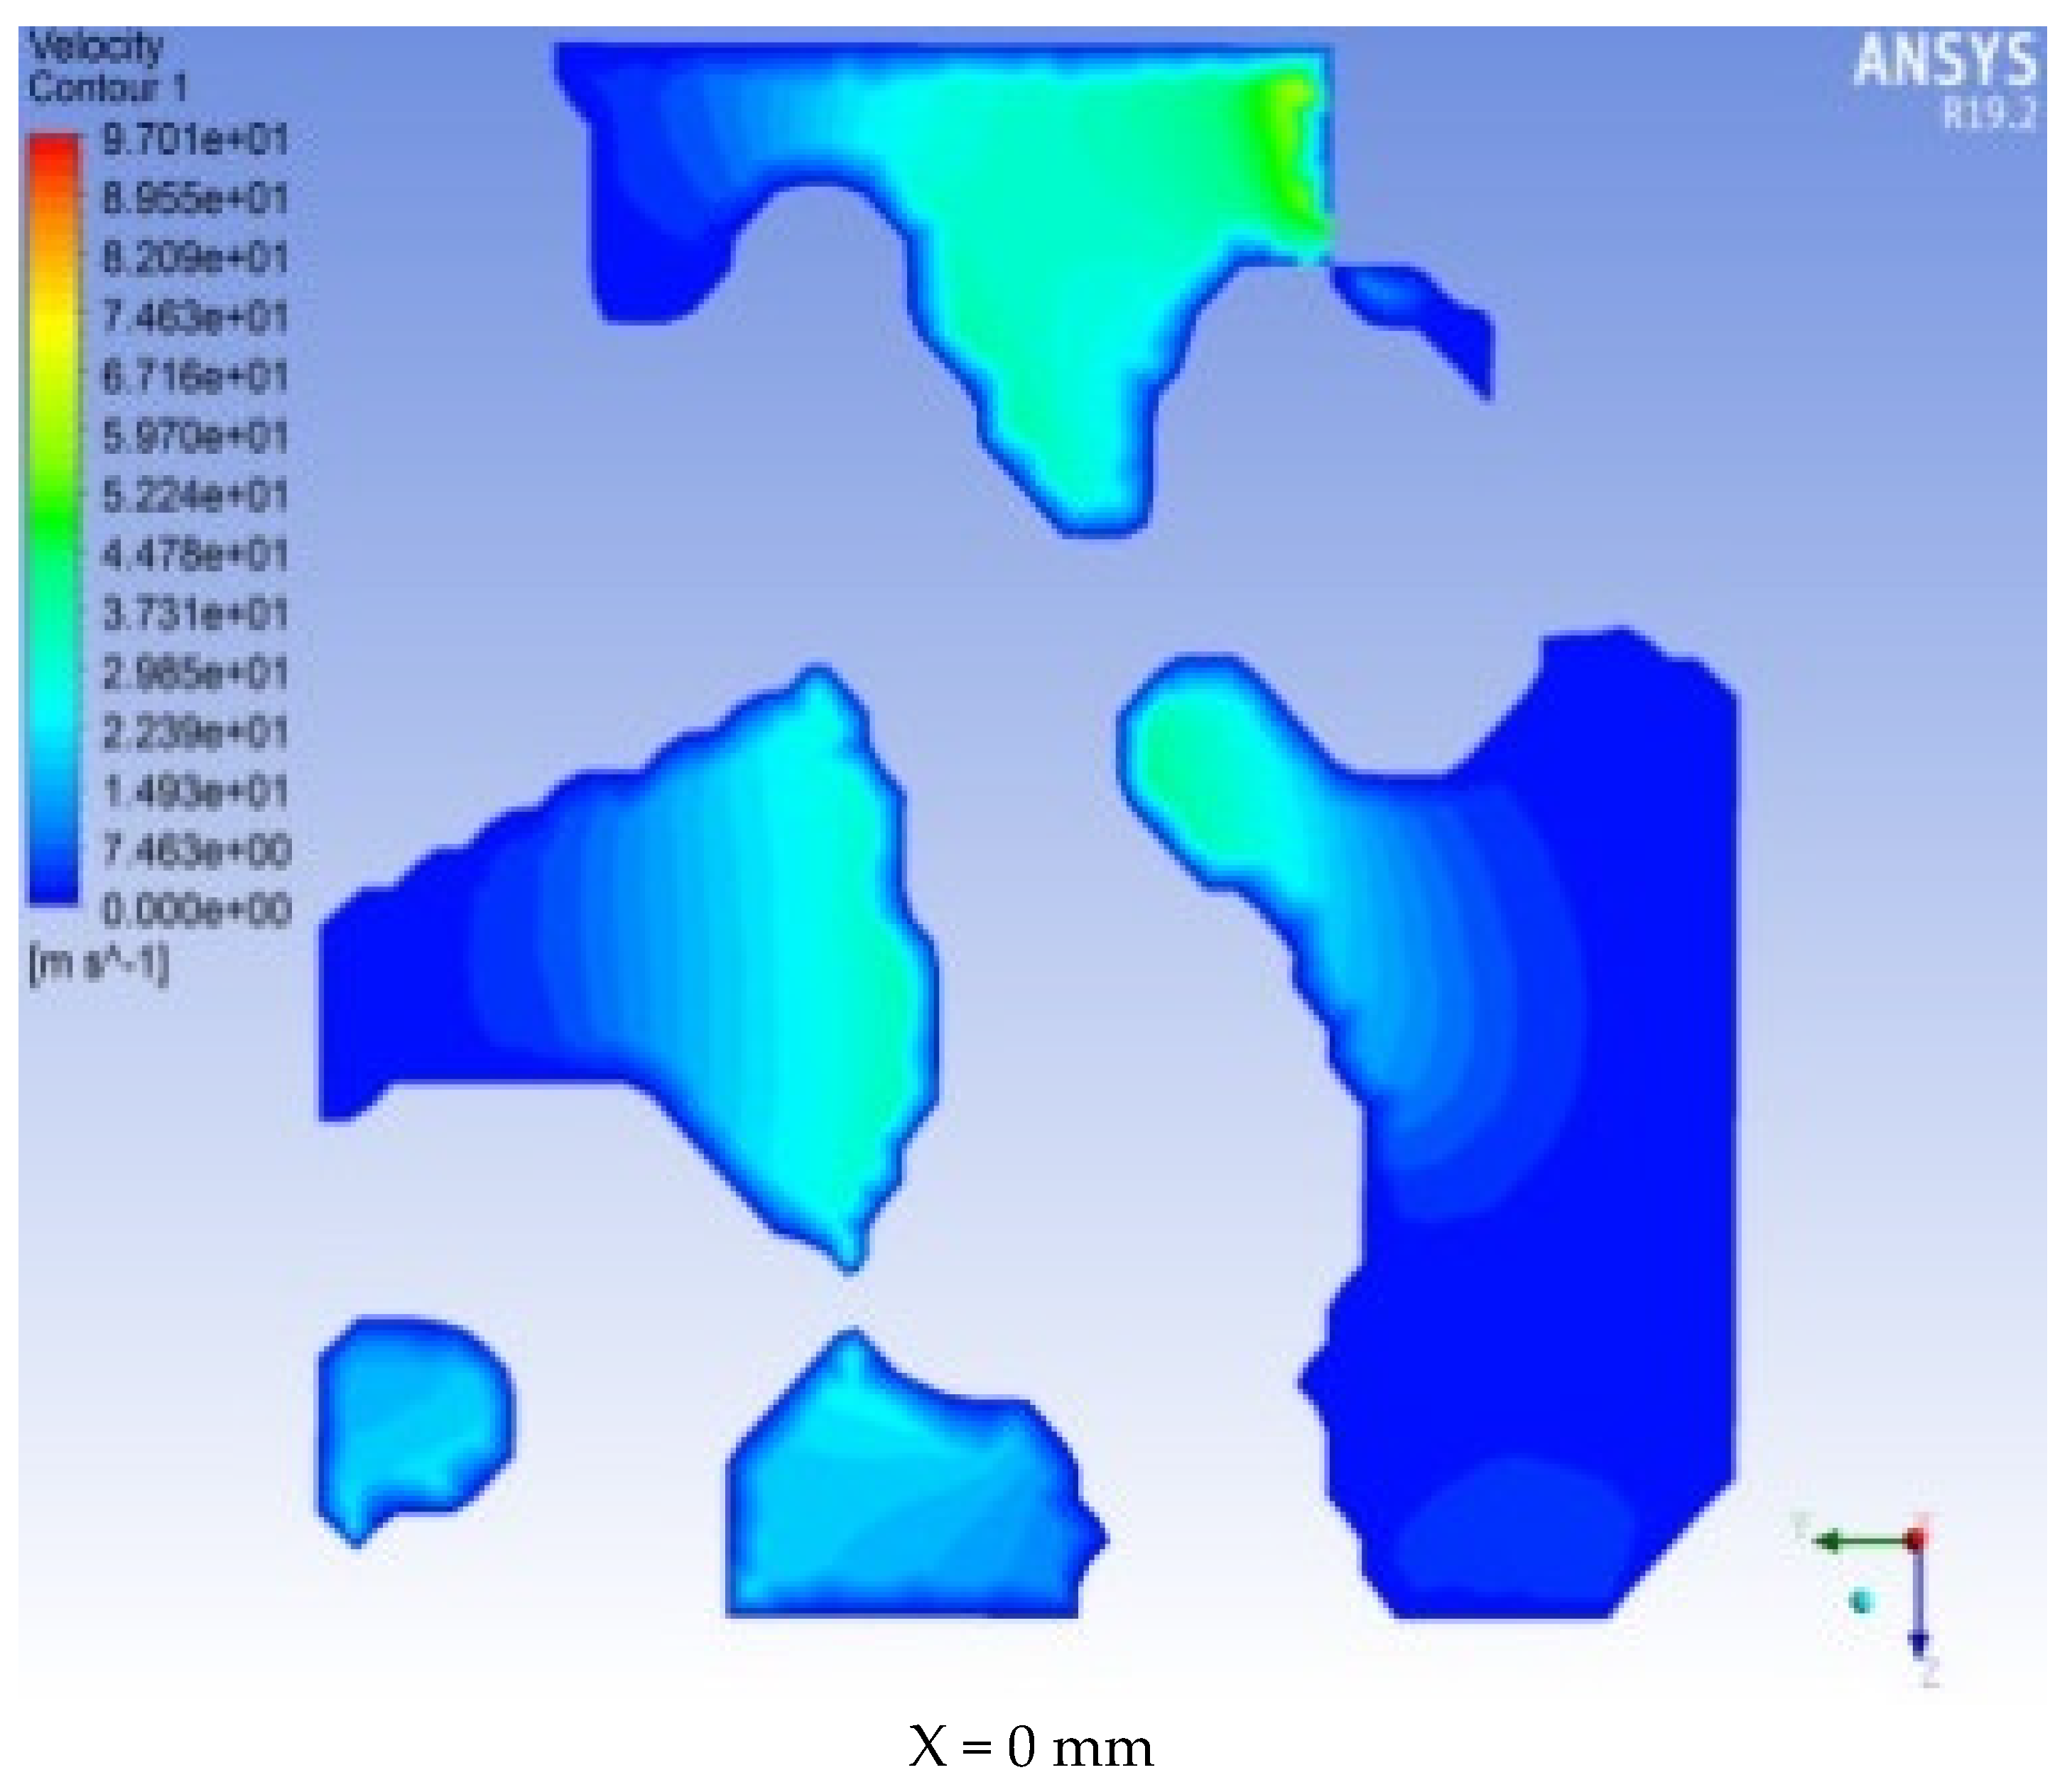
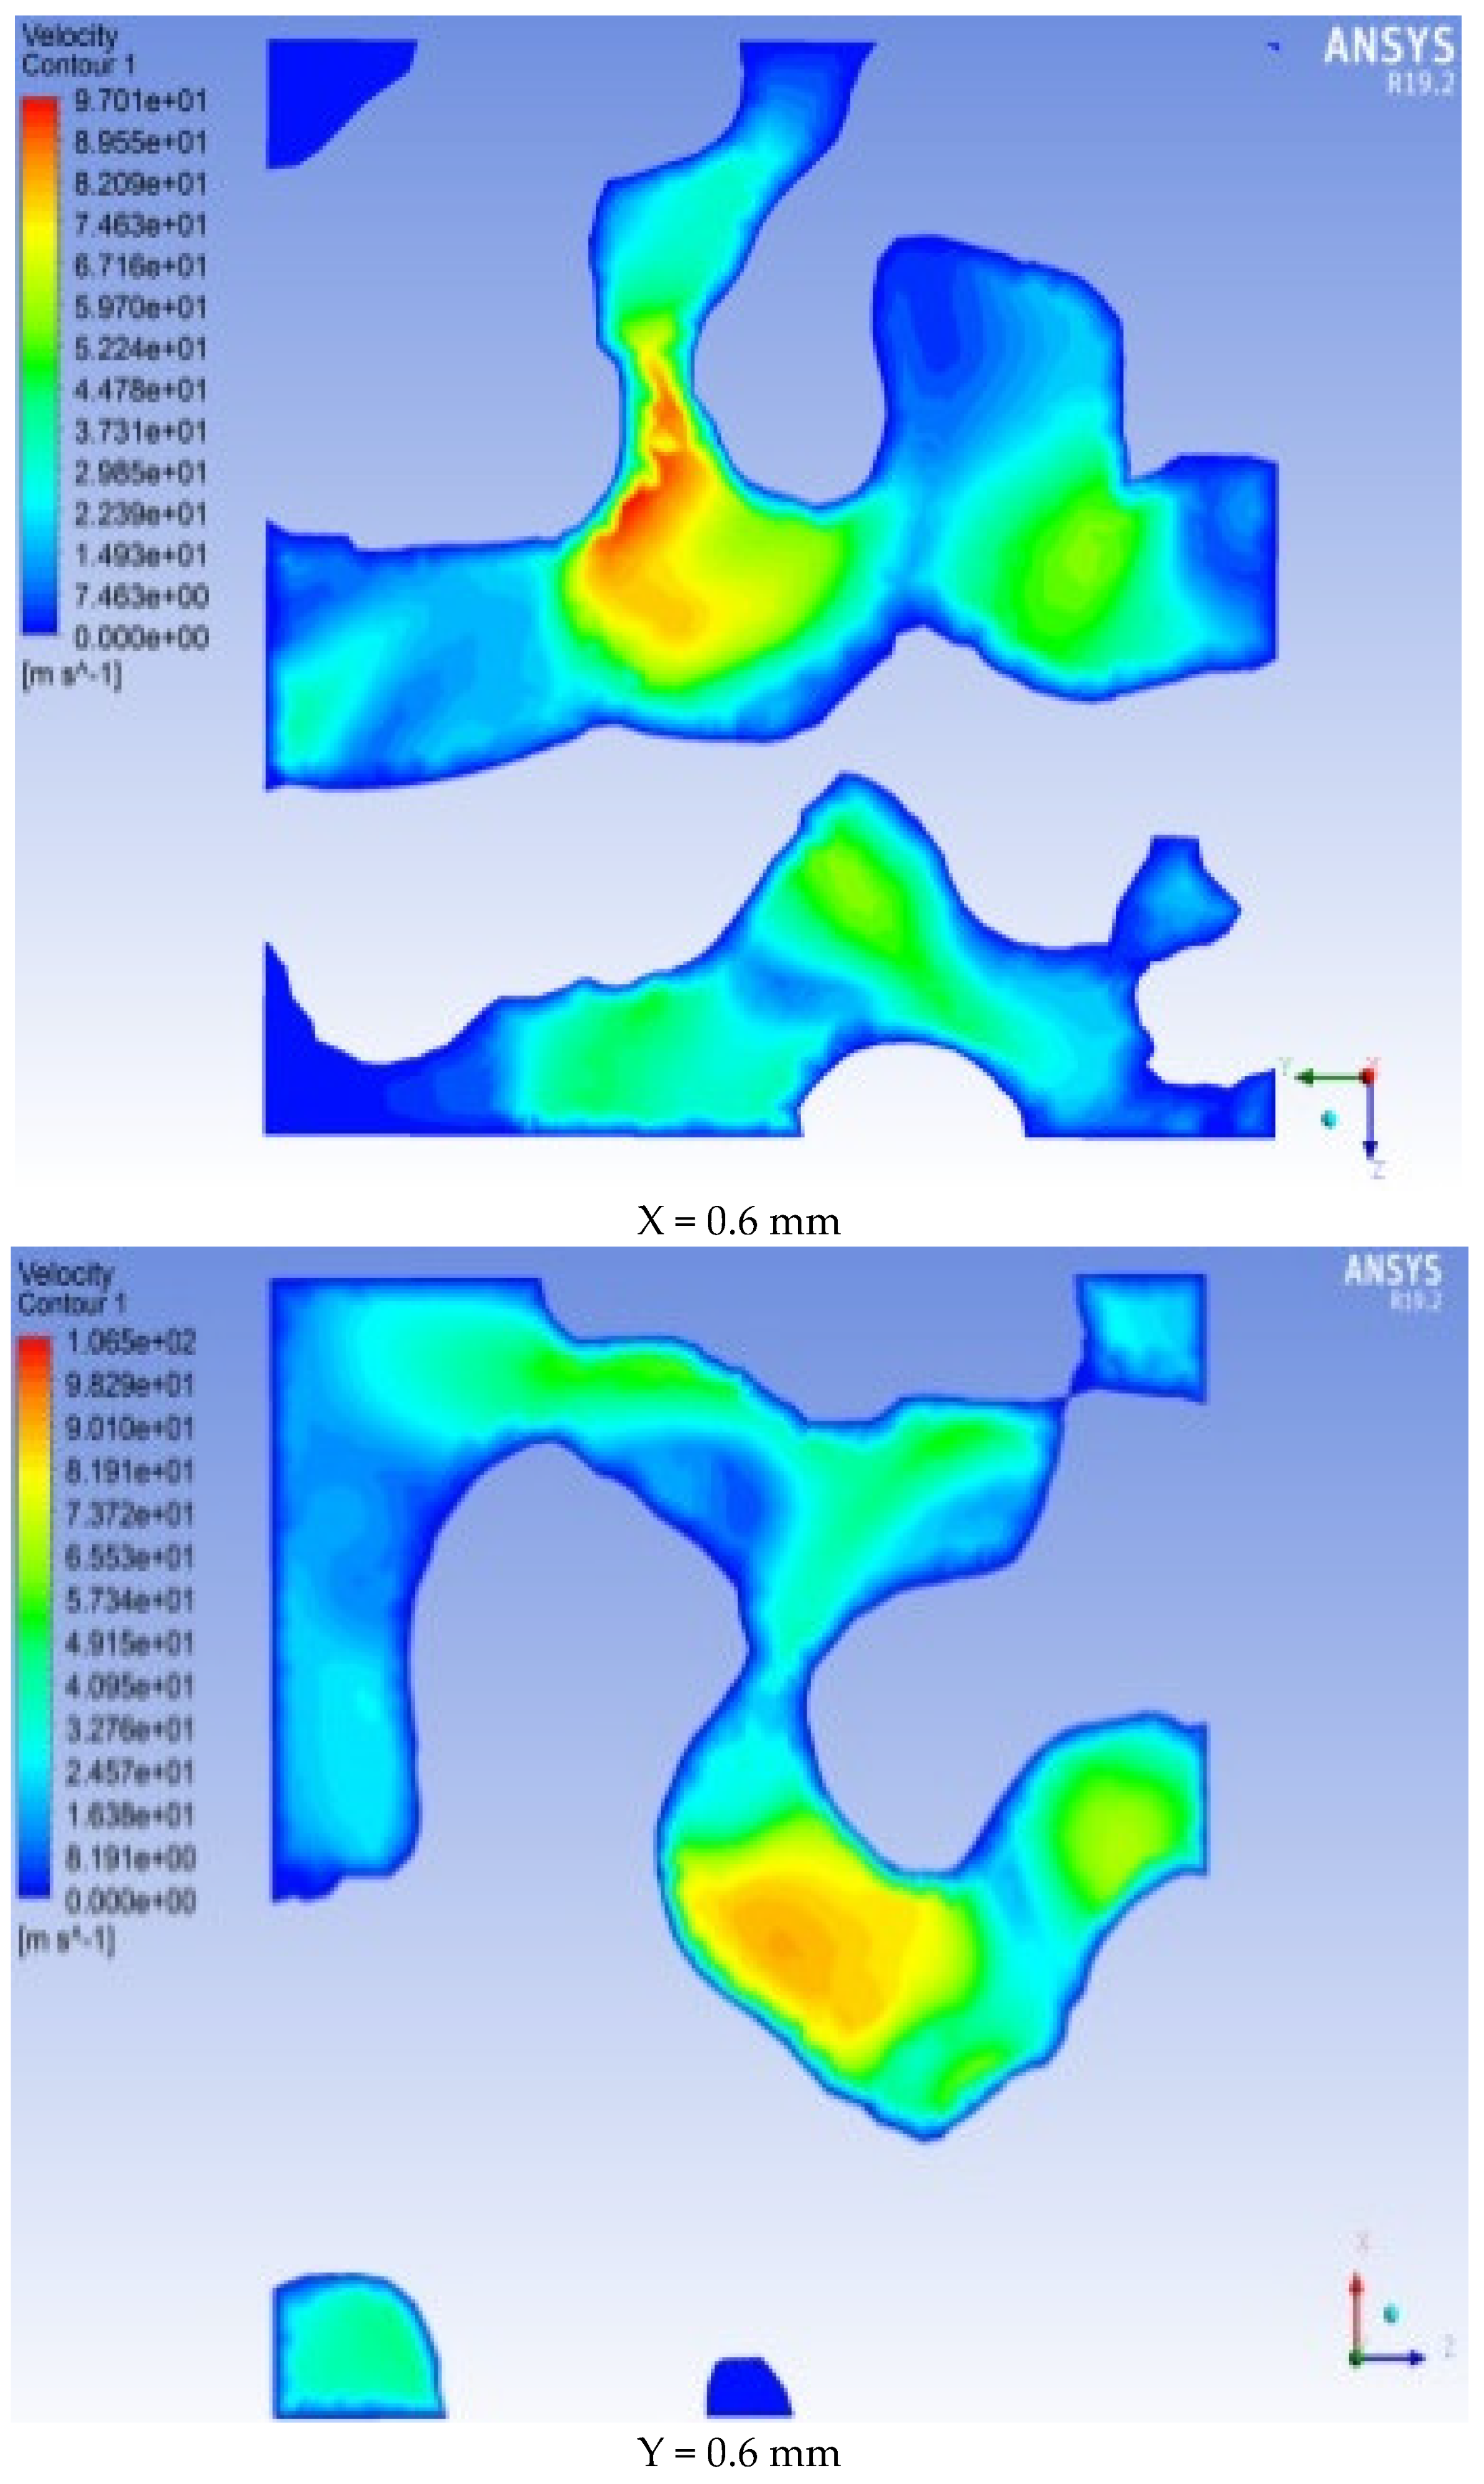
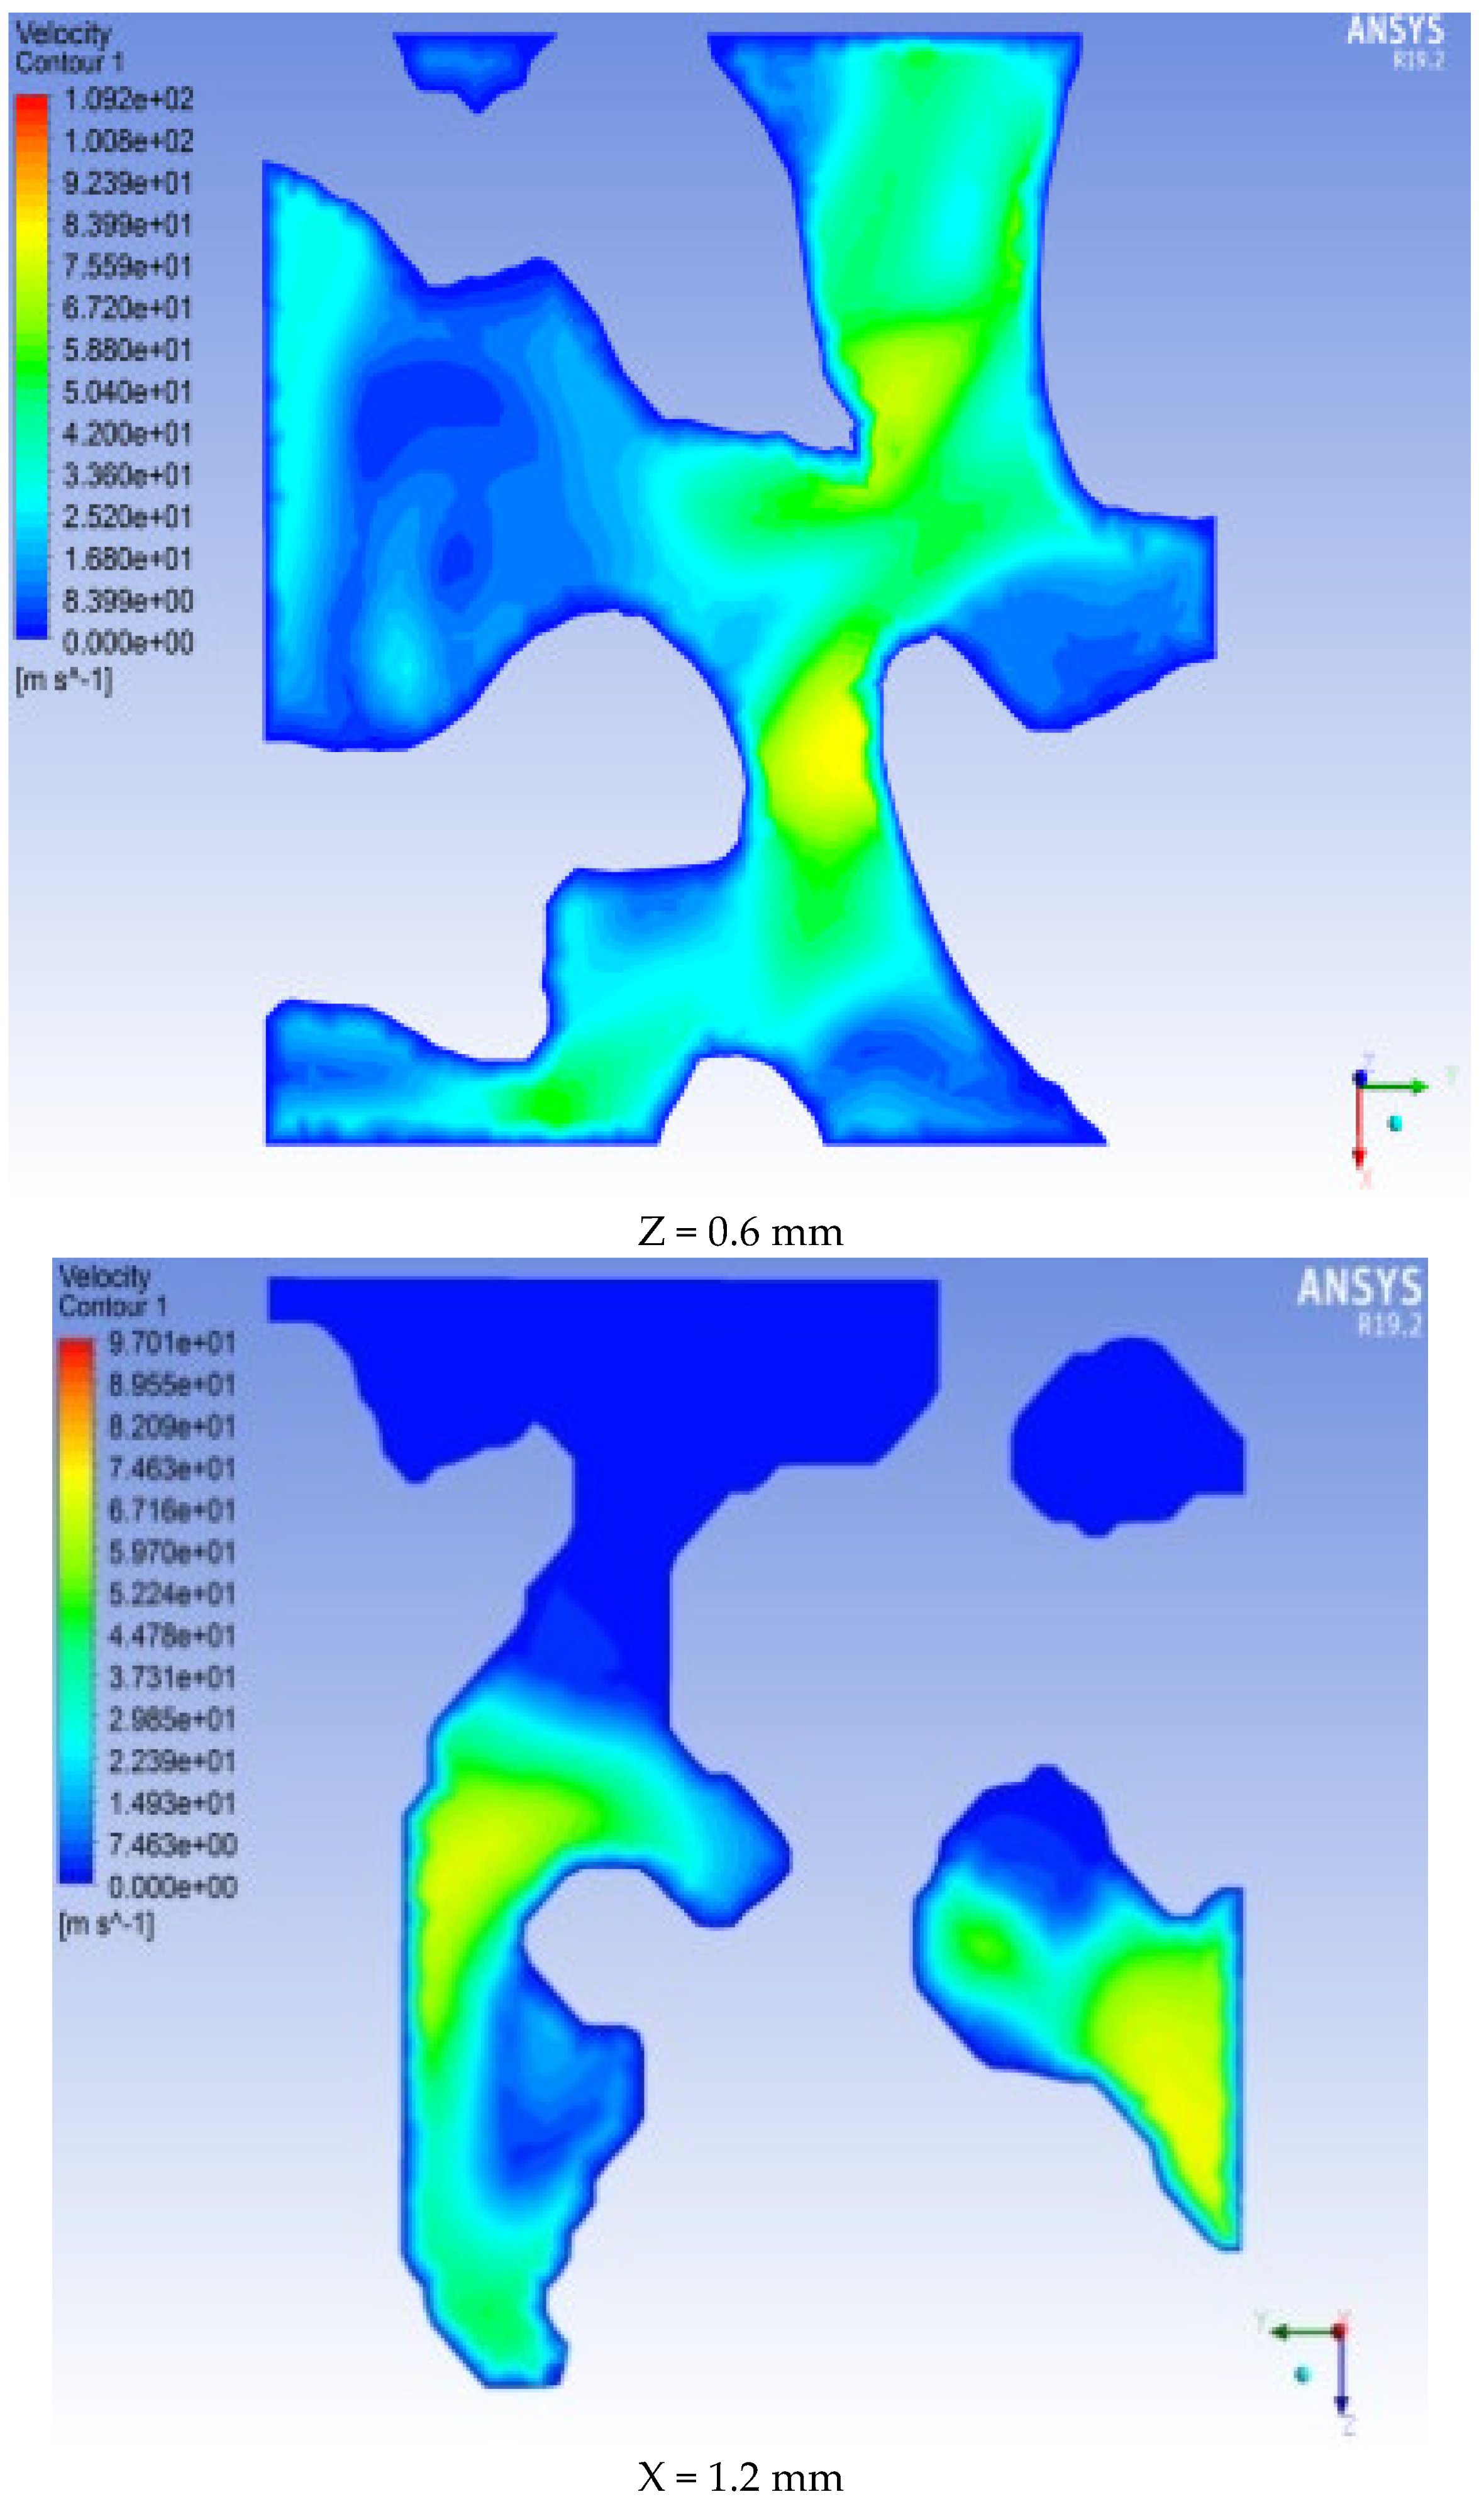
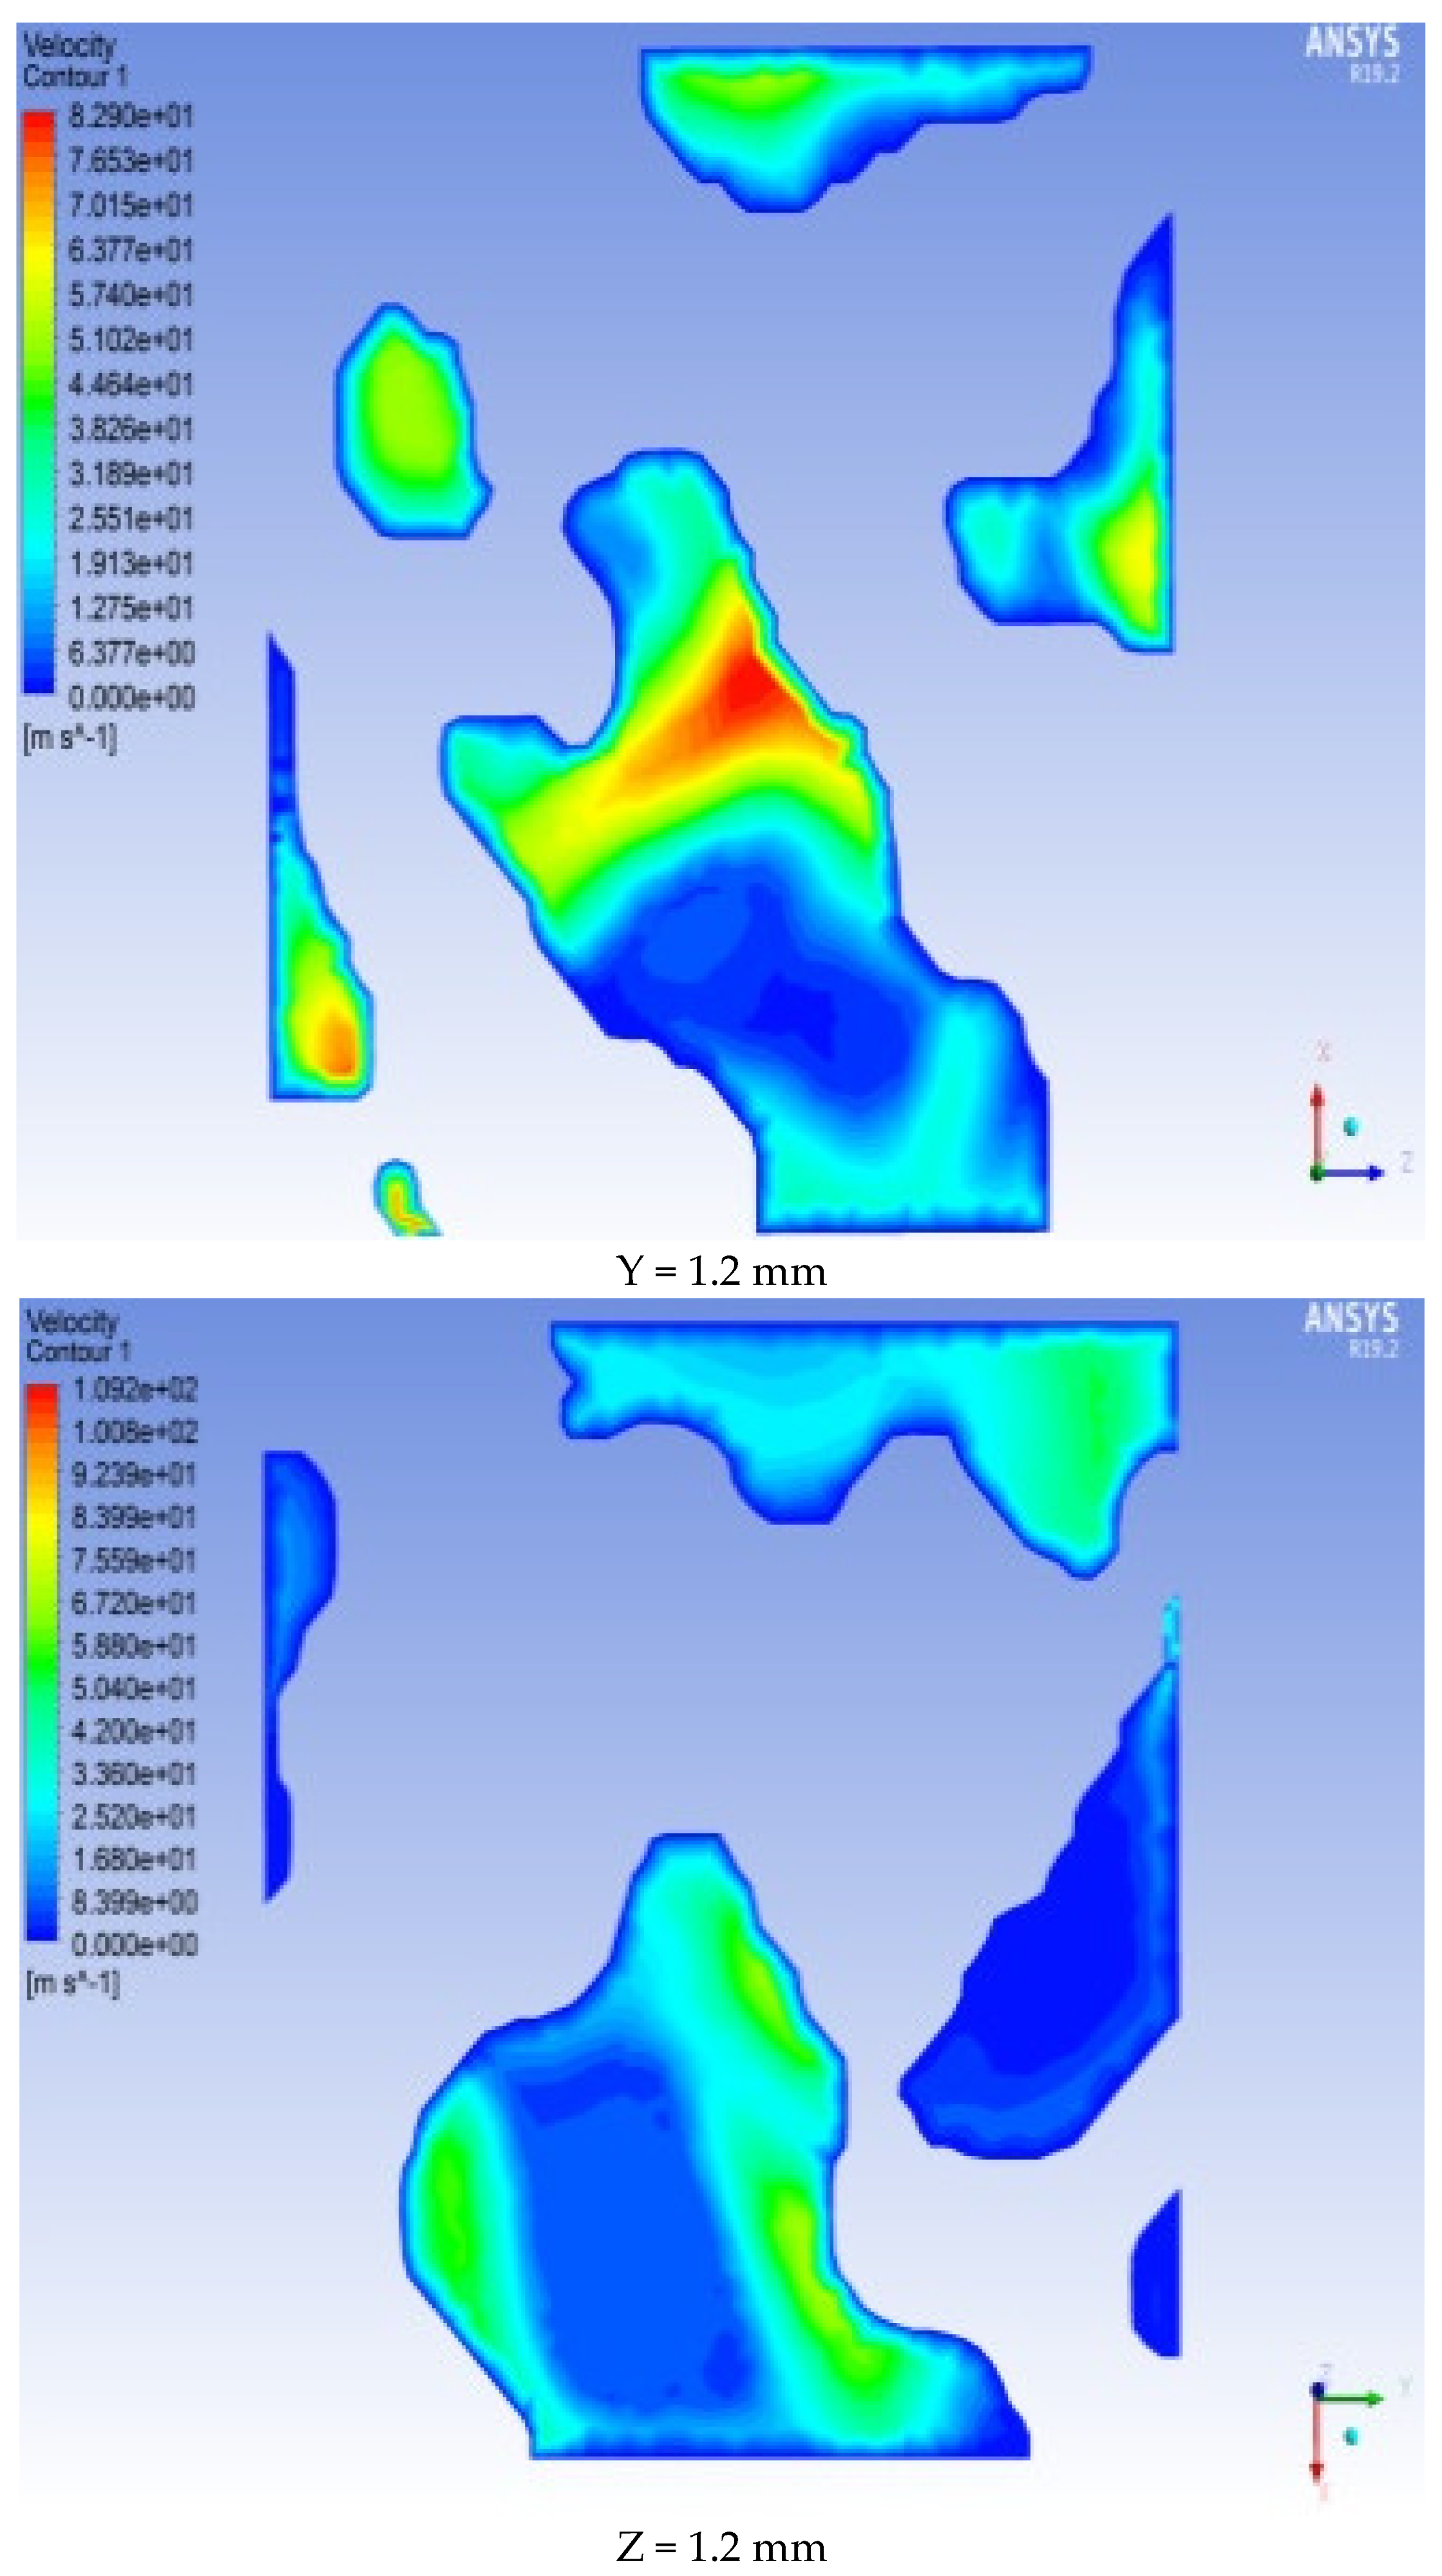
Cross-sections are set at different positions along the X, Y, and Z positive directions (X, Y, Z = 0 mm, 0.2 mm, 0.4 mm, 0.6 mm, 0.8 mm, 1 mm, and 1.2 mm from the ENP) to obtain each section. The pressure and velocity distributions on the surface are shown in Figure 13 and Figure 14 (selecting 0 mm, 6 mm, and 12 mm as examples).
As shown in Figure 13 and Figure 14, there are differences in the velocity fields in the three directions.
Figure 13 shows that the pressure distribution on the same cross-section is not uniform and that the pressure values vary at different positions. This finding indicates that the internal structure of the rock is irregular. Among the three directions of X, Y, and Z, the pressure drop in the Y and Z directions is faster than that in the X direction, and the pressure at the cross-section 0.2 mm from the entrance along the Y direction has the largest range of pressure change. Among them, the maximum pressure on the section at X = 0 mm (ENP) reaches 5 MPa. As the distance from the entrance end increases, the pressure in most of the X = 1.2 mm section is 0 MPa. At Y = 0 mm (ENP), the pressure reaches 5 MPa. As the distance from the entrance end increases, the pressure in most of the Y = 1.2 mm section is 0 MPa. The pressure cross-sectional view in the Z direction is equivalent to that in the X direction and Y direction. The microscopic pore morphology obviously changes in each section, and the pressure distribution is uneven in each section. From the ENS to the EXS, the pressure value gradually decreases along the seepage path. Specifically, the pressure in the section at Z = 0 mm (ENP) is the highest, with a value of 5 MPa. The pressure in the largest part of the Z = 1.2 mm section is 0 MPa.
According to Figure 14, the order of the average seepage velocity in the three seepage directions is Y > Z > X. The seepage velocity changes more obviously in the pore channels with sufficient seepage. Moreover, the seepage velocity is higher at the center of the pore channel. As the size of the pore channel decreases, the seepage velocity increases. Particularly where the pore radius abruptly changes, the rate of change in the seepage velocity is greater. Since the microscale seepage simulation considers the seepage of connected pores, there is no confining pressure restriction under high permeability water pressure. The pore diameter is only on the order of micrometers, so the seepage velocity will be larger than the value of the conventional seepage experiment of rock. The seepage simulation law of the positive single channel is similar to the seepage law obtained by researchers, such as [32,36], which confirms the previous research results and obtains an increasing number of detailed seepage laws.
The graphs of the average pressure, average velocity, and mass flow rate of each cross-section of X, Y, and Z positive direction seepage with an ENP of 5 MPa are shown in Figure 15, Figure 16 and Figure 17.
As shown in Figure 15, the change trend and range of the average seepage pressure of each section in the positive directions of X, Y, and Z are similar and gradually decrease along the seepage direction.
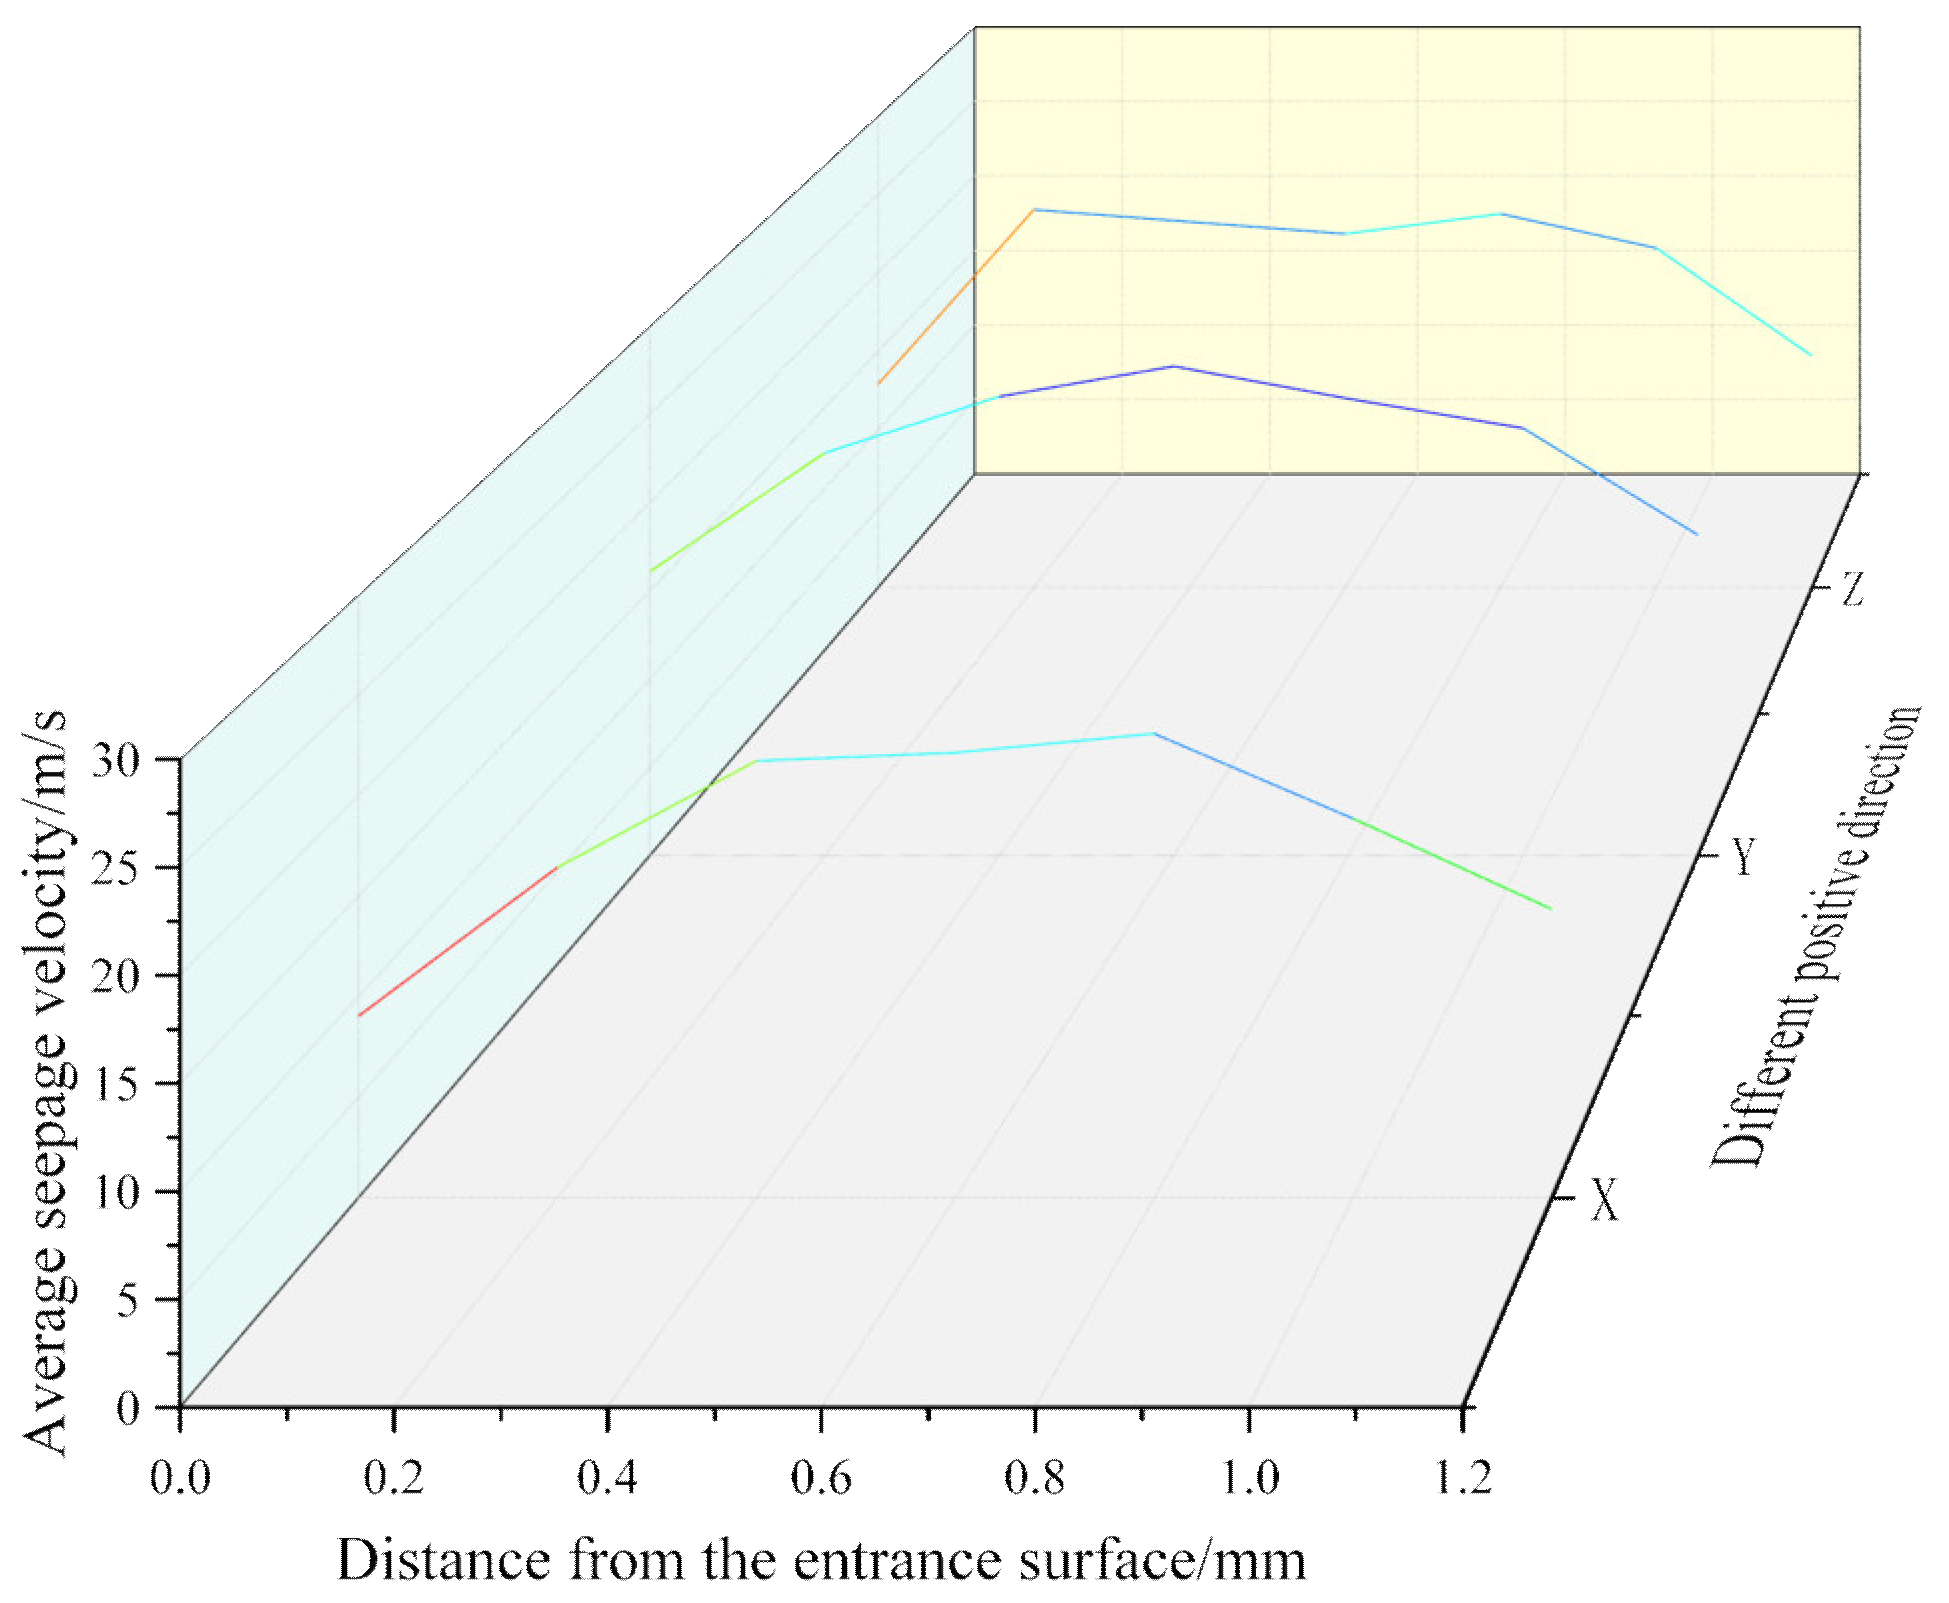
As shown in Figure 16, when the X, Y, and Z positive single-channel seepage flows, the average seepage velocity increases and then gradually decreases with increasing distance from the ENS. Specifically, the seepage velocity in the 0~0.8 mm section in the X direction significantly increases. Especially in the 0~0.4 mm section, the velocity increased by 140.6%. The velocity increase rate began to decrease in the 0.4~0.8 mm section, and the velocity in this section increased by 6.25%. The maximum average velocity of the X positive direction seepage occurs in the X = 0.8 mm section. The seepage velocity gradually decreases in the 0.8~1.2 mm section. The seepage velocity increases in the 0~0.6 mm section in the Y direction, and the increasing rate gradually decreases. The maximum average velocity of the Y positive direction seepage occurs at the Y = 0.6 mm section. The velocity gradually decreases in the section from 0.6 mm to 1.2 mm. The seepage velocity in the 0~0.2 mm zone in the Z direction significantly increases, and the velocity decreases in the 0.2 mm~0.8 mm zone. This shows that the radius of the pores in this section is larger. The seepage velocity gradually decreases in the 0.8~1.2 mm section. The order of the average seepage velocity in the three seepage directions is Y > Z > X, which shows local differences in seepage in different directions.
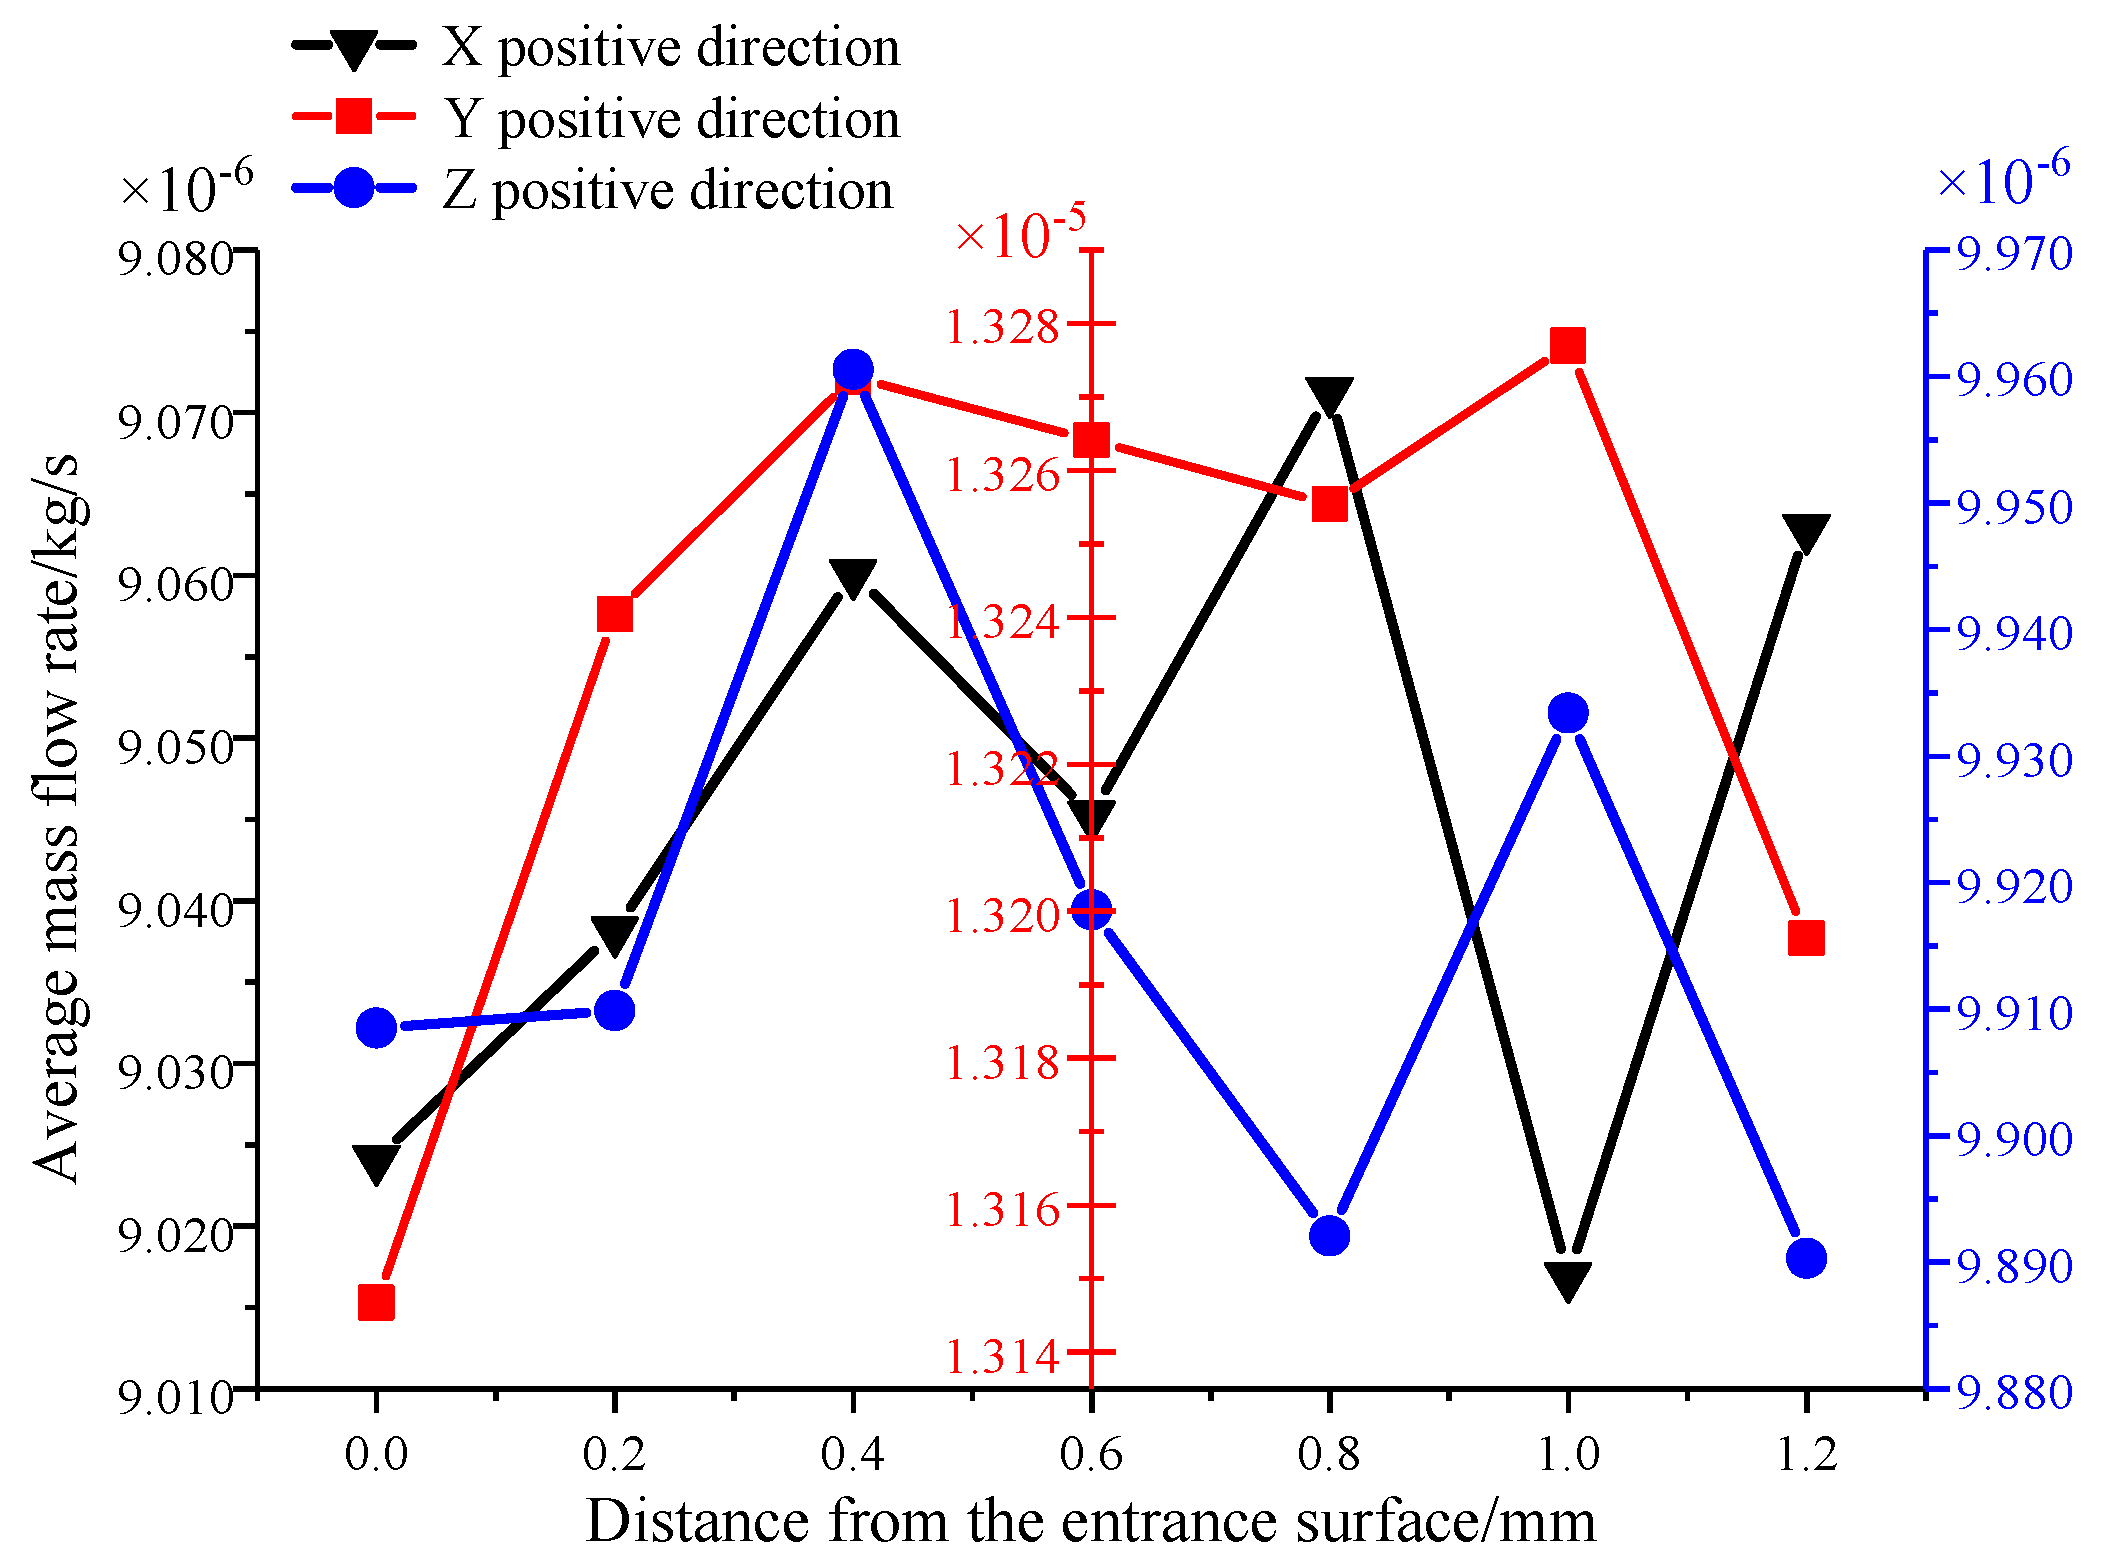
As shown in Figure 17, the X, Y, and Z positive average mass flow rates show similar trends in the Y and Z directions. The average mass flow rate of seepage in the X section at the X = 0.8 mm section has a tendency to increase because the seepage cross-sectional area in the X direction is the largest at this section, so the mass of seepage per unit time is also large. The order of the average mass flow rate is Y > X > Z.
In the seepage process, water flow will preferentially pass through pore channels with larger radii and shorter seepage paths. The seepage velocity is the largest at the center of the pore channel, the seepage velocity is smaller closer to the pore wall, and the seepage velocity can be regarded as zero at the position near the pore wall. From the perspective of the entire microscopic pore structure, the denser the streamlines are, the more seepage water in the pores. In addition, the model has a tendency to lower pressure where the seepage velocity is higher.
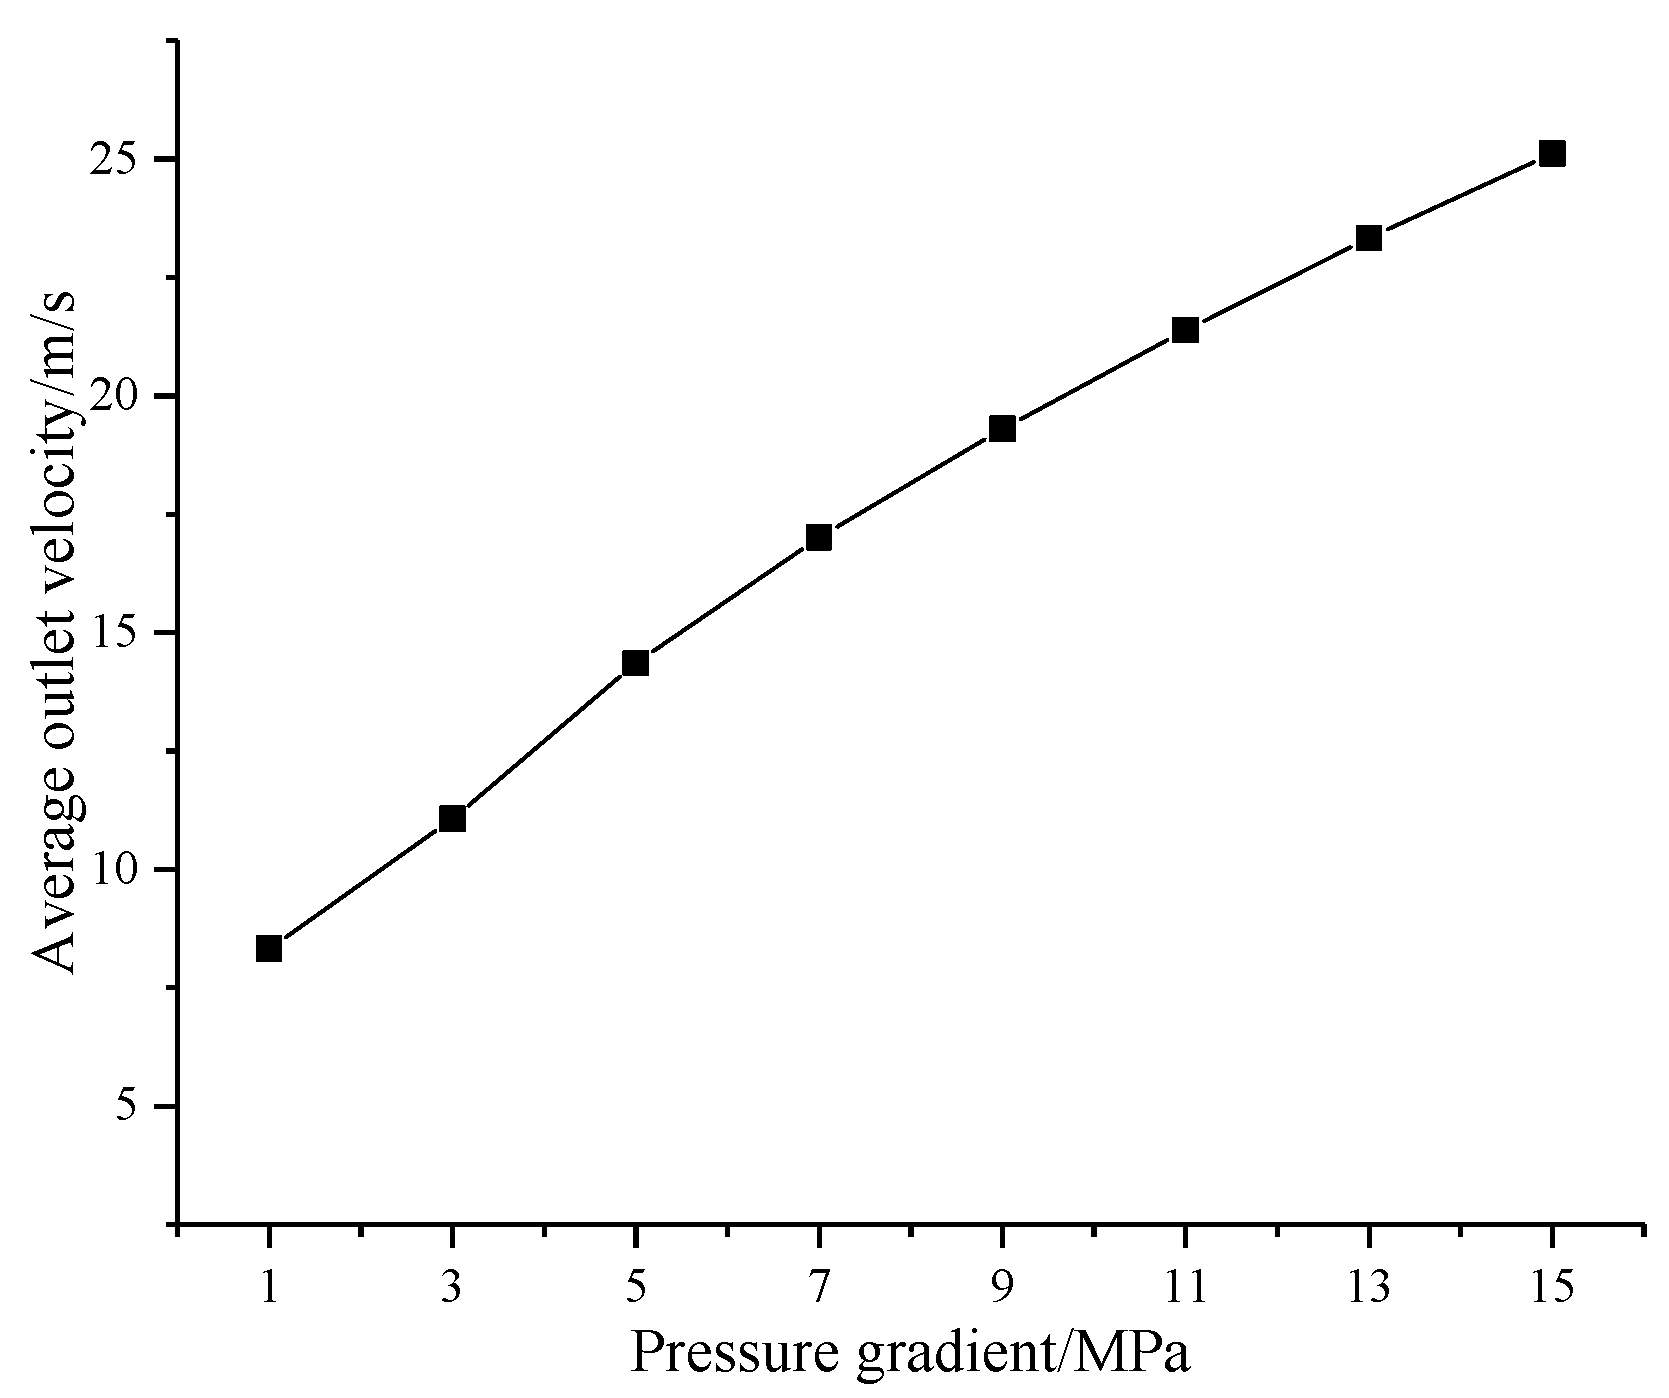
By extracting the average velocity of the EXSs, the curves of the ENSs and the EXSs velocity of the rock sample under different ENP conditions are obtained, as shown in Figure 18. The seepage velocity and ENP in the seepage process exhibit a nonlinear relationship. As the ENP increases, the flow rate of EXS slowly increases in the range of 1 to 3 MPa and increases faster in the range of 3 to 7 MPa. The relationship between the ENP and the flow rate in the interval of 7~15 MPa resembles a straight line, which shows that the starting pressure of water is approximately 3 MPa. As the ENP increases, first, the flow rate of EXS slowly increases because the starting pressure is not yet reached, and certain pores did not participate or fully participate in the seepage flow. Second, the pressure rapidly increases, and when the starting pressure is reached, the seepage starts to accelerate, and an increasing number of pores begins to participate in the seepage. The seepage flow is basically straight, and all seepage channels are opened.
4. Discussion
4.1. Negative Channel Seepape
Usually, percolation studies rarely involve negative channels (the opposite direction to the positive flow). This study presents the percolation properties of the negative channel.
Figure 19, Figure 20 and Figure 21 show the overall pressure distribution cloud diagram, the flow line diagram of the seepage velocity distribution, and the seepage velocity vector diagram of the pore model under an ENP of 5 MPa. The pore model is simulated for negative single-channel seepage in the three directions of X, Y, and Z.
As shown in Figure 19, Figure 20 and Figure 21, the pressure and velocity distributions of the X, Y, and Z positive entrance models show that the positive and negative seepage flows through the seepage channels are similar. The overall pressure distribution law of positive and negative seepage is similar. The trend and value of the positive and negative pressure changes in the X direction are also similar. However, the velocities of the ENS and EXS in the X positive and negative directions are obviously different. Y and Z directions have the same changing laws as the X direction. As shown in Figure 20 and Figure 21, the average seepage velocity at the entrance in the X positive direction is 9.03 m/s, and the average seepage velocity at the entrance in the X negative direction is 10.76 m/s. The average velocity of the Y positive-direction entrance is 16.08 m/s, and the average velocity of the Y negative-direction entrance is 15.11 m/s. The average velocity of the Z positive direction entrance is 12.92 m/s, and the average velocity of the Z negative direction entrance is 10.17 m/s. The highest velocities of both positive and negative seepage flow appear in the narrow positions of the pores with larger radii. The narrow positions of these pores restrict the flow of fluid, and only fluids with a higher flow rate can pass through the narrow pores.
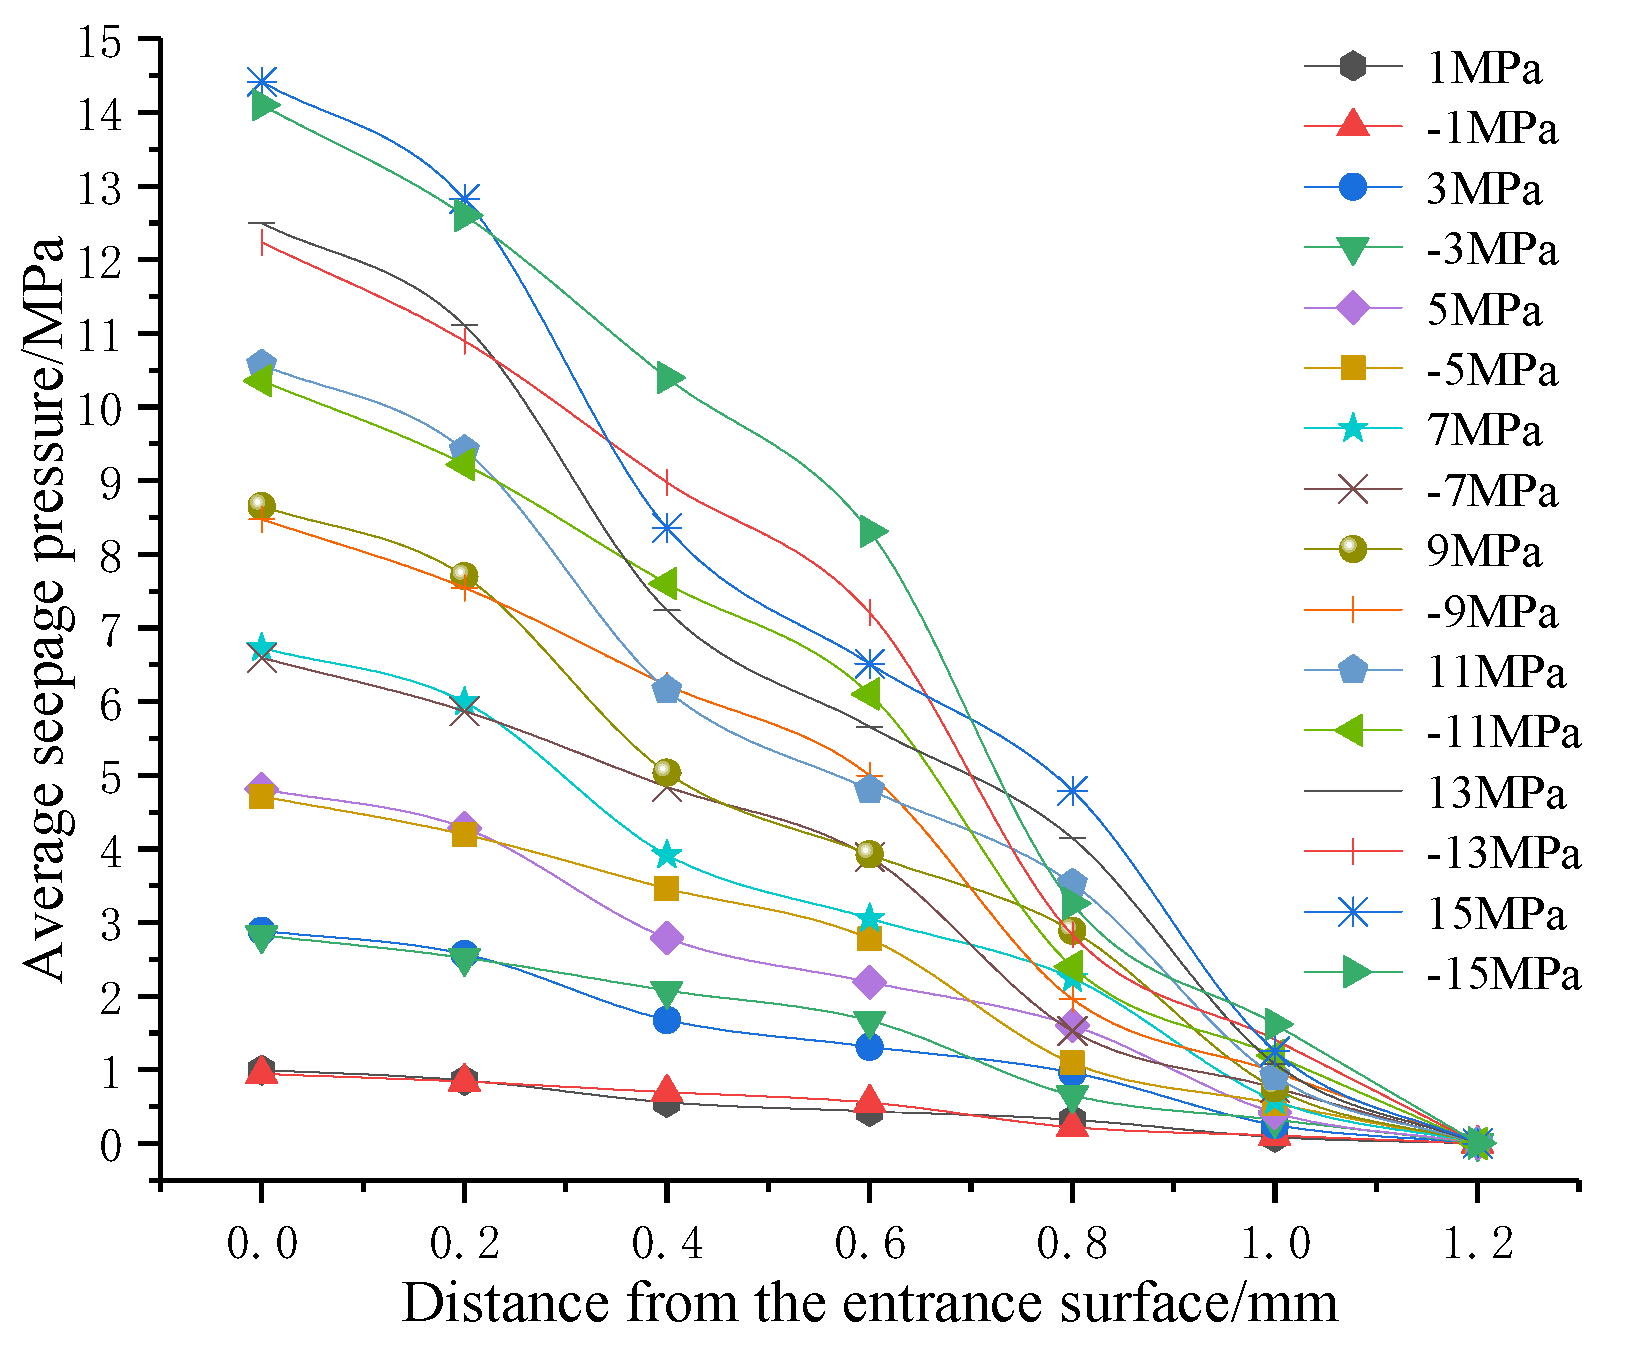
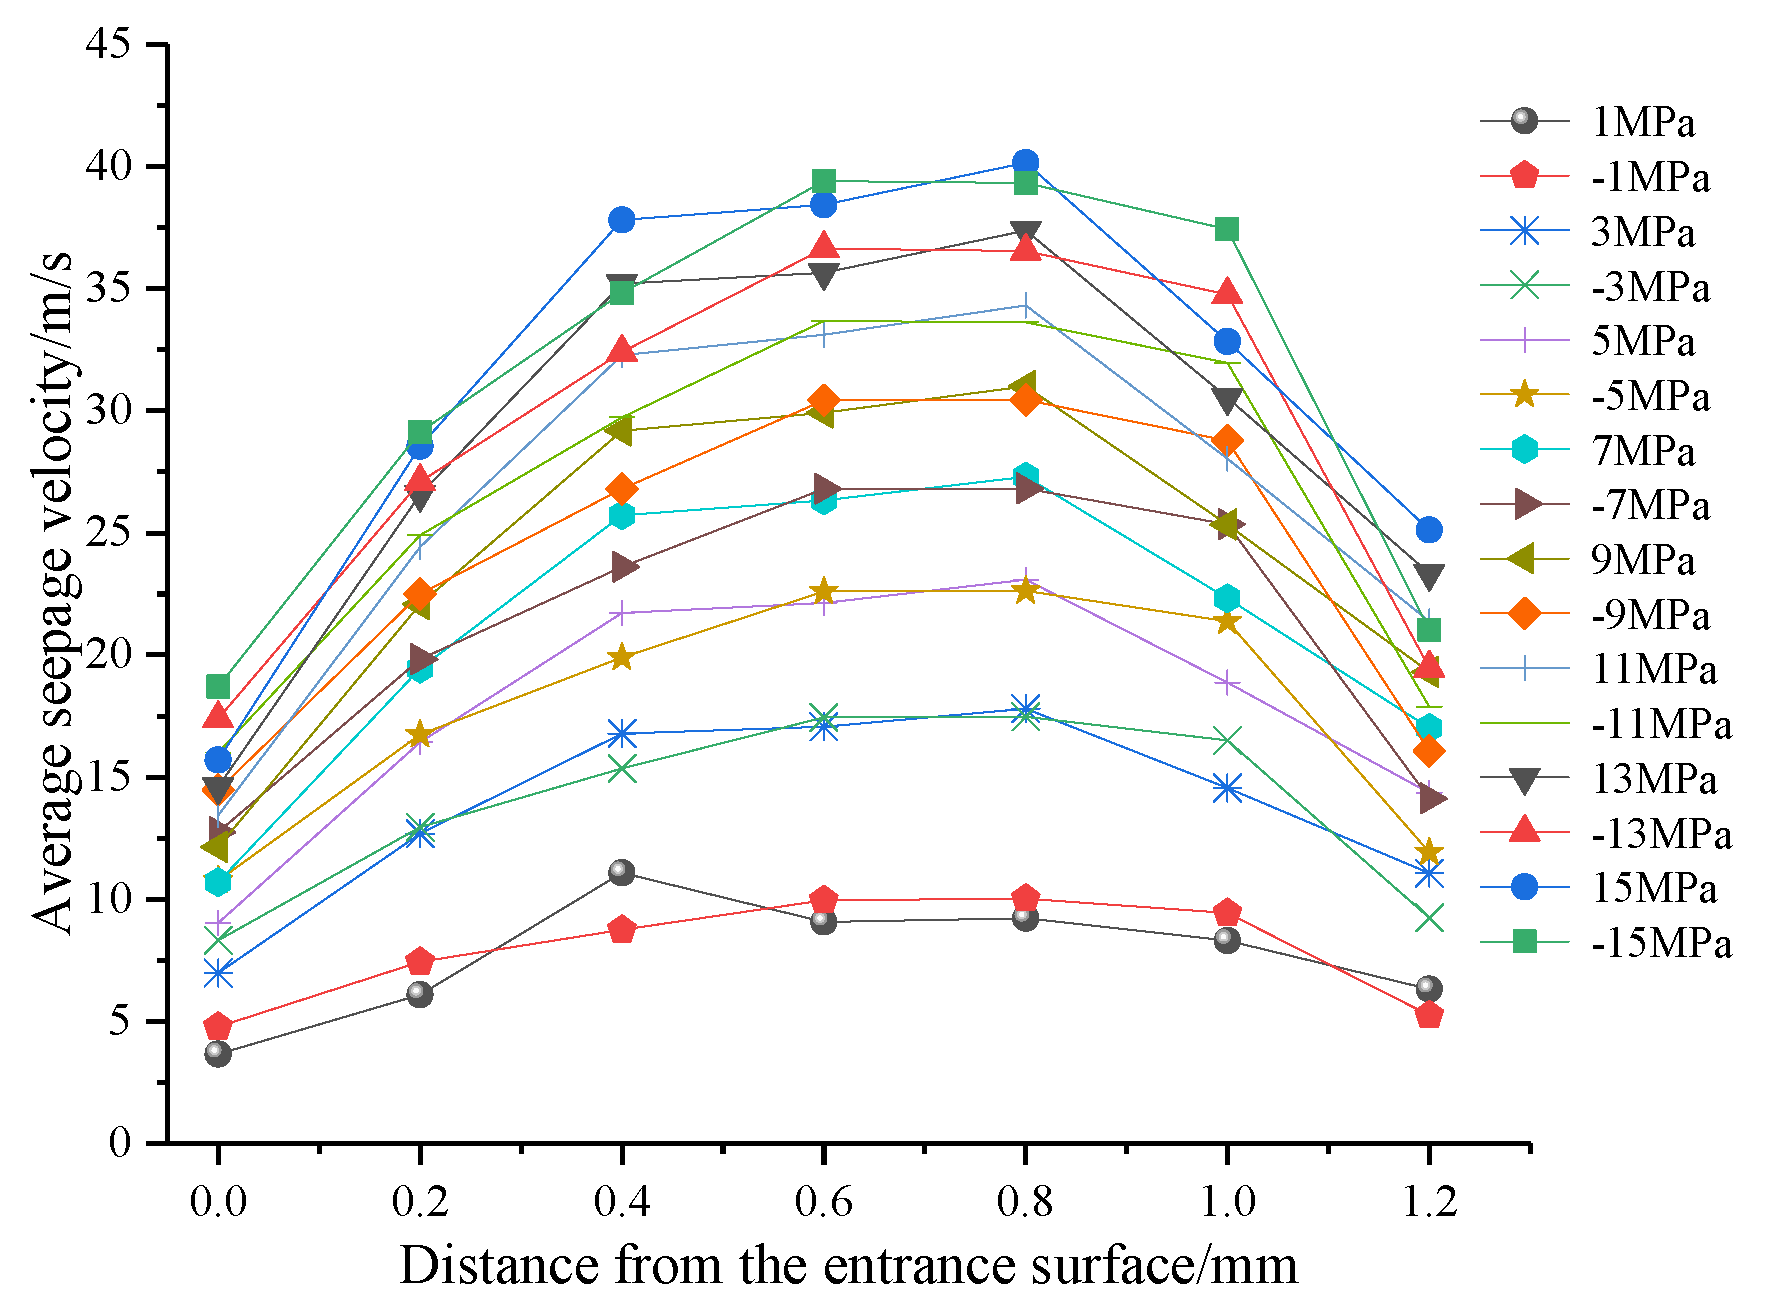
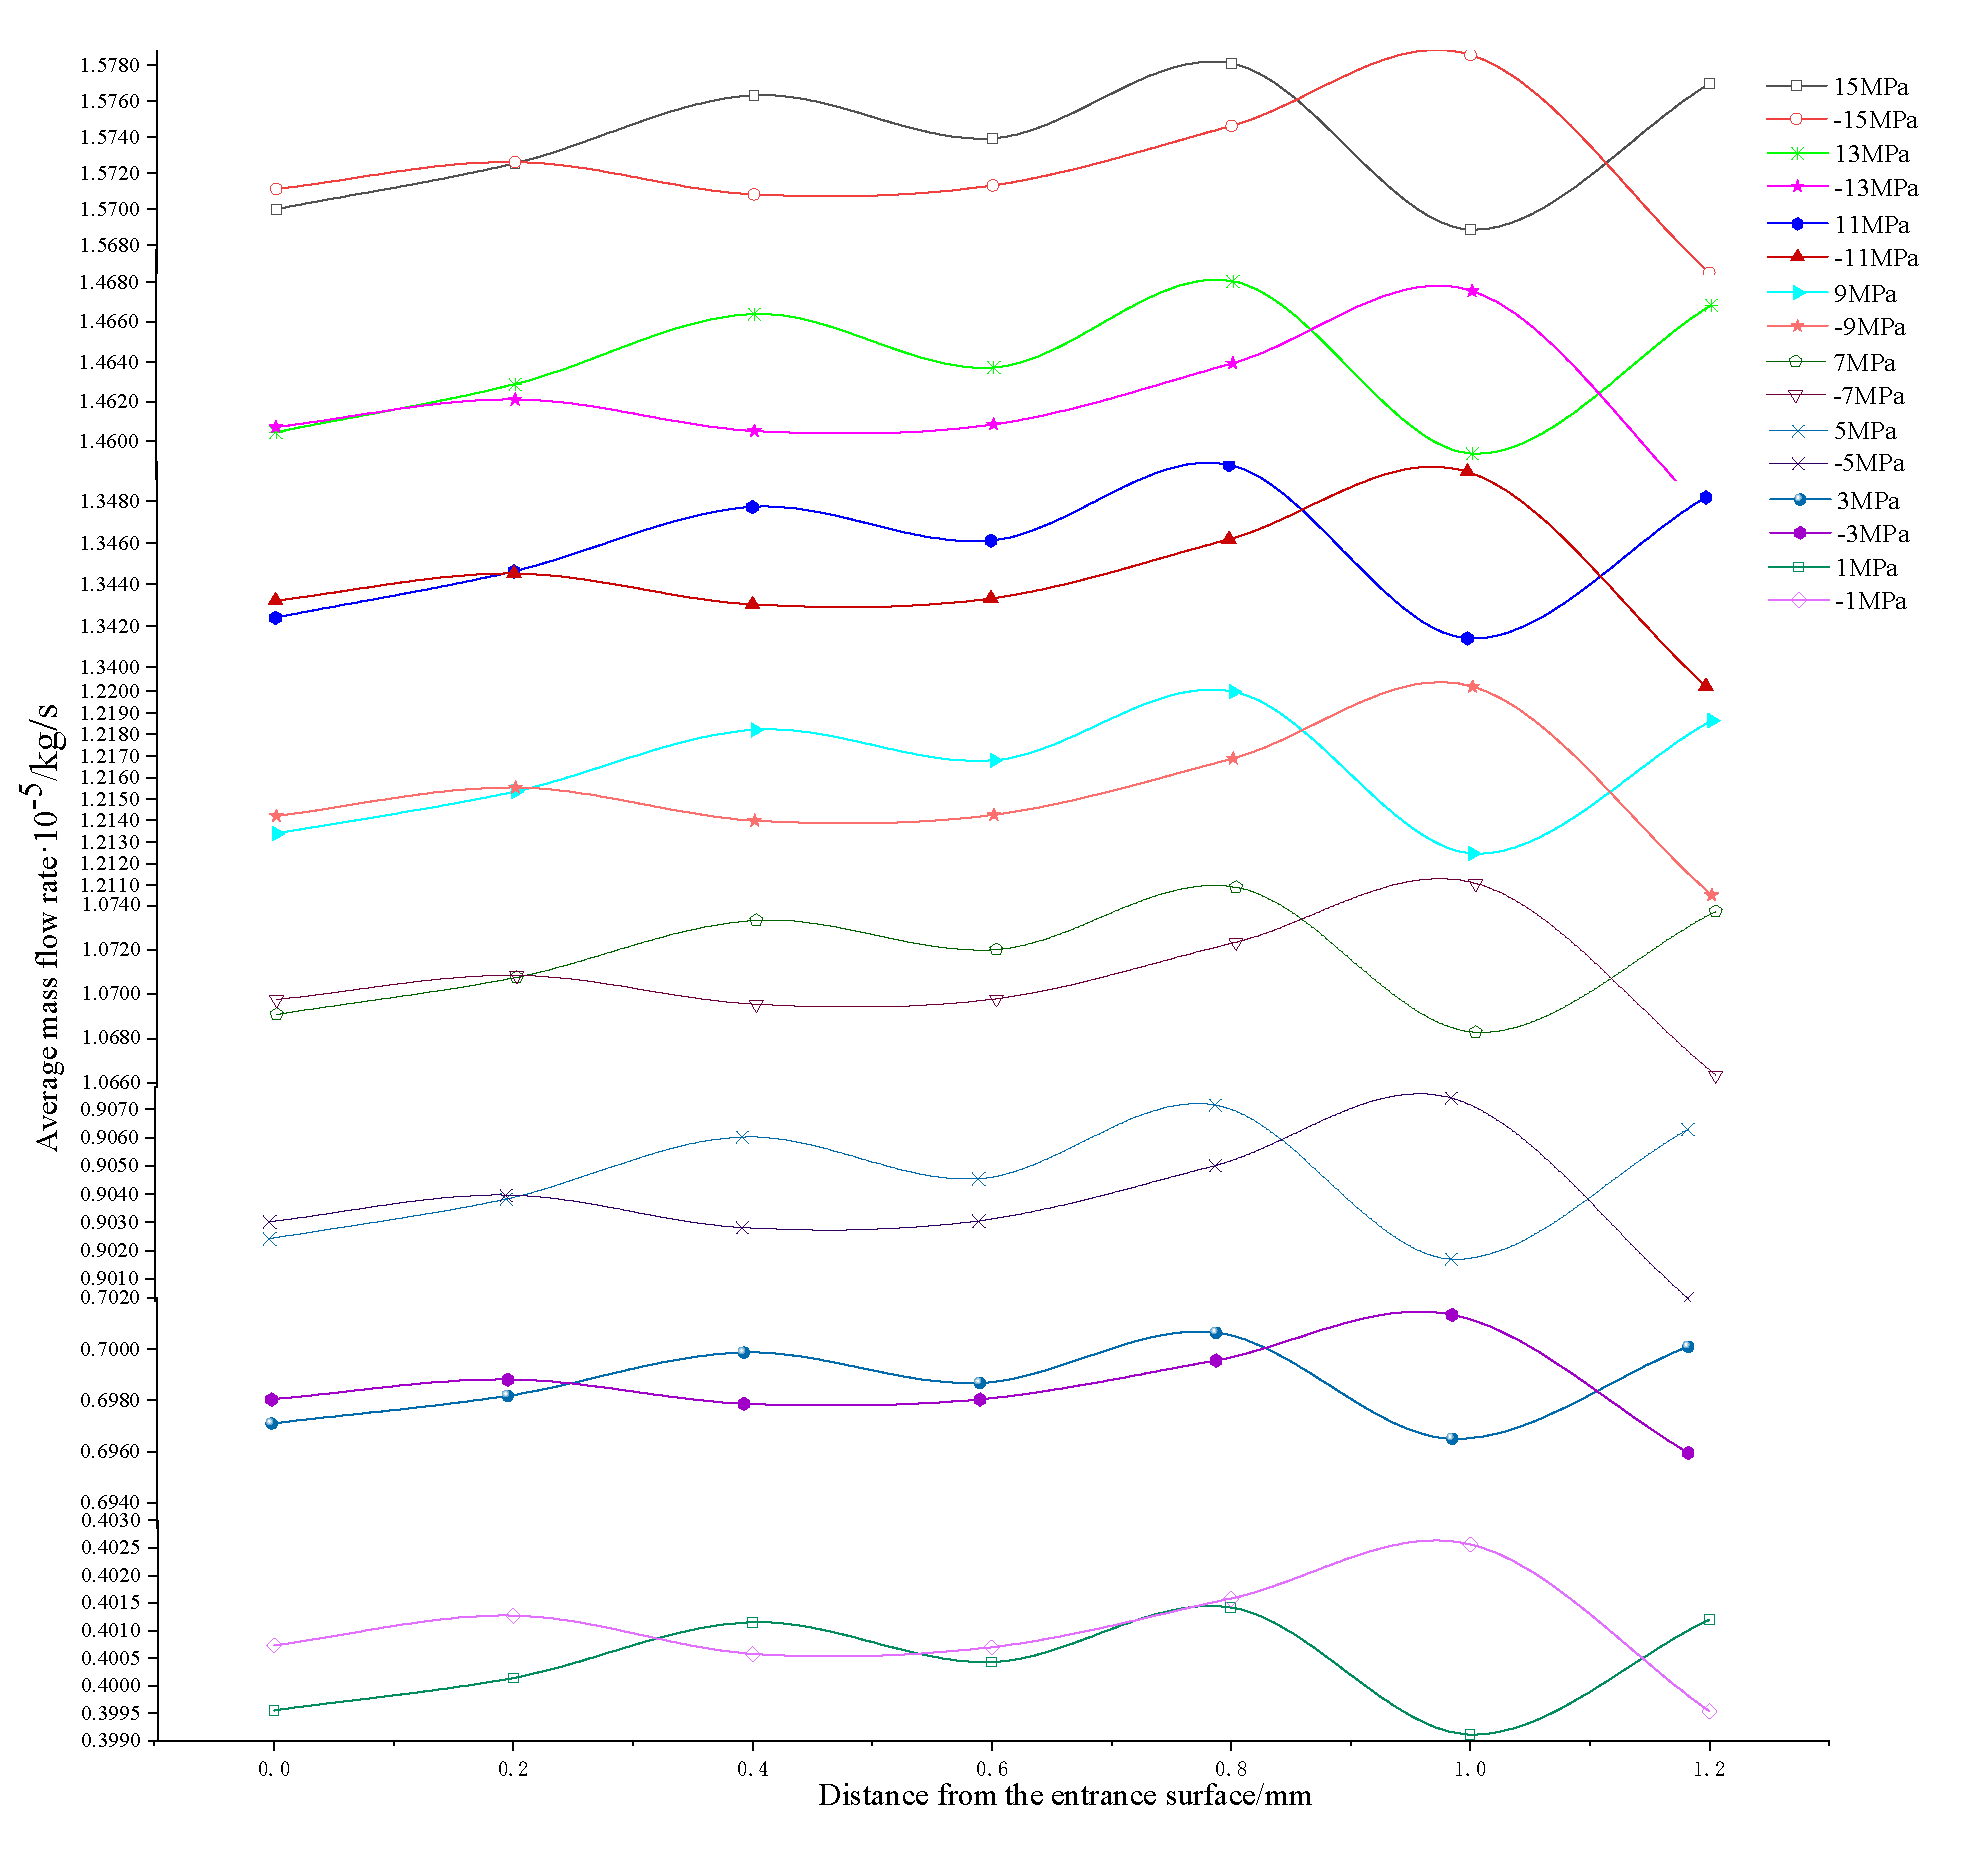
The curves of average pressure, average seepage velocity, and mass flow rate of each section (X positive direction and X negative direction) of a single channel of the pore model with different ENPs (1 MPa, 3 MPa, 5 MPa, 7 MPa, 9 MPa, 11 MPa, 13 MPa, and 15 MPa) are shown in Figure 22, Figure 23 and Figure 24.
Figure 22 shows that the trends of positive and negative seepage flow under different ENPs are identical. The farther from the ENS, the lower the average seepage pressure. The positive and negative seepage flows show a difference in pressure at the same distance from the ENS because the difference in pore structure and the change in pore radius will affect the change in pressure value. However, under the same ENP, the pressure drop of positive and negative seepage is equivalent, regardless of whether it is positive seepage or negative seepage, and the pressure loss is the same. Figure 23 and Figure 24 show that the fluid percolation in the pore channel is significantly affected by the pore structure. The maximum value of the seepage velocity when the same fluid flows through the same model with the positive and negative directions as the ENS and the minimum and average values is different. Along the seepage direction, the mass flow rate of the fluid entering from the negative ENS slowly increases and then begins to decrease within the distance close to the EXS. The mass flow rate of the fluid entering from the positive ENS presents a fluctuating state. At ENP = 1 MPa, the average mass flow rate of the positive ENS is lower than that of the negative ENS. When the ENP is 3~15 MPa, the average mass flow rate of positive seepage is slightly larger than that of negative seepage, and the average velocity of positive seepage is slightly larger than that of negative seepage. This finding shows that there are more positively connected pores inside, and the narrowness of certain pore structures enables positive direction seepage. Passing through these pore structures from the negative direction requires a higher flow rate.
Compared with the existing research results [48] under similar conditions, it can be seen that the research results have a certain similarity, that is to say, the research results are reliable.
4.2. Restrictions and Uncertainties
Other factors: pore pressure, in situ stress, changes in rock properties, changes in pore structure, and other factors can also be considered in the study. At the same time, the pore connectivity, void ratio, permeability and other factors in the seepage process are also very important. If the factors considered are studied, the results obtained should be more accurate. However, due to the limited computing power of the computers used in the research, if more and more sophisticated calculations are to be performed, more manpower, material resources, and financial support are required. That said, there is still some room for improvement in this study.
Size issues: If more precise sizes can be studied, the results should be more accurate. On the one hand, this study selected different sizes within the range to conduct multiple studies, and the results show that although there were some differences in the results, the differences were not large. On the other hand, this study discussed the issue through a multi-person meeting, which was approved by the person in charge of the construction site. Finally, according to the particle size range of the obtained rock sample, the data within the range were taken for calculation. More studies at different scales can be carried out in this study to obtain more precise findings.
Similar engineering application problems: For this study, the study of rock samples obtained from engineering sites is not necessarily applicable to other engineering sites. Since the results of this research will be applied in engineering later, it is necessary to focus on the specific conditions of the engineering rock first. At the same time, due to the accumulation of various data and experience in the project, other projects can be used for reference. In this study, the findings are mainly applicable to the geological conditions of the rock properties at this depth. Comparing the data in the research process with other projects may provide reference and guidance for more projects. Under the conditions of this study, it is especially necessary to pay attention to the various conditions of the geological survey reports of other projects.
5. Conclusions
This study combines the FEM, FCM, CT scanning calculation method, Avizo method, digital core technology, and other advanced calculation methods to explore the flow law of groundwater in the microscale pore structure of rock masses under different conditions.
- (1)
- The change trend of the overall pressure for the same model under different pressure gradients is a gradual decrease from the ENS to the EXS. The pressure drops sharply at a corner, and a threshold pressure must be exceeded to initiate the water seepage process. Seepage mainly occurs through pores with large radii. The seepage velocity increases with the ENP, but the seepage path is basically unchanged. In a pore channel, the largest seepage velocity occurs in the center of the pore, and the seepage velocity decreases with decreasing distance to the WS.
- (2)
- For the same model, the change trend and range of the seepage pressure in different seepage directions are similar, and the seepage pressure in all directions gradually decreases along the seepage direction. The average seepage velocity along the seepage direction increases and then gradually decreases with increasing distance from the ENS.
- (3)
- The fluid seepage law in the rock obtained in this study can effectively guide the arrangement of drainage pipes and other equipment and can serve as a reference for improving the efficiency of groundwater diversion. Although the techniques in this study can reflect the engineering situation to a certain extent, they are not completely consistent with the actual situation. Therefore, in the future, additional parameters can be considered, and more complex numerical models can be established to calculate results that are closer to reality. The disadvantage of this study is that the coupling effect of multiple parameters, such as multidirectional rock pressure, porosity change, and porosity were not fully considered.
Author Contributions
Y.W.: Conceptualization, data curation, methodology, writing—original draft. Y.-Z.L.: software, investigation, data curation, writing-review. W.-G.Q.: supervision, software, funding acquisition, validation. Z.-W.F.: writing-review and editing, investigation. S.Z.: validation, software. K.C.: software, supervision. L.Z.: investigation, visualization. All authors have read and agreed to the published version of the manuscript.
Funding
This study was financially supported by the National Natural Science Foundation of China (Grant No. 51774192 and 51474135), National Key Research and Development Program, China (Grant No. 2016YFC0600902).
Data Availability Statement
All data generated or analysed during this study are included in this published article. Some or all data that support the findings of this study are available from the corresponding author upon reasonable request.
Acknowledgments
Thanks to Shandong Provincial Key Laboratory of Disaster Prevention and Mitigation, Shandong University of Science and Technology.
Conflicts of Interest
The authors declare no conflict of interest.
References
- Wu, Y.; Qiao, W.; Li, Y.; Jiao, Y.; Zhang, S.; Zhang, Z.; Liu, H. Application of computer method in solving complex engineering technical problems. IEEE Access 2021, 9, 60891–60912. [Google Scholar] [CrossRef]
- Wu, Y.; Qiao, W.; Zhang, S.; Zhang, Z.; Li, Y.; Fan, Z.; Zhang, L. Application of computer simulation method in deep underground engineering of complicated geological condition. IEEE Access 2020, 8, 174943–174963. [Google Scholar] [CrossRef]
- Wu, Y.; Yang, X.X.; Sun, D.K. Experimental investigation of the mechanical behaviors of brittle rock materials containing en echelon boreholes. Arab. J. Geosci. 2020, 13, 425. [Google Scholar] [CrossRef]
- Cai, Q.; Yan, X. Global pattern of pollution manufacturing index. J. Clean. Prod. 2021, 286, 125497. [Google Scholar] [CrossRef]
- Gao, Y.; Qian, H.; Ren, W.; Wang, H.; Liu, F.; Yang, F. Hydrogeochemical characterization and quality assessment of groundwater based on integrated-weight water quality index in a concentrated urban area. J. Clean. Prod. 2020, 260, 121006. [Google Scholar] [CrossRef]
- Liu, J.; Peng, Y.; Li, C.; Gao, Z.; Chen, S. An investigation into the hydrochemistry, quality and risk to human health of groundwater in the central region of Shandong Province, North China. J. Clean. Prod. 2021, 282, 125416. [Google Scholar] [CrossRef]
- Zhang, Q.; Qian, H.; Xu, P.; Li, W.; Feng, W.; Liu, R. Effect of hydrogeological conditions on groundwater nitrate pollution and human health risk assessment of nitrate in Jiaokou Irrigation District. J. Clean. Prod. 2021, 298, 126783. [Google Scholar] [CrossRef]
- Gao, Y.; Jing, H.; Fu, G.; Zhao, Z.; Shi, X. Studies on combined effects of graphene oxide-fly ash hybrid on the workability, mechanical performance and pore structures of cementitious grouting under high W/C ratio. Constr. Build. Mater. 2021, 281, 122578. [Google Scholar] [CrossRef]
- Gao, Y.; Jing, H.; Zhou, Z.; Shi, X.; Li, L.; Fu, G. Roles of carbon nanotubes in reinforcing the interfacial transition zone and impermeability of concrete under different water-to-cement ratios. Constr. Build. Mater. 2021, 272, 121664. [Google Scholar] [CrossRef]
- Han, C.; Wei, J.; Zhang, W.; Zhou, W.; Yin, H.; Xie, D.; Yang, F.; Li, X.; Man, X. Numerical investigation of grout diffusion accounting for the dynamic pressure boundary condition and spatiotemporal variation in slurry viscosity. Int. J. Geomech. 2021, 21, 04021018. [Google Scholar] [CrossRef]
- Han, C.; Zhang, W.; Zhou, W.; Guo, J.; Yang, F.; Man, X.; Jiang, J.; Zhang, C.; Li, Y.; Wang, Z.; et al. Experimental investigation of the fracture grouting efficiency with consideration of the viscosity variation under dynamic pressure conditions. Carbonates Evaporites 2020, 35, 30. [Google Scholar] [CrossRef]
- Wu, Y.; Qiao, W.G.; Liu, H.N.; Li, Y.Z.; Zhang, S.; Xi, K.; Zhang, L. Research on sustainable development of fine-grained material cement slurry. Constr. Build. Mater. 2021, 302, 124155. [Google Scholar] [CrossRef]
- Wu, Y.; Qiao, W.; Li, Y.; Liu, H.; Tang, C.; Zhang, S.; Zhang, X.; Lu, J.; Chen, P. Research on Cement Slurry Using Silica Fume Instead of Fly Ash. Materials 2022, 15, 5626. [Google Scholar] [CrossRef]
- Zhang, S.; Qiao, W.G.; Chen, P.C.; Xi, K. Rheological and mechanical properties of microfine-cement-based grouts mixed with microfine fly ash, colloidal nanosilica and superplasticizer. Constr. Build. Mater. 2019, 212, 10–18. [Google Scholar] [CrossRef]
- Zhang, S.; Qiao, W.G.; Wu, Y.; Fan, Z.W.; Zhang, L. Optimization of microfine-cement-based slurry containing microfine fly ash and nano-CaCO3 for microfracture grouting. Bull. Eng. Geol. Environ. 2021, 80, 4821–4839. [Google Scholar] [CrossRef]
- Yuan, J.; Chen, W.; Tan, X.; Yang, D.; Zhang, Q. New method to evaluate antiwashout performance of grout for preventing water-inrush disasters. Int. J. Geomech. 2020, 20, 06019021. [Google Scholar] [CrossRef]
- Zhang, Q.S.; Zhang, L.Z.; Liu, R.T.; Li, S.C.; Zhang, Q.Q. Grouting mechanism of quick setting slurry in rock fissure with consideration of viscosity variation with space. Tunn. Undergr. Space Technol. 2017, 70, 262–273. [Google Scholar] [CrossRef]
- Hong, Q.; Lai, H.; Liu, Y.; Ma, X.; Xie, J. Deformation control method of a large cross-section tunnel overlaid by a soft-plastic loess layer: A case study. Bull. Eng. Geol. Environ. 2021, 80, 4717–4730. [Google Scholar] [CrossRef]
- Zheng, C.; Li, H.; Kizil, M.; Jiang, B.; Xue, S.; Yang, W.; Chen, Z. Performance enhancement of horizontal underground-to-inseam gas drainage boreholes with double-phase-grouting sealing method for coal mining safety and clean gas resource. J. Nat. Gas Sci. Eng. 2020, 76, 103179. [Google Scholar] [CrossRef]
- Zhou, W.F.; Liao, S.M.; Men, Y.Q. Effect of localized water pressure on mountain tunnels crossing fracture zone. Transp. Geotech. 2021, 28, 100530. [Google Scholar] [CrossRef]
- Jin, D. Construction technology and technology of casing sealing for pressure isolation and drainage in broken surrounding rock of roadway. Shandong Coal Sci. Technol. 2016, 12, 41–42. [Google Scholar]
- Pan, G.; Zhao, P.; Qiu, F. Application research on drainage and seepage control grouting technology and water gushing control. Coal Sci. Technol. 2016, 44, 95–101. [Google Scholar] [CrossRef]
- Pan, X.; Zheng, L.; Yu, H. Application of drainage grouting in pile foundation treatment of a project in Guangzhou. West. Prospect. Eng. 2020, 32, 29–30. [Google Scholar]
- Ren, S. Research on drainage and grouting sealing method of underground high pressure water inrush borehole. Coal Sci. Technol. 2019, 47, 213–218. [Google Scholar]
- Naderi, M. Assessing level of water resources management based on water supply and availability concepts. J. Clean. Prod. 2021, 305, 127086. [Google Scholar] [CrossRef]
- Fu, H.; An, P.; Li, K.; Cheng, G.; Li, J.; Yu, X. Grouting design of rich water tunnels and the calculation of distance between annular blind pipes. Adv. Civ. Eng. 2020, 2020, 8873971. [Google Scholar] [CrossRef]
- Wang, Y.; Pu, J.; Wang, L.; Wang, J.; Jiang, Z.; Song, Y.-F.; Wang, C.-C.; Wang, Y.; Jin, C. Characterization of typical 3D pore networks of Jiulaodong formation shale using nano-transmission X-ray microscopy. Fuel 2016, 170, 84–91. [Google Scholar] [CrossRef]
- Bakke, S.; Ren, P. 3-D Pore-Scale Modelling of Sandstones and Flow Simulations in the Pore Networks. SPE J. 1997, 2, 136–149. [Google Scholar] [CrossRef]
- Silin, D.; Patzek, T. Pore space morphology analysis using maximal inscribed spheres. Phys. A Stat. Mech. Its Appl. 2006, 371, 336–360. [Google Scholar] [CrossRef]
- Blunt, M.J. Pore level modeling of the effects of wettability. SPE J. 1997, 2, 494–510. [Google Scholar] [CrossRef]
- Zhang, L.; Jing, W.; Yang, Y.; Yang, H.; Guo, Y.; Sun, H.; Zhao, J.; Yao, J. The Investigation of Permeability Calculation Using Digital Core Simulation Technology. Energies 2019, 12, 3273. [Google Scholar] [CrossRef]
- Du, X. Research on the Micro-Flow Mechanism of Low Permeability Sandstone Reservoirs. Ph.D. Thesis, Southwest Petroleum University, Chengdu, China, 2012. Available online: https://kns.cnki.net/KCMS/detail/detail.aspx?dbname=CDFD1214&filename=1012516058.nh (accessed on 1 June 2012).
- Bai, R. Construction of Microscopic Pore Structure of Coal Body and Numerical Simulation of Low-Pressure Water Seepage Based on Micro-CT Technology. Master’s Thesis, Shandong University of Science and Technology, Qingdao, China, 2017. [Google Scholar]
- Wei, B. Application of Digital Core Technology to Simulate High Temperature and High Pressure Gas-Water Seepage. Master’s Thesis, Southwest Petroleum University, Chengdu, China, 2017. Available online: https://kns.cnki.net/KCMS/detail/detail.aspx?dbname=CMFD201702&filename=1017108155.nh (accessed on 1 June 2017).
- Wang, R. Research on Core Structure Reconstruction and its Seepage Law. Master’s Thesis, Wuhan Light Industry University, Wuhan, China, 2017. Available online: https://kns.cnki.net/KCMS/detail/detail.aspx?dbname=CMFD201801&filename=1018067529.nh (accessed on 1 June 2017).
- Lv, B. Three-Dimensional Characterization of Pores and Infiltration of Coal-Based Porous Carbon. Master’s Thesis, China University of Mining and Technology, Beijign, China, 2019. Available online: https://kns.cnki.net/KCMS/detail/detail.aspx?dbname=CMFD201902&filename=1019854357.nh (accessed on 1 June 2019).
- Gong, J. Three-Dimensional Reconstruction and Seepage Simulation of Coal-Based Porous Media. Master’s Thesis, China University of Mining and Technology, Beijign, China, 2020. [Google Scholar] [CrossRef]
- Hou, S. Research on microscopic seepage characteristics of low permeability uranium-bearing sandstone based on digital core. Master’s Thesis, University of South China, Hengyang, China, 2020. [Google Scholar] [CrossRef]
- Chen, J.; Liu, P.; Liu, L.; Zeng, B.; Zhao, H.; Zhang, C.; Zhang, J.; Li, D. Anchorage performance of a modified cable anchor subjected to different joint opening conditions. Constr. Build. Mater. 2022, 336, 127558. [Google Scholar] [CrossRef]
- Chen, J.; Zeng, B.; Liu, L.; Tao, K.; Zhao, H.; Zhang, C.; Zhang, J.; Li, D. Investigating the anchorage performance of full-grouted anchor bolts with a modified numerical simulation method. Eng. Fail. Anal. 2022, 141, 106640. [Google Scholar] [CrossRef]
- He, M.; Zhang, Z.; Zhu, J.; Li, N. Correlation Between the Constant m(i) of Hoek-Brown Criterion and Porosity of Intact Rock. Rock Mech. Rock Eng. 2022, 2, 923–936. [Google Scholar] [CrossRef]
- He, M.; Li, P. Initial Assessment on Hydraulic Conductivity of Rock Mass and its Size Effect Using Drilling Data. Groundwater 2022, 1. [Google Scholar] [CrossRef]
- Li, Z.; Liu, G.; Duan, S.; Pei, S.; Yan, C. Sensitivity Analysis in the Estimation of Mechanical Parameters of Engineering Rock Mass Based on the Hoek-Brown Criterion. Math. Probl. Eng. 2020, 2020, 9418905. [Google Scholar] [CrossRef]
- Zhang, F.; Wu, F.; Luo, R.; Yu, J.; He, W. Research on heterogeneity of Chang 6~1 and Chang 4+5~2reservoirs in Zhaojiatai area of Zibei Oilfield. Pet. Geol. Recovery Factor 2011, 18, 42–45. [Google Scholar] [CrossRef]
- Wu, Y.; Qiao, W.; Li, Y.; Zhang, S.; Sun, D.; Tang, C.; Liu, H.; Wang, T. Development and validation of environmentally friendly similar surrounding rock materials and cement slurry for surrounding rock repair and reinforcement. J. Clean. Prod. 2022, 347, 131288. [Google Scholar] [CrossRef]
- Wu, Y.; Liu, H.; Tang, C.; Zhu, Y.; Zhang, X. Research and Application of Fast-Strengthening Environment-Friendly Sulfoaluminate Cement Slurry on Taguchi Method. Processes 2022, 10, 965. [Google Scholar] [CrossRef]
- Zhu, Y.; Chen, H.; Li, A.; Wu, Y.; Zhang, X. Effect of Loading Conditions on the Shear Behaviors of Rock-like Materials Containing Circular Holes, with the CZM Method. Appl. Sci. 2022, 12, 4708. [Google Scholar] [CrossRef]
- Wu, Y.; Qiao, W.; Li, Y.; Fan, Z.; Zhang, S.; Zhang, L.; Zhang, X. Seepage of Groundwater in an Underground Fractured Rock Mass and Its Sustainable Engineering Application. Application. Appl. Sci. 2022, 12, 8221. [Google Scholar] [CrossRef]
Figure 1.
Pore type diagram.


Figure 2.
CT scanning equipment adopted.

Figure 3.
Schematic diagram of the principle of two-dimensional CT image superposition. (a) Slice scene graph. (b) 3D model diagram.
Figure 3.
Schematic diagram of the principle of two-dimensional CT image superposition. (a) Slice scene graph. (b) 3D model diagram.

Figure 4.
3D model reconstruction process.

Figure 5.
3D real core model.

Figure 6.
Schematic diagram of model entrance surface.

Figure 7.
Pressure cloud diagram of the X direction entrance under different pressures.


Figure 8.
Streamline diagram of seepage velocity distribution at the X direction entrance under different pressures.
Figure 8.
Streamline diagram of seepage velocity distribution at the X direction entrance under different pressures.


Figure 9.
Vector diagram of the seepage velocity distribution at the X direction entrance under different pressures.
Figure 9.
Vector diagram of the seepage velocity distribution at the X direction entrance under different pressures.


Figure 10.
X, Y, and Z positive single channel seepage pressure distribution. (a) X positive direction, (b) Y positive direction, and (c) Z positive direction.
Figure 10.
X, Y, and Z positive single channel seepage pressure distribution. (a) X positive direction, (b) Y positive direction, and (c) Z positive direction.

Figure 11.
Streamline diagram of X, Y, and Z positive single channel seepage velocity distribution. (a) X positive direction, (b) Y positive direction, and (c) Z positive direction.
Figure 11.
Streamline diagram of X, Y, and Z positive single channel seepage velocity distribution. (a) X positive direction, (b) Y positive direction, and (c) Z positive direction.

Figure 12.
X, Y, and Z positive single channel seepage velocity distribution vector diagram. (a) X positive direction, (b) Y positive direction, and (c) Z positive direction.
Figure 12.
X, Y, and Z positive single channel seepage velocity distribution vector diagram. (a) X positive direction, (b) Y positive direction, and (c) Z positive direction.

Figure 13.
X, Y, and Z positive single channel seepage pressure cloud diagram of different cross-sections.
Figure 13.
X, Y, and Z positive single channel seepage pressure cloud diagram of different cross-sections.


Figure 14.
X, Y, and Z positive single channel seepage velocity cloud diagram at different cross-sections.
Figure 14.
X, Y, and Z positive single channel seepage velocity cloud diagram at different cross-sections.


Figure 15.
Curves of mean pressure at different cross-sections of X, Y, and Z seepage.

Figure 16.
Curves of average seepage velocity at different cross-sections of X, Y, and Z seepage.

Figure 17.
Curves of average mass flow rate in different sections of Y and Z seepage.

Figure 18.
Relationship between entrance pressure and exit flow rate.

Figure 19.
X, Y, and Z negative single channel seepage water pressure distribution diagram. (a) X negative direction, (b) Y negative direction, and (c) Z negative direction.
Figure 19.
X, Y, and Z negative single channel seepage water pressure distribution diagram. (a) X negative direction, (b) Y negative direction, and (c) Z negative direction.

Figure 20.
X, Y, and Z negative single channel seepage velocity distribution streamline diagram. (a) X negative direction, (b) Y negative direction, and (c) Z negative direction.
Figure 20.
X, Y, and Z negative single channel seepage velocity distribution streamline diagram. (a) X negative direction, (b) Y negative direction, and (c) Z negative direction.

Figure 21.
X, Y, and Z negative single channel seepage velocity distribution vector diagram. (a) X negative direction, (b) Y negative direction, and (c) Z negative direction.
Figure 21.
X, Y, and Z negative single channel seepage velocity distribution vector diagram. (a) X negative direction, (b) Y negative direction, and (c) Z negative direction.

Figure 22.
Pressure curves of each section under different pressure drops.

Figure 23.
The seepage velocity curve of each section under different pressure drops.

Figure 24.
The mass flow rate curve of each section under different pressure drops.

Publisher’s Note: MDPI stays neutral with regard to jurisdictional claims in published maps and institutional affiliations. |
© 2022 by the authors. Licensee MDPI, Basel, Switzerland. This article is an open access article distributed under the terms and conditions of the Creative Commons Attribution (CC BY) license (https://creativecommons.org/licenses/by/4.0/).
Share and Cite
MDPI and ACS Style
Wu, Y.; Li, Y.-Z.; Qiao, W.-G.; Fan, Z.-W.; Zhang, S.; Chen, K.; Zhang, L. Water Seepage in Rocks at Micro-Scale. Water 2022, 14, 2827. https://doi.org/10.3390/w14182827
AMA Style
Wu Y, Li Y-Z, Qiao W-G, Fan Z-W, Zhang S, Chen K, Zhang L. Water Seepage in Rocks at Micro-Scale. Water. 2022; 14(18):2827. https://doi.org/10.3390/w14182827
Chicago/Turabian StyleWu, Yue, Yan-Zhi Li, Wei-Guo Qiao, Zhen-Wang Fan, Shuai Zhang, Kui Chen, and Lei Zhang. 2022. "Water Seepage in Rocks at Micro-Scale" Water 14, no. 18: 2827. https://doi.org/10.3390/w14182827
Note that from the first issue of 2016, this journal uses article numbers instead of page numbers. See further details here.