
Study on Soil Leaching Risk of Reuse of Reclaimed Fertilizer from Micro-Flush Sanitary Wastewater
by
Minghuan Lv
1,2,†,
Shikun Zhu
1,2,*,†,
Yunpeng Shi
1,2,
Shangyi Shu
1,2,
Ao Li
1,2 and
Bin Fan
1,2,* 1
Research Center for Eco-Environmental Sciences, Chinese Academy of Sciences, Beijing 100085, China
2
University of Chinese Academy of Sciences, Beijing 100049, China
*
Authors to whom correspondence should be addressed.
†
These authors contributed equally to this work.
Water 2022, 14(18), 2823; https://doi.org/10.3390/w14182823
Submission received: 2 July 2022
/
Revised: 2 September 2022
/
Accepted: 7 September 2022
/
Published: 10 September 2022
(This article belongs to the Section Wastewater Treatment and Reuse)
Abstract
:In view of the potential soil leaching risk of the reuse of fertilizer reclaimed from micro-flush sanitary wastewater, the batch tests of soil adsorption and degradation, soil column percolation test and multi-stage soil box percolation test were adopted. The characteristics of leachate after the interaction between reclaimed fertilizer and soil, as well as the changes of soil attributes in the soil box system, were analyzed. After obtaining the correlation coefficients of solute transport in soil through the above experiments, the HYDRUS-1D model was constructed to simulate the solute migration and transformation in the soil with a duration of 1 year and a soil thickness of 5 m. The impacts of leachate on groundwater and soil were analyzed. The results showed that the adsorption intensity of total ammonia nitrogen (TAN) () in the tested soil was lower than that of chemical oxygen demand (COD) (). The HYDRUS prediction showed that concentrations of TAN and COD at the soil depth of 5 m were 0, while total nitrogen (TN) still had a concentration of 0.11 mg/L. However, the TN leaching into the deep soil mainly came from the soil itself. The TAN at 3.4 m soil showed an upward trend in the prediction period. In addition, the reuse of reclaimed fertilizer can expand the soil nutrient inventory, which is conducive to the improvement of soil fertility. It can be concluded that the soil leaching risk of reuse of reclaimed fertilizer is not significant in the short term (one year). However, the risk of fertilization on soil with high-nitrogen background value should be paid attention to in the long term.
1. Introduction
Human excreta and kitchen wastes are potential fertilizers for agricultural production and can be collected by means of ‘Micro-flush Pipeline transportation’ [1,2,3,4]. This paper defined the toilet and kitchen wastewater (toilet cleaning water ≤ 1.5 L/time, and the ratio of kitchen wastes to water volume is about 1:1) collected by micro-flush pipeline transportation as micro-flush Sanitary Wastewater (SW). Under the circumstances of meeting the sanitation standards, the micro-flush SW generally needs to be fermented through the three-compartment septic tank. The liquid discharged from the septic tank and the sediments cleaned regularly can be used as fertilizer, which is especially suitable for rural settlements adjacent to farmland ecosystems [5,6]. The water consumption of the micro-flush toilet is much lower than that of the conventional flush toilet (6 L/time). However, the water content of micro-flush SW is still very high (about 98%). In view of the high solvability, fluidity and soil permeability of water, it is necessary to pay attention to the environmental contamination risk of the liquid fertilizer reclaimed from SW when it is reused in the field, especially the risk of the nutrients and organic matter in the soil being leached into the groundwater by the water in the fertilizer [7,8,9]. In addition, the short-term reuse of reclaimed fertilizer may not have a significant impact on soil and groundwater, but the long-term reuse on the same land will produce risk superposition effect, resulting in the load of organic matter, nutrients and other substances exceeding the environmental capacity. Therefore, it is necessary to establish a prediction model to simulate and evaluate the environmental contamination effect induced by long-term reuse of reclaimed fertilizer.
When studying the solute transport in the shallow vadose zone, the relevant parameters of soil and hydraulics in the vadose zone and the distribution characteristics of pollutants can be obtained by experimental means. The laws of migration and transformation of substances in soil can be preliminarily studied by using soil static adsorption batch test and soil degradation kinetics test [10,11]. The soil leaching test can not only be used to determine the components of leachate but also to study the impact of wastewater on soil attributes [12,13]. However, when taking large-scale area or deep aeration zone as the object of study, sampling is often difficult. So, it is necessary to carry out simulation calculations with the help of computer software on the basis of referring to empirical parameters. HYDRUS-1D software can comprehensively consider the multiple effects of adsorption and microbial degradation in soil, establishing a one-dimensional numerical model of solute transport in variable saturated soil according to the different types of soils and boundary conditions [14]. It solves the solute transport through finite element calculation by using convection dispersion equation and simulates the migration and transformation of substances in soil depth profile with time. At present, HYDRUS-1D model is not only used to evaluate the agricultural problem of irrigation schemes but also the impact of plants on soil water budget and groundwater recharge [15,16,17], but also widely applied in the environmental problem of the migration of different solutes and particles in soil. Most objects of the research are nitrates, antibiotics and toxic and harmful substances [18,19,20,21,22]. In addition, the HYDRUS model can estimate or calibrate soil solute transport parameters based on measured data inversion [23,24]. Since the composition of liquid digestate obtained by different raw materials, anaerobic digestion parameters and treatment methods is different, it is difficult to compare the migration of various fertilizer in soil. Therefore, it is necessary to take SW as the research object for targeted analysis.
The content of heavy metals in SW is pretty low [25], and it can be removed fairly well by anaerobic fermentation [26,27,28,29]. Drug residues and hormone components in human feces and urine need to be removed by expensive technical means, such as electrodialysis, nanofiltration and advanced oxidation, while conventional municipal sewage treatment does not usually include such process units. Therefore, it is far-fetched to overemphasize the pollution risk of these components in SW [30]. In addition, the degradation rate of sex hormones on cultivated land is very fast [31], and the anaerobic digestion process of municipal sludge can remove more than 60% of antibiotics and natural estrogen [32]. Hence, these parameters will not be considered. This study will focus on the environmental pollution path of soil leaching of treated SW. The interception law of nitrogen, phosphorus and organic matter by soil will be analyzed, and the physical and chemical characteristics of leachate and the change of soil nutrient content after long-term reuse will be researched.
This study intends to predict the migration and transformation law of reclaimed fertilizer in the soil within a certain time range through HYDRUS-1D software, so as to evaluate whether it is a leaching risk to groundwater. Based on the simulation of the corrected model of HYDRUS-1D, the soil leaching risk of the reuse of fertilizer reclaimed from SW with soil as the absorption carrier can be evaluated, which will provide scientific guidance for the prevention and control of the contamination risk.
2. Materials and Methods
2.1. Feedstock
The feedstocks of batch tests, soil column and soil box percolation tests were the SW treated by micro-mesh septic tank (MMST), which was a treatment facility based on the traditional septic tank configuration with multi-step micro meshes. MMST had the functions of anaerobic fermentation and particle interception. The effluent of MMST (the reclaimed fertilizer) can ensure health safety and biological safety. Before the test, several liters of reclaimed fertilizer were collected at one time and stored in plastic barrels for use. Since the actual SW was used, the properties of fertilizer used in different tests were different, and the corresponding specific values are shown in Table 1.
The soil used in the tests were the cultivated layer soil taken from the test field (0–20 cm thick) in Rugao, Jiangsu province (32°00′–32°30′ N, 120°20′–120°50′ E). The average annual temperature and precipitation of the test site is 14.9 °C and 1052.9 mm·a−1, respectively. The groundwater level is 3–3.50 m, and the altitude is 2–6 m. The tested soil is sandy loam with an average bulk density and water content of 1.39 g/cm3 and 17%, respectively. The organic matter of the soil is 31.78 g/kg.
2.2. Experiment Design
2.2.1. Batch Tests of Soil Adsorption
- (1)
- Adsorption kinetics test
The tested soil was placed into an oven at 105 °C for more than 4 h to dry the soil and minimize the interference of microbial activities [33]. Then, the soil was passed through a 100-mesh sieve after cooling. The sieved soil was stirred evenly on the enamel plate and several portions of 60 g soil sample were weighed into 150 mL brown conical flasks with stopper. After that, 120 mL of reclaimed fertilizer was added to the flasks of each test group at a soil: water ratio of 1:2. In order to eliminate the influence of nutrients and organic matter desorption in the tested soil on the equilibrium adsorption concentration, a control group was set up and 120 mL of deionized water was added [34]. The stoppered conical flasks were put into a constant temperature oscillation box with a temperature of 25 °C and an oscillation frequency of 200 r/min for oscillation and adsorption. At 0, 0.5, 1, 2, 4, 8, 12, 24, 32 and 48 h after the start of oscillation, three samples of the test group and one sample of the control group were taken out and centrifuged for 5 min under the condition of 3000 r/min, and the supernatant was taken to detect TAN, TN, TP, COD and other indicators. The adsorption capacity of soil was calculated with Equation (1) [10].
is the adsorption capacity, mg/g. is the initial concentration of pollutants, mg/L. is the difference between the concentration of the test group and that of the control group when the adsorption reaches equilibrium, mg/L. is the volume of feedstock, L. is the mass of soil sample, g.
- (2)
- Isothermal adsorption test
According to the soil sample treatment method described in Adsorption kinetics test, after filling soil in brown conical flasks, 120 mL of reclaimed fertilizer was added with different dilution multiple, respectively. The dilution multiple and concentrations are shown in Table 2. Three groups of parallel samples for each dilution multiple were set. An amount of 120 mL of deionized water was added into the flasks of the control group, which also had three groups of parallel samples. The conical flasks were put into a constant temperature oscillation box with a temperature of 25 °C and an oscillation frequency of 200 r/min. The flasks were taken out and centrifuged to determine the indexes of the supernatant after the soil adsorption reached equilibrium. The adsorption equilibrium time can be obtained according to the results of adsorption kinetics test. The adsorption capacity of soil sample was calculated with Equation (2).
where, is the equilibrium adsorption capacity, mg/g. is the equilibrium adsorption concentration, mg/L.
2.2.2. Batch Test of Soil Degradation
In order to determine the degradation coefficient of organic matter and nitrogen compounds in the reclaimed fertilizer by soil microorganisms under anaerobic conditions, the air-dried soil was passed through 30-mesh screen. Several parts of 60 g soil samples were weighed and placed in 150 mL conical flasks with stopper. An amount of 120 mL of reclaimed fertilizer was added to the flasks of each test group, and 120 mL of deionized water was added to the flasks of the control group. Conical flasks with stoppers were used to simulate anaerobic condition. The conical flasks were put into a constant temperature oscillation box with a temperature of 25 °C and an oscillation frequency of 200 r/min. Three flasks of test group and one flask of control group were taken out at regular intervals for centrifugation and determination. The concentrations of TAN, TN, TP and COD of the supernatant were detected. At the initial stage of oscillation treatment, 12 h was taken as the sampling interval, and then extended to 24 h and 2 days gradually. The test lasted about 20 days.
2.2.3. Soil Column Percolation Test
Gravel (1 cm in diameter) was paved 2 cm high at the bottom of the cylindrical container with a diameter of 15 cm to slow down the blockage of the soil column. After sieving the air-dried soil to 1 cm, water was added until the soil was mingled together and the moisture content of the soil was measured. The tested soil was filled into the cylindrical container with the filling height of 10 cm, 30 cm and 50 cm. The soil moisture content was 17.50%, 16.79% and 17.03%, respectively. There were several 5 mm diameter perforations at the bottom of the container to discharge the leachate, and the perforated percentage was about 60%. The soil column container was placed on the iron frame, and a sampling bucket with a diameter greater than 15 cm was placed below the container to collect all the leachate (Figure 1). Based on the size of the soil column container and the loading amount of soil, in order to ensure that the amount of leachate sample meets the needs of laboratory analysis, it was designed to feed liquid once a day with a volume of 800 mL [8]. A certain amount of feedstock was poured into the barrel above the soil column. Under the regulation of the flow rate regulator, the fertilizer slowly dripped to the non-woven fabric (average aperture 5 μm) on the surface of the soil column. The function of non-woven fabric was to evenly distribute the fertilizer. The hydraulic load was 45.27 L/(m2·day), and the volume and quality of the leachate were measured every day.
2.2.4. Multistage Soil Box Percolation Test
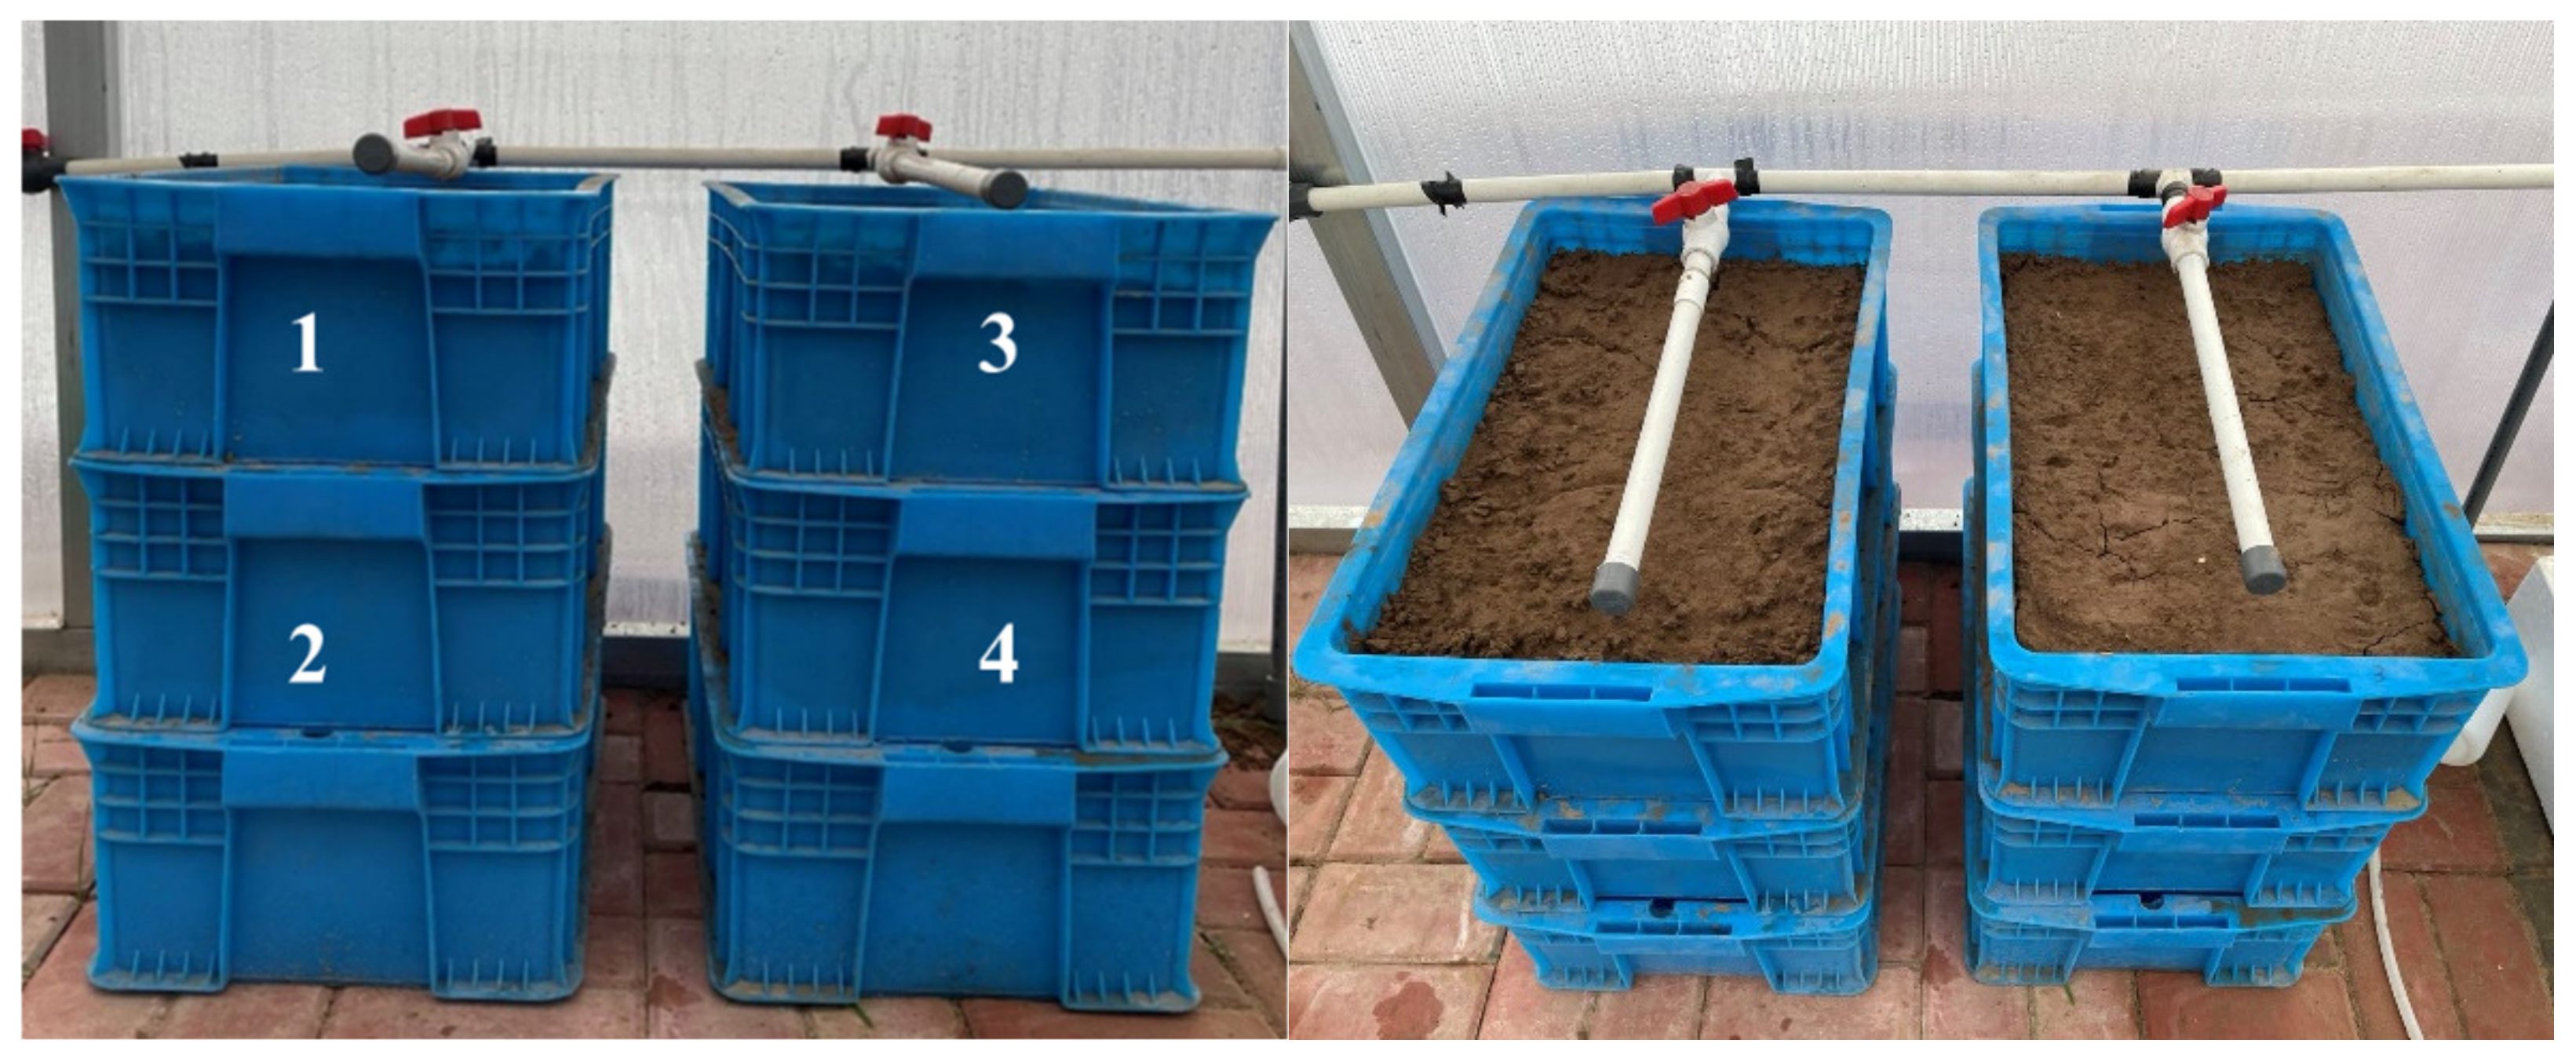
A layer of non-woven fabric with an average aperture of 1 μm was laid at the bottom of four plastic boxes with hollow bottoms. The size of the boxes was 46 cm × 29 cm × 15 cm. The air-dried soil was put into the boxes after passing through a 1 cm screen, and the filling amount was 25 kg/box. The plastic boxes filled with soil were stacked vertically on a bottom closed plastic box to form two groups of multi-stage soil box percolation system with soil layer thickness of 30 cm (Figure 2). Among them, non-woven fabric was used to prevent soil from leaking into the bottom box, and the bottom box was used to collect the leachate. Before the start of the test, the five-point sampling method was used to collect the soil in No. 1–4 soil boxes as the initial sample. The soil attributes are shown in Table 3.
Sijiu Chinese cabbage (Brassica) were sown on the upper layer of the soil box percolation system on 26 October. The method of spot-sowing was adopted with 2 seeds per hole and a hole spacing of 5 cm. The reclaimed fertilizer was pumped by the diaphragm pump and fed into two groups of systems through the pipeline erected on the upper part. Considering evapotranspiration (the FAO-56-PM-24 h model and the reference crop evapotranspiration double crop coefficient method were used to calculate the actual evapotranspiration) [35], the crop fertilizer demand (the nutrients required by the tested crops during the growth period is about 280 kg N/hm2 and 28 kg P/hm2) [36] and the actual situation of soil and crops in the boxes, the amount of feedstock was designed. The average amount of feedstock added within 30 days of operation was 612 mL, and the characteristics of leachate were continuously investigated.
2.2.5. Model Construction and Parameter Setting
HYDRUS-1D software was used to build a model to simulate the migration and transformation process of organic matter and nutrients after entering the aeration zone with the reclaimed fertilizer, that is, the water flow movement and the reaction of solute in the migration process. Therefore, the model mainly used the water flow module and solute transport module. Plant growth and root water absorption were not considered in this study. The time unit, mass unit and length unit of the model was set as d (day), mg and cm, respectively. The van Genuchten–Mualem model of single pore model was adopted as the soil flow model without considering the effect of water hysteresis. The soil type was sandy loam, provided by the software, and the soil hydraulic parameters are shown in Table 4. The upper boundary of the flow model was the atmospheric boundary, and the lower one was the free drainage boundary. The maximum ponding depth was set to 20 cm, and the upper and lower boundaries of solute transport were concentration flux boundary condition.
2.3. Analytic Methods
This paper focused on the analysis of the properties of water samples after the interaction between reclaimed fertilizer and soil, as well as the changes of soil properties in soil box system. Reference standard method for water sample property analysis [37]. The pH of soil was measured by pH meter according to the soil water ratio of 1:2.5, while EC was measured by conductivity meter according to the soil water ratio of 1:5 [38]. The contents of N, C, H and S elements were measured by element analyzer (Vario MAX cube).
2.4. Calculations
The quasi second-order adsorption kinetic equation was used to fit the adsorption kinetics test results, and the formula was as follows:
and are the equilibrium adsorption capacity and the adsorption capacity at time , respectively, mg·g−1. is the adsorption time, h. is the quasi second-order adsorption rate constant, g·mg−1 h−1.
Linear model and Freundlich model were, respectively, used to fit the isothermal adsorption test results. The linear model formula is as follows:
Freundlich model formula is as follows:
where, is the equilibrium adsorption capacity, mg/g. is the equilibrium adsorption concentration, mg/L. and is the constant of linear equation. is the adsorption capacity constant, which reflects the number of adsorption sites on the soil surface and it is a constant related to the maximum adsorption capacity. The greater the is, the faster the adsorption rate [39]. is the adsorption intensity constant.
The first-order kinetic equation was used to simulate the results of soil biodegradation test. The formula is as follows:
where, is the concentration of fertilizer, mg/L, is the reaction time, d. is the first-order kinetic reaction rate constant.
Water dispersion coefficient (cm2·d−1) is related to longitudinal dispersion of solute in one-dimensional soil (cm), saturated hydraulic conductivity (cm·d−1) and molecular diffusion coefficient (cm2·d−1):
Among them, is the distortion factor, which has little contribution to , so the molecular diffusion can be ignored [40]. The results of parameter sensitivity analysis in the literature showed that the simulated concentration is insensitive to and [41]. Therefore, the water dispersion coefficient was adjusted according to the particle size distribution value of each soil recommended in the literature [23]. In this study, was set as 10 cm.
3. Results and Discussion
3.1. Acquisition of Soil Solute Transport and Reaction Parameters
3.1.1. Adsorption Coefficient
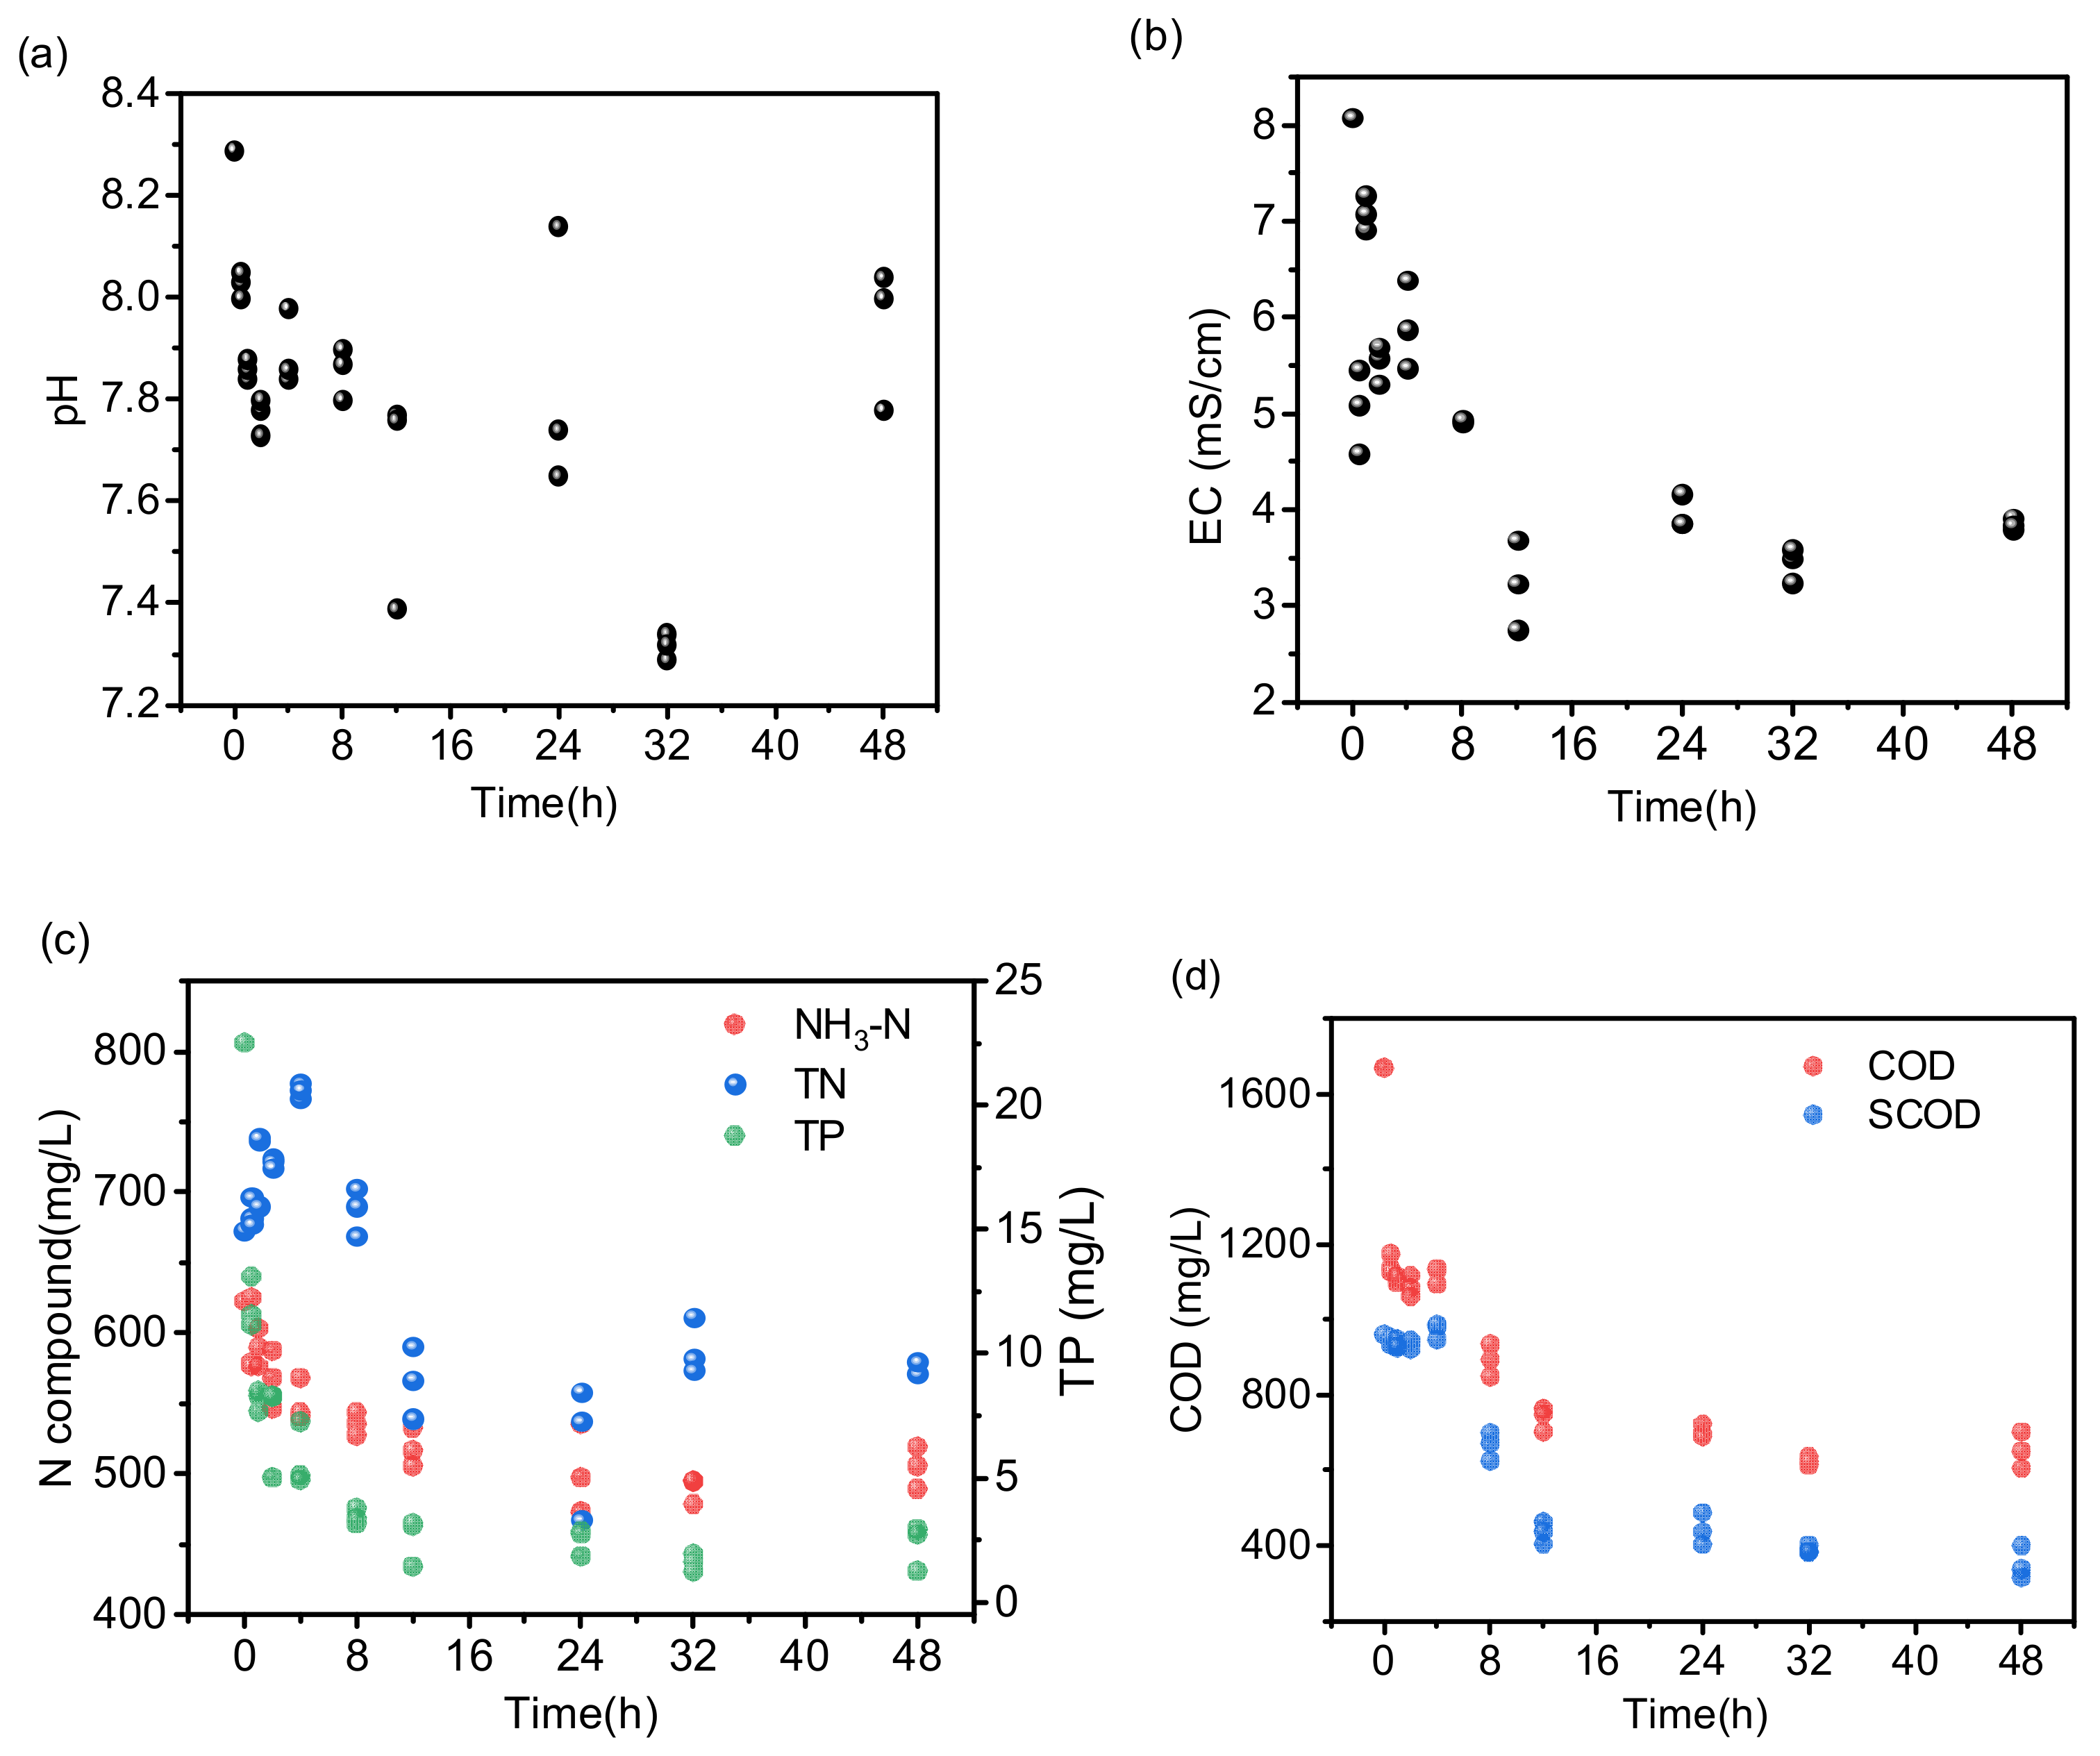
The soil adsorption coefficient was obtained from the batch test of soil adsorption, in which the adsorbent was soil and the liquid to be adsorbed was reclaimed fertilizer. The solutes concerned in this paper include nitrogen, phosphorus and organic matter represented by COD. Figure 3 shows the results of soil adsorption kinetics test. As shown in Figure 3, during the adsorption period of 0–48 h, the pH value decreased first and then increased. The change of conductivity, nutrients and organic matter were similar, showing a process of first fast, then slow and, finally, stable. Specifically, the solute was rapidly adsorbed by soil particles during 0–4 h, and then the adsorption rate slowed down. The adsorption reached equilibrium during 12–24 h. After 24 h, the concentration of the target substance presented an oscillating equilibrium state due to the dynamic process of adsorption and desorption [42].
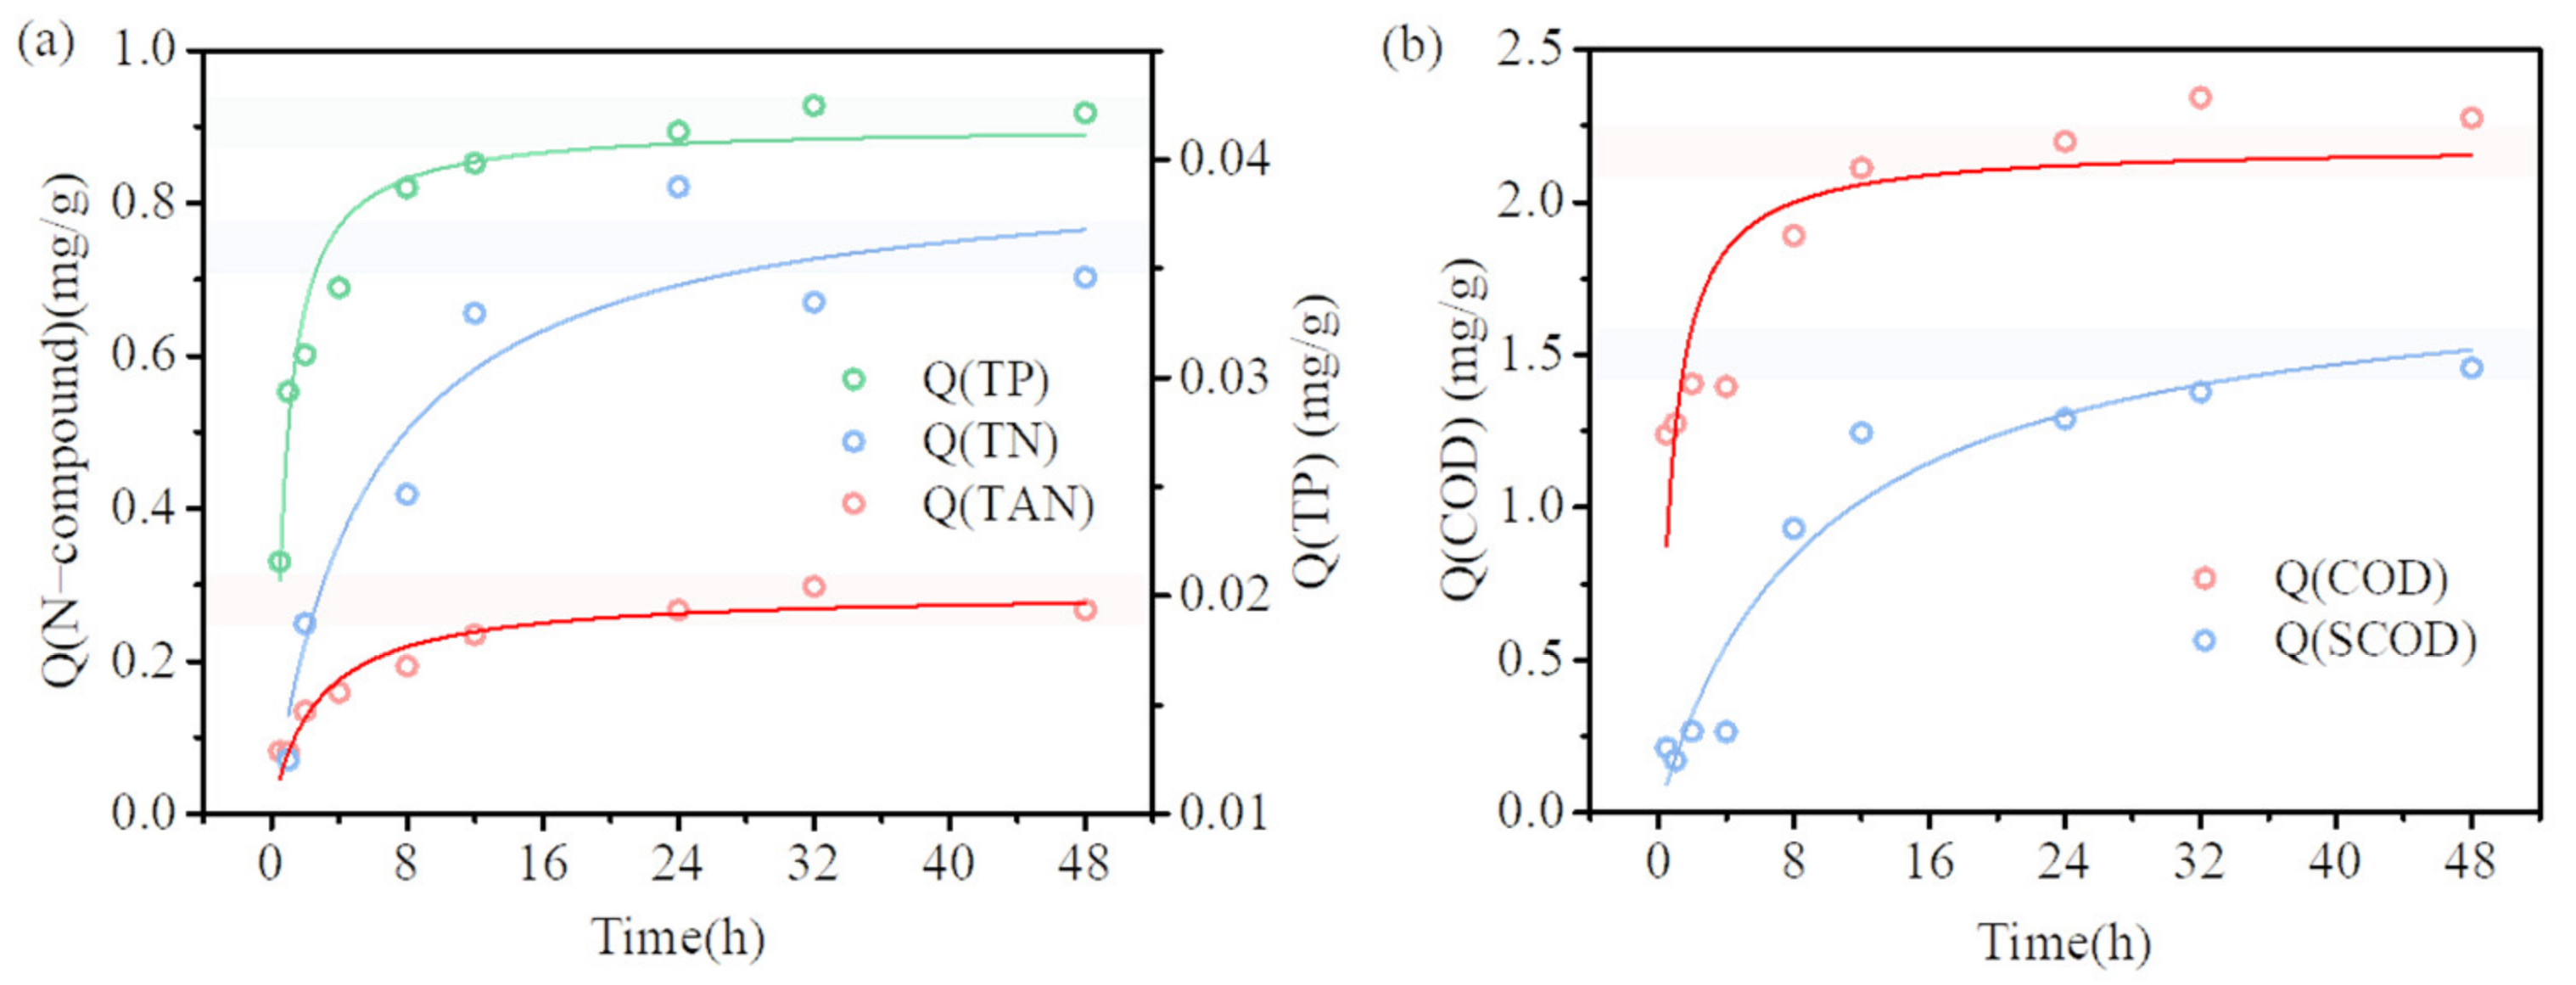
Figure 4 shows the dynamic curve of soil adsorption. As shown in Figure 4, the adsorption of nutrients and organic matters in the reclaimed fertilizer in the tested soil conformed to the quasi second-order kinetic equation, indicating that its adsorption forms include physical and chemical adsorption, and the electrostatic interaction between functional groups was the driving mechanism of this process [43]. At the initial stage, there were many adsorption sites on the soil colloids, which can fully contact and quickly adsorb the solute, making it adhere to the soil surface and then diffuse into the soil macropores. During this period, the resistance is relatively small. As the solute gradually diffused from the macropores to the micropores, the adsorption resistance increased, while the adsorption rate decreased. When the soil adsorption site was saturated, the adsorption reached equilibrium [10]. Among the nutrients, the adsorption rate of phosphorus was the fastest, followed by TAN. The concentration of TN in the reclaimed fertilizer fluctuated greatly after the adsorption was basically balanced. This was because the TN precipitated from the blank sample of the tested soil (deionized water) was between 150–240 mg/L, in which TAN was only 10–15 mg/L, while the proportion of nitrate nitrogen was large. Since the water solubility of nitrate nitrogen is high and the potential locations of its adsorption are some active sites on the soil surface [44], it is easy to desorb after adsorption, resulting in relatively poor goodness of fit (R2 = 0.9109).
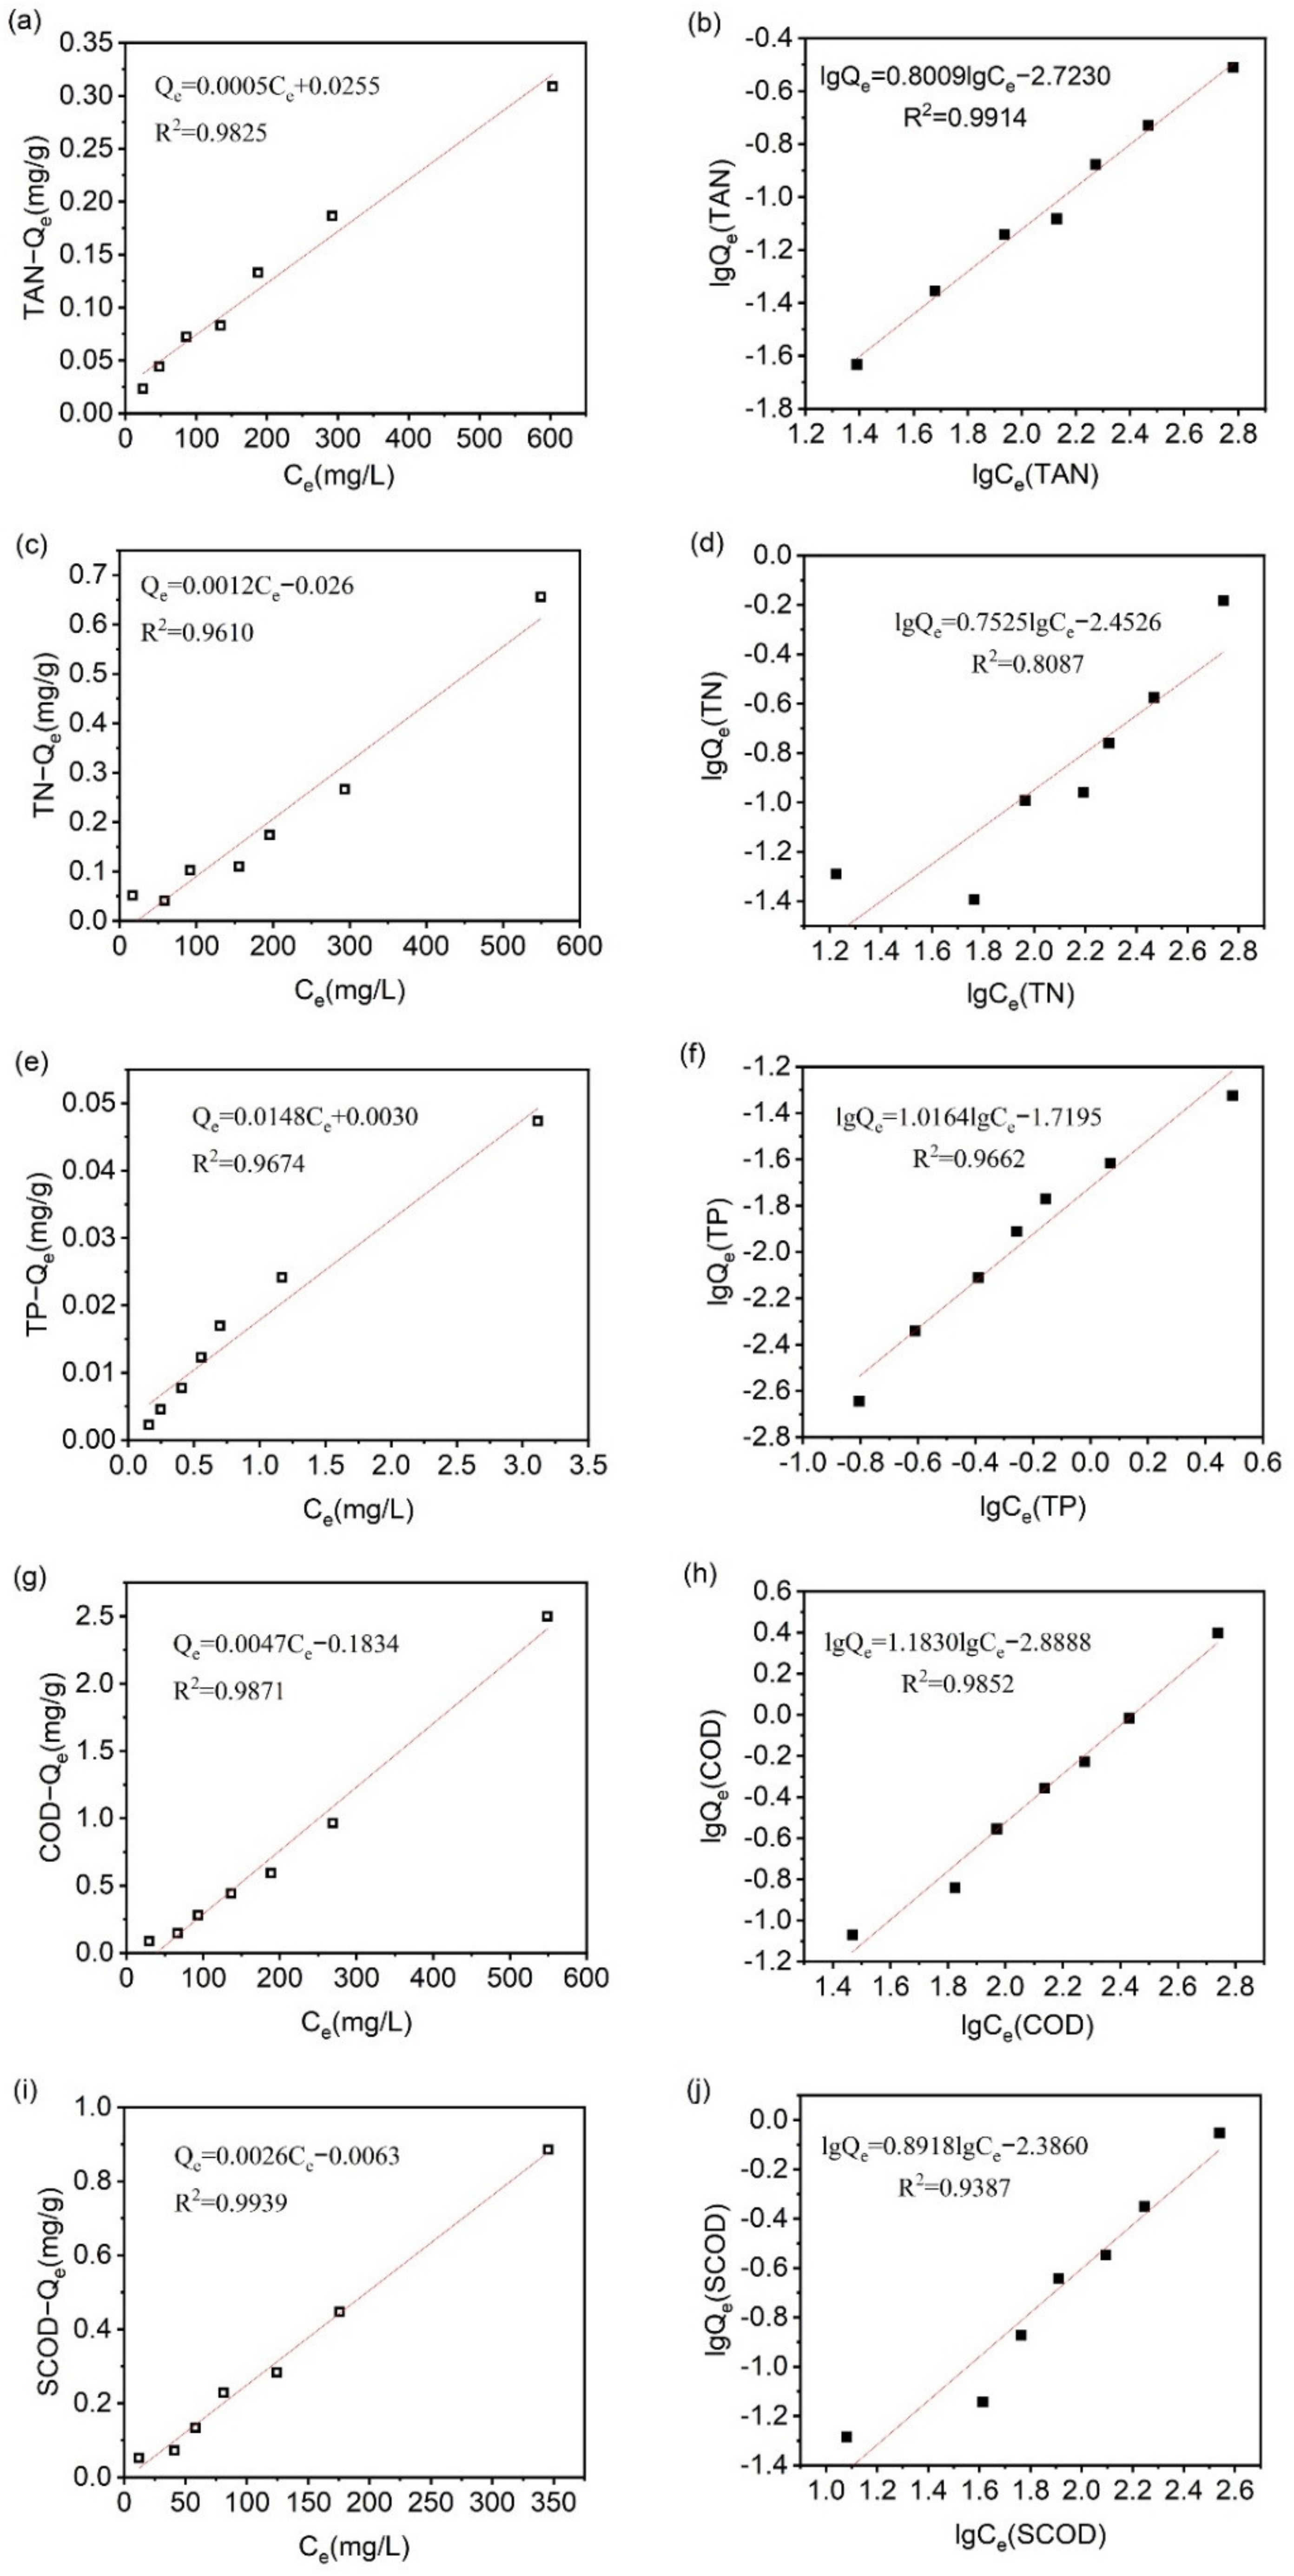
The isothermal adsorption test data of the tested soil for substances in reclaimed fertilizer were fitted with linear and Freundlich models, and the results are shown in Figure 5. The correlations of linear model to other indexes except TAN were higher than that of the Freundlich model. However, the differences between the adsorption results of TP and COD fitted by the two models were not obvious. Because TAN is positively charged, it is easy to be adsorbed by soil. However, from the Freundlich curve, the of TAN was less than 1, indicating that there were some limitations in the effective specific adsorption sites on the surface of soil particles. With the increase in TAN concentration in wastewater, the adsorption difficulty increases [45].
3.1.2. Degradation Coefficient
The degradation coefficient was obtained through the indoor static degradation test. Since the test focuses on biodegradation in anaerobic conditions, only physical adsorption is considered for phosphorus removal, and biological removal is not considered. Therefore, this experiment investigated the anaerobic degradation ability of soil to nitrogen and organic matter in reclaimed fertilizer. Under anaerobic conditions, TAN in the tested soil is not prone to nitrification, and the main removal path is soil particle adsorption, of which the rate is fast. Hence, the correlation of TAN fitted by the first-order kinetic curve was the worst (R2 = 0.7334). The first-order kinetic reaction rate constants of TAN, TN, COD and SCOD were 0.0948 d−1, 0.0824 d−1, 0.3258 d−1, 0.1701 d−1, respectively (Figure 6). Among them, the COD degradation rate was the fastest.
3.2. Migration Parameter Correction and Model Verification
3.2.1. Soil Column Percolation Test
The purpose of soil column percolation test was to analyze the effect of soil thickness on the permeability of reclaimed fertilizer, so as to correct the solute parameters. After the three groups of soil columns of 10 cm, 30 cm and 50 cm were operated, the leachate was collected and measured every day. Because of the thick soil in 30 cm and 50 cm columns, the water percolation rate was affected greatly. In addition, continuous liquid inflow led to the increase in soil water content and the gradual compression of soil pores [46]; hence, there was no leachate after feeding for 6 consecutive days. The total amount of water entering the soil column at the end of percolation was 4.8 L.
Figure 7a–c shows that after the reclaimed fertilizer entered the soil column, the original nitrogen (mainly nitrate nitrogen) in the tested soil was washed out. As a result, the TN concentrations of leachate at three heights on the first day were more than 1500 mg/L, which was much higher than that of influent (666.1 mg/L). As the easily mobile nitrogen forms in the soil were washed away, the TN concentration in the leachate of 30 cm and 50 cm soil columns decreased day by day. At the end of the experiment, the TN interception efficiency reached 97.65% and 94.70% respectively. However, the TN in leachate of 10 cm column decreased first and then increased. At the end of the test, the TN interception efficiency was only 39.03%, significantly lower than 30 cm and 50 cm soil columns (p < 0.01, one-way ANOVA analysis). Due to the limited adsorption sites, the increase rate of TAN at 10 cm was higher than the conversion rate, while the TAN at 30 cm and 50 cm fluctuated between 2.98–16.54 mg/L and 3.50–7.20 mg/L, respectively. The interception efficiency of TAN in 30 cm and 50 cm soil columns were significantly higher than that of 10 cm soil column (p < 0.01). During the test, the interception efficiency of TAN in 50 cm soil column was always larger than 99%. However, the interception efficiency of TAN of 30 cm and 50 cm soil columns had no significant difference (p > 0.05). In order to prevent the loss of nitrate nitrogen from the soil itself, attention should be paid to controlling the amount of liquid fertilizer for fertilization to reduce the mineral nitrogen entering the groundwater [47].
Figure 7d shows the concentration and interception efficiency of TP in the leachate. TP concentration at 10 cm soil column increased day by day and reached 3.67 mg/L on the 6th day with an interception efficiency of less than 90%. The TP concentration at the 30 cm soil column decreased first and then increased, but the interception efficiency was not less than 99% during the test. TP at 50 cm column generally showed a downward trend, and the interception efficiency was higher than that of 30 cm soil column at the end of the test. The phosphorus entering the soil was adsorbed by the soil particles, and the excess part exuded into the soil column system. Therefore, the interception efficiency of TP increased with the increase in the height of the soil column. Since the difference between the three groups of columns were not significant (p > 0.05), the main interception layer of phosphorus was 0–10 cm soil layer.
The COD concentration of leachate in 10 cm soil column was 751 mg/L on the first day, and then decreased and stabilized on the following days, with an average interception efficiency of 79.29%, significantly lower than 30 cm and 50 cm soil columns (p < 0.01). The change patterns of 30 cm and 50 cm soil columns were similar, but the average interception efficiencies after stabilization were 89.96% and 94.38%, respectively. The COD in leachate included the original organic matter of tested soil and the part of reclaimed fertilizer that had not been intercepted and decomposed. Therefore, the thicker the soil layer in the initial stage, the higher the COD concentration in leachate. However, the final interception efficiency also increased with the increase in soil layer thickness. Comparing the three groups of data, most reductive substances were adsorbed and degraded in soil layers at 0–10 cm.
Since the parameters, such as the longitudinal dispersivity (), cannot be easily measured in laboratory or in the field [48], the concentrations of various solutes in the leachate at different soil thicknesses were substituted into the inverse solution program of HYDRUS-1D with an applied amount of 4.527 cm/d. The corrected solute transport characteristic parameters were obtained in Table 5. The longitudinal dispersivity of TN is less than other parameters, indicating that the dispersion of TN in the direction parallel to the water flow is weaker than that of organic matter [23]. From the perspective of kinetic reaction rate constant, the degradation of organic matter in soil is faster than nitrogen.
3.2.2. Soil Box Percolation Test
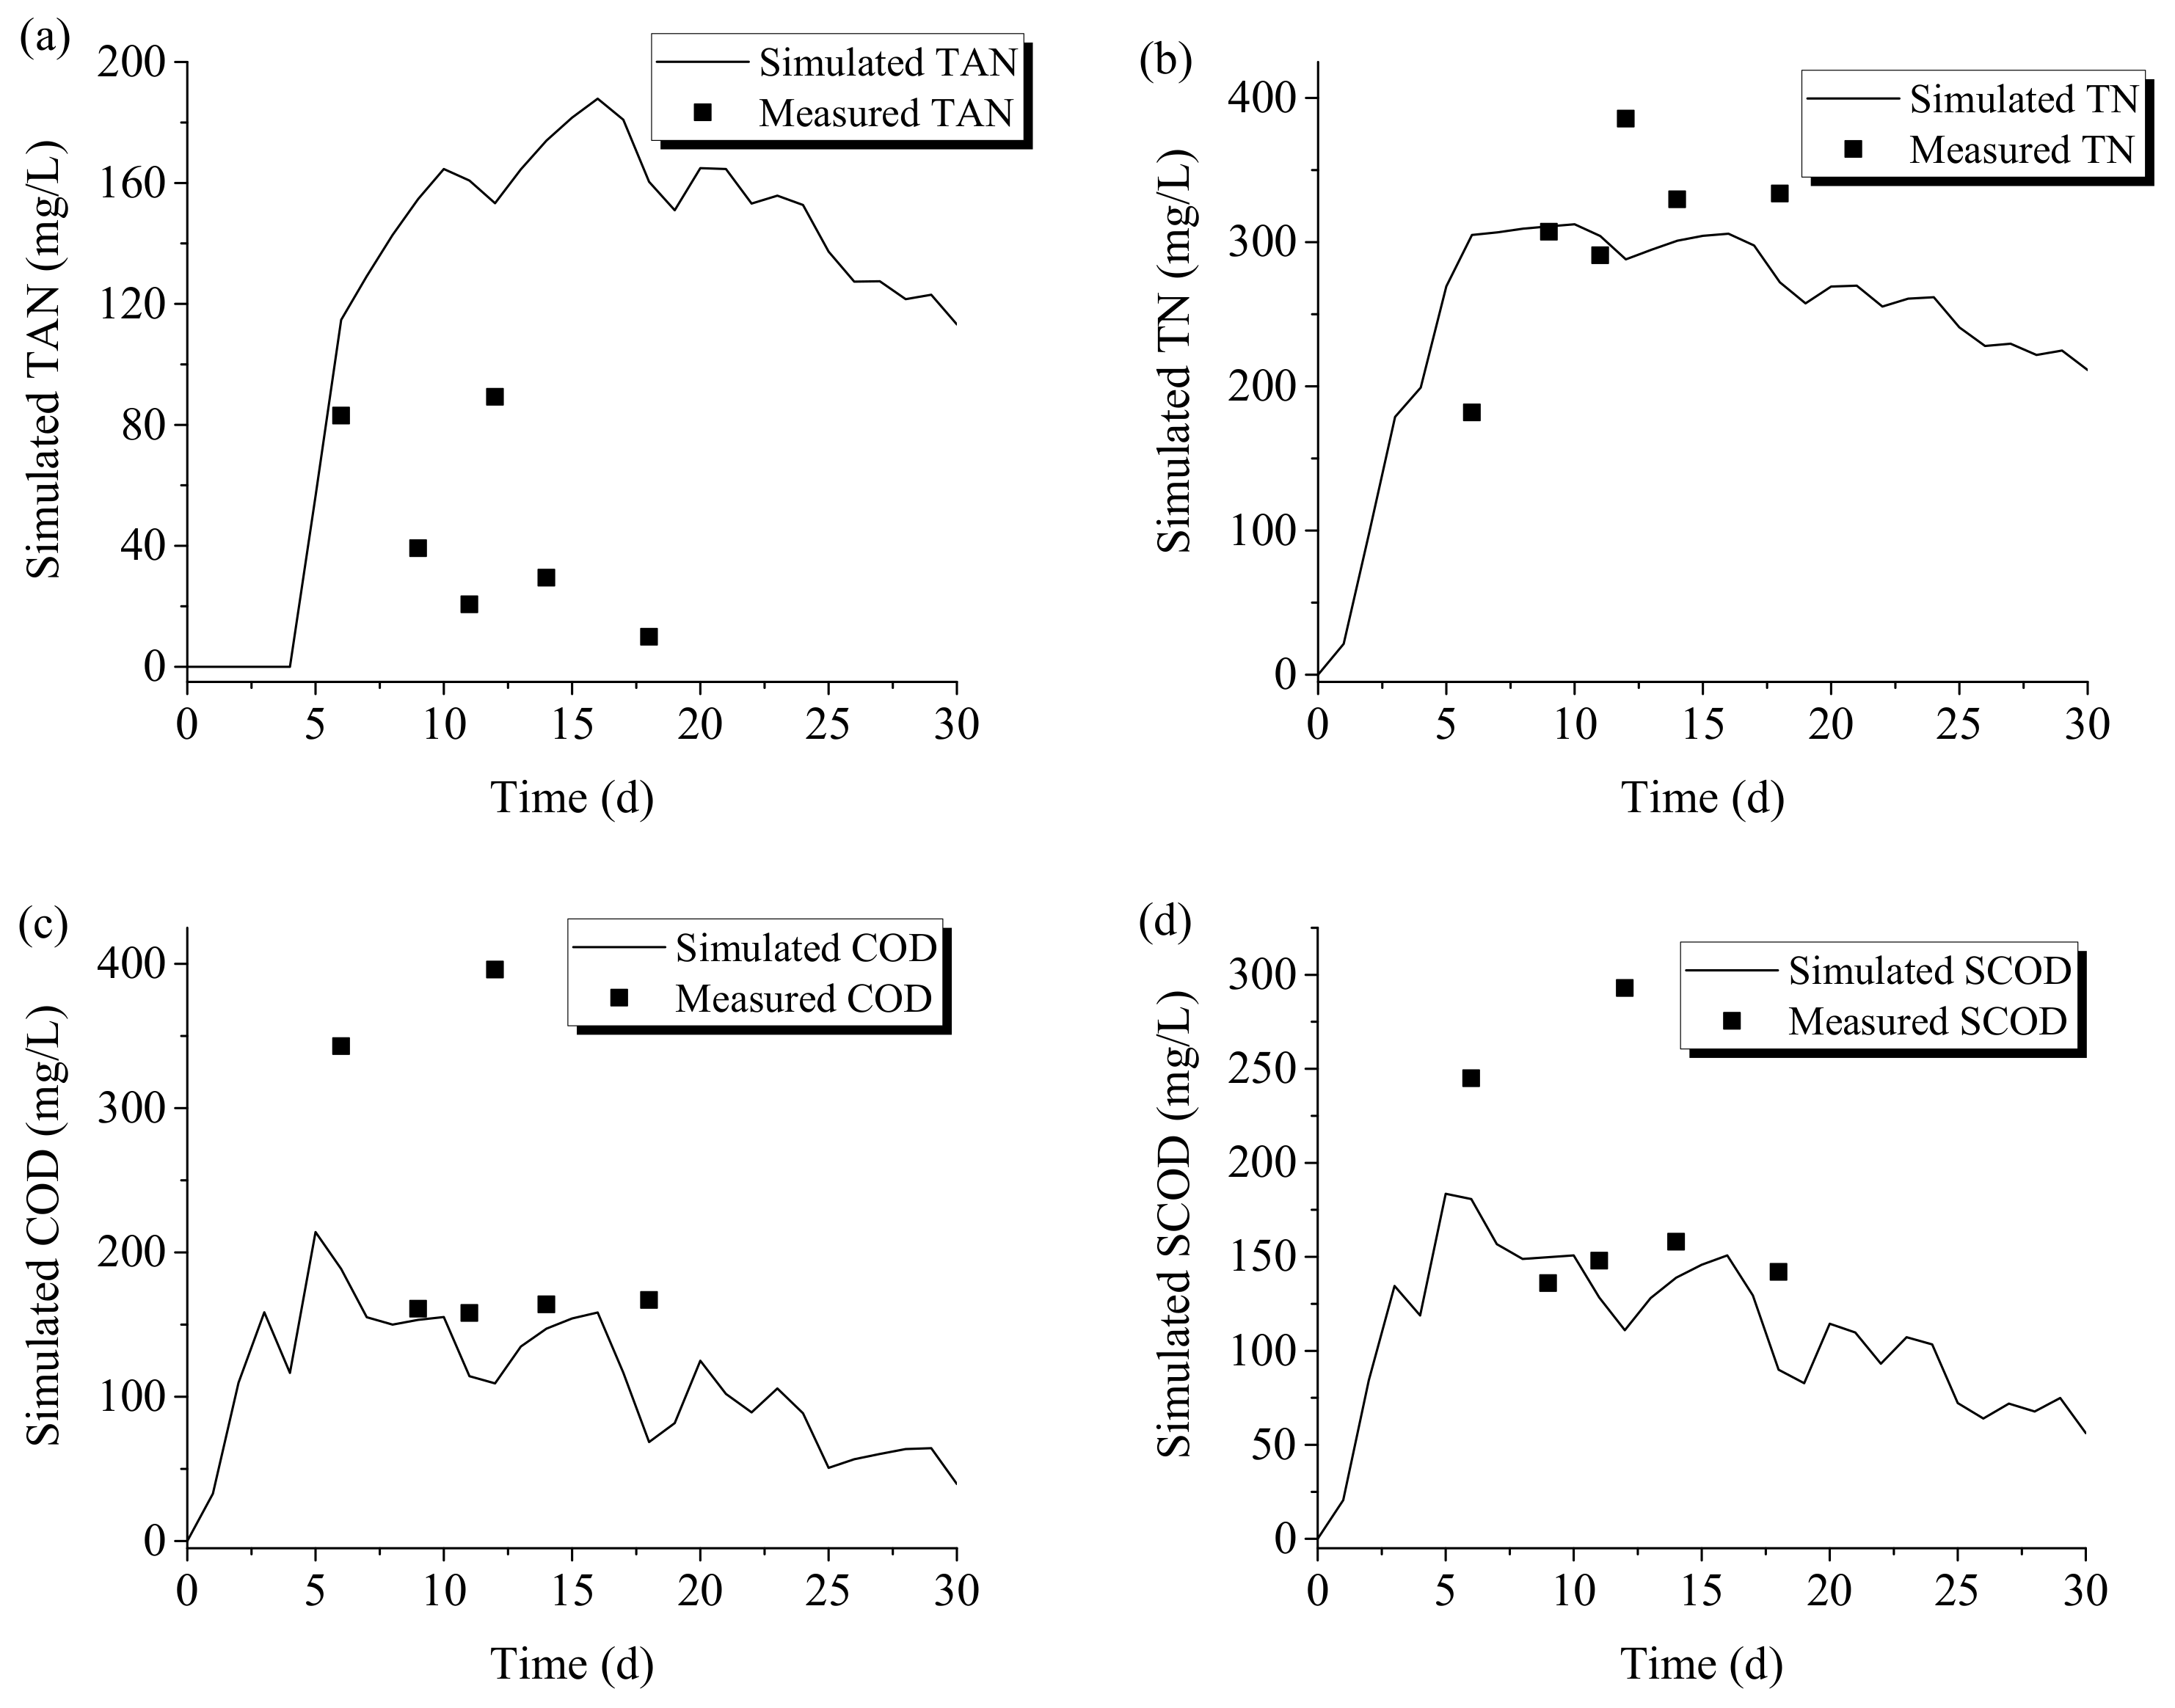
The corrected model was verified by the results of multistage soil box percolation test. Since the soil surface area of the soil boxes was larger than that of the soil columns, and the water inflow was only 1/10 of soil column, sufficient leachate was collected in the bottom box on the 6th day. Figure 8 shows the concentration of nitrogen and COD in 30 cm soil layer simulated by HYDRUS-1D and the measured values of percolation in soil boxes. Among them, the simulated value of TAN was quite different from the measured one, which was reflected by the measured value being far lower than the simulated one (with a relative deviation of 68.01%). In addition to the higher measured value on the 12th day, the model had a good simulation effect on TN and COD (with a relative deviation of 12.09% and 18.26%, respectively).
From the results of soil adsorption batch test, it was less difficult to adsorb TAN when the concentration was low (Freundlich model). The TAN concentration used in the soil box percolation test (602.4 mg/L) was significantly lower than that in soil column test (813.8 mg/L). Therefore, there may be some deviation in simulating TAN concentration with the parameters corrected by the results of the soil column test. On the other hand, the environmental conditions of the degradation batch test were set as anaerobic, but the topsoil area of the soil box was much larger than the conical flacks, and the reclaimed fertilizer can have a partial aerobic reaction on the top layer, and thus it has a better degradation effect. The measured concentration of TAN was lower than the simulated concentration due to the above two reasons. It is worth noting that under the actual soil conditions (within the range of 5 m soil thickness), the nitrification and adsorption of TAN will not be the same as in the soil boxes with large topsoil areas, so the established model was still used for prediction.
3.3. Prediction of Soil Leaching Risk of Reclaimed Fertilizer
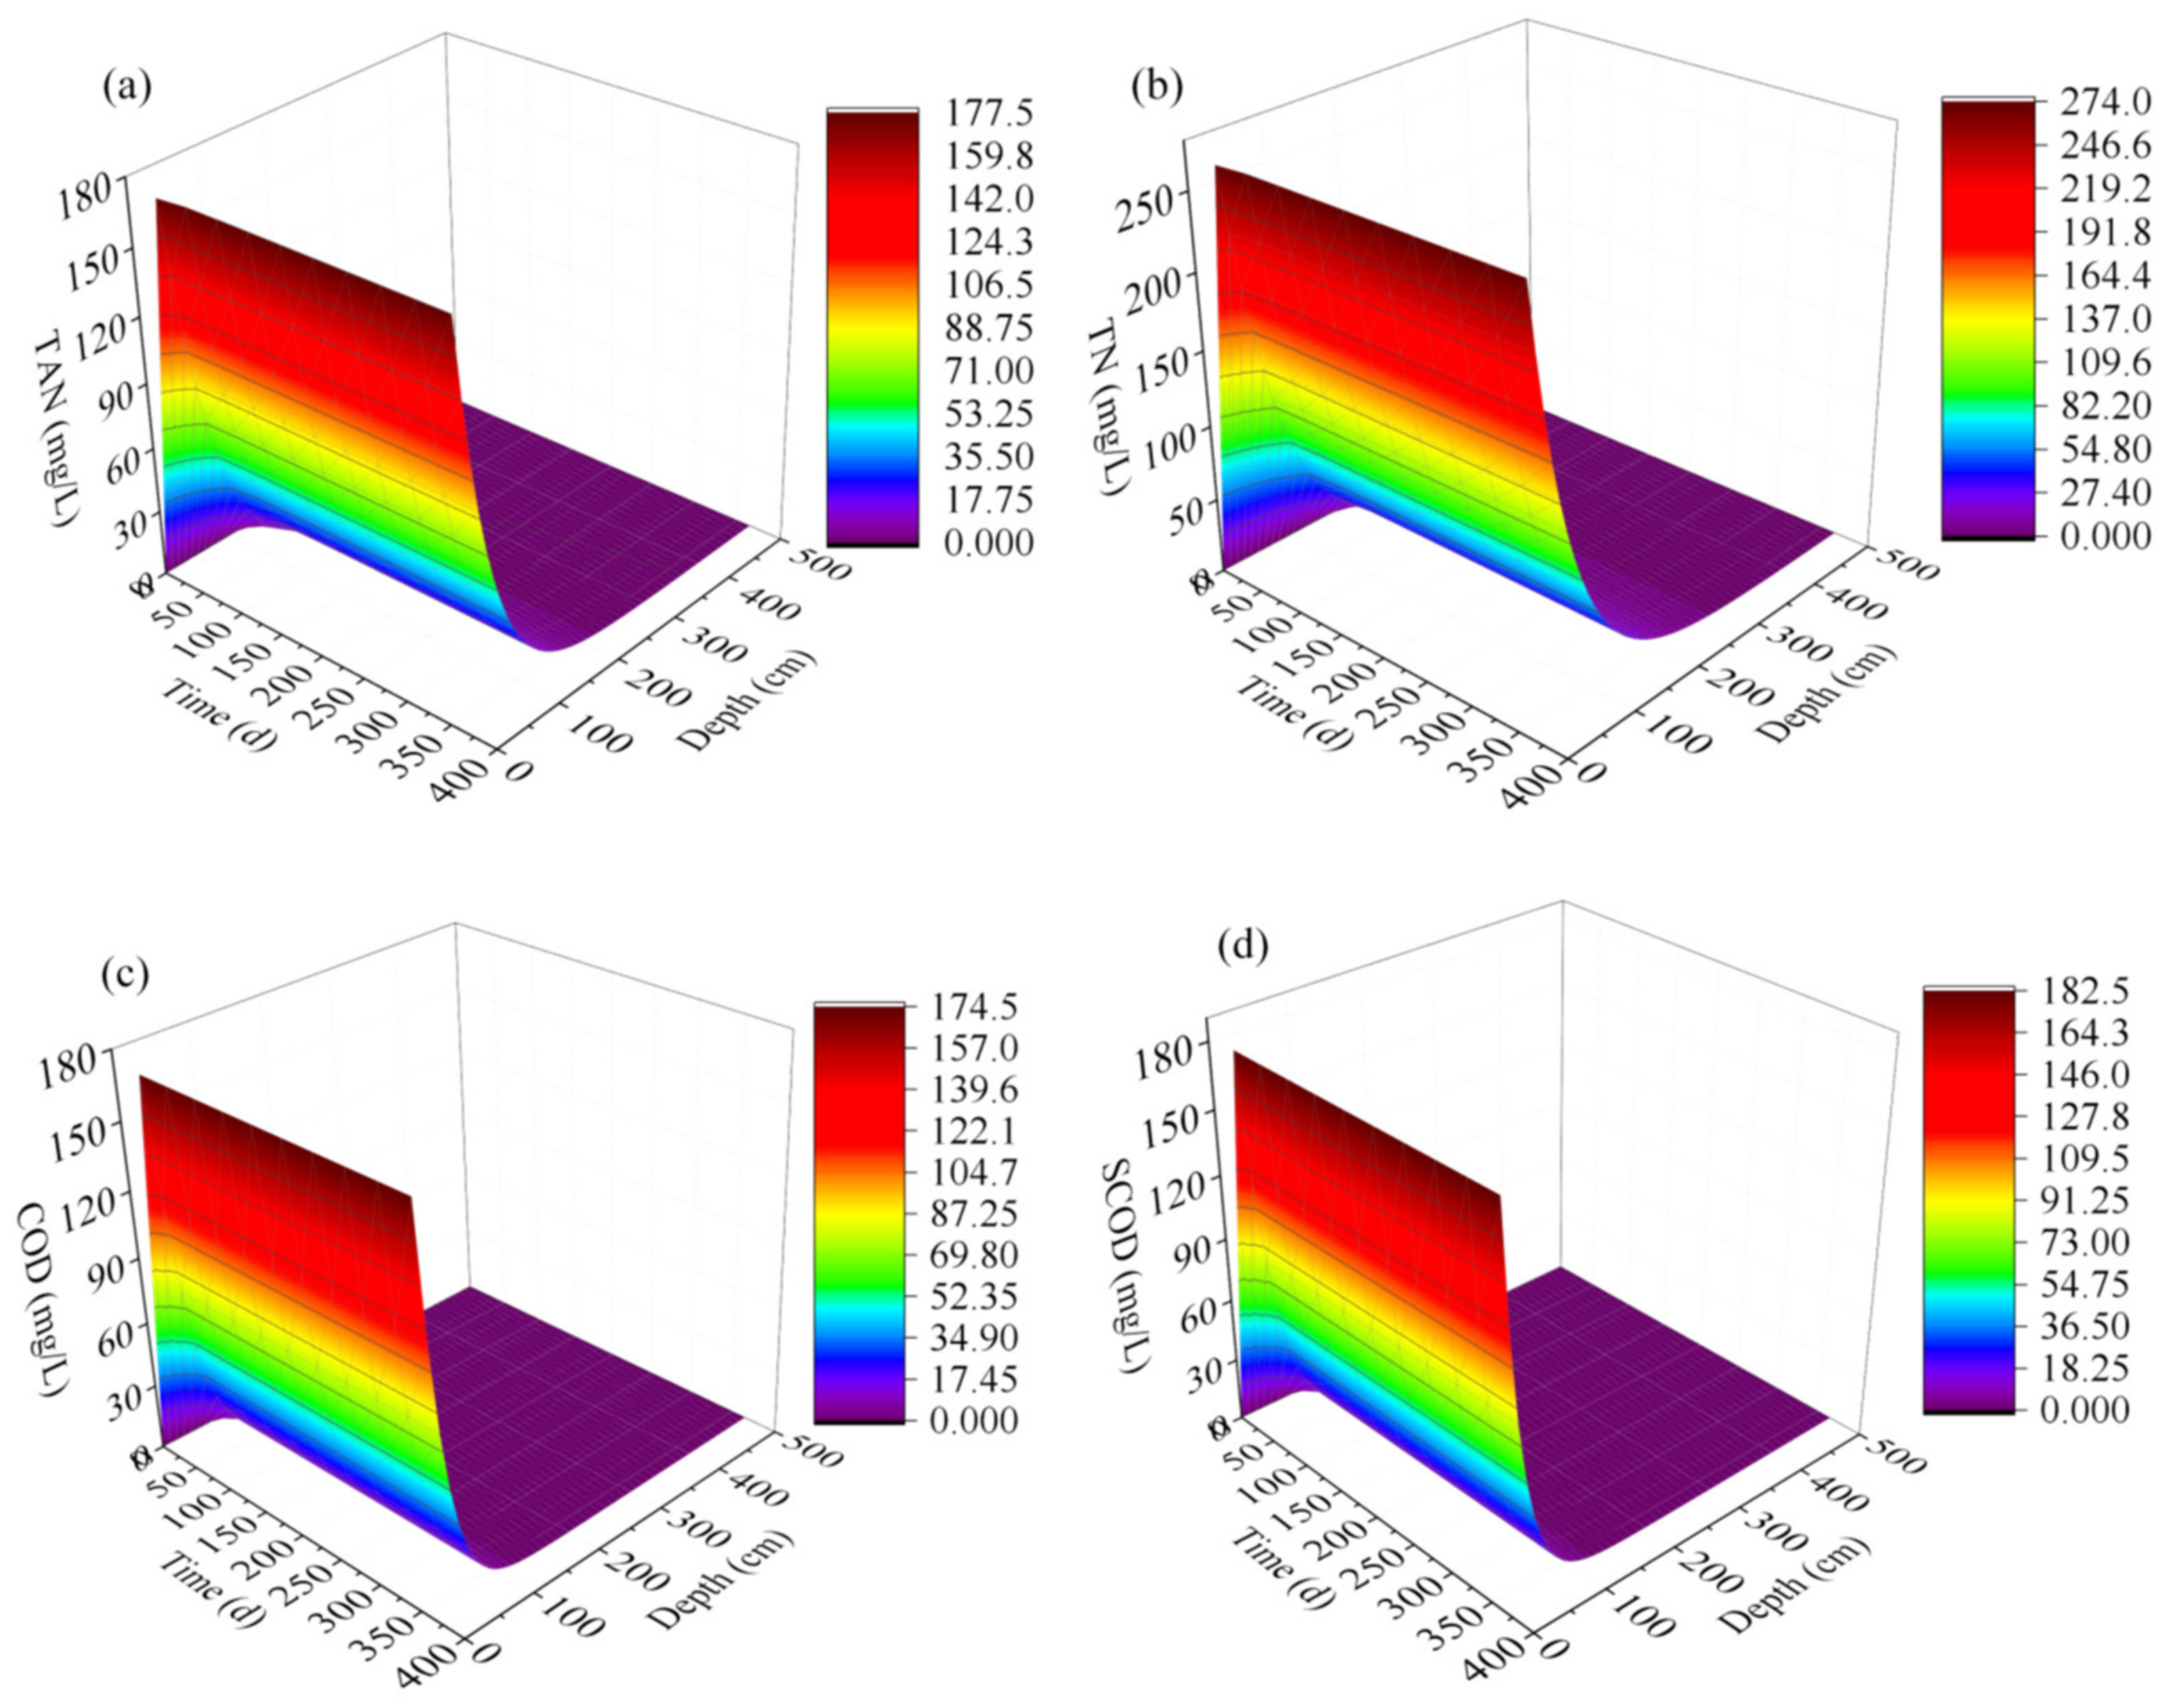
The adsorption coefficient, biodegradation coefficient, soil water content, dispersion property parameters and the characteristics of reclaimed fertilizer were input into HYDRUS-1D software to simulate and predict the migration and distribution of nitrogen and organic matter in the soil depth profile. Because the phosphorus can be adsorbed and retained by the soil easily and the phosphorus concentration is not clearly specified in the Chinese groundwater quality standard, no further study on the migration of phosphorus is carried out in this study. The model mainly simulated the groundwater contamination risk of long-term reuse of fertilizer reclaimed from SW, so the simulation time was set as 365 d, and the simulation results were output in equal time steps (36.5 d). The simulated depth range was 0–500 cm underground and the soil layer was not divided. The water content of the soil surface and bottom layer were set as 17% and 29%, respectively (the water content of the bottom layer was determined according to the operation results of the inverse solution), the amount of reuse was set to 0.4 cm/d, and the concentration of each substance on the top layer was set according to the long-term measurement data (Table 6).
According to Figure 9, after one year of reuse, the COD concentration under 1.3 m soil layer can be stabilized within 1 mg/L, and the TAN concentration under 3.4 m soil layer can be stabilized at 0.02 mg/L. In the soil layer below 3 m, TN concentration can be kept below 2 mg/L, meeting the Chinese groundwater quality standard.
From the simulation data, after 36 days of reuse, the concentrations of COD and SCOD in 1.3 m soil layer showed a relatively stable trend, so it is unlikely that the bottom layer will continue to penetrate downward. However, compared with COD, SCOD has stronger migration potential, which is due to its morphological structure being easily soluble in water. The TAN concentration at 3.4 m of the soil layer showed an upward trend after day 292, indicating that the continuous reuse may lead to the extension of the leaching path of TAN. The fate of TAN in the soil includes soil filtration, soil adsorption, reaction, crop absorption, etc. If the adsorbed TAN cannot be transformed and absorbed in time, it will lead to the saturation of soil adsorption sites, so that the continuously input part will flow into the ground with water. In order to reduce the leaching risk of TAN migration to groundwater, crops can be planted to accelerate the absorption of TAN [49]. In addition, fertilizing on demand or adding biochar to the soil can reduce nutrient loss [50,51], and regularly ploughing the soil can oxygenate the soil to accelerate the nitrification reaction. According to the prediction, after one year of continuous reuse of reclaimed fertilizer, the TAN, COD and SCOD of leachate at the depth of 5 m are all 0. However, there is still a certain residue of TN (0.11 mg/L), and that concentration level remains relatively stable from the 146th day to the end of the simulation period. Since the feedstock basically contains no nitrate nitrogen and the TAN concentration at the depth of 5 m is 0, it can be inferred that the penetrated nitrogen mainly comes from the intermediate products of soil leaching, ammonia nitrification and denitrification [10].
3.4. Effect of Reclaimed Fertilizer Reuse on Soil Properties
After 30 days of operation of the multi-stage soil box system, the soil samples in the boxes were collected again. The soil attributes analysis is shown in Table 7. Compared with the initial soil (Table 3), the pH decreased significantly (from 8.13 to 7.15), while the conductivity increased (from 0.015 to 0.162 S/m) after reuse, among which the change range of soil in box No. 1 and No. 3 were greater. Compared with the initial value, the contents of C and N elements in soil increased by 4.25% and 60.52%, respectively.
Comparing the pH in Table 3 and Table 7, the soil changed from weak alkaline to neutral, which is more conducive to seed germination and crop growth [52,53]. At the same time, the decrease in pH can also reduce the release of soil phosphorus [54], which is conducive to the retention of soil phosphorus. C/N close to 10 is more favorable for the formation of soil organic matter and the prevention of nitrogen loss. The increase in C/H indicated the increase in organic matter condensation degree and stability [55,56]. The above results showed that the application of fertilizer reclaimed from SW increased soil fertility and had a certain effect of soil improvement. The soil change of soil box No. 1 and No. 3 were more significant, owing to the direct contact with the fertilizer. Therefore, soil particles, pores and microorganisms can be used to intercept most of the dissolved solids in the reclaimed fertilizer.
4. Conclusions
It is in line with the requirements of sustainable development to reuse the micro-flush sanitary wastewater as fertilizer. However, the nutrients and organic matter in the reclaimed fertilizer and soil itself may be leached during the fertilization process, thus bringing risk to the groundwater. In this paper, the reclaimed fertilizer of micro-flush SW was taken as the research object, and the cultivated soil of the test site was taken as the tested soil. Through batch tests, soil column correction test and soil box verification test, the soil hydrodynamic parameters, boundary conditions and solute transport parameters required by HYDRUS-1D were obtained. The model was used to predict the correlation between soil depth and concentration of leachate under a specific period of time, so as to evaluate the potential soil leaching risk of reclaimed fertilizer and to put forward suggestions for risk control to guide the safe reuse of reclaimed fertilizer. It can be concluded that, compared with COD (), the adsorption intensity of TAN () in the tested soil was relatively low. TAN was more likely to leach into groundwater. HYDRUS-1D predicted that after one year of continuous reuse, the COD below 1.3 m soil layer and TAN below 3.4 m can meet the class I water standard for underground water. At the depth of 5 m, the concentrations of TAN, COD and SCOD are all 0, and TN still has a certain residue (0.11 mg/L) that mainly comes from the soil itself. The TAN concentration at 3.4 m showed an upward trend in the prediction period. The soil leaching risk of the reuse of reclaimed fertilizer is not significant in the short term (one year). The risk of fertilization on soil with high nitrogen background value should be paid attention to in a long-term context. The reuse of reclaimed fertilizer can increase soil fertility and have a certain effect on soil improvement.
Author Contributions
M.L. and S.Z.: Writing—original draft, Data curation, Methodology, Formal analysis. Y.S.: Data curation. S.S.: Validation. A.L.: Methodology. B.F.: Conceptualization, Writing—review and editing, Supervising, Hosting project. All authors have read and agreed to the published version of the manuscript.
Funding
This research was supported by National Key R&D Program of China (grant number: 2020YFD1100105), the Major Program of National Natural Science Foundation of China (grant number: 51838013) and Xiamen Science and Technology Major Project (grant number: 3502Z20191012).
Institutional Review Board Statement
Not applicable.
Informed Consent Statement
Not applicable.
Data Availability Statement
Not applicable.
Acknowledgments
We appreciate the support of National Key R&D Program of China (grant number: 2020YFD1100105), the Major Program of National Natural Science Foundation of China (grant number: 51838013) and Xiamen Science and Technology Major Project (grant number: 3502Z20191012).
Conflicts of Interest
The authors declare no conflict of interest.
References
- Fan, B.; Hu, M.; Wang, H.; Xu, M.; Qu, B.; Zhu, S. Get in sanitation 2.0 by opportunity of rural China: Scheme, simulating application and life cycle assessment. J. Clean. Prod. 2017, 147, 86–95. [Google Scholar] [CrossRef]
- Sheng, X.; Qiu, S.; Xu, F.; Shi, J.; Song, X.; Yu, Q.; Liu, R.; Chen, L. Management of rural domestic wastewater in a city of Yangtze delta region: Performance and remaining challenges. Bioresour. Technol. Rep. 2020, 11, 100507. [Google Scholar] [CrossRef]
- Wang, H.; Zhu, S.; Zhang, Y.; Lv, M.; Fan, B. Stabilization and sanitization of concentrated domestic bio-wastes with improved septic tank technology. Desalin. Water Treat. 2019, 149, 91–97. [Google Scholar] [CrossRef]
- Gao, M.; Zhang, L.; Liu, Y. High-loading food waste and blackwater anaerobic co-digestion: Maximizing bioenergy recovery. Chem. Eng. J. 2020, 394, 124911. [Google Scholar] [CrossRef]
- Xu, M.; Zhu, S.; Zhang, Y.; Wang, H.; Fan, B. Spatial-temporal economic analysis of modern sustainable sanitation in rural China: Resource-oriented system. J. Clean. Prod. 2019, 233, 340–347. [Google Scholar] [CrossRef]
- Xu, M.; Fan, B.; Zhang, Y.; Li, A.; Li, Y.; Lv, M.; Shi, Y.; Zhu, S.; Qian, T. Effects of resource-oriented waste management on optimizing water-food-energy nexus in rural China: A material and energy flow analysis. J. Clean. Prod. 2020, 276, 124259. [Google Scholar] [CrossRef]
- Styles, D.; Adams, P.; Thelin, G.; Vaneeckhaute, C.; Withers, P.J.A.; Chadwick, D. Life cycle assessment of biofertilizer production and use compared with conventional liquid digestate management. Environ. Sci. Technol. 2018, 52, 7468–7476. [Google Scholar] [CrossRef]
- Niyungeko, C.; Liang, X.; Liu, C.; Liu, Z.-W.; Sheteiwy, M.; Zhang, H.; Zhou, J.; Tian, G. Effect of biogas slurry application rate on colloidal phosphorus leaching in paddy soil: A column study. Geoderma 2018, 325, 117–124. [Google Scholar] [CrossRef]
- Remington, C.; Bourgault, C.; Dorea, C.C. Measurement and Modelling of Moisture Sorption Isotherm and Heat of Sorption of Fresh Feces. Water 2020, 12, 323. [Google Scholar] [CrossRef]
- Li, N.; Han, Z.; Ren, Y.; Wang, S.; Hu, X.; Zeng, Z. Retarding performance of the vadose zone for nitrogen pollutants derived from municipal solid waste landfills in the red bed zone. J. Environ. Manag. 2022, 306, 114406. [Google Scholar] [CrossRef]
- Cheyns, K.; Mertens, J.; Diels, J.; Smolders, E.; Springael, D. Monod kinetics rather than a first-order degradation model explains atrazine fate in soil mini-columns: Implications for pesticide fate modelling. Environ. Pollut. 2010, 158, 1405–1411. [Google Scholar] [CrossRef]
- Mojid, M.A.; Hossain, A.B.M.Z.; Wyseure, G.C.L. Impacts of Municipal Wastewater on Basic Soil Properties as Evaluated by Soil Column Leaching Experiment in Laboratory. J. Soil Sci. Plant Nutr. 2019, 19, 402–412. [Google Scholar] [CrossRef]
- Merdy, P.; Lucas, Y.; Coulomb, B.; Melfi, A.J.; Montes, C.R. Soil organic carbon mobility in equatorial podzols: Soil column experiments. Soil 2021, 7, 585–594. [Google Scholar] [CrossRef]
- Simunek, J.J.; Saito, H.; Sakai, M.; Van Genuchten, M. The HYDRUS-1D Software Package for Simulating the One-Dimensional Movement of Water, Heat, and Multiple Solutes in Variably-Saturated Media; CSIRO: Canberra, Australia, 2008. [Google Scholar]
- Gumuła-Kawęcka, A.; Jaworska-Szulc, B.; Szymkiewicz, A.; Gorczewska-Langner, W.; Pruszkowska-Caceres, M.; Angulo-Jaramillo, R.; Šimůnek, J. Estimation of groundwater recharge in a shallow sandy aquifer using unsaturated zone modeling and water table fluctuation method. J. Hydrol. 2022, 605, 127283. [Google Scholar] [CrossRef]
- Krevh, V.; Filipović, V.; Filipović, L.; Mateković, V.; Petošić, D.; Mustać, I.; Ondrašek, G.; Bogunović, I.; Kovač, Z.; Pereira, P.; et al. Modeling seasonal soil moisture dynamics in gley soils in relation to groundwater table oscillations in eastern Croatia. CATENA 2022, 211, 105987. [Google Scholar] [CrossRef]
- Yi, J.; Li, H.; Zhao, Y.; Shao, M.A.; Zhang, H.; Liu, M. Assessing soil water balance to optimize irrigation schedules of flood-irrigated maize fields with different cultivation histories in the arid region. Agric. Water Manag. 2022, 265, 107543. [Google Scholar] [CrossRef]
- Alam, T.; Bezares-Cruz, J.C.; Mahmoud, A.; Jones, K.D. Modeling transport, fate, and removal kinetics of nitrate and orthophosphate using recycled adsorbents for high and low-flow stormwater runoff treatment. Chemosphere 2022, 287, 132152. [Google Scholar] [CrossRef]
- Lin, Q.; Li, B.; Liu, X.; Zhang, B.; Xu, S. Insights into sorption and leaching behavior of sulfadiazine in soil as affected by humic acid. J. Soil Sediment. 2022, 22, 809–817. [Google Scholar] [CrossRef]
- Mallants, D.; Doble, R.; Beiraghdar, Y. Fate and transport modelling framework for assessing risks to soil and groundwater from chemicals accidentally released during surface operations: An Australian example application from shale gas developments. J. Hydrol. 2022, 604, 127271. [Google Scholar] [CrossRef]
- Brunetti, G.; Kodešová, R.; Švecová, H.; Fér, M.; Nikodem, A.; Klement, A.; Grabic, R.; Šimůnek, J. A novel multiscale biophysical model to predict the fate of ionizable compounds in the soil-plant continuum. J. Hazard. Mater. 2022, 423, 127008. [Google Scholar] [CrossRef]
- Adhikari, K.; Mal, U. Evaluation of contamination of manganese in groundwater from overburden dumps of Lower Gondwana coal mines. Environ. Earth Sci. 2021, 80, 23. [Google Scholar] [CrossRef]
- Kanzari, S.; Nouna, B.B.; Mariem, S.B.; Rezig, M. Hydrus-1D model calibration and validation in various field conditions for simulating water flow and salts transport in a semi-arid region of Tunisia. Sustain. Environ. Res. 2018, 28, 350–356. [Google Scholar] [CrossRef]
- Šimůnek, J.; van Genuchten, M.T.; Šejna, M. Recent Developments and Applications of the HYDRUS Computer Software Packages. Vadose Zone J. 2016, 15, 33. [Google Scholar] [CrossRef]
- Alburquerque, J.A.; de la Fuente, C.; Ferrer-Costa, A.; Carrasco, L.; Cegarra, J.; Abad, M.; Bernal, M.P. Assessment of the fertiliser potential of digestates from farm and agroindustrial residues. Biomass. Bioenerg. 2012, 40, 181–189. [Google Scholar] [CrossRef]
- Spångberg, J.; Tidåker, P.; Jönsson, H. Environmental impact of recycling nutrients in human excreta to agriculture compared with enhanced wastewater treatment. Sci. Total Environ. 2014, 493, 209–219. [Google Scholar] [CrossRef]
- Massé, D.I.; Croteau, F.; Masse, L. The fate of crop nutrients during digestion of swine manure in psychrophilic anaerobic sequencing batch reactors. Bioresour. Technol. 2007, 98, 2819–2823. [Google Scholar] [CrossRef]
- Tang, Y.; Wen, G.; Li, P.; Dai, C.; Han, J. Effects of Biogas Slurry Application on Crop Production and Soil Properties in a Rice–Wheat Rotation on Coastal Reclaimed Farmland. Water Air Soil Pollut. 2019, 230, 51. [Google Scholar] [CrossRef]
- Tilvikienė, V.; Šlepetienė, A.; Kadžiulienė, Ž. Effects of 5 years of digestate application on biomass production and quality of cocksfoot (Dactylis glomerata L.). Grass Forage Sci. 2018, 73, 206–217. [Google Scholar] [CrossRef]
- Banasiak, L.J.; Schäfer, A.I. Sorption of steroidal hormones by electrodialysis membranes. J. Membr. Sci. 2010, 365, 198–205. [Google Scholar] [CrossRef]
- Colucci, M.S.; Bork, H.; Topp, E. Persistence of Estrogenic Hormones in Agricultural Soils: I. 17β-Estradiol and Estrone. J. Environ. Qual. 2001, 30, 2070–2076. [Google Scholar] [CrossRef]
- Carballa, M.; Omil, F.; Ternes, T.; Lema, J.M. Fate of pharmaceutical and personal care products (PPCPs) during anaerobic digestion of sewage sludge. Water Res. 2007, 41, 2139–2150. [Google Scholar] [CrossRef]
- Wang, Z.L.; Sun, G.; Zhou, W.; Sheng, J.; Ye, X.; Olaniran, A.O.; Gueguim Kana, E.B. Adsorption Characteristics of Three Types of Soils on Biogas Slurry Ammonium Nitrogen. Front. Env. Sci. 2022, 69, 942263. [Google Scholar] [CrossRef]
- Anna, S.; Eugeniusz, K. Kinetic and Equilibrium Studies of Sorption of Ammonium in the Soil-Water Environment in Agricultural Areas of Central Poland. Appl. Sci. 2016, 6, 269. [Google Scholar] [CrossRef]
- Allen, R.; Pereira, L.; Raes, D.; Martin, M. Guidelines for Computing CropWater Requirements; FAO: Rome, Italy, 1998. [Google Scholar]
- Kafkafi, U. Fertigation: A Tool of Efficient Fertilizer and Water Management; China Agriculture Press: Beijing, China, 2013. [Google Scholar]
- APHA; AWWA; WEF. Standards Methods for the Examination of Water and Wastewater, 21st ed.; APHA: Washington, DC, USA, 2005. [Google Scholar]
- Bao, S. Soil Agrochemical Analysis, 3rd ed.; China Agricultural Press: Beijing, China, 2000. [Google Scholar]
- Araújo, C.S.T.; Almeida, I.L.S.; Rezende, H.C.; Marcionilio, S.M.L.O.; Léon, J.J.L.; de Matos, T.N. Elucidation of mechanism involved in adsorption of Pb (II) onto lobeira fruit (Solanum lycocarpum) using Langmuir, Freundlich and Temkin isotherms. Microchem. J. 2018, 137, 348–354. [Google Scholar] [CrossRef]
- Vanderborght, J.; Vereecken, H. Review of Dispersivities for Transport Modeling in Soils. Vadose Zone J. 2007, 6, 29–52. [Google Scholar] [CrossRef]
- Veizaga, E.A.; Rodríguez, L.; Ocampo, C.J. Water and chloride transport in a fine-textured soil in a feedlot pen. J. Contam. Hydrol. 2015, 182, 91–103. [Google Scholar] [CrossRef]
- Mozaffari Majd, M.; Kordzadeh-Kermani, V.; Ghalandari, V.; Askari, A.; Sillanpää, M. Adsorption isotherm models: A comprehensive and systematic review (2010−2020). Sci. Total Environ. 2022, 812, 151334. [Google Scholar] [CrossRef]
- Bhattacharyya, A.; Mondal, D.; Roy, I.; Sarkar, G.; Saha, N.R.; Rana, D.; Ghosh, T.K.; Mandal, D.; Chakraborty, M.; Chattopadhyay, D. Studies of the kinetics and mechanism of the removal process of proflavine dye through adsorption by graphene oxide. J. Mol. Liq. 2017, 230, 696–704. [Google Scholar] [CrossRef]
- Aljazzar, T.; Al-Qinna, M. Assessment of nitrate transport parameters using the advection-diffusion cell. Environ. Sci. Pollut. R. 2016, 23, 23145–23157. [Google Scholar] [CrossRef]
- Conde-Cid, M.; Fernández-Calviño, D.; Núñez-Delgado, A.; Fernández-Sanjurjo, M.J.; Arias-Estévez, M.; Álvarez-Rodríguez, E. Estimation of adsorption/desorption Freundlich’s affinity coefficients for oxytetracycline and chlortetracycline from soil properties: Experimental data and pedotransfer functions. Ecotox. Environ. Saf. 2020, 196, 110584. [Google Scholar] [CrossRef]
- Bai, M.; Liu, Z.-B.; Zhang, S.-J.; Liu, F.; Lei, S.-L. Drainage performance and capillary rise restraint effect of wicking geotextile. J. Cent. South Univ. 2021, 28, 3260–3267. [Google Scholar] [CrossRef]
- Yao, R.; Li, H.; Zhu, W.; Yang, J.; Wang, X.; Yin, C.; Jing, Y.; Chen, Q.; Xie, W. Biochar and potassium humate shift the migration, transformation and redistribution of urea-N in salt-affected soil under drip fertigation: Soil column and incubation experiments. Irrig. Sci. 2022, 40, 267–282. [Google Scholar] [CrossRef]
- Tan, X.; Shao, D.; Gu, W.; Liu, H. Field analysis of water and nitrogen fate in lowland paddy fields under different water managements using HYDRUS-1D. Agric. Water Manag. 2015, 150, 67–80. [Google Scholar] [CrossRef]
- Akbari, P.; Herbert, S.; Hashemi, M.; Barker, A.; Zandvakili, O.R.; Emami Bistgani, Z. Winter Annual Rye Seeding Date Influence on Nitrogen Recovery and Ammonia Volatilization from Late Fall Surface-Applied Manure. Agronomy 2020, 10, 931. [Google Scholar] [CrossRef]
- Zhang, S.; Hou, X.; Wu, C.; Zhang, C. Impacts of climate and planting structure changes on watershed runoff and nitrogen and phosphorus loss. Sci. Total Environ. 2020, 706, 134489. [Google Scholar] [CrossRef] [PubMed]
- Zhang, C.; Huang, X.; Zhang, X.; Wan, L.; Wang, Z. Effects of biochar application on soil nitrogen and phosphorous leaching loss and oil peony growth. Agric. Water Manag. 2021, 255, 107022. [Google Scholar] [CrossRef]
- Rezvani, M.; Nadimi, S.; Zaefarian, F.; Chauhan, B.S. Environmental factors affecting seed germination and seedling emergence of three Phalaris species. Crop. Prot. 2021, 148, 105743. [Google Scholar] [CrossRef]
- Lamsal, A.; Devkota, M.P.; Shrestha, D.S.; Joshi, S.; Shrestha, A. Seed germination ecology of Ageratum houstonianum: A major invasive weed in Nepal. PLoS ONE 2019, 14, e0225430. [Google Scholar] [CrossRef]
- Alovisi, A.M.T.; Cassol, C.J.; Nascimento, J.S.; Soares, N.B.; da Silva Junior, I.R.; da Silva, R.S.; da Silva, J.A.M. Soil factors affecting phosphorus adsorption in soils of the Cerrado, Brazil. Geoderma. Reg. 2020, 22, e00298. [Google Scholar] [CrossRef]
- Yan, L.; Liu, C.; Zhang, Y.; Liu, S.; Zhang, Y. Effects of C/N ratio variation in swine biogas slurry on soil dissolved organic matter: Content and fluorescence characteristics. Ecotox. Environ. Saf. 2021, 209, 111804. [Google Scholar] [CrossRef]
- Cheng, J.; Chen, Y.; He, T.; Liao, R.; Liu, R.; Yi, M.; Huang, L.; Yang, Z.; Fu, T.; Li, X. Soil nitrogen leaching decreases as biogas slurry DOC/N ratio increases. Appl. Soil. Ecol. 2017, 111, 105–113. [Google Scholar] [CrossRef]
Figure 1.
Photograph of soil column infiltration test.

Figure 2.
Photos of multistage soil box percolation system.

Figure 3.
Variation of (a) pH, (b) EC, (c) nutrients, (d) organics in the soil adsorption kinetics test. Note: EC—Electrical conductivity; NH3-N—Ammonia nitrogen; TN—Total nitrogen; TP—Total phosphorus; COD—Chemical oxygen demand; SCOD—Soluble chemical oxygen demand.
Figure 3.
Variation of (a) pH, (b) EC, (c) nutrients, (d) organics in the soil adsorption kinetics test. Note: EC—Electrical conductivity; NH3-N—Ammonia nitrogen; TN—Total nitrogen; TP—Total phosphorus; COD—Chemical oxygen demand; SCOD—Soluble chemical oxygen demand.

Figure 4.
Adsorption kinetic models of (a) nutrients, (b) organics by soil. Note: TAN—Total ammonia nitrogen; TN—Total nitrogen; TP—Total phosphorus; COD—Chemical oxygen demand; SCOD—Soluble chemical oxygen demand.
Figure 4.
Adsorption kinetic models of (a) nutrients, (b) organics by soil. Note: TAN—Total ammonia nitrogen; TN—Total nitrogen; TP—Total phosphorus; COD—Chemical oxygen demand; SCOD—Soluble chemical oxygen demand.

Figure 5.
Isothermal adsorption curves of soil to reclaimed fertilizer. (a) TAN fitted with linear model; (b) TAN fitted with Freundlich model; (c) TN fitted with linear model; (d) TN fitted with Freundlich model; (e) TP fitted with linear model; (f) TP fitted with Freundlich model; (g) COD fitted with linear model; (h) COD fitted with Freundlich model; (i) SCOD fitted with linear model; (j) SCOD fitted with Freundlich model. Note: TAN—Total ammonia nitrogen; TN—Total nitrogen; TP—Total phosphorus; COD—Chemical oxygen demand; SCOD—Soluble chemical oxygen demand; EC—Electrical conductivity.

Figure 6.
Soil biodegradation curve of reclaimed fertilizer. (a) TAN, (b) TN, (c) COD and (d) SCOD fitted by the first-order kinetic curve. Note: TAN—Total ammonia nitrogen; TN—Total nitrogen; COD—Chemical oxygen demand; SCOD—Soluble chemical oxygen demand.
Figure 6.
Soil biodegradation curve of reclaimed fertilizer. (a) TAN, (b) TN, (c) COD and (d) SCOD fitted by the first-order kinetic curve. Note: TAN—Total ammonia nitrogen; TN—Total nitrogen; COD—Chemical oxygen demand; SCOD—Soluble chemical oxygen demand.

Figure 7.
Concentration and interception efficiency of (a) TAN, (b) TN, (c) NO3-N, (d) TP, (e) COD and (f) SCOD in soil column leachate. Note: Con—Concentration; Int—Interception efficiency; 10, 30, 50 represent 10 cm, 30 cm and 50 cm; TAN—Total ammonia nitrogen; TN—Total nitrogen; NO3-N—Nitrate nitrogen; TP—Total phosphorous; COD—Chemical oxygen demand; SCOD- Soluble chemical oxygen demand.

Figure 8.
Simulated and measured values of (a) TAN, (b) TN, (c) COD and (d) SCOD in the soil layer of 30 cm. Note: TAN—Total ammonia nitrogen; TN—Total nitrogen; COD—Chemical oxygen demand; SCOD—Soluble chemical oxygen demand.
Figure 8.
Simulated and measured values of (a) TAN, (b) TN, (c) COD and (d) SCOD in the soil layer of 30 cm. Note: TAN—Total ammonia nitrogen; TN—Total nitrogen; COD—Chemical oxygen demand; SCOD—Soluble chemical oxygen demand.

Figure 9.
Predicted values of (a) TAN, (b) TN, (c) COD and (d) SCOD transport in soil. Note: TAN—Total ammonia nitrogen; TN—Total nitrogen; COD—Chemical oxygen demand; SCOD—Soluble chemical oxygen demand.
Figure 9.
Predicted values of (a) TAN, (b) TN, (c) COD and (d) SCOD transport in soil. Note: TAN—Total ammonia nitrogen; TN—Total nitrogen; COD—Chemical oxygen demand; SCOD—Soluble chemical oxygen demand.


Table 1.
Characteristics of feedstock in different tests.
| Test | Adsorption Test | Degradation Test | Soil Column Test | Soil Box Test |
|---|---|---|---|---|
| pH | 8.29 | 8.92 | 8.17 | 8.50 ± 0.10 |
| TAN (mg/L) | 622.6 | 689.8 | 813.8 | 602.4 ± 16.6 |
| TN (mg/L) | 672.5 | 652.6 | 891.9 | 666.1 ± 60.2 |
| TP (mg/L) | 22.5 | 9.7 | 29.0 | 13.0 ± 3.3 |
| COD (mg/L) | 1669 | 557 | 1457 | 1209 ± 47 |
| SCOD (mg/L) | 961 | 324 | 910 | 892 ± 24 |
| EC (S/m) | 0.807 | 0.508 | 1.031 | 0.76 ± 0.02 |
Note: TAN—Total ammonia nitrogen; TN—Total nitrogen; TP—Total phosphorus; COD—Chemical oxygen demand; SCOD—Soluble chemical oxygen demand; EC—Electrical conductivity.
Table 2.
Dilution gradient and concentration of fermented sanitation wastewater.
| Dilution Multiple | pH | EC (S/m) | TAN (mg/L) | TN (mg/L) | TP (mg/L) | COD (mg/L) | SCOD (mg/L) |
|---|---|---|---|---|---|---|---|
| 1 | 8.33 | 0.899 | 757.68 | 877.29 | 26.79 | 1798 | 788 |
| 2 | 8.34 | 0.495 | 385.43 | 426.63 | 13.24 | 751 | 399 |
| 3 | 8.30 | 0.335 | 253.58 | 282.42 | 9.17 | 485 | 266 |
| 4 | 8.28 | 0.258 | 175.80 | 210.58 | 6.70 | 357 | 195 |
| 6 | 8.25 | 0.163 | 122.18 | 143.07 | 4.28 | 233 | 125 |
| 10 | 8.18 | 0.102 | 69.70 | 78.55 | 2.53 | 139 | 77 |
| 20 | 8.06 | 0.054 | 36.17 | 42.44 | 1.29 | 72 | 38 |
Note: EC—Electrical conductivity; TAN—Total ammonia nitrogen; TN—Total nitrogen; TP—Total phosphorus; COD—Chemical oxygen demand; SCOD—Soluble chemical oxygen demand.
Table 3.
Initial soil attributes.
| Box Number | pH | EC (S/m) | N (%) | C (%) | H (%) | S (%) |
|---|---|---|---|---|---|---|
| 1 | 8.10 | 0.016 | 0.1003 | 1.6844 | 0.5476 | 0.0640 |
| 2 | 8.11 | 0.016 | 0.1085 | 1.7618 | 0.5618 | 0.0435 |
| 3 | 8.08 | 0.013 | 0.1018 | 1.7472 | 0.5309 | 0.0355 |
| 4 | 8.22 | 0.013 | 0.0996 | 1.7330 | 0.5259 | 0.0305 |
| Average | 8.13 | 0.015 | 0.1026 | 1.7316 | 0.5415 | 0.0434 |
Note: EC—Electrical conductivity; N, C, H and S—Content of N, C, H and S elements in soil.
Table 4.
The hydraulic parameters of sandy loam soil.
| Parameters | Qr | Qs | α (cm−1) | n | Ks (cm·d−1) | L |
|---|---|---|---|---|---|---|
| Values | 0.065 | 0.41 | 0.075 | 1.89 | 106.1 | 0.5 |
Note: Qr—Residual soil water content; Qs—Saturated soil water content; α, n—Parameters in the soil water retention function; Ks—Saturated hydraulic conductivity; L—Tortuosity parameter in the conductivity function.
Table 5.
Corrected characteristic parameters for solute migration in soil.
| Parameters | Diffus. W | Disp. L | |||
|---|---|---|---|---|---|
| cm2·d−1 | cm | (d−1) | |||
| TAN | 1364 | 16.63 | 0.03312 | 0.4004 | 0.1538 |
| TN | 1061 | 10.30 | 0.0006 | - | 0.0831 |
| COD | 1653 | 17.50 | 0.0024 | - | 0.5301 |
| SCOD | 1061 | 19.06 | 0.0013 | - | 0.3666 |
Note: Diffus. W()—Diffusion coefficient; Disp. L()—longitudinal dispersivity; —First adsorption coefficient; —adsorption intensity constant; —first-order kinetic reaction rate constant. TAN—Total ammonia nitrogen; TN—Total nitrogen; COD—Chemical oxygen demand; SCOD—Soluble chemical oxygen demand.
Table 6.
Concentration setting value of each parameter on the top.
| Parameters | Concentration |
|---|---|
| mg·cm−3 | |
| TAN | 0.650 |
| TN | 0.700 |
| COD | 1.2 |
| SCOD | 0.9 |
Note: TAN—Total ammonia nitrogen; TN—Total nitrogen; COD—Chemical oxygen demand; SCOD—Soluble chemical oxygen demand.
Table 7.
Soil attributes after soil box percolation test.
| Box Number | pH | EC (S/m) | N (%) | C (%) | H (%) | S (%) |
|---|---|---|---|---|---|---|
| 1 | 7.44 | 0.171 | 0.1670 | 1.8237 | 0.5402 | 0.0384 |
| 2 | 7.30 | 0.064 | 0.1254 | 1.8067 | 0.5305 | 0.0302 |
| 3 | 6.92 | 0.337 | 0.2370 | 1.8026 | 0.5555 | 0.0367 |
| 4 | 6.92 | 0.077 | 0.1291 | 1.7879 | 0.5352 | 0.0246 |
| Average | 7.15 | 0.162 | 0.1646 | 1.8052 | 0.5403 | 0.0325 |
Note: EC—Electrical conductivity; N, C, H and S—Content of N, C, H and S elements in soil.
Publisher’s Note: MDPI stays neutral with regard to jurisdictional claims in published maps and institutional affiliations. |
© 2022 by the authors. Licensee MDPI, Basel, Switzerland. This article is an open access article distributed under the terms and conditions of the Creative Commons Attribution (CC BY) license (https://creativecommons.org/licenses/by/4.0/).
Share and Cite
MDPI and ACS Style
Lv, M.; Zhu, S.; Shi, Y.; Shu, S.; Li, A.; Fan, B. Study on Soil Leaching Risk of Reuse of Reclaimed Fertilizer from Micro-Flush Sanitary Wastewater. Water 2022, 14, 2823. https://doi.org/10.3390/w14182823
AMA Style
Lv M, Zhu S, Shi Y, Shu S, Li A, Fan B. Study on Soil Leaching Risk of Reuse of Reclaimed Fertilizer from Micro-Flush Sanitary Wastewater. Water. 2022; 14(18):2823. https://doi.org/10.3390/w14182823
Chicago/Turabian StyleLv, Minghuan, Shikun Zhu, Yunpeng Shi, Shangyi Shu, Ao Li, and Bin Fan. 2022. "Study on Soil Leaching Risk of Reuse of Reclaimed Fertilizer from Micro-Flush Sanitary Wastewater" Water 14, no. 18: 2823. https://doi.org/10.3390/w14182823
Note that from the first issue of 2016, this journal uses article numbers instead of page numbers. See further details here.