Article

Area Changes and Influencing Factors of Large Inland Lakes in Recent 20 Years: A Case Study of Sichuan Province, China

1
School of Earth Science, Chengdu University of Technology, Chengdu 610059, China
2
Department of Land Surveying and Geo-Informatics, The Hong Kong Polytechnic University, Hongkong 999077, China
3
State Key Laboratory of Geohazard Prevention and Geoenvironment Protection, Chengdu University of Technology, Chengdu 610059, China
4
Land Satellite Remote Sensing Application Center, Ministry of Natural Resources of China, Beijing 100048, China
5
Northwest Engineering Corporation Limited, Xi’an 710065, China
6
PIESAT Information Technology Co., Ltd., Beijing 100195, China
*
Author to whom correspondence should be addressed.
Water 2022, 14(18), 2816; https://doi.org/10.3390/w14182816
Submission received: 27 July 2022 / Revised: 1 September 2022 / Accepted: 6 September 2022 / Published: 9 September 2022
(This article belongs to the Special Issue Remote Sensing in Monitoring and Assessment of Marine Environment)

Abstract

:
Lakes are important natural resources closely related to human survival and development. Based on PIE cloud computing platform, the study uses Landsat images and the empirical normalized water body index (ENDWI) to extract water body information of the large lakes in Sichuan province from 2000 to 2020 in the drought and rainy seasons, respectively, and uses the Mann–Kendall test to obtain the long-term trends of their area and climate. On this basis, the evolution of the lakes and their correlation with climate and human activities are analyzed. The results show that (1) In the past 20 years, the area of Lugu Lake, Qionghai Lake, and Luban Reservoir represent a decreasing trend, with Lugu Lake being the most affected. The area of Ma Lake, Three Forks Lake, and Shengzhong Reservoir increased, with the area of Shengzhong Reservoir increasing significantly; (2) During the drought season, all six lakes showed a decreasing trend in precipitation, with the most apparent decreasing trend for Lugu Lake (Slope = −0.8). Only Lugu Lake showed a decreasing trend in precipitation (Slope = −0.15) during the rainy season. The precipitation of Ma Lake, Three Forks Lake, Luban Reservoir and Shengzhong Reservoir showed a significant increasing trend (Slope value was greater than 1.96); (3) The temperatures of the remaining lakes all decreased in the drought season and increased in the rainy season, except that the temperature of Shengzhong Reservoir decreases throughout the year; (4) The area change of plain lakes is greatly affected by human activities, but the area of plateau lakes is are more impacted by climate. Our study improved the accuracy of long-term water body change monitoring with PIE-Engine Studio. Besides, the findings would provide reference for the implementation of sustainable water resources management in Sichuan Province.

1. Introduction

As critical national resources, lakes and reservoirs are essential in providing water for life and production, regulating climate, and maintaining ecosystem balance. The area of the lake is sensitive to human activities and climate changes [1,2,3,4,5]. The dynamic changes in the lake and the resulting changes in the surrounding ecosystem are likely to be influenced by global climate change [6,7,8]. Therefore, timely and accurate monitoring of changes in lakes enables our better understanding of regional and global environmental evolution [9]. Increased precipitation and permafrost degradation caused by warming temperatures are the primary reasons for rapid expansion of lakes in the Qinghai-Tibet interior basin [10]. The area of Hongjian Nur has been diminished due to a periodic decrease in precipitation [11]. Furthermore, the effects of anthropogenic hydraulic projects and land-cover changes caused by human activity on lake surface area have been observed. The Three Gorges Dam impoundment has altered the hydrological environment and land cover surrounding the Dongting Lake wetlands, resulting in changes there in recent decades [12]. Lakes have shrunk due to river diversions, damming, and unregulated water consumption [13,14,15,16]. Based on climatic, hydrological, and vegetation data in the Lake Urmia basin, Khazaei et al. [17] used the Pettitt test and Mann–Kendall test to explain the lake desiccation and discovered that the correlation between climate change and the drying of Lake Urmia was not significant. Human activities (increased water consumption) may be the driving factor in the drying of Lake Urmia.
In recent years, many scholars have made efforts to monitor the long time series dynamics of lakes and analyzed the causes of changes. Tao et al. [18] made a national assessment of lake changes and their drivers in the last 30 years (the mid-1980s to 2015). However, they did not consider the relationship between lake changes, climate changes, and changes of human activities in local regions. Liu et al. [19] studied the changes in alpine and non-alpine lakes and integrated them with climate changes. The results showed that the spatial pattern of lake changes was consistent with that of climate changes, but there is a lack of consideration of the impact of human activities on non-alpine lakes. Xiao et al. [20] extracted the area of lakes in the Yunnan-Guizhou plateau from 1985–2015 with a time interval of five years. They analyzed the influence of climate and human activities on the area of lakes in the Yunnan-Guizhou plateau. Too long a time interval can lead to errors in judgment regarding lake change trends [21]. To bridge the gap, this study focuses on the dynamic monitoring of lakes in Sichuan Province on a year-by-year basis during dry and rainy seasons. We also analyzed the impact of climate change and human activities on different types of lakes by combining climate and land cover data.
The rapid growth in cloud computing improves the possibility of large-scale and long-time series surface water monitoring [22]. Many researchers have used GEE (Google Earth Engine) for large-scale and long-term surface water monitoring [23,24,25,26,27,28,29]. Users can use pre-processed datasets, such as Landsat, directly on cloud computing platforms [30] without using specialized software for radiometric and atmospheric corrections, thereby significantly improving efficiency. PIE-Engine Studio is a computing cloud service platform in remote sensing and a geospatial data analysis and computing platform. Cheng et al. compared the data processing capability of GEE and PIE-Engine Studio using the calculation of the NDVI(Normalized Difference Vegetation Index) as an example. They found that GEE was more efficient, but the two platforms had consistent results [31]. The results demonstrated that China’s independent remote sensing cloud computing platform, PIE-Engine Studio, can offer data and arithmetic support for geoscience research and will aid in the development of China’s remote sensing cloud computing platform. We analyzed the spatial and temporal changes of highland and plain lakes using the PIE-Engine Studio platform and Landsat imagery. To avoid cloud pixels and seasonality, de-clouding was performed, and the drought and wet seasons were divided. Finally, the effects of climate and human activities on lake variation are explored. It is expected to provide a reference for the rational allocation of water resources in Sichuan Province. In addition, the feasibility of applying PIE-Engine Studio to the dynamic monitoring of long-time series lake areas is explored.

2. Materials and Methods

2.1. Study Area

Sichuan is in southwest China (97°~108° E, 26°~34° N). The area has high mountains in the west and flat topography in the east. It can be divided into two major parts, i.e., the western Sichuan plateau and the eastern Sichuan basin [32]. In this paper, six lakes were chosen as the study region. In the west, we chose the top three natural lakes (in terms of area) in Sichuan Province: Lugu Lake, Qionghai Lake, and Ma Lake. In the eastern basin, the top three artificial lakes were selected: Shengzhong Reservoir, Three Forks Lake, and Luban Reservoir. Figure 1 shows the location of the lakes in the study area.

2.2. Data

PIE-Engine Remote Sensing Cloud Service Platform (PIE Cloud Platform) includes PIE-Engine Factory, PIE-Engine Studio, PIE-Engine AI, and PIE-Engine Server data sharing cloud service. This paper researched area changes of typical water bodies in Sichuan Province mainly based on the PIE-Engine Studio remote sensing computing cloud service platform.
PIE-Engine Studio takes online programming as the primary usage mode and has a relatively rich data source. More than 90 datasets, including Landsat, Gaofen, Sentinel, Modis, etc., can be used on the platform. The remote sensing images we used are from the Landsat series data in PIE-Engine Studio (Table 1), and the number of images used is shown in Figure 2. Since the Landsat-7 Enhanced Thematic Mapper Plus (ETM+) image had a Scan Line Corrector failure after 2003, resulting in the striping of the image, so we used the Landsat-7 ETM image that was available from 2000–2021 as Supplementary Data. To ensure the temporal continuity of this study, we downloaded 2012 Landsat 7 ETM+ images and performed pre-processing such as strip filling, radiometric calibration, atmospheric correction, geometric correction, and clipping on ENVI 5.3.
The Chinese monthly precipitation dataset and the Chinese monthly average temperature dataset in PIE-Engine Studio were selected as the data sources (Table 1) for the meteorological data [33]. The analysis of how the lake area responded to changes in human activity employed data from the China 30 m Annual Land Cover Product (CLCD) in PIE-Engine Studio [33]. Prof. Huang’s team at Wuhan University obtained the CLCD with an overall accuracy of 79.31% using 300,000 scenes of Landsat images. The dataset was produced from 5463 independent reference samples, combined with automated stabilization samples of existing products and visual interpretation samples. We selected the JRC Global Surface Water Mapping Layers v1.4 dataset to validate the accuracy of extracting water bodies using ENDWI. This data product is the Global Surface Water atlas generated by scientists at the Joint Research Centre of the European Commission (JRC) with a resolution of 30 m [34].
To reduce the influence of seasonal factors on the area of water bodies [35], this paper divided a year into the drought season (December to May of the following year) and the rainy season (June to November). The related literature [36,37], shows that the wet season in southwest China mostly starts in May, and the rainy season starts in the east and gradually pushes toward the west. The six lakes selected in this paper have a wide latitudinal span, so June was chosen as the beginning of the rainy season.

2.3. Methods

The schematic diagram of the study is illustrated in Figure 3. Firstly, pre-processing of data was done on PIE-Engine Studio and ENVI 5.3. Next, water body extraction was programmed online on the cloud platform using ENDWI. After that, the changing trend was observed based on Sen slope estimation and the Mann–Kendall test. Finally, the response of meteorology and human activities to the lake area change was analyzed.

2.3.1. Water Body Extraction Method

We extracted water bodies using the Empirical Normalized Difference in Water Index (ENDWI) [38]. Qiao et al. studied Lugu Lake by comparing and analyzing the accuracy of seven models, normalized difference water index (NDWI) [39], modified normalized difference water index (MNDWI) [40], enhanced water index (EWI) [41], slope adjusted water index (SAWI) [42], revised normalized different water index (RNDWI) [43], new water index (NWI) [44], and ENDWI. They found that the extraction accuracy of each water body model is greater, but ENDWI has the highest accuracy. Therefore, we also chose ENDWI to extract water bodies. The following formula calculates the ENDWI. The green band, near-infrared (NIR) band and the mid-infrared (MIR) band are applied to ENDWI calculations (1). Table 2 shows the wavelength ranges of Landsat satellites.
ENDWI = Green MIR Green + NIR

2.3.2. Water Body Area Calculation

The workflow of the water body area calculation is illustrated in Figure 4. The Landsat 5, Landsat 7, and Landsat 8 datasets in the PIE-Engine Studio platform were first selected, and the data were filtered by time and region. Afterward, we calculated the cloud mask using the values of the quality assessment (QA) band. We performed the mask operation with the update mask algorithm to remove the cloud effect. Because the median values are not affected by the biased large or small data, it is more appropriate to represent the whole data. Therefore, we took the median value of the drought synthetic data and wet season synthetic data, and then calculated the ENDWI. Finally, after several visual judgments, we obtained the optimal threshold to segment the water body of each lake’s extraction result, and then calculated the water body area.

2.3.3. Rate of Change in the Lake Area

The rate of change (φ) indicates the intensity of change in the lake area over the different observation periods. The lake’s shrinkage and expansion rate are more intuitively analyzed using this indicator, which is given by the following formula.
φ = S t S 0 S 0   ×   100 %
where φ indicates the percentage change of the lake area in a certain period. S t and S 0 mean the lake area at the beginning and end of the certain period.

2.3.4. Trend Analysis Methods

The Theil–Sen Median, also known as the Sen slope estimate, is a robust nonparametric statistical method for calculating trends [45]. The formula is:
slope = median ( X j X i ) j i
where slope is the slope of Sen, X j represents the lake area or meteorological factor value in the year j, and   X i   represents the lake area or meteorological factor value in the year i.
The Mann–Kendall test [46,47] is a nonparametric test commonly used for trend analysis of time series data [48,49]. Nonparametric tests usually are used in combination [50,51]. It means that the Sen trend value is calculated first and the Mann–Kendall test is subsequently used to determine the significance of the trend. In this study, the statistics z-value, p-value and Sen slope estimating slope values for the Mann–Kendall test were calculated using R software v. 4.1.3 [14].

2.3.5. Verification of Accuracy

We used ENDWI to extract the surface water body information of typical lakes in Sichuan Province in 2020. We then used the water body information from Global Surface Water in 2020 to randomly select 100~200 test samples of each lake region to calculate the classification confusion matrix for accuracy analysis. Meanwhile, we also compared the lake areas with those obtained in other scholars' studies to verify the accuracy further.

3. Results

3.1. Verification Results

We analyzed the accuracy of the extraction results with Global Surface Water. We found that the overall accuracy was greater than 85%, the Kappa coefficients were all above 0.75 (Table 3), and the differences with other studies were below 4 km2 (Table 4). The above results indicate that it is feasible for us to extract water bodies with the ENDWI method on PIE-Engine Studio. The larger extent of Lugu Lake that we extracted may be that previous studies selected images of a specific date to extract water bodies as the lake area for that year. In contrast, we chose all available images in both the dry and rainy season time ranges to extract the water bodies and averaged the area of the dry and rainy seasons as the lake area for the year. The areas of the six lakes from 2000 to 2020 are shown in Table S1.

3.2. Spatial and Temporal Change of Typical Lakes in Sichuan Province

3.2.1. The Temporal and Spatial Change in the Lake Area

Figure 5a shows the changes in the lake area of Lugu Lake (LGL), Qionghai Lake (QHL), Ma Lake (ML), Three Forks Lake (TFL), Luban Reservoir (LBR), and Shengzhong Reservoir (SZR) from 2000 to 2020. Combined with Table 5, SZR and LGL represent significant changes while the trends of the remaining four lakes are less obvious.
Figure 5b shows the changes in LGL during the drought and rainy seasons and the annual average area. The changing trend of the drought and rainy seasons is the same, and the area difference between the drought and rainy seasons in 2001 is the largest. Using the drought season as an example, the area change has two stages. The first stage is a sharp decline (2000–2006), with a reduction of 3.45 km2. Figure 6a shows that the reduction mainly occurs in the Caohai wetland (the green part represents the reduced water body). The second is in the slow decline stage (2006–2020). The area decreased by 0.22 km², reaching its lowest level in 2011. Figure 6b shows that the Caohai part of Lugu Lake has been disappearing slowly since 2006. Figure 5c displays changes in the drought and rainy seasons and the annual average area of SZR. While the trends for the drought and wet seasons are mostly similar, the most significant area difference between the two occurred in 2001. Using the drought season as an example, the area change has four stages. The green color portion of Figure 7a shows the shrinkage of water bodies between 2000 and 2004. The second period is the phase of significant increase (2004–2013), with a rise of 14.88 km². During this period, the cropland near the Shengzhong Reservoir began to decrease, and the forest area became larger. The third period (2013–2014) depicts the decline phase, with a loss of 7.98 km², and the blue in Figure 7c represents the shrinking water bodies. The fourth period is the rising stage (2014–2020) but with a smaller magnitude than the second stage, with an increase of 4.83 km², and the red color in Figure 7d represents the increased water bodies.

3.2.2. Characteristics of Drought and Wet Season Area Changes

The water body information of the six lakes from 2000 to 2020 drought and wet seasons were extracted separately. The extraction results are shown in Figures S1–S12.
Figure 8a shows that Lugu Lake has an average area of 50.35 km² during the drought season. Furthermore, it reached a peak area of 53.6 km² in 2001 and a minimum area of 49.4 km² in 2020.
The area of Lugu Lake in the drought season has decreased significantly in the last 20 years (Table 5). The average area of Qionghai Lake in the drought season is 26.09 km² (Figure 8b), the area of the lake is relatively stable overall, and the area of Qionghai Lake in the drought season is decreased in the last 20 years (Table 5). The average area of Ma Lake during the drought season is 6.79 km² (Figure 8c). The lake area peaked at 7.07 km² in 2003 and dropped to a minimum of 6.59 km² in 2011 and 2019, indicating a generally smooth variation in the extent of Ma Lake during the dry season and a rise in general (Table 5). In the dry season, the average area of Three Forks Lake is 21.01 km² (Figure 8d), with a high of 23.6 km² in 2012 and a low of 18.2 km² in 2005. The Mann–Kendall test results demonstrated that the dry season area of Three Forks Lake has shrunk over the previous 20 years (Table 5). The Luban Reservoir’s area peaked at 13.1 km² in 2007 and 2019, decreased to a minimum of 8.68 km² in 2009, and has climbed over the past 20 years. The average area of Luban Reservoir during the dry season is 12.05 km² (Figure 8e) (Table 5). Shengzhong Reservoir’s average dry season area is 38.4 km² (Figure 8f), but the lake’s area peaked at 45.8 km² in 2010. The reservoir’s area was below the multi-year average until 2007, reaching its lowest extent of 27.3 km² and has significantly grown in the past 20 years (Table 5).
As shown in Figure 9a, the average area of Lugu Lake during the wet season is 50.35 km², with a peak area of 52.3 km² in 2000 and a minimum area of 49.2 km² in 2015. The area of Lugu Lake in the wet season has been declining significantly in the last 20 years (Table 5). In the wet season, the average area of Qionghai Lake is 25.95 km² (Figure 9b). The lake area is less changeable, with a declining tendency (Table 5). The average area of Ma Lake during the wet season is 6.71 km² (Figure 9c), and the lake area peaked at 6.96 km² in 2013 and dropped to a minimum of 6.49 km² in 2005. The area during the wet season is less than 7 km², which is generally increasing (Table 5). The average area of Three Forks Lake during the wet season is 19.75 km² (Figure 9d), and the lake area peaked in 2015 at 23.3 km². According to the Mann–Kendall test, the area of Three Forks Lake during the wet season has expanded during the last 20 years (Table 5). During the wet season, the area of Luban Reservoir decreased, and that of Shengzhong Reservoir was significantly increased (Table 5). The area of both Luban and Shengzhong Reservoirs reached their lowest values in 2006. We think the reason may be that the mega-drought occurred in Sichuan and Chongqing that summer [54], which caused a relatively significant impact on the reservoirs.

3.2.3. Variable Characteristics of Different Lake Types

The six lakes can be categorized into two groups based on their geomorphological features and elevation, i.e., highland lakes (>1000 m elevation) and plain lakes (<1000 m) (Table 6). Plains lakes are artificially built reservoirs with elevations less than 1000 m, such as Three Forks Lake, Luban Reservoir, and Shengzhong Reservoir. Plains lakes are more affected by human activities (irrigation, for example) because of their location in plains or basins. Highland lakes, natural lakes with altitudes higher than 1000 m, are Lugu Lake, Qionghai Lake, and Ma Lake. They all belong to semi-enclosed lakes, and the lake water is resupplied mainly by rainfall. Therefore, these lakes are more influenced by meteorological factors and less by human activities.
Table 6 shows that the plateau lakes’ area changed slowly between 2000 and 2020, indicating a more stable trend in the region’s evolution. The changes in the area of the plain lakes are more significant due to human intervention (irrigation, for example).

3.3. Impact of Climate on Lake Area Changes

The main climate influence factors in this study were rainfall and temperature. As can be seen in Figure 10, all six lakes show a decreasing trend in precipitation in the springand an increasing trend in the summer. In autumn, all lakes except Lugu Lake show increased rainfall in the last 20 years. We also found that the rainfall of Three Forks Lake, Luban Reservoir, and Shengzhong Reservoir, which are in the plains, show a striking consistency in seasonal changes. Moreover, their rainfall shows the same trend in Qionghai Lake and Ma Lake, which are at the same altitude. In contrast, precipitation trends differ between plains and highland lakes (elevation < 1500 m). This situation shows that the altitude on the seasonal scale affects rainfall over a range of heights [55]. Figure 11 shows the rainfall of the six lakes during the dry and rainy seasons. It can be seen that the rainfall of all six lakes shows a decreasing trend in the dry season. Combined with Table 7, we found that Lugu Lake has the most apparent decreasing trend (Slope = −0.8). For the rainy season, only the precipitation of Lugu Lake shows a decreasing trend (Slope = −0.15). The rest of the lakes show an increasing trend in precipitation during the rainy season, with Ma Lake, Three Forks Lake, Luban Reservoir, and Shengzhong Reservoir showing a significant increasing trend (Slope values are all greater than 1.96).
Figure 12 illustrates the seasonal characteristics of temperature changes in the study area. In spring and autumn, temperatures increase in all lakes except two reservoirs, and Lee [56] showed that irrigation reservoirs in urban areas have a decreasing effect on temperatures. In all six lakes, the temperature increases in summer and decreases in winter. As seen in Figure 13 and Table 7, the dry season temperatures in the study area are all decreasing slightly. The temperature in the rainy season tends to increase except for Shengzhong Reservoir and Qionghai Lake which shows a significant increase (Slope = 0.03, Z = 1.98). In general, only the rainfall of Lugu Lake decrease in dry and rainy seasons. The precipitation of the rest of the lakes decreases in the dry seasons and increases in the rainy seasons. Only the temperature of Shengzhong Reservoir decreases throughout the year. The temperatures of the rest of the lakes decreases in the dry seasons and increases in the rainy seasons.
The correlation analysis of lake area with temperature and precipitation was studied using SPSS (Table 8). The correlation between the precipitation and the area of Lake Ma in the rainy season was significant (p < 0.05), showing a significant positive correlation. In the dry season, there was a negative correlation between rainfall and the area in Three Forks Lake and Shengzhong Reservoir. The correlation between temperature change and the area of Lugu Lake in the rainy season was more significant (p < 0.05) than that of Lake Ma, showing a significant negative correlation. The correlations between climatic factors and the areas of Qionghai Lake, Three Forks Lake, Luban Reservoir, and Shengzhong Reservoir are all poor. This situation indicates that climatic factors (i.e., precipitation and temperature) are not the main drivers of the changes in these four lakes.

3.4. Impact of Human Activities on Changes in the Lake Area

According to relevant studies, anthropogenic activities are one of the significant factors impacting the change in lake surface water area [57]. Analyzing the land cover change of each lake basin provides insight into how human activities have affected lakes, which is the most evident manifestation of human activity. Origin was used to plot the land cover changes of the selected lakes (Figure 14), and the data were scaled up and down equally to be more intuitive. See Figures S13–S18 for detailed land cover maps around the selected lakes.
The impervious surface area of all lakes increased (Figure 14), with Qionghai showing the most rapid growth. The cropland surrounding Lugu Lake decreased and subsequently increased (Figure 14). Some cropland was turned to impervious surfaces in 2008. The main reason for the declining trend of the grassland around Lugu Lake is that some grasslands have been turned into forest land during the natural succession process due to ecological measures such as “returning farmland to forest and grass”. Since 2012, some grasslands have been converted to wetlands. Since 2013, wastelands have been turned into forested land, minimizing soil erosion around the lake [58]. As a result, the area change of Lugu Lake is still in a decreasing trend but gradually stabilized.
The cropland area in Qionghai Lake is declining, while the impervious surface area is significantly increasing. The “four retreats and three returns” project (retreating people, houses, fields, and ponds; returning lakes, water, and wetlands), has effectively protected the forests around Qionghai and slowed down the impact of human activities on Qionghai. Although the area of Qionghai Lake has declined in the past 20 years, the change is very slight.
After proposing measures to protect and restore the ecosystems of mountains, water, forests, fields, and lakes in 2016, the forest area around Three Forks Lake began to rise and the cropland area began to decrease. Three Forks Lake shoreline land is primarily used for agriculture and lake water is mainly used for irrigation. As agricultural land is decreasing, the water area increases. Farmers’ income has shifted from planting and farming to tourism and related services as a result of the growth of tourism and the rise in tourists. This measure has contributed to the protection of surface water [59].
The impervious surface area around the Luban Reservoir is increasing. Meanwhile, the forest area decreased significantly between 2000 and 2006, resulting in severe soil erosion.
The Shengzhong Reservoir’s water resources consumption in the reservoir area is primarily used for agricultural water [60], domestic water demand, and upstream water consumption. Since the return of farmland to forest, the cropland area has gradually decreased, and water resource consumption has decreased. Furthermore, we found that a reduction in soil erosion often accompanies cropland conversion to forest according to the work of Li [61]. Therefore, we concluded that the reduction in water consumption and erosion conditions have increased in the reservoir area.

4. Discussion

4.1. Driving Forces for Changes in Lake Dynamics

According to Table 9, the total area of the six lakes increased from 153.23 km² to 158.77 km², with Lugu Lake’s area decreasing from 34.4% to 31.4% in 2000 and Shengzhong Reservoir’s area increasing from 22.87% to 26.9%. The following analysis focuses on the factors influencing changes in Lugu Lake and Shengzhong Reservoir.
Qiao et al. [62] found that the area changes of Lugu Lake from 1974 to 2018 were relatively stable, with changes occurring mainly in the Caohai wetlands. This is consistent with our findings, and we have monitored the area of Lugu Lake year by year to more clearly see the dynamic trend of Lugu Lake in the last 20 years. Wang et al. [63] also noted the degradation of wetlands around Lugu Lake. The wetlands were disturbed by poverty alleviation projects and tourism development. The source of water in Lugu Lake was mainly spring water and rainwater. In this study, we found that the rainfall in Lugu Lake has decreased in the last 20 years, which is consistent with the study of Wang et al. There is a significant negative correlation between the temperature increase and the area change during the rainy seasons. The rise in temperature and decrease in precipitation caused a substantial reduction in the area of Lugu Lake. Shengzhong Reservoir is the largest irrigation project in Southwest China, and the water resources are mainly used for agricultural irrigation. Figure 14 shows that the cropland area around the reservoir is decreasing, and water resource consumption is decreasing [64,65]. One of the main reasons for the shrinkage of lakes in wet areas is the severe soil erosion in the watershed due to natural or anthropogenic causes and a large amount of sediment siltation in the lakes. The forest area around the Shengzhong Reservoir has gradually increased in the last 20 years, making the erosion situation less. Thus, human activities are the main driving forces for the increase in the area of Shengzhong Reservoir. During the rainy season, the precipitation in Shengzhong Reservoir increases significantly, and the temperature decreases (Table 7). However, the correlation between climate change and the area change of Shengzhong Reservoir is low, indicating that climatic factors may affect the area change of Shengzhong Reservoir, but the effect is not significant.

4.2. Ecological Impacts

Wetlands are known as one of the three major ecosystems of the Earth, along with forests and oceans. They have the title “Kidney of the Earth”, which is vital in regulating climate and maintaining biological and genetic diversity [66]. Sichuan’s unique geomorphology and climate provide advantaged conditions for producing a wide variety of wetland types: Lugu Lake, Qionghai Lake and Ma Lake are natural wetlands [67]; Three Forks Lake, Luban Reservoir and Shengzhong Reservoir are artificial wetlands. The area of Lugu Lake, Qionghai Lake, and Luban Reservoir is shrinking, which will also impact the ecological environment. Using Qionghai Lake as an example, from the 1960s to the 1990s, disorderly human activities such as sea enclosures and pond reclamation severely damaged nearly two-thirds of the lakeside wetlands. Mudflats and native wetlands essentially vanished. Water birds and native species declined, and the ecological functions of Qionghai wetlands were gradually reduced [68]. At the same time, the water area was also significantly shrinking, and water quality fell from Class II to Class III [69,70]. Consequently, the government has implemented ecological management measures, including the comprehensive treatment project of intercepting sewage on the northwest shore of Qionghai Lake and the protective forest and coastal greening project [71]. These measures have significantly improved the water quality of the Qionghai wetlands and protected the lakeside wetlands, stabilizing the Qionghai Lake, although it is still decreasing.

4.3. Uncertainties and Limitations

Hu [72] extracted the area of four lakes, Zhuonai Lake, Kusai Lake, Heidinor Lake, and Salt Lake, from 1989 to 2018 using Landsat imagery but selected the area of the lakes for only one day of the year to represent the area for the whole year, resulting in inaccurate results as the surface of water bodies varies significantly due to change of seasons [73].
This study used the PIE-Engine remote sensing computational cloud platform to monitor the area changes of typical water bodies in Sichuan Province based on Landsat images year by year in dry and wet seasons. Long time series of continuous and sufficient remote sensing images may more precisely depict the dynamic changes of water bodies. Compared to previous studies’ results, the area of water bodies obtained for this paper showed good consistency. However, there are some uncertain aspects at the same time. Only Landsat images are used as the data source in this paper. There is still a lack of data due to the long revisit period of Landsat satellites and the large amount of clouds in the Sichuan basin. Because the missing data in this research are few, and the water extraction is divided into drought and wet seasons to decrease the impact of seasonal influences, this paper used Python to fill in the data using the linear regression filling method. In future work, we can combine Sentinel, GF series, and other data sources to improve it. In addition, the water segmentation thresholds in this paper are derived from several experiments, some errors and uncertainties may occur due to the manual visual inspection. In future research, we can consider reducing the uncertainty by using more human-independent methods such as deep learning. Only climatic conditions (rainfall and temperature) and human activities were chosen as driving factors in this paper. However, the dynamics of water body area are the consequence of various factors. Therefore, subsequent studies can integrate surface water temperature, groundwater, evaporation, and other factors for a more comprehensive analysis.

5. Conclusions

Using PIE-Engine Studio, information on water bodies in drought and wet seasons was extracted separately, and long-term trends in area and climate were analyzed using the Mann–Kendall method. Based on this, the drivers of area changes of different lake types (highland lakes and plains lakes) were investigated from both natural and anthropogenic aspects. The Qionghai Lake and Luban Reservoir show a decreasing trend during 2000–2020, and the area of Lugu Lake decreased significantly. Shengzhong Reservoir is showing a significant trend of increase, and the area of Ma Lake and Three Forks Lake is slowly rising. Climate change was verified as the main factor causing changes in Lugu Lake while human activities have little effect. The area changes of Qionghai Lake in the last 20 years fluctuated slightly, and there was poor correlation between them and climate. We consider that it was mainly human activities around the lake shoreline that caused minor changes in the lake surface area. The rainfall of Ma Lake increased significantly during the rainy seasons, and there was a significant positive correlation between it and its surface area (R = 0.55, p < 0.05). Thus, the climate is the primary driver of dynamic changes in Ma Lake. Human activities (for example, land use changes and irrigation water use) are the key factors influencing the changes in the area of the plain lakes, and climate has few influences on them. The results provide a basis for surface water resource management and large-scale, long-term surface water monitoring studies. The conclusion can be drawn that PIE-Engine Studio can be used for continuous time series and large-scale monitoring of water dynamics, with the advantages of multiple data sources, high efficiency, and low cost.

Supplementary Materials

The following supporting information can be downloaded at: https://www.mdpi.com/article/10.3390/w14182816/s1, Table S1: The area of the selected lakes for the last 20 years; Figure S1: Information on the water bodies of Lugu Lake in the dry season from 2000 to 2020; Figure S2: Information on the water bodies of Lugu Lake in the rainy season from 2000 to 2020; Figure S3: Information on the water bodies of Qionghai Lake in the dry season from 2000 to 2020; Figure S4: Information on the water bodies of Qionghai Lake in the rainy season from 2000 to 2020; Figure S5: Information on the water bodies of Ma Lake in the dry season from 2000 to 2020; Figure S6: Information on the water bodies of Ma Lake in the rainy season from 2000 to 2020; Figure S7: Information on the water bodies of Three Forks Lake in the dry season from 2000 to 2020; Figure S8: Information on the water bodies of Three Forks Lake in the rainy season from 2000 to 2020; Figure S9: Information on the water bodies of Luban Reservoir in the dry season from 2000 to 2020; Figure S10: Information on the water bodies of Luban Reservoir in the rainy season from 2000 to 2020; Figure S11: Information on the water bodies of Shengzhong Reservoir in the dry season from 2000 to 2020; Figure S12: Information on the water bodies of Shengzhong Reservoir in the rainy season from 2000 to 2020; Figure S13: Land cover distribution around Lugu Lake from 2000–2019; Figure S14: Land cover distribution around Qionghai Lake from 2000–2019; Figure S15: Land cover distribution around Ma Lake from 2000–2019; Figure S16: Land cover distribution around Three Forks Lake from 2000–2019; Figure S17: Land cover distribution around Luban Reservoir from 2000–2019; Figure S18: Land cover distribution around Shengzhong Reservoir from 2000–2019.

Author Contributions

Conceptualization, X.D. and Y.L.; data curation, G.Q., Y.S. and D.L.; formal analysis, W.L. (Weile Li), J.R. and S.L.; methodology, W.L. (Wenxin Liu) and Y.W.; writing—original draft, W.L. (Wenxin Liu) and X.D.; writing—review & editing, W.L. (Wenxin Liu), X.D. and M.W. All authors have read and agreed to the published version of the manuscript.

Funding

This research was funded by the National Key Research and Development Program of China, grant No. 2021YFC3000401; the Research Center for Human Geography of Tibetan Plateau and Its Eastern Slope (Chengdu University of Technology), grant No. RWDL2021-ZD003; Key Research Bases of Humanities and Social Sciences in Higher Education in Sichuan Province, Sichuan Center for Disaster Economic Research, grant No. ZHJJ2021-ZD001; the National Key Research and Development Program of China under Grant 2017YFB0503601; Industry-school Cooperative Education Program of Ministry of Education, grant (202101162001,202102245035).

Conflicts of Interest

The authors declare no conflict of interest.

References

  1. Yang, X.K.; Lu, X.X. Drastic change in China’s lakes and reservoirs over the past decades. Sci. Rep. 2014, 4, 10. [Google Scholar] [CrossRef] [PubMed]
  2. Moser, K.A.; Baron, J.S.; Brahney, J.; Oleksy, I.A.; Saros, J.E.; Hundey, E.J.; Sadro, S.A.; Kopacek, J.; Sommaruga, R.; Kainz, M.J.; et al. Mountain lakes: Eyes on global environmental change. Glob. Planet. Change 2019, 178, 77–95. [Google Scholar] [CrossRef]
  3. Wang, J.; Ding, J.; Li, G.; Liang, J.; Yu, D.; Aishan, T.; Zhang, F.; Yang, J.; Abuldmiti, A.; Liu, J. Dynamic detection of water surface area of Ebinur Lake using multi-source satellite data (Landsat and Sentinel-1A) and its responses to changing environment. Catena 2019, 177, 189–201. [Google Scholar] [CrossRef]
  4. Zhang, G.Q.; Duan, S.Q. Lakes as sentinels of climate change on the Tibetan Plateau. All Earth 2021, 33, 161–165. [Google Scholar] [CrossRef]
  5. Yang, Z.C.; Dai, X.A.; Wang, Z.K.; Gao, X.J.; Qu, G.; Li, W.L.; Li, J.Z.; Lu, H.; Wang, Y.L. The dynamics of Paiku Co lake area in response to climate change. J. Water Clim. Change 2022, 13, 2725–2746. [Google Scholar] [CrossRef]
  6. Zhang, G.; Yao, T.; Piao, S.; Bolch, T.; Xie, H.; Chen, D.; Gao, Y.; O’Reilly, C.M.; Shum, C.K.; Yang, K.; et al. Extensive and drastically different alpine lake changes on Asia’s high plateaus during the past four decades. Geophys. Res. Lett. 2017, 44, 252–260. [Google Scholar] [CrossRef]
  7. Hanson, Z.J.; Zwart, J.A.; Jones, S.E.; Hamlet, A.F.; Bolster, D. Projected changes of regional lake hydrologic characteristics in response to 21st century climate change. Inland Waters 2021, 11, 335–350. [Google Scholar] [CrossRef]
  8. Li, W.L.; Zhao, B.; Xu, Q.; Scaringi, G.; Lu, H.Y.; Huang, R.Q. More frequent glacier-rock avalanches in Sedongpu gully are blocking the Yarlung Zangbo River in eastern Tibet. Landslides 2022, 19, 589–601. [Google Scholar] [CrossRef]
  9. Zhu, C.; Li, J.; Zhang, X.; Luo, J. BostenWater Resource Dynamic Detection and Feature Analysis in Recent 40 Years by Remote Sensing. J. Nat. Resour. 2015, 30, 106–114. [Google Scholar]
  10. Liu, W.; Xie, C.; Zhao, L.; Li, R.; Liu, G.; Wang, W.; Liu, H.; Wu, T.; Yang, G.; Zhang, Y.; et al. Rapid expansion of lakes in the endorheic basin on the Qinghai-Tibet Plateau since 2000 and its potential drivers. Catena 2021, 197, 104942. [Google Scholar] [CrossRef]
  11. Zhou, L.; Zhu, Y.; Du, M.; Wang, S.; He, C.; Luo, T.; Wu, J.; Zhang, J.; Yang, K. The Long-Time Variation of Lake in Typical Desert Area and Its Human and Climate Change Causes: A Case Study of the Hongjian Nur. Ieee J. Sel. Top. Appl. Earth Obs. Remote Sens. 2021, 14, 416–425. [Google Scholar] [CrossRef]
  12. Yang, L.; Wang, L.; Yu, D.; Yao, R.; Li, C.A.; He, Q.; Wang, S.; Wang, L. Four decades of wetland changes in Dongting Lake using Landsat observations during 1978–2018. J. Hydrol. 2020, 587, 124954. [Google Scholar] [CrossRef]
  13. Pekel, J.F.; Cottam, A.; Gorelick, N.; Belward, A.S. High-resolution mapping of global surface water and its long-term changes. Nature 2016, 540, 418–422. [Google Scholar] [CrossRef]
  14. Cao, H.; Han, L.; Liu, Z.; Li, L. Monitoring and driving force analysis of spatial and temporal change of water area of Hongjiannao Lake from 1973 to 2019. Ecol. Inform. 2021, 61, 101230. [Google Scholar] [CrossRef]
  15. Mi, J.; Zhang, M.; Zhu, Z.C.; Vuik, V.; Wen, J.H.; Gao, H.K.; Bouma, T.J. Morphological wave attenuation of the nature-based flood defense: A case study from Chongming Dongtan Shoal, China. Sci. Total Environ. 2022, 831, 154813. [Google Scholar] [CrossRef]
  16. Zhang, M.; Dai, Z.; Bouma, T.J.; Bricker, J.; Townend, I.; Wen, J.; Zhao, T.; Cai, H. Tidal-flat reclamation aggravates potential risk from storm impacts. Coast. Eng. 2021, 166, 103868. [Google Scholar] [CrossRef]
  17. Khazaei, B.; Khatami, S.; Alemohammad, S.H.; Rashidi, L.; Wu, C.S.; Madani, K.; Kalantari, Z.; Destouni, G.; Aghakouchak, A. Climatic or regionally induced by humans? Tracing hydro-climatic and land-use changes to better understand the Lake Urmia tragedy. J. Hydrol. 2019, 569, 203–217. [Google Scholar] [CrossRef]
  18. Tao, S.; Fang, J.; Ma, S.; Cai, Q.; Xiong, X.; Tian, D.; Zhao, X.; Fang, L.; Zhang, H.; Zhu, J.; et al. Changes in China’s lakes: Climate and human impacts. Natl. Sci. Rev. 2020, 7, 132–140. [Google Scholar] [CrossRef]
  19. Liu, Y.; Ye, Z.; Jia, Q.; Mamat, A.; Guan, H. Multi-Source Remote Sensing Data for Lake Change Detection in Xinjiang, China. Atmosphere 2022, 13, 713. [Google Scholar] [CrossRef]
  20. Xiao, Q.; Yang, K.; Hong, L. Remote sensing monitoring and temporal-spatial analysis of surface water body area changes of lakes on the Yunnan-Guizhou Plateau over the past 30 years. J. Lake Sci. 2018, 30, 1083–1096. [Google Scholar]
  21. Fraker, M.E.; Sinclair, J.S.; Frank, K.T.; Hood, J.M.; Ludsin, S.A. Temporal scope influences ecosystem driver-response relationships: A case study of Lake Erie with implications for ecosystem-based management. Sci. Total Environ. 2022, 813, 152473. [Google Scholar] [CrossRef]
  22. Huang, W.; Duan, W.; Nover, D.; Sahu, N.; Chen, Y. An integrated assessment of surface water dynamics in the Irtysh River Basin during 1990–2019 and exploratory factor analyses. J. Hydrol. 2021, 593, 125905. [Google Scholar] [CrossRef]
  23. Fuentealba, M.; Bahamondez, C.; Sarricolea, P.; Meseguer-Ruiz, O.; Latorre, C. The 2010–2020 ‘megadrought’ drives reduction in lake surface area in the Andes of central Chile (32 degrees–36 degrees S). J. Hydrol.-Reg. Stud. 2021, 38, 100952. [Google Scholar] [CrossRef]
  24. Ji, M.; Tang, J.; Gao, X.; Yang, Y.; Wu, Z. Analysis of Spatiotemporal Changes and Driving Factors of Poyang Lake Area Based on Google Earth Engine. J. China Hydrol. 2021, 41, 40–47. [Google Scholar]
  25. Liao, W.; Chen, Y.; Zhao, X.; Wen, X. Analysis of lake and lake shoreline evolution in Hubei province in recent 30 years based on Google Earth Engine. Hubei Agric. Sci. 2021, 60, 46–54, 59. [Google Scholar] [CrossRef]
  26. Liu, Y.; Tian, T.; Zeng, P.; Zhang, X.; Che, Y. Surface water change characteristics of Taihu Lake from 1984–2018 based on Google Earth Engine. Chin. J. Appl. Ecol. 2020, 31, 3163–3172. [Google Scholar] [CrossRef]
  27. Lu, T.; Shao, C.; Ren, X.; Ma, H.; Wang, L. Spatio-temporal Changes of Water Area in Songtao Reservoir from 1990 to 2019 Based on Google Earth Engine. Sci. Technol. Eng. 2021, 21, 11472–11479. [Google Scholar]
  28. Weekley, D.; Li, X. Tracking Multidecadal Lake Water Dynamics with Landsat Imagery and Topography/Bathymetry. Water Resour. Res. 2019, 55, 8350–8367. [Google Scholar] [CrossRef]
  29. Zhang, W.; Zhang, Z.; Wei, X.; Hu, Y.; Li, Y.; Meng, L. Long-term spatiotemporal changes of surface water and its influencing factors in the mainstream of Han River, China. J. Hydrol.-Reg. Stud. 2022, 40, 101009. [Google Scholar] [CrossRef]
  30. Gorelick, N.; Hancher, M.; Dixon, M.; Ilyushchenko, S.; Thau, D.; Moore, R. Google Earth Engine: Planetary-scale geospatial analysis for everyone. Remote Sens. Environ. 2017, 202, 18–27. [Google Scholar] [CrossRef]
  31. Cheng, W.; Qian, X.; Li, S.; Ma, H.; Liu, D.; Liu, F.; Liang, J.; Hu, J. Research and application of PIE-Engine Studio for spatiotemporal remote sensing cloud computing platform. Natl. Remote Sens. Bull. 2022, 26, 335–347. [Google Scholar]
  32. Sichuan Provincial Water Resources Department. Available online: http://slt.sc.gov.cn/scsslt/ (accessed on 22 July 2022).
  33. PIE-Engine Remote Sensing and Geographic Information Cloud Service Platform. Available online: https://engine.piesat.cn/dataset-list/ (accessed on 15 July 2022).
  34. Global Surface Water Explorer. Available online: http://global-surface-water.appspot.com/ (accessed on 24 July 2022).
  35. Dai, X.A.; Yang, X.P.; Wang, M.L.; Gao, Y.; Liu, S.H.; Zhang, J.M. The Dynamic Change of Bosten Lake Area in Response to Climate in the Past 30 Years. Water 2020, 12, 4. [Google Scholar] [CrossRef]
  36. Yan, H.; Li, Q.; Sun, C.; Yuan, Y.; Li, D. Criterion for Determining the Onset and End of the Rainy Season in Southwest China. Chin. J. Atmos. Sci. 2013, 37, 1111–1128. [Google Scholar]
  37. Jiazila, B.; Li, W.; Sun, C.; Zuo, J.; Zhang, R.; Liu, J. Characteristics of Wet and Dry Seasons in Southwest China During 1961–2014. Progress. Inquisitiones Mutat. Clim. 2017, 13, 103–116. [Google Scholar]
  38. Nie, X.; Liu, R.; Du, S. A Kind of Water Extraction Model Based on Empirical Normalized Difference Water Index. Beijing Surv. Mapp. 2017, 5, 41–45. [Google Scholar] [CrossRef]
  39. McFeeters, S.K. The use of the normalized difference water index (NDWI) in the delineation of open water features. Int. J. Remote Sens. 1996, 17, 1425–1432. [Google Scholar] [CrossRef]
  40. Xu, H. A Study on Information Extraction of Water Body with the Modified Normalized Difference Water Index (MNDWI). J. Remote Sens. 2005, 5, 589–595. [Google Scholar]
  41. Pci, Y.A.N.; Youjing, Z.; Yuan, Z. A Study on Information Extraction of Water Enhanced Water Index (EWI) and GIS System in Semi-arid Regions with the Based Noise Remove Techniques. Remote Sens. Inf. 2007, 6, 62–67. [Google Scholar]
  42. Zhang, Q.; Wu, B.; Yang, Y. Extraction of Open Water in Rugged Area with A Novel Slope Adjusted Water Index. Remote Sens. Inf. 2018, 33, 98–107. [Google Scholar]
  43. Cao, R.; Li, C.; Liu, L.; Wang, J.; Yan, G. Extracting Miyun reservoir’s water area and monitoring its change based on a revised normalized different water index. Sci. Surv. Mapp. 2008, 2, 158–160. [Google Scholar]
  44. Feng, D. Study on information extraction of water body with a new water index (NWI). Sci. Surv. Mapp. 2009, 34, 155–157. [Google Scholar]
  45. Sen, P.K. Estimates of the Regression Coefficient Based on Kendall’s Tau. J. Am. Stat. Assoc. 1968, 63, 1379–1389. [Google Scholar] [CrossRef]
  46. Mann, H.B. Nonparametric Tests Against Trend. Econometrica 1945, 13, 245. [Google Scholar] [CrossRef]
  47. Kendall, M.G. Rank Correlation Methods. Br. J. Psychol. 1990, 25, 86–91. [Google Scholar] [CrossRef]
  48. Asfaw, A.; Simane, B.; Hassen, A.; Bantider, A. Variability and time series trend analysis of rainfall and temperature in northcentral Ethiopia: A case study in Woleka sub-basin. Weather Clim. Extrem. 2018, 19, 29–41. [Google Scholar] [CrossRef]
  49. Dai, X.A.; Fan, W.J.; Shan, Y.F.; Gao, Y.; Liu, C.; Nie, R.H.; Zhang, D.H.; Li, W.L.; Zhang, L.F.; Sun, X.J.; et al. LAI-Based Phenological Changes and Climate Sensitivity Analysis in the Three-River Headwaters Region. Remote Sens. 2022, 14, 3748. [Google Scholar] [CrossRef]
  50. Hazarika, J.; Goswami, K. Non-parametric Methods in the Analysis of Hydroclimatic Variables. Thail. Statist. 2021, 19, 420–436. [Google Scholar]
  51. Zhang, Z.; Chang, J.; Xu, C.-Y.; Zhou, Y.; Wu, Y.; Chen, X.; Jiang, S.; Duan, Z. The response of lake area and vegetation cover variations to climate change over the Qinghai-Tibetan Plateau during the past 30 years. Sci. Total Environ. 2018, 635, 443–451. [Google Scholar] [CrossRef] [PubMed]
  52. Li, Y. Study on the Characteristics of Lake Morphological Change and Sustainable Tourism Development of Horse Lake in Leibo County. Master’s Thesis, Chengdu University of Technology, Chengdu, China, 2018. [Google Scholar]
  53. Deng, C. Study on the Change of Habitat Quality of Qionghai Wetland under the Influence of Human Activities. Master’s Thesis, Chengdu University of Technology, Chengdu, China, 2019. [Google Scholar]
  54. Li, Y.; Xu, H.; Liu, D. Features of the extremely severe drought in the east of Southwest China and anomalies of atmospheric circulation in summer 2006. Acta Meteorol. Sin. 2009, 67, 122–132. [Google Scholar] [CrossRef]
  55. Zhou, Q.; Kang, L.; Jiang, X.; Liu, Y. Relationship Between Heavy Rainfall and Altitude in Mountainous Areas of Sichuan Basin. Meteorol. Mon. 2019, 45, 811–819. [Google Scholar]
  56. Zheng, H.Y.; Jin, W.C.; Lee, K.S.; Oh, S.N. A Study on Air Temperature-reducing Effects by Irrigation Reservoir. J. Korea Soc. Environ. Restor. Technol. 2010, 13, 32–39. [Google Scholar]
  57. Bai, J.; Chen, X.; Li, J.; Yang, L.; Fang, H. Changes in the area of inland lakes in arid regions of central Asia during the past 30 years. Environ. Monit. Assess. 2011, 178, 247–256. [Google Scholar] [CrossRef] [PubMed]
  58. He, Q.; Dai, X.A.; Chen, S.Q. Assessing the effects of vegetation and precipitation on soil erosion in the Three-River Headwaters Region of the Qinghai-Tibet Plateau, China. J. Arid Land 2020, 12, 865–886. [Google Scholar] [CrossRef]
  59. Chen, Y. Study on Lakeside Land Problems and Its Influencing Factors in Sancha Lake, City of Jianyang. Master’s Thesis, Sichuan Agricultural University, Chengdu, China, 2016. [Google Scholar]
  60. Yang, R. Research on Countermeasure of Eco-environmental protection and Pollution Prevention of Shengzhong Reservoir. Sichuan Environ. 2010, 29, 34–42. [Google Scholar] [CrossRef]
  61. Li, H.; Zhu, H.; Liang, C.; Wei, X.; Yao, Y. Soil erosion significantly decreases aggregate-associated OC and N in agricultural soils of Northeast China. Agric. Ecosyst. Environ. 2022, 323, 107677. [Google Scholar] [CrossRef]
  62. Qiao, C.; Sun, J. Remote Sensing Monitoring of Water Body Area Changes in Lugu Lake in Recent 45 Years. J. Anhui Agric. Sci. 2020, 48, 95–99. [Google Scholar]
  63. Wang, H.; Kong, X.; Luo, J.; Li, P.; Xie, T.; Yi, X.; Wang, F.; Xiao, J. A Novel Approach for Monitoring the Ecoenvironment of Alpine Wetlands using Big Geospatial Data and Cloud Computing. Adv. Meteorol. 2022, 2022, 7451173. [Google Scholar] [CrossRef]
  64. Elias, E.; Seifu, W.; Tesfaye, B.; Girmay, W. Impact of land use/cover changes on lake ecosystem of Ethiopia central rift valley. Cogent Food Agric. 2019, 5, 1595876. [Google Scholar] [CrossRef]
  65. Yao, Y.Z.; Tian, H.Q.; Kalin, L.; Pan, S.F.; Friedrichs, M.A.M.; Wang, J.; Li, Y. Contrasting stream water temperature responses to global change in the Mid-Atlantic Region of the United States: A process-based modeling study. J. Hydrol. 2021, 601, 126633. [Google Scholar] [CrossRef]
  66. Sun, R.; Yao, P.; Wang, W.; Yue, B.; Liu, G. Assessment of Wetland Ecosystem Health in the Yangtze and Amazon River Basins. Isprs Int. J. Geo-Inf. 2017, 6, 81. [Google Scholar] [CrossRef]
  67. Duan, Z.; Gao, H.; Tang, R.; Song, B. Analysis and Protection Countermeasures of Wetland Resources in Sichuan Province. J. Anhui Agric. Sci. 2015, 43, 129–131. [Google Scholar] [CrossRef]
  68. Zelelew, S.A.; Abebe, W.B.; Amsalu, T. Land-use cover change impact on Cranes nesting space in the Lake Tana Biosphere Reserve area, Blue Nile Basin. Wetl. Ecol. Manag. 2021, 29, 495–505. [Google Scholar] [CrossRef]
  69. Ran, J.; Xiang, R.; Li, J.; Xiao, K.; Zheng, B. Spatiotemporal Variations in the Water Quality of Qionghai Lake, Yunnan-Guizhou Plateau, China. Water 2022, 14, 2451. [Google Scholar] [CrossRef]
  70. Zheng, L.; An, Z.; Chen, X.; Liu, H. Changes in Water Environment in Erhai Lake and Its Influencing Factors. Water 2021, 13, 1362. [Google Scholar] [CrossRef]
  71. Liu, Y.; Xiong, J.; Huang, C. Research on Protective Development of Tourism Resource of Qionghai Lake Wetland. J. Anhui Agric. Sci. 2014, 42, 12160–12161, 12295. [Google Scholar] [CrossRef]
  72. Hu, Z.; Tan, D.; Wen, X.; Chen, B.; Shen, D. Investigation of dynamic lake changes in Zhuonai Lake-Salt Lake Basin, Hoh Xil, using remote sensing images in response to climate change (1989–2018). J. Water Clim. Change 2021, 12, 2199–2216. [Google Scholar] [CrossRef]
  73. Tulbure, M.G.; Broich, M.; Stehman, S.V.; Kommareddy, A. Surface water extent dynamics from three decades of seasonally continuous Landsat time series at subcontinental scale in a semi-arid region. Remote Sens. Environ. 2016, 178, 142–157. [Google Scholar] [CrossRef]
Figure 1. Locations of the lakes in the study area.
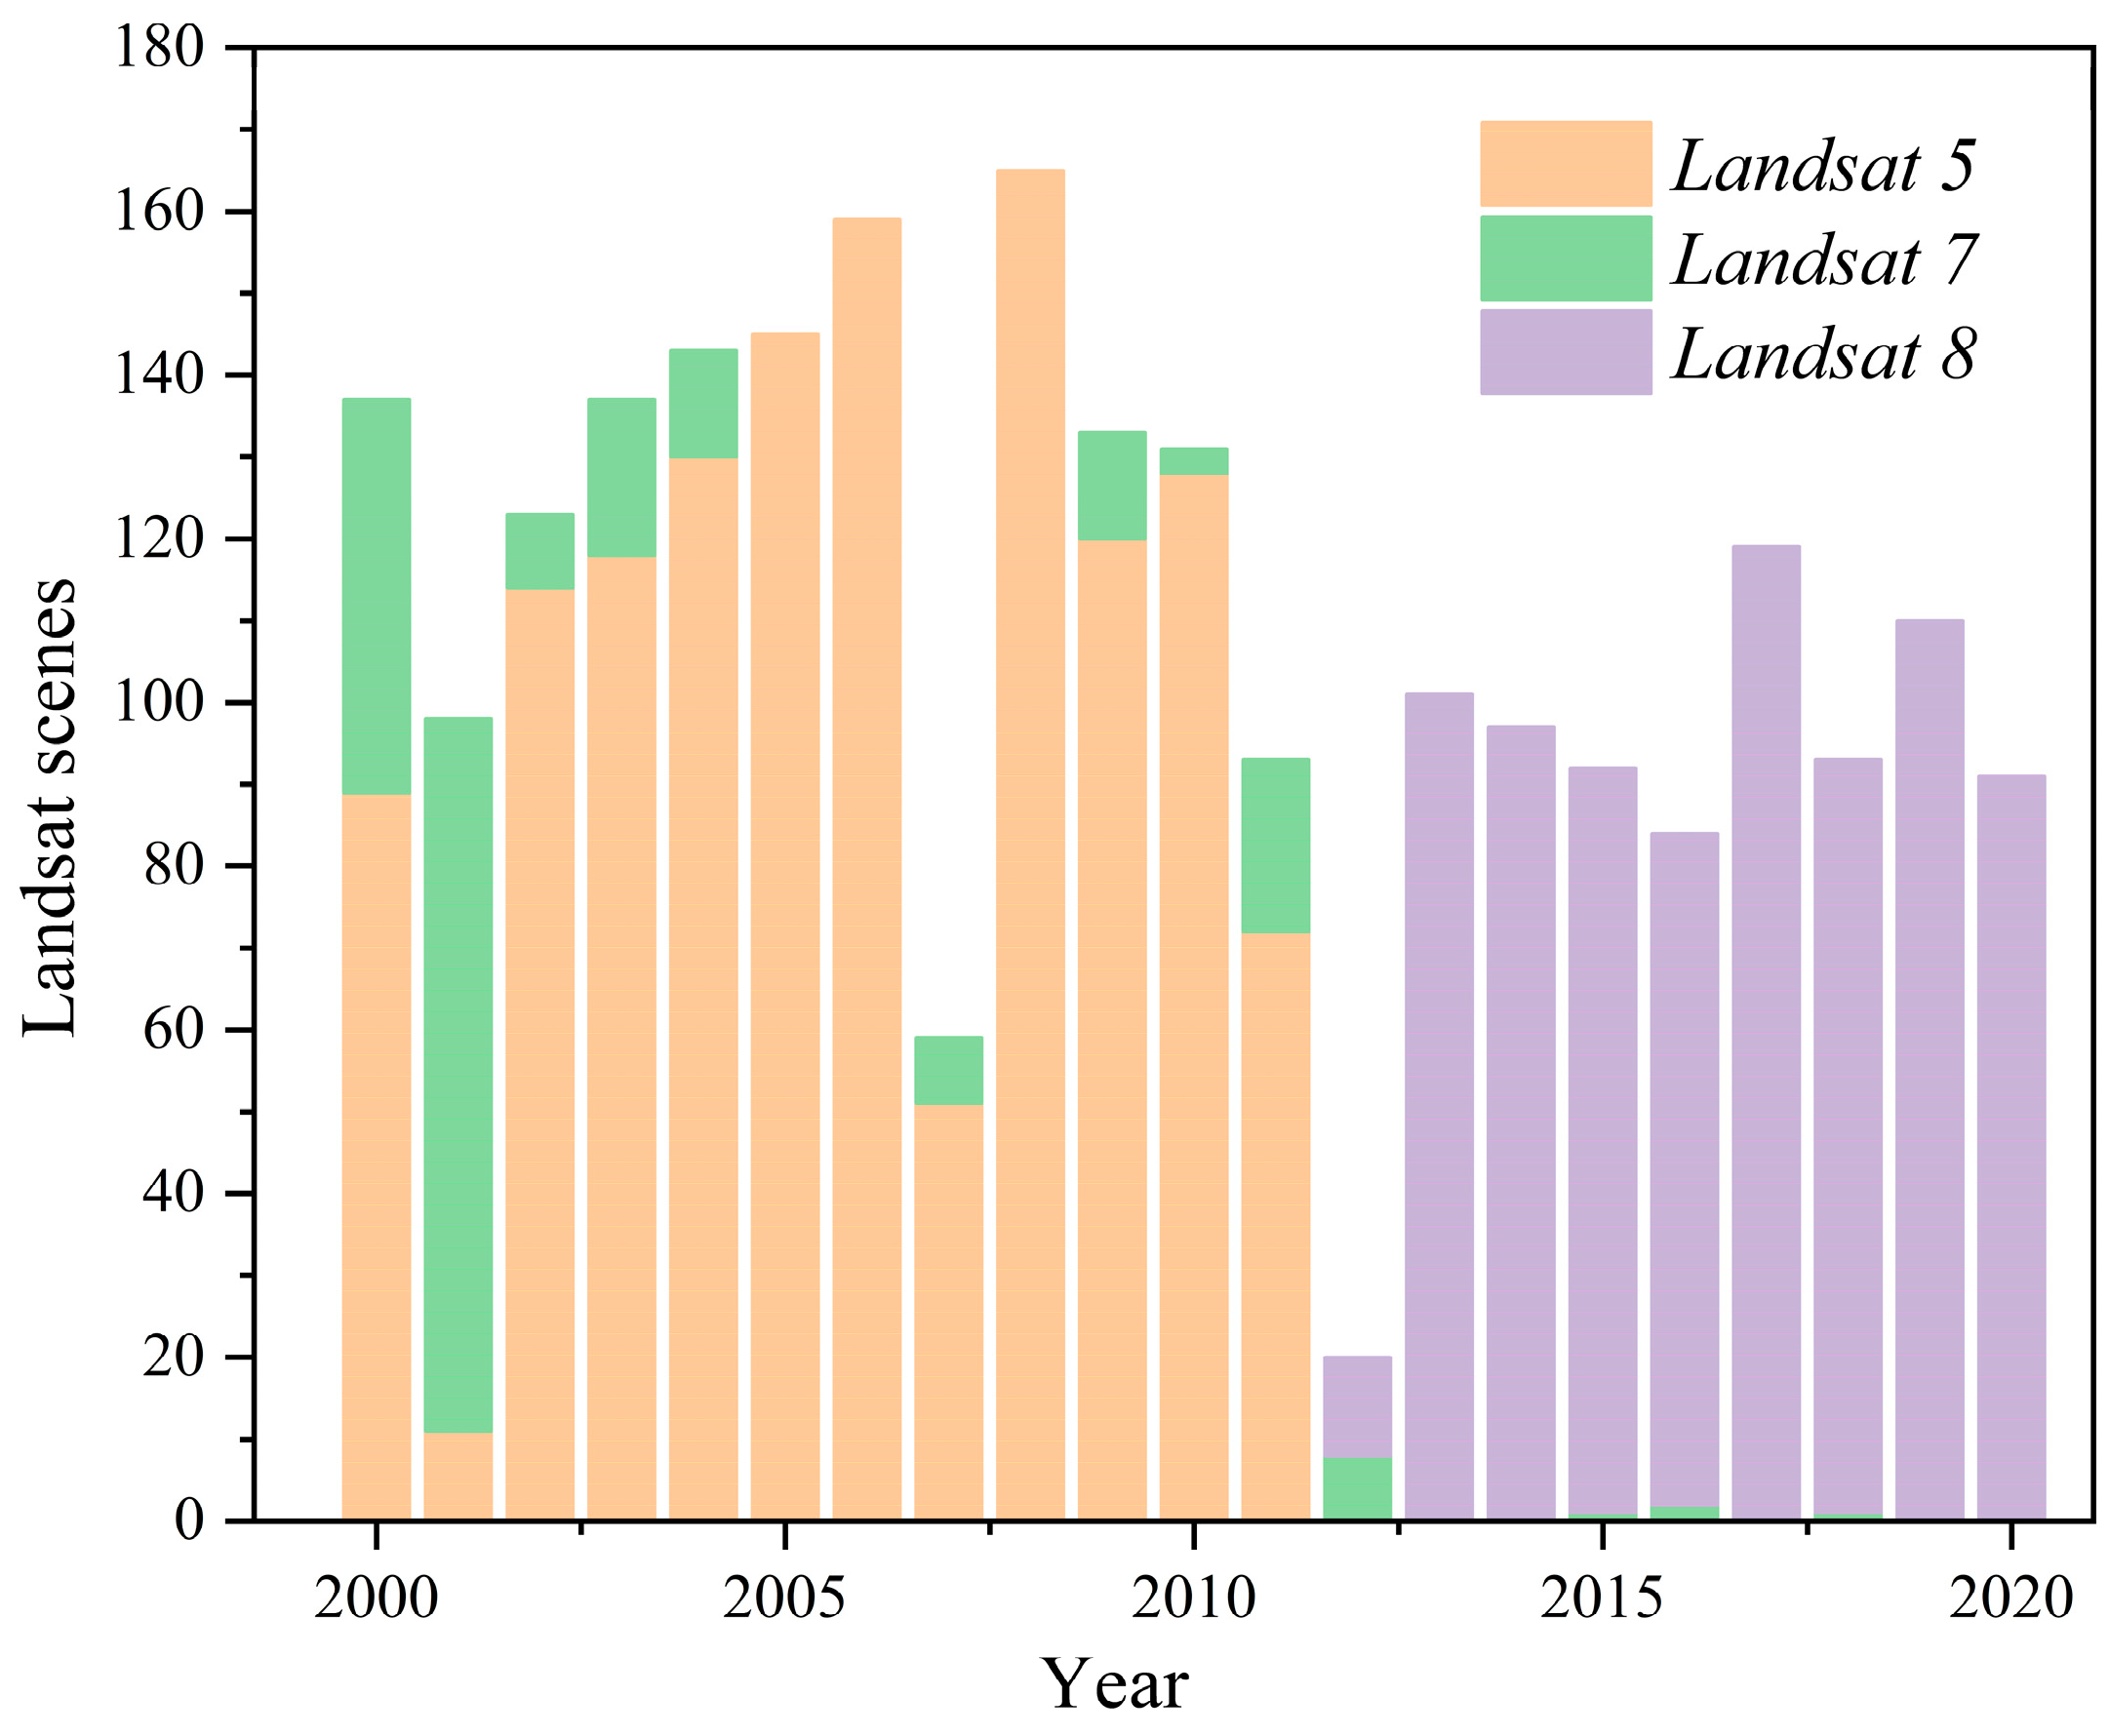
Water 14 02816 g001
Figure 2. The number of Landsat images used.
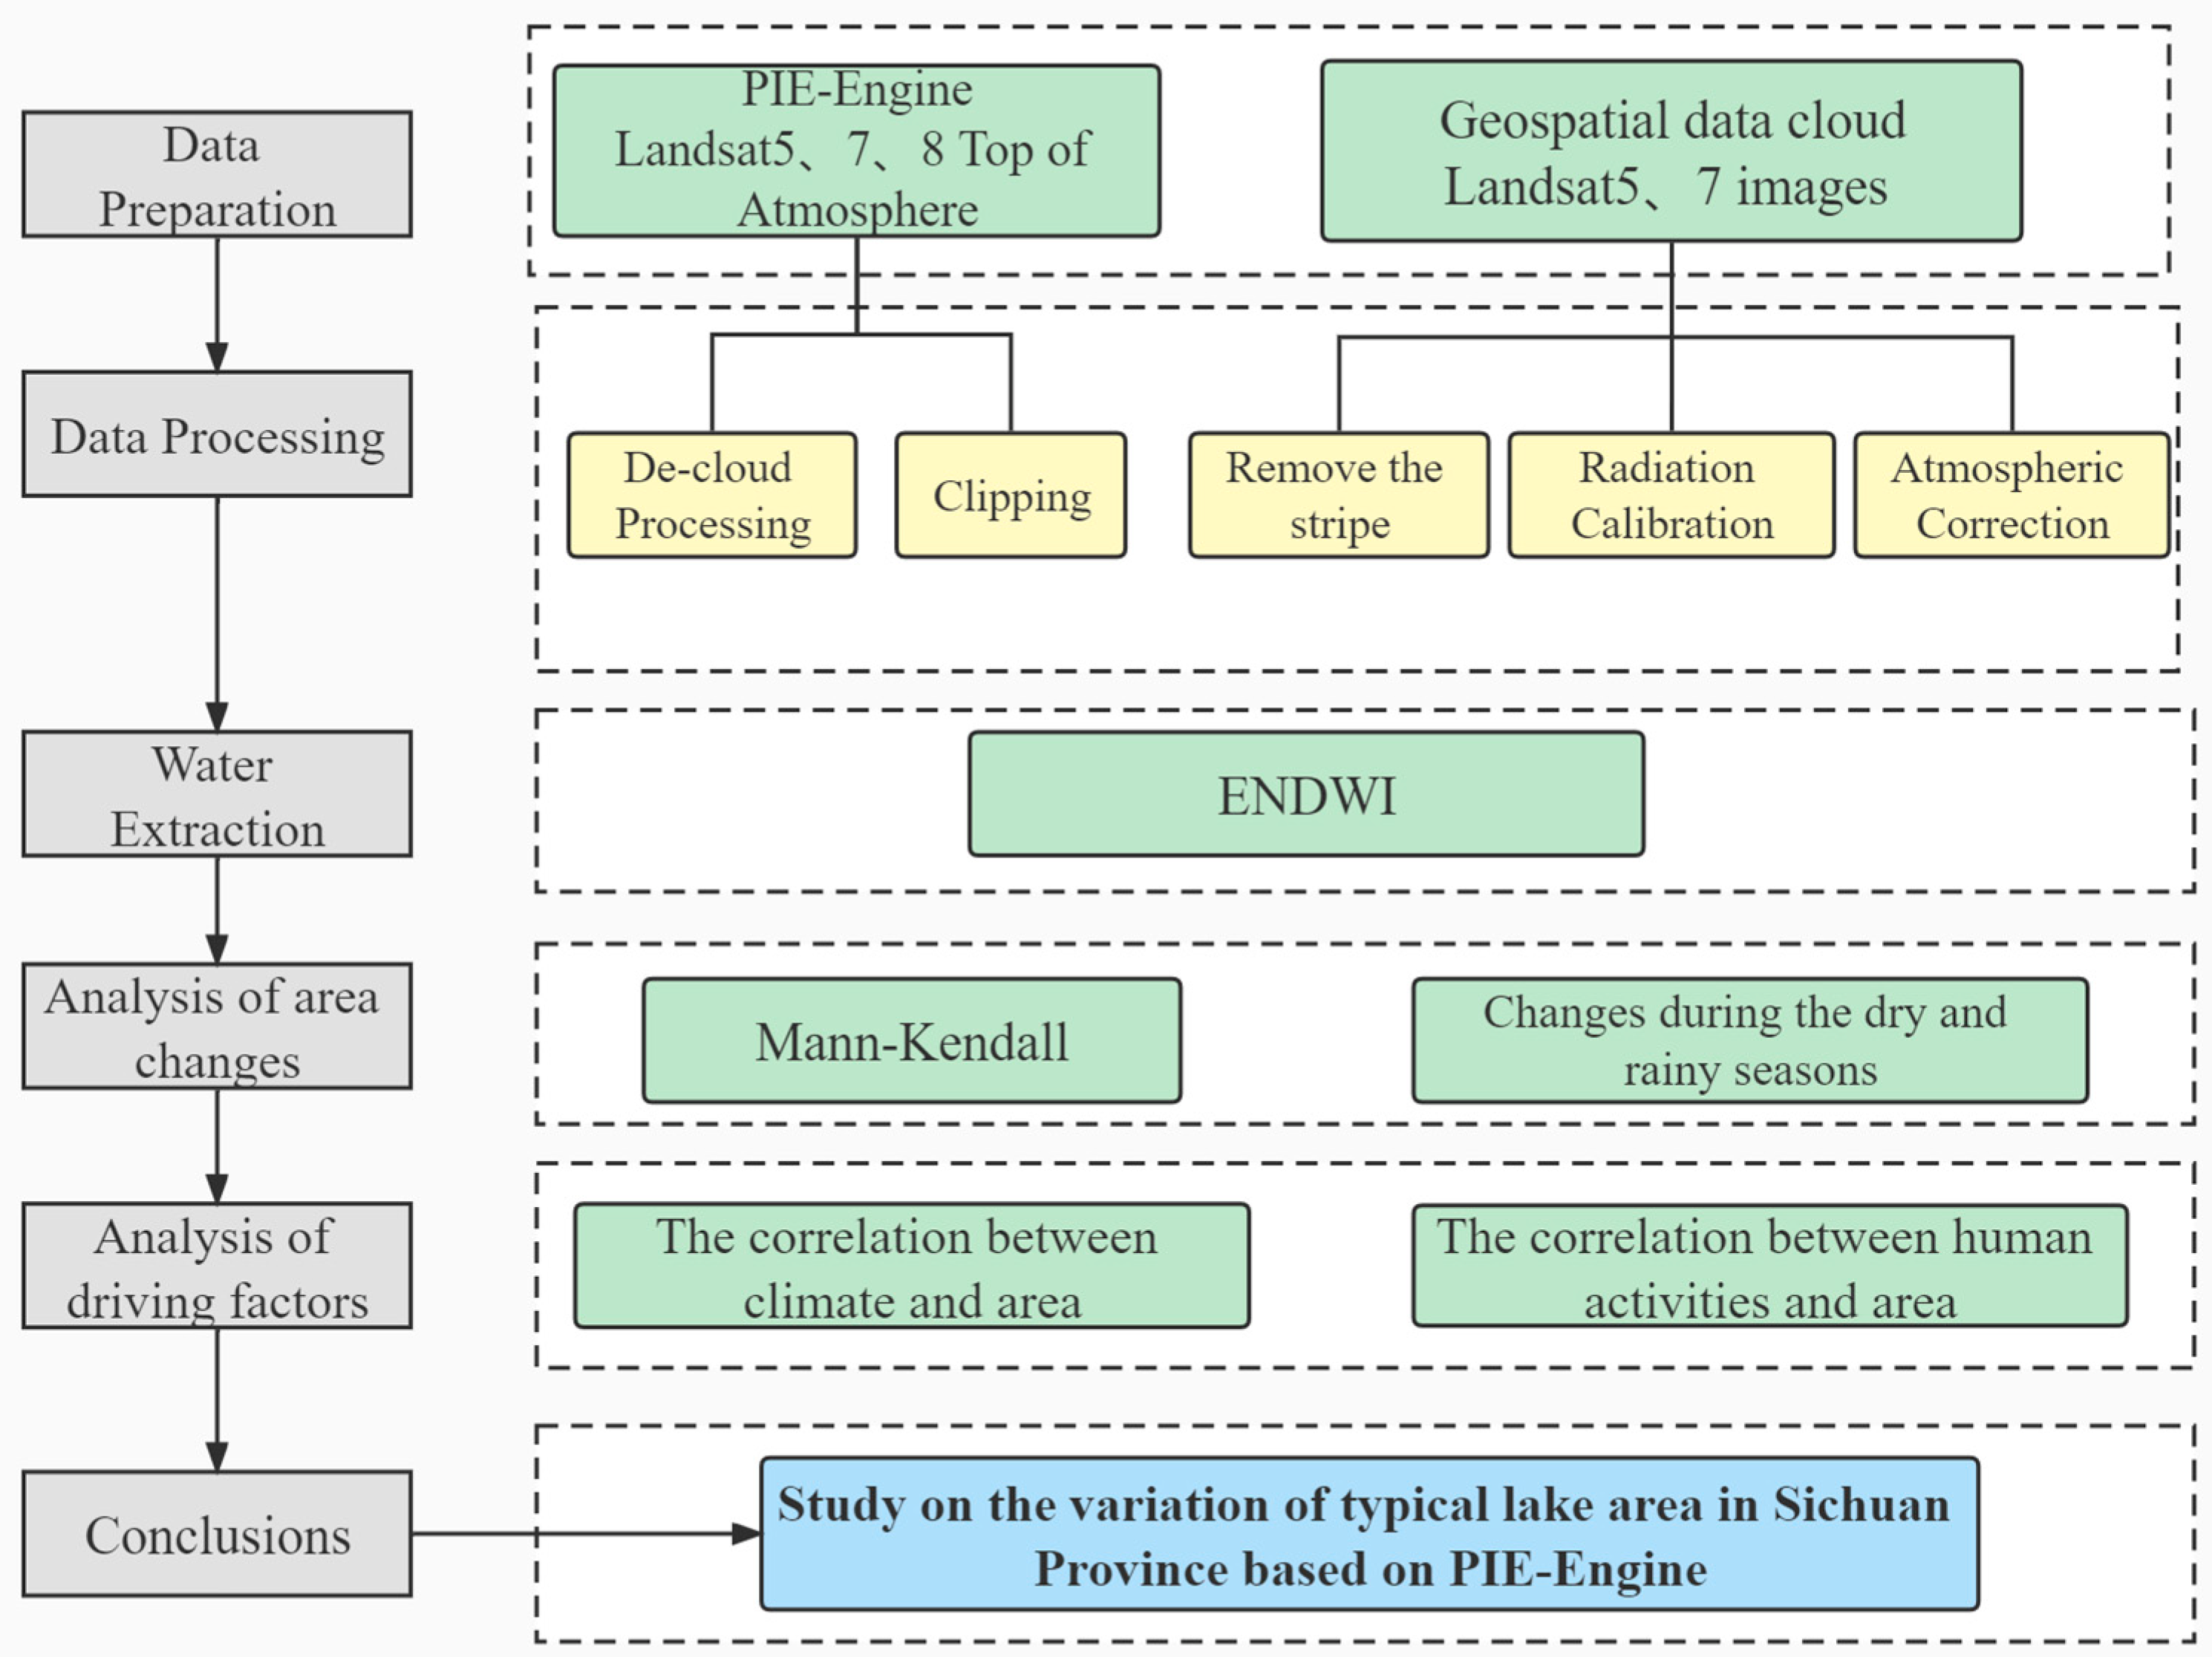
Water 14 02816 g002
Figure 3. Schematic diagram of the study.
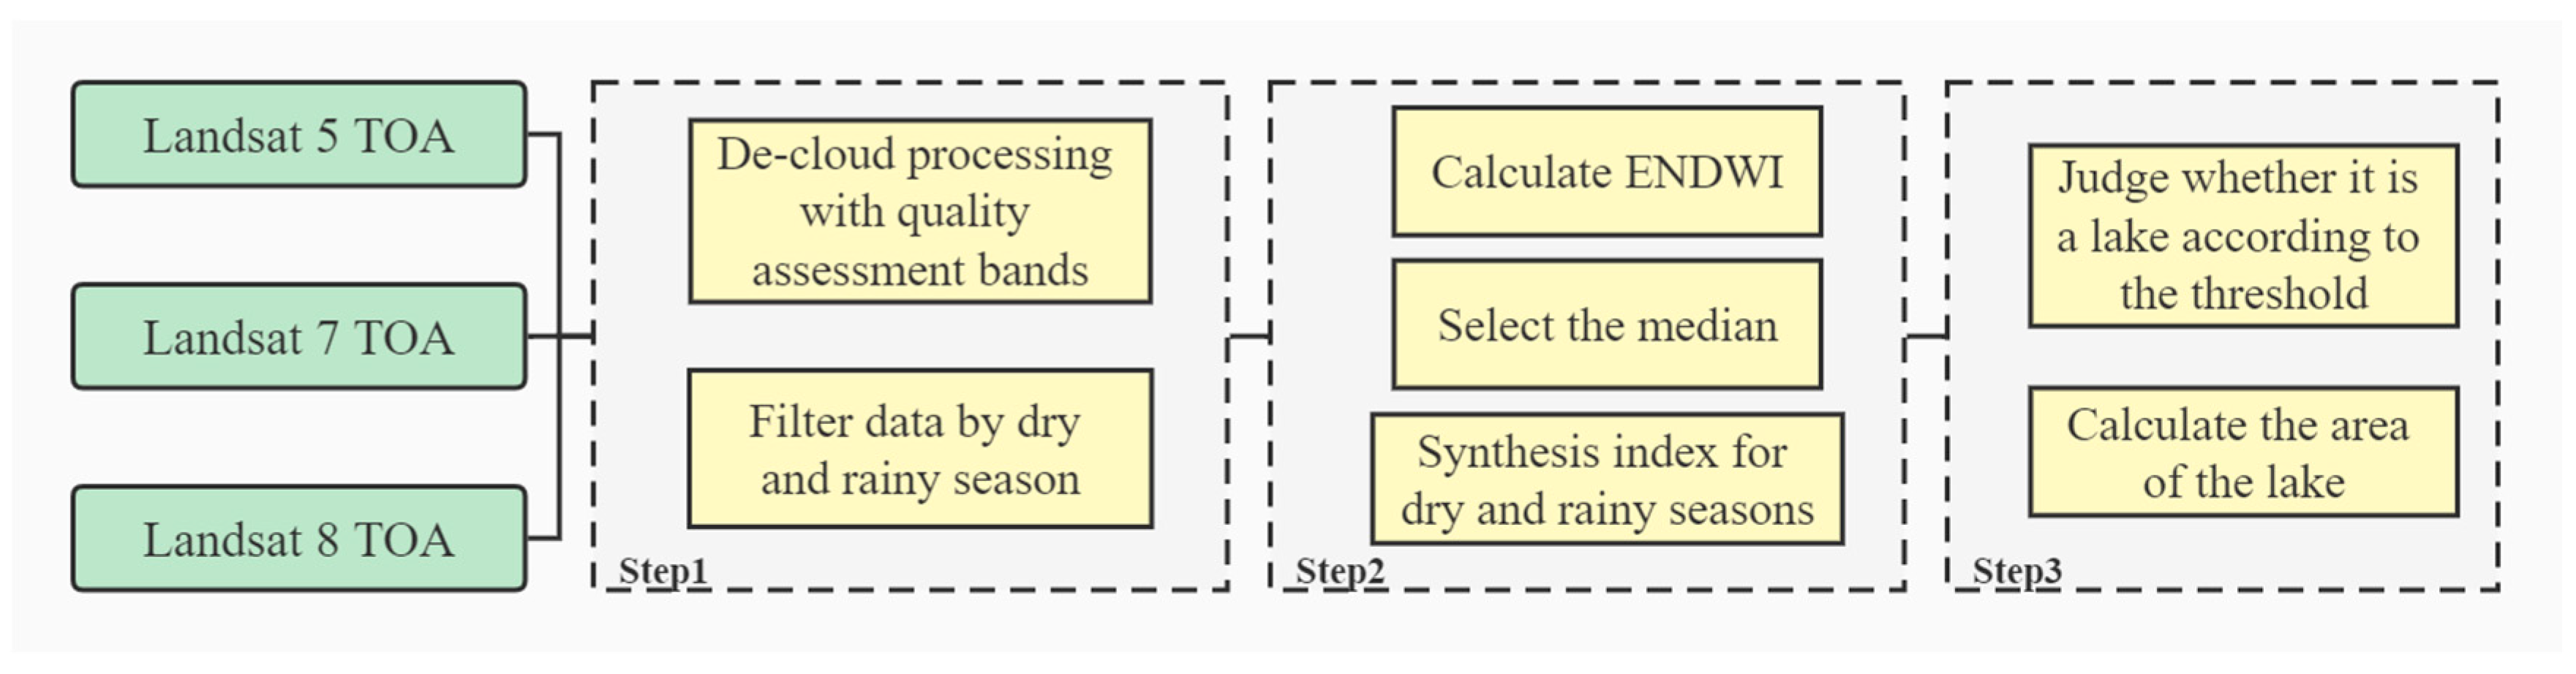
Water 14 02816 g003
Figure 4. The workflow of the water body area calculation.
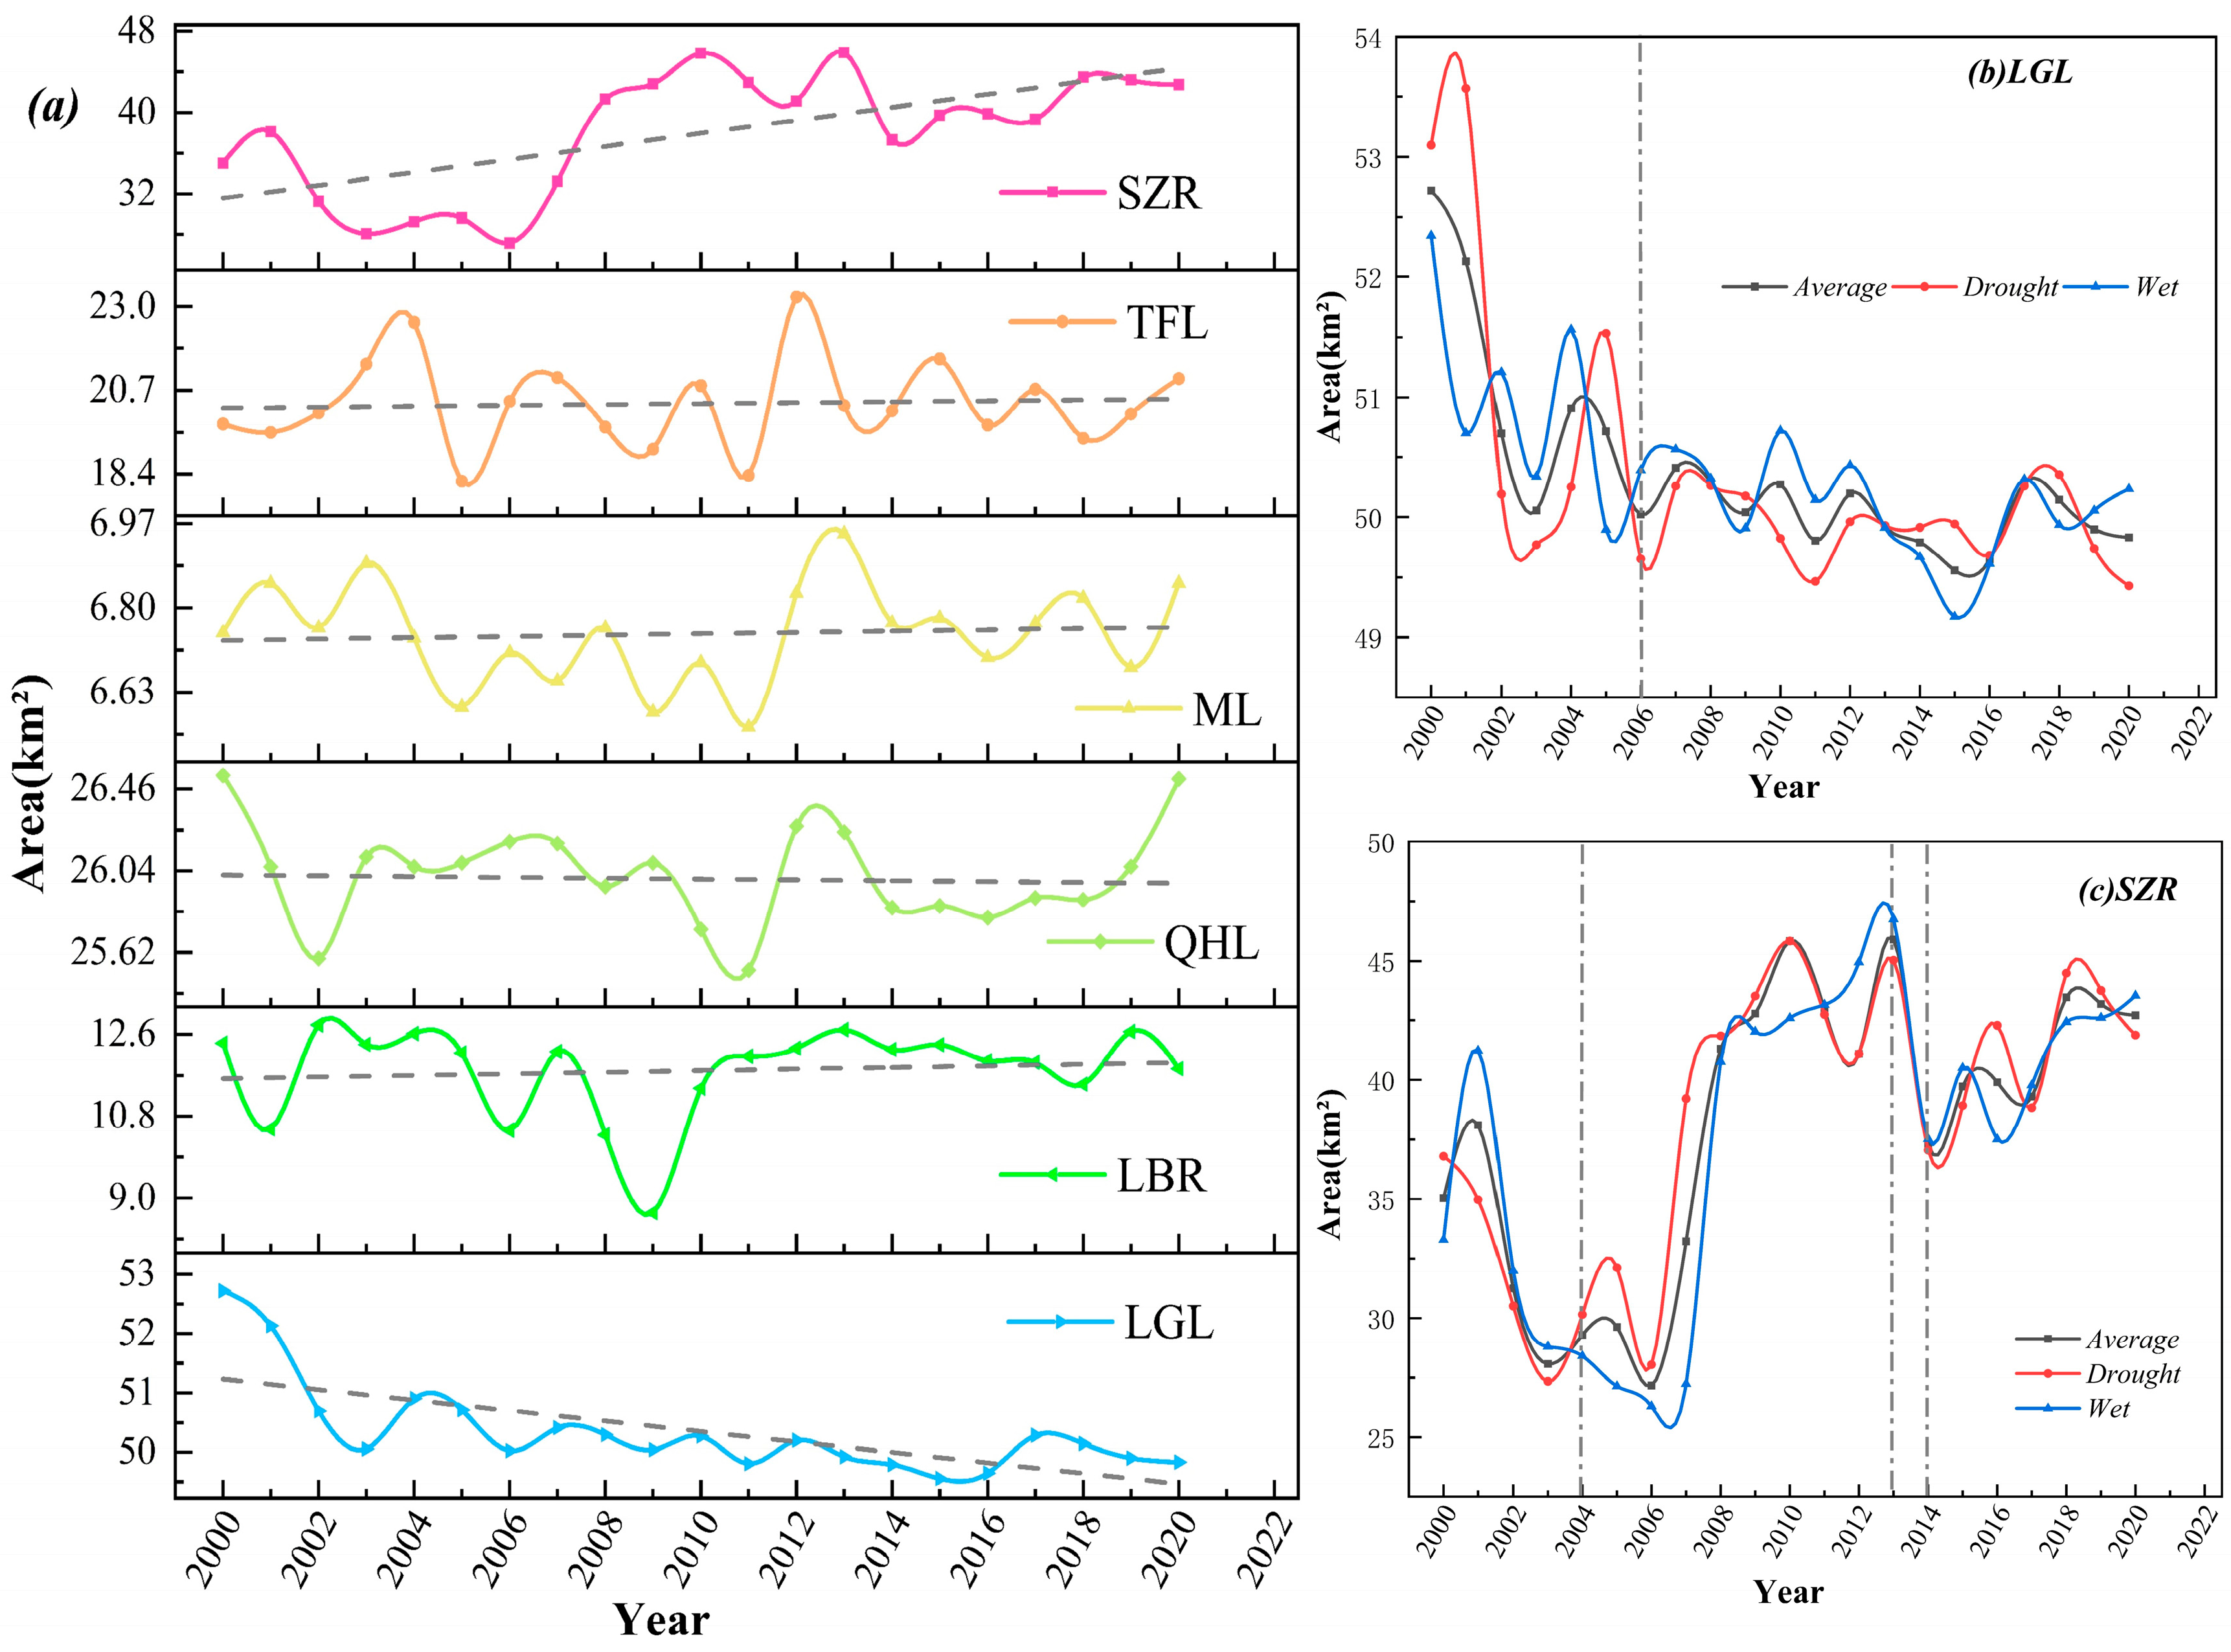
Water 14 02816 g004
Figure 5. Lake area. (a) Trends in the average annual area of the six lakes; (b) Annual average change in area of the Lugu Lake from drought to wet season; (c) Annual average change in area of the Shengzhong Reservoir from drought to wet season.
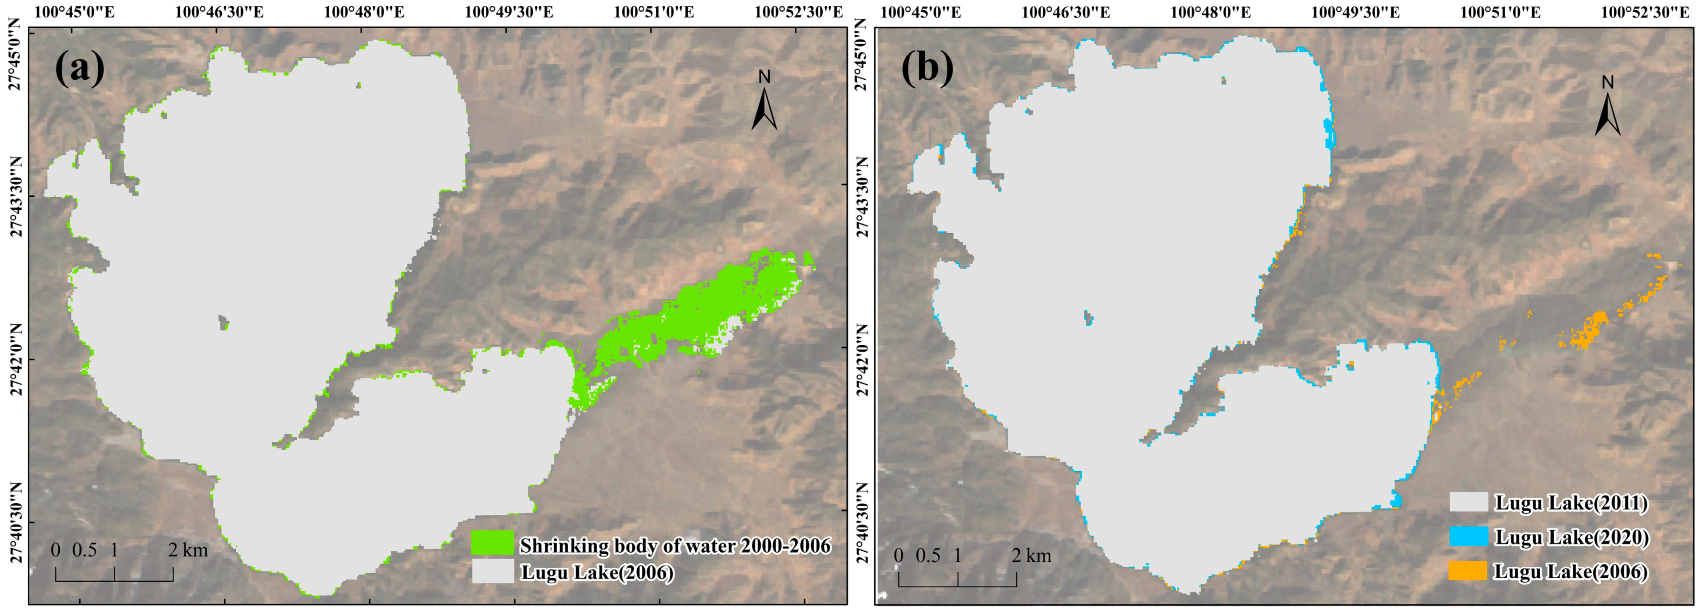
Water 14 02816 g005
Figure 6. Spatial changes in Lugu Lake. (a) The shrinking water bodies of Lugu Lake during 2000–2006; (b) After 2006, the Caohai part of Lugu Lake slowly disappeared.
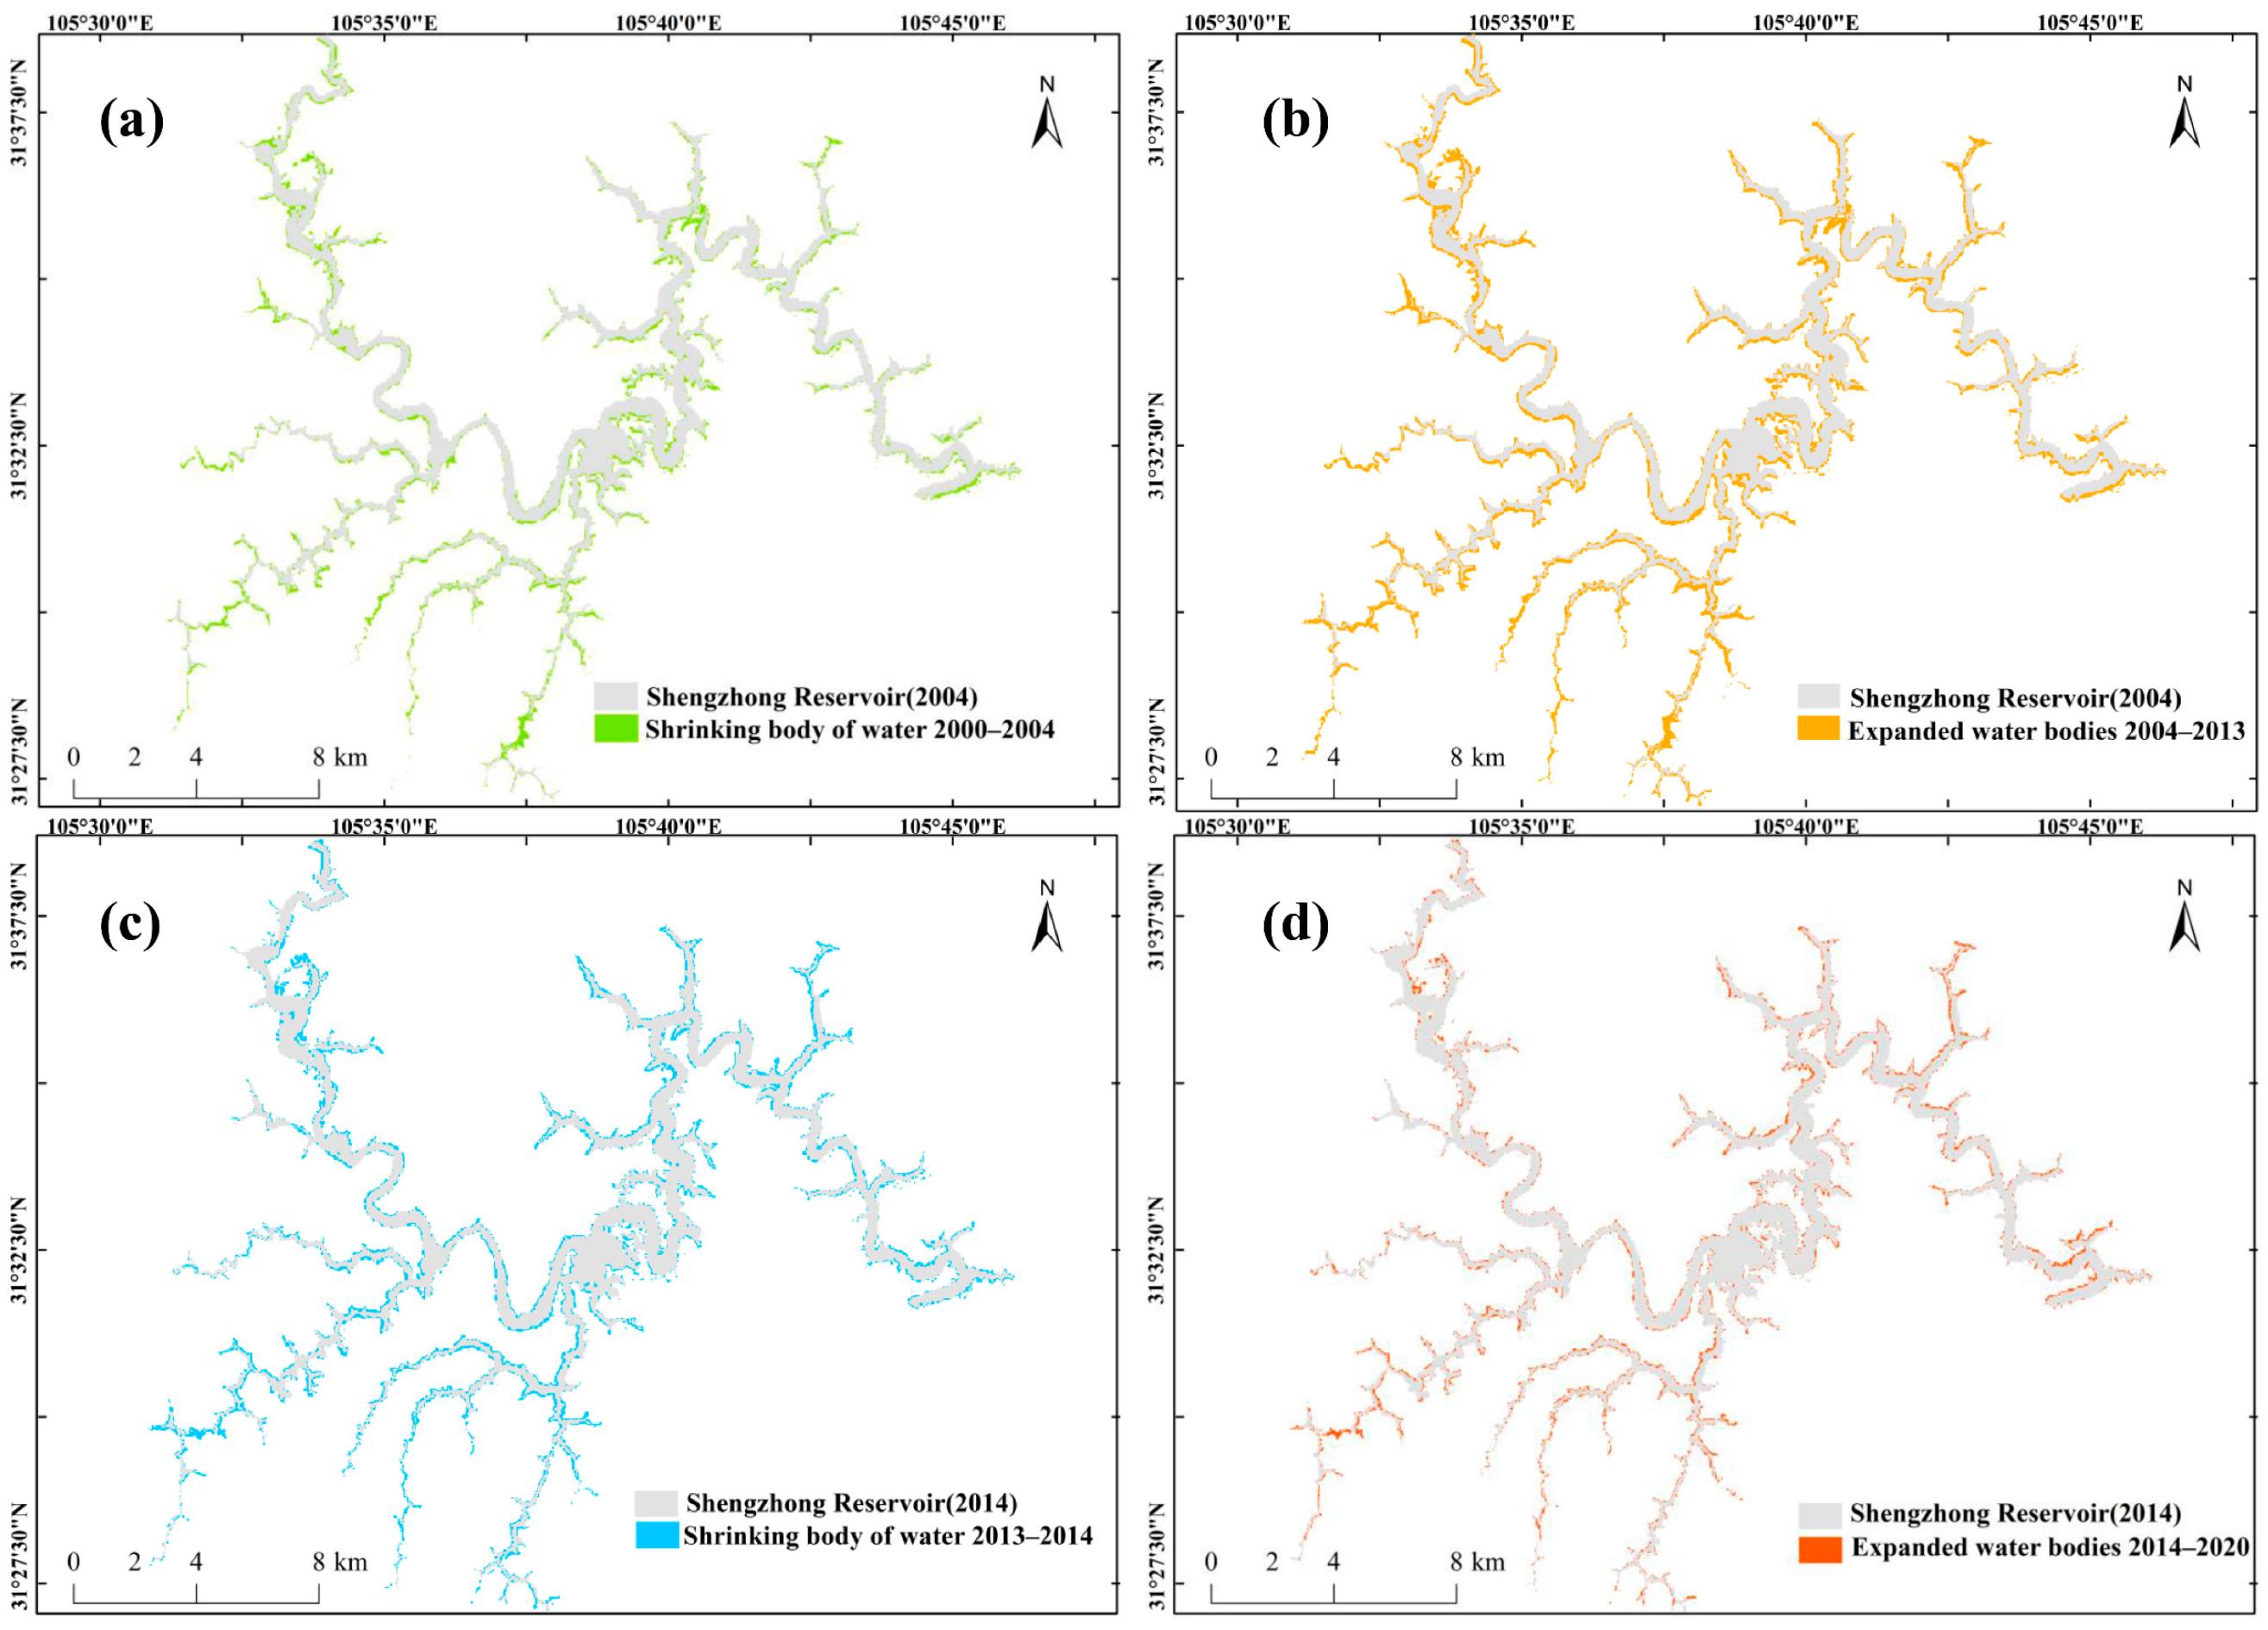
Water 14 02816 g006
Figure 7. Spatial changes in Shengzhong Reservoir. (a) The shrinking water bodies of Shengzhong Reservoir during 2000-2004; (b) The expansion of water bodies in Shengzhong Reservoir during the period 2004-2013; (c) The shrinking water bodies of Shengzhong Reservoir during 2013–2014; (d) The expansion of water bodies in Shengzhong Reservoir during the period 2014–2020.
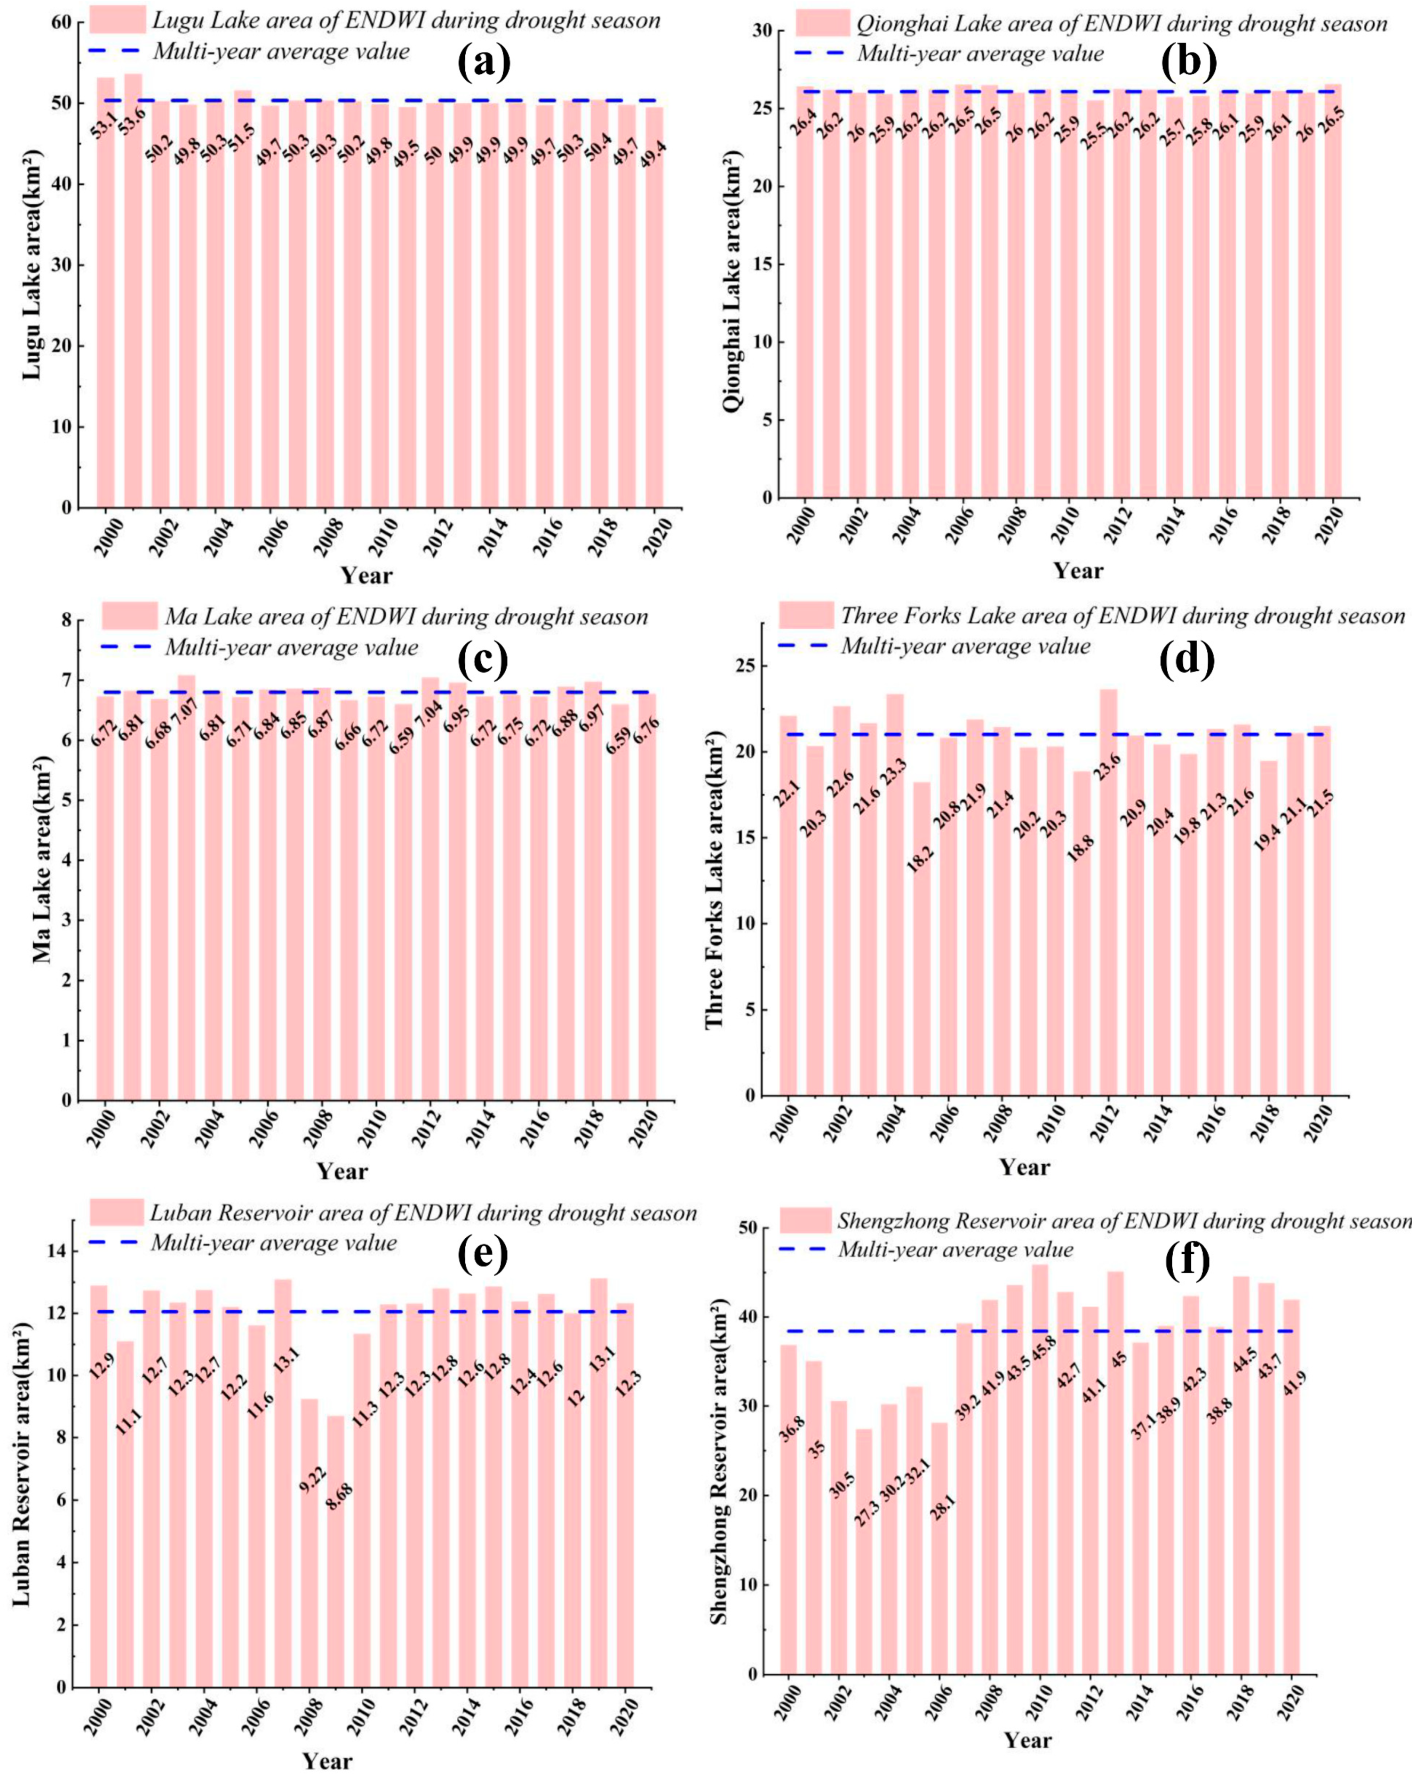
Water 14 02816 g007
Figure 8. Change in dry season area of selected lakes from 2000 to 2020. (a) Lugu Lake; (b) Qionghai Lake; (c) Ma Lake; (d) Three Forks Lake; (e) Luban Reservoir; (f) Shengzhong Reservoir. Note, the dashed line indicates the multi-year average lake area during the dry season.
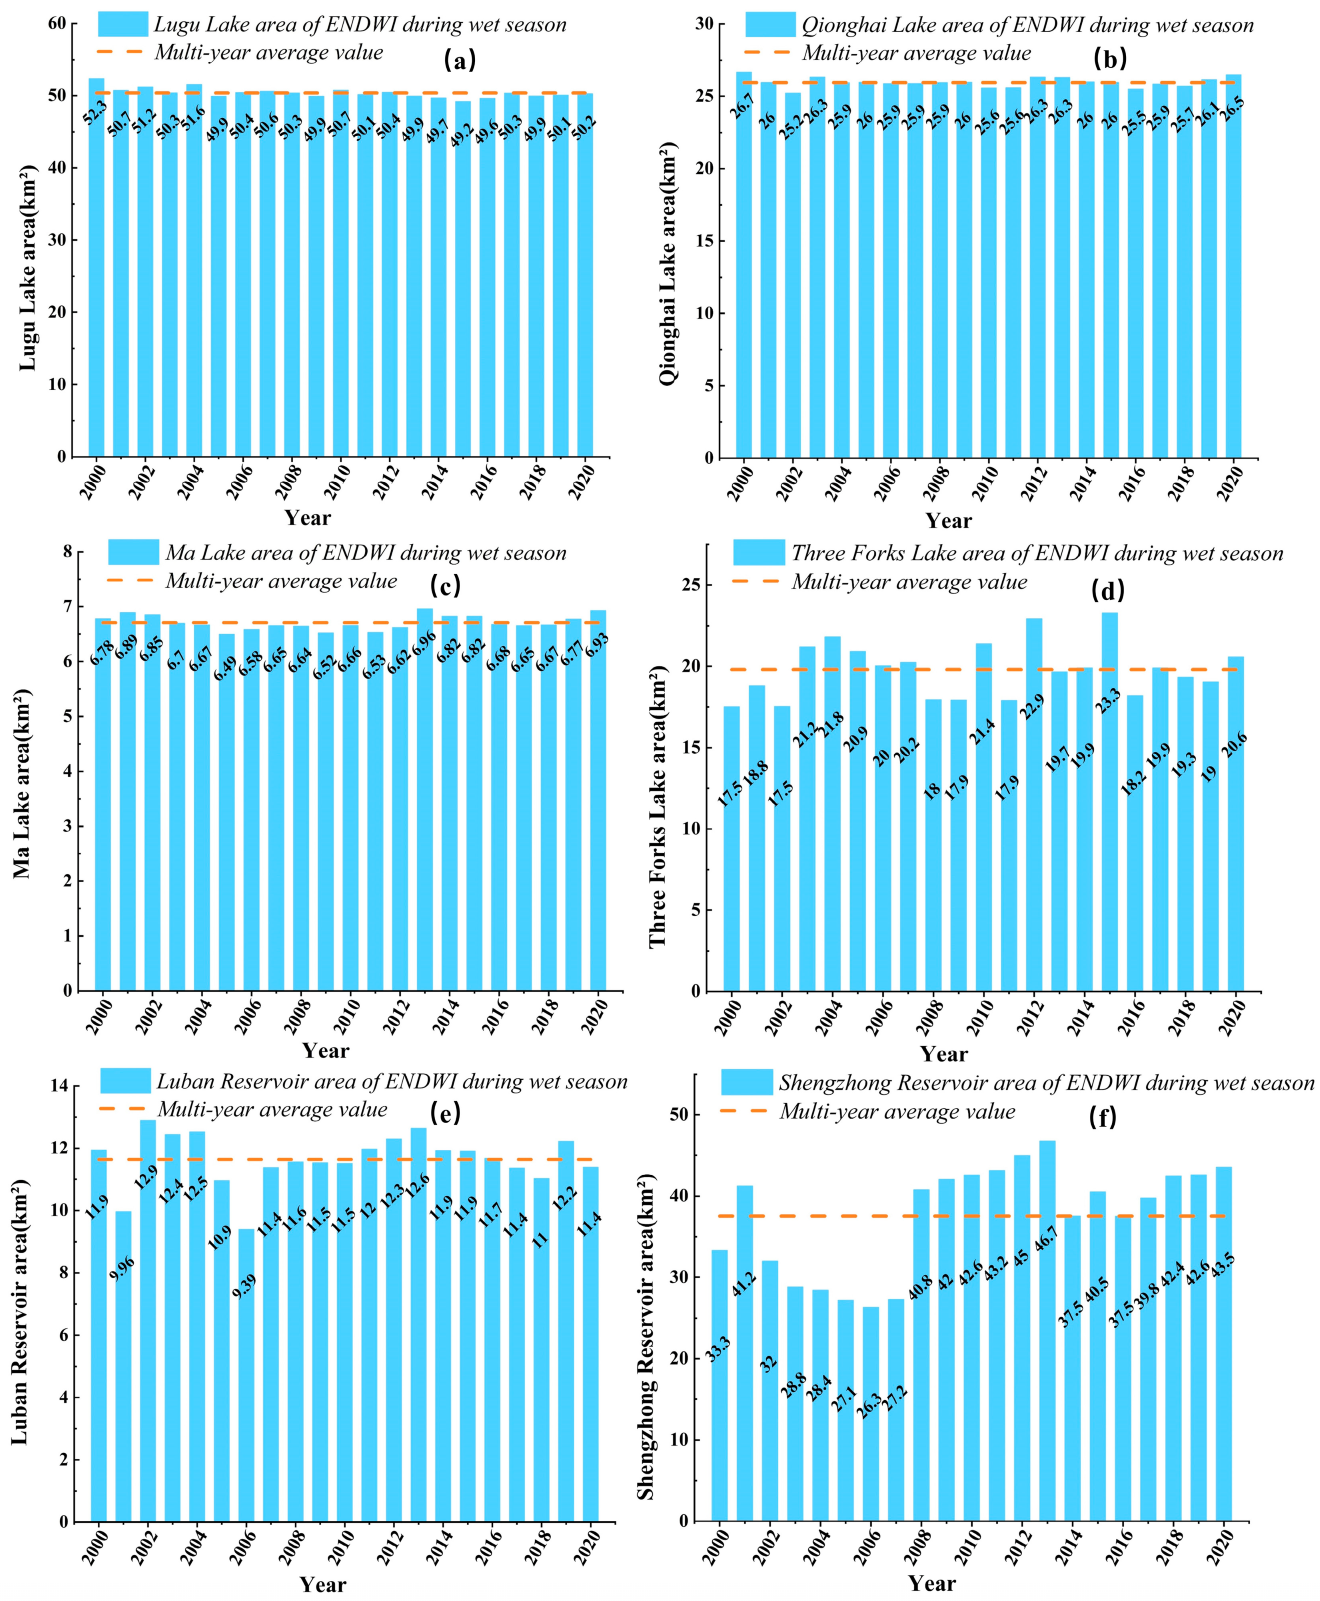
Water 14 02816 g008
Figure 9. Change in wet season area of selected lakes from 2000 to 2020. (a) Lugu Lake; (b) Qionghai Lake; (c) Ma Lake; (d) Three Forks Lake; (e) Luban Reservoir; (f) Shengzhong Reservoir. Note, the dashed line indicates the multi-year average lake area during the wet season.
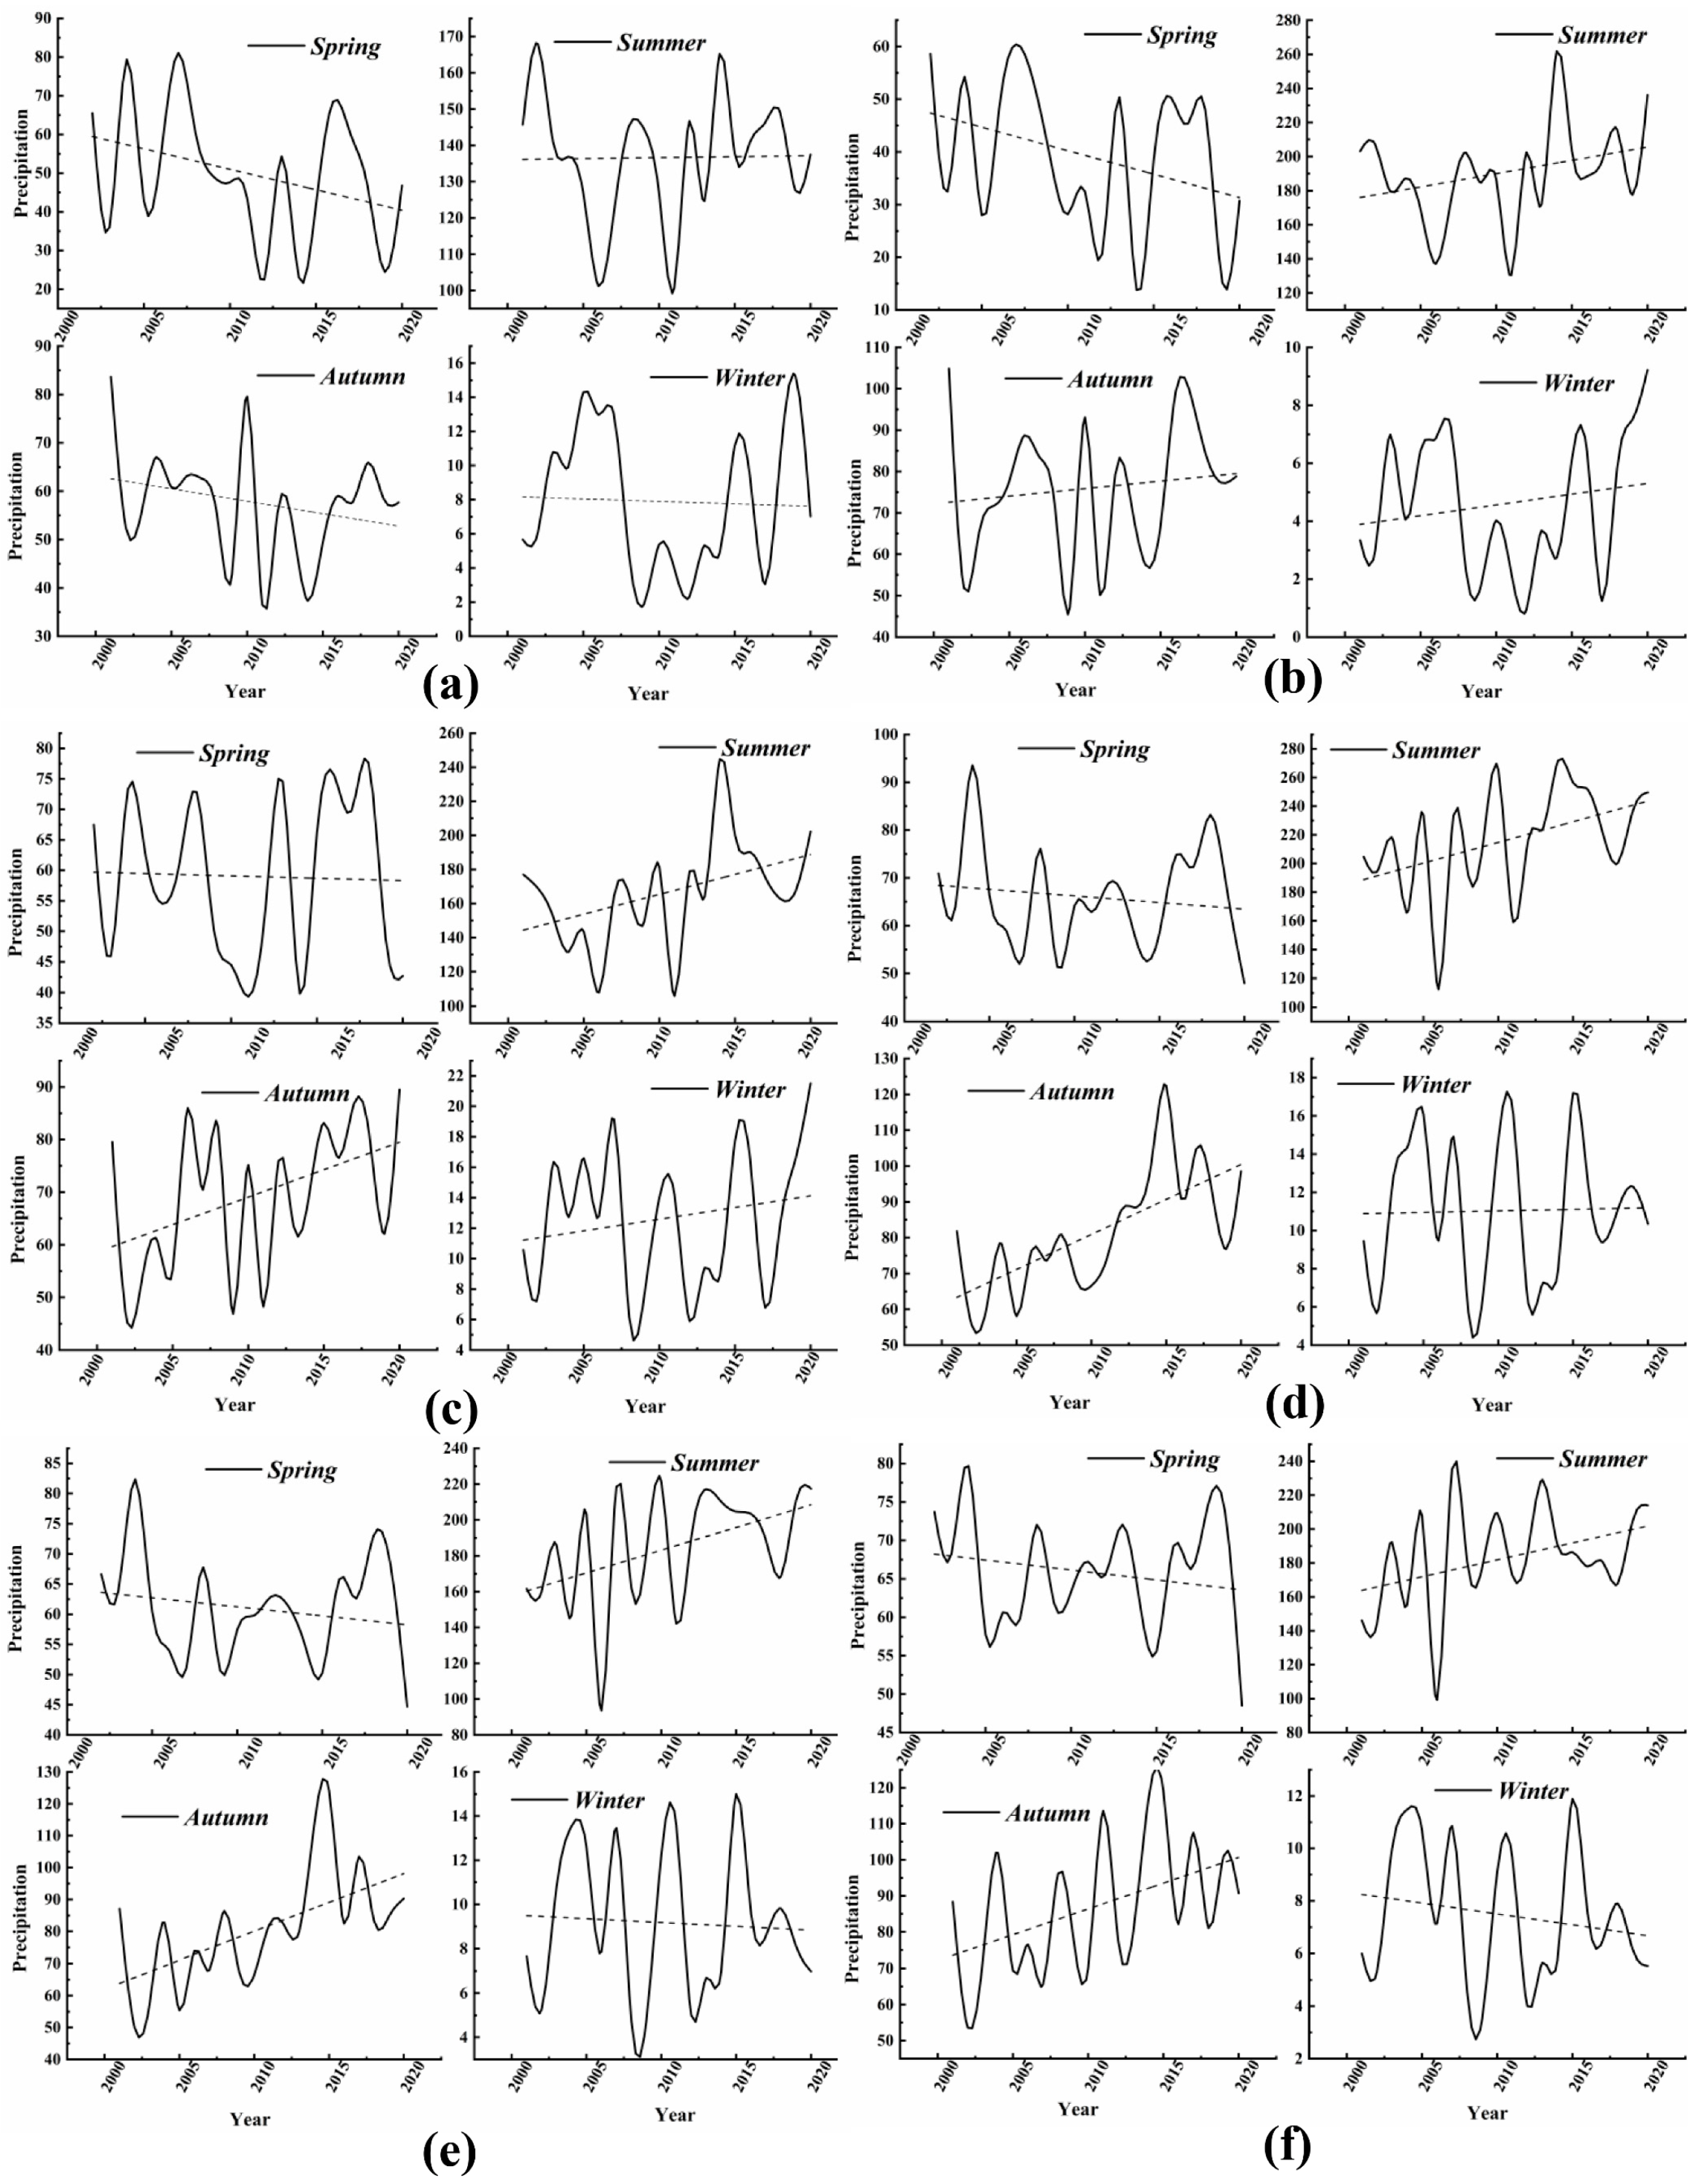
Water 14 02816 g009
Figure 10. Seasonal characteristics of the precipitation variation in the study area (mm). (a) Lugu Lake; (b) Qionghai Lake; (c) Ma Lake; (d) Three Forks Lake; (e) Luban Reservoir; (f) Shengzhong Reservoir. Note, the direction of the dashed line indicates the trend of precipitation in spring, summer, autumn and winter.
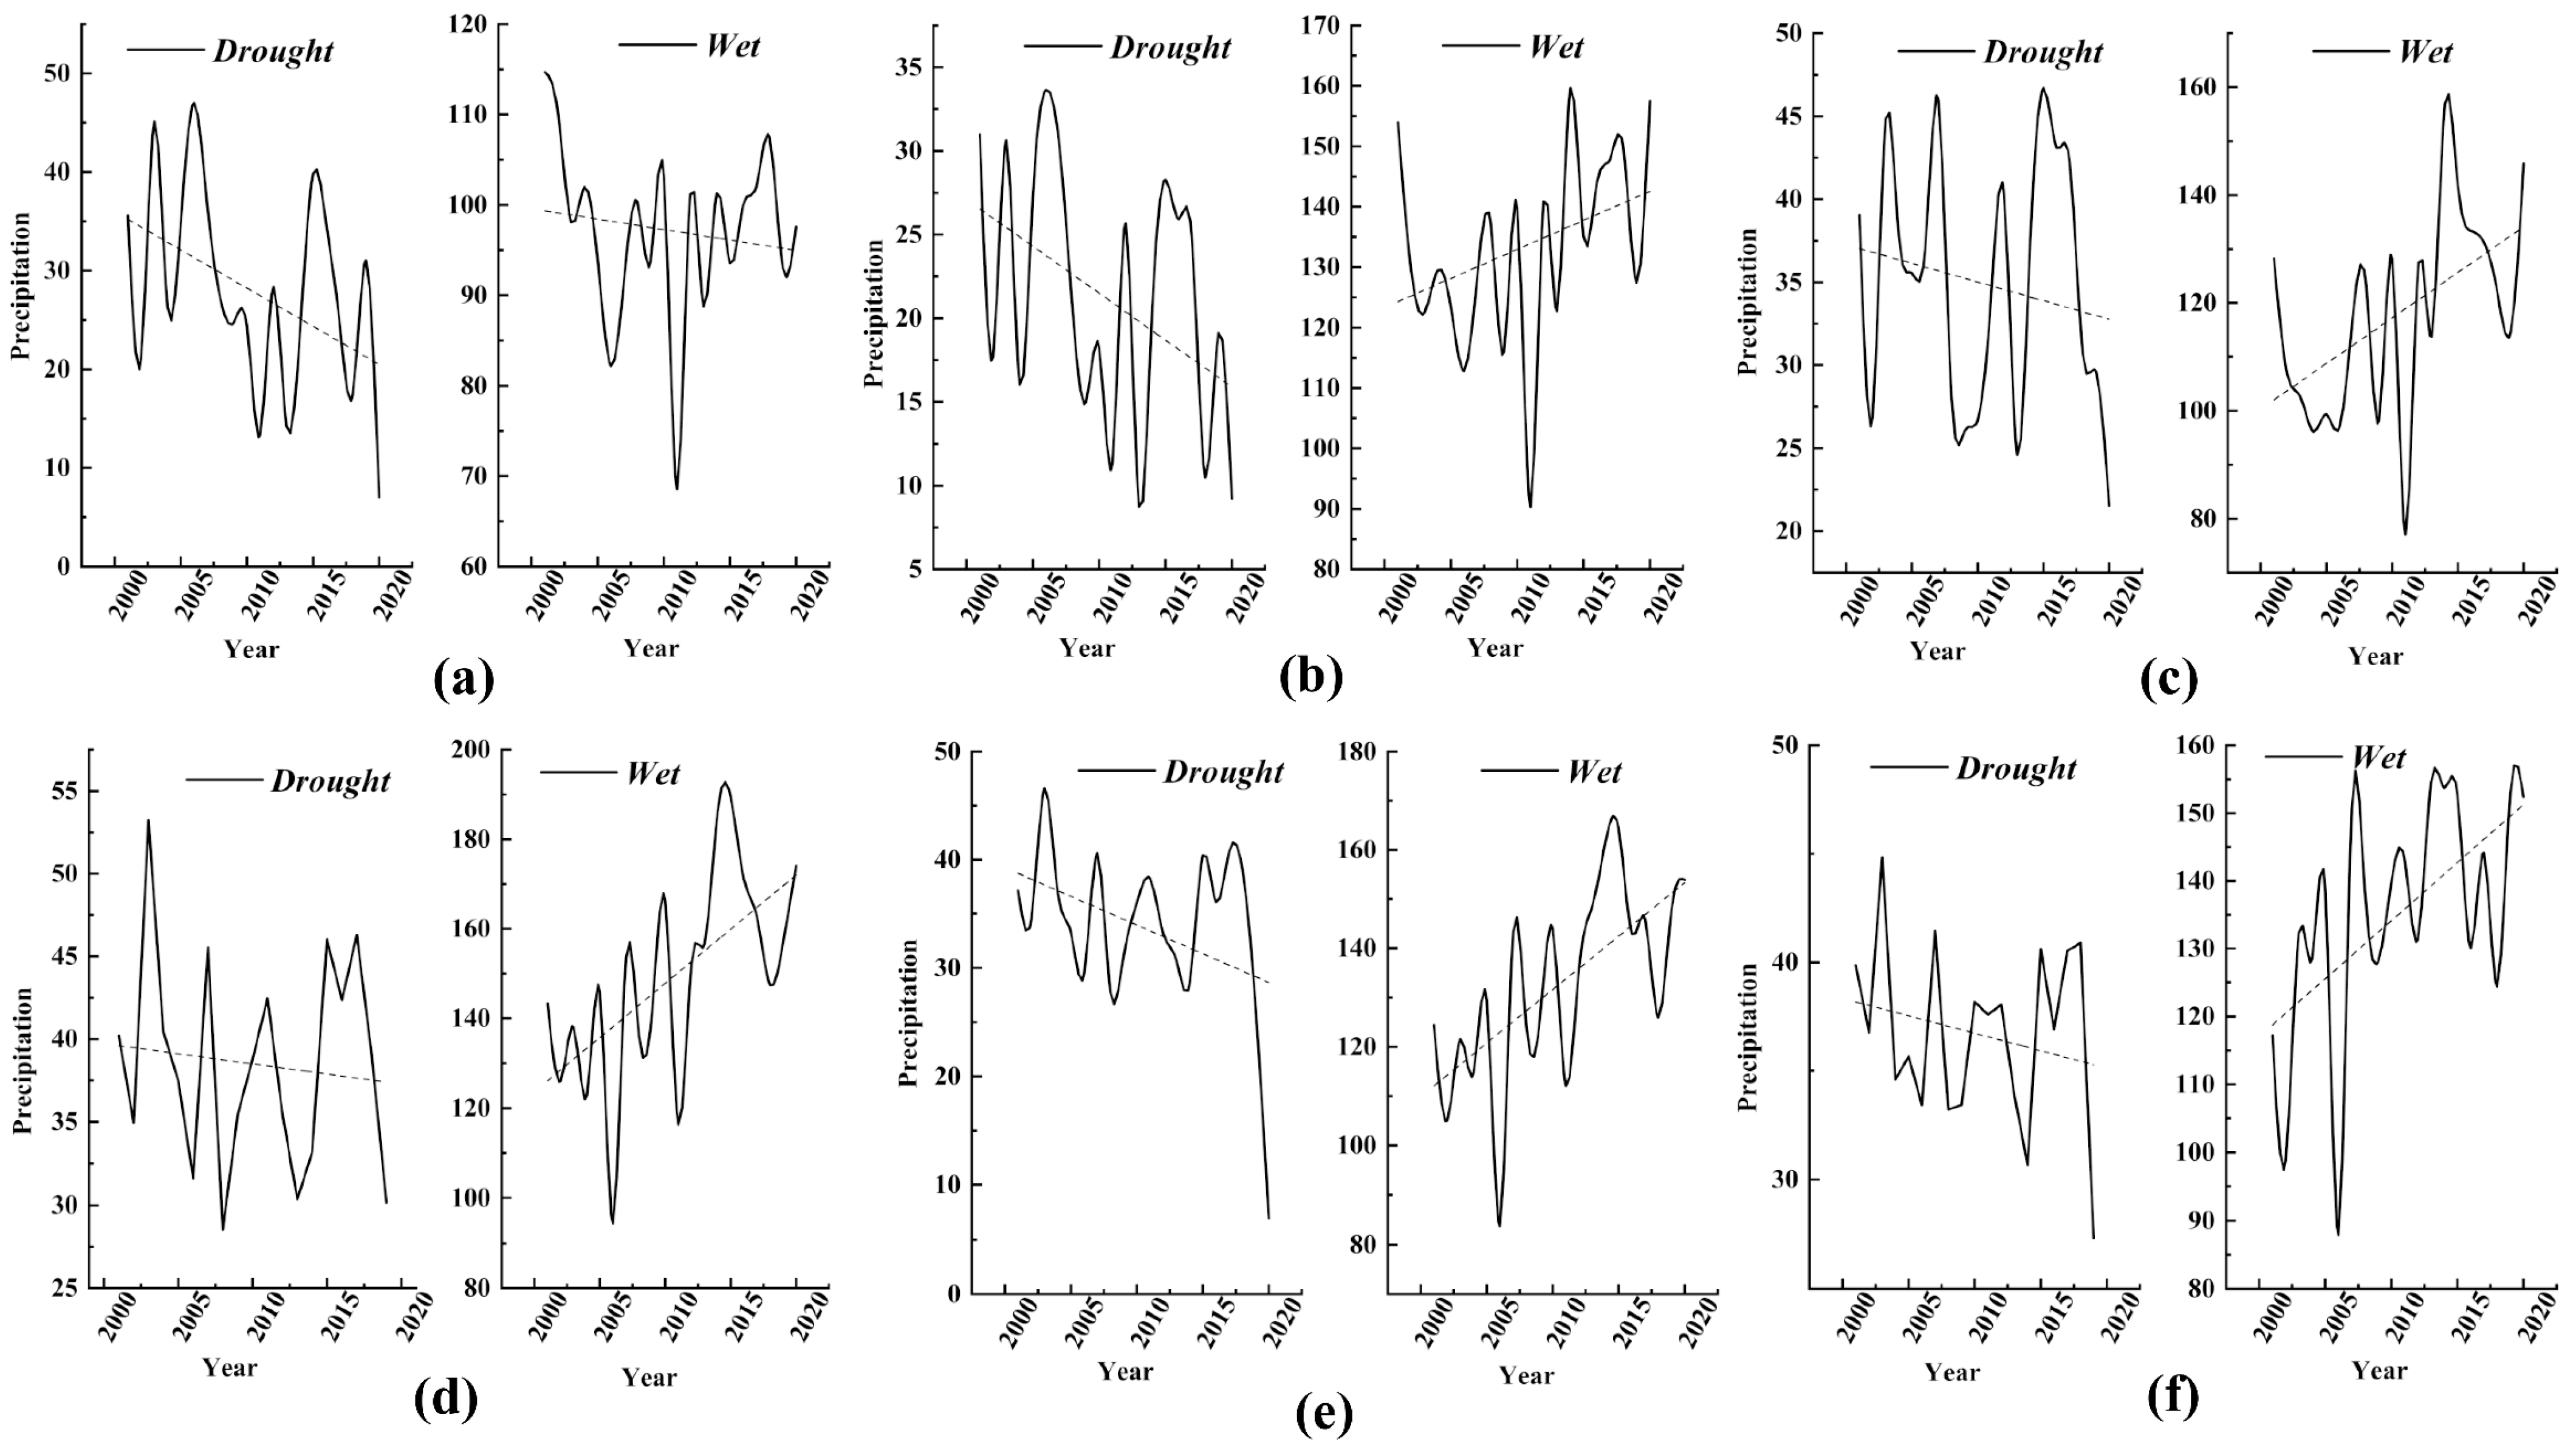
Water 14 02816 g010
Figure 11. Characteristics of the drought and wet season variation in precipitation (mm). (a) Lugu Lake; (b) Qionghai Lake; (c) Ma Lake; (d) Three Forks Lake; (e) Luban Reservoir; (f) Shengzhong Reservoir. Note, the direction of the dashed line indicates the trend of precipitation in the drought and wet season.
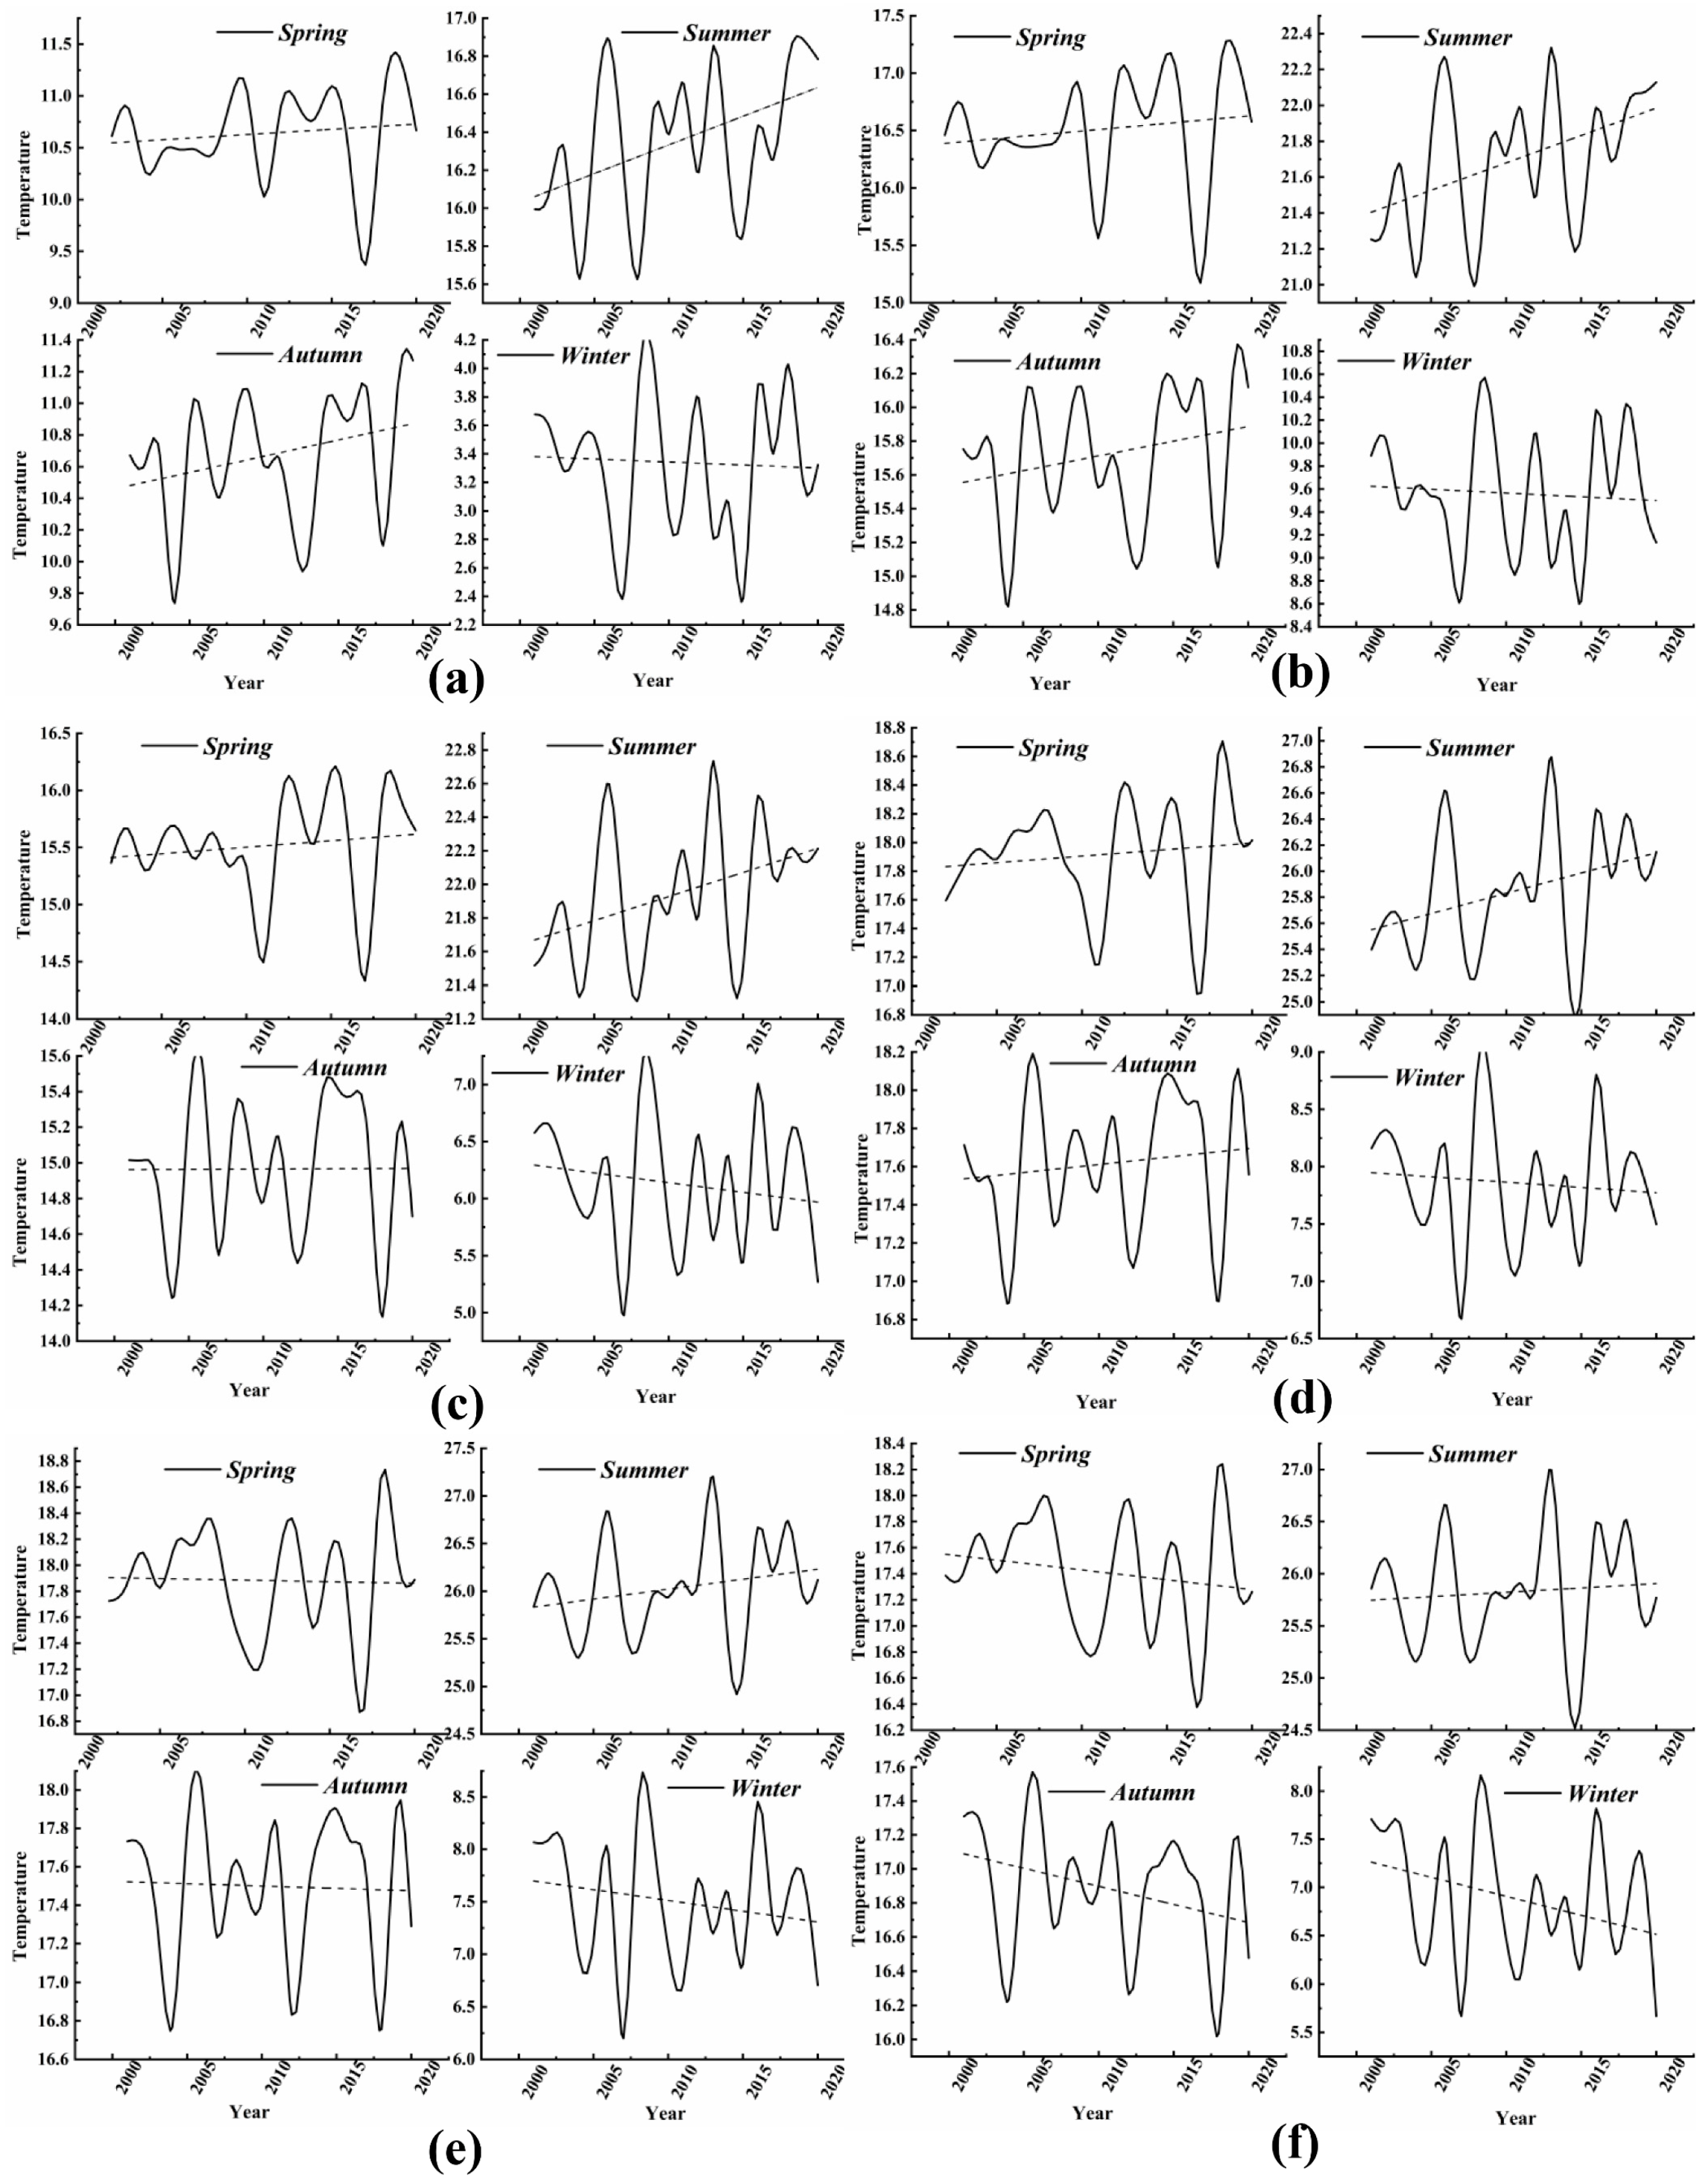
Water 14 02816 g011
Figure 12. Seasonal characteristics of the temperature variation in the study area (℃). (a) Lugu Lake; (b) Qionghai Lake; (c) Ma Lake; (d) Three Forks Lake; (e) Luban Reservoir; (f) Shengzhong Reservoir. Note, the direction of the dashed line indicates the trend of temperature in spring, summer, autumn and winter.
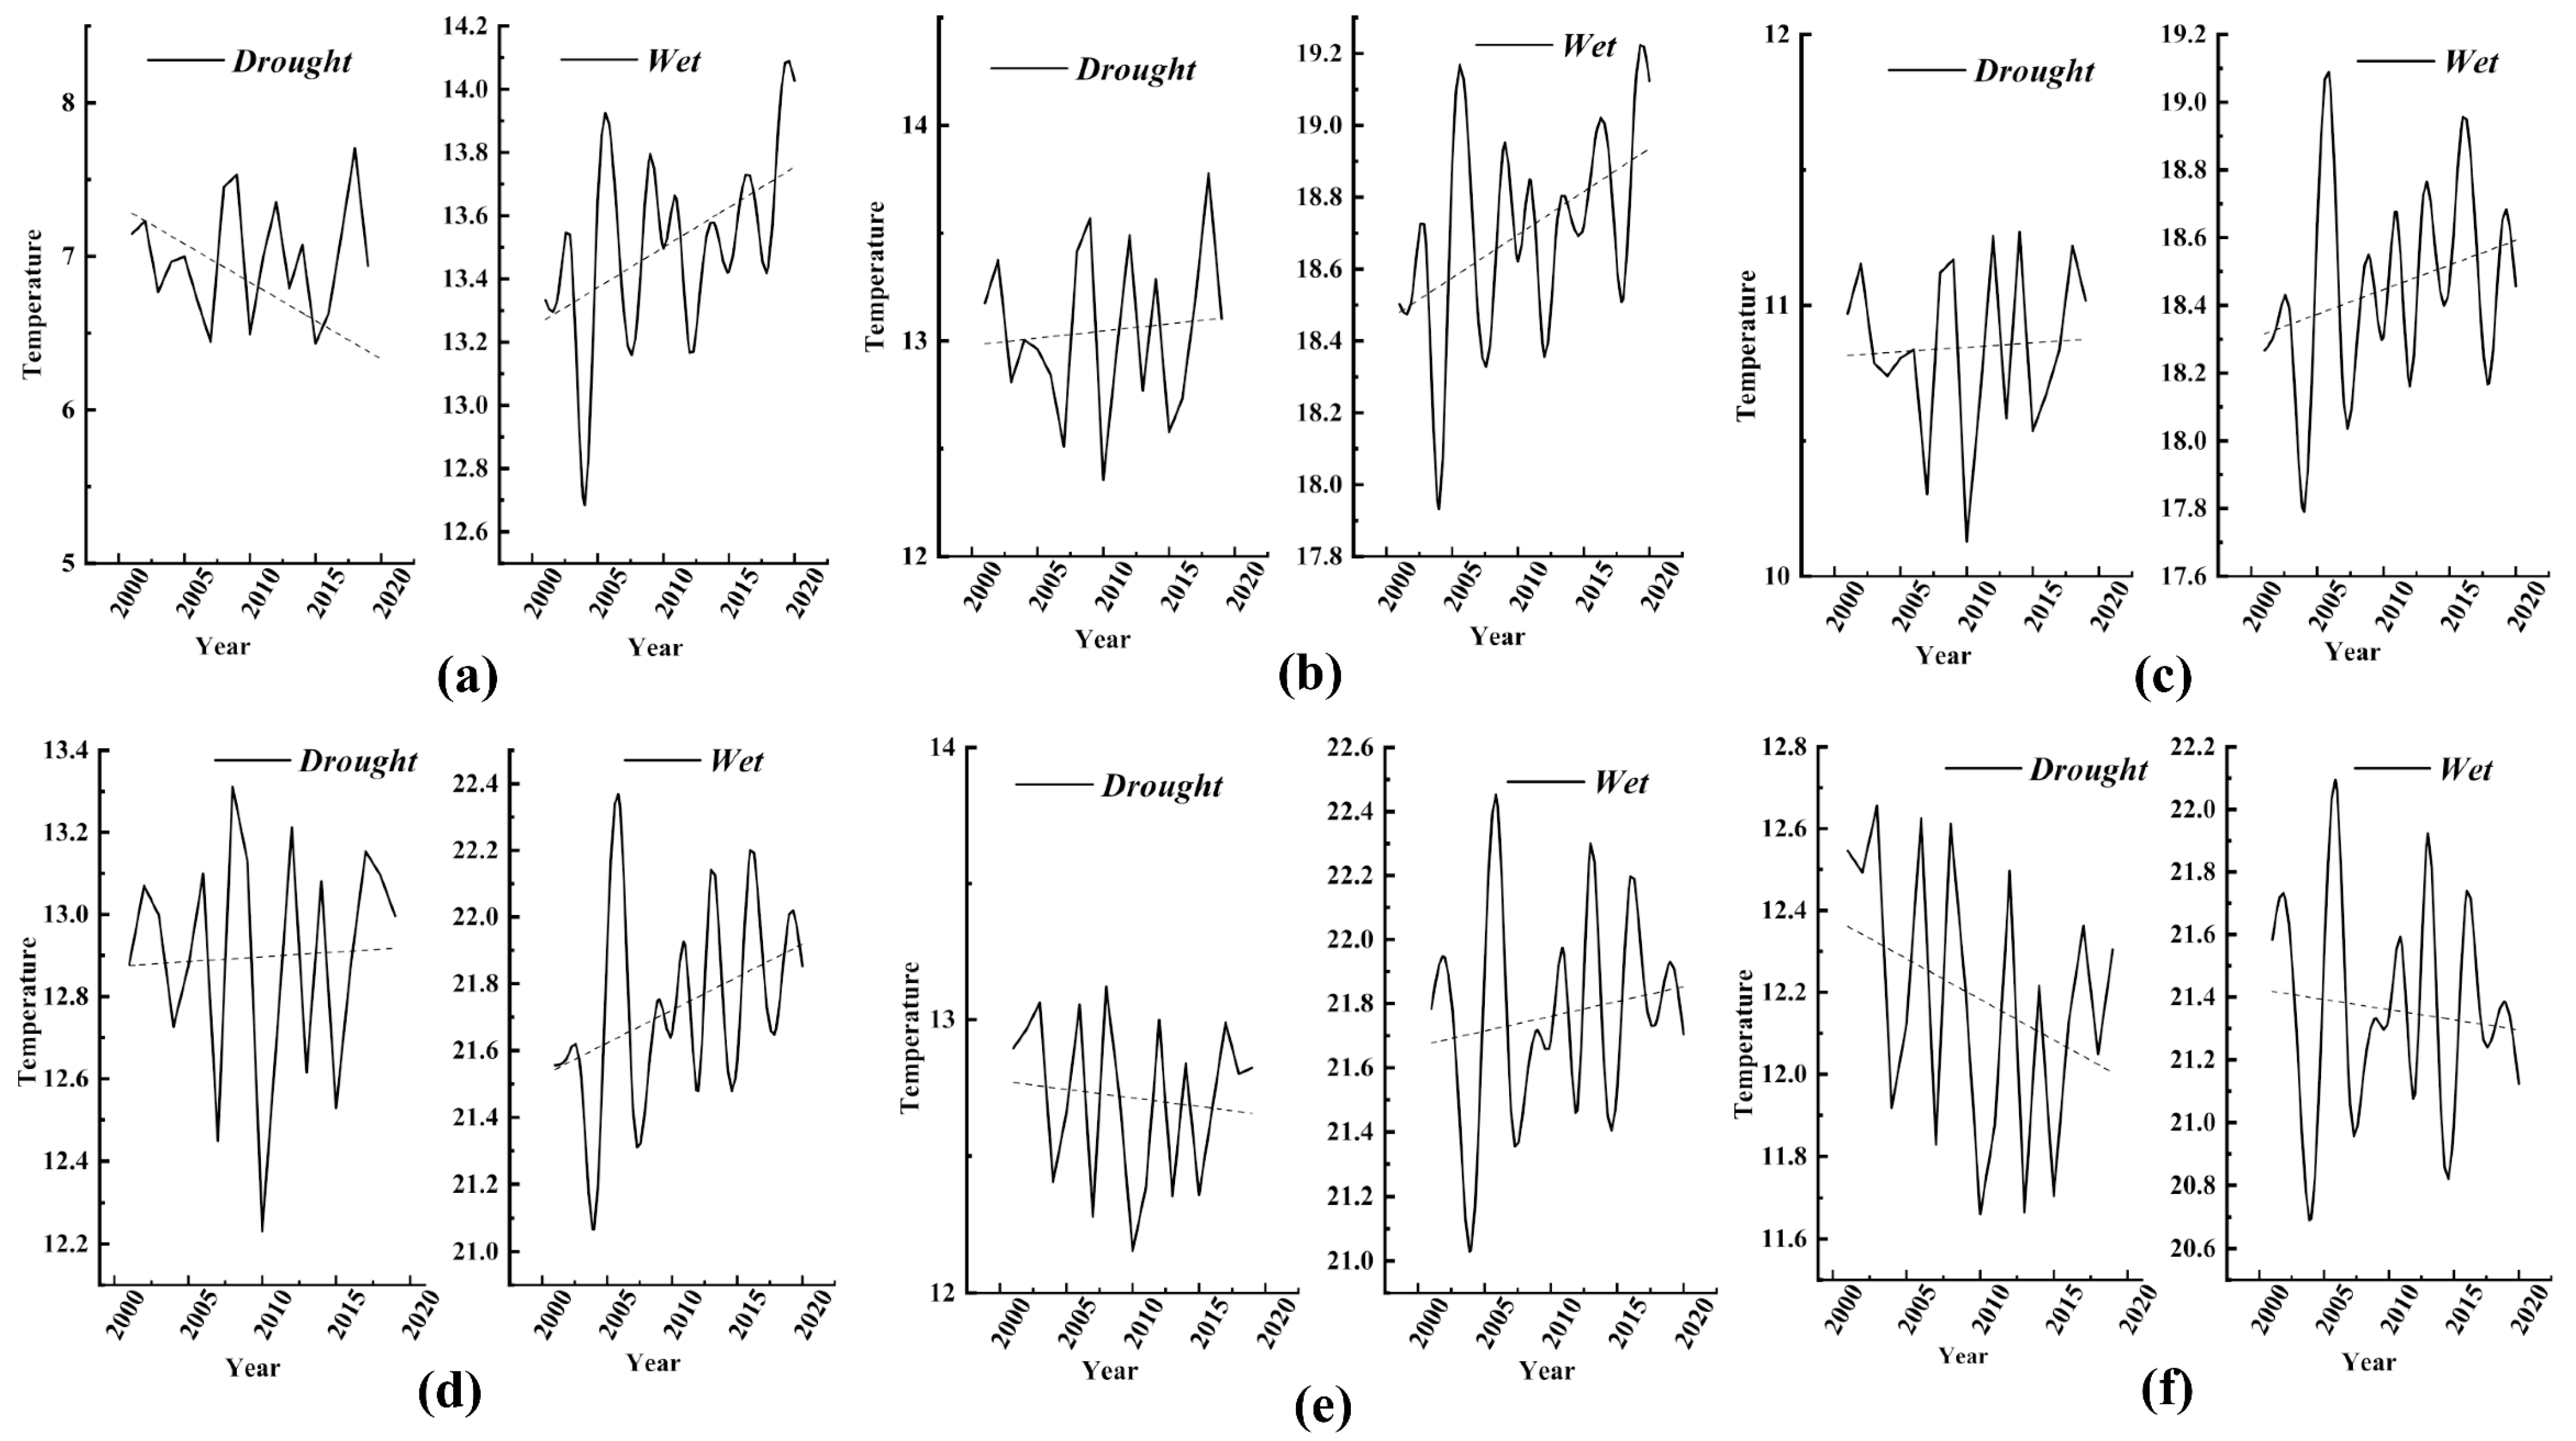
Water 14 02816 g012
Figure 13. Characteristics of the drought and wet season variation in temperature (°C). (a) Lugu Lake; (b) Qionghai Lake; (c) Ma Lake; (d) Three Forks Lake; (e) Luban Reservoir; (f) Shengzhong Reservoir. Note, the direction of the dashed line indicates the trend of temperature in the drought and wet season.
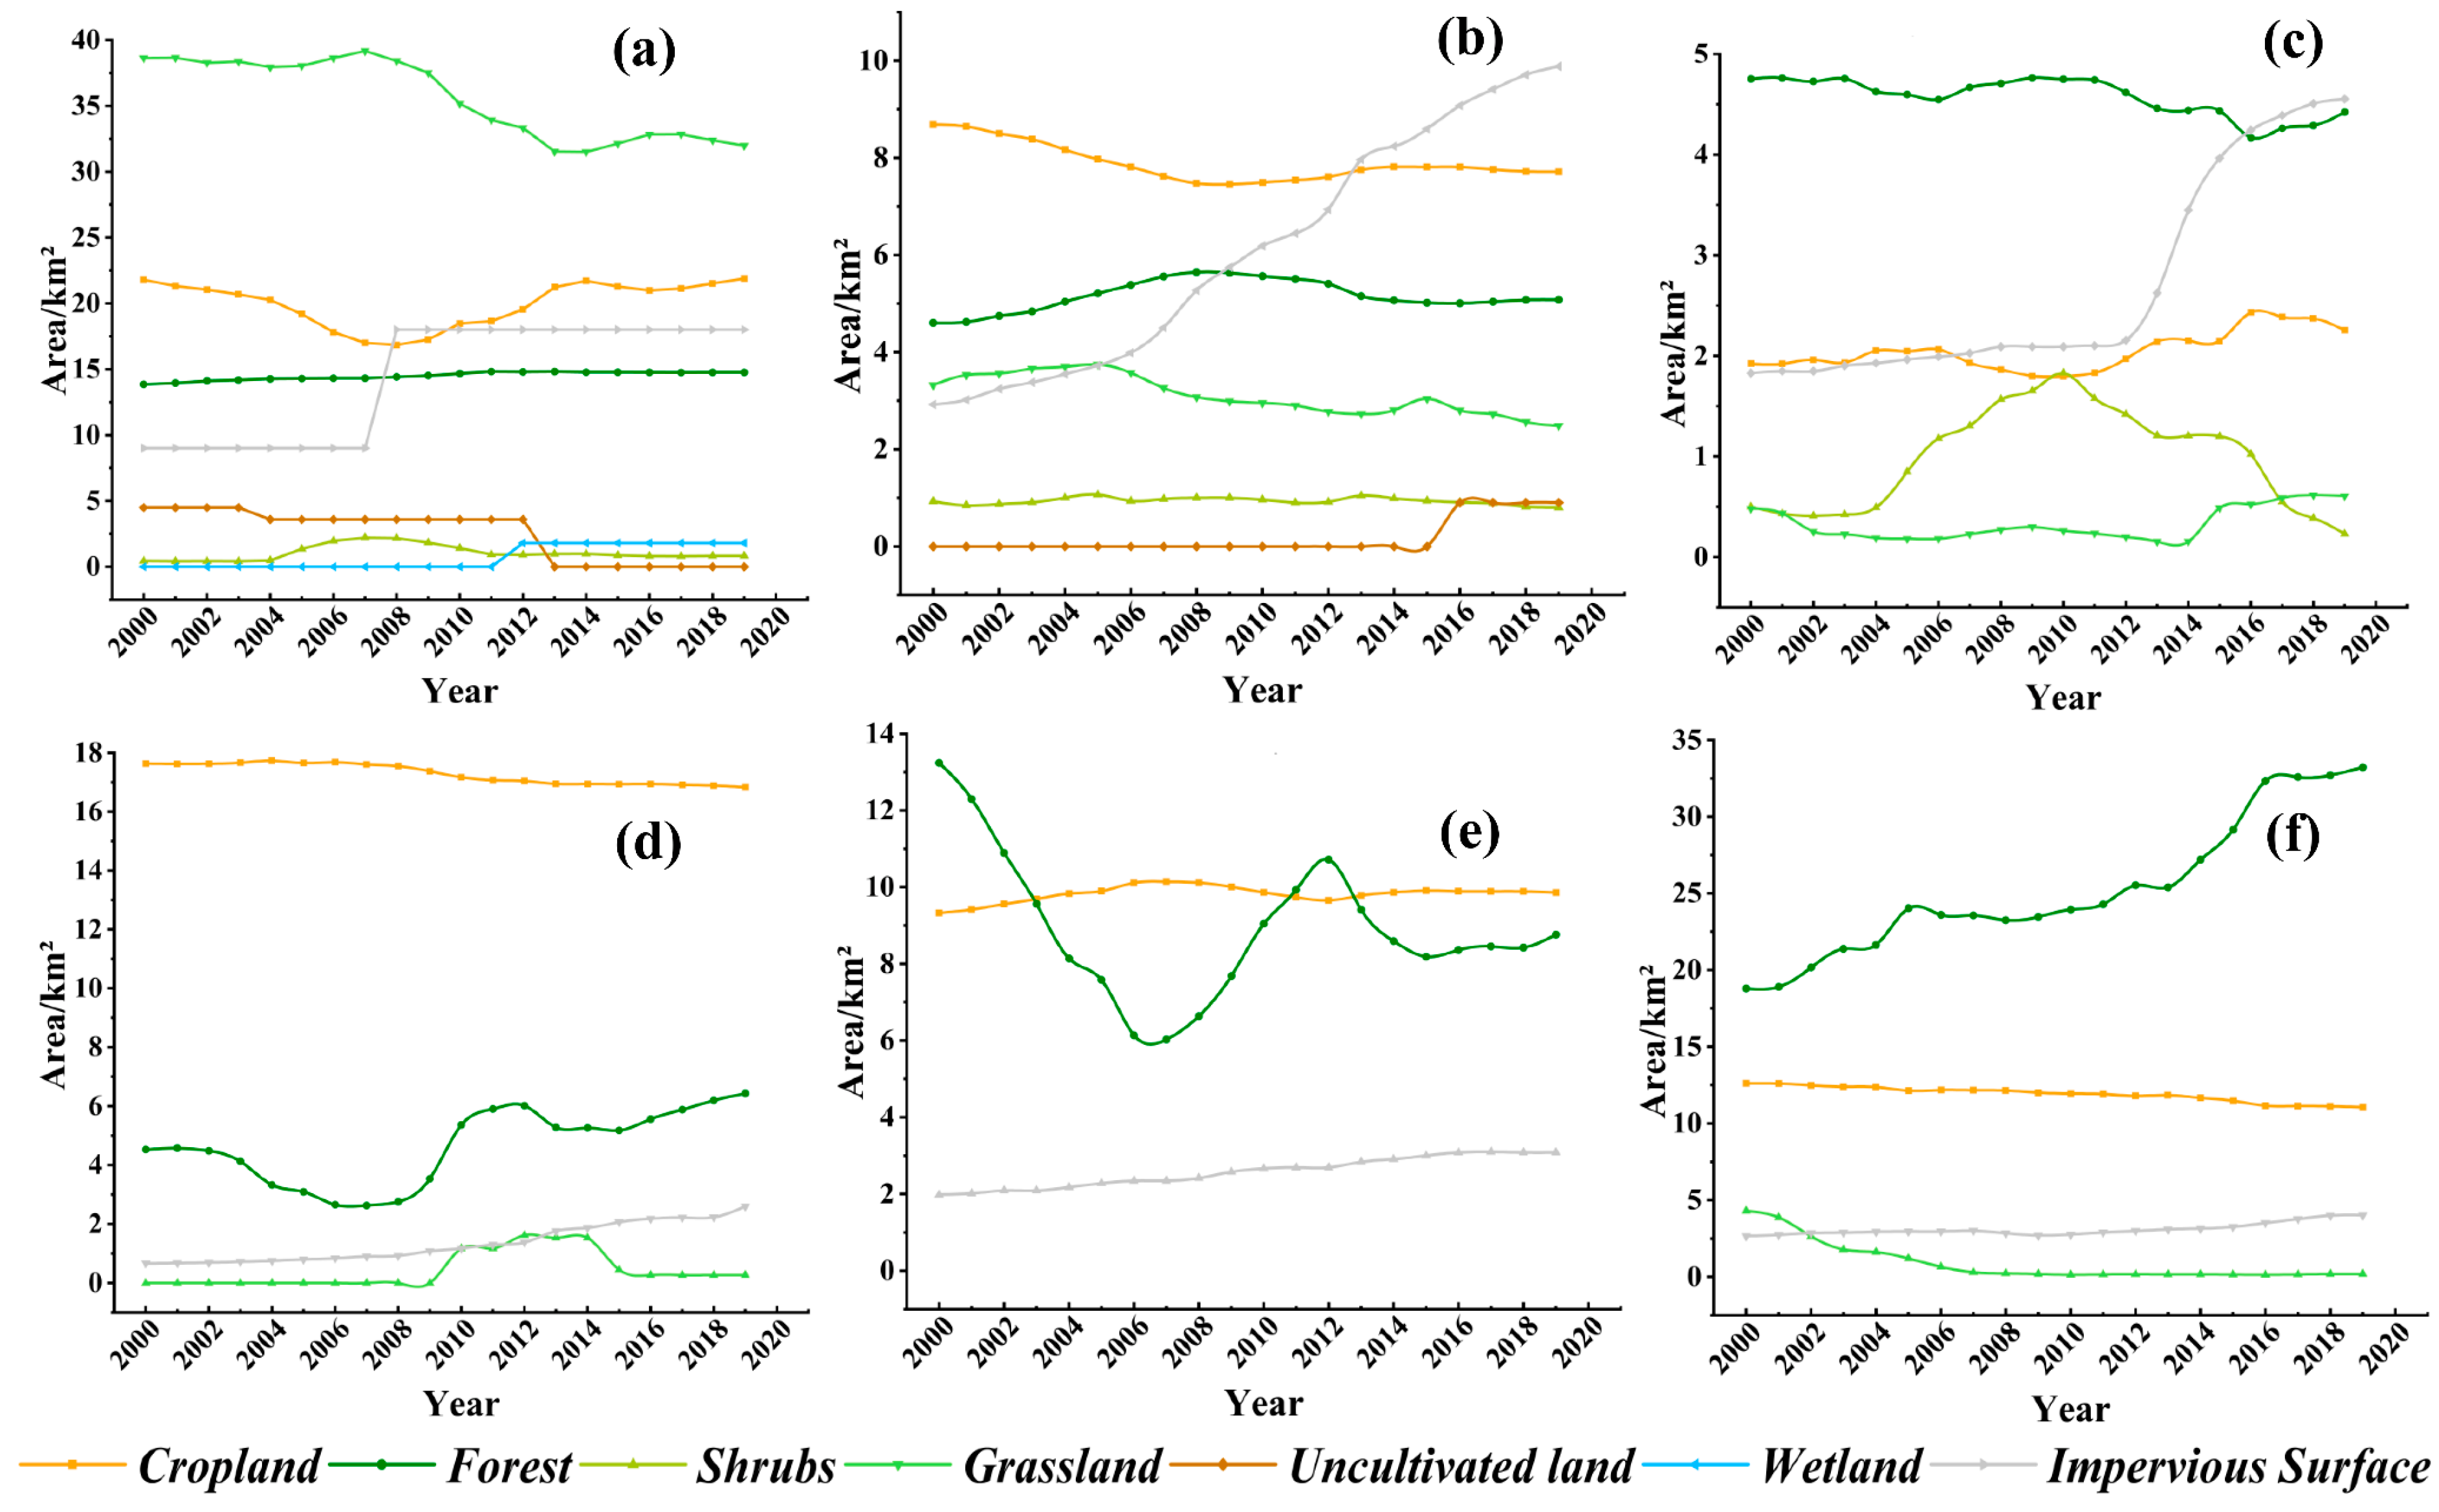
Water 14 02816 g013
Figure 14. Land cover change of selected lakes from 2000 to 2019. (a) Lugu Lake; (b) Qionghai Lake; (c) Ma Lake; (d) Three Forks Lake; (e) Luban Reservoir; (f) Shengzhong Reservoir. Note, the types of land cover represented by the different colored lines is shown at the bottom of the figure.
Water 14 02816 g014
Table 1. Data sources.
DatasetTime RangeSatellites and SensorsResolution
Landsat 5 Collection 2 Top of Atmosphere2000–2011TM30 m
Landsat 7 Top of Atmosphere2000–2021ETM+30 m
Landsat 8 Top of Atmosphere2013–2021OLI, TIRS30 m
JRC Global Surface Water Mapping Layers, v1.42020 30 m
TPDC/China 1 km Precipitation (Monthly)2001–2019 1 km
TPDC/China 1 km Avg Temperature (Monthly)2001–2019 1 km
Annual China Land Cover Dataset2000–2019 30 m
Table 2. Wavelength ranges of the band used in this study.
SatelliteGreen/μmNIR/μmMIR/μm
Landsat-50.52–0.600.76–0.901.55–1.75
Landsat-70.52–0.600.76–0.901.55–1.75
Landsat-80.53–0.600.85–0.891.56–1.67
Table 3. Results of validating water body extraction accuracy with the Global Surface Water dataset.
Lugu LakeQionghai LakeMa LakeThree Forks LakeLuban ReservoirShengzhong Reservoir
Overall Accuracy96.00%97.00%98.00%89.00%90.00%93.47%
Kappa Coefficient0.920.940.960.780.80.87
Table 4. Comparison of the results of different extraction methods (km²).
LakesYearENDWIAWEIsh/MNDWI/Supervised Classification 1Difference of Areas 2
Lugu Lake200052.7249.333.39
200550.7249.511.21
201050.2849.400.88
201549.5649.500.06
Ma Lake20056.606.98−0.38
20116.566.97−0.41
20176.776.86−0.09
Qionghai Lake200426.0627.29−1.23
201025.7427.36−1.62
201326.2426.85−0.61
201725.9027.23−1.33
Note: 1 AWEIsh is the index used by Xiao [20] to extract Lugu Lake; MNDWI is used by Li [52] to extract Ma Lake; supervised classification is the method used by Deng [53] to extract Qionghai Lake. 2 The difference between the lake area in this paper and the data from the previous study.
Table 5. Mann-Kendall trend test for water area of typical lakes in Sichuan Province.
LakesTimeTestTrend
Sen’s Slope 1p 2Z 3
LGLDrought−0.0420.037−2.084Decreasing significantly
Wet−0.0600.005−2.808Decreasing significantly
Annual−0.0680.0003−3.654Decreasing significantly
QHLDrought−0.0070.487−0.695Decreasing
Wet−5.00 × 10−40.976−0.030Decreasing
Annual−0.0070.607−0.514Decreasing
MLDrought0.000454550.8320.212Increasing
Wet0.0020.7170.363Increasing
Annual0.0010.7390.333Increasing
TFLDrought−0.0400.381−0.876Decreasing
Wet0.0420.5660.574Increasing
Annual0.0100.8800.151Increasing
LBRDrought0.0110.5660.574Increasing
Wet−0.0130.740−0.332Decreasing
Annual−0.0090.740−0.332Decreasing
SZRDrought0.5630.0102.567Increasing significantly
Wet0.6530.0202.325Increasing significantly
Annual0.6680.0072.688Increasing significantly
Note: 1 Sen’s slope estimator. 2 Mann–Kendall tests. 3 The smaller the p-value, the more significant the result.
Table 6. Changes in the area of typical lakes in Sichuan Province from 2000 to 2020 (km²).
NameLongitudeLatitudeElevationLake Areas (km²)Changes
(E)(N)(m)20002020(%)
Lugu Lake (LGL)100.7827.71265952.7249.83−5.482
Qionghai Lake (QHL)102.3127.82147526.5326.51−0.075
Ma Lake (ML)103.7828.4110796.756.851.481
Three Forks Lake (TFL)104.2830.2842019.7821.026.269
Luban Reservoir (LBR)105.0130.9142412.4111.85−4.512
Shengzhong Reservoir (SZR)105.6531.5438535.0442.7121.889
Table 7. Mann–Kendall trend test for meteorological factors.
LakeTimePrecipitationTrendTemperatureTrend
SlopeZpSlopeZp
Lugu LakeDrought−0.80−1.720.09Decreasing−0.01−0.620.54Decreasing
Wet−0.15−0.620.54Decreasing0.021.910.06Increasing
Qionghai LakeDrought−0.58−1.910.06Decreasing−0.01−0.490.63Decreasing
Wet1.261.780.07Increasing0.031.980.05Increasing significantly
Ma LakeDrought−0.38−0.750.46Decreasing−0.01−0.230.82Decreasing
Wet1.751.980.05Increasing significantly0.021.200.23Increasing
Three Forks LakeDrought−0.39−0.750.46Decreasing−0.01−1.070.28Decreasing
Wet2.372.890.00Increasing significantly0.021.850.06Increasing
Luban ReservoirDrought−0.42−1.070.28Decreasing−0.01−1.070.28Decreasing
Wet2.263.150.00Increasing significantly0.010.620.54Increasing
Shengzhong ReservoirDrought−0.25−0.940.35Decreasing−0.03−1.720.09Decreasing
Wet1.432.300.02Increasing significantly−0.01−0.490.63Decreasing
Table 8. Correlation of area with precipitation and temperature.
LakesTimePrecipitationTemperature
RpSigRpSig
Lugu Lakewet0.310.18 −0.530.02*(1)
drought0.230.34 0.270.24
Qionghai Lakewet0.110.65 0.150.52
drought0.150.53 −0.390.09
Ma Lakewet0.550.01*−0.070.78
drought0.290.22 0.090.71
Three Forks Lakewet0.320.17 −0.340.15
drought−0.070.77 −0.040.86
Luban Reservoirwet0.290.21 −0.320.17
drought0.150.53 −0.120.63
Shengzhong Reservoirwet0.420.07 0.010.96
drought−0.200.39 −0.240.31
Note: 1 Sig is *, representing a significant correlation at the 0.05 level (two-tailed).
Table 9. Comparison of the area percentage of each lake in 2000 and 2020.
Lake2000 (km²)2020 (km²)Proportion of Total
Area in 2000
Proportion of Total
Area in 2020
Lugu Lake52.7249.8334.4%31.4%
Qionghai Lake26.5326.5117.3%16.7%
Ma Lake6.756.854.4%4.3%
Three Forks Lake19.7821.0212.9%13.2%
Luban Reservoir12.4111.858.1%7.5%
Shengzhong Reservoir35.0442.7122.9%26.9%
Total153.23158.77100%100%
Publisher’s Note: MDPI stays neutral with regard to jurisdictional claims in published maps and institutional affiliations.

