
Investigating Drought Propagation Time, Relationship, and Drivers in Perennial River Basins of China

1
School of Water Conservancy, North China University of Water Resources and Electric Power, Zhengzhou 450046, China
2
College of Water Resources, North China University of Water Resources and Electric Power, Zhengzhou 450046, China
*
Author to whom correspondence should be addressed.
Water 2022, 14(18), 2812; https://doi.org/10.3390/w14182812
Submission received: 25 July 2022
/
Revised: 28 August 2022
/
Accepted: 7 September 2022
/
Published: 9 September 2022
(This article belongs to the Section Hydrology)
Abstract
:Drought is a multifaceted natural disaster that can impact the ecological environment, crop yield, and social economy through the hydrological cycle process. Meteorological drought occurs first, which then propagates to other forms. This study presents the propagation characteristics of meteorological to hydrological drought in different river basins of China. The main drivers of drought propagation are also quantitatively analyzed in this study. The standardized precipitation index (SPI) and standardized runoff index (SRI) were used to describe meteorological and hydrological drought, respectively. The Songhua and Liaohe River Basin (SLRB), Haihe River Basin (HARB), Huaihe River Basin (HURB), Yellow River Basin (YRB), Yangtze River Basin (YARB), Pearl River Basin (PRB), Southeast Basin (SEB), Southwest Basin (SWB), and Continental Basin (CB) were analyzed in this study. The precipitation and runoff datasets were used to compute the SPI and SRI, respectively. The results showed that the drought propagation time was mainly 1–3 months in China. In general, drought propagation had a stronger relationship in the central and eastern river basins of China than in the western river basins (SWB and CB). Spring and winter had a weaker drought propagation relationship than autumn and winter. Drought propagation was driven by precipitation in the HURB, YARB, SEB, and PRB; soil moisture and precipitation were drivers in the HARB and YRB; moreover, soil moisture and potential evapotranspiration were drivers in the SLRB and CB. This study improves the understanding of the characteristics and drivers of drought propagation in droughts in river basins. Therefore, this study might provide a reference to reveal the mechanism of drought.
1. Introduction
Drought is recognized as a natural environmental disaster [1,2,3,4]. Meanwhile, drought also has a negative impact on the environment, ecology, agriculture, and social economy of a region [5,6,7,8,9]. Compared with other types of disasters, drought is unpredictable, difficult to defend, and has a wide range of influencing characteristics [5,9,10,11,12]. Therefore, drought has more serious uncertainty [13], destructiveness [5], and crypticity [14] than other types of disasters in the natural environment. Moreover, drought also has an important impact on the ecological environment at basin scales [2,12,15].
Based on the origin and impact, drought is also divided into many types, such as meteorological drought, hydrological drought [16], agricultural drought [1], vegetation drought [9], groundwater drought [17], and socioeconomic drought [18]. Drought transmission can also be divided into many types [5,16]. Therefore, meteorological, agricultural, and hydrological droughts are early development drought types in nature [5]. Meanwhile, meteorological drought usually occurs when a lack of precipitation appears in a region for a period of time [5,19], while hydrological drought is defined as inadequate surface and subsurface water resource conditions occurring in a region [5,20]. At present, droughts are usually described by the drought index in many studies [1,5,14,21]. For example, Vicente-Serrano et al. [22] employed a standardized precipitation evapotranspiration index to explore global vegetation response time to meteorological drought; Asadi Zarch, et al. [23] used a standardized precipitation index (SPI) to investigate global warming and global drought change trends; Wu et al. [24] used a nonparametric standardized runoff index to investigate hydrological drought risk in the Loess Plateau; Ding et al. [16] used a standardized runoff index (SRI), standardized precipitation evapotranspiration index and the Palmer drought severity index to analyze the relationship among meteorological, agricultural and hydrological drought in China. The SLRB (Songhua and Liaohe River Basin), HARB (Haihe River Basin), HURB (Huaihe River Basin), YRB (Yellow River Basin), YARB (Yangtze River Basin), PRB (Pearl River Basin), SEB (Southeast Basin), SWB (Southwest Basin), and CB (Continental Basin) were analyzed in this study. Meanwhile, the simulated and observed datasets have also been widely used in the calculation of drought indices in many studies [9,13,23,25,26]. For example, Vicente-Serrano et al. [22] used the Climatic Research Unit (CRU) precipitation and potential evapotranspiration dataset to compute the global SPEI; Peel et al. [27] also used the CRU precipitation and temperature dataset to divide global climate regions; Zhang et al. [28] also used the CRU precipitation and potential evapotranspiration dataset to compute the Palmer drought severity index in China. Ding et al. [16] used a runoff dataset to compute the SRI in China. Therefore, the dataset could be reliably used to compute drought because the dataset has a wide application and a high accuracy [16,22,27,29].
At present, there are many drought-related studies [15,30,31,32,33]. Some studies have focused on the effects of drought. For example, Zhou et al. [2] and Xu et al. [14] analyzed the vegetation response time and the degree of SPEI; Huang et al. [12] investigated the propagation time from meteorological to hydrological drought in the Wei River Basin; Guo et al. [34] also investigated the propagation thresholds from meteorological to hydrological drought in the Wei River Basin. Some studies have focused on drought change. For example, Yao et al. [35] analyzed the drought change trend during 1961–2013 in China; Yao et al. [36] also analyzed the drought change trend in the future across China. Some studies have focused on developing new drought indices. For example, Wang et al. [37] developed a new drought index of the standardized precipitation evapotranspiration runoff and estimated its applicability in Sichuan Province; Zhang et al. [38] also developed a new framework to monitor global multicategory and multiscalar drought.
However, most of these previous studies on drought characteristics were about trend frequency and risk [33] and the evaluation of drought propagation characteristics is still relatively rare. Therefore, the objective of this study was to explore the drought propagation relationship due to meteorological and hydrological droughts in different seasons across nine river basins of China. The aim of this study was as follows: (1) to investigate the propagation time and relationship of meteorological and hydrological drought in the main river basins of China; (2) to analyze the relationship between meteorological and hydrological drought on an annual scale; (3) to quantitatively analyze the main drivers of drought propagation in China; and (4) based on the results of this study, to explain the reasons for the difference in drought propagation in China. The findings could also be used to understand the propagation from meteorological to hydrological drought and the propagation differences among different river drains.
2. Data and Methods
2.1. Study Area
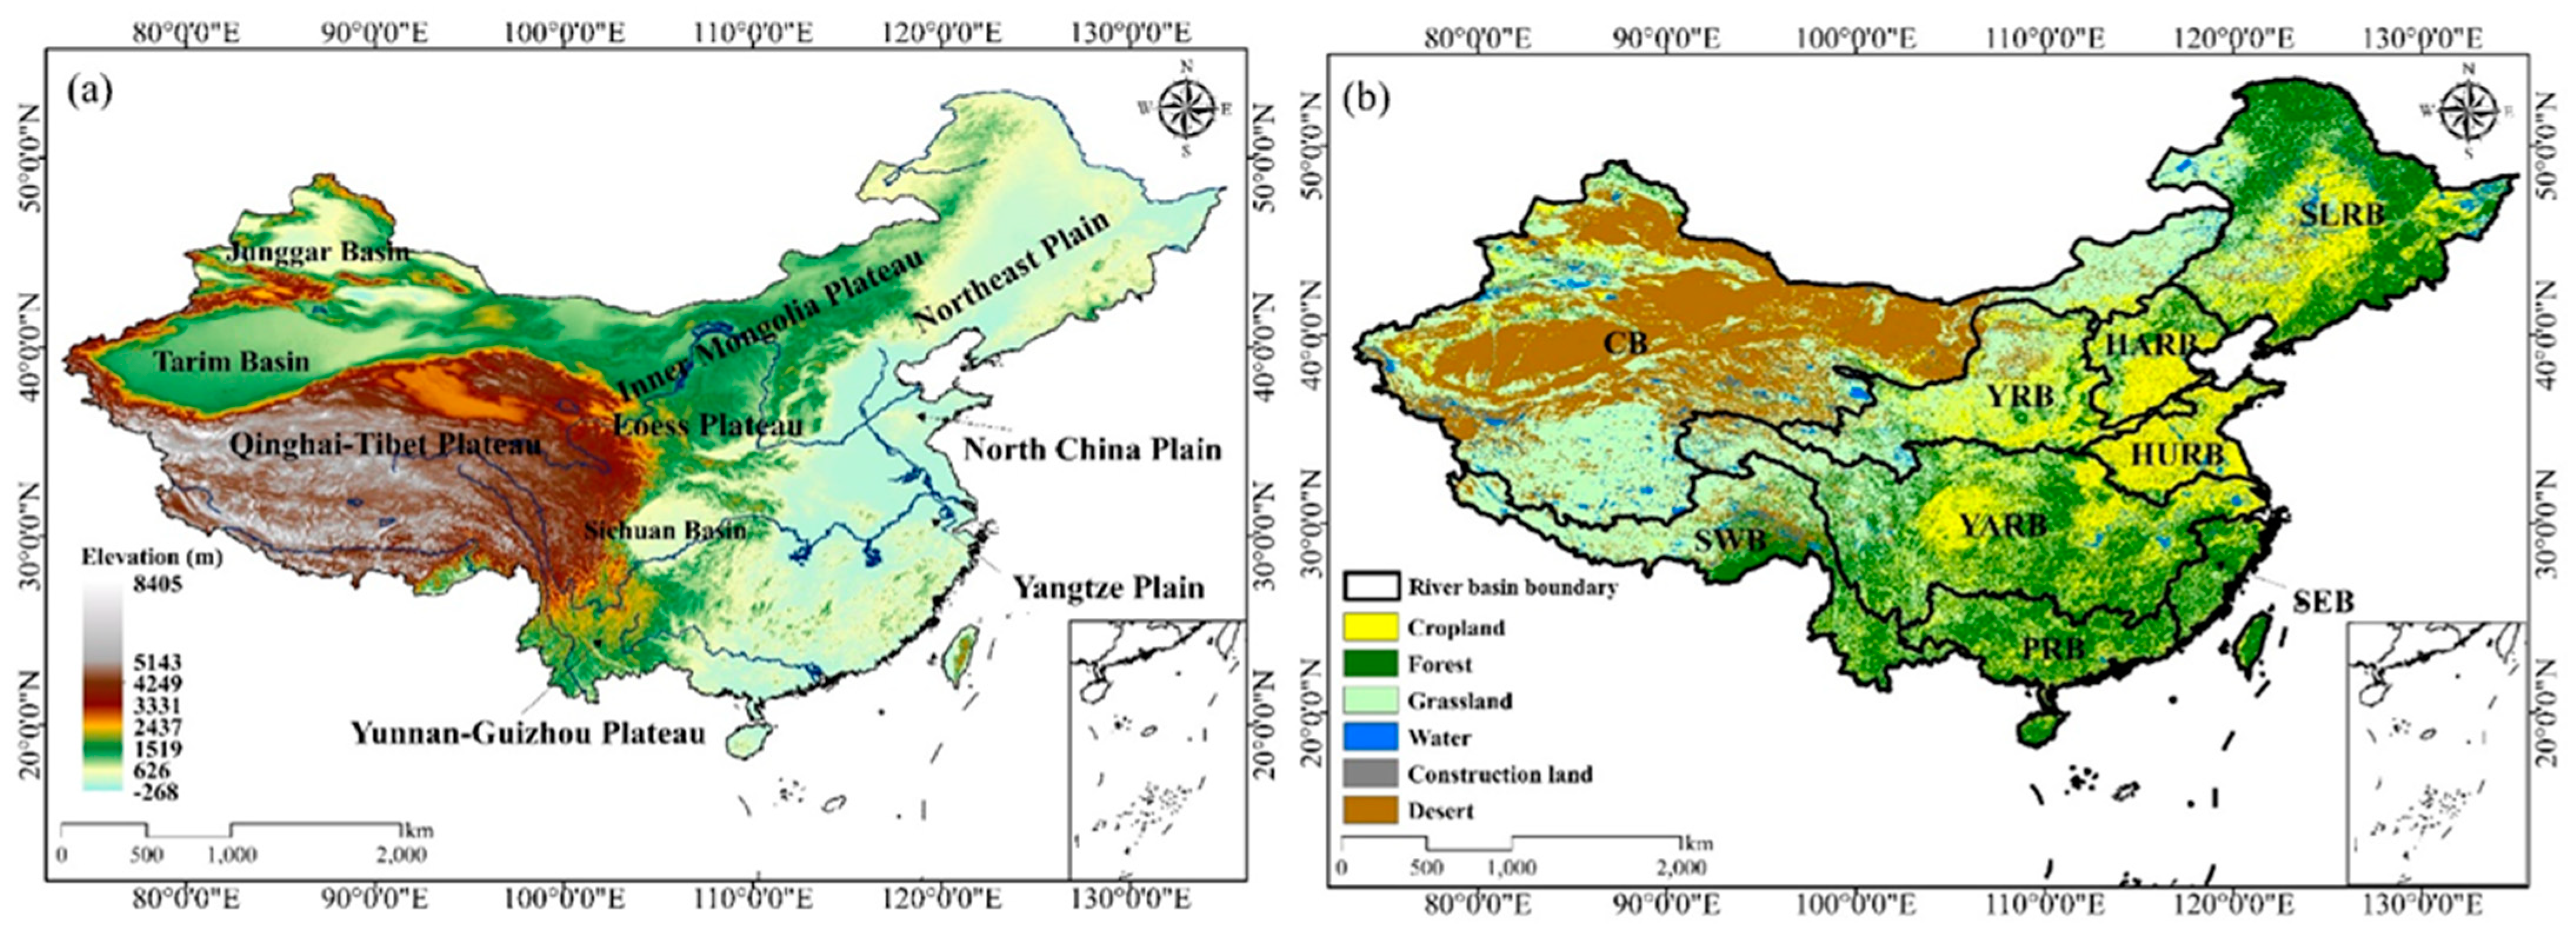
China has a diverse climate because it has an enormous expansion and complex terrain [36]. Its land and ocean areas are approximately 9.63 × 10⁶ km2 and 3 × 10⁶ km2, respectively [39]. From Figure 1, The major rivers in China include the Songhua River, Liaohe River, Haihe River, Huaihe River, Yellow River, Yangtze River, Pearl River, Tarim River, Yarlung Zangbo River, Salween River, and Lancang River [10,15,40,41,42]. The main river basins in China include the Songhua and Liaohe River Basins (SLRB), Haihe River Basin (HARB), Huaihe River Basin (HURB), Yellow River Basin (YRB), Yangtze River Basin (YARB), Pearl River Basin (PRB), Southwest Basin (SWB), Continental Basin (CB) and Southeast Basin (SEB).
2.2. Data Sources
In this study, hydrological and meteorological drought were computed based on runoff and P (precipitation) in China, respectively [3,16,21]. The runoff data were provided by Atmospheric and Climate Sciences [43]. The runoff dataset had a monthly temporal resolution and a 0.5° × 0.5° spatial resolution during 1901–2014, globally [43]. Based on observational data (including antecedent precipitation, temperature, and streamflow), Ghiggi et al. [43] used a machine learning algorithm to predict monthly runoff. Moreover, Ghiggi et al. [43] also compared and checked the simulation data of a runoff dataset and different global hydrological models. The results showed that the runoff dataset had a higher accuracy and reliability than advanced global hydrological models. Many studies have also proven the reliability of GRUN runoff data [44,45]. The runoff dataset was also applied in similar drought studies, such as Ding et al. [16]. (https://figshare.com/articles/GRUN_Global_Runoff_Reconstruction/9228176, accessed date: 21 May 2022).
The Climatic Research Unit precipitation data were obtained from the Climatic Research Unit (CRU) of the British Atmospheric Data Center [29]. Many studies have also proven the reliability of CRU precipitation data [44,45]. This CRU dataset was interpolated from the meteorological station’s daily observation data globally [46]. Therefore, CRU precipitation data were used in this study. The CRU precipitation data had a monthly temporal resolution and a 0.5° × 0.5° spatial resolution during 1901–2014, globally [26,29,46]. (http://mpimet.mpg.de/cdi, accessed date: 21 May 2022).
SM (soil moisture), PET (potential evapotranspiration), and P were used to analyze the drought propagation attribution in China. The SM dataset used was the ERA-Interim reanalysis product provided by the European Centre for Medium-Range Weather Forecasts (ECMWF) [16]. The SM dataset had monthly a temporal resolution and a 1.25° × 0.94° spatial resolution during 1979–2016, globally. We also used the linear interpolation method to change the spatial resolution to 0.5° × 0.5° [47]. The PET dataset was also provided by the Climatic Research Unit. The PET dataset had monthly temporal resolution and a 0.5° × 0.5° spatial resolution during 1901–2014, globally [11,22]. Because the time series of the SM dataset (1979–2016) was different from that of the other datasets (1901–2014), attribution analysis of drought propagation was based on the overlapping time series of different datasets (1979–2014) in this study.
2.3. Methodology
The use of standardized drought indices has been increasingly witnessed in the meteorological and hydrological community for drought monitoring and impact assessment [20,23,24,43] due to the simplicity, standardized nature, and flexibility of use in time and space [48]. In this study, SPI and SRI are used to represent meteorological drought and hydrological drought, respectively. Both SPI and SRI can describe the characteristics of drought at different timescales, and the standardized index calculation process is relatively simple. The Pearson correlation analysis and Lindeman–Merenda–Gold (LMG) method are used to analyze the drought propagation characteristics.
2.3.1. Meteorological Drought Index: Standardized Precipitation Index
The SPI has been widely used in meteorological drought studies [23,49]. The SPI was computed using the monthly P data of a region [5,49,50]. The P time series used gamma distribution probability to fit into the SPI computational process [49]. Meanwhile, the gamma distribution was defined as follows:
where α > 0 is a shape parameter, β > 0 is a scale parameter, is the P amount, and is the gamma distribution formula.
The approximate solution can be obtained as follows:
where , = 2.515517, = 0.802853, = 0.010328, = 1.432788 and = 0.189269, = 0.001308.
2.3.2. Hydrological Drought Index: Standardized Runoff Index
The SRI has also been widely used in hydrological drought studies [20,24]. The computational process and principles of SRI were similar to those of SPI [24]. However, the runoff time series uses the log-normal distribution probability to fit into the SRI computational process [16,36]. Meanwhile, the log-normal distribution was defined as follows:
where α > 0 is a shape parameter, β > 0 is a scale parameter, is the P amount, and is the log-normal distribution formula.
2.3.3. Drought Propagation Relationship
In this study, Pearson correlation analysis [51] was used to describe the drought propagation relationship from meteorological (SPIk) to hydrological (SRI1) drought in different river basins [11,25,52] (k shows the accumulation). Many studies also used the accumulation period with the maximum Pearson correlation coefficient to define drought propagation time between SPIk and SRI1 [14,19,53]. The maximum correlation coefficient of the Pearson method can effectively reflect the drought propagation relationship among different drought types and define the drought propagation time [6,14,19,52,53]. Then, we used this method to describe the relationship and time of drought propagation. The cross-wavelet transform method was used to show the effect of meteorological drought at different timescales on hydrological drought and to explore the detailed relationship [9,19]. For each river basin, the mean precipitation and runoff values were computed into the SPI and SRI, respectively. Cross-wavelet transform was also applied to the relationship between the SPI and SRI on an annual scale [17,24].
2.3.4. Drivers of Drought Propagation
In this study, the relative importance of drivers was quantified using the LMG method in the propagation from meteorological to hydrological drought [16,54]. The relative importance refers to quantifying the contribution of individual regression factors to multiple regression models. The relative contribution rates of each factor to the droughts in the model were then calculated by averaging all of the possible marginal contributions to the variables and by decomposing the dependent variable variance. Finally, the Pearson coefficient correlation was used to evaluate the correlation between droughts and factors. Regression variables and quantifying the relative importance of the explanatory variable can be avoided using LMG in many studies [54,55,56]. Therefore, the LMG method can quantify the influence degree of drought factors with PET, PRE, and SM. Based on relative importation, we analyzed the distribution characteristics of influencing factors on drought in different climate regions. Based on these advantages, the relative importance of P, SM and PET was quantified using the LMG method in the propagation from meteorological to hydrological drought. The formula of LMG was defined as follows:
where x is the regression variable, S is the set of variables that were entered into the model, and R2 is the goodness of fit of the model. Therefore, the LMG is the expectation of the marginal contribution of regression variable xj in all sequences.
3. Results
3.1. Long Time Series Drought Propagation
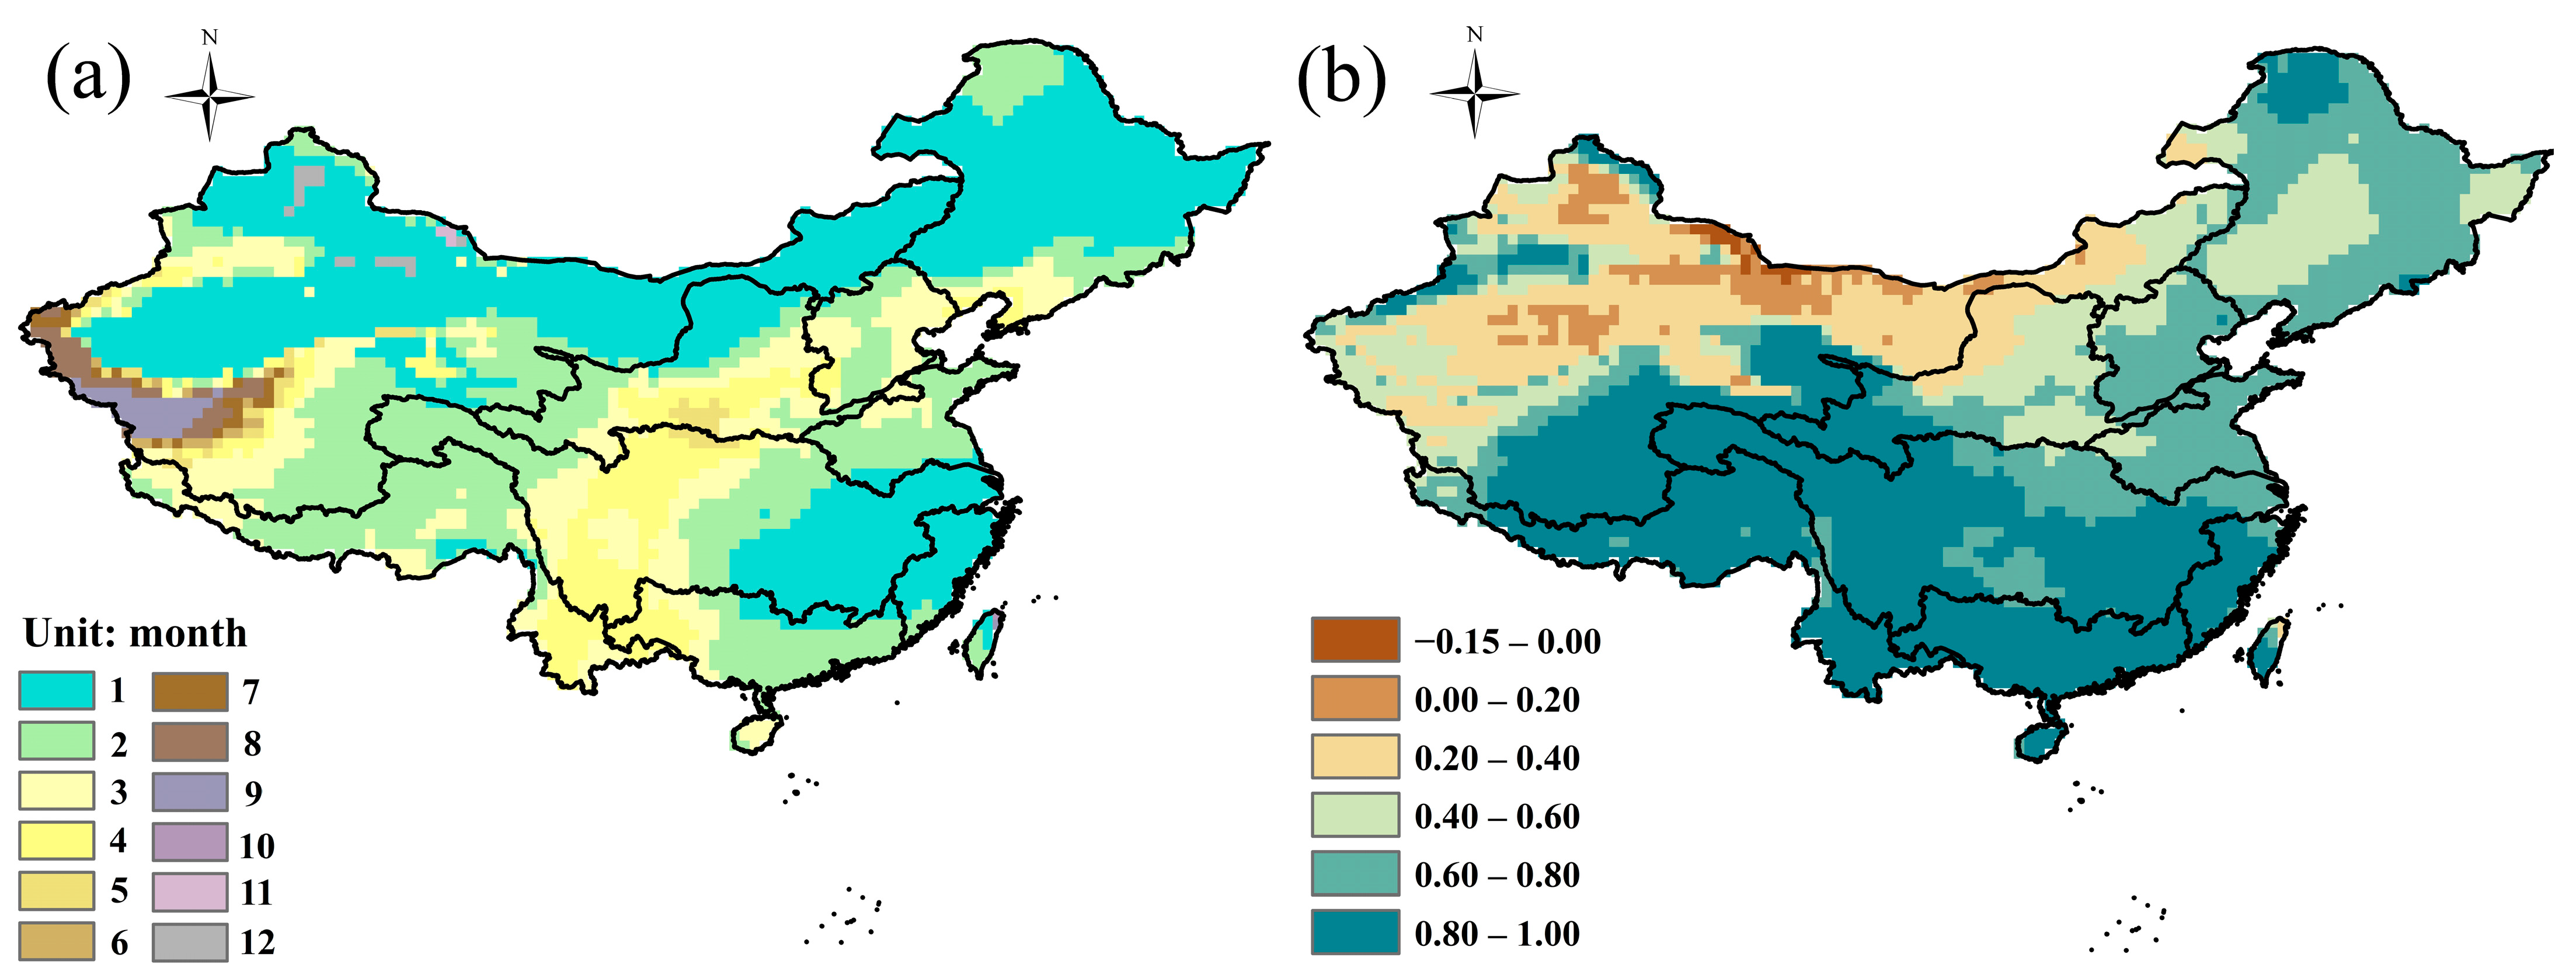
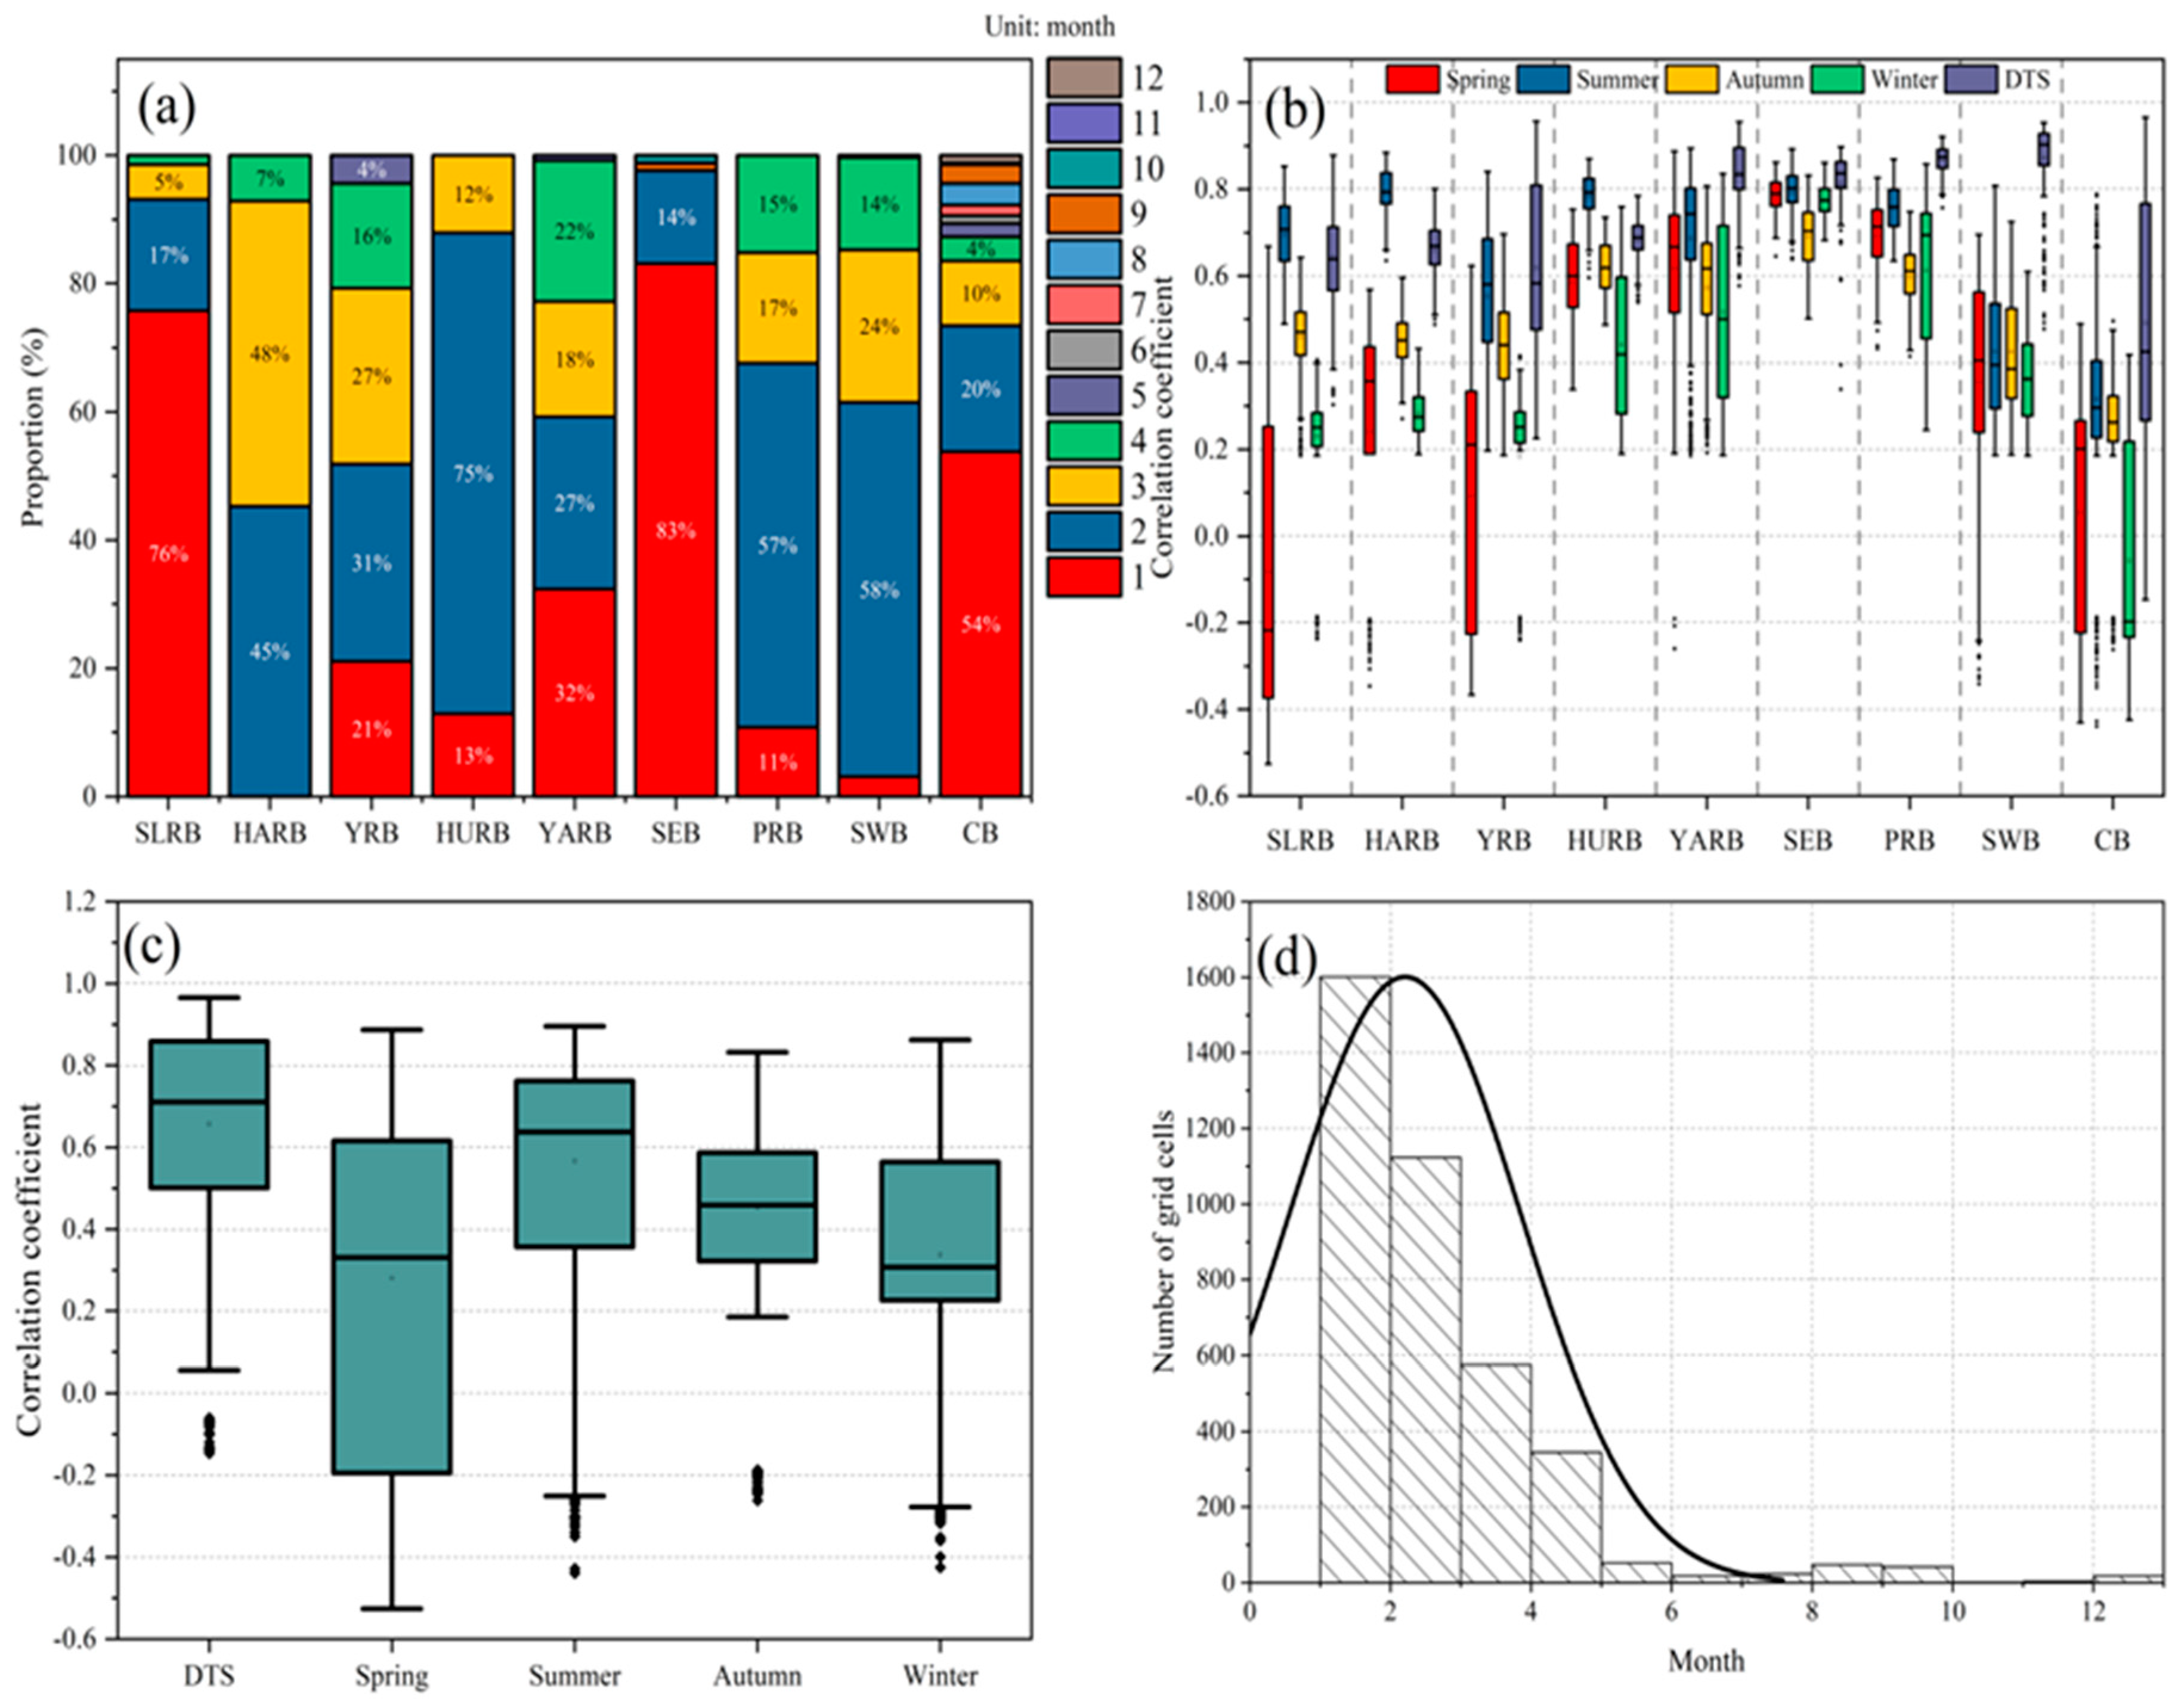
Based on the drought correlation analysis, the characteristics of the propagation from meteorological to hydrological drought were investigated [57]. From Figure 2a, we found that the propagation time was mostly 1–2 months in 70.79% of the areas of China; the drought propagation time of 1–2 months was mainly distributed in the SLRB, HARB, HURB, northern YRB, northern CB, western YARB, western PRB, and eastern SWB. The drought propagation time was 3–4 months in 23.93% of the areas of China; the drought propagation time of 3–4 months was mainly distributed in the southern YRB, western YARB, western PRB, eastern SEB, and western CB. The drought propagation time was 6–9 months in 5.28% of the areas of China; the propagation time of 6–9 months was mainly distributed in the western CB. As shown in Figure 3a, the SLRB (76% areas), SEB (83% areas) and CB (54% areas) mainly had 1-month drought propagation time; the HURB (75% areas), PRB (57% areas) and SWB (58% areas) mainly had a 2-month drought propagation time; the drought propagation times were mainly 2 (45% areas) and 3 (48% areas) months in the HARB; the drought propagation times were mainly 1 (21% areas), 2 (31% areas) and 3 (27% areas) months in the YRB; the drought propagation times were mainly 1 (32% areas), 2 (27% areas) and 4 (22% areas) months in the YARB.
From Figure 2b, we found that the propagation relationship generally showed higher and lower correlation coefficients from meteorological to hydrological drought in northwestern and southern China, respectively. As shown in Figure 3b, the different timescales (DTS) correlation coefficients had higher values (approximately 0.80–0.90) in the YARB, SEB, PRB, and SWB; the DTS correlation coefficient had lower values (approximately 0.30–0.80) in the CB; and the DTS correlation coefficient showed higher (approximately 0.80–1.00) and lower (approximately −0.15–0.40) values in the southern and northern CB, respectively. However, the DTS correlation coefficient was between 0.50 and 0.80 in the SLRB, HARB, YRB, and HURB. The DTS correlation coefficient had higher (approximately 0.60–1.00) and lower (approximately 0.20–0.60) values in the eastern and western regions, respectively. In Figure 3b, in general, there were strong drought propagation relationships in different river basins of China in summer and autumn. However, there were weaker propagation relationships in spring and winter. In summer, the correlation coefficient (approximately 0.45–0.85) showed a strong propagation relationship from meteorological to hydrological drought for the SLRB, HARB, YRB, HURB, YARB, SEB, and PRB; however, the correlation coefficient (approximately 0.25–0.50) showed a weak propagation relationship for the SWB and CB (western China). In autumn, the correlation coefficient (approximately 0.50–0.75) showed a strong propagation relationship from meteorological to hydrological drought for the HURB, YARB, SEB, and PRB (southeastern China); however, the correlation coefficient (approximately 0.20–0.50) showed a weak propagation relationship for the SLRB, HARB, YRB, SWB, and CB. In spring and winter, the correlation coefficient showed a weak propagation relationship from meteorological to hydrological drought for the SLRB, HARB, YRB, and CB (northern China); however, the correlation coefficient showed a strong propagation relationship for the HURB, YARB, SEB, PRB and SWB (southern China). Figure 3c,d show the statistical results of the correlation coefficient and propagation time in mainland China. It is seen in Figure 3c,d, that the relationship between meteorological drought and hydrological drought was stronger in summer and autumn than in spring and winter. The drought propagation time was mainly 1–3 months. Meanwhile, the propagation relationship between meteorological and hydrological drought was shown to be stronger (correlation coefficient about 0.50–0.85) in different timescales.
In general, meteorological to hydrological drought had a weak propagation relationship across western China in summer, and northern China in spring and winter; moreover, meteorological to hydrological drought had a strong propagation relationship across southeastern China in autumn, and southern China in spring and winter. Moreover, the propagation relationship was similar in summer, autumn, and winter across the SLRB, HARB, and YRB; the correlation coefficient was a higher level in summer; however, the correlation coefficient was a lower level in winter across the SLRB, HARB, and YRB.
3.2. Annual Scale Drought Propagation
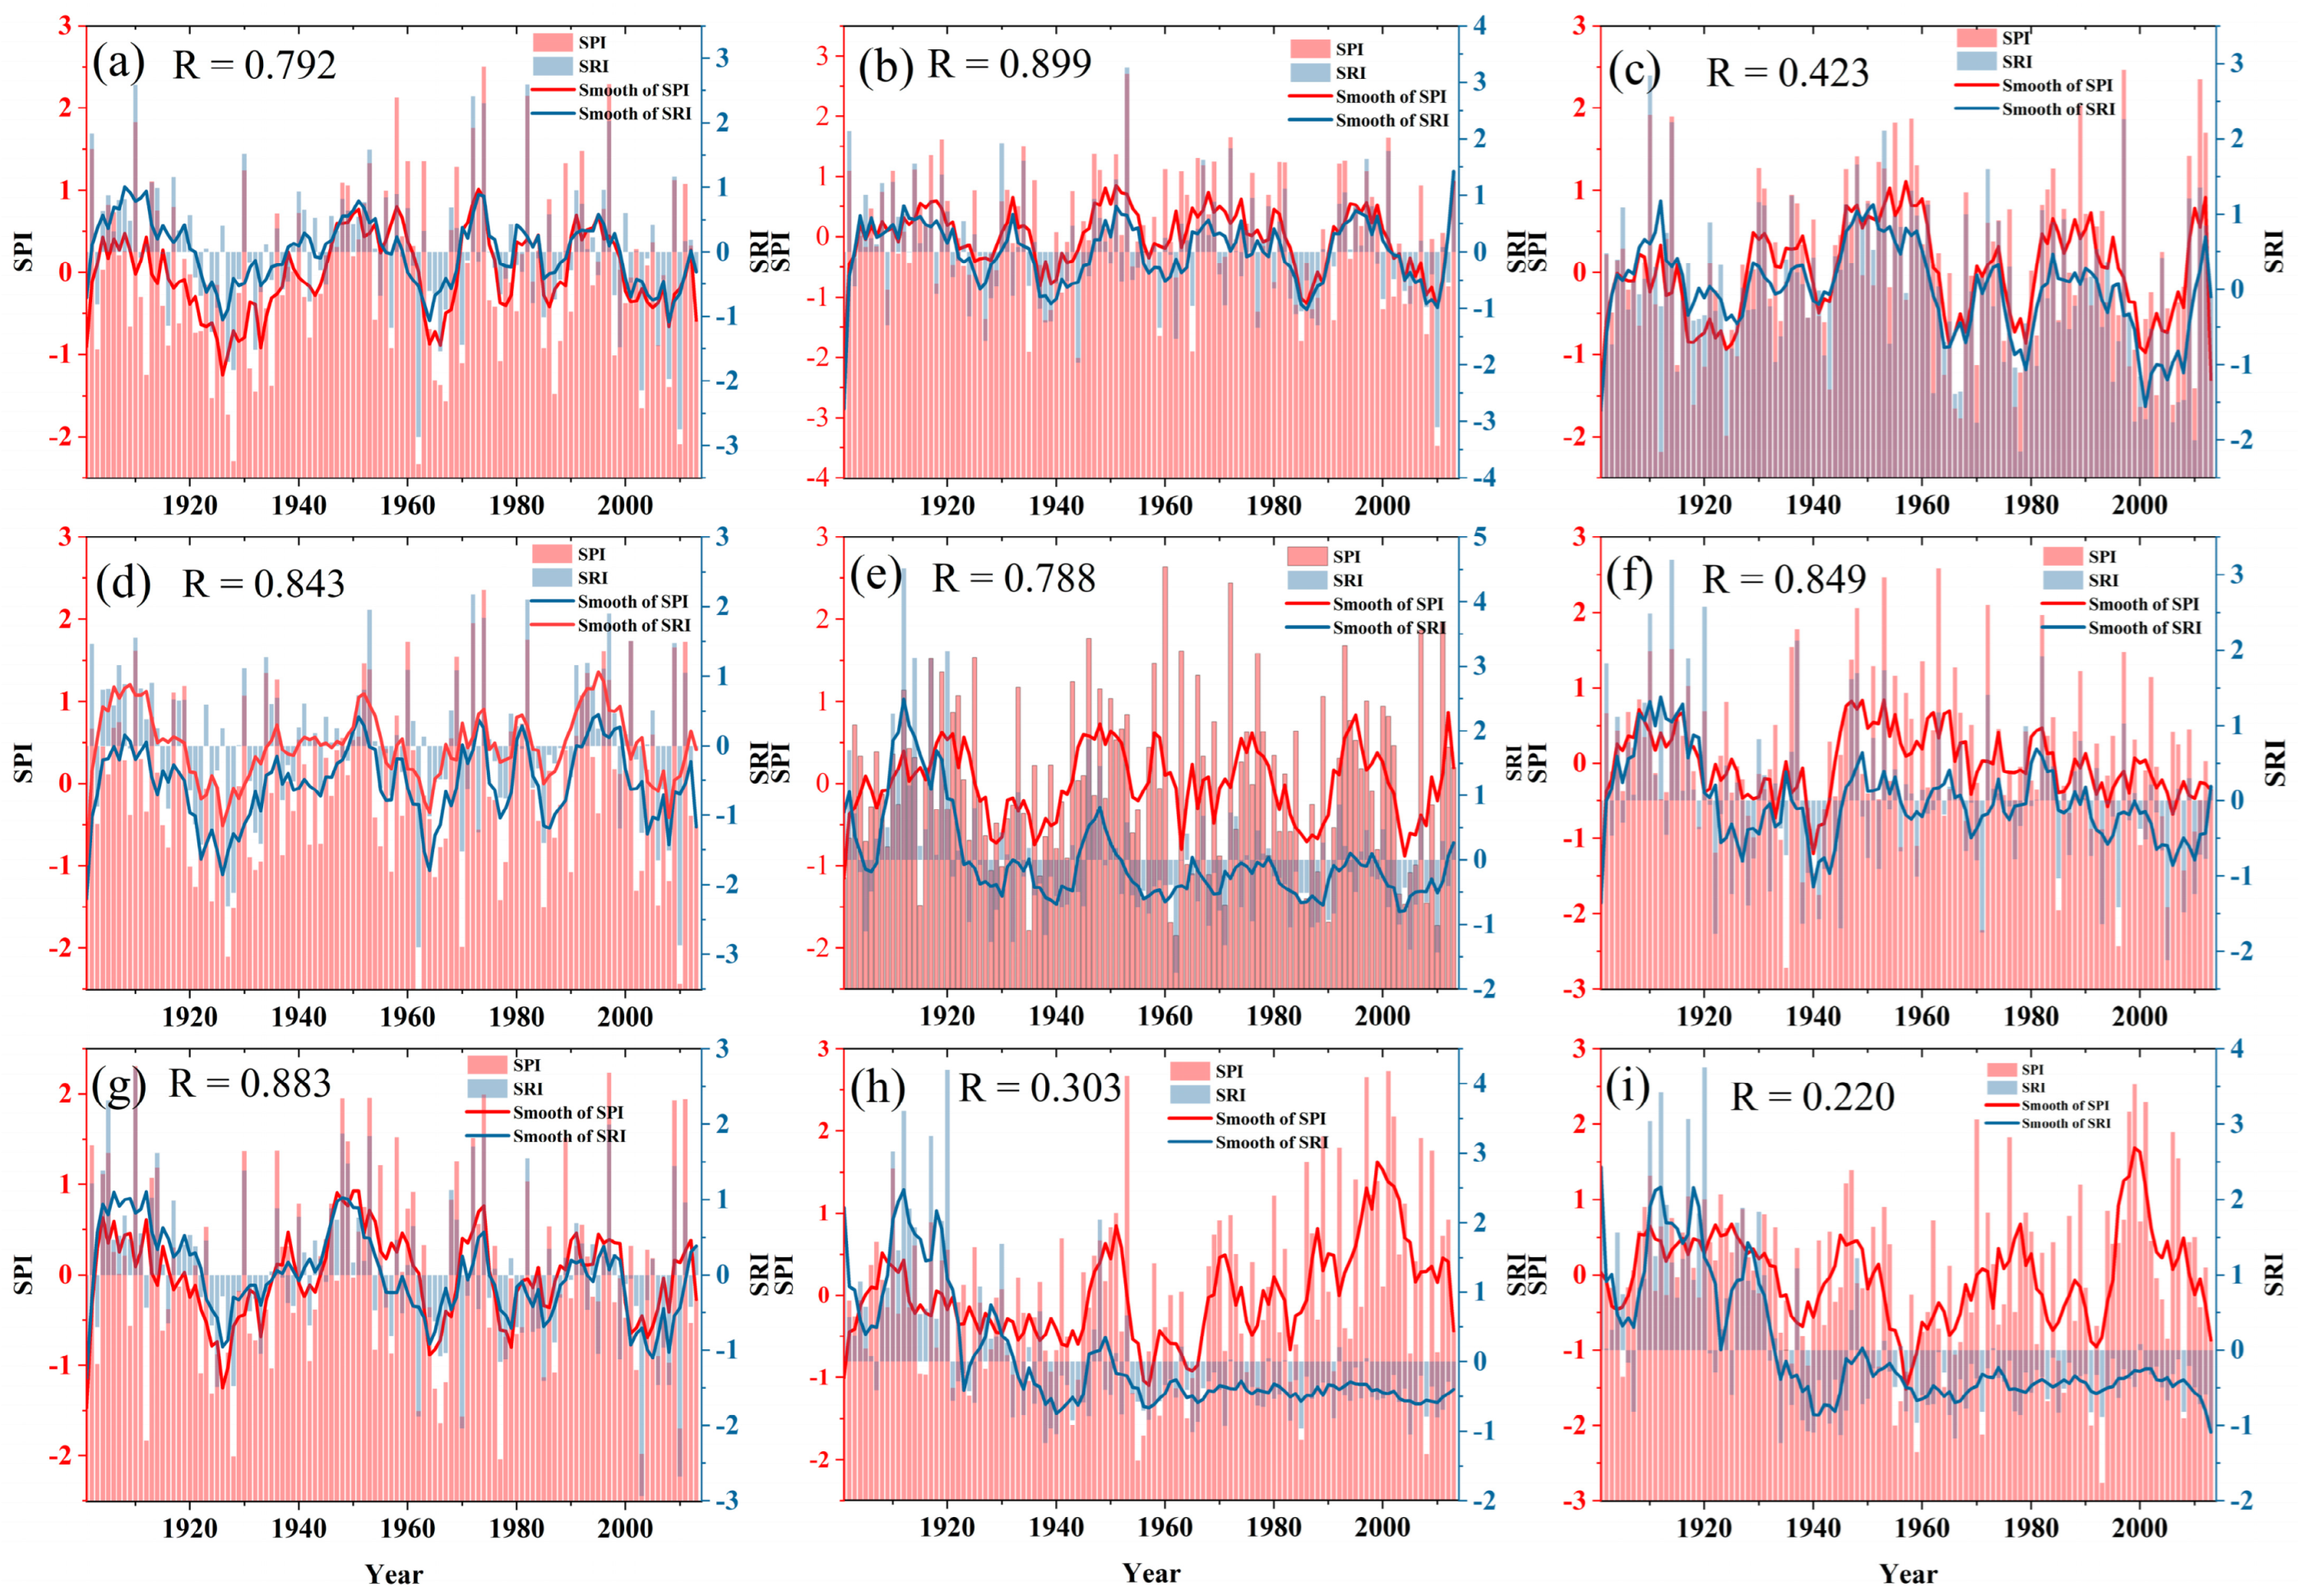
The change characteristics of meteorological and hydrological drought are compared on an annual scale in Figure 4. From Figure 4a–g, we found that meteorological and hydrological drought had the same change characteristics in the SLRB, HARB, YRB, HURB, YARB, SEB, and PRB. The correlation coefficients were 0.79, 0.90, 0.42, 0.84, 0.79, 0.85 and 0.88 in the SLRB, HARB, YRB, HURB, YARB, SEB, and PRB, respectively. Moreover, the SLRB, HARB, HURB, YARB, SEB, and PRB showed the same wave trough of SPI and SRI in 1925, 1965, and 1985. The SLRB, HARB, HURB, YARB, SEB, and PRB also showed the same peak-trough of SPI and SRI in 1950, 1970, and 1995. However, meteorological and hydrological droughts had different change characteristics in the SWB and CB (Figure 4h,i). The correlation coefficients were 0.30 and 0.22 in the SWB and CB, respectively. In general, the SPI time series showed an increasing trend from 1960 to 2000 across the SWB and CB. However, in general, the SRI time series showed a decreasing trend from 1910 to 1960, and a stable trend from 1960 to 2014.
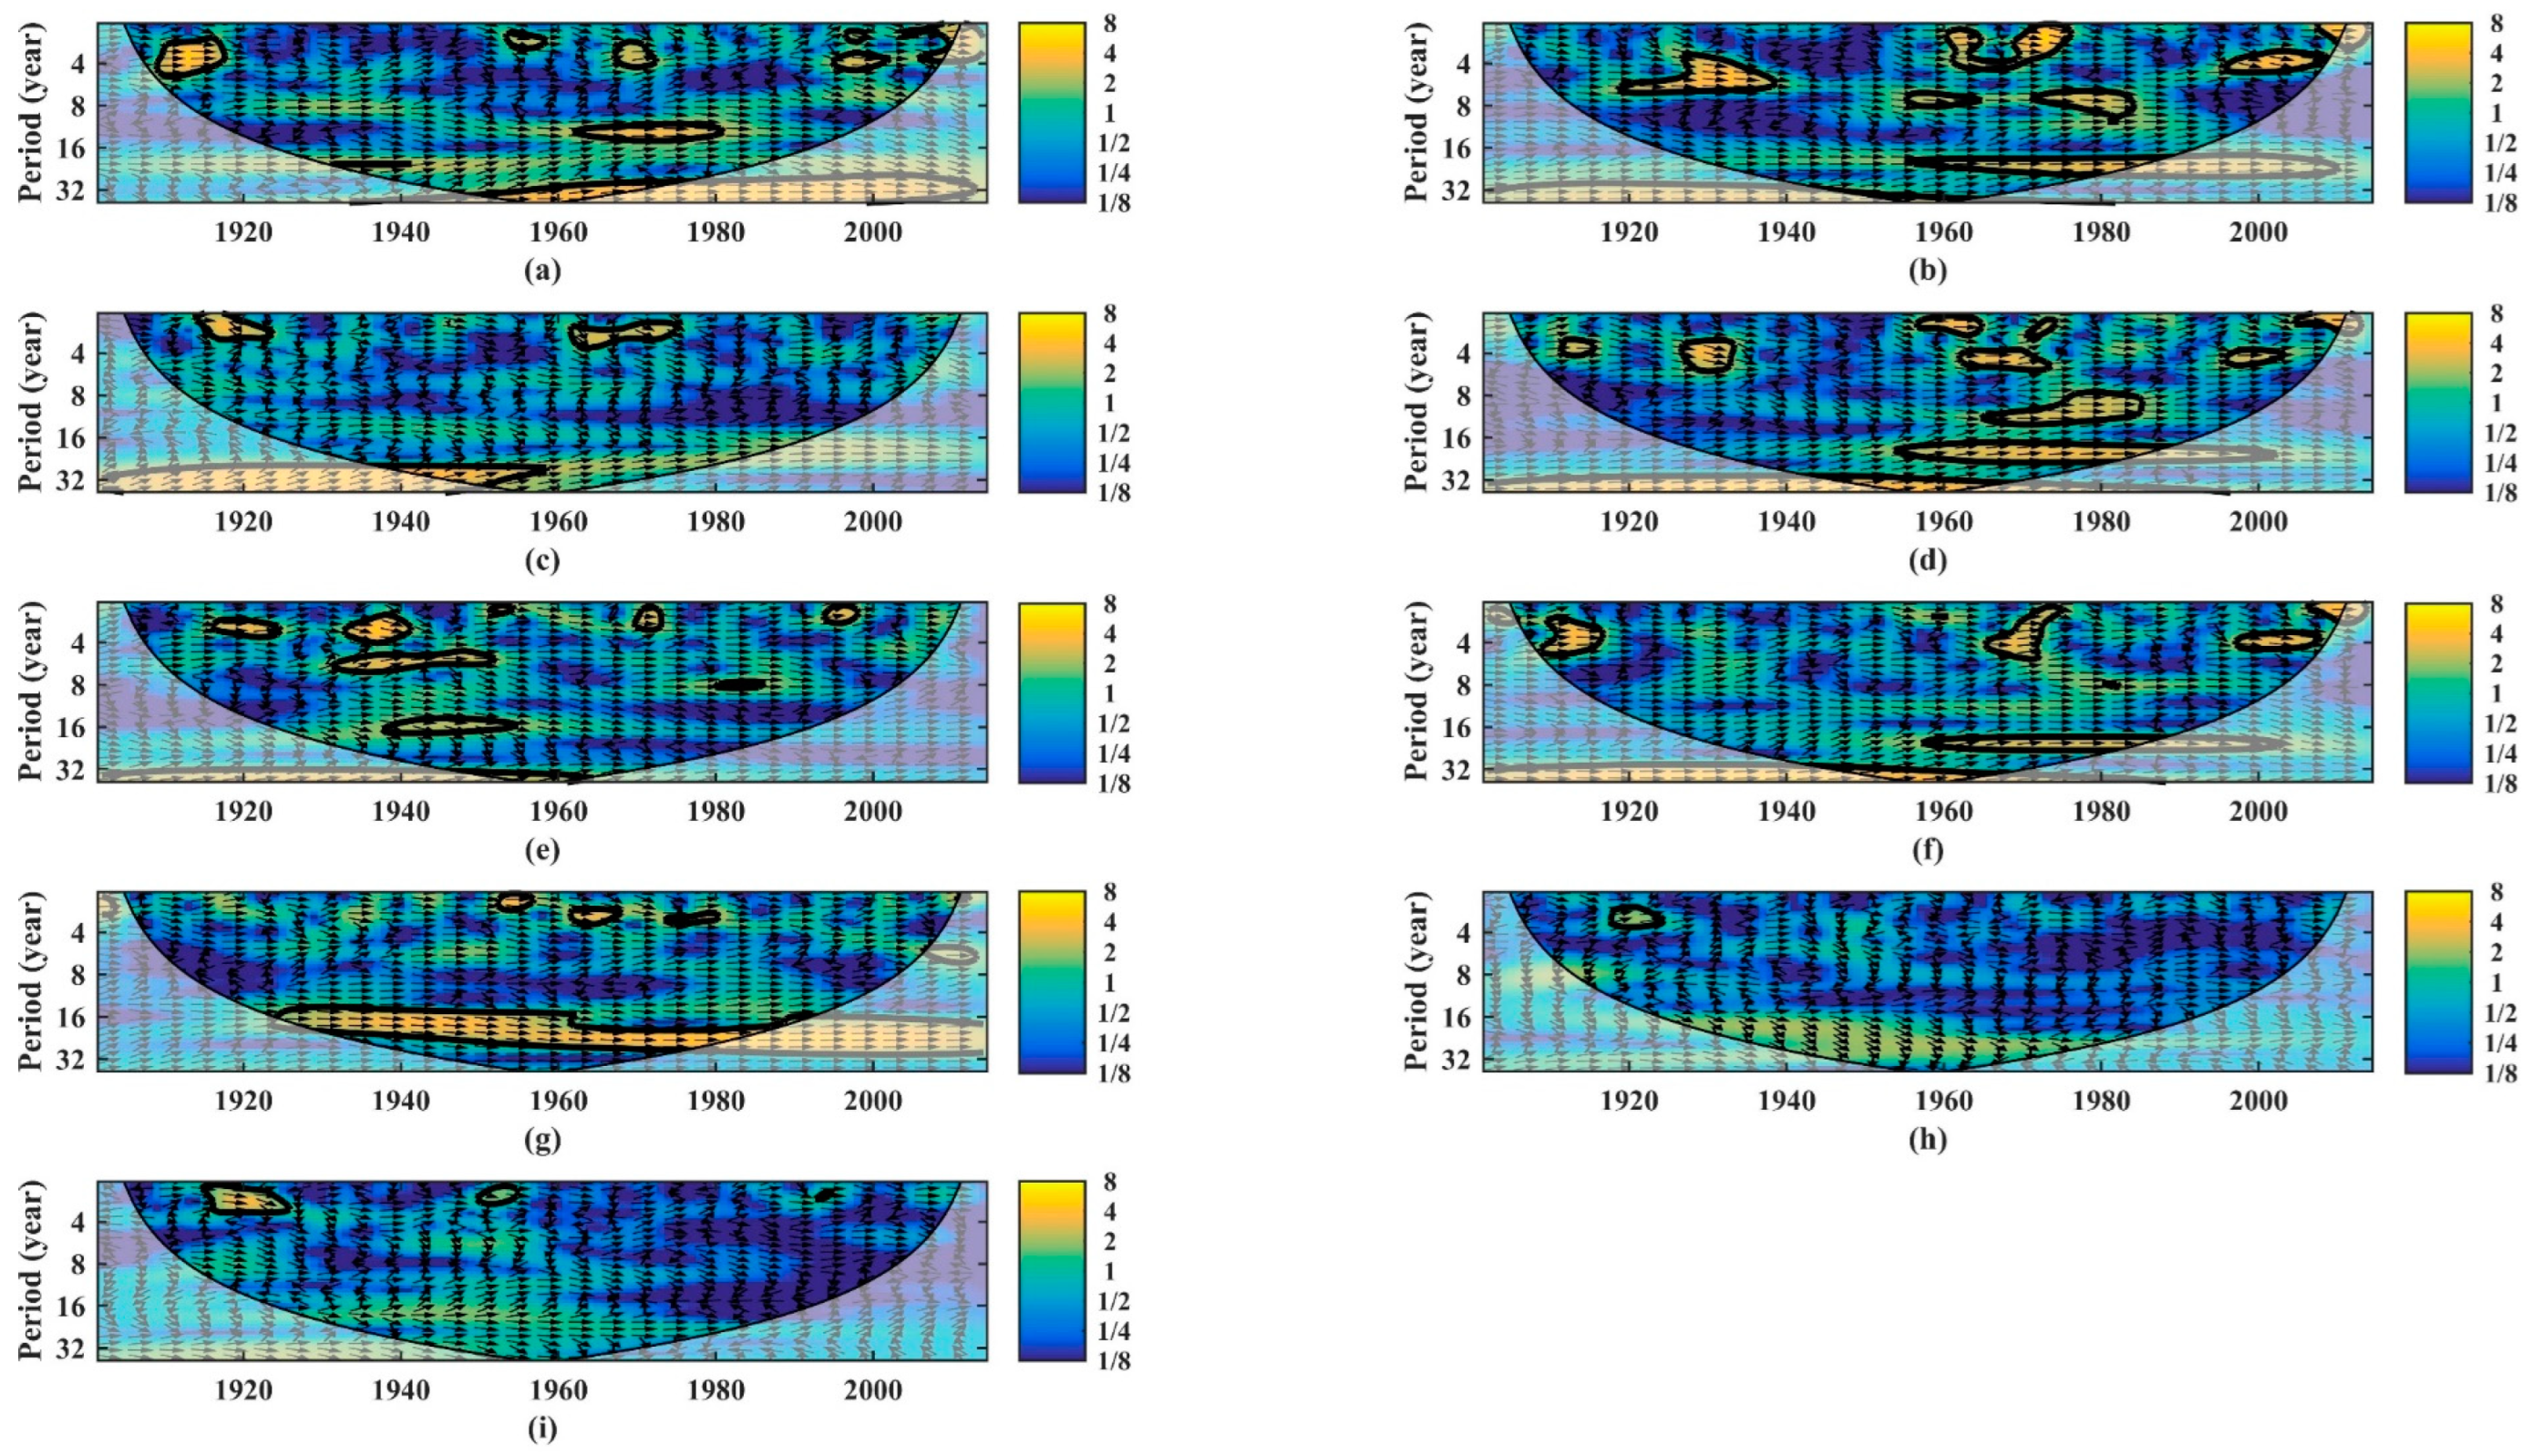
In Figure 5, in general, meteorological and hydrological drought had an evident positive relationship in the SLRB, HARB, YRB, HURB, YARB, SEB, and PRB; however, meteorological and hydrological drought had no significant positive relationship in the SWB and CB. The relationship varied among different river basins in China. The relationship of drought propagation occurred at a larger timescale (more than 32a) in the SLRB, HARB, YRB, HURB, YARB, and SEB. Moreover, the SLRB, HARB, YRB, HURB, YARB, and SEB had periodicity characteristics of larger timescales in 1935–2014, 1901–1980, 1901–1960, 1901–1995, 1901–1960, and 1901–1990, respectively. Drought propagation occurred on a large timescale (between 16a and 32a) in the HARB, HURB, YARB, SEB, and PRB. Moreover, the HARB, HURB, YARB, SEB, and PRB had periodicity characteristics of large timescales in 1955–2010, 1955–2005, 1940–1955, 1955–2005, and 1925–2014, respectively. In Figure 5b,d, the HURB and HURB had similar periodicity characteristics at different timescales; the relationship of drought propagation occurred on a small timescale (between 4a and 8a) in the HARB and HURB, which had a periodicity characteristic in 1920–1940 and 1995–2010; drought propagation occurred on a medium timescale (between 8a and 16a) in the HARB and HURB, which had periodicity characteristics in 1950–1985. Moreover, the SLRB also had a periodicity characteristic of a medium timescale (between 8a and 16a) during 1960–1980.
3.3. Attribution Analysis of Drought Propagation
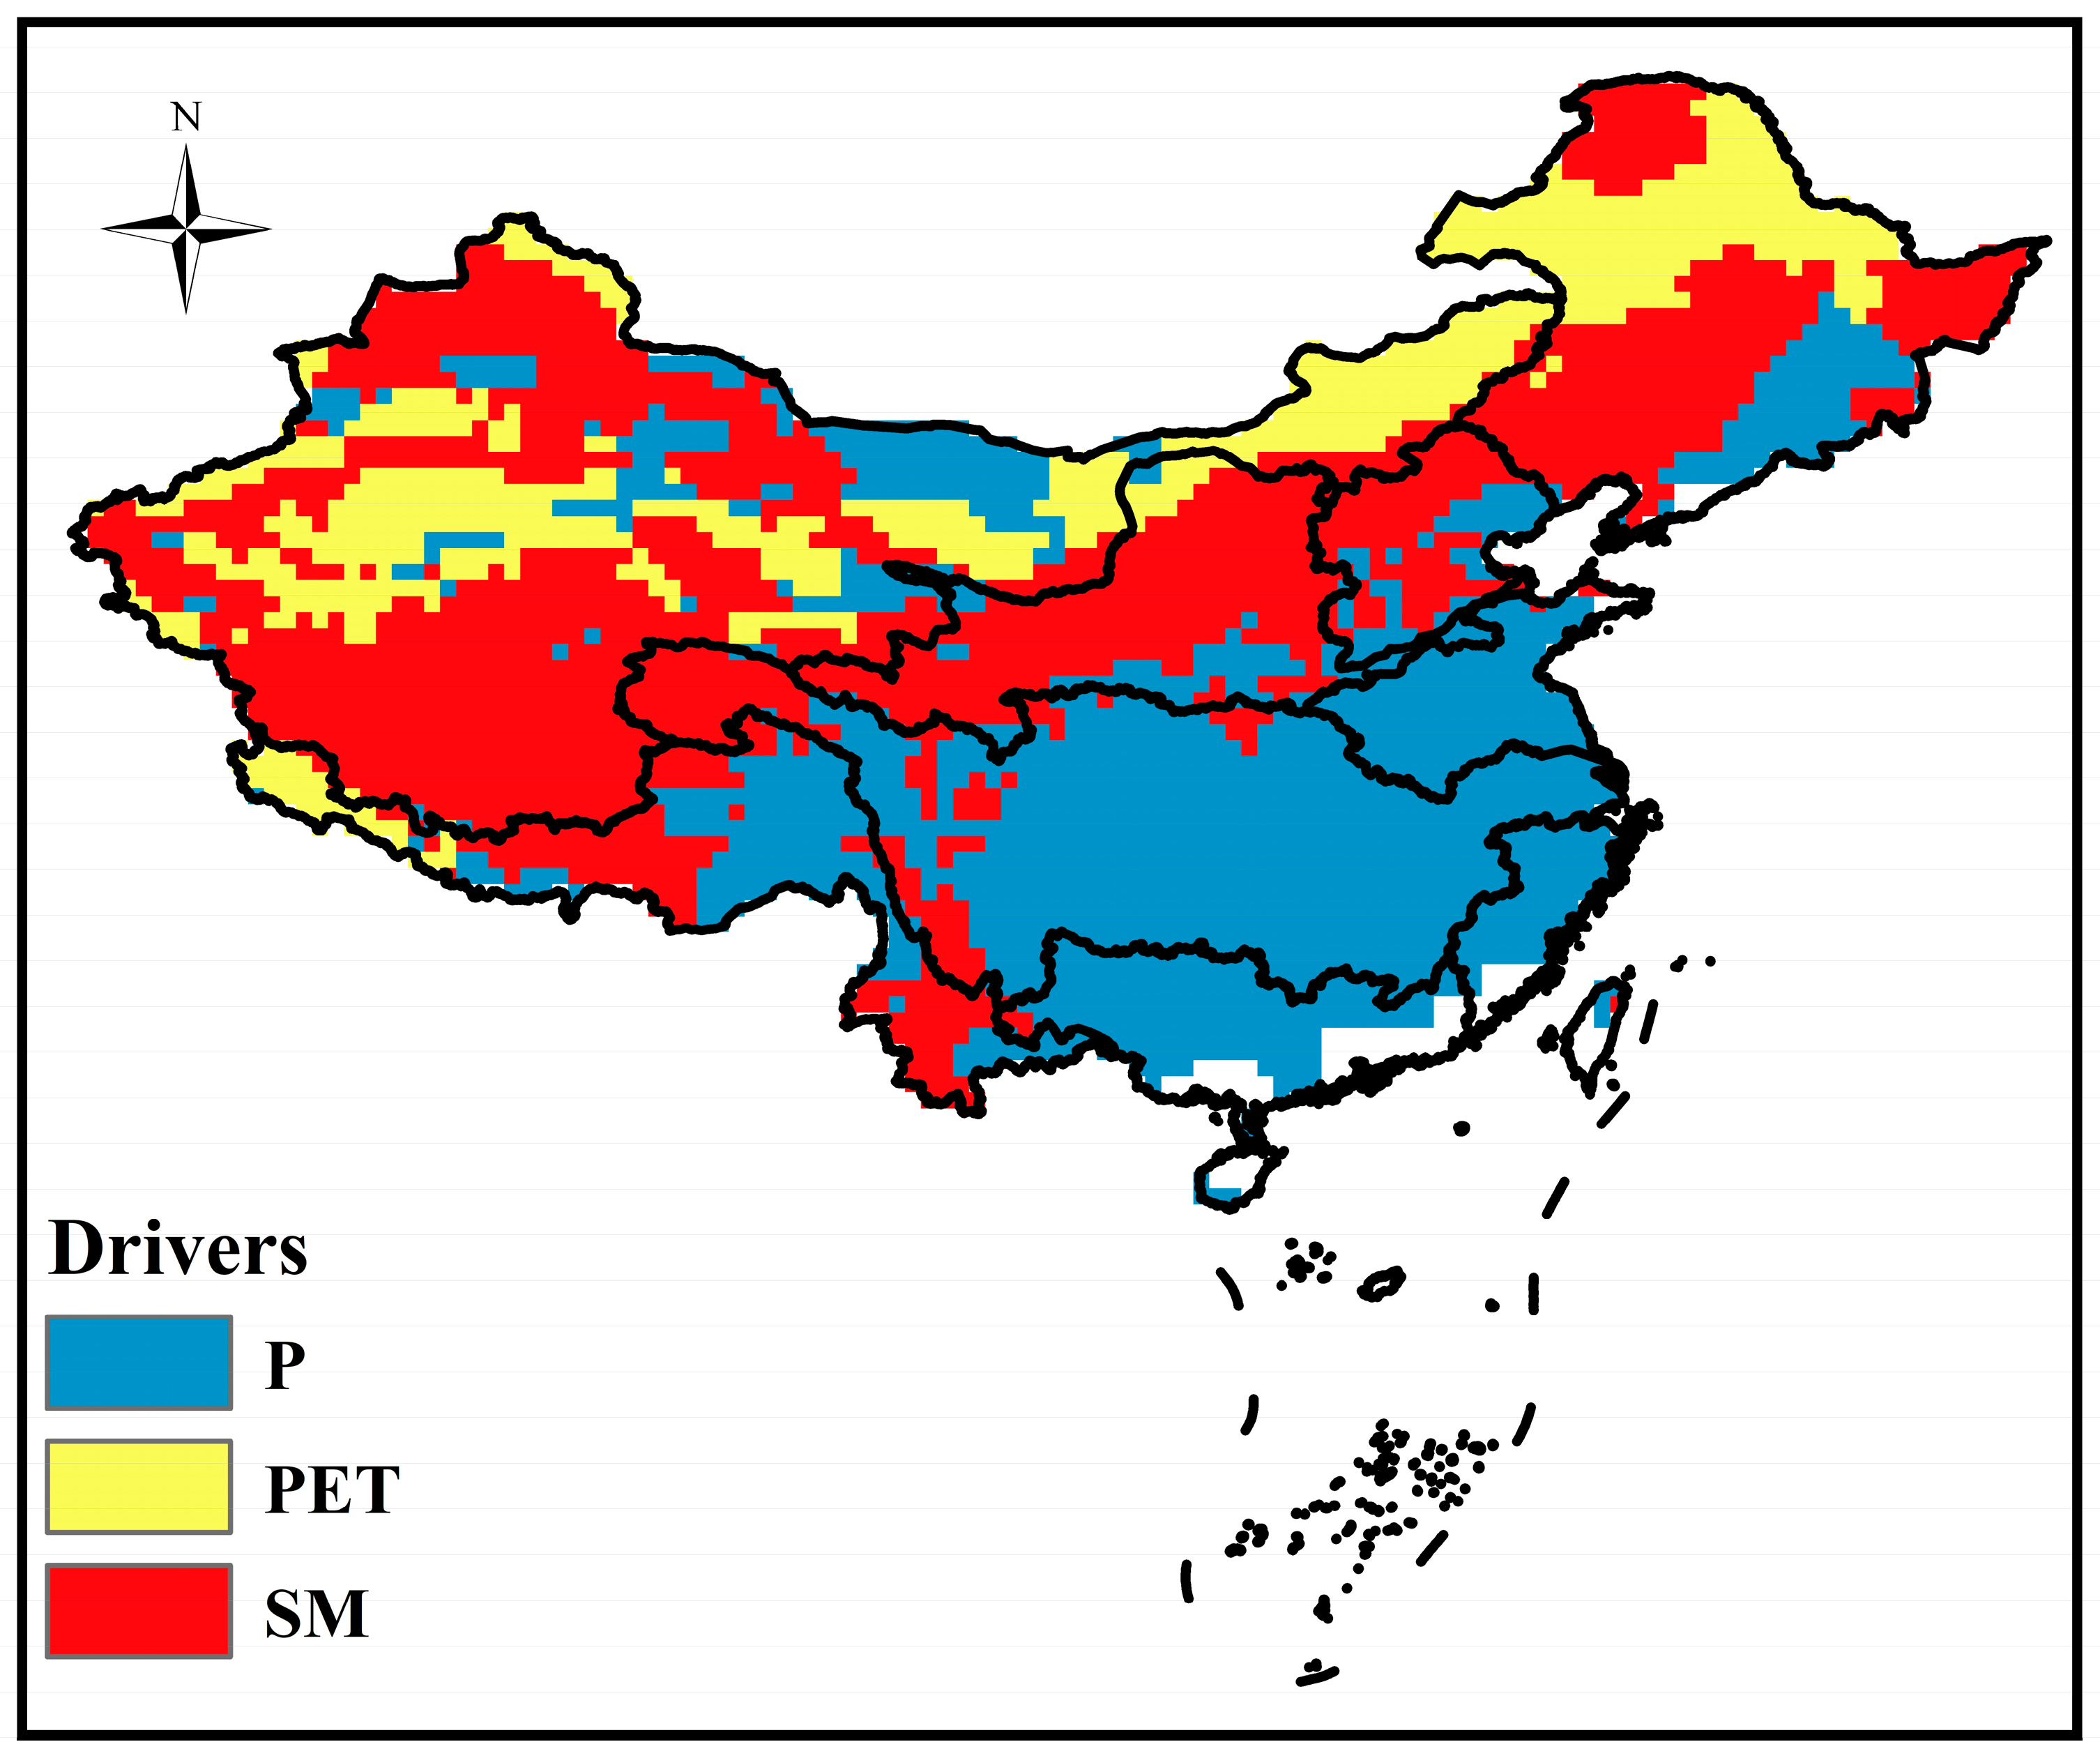
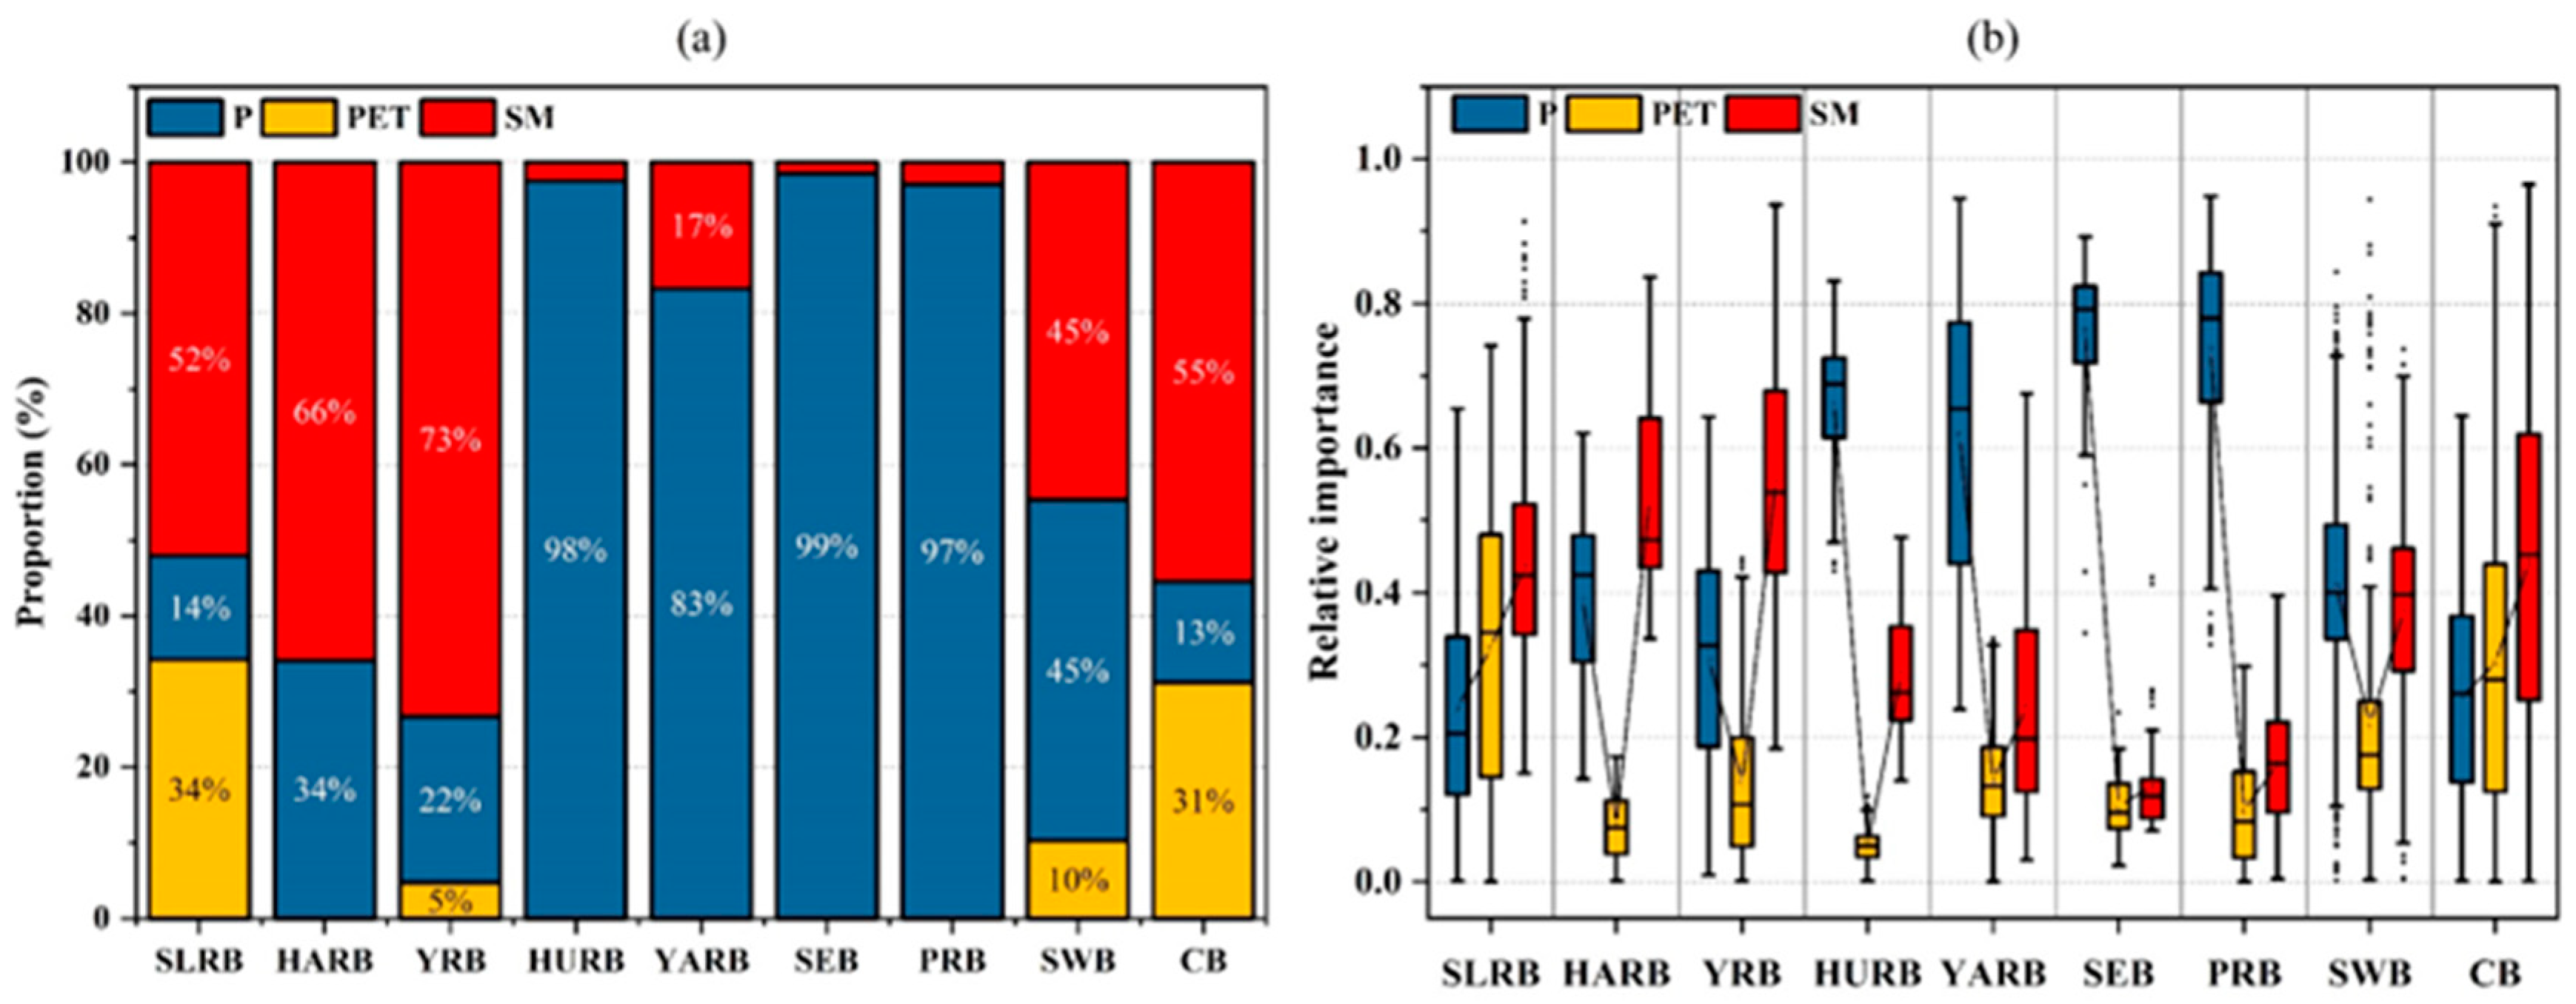
Figure 6 shows the factors driving propagation from meteorological to hydrological droughts in China. In general, P was the primary driving factor for drought propagation in southern China. However, potential evapotranspiration and soil moisture were the primary drivers for drought propagation in northern China. In Figure 7a, the primary drivers of PET, P, and SM had 34%, 14%, and 52% areas, respectively, in the SLRB; from Figure 6, in general, PET, SM, and P showed primary drivers in the northern, southwestern, and southern eastern SLRB. The primary drivers of SM and P were 34% and 66%, respectively, in the HARB; SM and P were the primary drivers in the northern and southern HARB. The primary drivers of PET, P, and SM had 5%, 22%, and 73% areas in the YRB, respectively. P had large areas (proportion more than 90%) in the HURB, YARB, SEB, and PRB. Both P and SM had 45% areas in the SWB; P showed as a primary driver in the western and southern SWB; moreover, SM showed as a primary driver in the central SWB. PET and SM had 31% and 55% areas in the CB, respectively; PET showed as a primary driver in the central and western CB; moreover, SM showed as a primary driver in the northern and southern CB. In general, PET and SM had higher proportion areas as primary drivers in the SLRB and CB; SM had high proportion areas as a primary driver in the HARB and YRB; and P had higher proportion areas as a primary driver in the HURB, YARB, SEB, and PRB.
From Figure 7b, P (relative importance approximately 0.10–0.35), PET (approximately 0.10–0.50), and SM (approximately 0.30–0.60) displayed a similar relative importance in the SLRB and CB. Moreover, P (approximately 0.20–0.45), PET (approximately 0.05–0.20), and SM (approximately 0.40–0.70) displayed a similar relative importance in the HARB and YRB. However, P had a high relative importance in the HURB (approximately 0.60–0.70), YARB (approximately 0.40–0.80), SEB (approximately 0.70–0.82), and PRB (approximately 0.65–0.82). Both P (approximately 0.32–0.50) and SM (approximately 0.30–0.48) showed a similar relative importance in the SWB. In general, the SLRB and CB showed a similar relative importance of P, PET, and SM for the propagation from meteorological to hydrological drought; The HARB and YRB had a similar relative importance of driver factors; and P had the highest relative importance for the propagation of drought in the HURB, YARB, SEB and PRB.
4. Discussion
4.1. Difference Analysis of Drought Propagation in Different River Basins
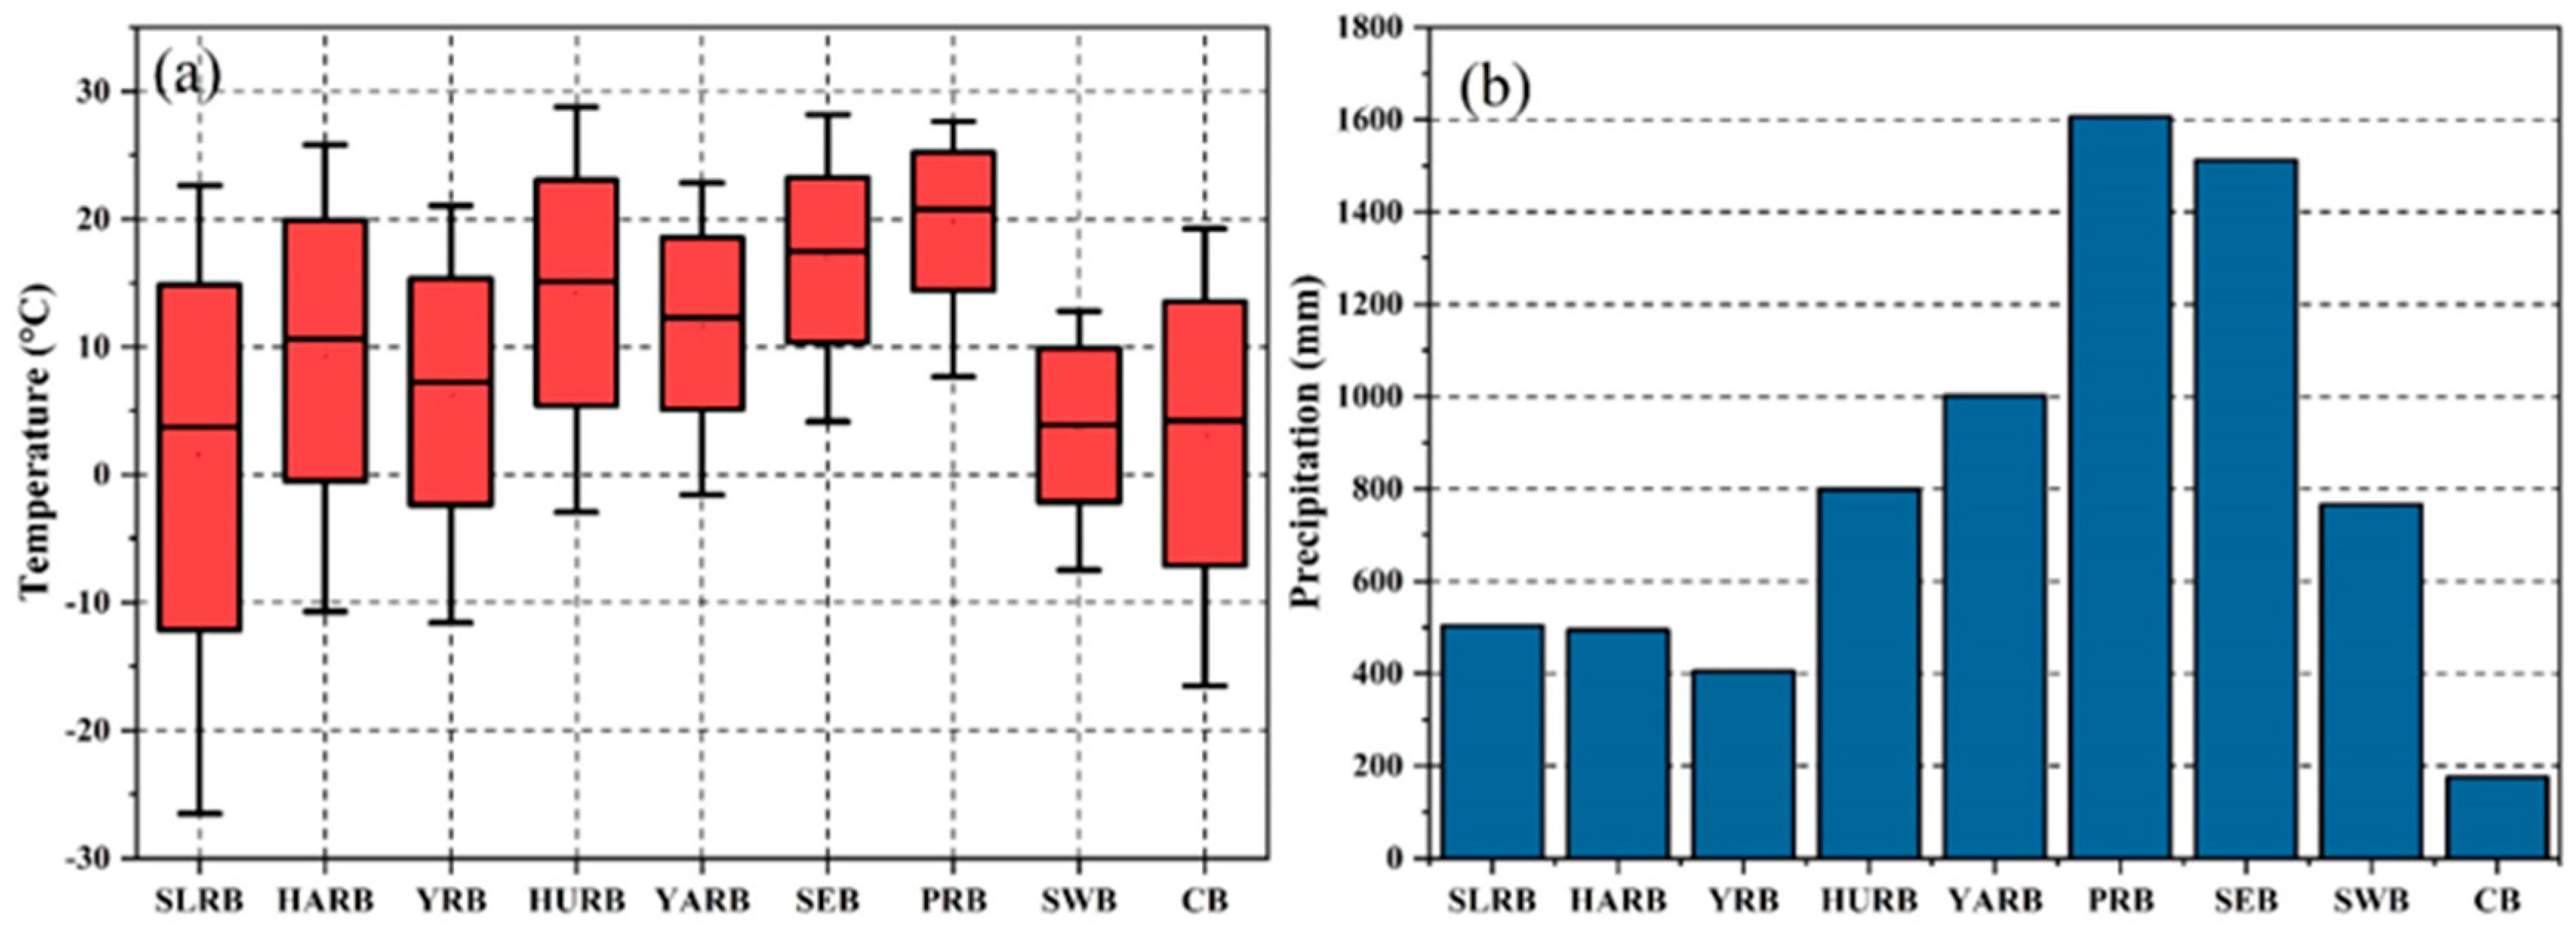
Based on Section 3.3, we analyzed the direct drivers (P, PET, and SM) for the propagation from meteorological to hydrological drought in different river basins of China. However, many indirect factors also impact drought propagation, such as topography [58,59], hydrological cycle characteristics [59,60], land cover [61], and climate type [19]. In Figure 3b, the propagation relationship was weak for meteorological to hydrological drought that occurred in spring and winter across the SLRB and CB. Many studies have found that the freezing and thawing of snow could obstruct drought propagation [62,63]. Snowmelt could produce runoff and relieve hydrological drought [63]. However, P did not play a key role in the process of runoff from snowmelt. Meanwhile, the temperature was below zero degrees Celsius, and snow also accumulated on the ground [7] in winter across the SLRB and CB (Figure 8a). When the snow melted in spring and accumulated in winter, the propagation from meteorological to hydrological drought was obstructed. Therefore, snowmelt could obstruct the propagation from meteorological to hydrological drought in spring and winter. Meanwhile, based on Figure 3b, we also found that accumulated snow could also obstruct drought propagation in winter across the HURB, YAR, and the SWB. There was a low level of P (Figure 8b), and the desert had a large area proportion (Figure 1b) in the CB. Zhou, et al. [64] and Wang, et al. [65] found that the desert of the CB had low levels of SM. Han, et al. [66] also found that PET was also high in the CB. The small amount of P mainly supplied SM and PET in the CB [64,66], which could explain why SM and PET were the main drivers of drought propagation. Therefore, runoff was difficult to produce by P in summer and autumn across the CB. Moreover, Figure 3b also proved that the drought propagation relationship was weak in summer and autumn across the CB.
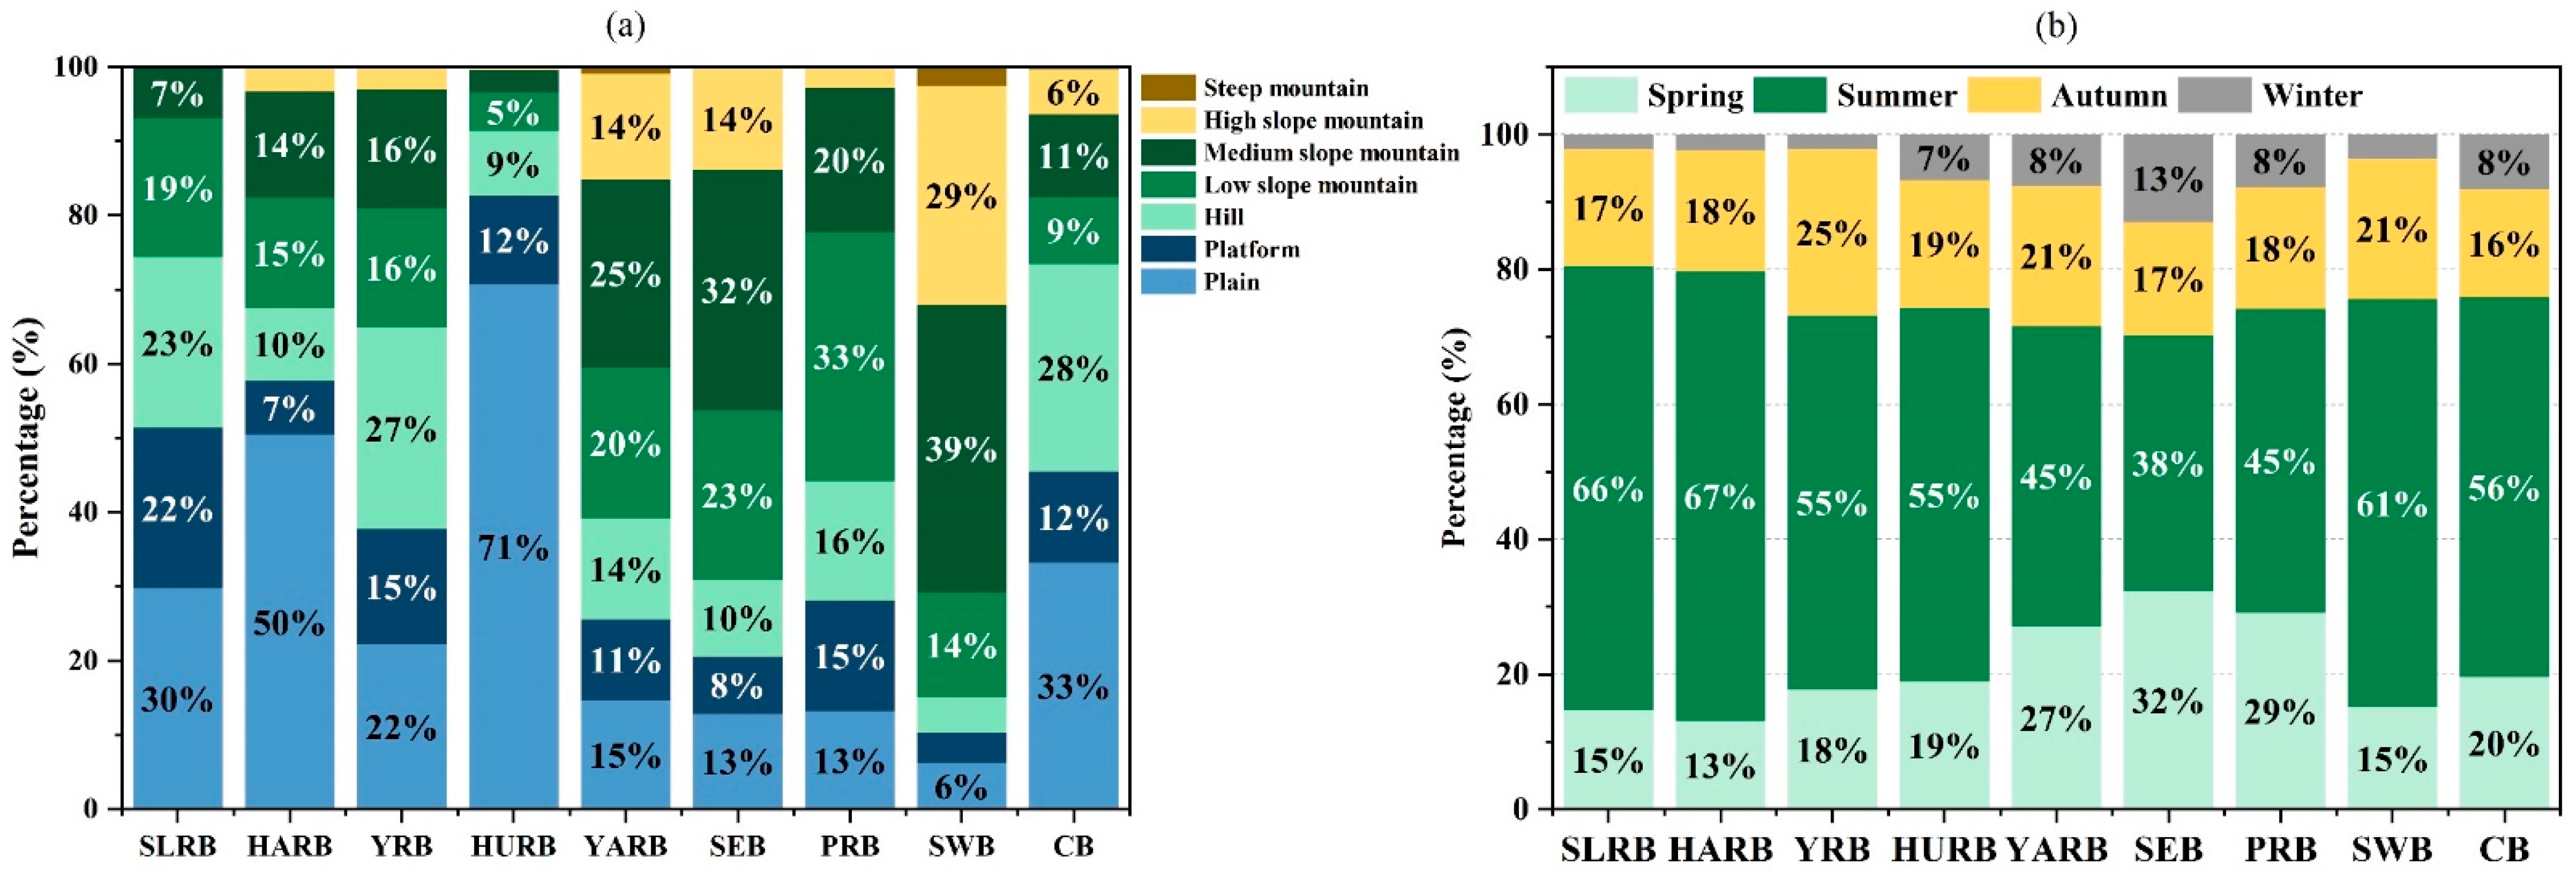
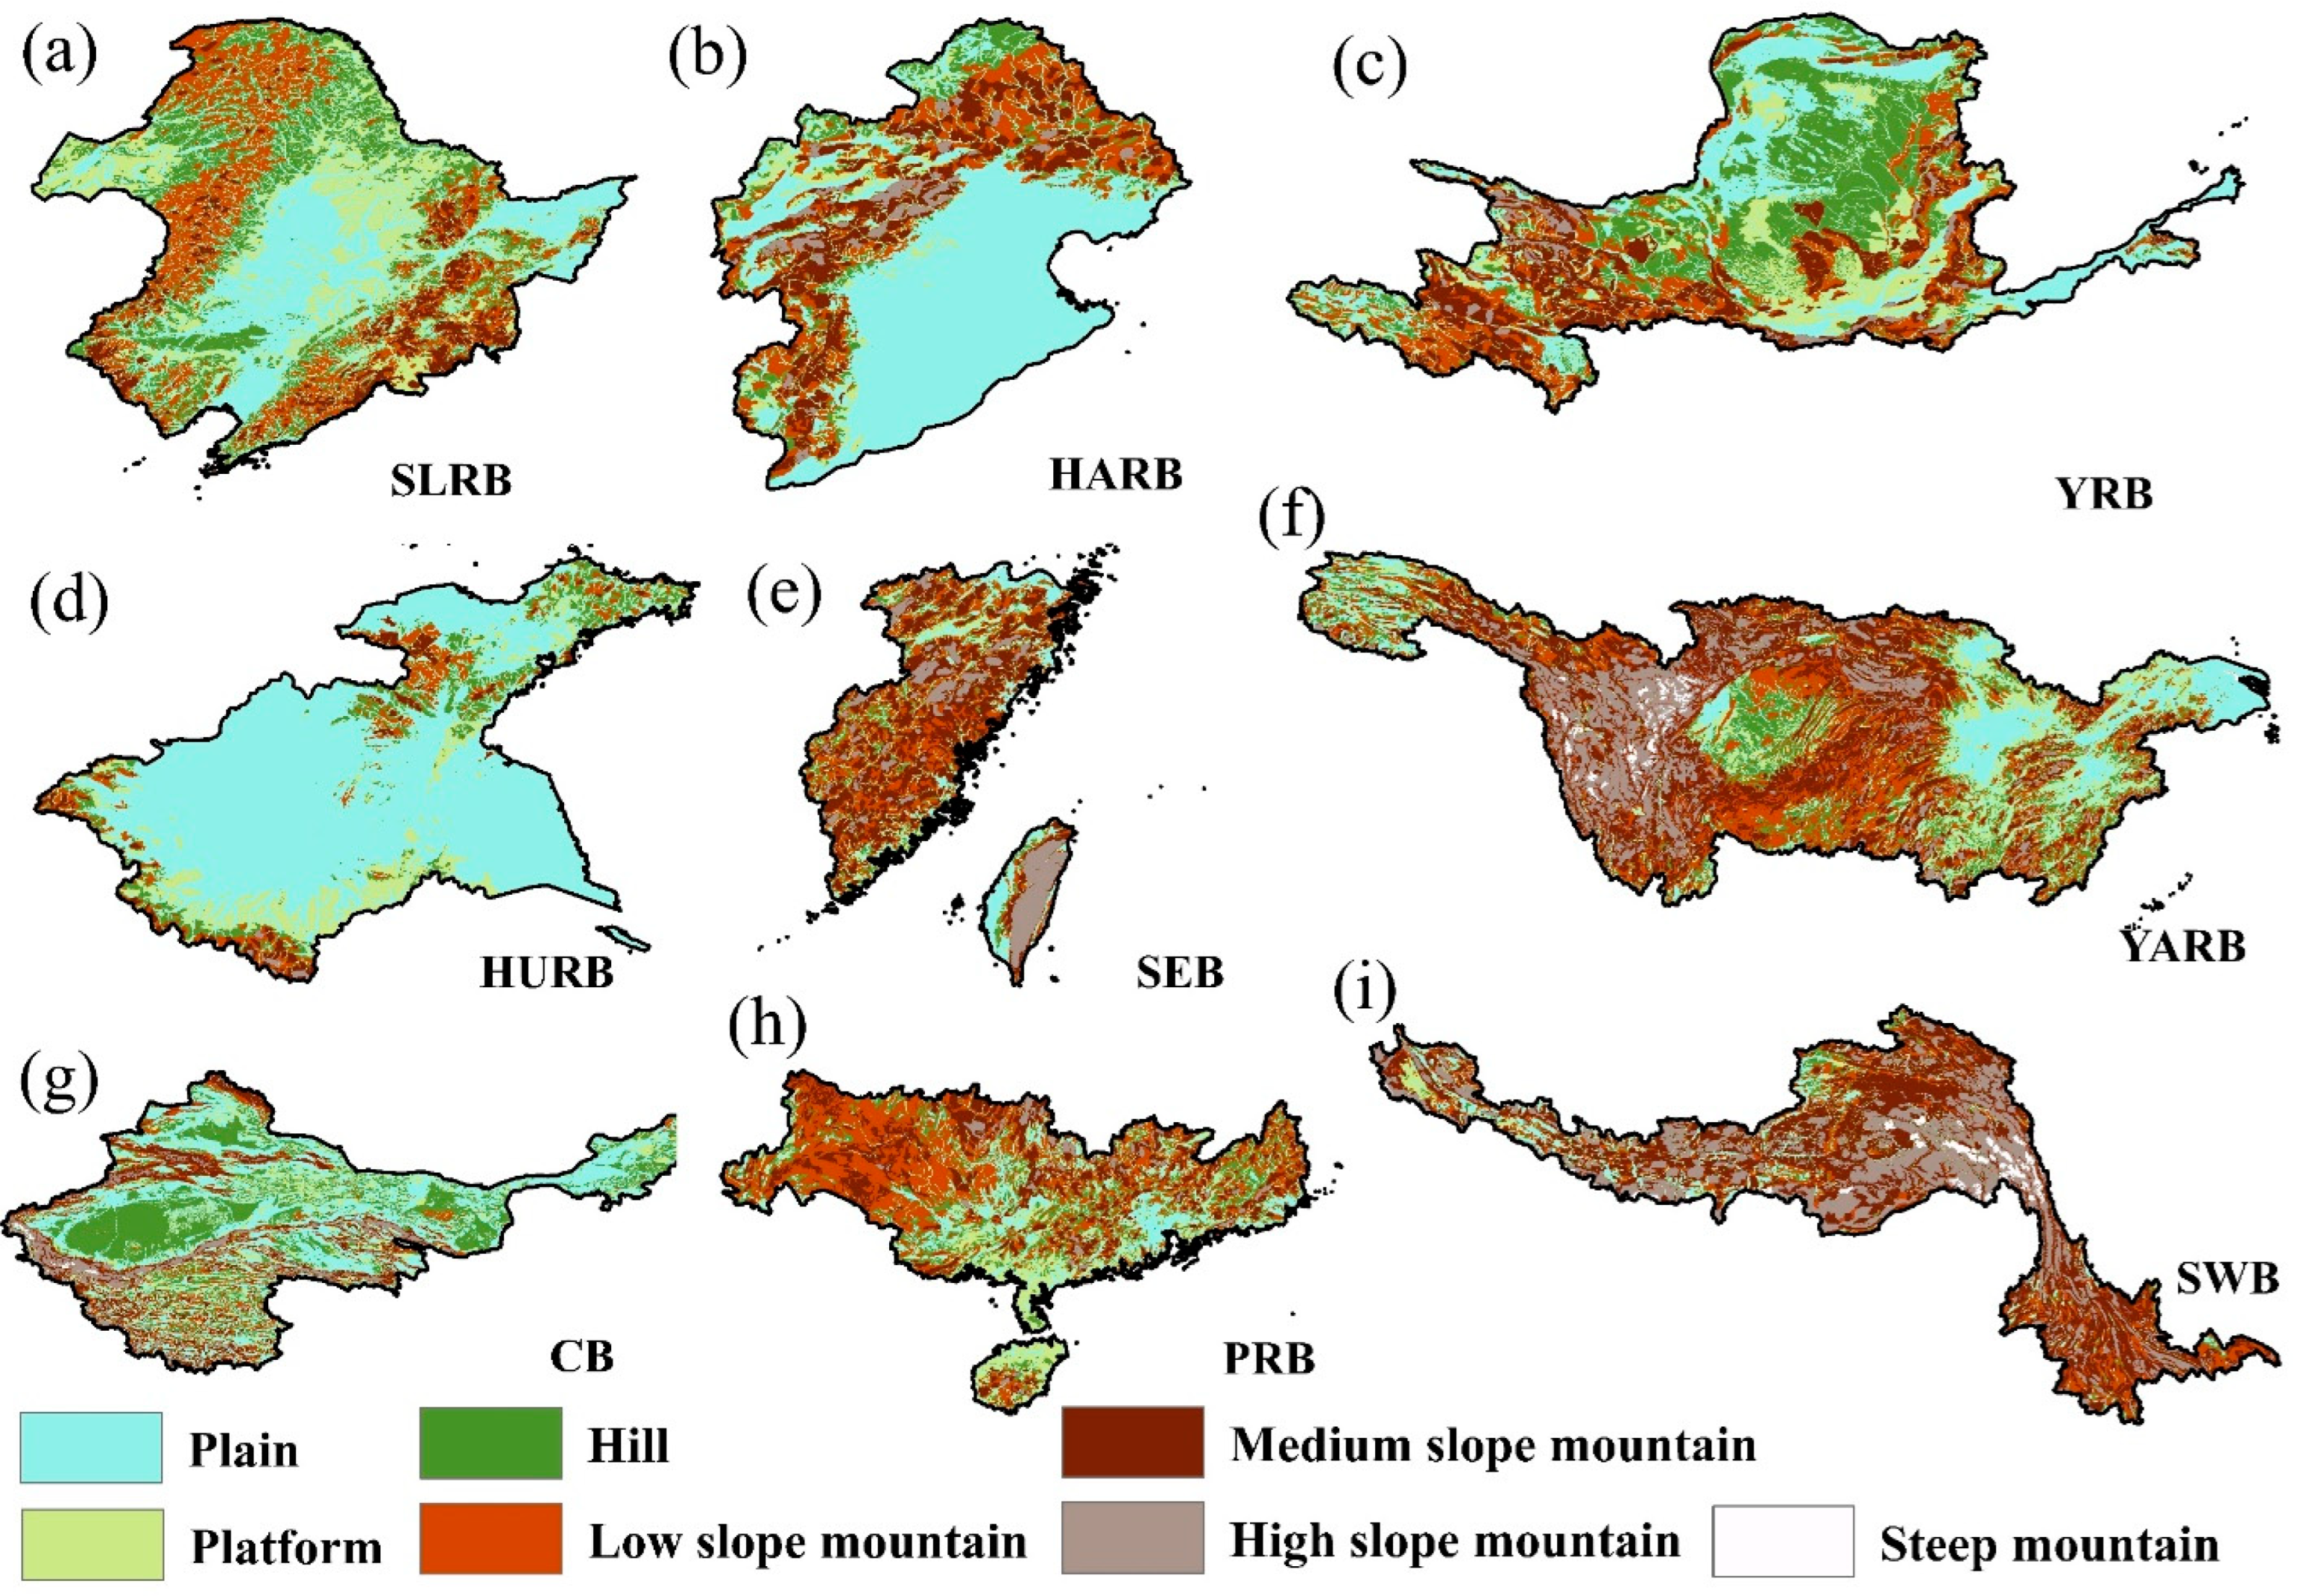
Based on Section 3.1, we found that the propagation relationship was strong from meteorological to hydrological drought in the HURB, YARB, SEB, and PRB. Based on Section 3.3, we also found that P was the primary driving factor in the HURB, YARB, SEB, and PRB. Many studies found that there were higher SM levels in the HURB, YARB, SEB, and PRB [64,65]. Meanwhile, from Figure 8b, P was also higher in the HURB, YARB, PRB, SEB, and SWB [50]. Therefore, runoff could be easier to produce under saturated conditions (high levels) of SM, rather than unsaturated conditions (low levels) of SM [67]. Therefore, drought propagation would have a strong relationship when P and SM were at higher levels in the HURB, YARB, SEB, PRB, and SWB. Moreover, from Figure 9b and Figure 10e,f,h,i, we found that mountainous areas were proportionally greater in the YARB, SEB, PRB, and SWB. P could produce more runoff in mountains than in the plains [59]. Therefore, mountains could be an indirect factor in strengthening drought propagation in the YARB, SEB, PRB, and SWB. Meanwhile, the plain also experiences ponding and waterlogging when rainwater infiltrates the soil instead of runoff across the ground [59]. From Figure 9b, plain and platform were in higher proportions in the SLRB, HARB, and HURB. Therefore, propagation drought would be obstructed by the plains and platforms in the central SLRB, southeastern HARB, and HURB. The relationship of drought propagation shows large differences in summer and autumn across the SLRB and HARB. From Figure 8b, we found that the annual precipitation was similar between the SLRB and HARB. However, Yao et al. [68] found that the precipitation was mainly in summer and autumn across the HARB. Zhou et al. [64] also found that SM in summer was higher than in autumn in the SLRB and HARB. Therefore, the high levels of P and SM in summer could have a stronger propagation relationship than those in autumn in the SLRB and HARB.
4.2. Comparisons and Limitations
Many studies have also investigated drought propagation characteristics, mechanisms, and times [1,21,69]. Zhou et al. [1] also found that the drought propagation time was 1–2 months from meteorological to hydrological drought in the YARB. The results of Wang et al. [15] also showed that meteorological drought usually occurred earlier than hydrological drought, and a positive correlation was shown between hydrological and meteorological drought in the YRB. Wu et al. [24] found that hydrological drought showed a higher risk in the spring than in other seasons across the Loess Plateau. Meanwhile, this study also found that the drought propagation relationship was weaker than that in other seasons between meteorological and hydrological droughts in the YRB. Guo et al. [34] found that the propagation of hydrological drought had a threshold and sensitivity among various regions. This study also investigated the drivers of drought propagation in different river basins. Therefore, when the drivers reach a certain level, the threshold of propagation could be achieved from meteorological to hydrological drought [1,12,34]. Zhou et al. [6] found that the propagation time was 2–6 months from meteorological to hydrological drought in the PRB. This study also found that the drought propagation time was longer than 2 months in most areas of the PRB.
However, this study also had some limitations. For example, abnormal drought propagation relationships were not adequately explained for the CB and SWB [10]. Moreover, human activities [70] and land cover [61] might affect the propagation relationship and the time from meteorological to hydrological drought. Because human activities and land cover could have complex mechanisms impacting drought propagation [61,70], we were not able to sufficiently analyze human activities and land cover in this study. Previous studies have shown that if more variables, such as temperature, evaporation, and soil moisture are taken into account when calculating the drought index, the drought characteristics will change [71,72]. In this study, the SPI, with the characteristics of multiple timescales and easy calculations, was selected to represent meteorological drought. In the future, the meteorological drought index considering multiple factors should be applied in the study of drought propagation. However, the above limitations might be an interesting study direction to investigate drought in the future.
5. Conclusions
In this study, we investigated the propagation characteristics of meteorological to hydrological drought across nine river basins in China. We also quantitatively analyzed the main drivers of drought propagation in China. The results show that the drought propagation time of the nine basins in China was mainly 1–3 months, and the relationship between meteorological drought and hydrological drought in spring and winter is weaker than in summer and autumn. In general, the propagation relationship from meteorological to hydrological drought was strong based on correlation analysis in different timescales. The SLRB, SEB, and CB mainly had a 1-month propagation time; The HARB, YRB, HURB, YARB, PRB, and SWB had a 2–3-month propagation time. The drought response relationship of the basins located in central and eastern China is stronger than that of the western basins, and the driving factors affecting the drought propagation relationship of different basins are different. P was the single main driving factor of drought propagation in the HURB, YARB, SEB, and PRB; SM and PET were the main drivers of drought propagation in the SLRB and CB, and SM and P were the main drivers of drought propagation in the HARB and YRB. Moreover, the underlying surface condition and other factors are also important factors affecting drought propagation, which need to be further explored.
Overall, the results of this study can improve our understanding of the drought propagation mechanism from the perspective of the river basin, and can help to more effectively strengthen drought monitoring and prevention, especially under changing climate conditions in the future. It also provides a reference for the study of global drought propagation.
Author Contributions
Conceptualization, L.L. and L.Z.; methodology, L.L.; software, L.L.; validation, L.L., L.Z. and F.W.; data curation, L.L.; writing—original draft preparation, L.L.; writing-review and editing, L.L., and L.Z.; visualization, J.G. and P.Y.; formula analysis, P.Y.; funding acquisition, F.W., J.G. and L.L. All authors have read and agreed to the published version of the manuscript.
Funding
This work was supported by the National Natural Science Foundation of China [grant no. 51979108,51709110], the Key Technologies R & D and Promotion program of Henan (202102110128) and Foundation for University Young Key Scholar by Henan province (2020GGJS100).
Institutional Review Board Statement
Not applicable.
Informed Consent Statement
Not applicable.
Data Availability Statement
The data that support the findings of this study are available from the corresponding author, [F.W.], upon reasonable request.
Acknowledgments
The authors thank Yibo Ding and Zhaoqiang Zhou for valuable technical assistance.
Conflicts of Interest
The authors declare no conflict of interests.
References
- Li, R.; Chen, N.; Zhang, X.; Zeng, L.; Wang, X.; Tang, S.; Li, D.; Niyogi, D. Quantitative analysis of agricultural drought propagation process in the Yangtze River Basin by using cross wavelet analysis and spatial autocorrelation. Agric. For. Meteorol. 2020, 280, 107809. [Google Scholar] [CrossRef]
- Zhou, Z.; Shi, H.; Fu, Q.; Ding, Y.; Li, T.; Liu, S. Investigating the Propagation from Meteorological to Hydrological Drought by Introducing the Nonlinear Dependence with Directed Information Transfer Index. Water Resour. Res. 2021, 57, e2021WR030028. [Google Scholar] [CrossRef]
- Bhardwaj, K.; Shah, D.; Aadhar, S.; Mishra, V. Propagation of Meteorological to Hydrological Droughts in India. J. Geophys. Res. Atmos. 2020, 125, e2020JD033455. [Google Scholar] [CrossRef]
- Zhang, B.; AghaKouchak, A.; Yang, Y.; Wei, J.; Wang, G. A water-energy balance approach for multi-category drought -assessment across globally diverse hydrological basins. Agric. For. Meteorol. 2019, 264, 247–265. [Google Scholar] [CrossRef]
- Mishra, A.K.; Singh, V.P. A review of drought concepts. J. Hydrol. 2010, 391, 202–216. [Google Scholar] [CrossRef]
- Zhou, Z.; Shi, H.; Fu, Q.; Ding, Y.; Li, T.; Wang, Y.; Liu, S. Characteristics of propagation from meteorological drought to hydrological drought in the Pearl River Basin. J. Geophys. Res. Atmos. 2021, 126, e2020JD033959. [Google Scholar] [CrossRef]
- Zhou, Z.; Shi, H.; Fu, Q.; Li, T.; Gan, T.Y.; Liu, S.; Liu, K. Is the cold region in Northeast China still getting warmer under climate change impact? Atmos. Res. 2020, 237, 104864. [Google Scholar] [CrossRef]
- Zhou, Z.Q.; Ding, Y.B.; Shi, H.Y.; Cai, H.J.; Fu, Q.; Liu, S.N.; Li, T.X. Analysis and prediction of vegetation dynamic changes in China: Past, present and future. Ecol. Indic. 2020, 117, 11. [Google Scholar] [CrossRef]
- Zhou, Z.; Liu, S.; Ding, Y.; Fu, Q.; Wang, Y.; Cai, H.; Shi, H. Assessing the responses of vegetation to meteorological drought and its influencing factors with partial wavelet coherence analysis. J. Environ. Manag. 2022, 311, 114879. [Google Scholar] [CrossRef]
- Yang, P.; Xia, J.; Zhang, Y.; Zhan, C.; Sun, S. How is the risk of hydrological drought in the Tarim River Basin, Northwest China? Sci. Total Environ. 2019, 693, 133555. [Google Scholar] [CrossRef]
- Vicente-Serrano, S.M.; Beguería, S.; López-Moreno, J.I.; Angulo, M.; El Kenawy, A. A New Global 0.5° Gridded Dataset (1901–2006) of a Multiscalar Drought Index: Comparison with Current Drought Index Datasets Based on the Palmer Drought Severity Index. J. Hydrometeorol. 2010, 11, 1033–1043. [Google Scholar] [CrossRef]
- Huang, S.; Li, P.; Huang, Q.; Leng, G.; Hou, B.; Ma, L. The propagation from meteorological to hydrological drought and its potential influence factors. J. Hydrol. 2017, 547, 184–195. [Google Scholar] [CrossRef]
- Ju, J.; Wu, C.; Yeh, P.J.F.; Dai, H.; Hu, B.X. Global precipitation-related extremes at 1.5 °C and 2 °C of global warming targets: Projection and uncertainty assessment based on the CESM-LWR experiment. Atmos. Res. 2021, 264, 105868. [Google Scholar] [CrossRef]
- Xu, H.-j.; Wang, X.-p.; Zhao, C.-y.; Yang, X.-m. Diverse responses of vegetation growth to meteorological drought across climate zones and land biomes in northern China from 1981 to 2014. Agric. For. Meteorol. 2018, 262, 1–13. [Google Scholar] [CrossRef]
- Wang, F.; Wang, Z.; Yang, H.; Di, D.; Zhao, Y.; Liang, Q.; Hussain, Z. Comprehensive evaluation of hydrological drought and its relationships with meteorological drought in the Yellow River basin, China. J. Hydrol. 2020, 584, 124751. [Google Scholar] [CrossRef]
- Ding, Y.; Gong, X.; Xing, Z.; Cai, H.; Zhou, Z.; Zhang, D.; Sun, P.; Shi, H. Attribution of meteorological, hydrological and agricultural drought propagation in different climatic regions of China. Agric. Water Manag. 2021, 255, 106996. [Google Scholar] [CrossRef]
- Han, Z.; Huang, S.; Huang, Q.; Leng, G.; Wang, H.; Bai, Q.; Zhao, J.; Ma, L.; Wang, L.; Du, M. Propagation dynamics from meteorological to groundwater drought and their possible influence factors. J. Hydrol. 2019, 578, 124102. [Google Scholar] [CrossRef]
- Shi, X.; Chen, J.; Gu, L.; Xu, C.Y.; Chen, H.; Zhang, L. Impacts and socioeconomic exposures of global extreme precipitation events in 1.5 and 2.0 degrees C warmer climates. Sci. Total Environ. 2021, 766, 142665. [Google Scholar] [CrossRef]
- Ding, Y.; Xu, J.; Wang, X.; Cai, H.; Zhou, Z.; Sun, Y.; Shi, H. Propagation of meteorological to hydrological drought for different climate regions in China. J. Environ. Manag. 2021, 283, 111980. [Google Scholar] [CrossRef]
- Shukla, S.; Wood, A.W. Use of a standardized runoff index for characterizing hydrologic drought. Geophys. Res. Lett. 2008, 35, L02405. [Google Scholar] [CrossRef] [Green Version]
- Forootan, E.; Khaki, M.; Schumacher, M.; Wulfmeyer, V.; Mehrnegar, N.; van Dijk, A.; Brocca, L.; Farzaneh, S.; Akinluyi, F.; Ramillien, G.; et al. Understanding the global hydrological droughts of 2003–2016 and their relationships with teleconnections. Sci. Total Environ. 2019, 650 Pt 2, 2587–2604. [Google Scholar] [CrossRef]
- Vicente-Serrano, S.M.; Camarero, J.J.; Azorin-Molina, C. Diverse responses of forest growth to drought time-scales in the Northern Hemisphere. Glob. Ecol. Biogeogr. 2014, 23, 1019–1030. [Google Scholar] [CrossRef]
- Asadi Zarch, M.A.; Sivakumar, B.; Sharma, A. Droughts in a warming climate: A global assessment of Standardized precipitation index (SPI) and Reconnaissance drought index (RDI). J. Hydrol. 2015, 526, 183–195. [Google Scholar] [CrossRef]
- Wu, J.; Miao, C.; Tang, X.; Duan, Q.; He, X. A nonparametric standardized runoff index for characterizing hydrological drought on the Loess Plateau, China. Glob. Planet. Change 2018, 161, 53–65. [Google Scholar] [CrossRef]
- Vicente-Serrano, S.M.; Beguería, S.; López-Moreno, J.I. A Multiscalar Drought Index Sensitive to Global Warming: The Standardized Precipitation Evapotranspiration Index. J. Clim. 2010, 23, 1696–1718. [Google Scholar] [CrossRef]
- Shi, H.; Li, T.; Wei, J. Evaluation of the gridded CRU TS precipitation dataset with the point raingauge records over the Three-River Headwaters Region. J. Hydrol. 2017, 548, 322–332. [Google Scholar] [CrossRef]
- Peel, M.C.; Finlayson, B.L.; McMahon, T.A. Updated world map of the Koppen-Geiger climate classification. Hydrol. Earth Syst. Sci. 2007, 11, 1633–1644. [Google Scholar] [CrossRef]
- Zhang, Y.; Li, G.; Ge, J.; Li, Y.; Yu, Z.; Niu, H. sc_PDSI is more sensitive to precipitation than to reference evapotranspiration in China during the time period 1951–2015. Ecol. Indic. 2019, 96, 448–457. [Google Scholar] [CrossRef]
- Harris, I.; Osborn, T.J.; Jones, P.; Lister, D. Version 4 of the CRU TS monthly high-resolution gridded multivariate climate dataset. Sci. Data. 2020, 7, 109. [Google Scholar] [CrossRef]
- Swain, S.; Mishra, S.K.; Pandey, A. A detailed assessment of meteorological drought characteristics using simplified rainfall index over Narmada River Basin, India. Environ. Earth Sci. 2021, 80, 221. [Google Scholar] [CrossRef]
- Swain, S.; Mishra, S.K.; Pandey, A.; Kalura, P. Inclusion of groundwater and socio-economic factors for assessing comprehensive drought vulnerability over Narmada River Basin, India: A geospatial approach. Appl. Water Sci. 2022, 12, 14. [Google Scholar] [CrossRef]
- Swain, S.; Mishra, S.K.; Pandey, A.; Dayal, D. Identification of Meteorological Extreme Years over Central Division of Odisha Using an Index-Based Approach. Hydrol. Extrem. 2021, 97, 161–174. [Google Scholar]
- Swain, S.; Mishra, S.K.; Pandey, A. Assessment of meteorological droughts over Hoshangabad district, India. IOP Conf. Ser. Earth Environ. Sci. 2020, 491, 012012. [Google Scholar] [CrossRef]
- Guo, Y.; Huang, S.; Huang, Q.; Leng, G.; Fang, W.; Wang, L.; Wang, H. Propagation thresholds of meteorological drought for triggering hydrological drought at various levels. Sci. Total Environ. 2020, 712, 136502. [Google Scholar] [CrossRef]
- Yao, N.; Li, Y.; Lei, T.; Peng, L. Drought evolution, severity and trends in mainland China over 1961–2013. Sci. Total Environ. 2018, 616, 73–89. [Google Scholar] [CrossRef]
- Yao, N.; Li, L.; Feng, P.; Feng, H.; Li, L.; Liu, Y.; Jiang, K.; Hu, X.; Li, Y. Projections of drought characteristics in China based on a standardized precipitation and evapotranspiration index and multiple GCMs. Sci. Total Environ. 2020, 704, 135245. [Google Scholar] [CrossRef]
- Wang, L.; Yu, H.; Yang, M.; Yang, R.; Gao, R.; Wang, Y. A drought index: The standardized precipitation evapotranspiration runoff index. J. Hydrol. 2019, 571, 651–668. [Google Scholar] [CrossRef]
- Zhang, B.Q.; Xia, Y.L.; Huning, L.S.; Wei, J.H.; Wang, G.Q.; AghaKouchak, A. A Framework for Global Multicategory and Multiscalar Drought Characterization Accounting for Snow Processes. Water Resour. Res. 2019, 55, 9258–9278. [Google Scholar] [CrossRef]
- Ding, Y.; Xu, J.; Wang, X.; Peng, X.; Cai, H. Spatial and temporal effects of drought on Chinese vegetation under different coverage levels. Sci. Total Environ. 2020, 716, 137166. [Google Scholar] [CrossRef]
- Li, Y.; Yan, D.; Peng, H.; Xiao, S. Evaluation of precipitation in CMIP6 over the Yangtze River Basin. Atmos. Res. 2021, 253, 105406. [Google Scholar] [CrossRef]
- Wang, X.; Hou, X.; Zhao, Y. Changes in consecutive dry/wet days and their relationships with local and remote climate drivers in the coastal area of China. Atmos. Res. 2021, 247, 105138. [Google Scholar] [CrossRef]
- Wang, Z.; Zhong, R.; Lai, C.; Zeng, Z.; Lian, Y.; Bai, X. Climate change enhances the severity and variability of drought in the Pearl River Basin in South China in the 21st century. Agric. For. Meteorol. 2018, 249, 149–162. [Google Scholar] [CrossRef]
- Ghiggi, G.; Humphrey, V.; Seneviratne, S.I.; Gudmundsson, L. GRUN: An observation-based global gridded runoff dataset from 1902 to 2014. Earth Syst. Sci. Data. 2019, 11, 1655–1674. [Google Scholar] [CrossRef]
- Wei, L.Y.; Jiang, S.H.; Ren, L.L. Evaluation and comparison of three long-term gauge-based precipitation products for drought monitoring over mainland China from 1961 to 2016. Nat. Hazards 2020, 104, 1371–1387. [Google Scholar] [CrossRef]
- Yao, J.Q.; Chen, Y.N.; Yu, X.J.; Zhao, Y.; Guan, X.F.; Yang, L.M. Evaluation of multiple gridded precipitation datasets for the arid region of northwestern China. Atmos. Res. 2020, 236, 104818. [Google Scholar] [CrossRef]
- Harris, I.; Jones, P.D.; Osborn, T.J.; Lister, D.H. Updated high-resolution grids of monthly climatic observations—The CRU TS3.10 Dataset. Int. J. Climatol. 2014, 34, 623–642. [Google Scholar] [CrossRef]
- Bigaignon, L.; Fieuzal, R.; Delon, C.; Tallec, T. Combination of two methodologies, artificial neural network and linear interpolation, to gap-fill daily nitrous oxide flux measurements. Agric. For. Meteorol. 2020, 291, 108037. [Google Scholar] [CrossRef]
- Fang, W.; Huang, S.Z.; Huang, Q.; Huang, G.H.; Wang, H.; Leng, G.Y.; Wang, L. Identifying drought propagation by simultaneously considering linear and nonlinear dependence in the Wei River basin of the Loess Plateau, China. J. Hydrol. 2020, 591, 125287. [Google Scholar] [CrossRef]
- Dutta, D.; Kundu, A.; Patel, N.R.; Saha, S.K.; Siddiqui, A.R. Assessment of agricultural drought in Rajasthan (India) using remote sensing derived Vegetation Condition Index (VCI) and Standardized Precipitation Index (SPI). Egypt. J. Remote Sens. Space Sci. 2015, 18, 53–63. [Google Scholar] [CrossRef]
- Yao, N.; Li, Y.; Li, N.; Yang, D.; Ayantobo, O.O. Bias correction of precipitation data and its effects on aridity and drought assessment in China over 1961-2015. Sci. Total Environ. 2018, 639, 1015–1027. [Google Scholar] [CrossRef]
- Heo, J.-H.; Kho, Y.W.; Shin, H.; Kim, S.; Kim, T. Regression equations of probability plot correlation coefficient test statistics from several probability distributions. J. Hydrol. 2008, 355, 1–15. [Google Scholar] [CrossRef]
- Sun, S.; Li, Q.; Li, J.; Wang, G.; Zhou, S.; Chai, R.; Hua, W.; Deng, P.; Wang, J.; Lou, W. Revisiting the evolution of the 2009–2011 meteorological drought over Southwest China. J. Hydrol. 2019, 568, 385–402. [Google Scholar] [CrossRef]
- Huang, J.; Li, Q.; Song, Z. Historical global land surface air apparent temperature and its future changes based on CMIP6 projections. Sci. Total Environ. 2021, 816, 151656. [Google Scholar] [CrossRef] [PubMed]
- Guo, C.; Tang, Y.; Lu, J.; Zhu, Y.; Cao, W.; Cheng, T.; Zhang, L.; Tian, Y. Predicting wheat productivity: Integrating time series of vegetation indices into crop modeling via sequential assimilation. Agric. For. Meteorol. 2019, 272–273, 69–80. [Google Scholar] [CrossRef]
- Kern, A.; Barcza, Z.; Marjanović, H.; Árendás, T.; Fodor, N.; Bónis, P.; Bognár, P.; Lichtenberger, J. Statistical modelling of crop yield in Central Europe using climate data and remote sensing vegetation indices. Agric. For. Meteorol. 2018, 260, 300–320. [Google Scholar]
- Li, H.; Wu, Y.; Liu, S.; Xiao, J. Regional contributions to interannual variability of net primary production and climatic attributions. Agric. For. Meteorol. 2021, 303, 108384. [Google Scholar] [CrossRef]
- Jia, X.; O’Connor, D.; Hou, D.; Jin, Y.; Li, G.; Zheng, C.; Ok, Y.S.; Tsang, D.C.W.; Luo, J. Groundwater depletion and contamination: Spatial distribution of groundwater resources sustainability in China. Sci. Total Environ. 2019, 672, 551–562. [Google Scholar] [CrossRef]
- Khosh Bin Ghomash, S.; Caviedes-Voullieme, D.; Hinz, C. Effects of erosion-induced changes to topography on runoff dynamics. J. Hydrol. 2019, 573, 811–828. [Google Scholar] [CrossRef]
- Saranya, P.; Krishnakumar, A.; Kumar, S.; Anoop Krishnan, K. Isotopic study on the effect of reservoirs and drought on water cycle dynamics in the tropical Periyar basin draining the slopes of Western Ghats. J. Hydrol. 2020, 581, 124421. [Google Scholar] [CrossRef]
- Selten, F.M.; Bintanja, R.; Vautard, R.; van den Hurk, B. Future continental summer warming constrained by the present-day seasonal cycle of surface hydrology. Sci. Rep. 2020, 10, 4721. [Google Scholar] [CrossRef]
- Wei, B.; Xie, Y.; Jia, X.; Wang, X.; He, H.; Xue, X. Land use/land cover change and it’s impacts on diurnal temperature range over the agricultural pastoral ecotone of Northern China. Land Degrad. Dev. 2018, 29, 3009–3020. [Google Scholar] [CrossRef]
- Wu, Y.; Ouyang, W.; Hao, Z.; Yang, B.; Wang, L. Snowmelt water drives higher soil erosion than rainfall water in a mid-high latitude upland watershed. J. Hydrol. 2018, 556, 438–448. [Google Scholar] [CrossRef]
- Yang, Y.; Wu, Q.; Hou, Y.; Zhang, Z.; Zhan, J.; Gao, S.; Jin, H. Unraveling of permafrost hydrological variabilities on Central Qinghai-Tibet Plateau using stable isotopic technique. Sci. Total Environ. 2017, 605, 199–210. [Google Scholar] [CrossRef] [PubMed]
- Zhou, K.; Li, J.; Zhang, T.; Kang, A. The use of combined soil moisture data to characterize agricultural drought conditions and the relationship among different drought types in China. Agric. Water Manag. 2021, 243, 106479. [Google Scholar] [CrossRef]
- Wang, A.; Lettenmaier, D.P.; Sheffield, J. Soil Moisture Drought in China, 1950–2006. J. Clim. 2011, 24, 3257–3271. [Google Scholar] [CrossRef]
- Han, S.; Xu, D.; Wang, S. Decreasing potential evaporation trends in China from 1956 to 2005: Accelerated in regions with significant agricultural influence? Agric. For. Meteorol. 2012, 154, 44–56. [Google Scholar] [CrossRef]
- Deb, P.; Kiem, A.S.; Willgoose, G. Mechanisms influencing non-stationarity in rainfall-runoff relationships in southeast Australia. J. Hydrol. 2019, 571, 749–764. [Google Scholar] [CrossRef]
- Yao, S.; Jiang, D.; Fan, G. Seasonality of Precipitation over China. Chin. J. Atmos. Sci. 2017, 40, 1191–1203. (In Chinese) [Google Scholar]
- Hao, Z.; Singh, V.P. Drought characterization from a multivariate perspective: A review. J. Hydrol. 2015, 527, 668–678. [Google Scholar] [CrossRef]
- Xu, Y.; Zhang, X.; Wang, X.; Hao, Z.; Singh, V.P.; Hao, F. Propagation from meteorological drought to hydrological drought under the impact of human activities: A case study in northern China. J. Hydrol. 2019, 579, 124147. [Google Scholar] [CrossRef]
- Liu, L.Y.; Yang, X.Q.; Gong, F.X.; Su, Y.X.; Huang, G.Q.; Chen, X.Z. The Novel Microwave Temperature Vegetation Drought Index (MTVDI) Captures Canopy Seasonality across Amazonian Tropical Evergreen Forests. Remote Sens. 2021, 13, 339. [Google Scholar] [CrossRef]
- Zhou, Z.; Ding, Y.; Fu, Q.; Wang, C.; Wang, Y.; Cai, H.; Liu, S.; Shi, H. Comprehensive evaluation of vegetation responses to meteorological drought from both linear and nonlinear perspectives. Front. Earth Sci.-Switz. 2022, 10, 953805. [Google Scholar] [CrossRef]
Figure 1.
Geographic zones (a) and main river basins (b) in China. The main river basins include the Songhua and Liaohe River Basins (SLRB), Haihe River Basin (HARB), Huaihe River Basin (HURB), Yellow River Basin (YRB), Yangtze River Basin (YARB), Pearl River Basin (PRB), Southeast Basin (SEB), Southwest Basin (SWB), and Continental Basin (CB).

Figure 2.
Propagation time (a) and spatial distribution of the maximum Pearson correlation coefficient values (b) between the SPI and SRI for the period 1902–2014.
Figure 2.
Propagation time (a) and spatial distribution of the maximum Pearson correlation coefficient values (b) between the SPI and SRI for the period 1902–2014.

Figure 3.
Box diagram showing the response relationship in different seasons and timescales (a) and propagation times (b) between the SPI and SRI for different river basins. Box diagram showing the response relationship between in different season in China (c) drought response time in DTS in China (d). DTS represents different timescales.

Figure 4.
Annual change in the SPI and SRI during 1902–2014 in the SLRB (a), HARB (b), YRB (c), HURB (d), YARB (e), SEB (f), PRB (g), SWB (h), and CB (i) river basins. R represents the correlation coefficient between the SPI and SRI on an annual scale.
Figure 4.
Annual change in the SPI and SRI during 1902–2014 in the SLRB (a), HARB (b), YRB (c), HURB (d), YARB (e), SEB (f), PRB (g), SWB (h), and CB (i) river basins. R represents the correlation coefficient between the SPI and SRI on an annual scale.

Figure 5.
Cross-wavelet analysis results between the SPI and SRI of river basins SLRB (a), HARB (b), YRB (c), HURB (d), YARB (e), SEB (f), PRB (g), and SWB (h), and CB (i). The thick contours denoting a 95% confidence level are shown as yellow fill surrounded by a black outline. The relative phase relationship is presented as arrows (with anti-phase toward the left and in-phase toward the right). The color bar to the right of the diagram denotes the wavelet energy. (For interpretation of the references to color in this figure legend, the reader is referred to the Web version of this article.).

Figure 6.
The primary driving factor of propagation from meteorological to hydrological drought in China. The drivers included P, PET, and SM.
Figure 6.
The primary driving factor of propagation from meteorological to hydrological drought in China. The drivers included P, PET, and SM.

Figure 7.
The proportion areas of primary drivers in the propagation from meteorological to hydrological drought across different river basins of China (a). The relative importance of drivers in drought propagation across different river basins of China (b). The drivers included P, PET, and SM.
Figure 7.
The proportion areas of primary drivers in the propagation from meteorological to hydrological drought across different river basins of China (a). The relative importance of drivers in drought propagation across different river basins of China (b). The drivers included P, PET, and SM.

Figure 8.
The monthly temperature (a) and annual average P (b) in 1901–2014 in different river basins.
Figure 8.
The monthly temperature (a) and annual average P (b) in 1901–2014 in different river basins.

Figure 9.
The proportion of topography (a) and seasonal precipitation (b) in different river basins. The proportion of seasonal precipitation in annual precipitation.
Figure 9.
The proportion of topography (a) and seasonal precipitation (b) in different river basins. The proportion of seasonal precipitation in annual precipitation.

Figure 10.
Map of the landforms in the SLRB (a), HARB (b), YRB (c), HURB (d), SEB (e), YARB (f), CB (g), PRB (h), and SWB (i) river basins. The topography data were provided by the Recourse and Environment Data Cloud Platform http://www.resdc.cn/ (accessed on 23 May 2022).
Figure 10.
Map of the landforms in the SLRB (a), HARB (b), YRB (c), HURB (d), SEB (e), YARB (f), CB (g), PRB (h), and SWB (i) river basins. The topography data were provided by the Recourse and Environment Data Cloud Platform http://www.resdc.cn/ (accessed on 23 May 2022).

Publisher’s Note: MDPI stays neutral with regard to jurisdictional claims in published maps and institutional affiliations. |
© 2022 by the authors. Licensee MDPI, Basel, Switzerland. This article is an open access article distributed under the terms and conditions of the Creative Commons Attribution (CC BY) license (https://creativecommons.org/licenses/by/4.0/).
Share and Cite
MDPI and ACS Style
Li, L.; Zhao, L.; Ge, J.; Yang, P.; Wu, F. Investigating Drought Propagation Time, Relationship, and Drivers in Perennial River Basins of China. Water 2022, 14, 2812. https://doi.org/10.3390/w14182812
AMA Style
Li L, Zhao L, Ge J, Yang P, Wu F. Investigating Drought Propagation Time, Relationship, and Drivers in Perennial River Basins of China. Water. 2022; 14(18):2812. https://doi.org/10.3390/w14182812
Chicago/Turabian StyleLi, Lusheng, Lili Zhao, Jiankun Ge, Peiwen Yang, and Feng Wu. 2022. "Investigating Drought Propagation Time, Relationship, and Drivers in Perennial River Basins of China" Water 14, no. 18: 2812. https://doi.org/10.3390/w14182812
Note that from the first issue of 2016, this journal uses article numbers instead of page numbers. See further details here.