Article

High Precision Extraction of Surface Water from Complex Terrain in Bosten Lake Basin Based on Water Index and Slope Mask Data

1
College of Geography and Remote Sensing Sciences, Xinjiang University, Urumqi 830046, China
2
Key Laboratory of Oasis Ecology, Urumqi 830046, China
3
GeoInformatic Unit, Geography Section, School of Humanities, Universiti Sains Malaysia, 11800 USM, Penang 10790, Malaysia
4
Departments of Earth Sciences, The University of Memphis, Memphis, TN 38152, USA
*
Author to whom correspondence should be addressed.
Water 2022, 14(18), 2809; https://doi.org/10.3390/w14182809
Submission received: 26 July 2022 / Revised: 29 August 2022 / Accepted: 6 September 2022 / Published: 9 September 2022

Abstract

:
The surface water extraction algorithm based on satellite remote sensing images is advantageous as it is able to obtain surface water information in a relatively short time. However, when it is used to extract information on surface water in large-scale, long-time series and complex terrain areas, there will be a large number of misclassified pixels, and a large amount of image preprocessing work is required. The accuracy verification is time-consuming and laborious, and the results may not be accurate. The complex climatic and topographic conditions in Bosten Lake Basin make it more difficult to monitor and control surface water bodies. Therefore, based on the GEE (Google Earth Engine) cloud platform, and the studies of the effect of nine kinds of water indexes on the surface water extraction in Bosten Lake Basin, this paper adds a slope mask to remove misclassified pixels and finds the best extraction method of surface water extraction in the basin by means of accuracy verification and visual discrimination through continuous iteration of index threshold and slope mask threshold. The results show that when the threshold value is −0.25 and the slope mask is 8 degrees, the index WI2019 has the best effect on the surface water information extraction of Bosten Lake Basin, effectively eliminating the interference of shadow and snow. The effect of water extraction in the long-time series is discussed and it was found that the precision of water extraction in the long-time series is also better than other indexes. The effects of various indexes on surface water extraction under complex terrain are compared. It can quickly and accurately realize the long-time series of surface water extraction under large-area complex terrain and provides useful guiding significance for water resources management and allocation as well as a water resources ecological assessment of Bosten Lake Basin.

1. Introduction

There is no life without water. Water plays a vital role in the survival of human beings and other creatures as well as the rise of civilization and development of human society. Surface water generally includes rivers, lakes, glaciers, and swamps. It is the main component of freshwater resources on earth, which is irreplaceable in maintaining the ecological balance of river basins as well as meeting human demands, including power, water supply, irrigation, industrial needs and others. Interestingly, changes in surface water area can reflect and characterize the impact of climate change and human activities on surface water. Quickly and accurately extracting surface water information and grasping the spatial distribution of surface water have important practical significance for flood and drought disaster research, water resources monitoring research, water resources management research, etc. [1,2]. The surface water in arid and semi-arid environments is threatened by both natural and anthropogenic pressures. Mapping the distribution of surface water bodies is essential for managing and addressing degradation of both water quantity and quality [3]. Before the application of remote sensing technology in mapping water resources, most of the water was extracted based on manual measurement. This manual method has low precision, a massive heavy workload, a large cost and poor macro and continuous and real-time monitoring effect, all of which are impediments in meeting the requirements spatially and temporally. On the other hand, remote sensing technology has the advantages of macro scale data collection, dynamic monitoring and low cost. The use of remote sensing images to extract water information can accurately grasp the spatial distribution status and changing trend of water bodies in basins, and provide basic data for comprehensive management of basins, flood monitoring and water resources protection and conservation, all of which are of great importance [4,5,6].
At present, there are many algorithms for extracting water information from remote sensing images. In general, these methods can be roughly divided into several categories: single band method [7,8], spectral relationship method [4,9], image classification method [10] and water index method. Among them, the water index method is a popular index widely used by researchers. The most influential water index algorithms mainly include Normalized difference water index (NDWI), which weakens the influence of nonwatery factors such as vegetation and soil. It is generally effective in extracting water from large lakes and reservoirs, but it still contains a lot of interference information in urban water extraction [11]. The modified normalized difference water index (MNDWI) is proposed on the basis of NDWI method, using Landsat TM short wave infrared (TM5) instead of near-infrared (TM4). MNDWI can weaken the impact of soil and buildings, but has a good effect on the removal of building shadows in urban areas [12]. The water index WI2006 uses the natural pairs of each band of landsat7 ETM+ images to reflect the reflection coefficient and interaction conditions and is used to extract wetlands covering eastern Australia [13]. The enhanced water index (EWI) is constructed by using the green light band (TM2), a near-infrared band (TM4) and mid-infrared band (TM5) of TM images, and this method is used to extract the water system information of semi-arid areas. This index allows the researcher to ignore the influence of atmospheric factors [14].
By analyzing the creation process of enhanced water index EWI, it is verified that the surface water can be extracted well whether the remote sensing image has been atmospherically corrected or not [15]. The modified normalized difference water index RNDWI (revised normalized difference water index) is constructed on the basis of analyzing the spectral characteristics of three ground feature types, viz. water, vegetation and soil. It can eliminate the influence of mountain shadows and accurately extract the water and land boundaries of Miyun Reservoir by using this index [16]. The new water index NWI (new water index) is proposed in combination with the strong absorption of water in the near-infrared and mid-infrared bands. NWI can partially eliminate the impact of solar altitude angle, terrain, shadow and atmospheric conditions, and its accuracy is very high [17]. The new water index NEW is a band ratio algorithm constructed by using the blue-green band (TM1) and mid-infrared band (TM7) of tm/etm+ images. This index can not only extract natural water but also eliminate the impact of terrain differences, thus solving the problem of shadow in water information [18].
In recent years, more new water indexes have been created with good verification results. For example, the automatic water extraction index AWEI is proposed based on TM image data. The main goal of AWEI is to separate water and nonwater pixels to the greatest extent by subtracting and adding between bands and assigning different coefficients to bands. It has been verified that AWEI has higher accuracy than MNDWI in extracting water information [19]. Another new index, Water index WI2015, is a water extraction algorithm based on linear discriminant analysis proposed on the basis of WI2006. The index uses linear discriminate anti-analysis classification (LDAC) to determine the coefficient of the best classification of the training area, which improves the classification accuracy [20]. The multi-band water index MBWI (multi-band water index) can weaken the impact of mountain shadows and dark pixels of buildings, and reduce the seasonal impact caused by changes in solar conditions [21]. Finally, the water index wi2019 (water index2019) is constructed on the basis of the analysis of the light break characteristics of water and snow, which improves the differentiation between water and snow in the classification process.
Among the numerous water remote sensing information extraction technologies, the one based on water remote sensing index is undoubtedly the most widely used. At present, the global and regional surface water distribution mapping is almost inseparable from the water remote sensing index. Some scholars carried out early high-resolution remote sensing mapping of global land surface water bodies [22], in which NDWI (normalized difference water index) and MNDWI (modified NDWI) water index were used as the main technologies. Taking MNDWI as a key algorithm, the global river distribution range and area can be calculated [23]. With the continuous construction and improvement of water index, many water indexes have been developed and often used to compare the effects of surface water extraction in the process of extracting surface water in different regions and are now widely used for surface water extraction in inland water bodies, wetlands, delta areas, coastal areas, dry, arid and semi-arid and other complex terrains [23,24,25,26,27,28,29]. These studies have achieved good water extraction results in the study area. Different water indexes have different advantages in surface water information extraction. The construction of new water indexes is based on the spectral information difference of typical ground object sample points in study area. They often achieve high extraction accuracy and differentiation effect within a study area. When selecting other study areas for verification, the extraction effect tends to decline, with the threshold value of extracted surface water also changing greatly [20,30,31]. When the threshold value is too small, it cannot effectively eliminate the misclassification of pixels, whereas too large a domain value will cause the loss of surface water information. In the specific application process, the automatic optimal threshold selection method often cannot achieve the best water extraction effect [32]. Therefore, it is necessary to optimize the water index and find the optimal threshold when using the water index to explore the change in water area in the study area [33].
Various water indexes have different effects when they are used to distinguish between water bodies and nonwater bodies. Shadows, ice, snow and clouds are the main misclassification types of water bodies. Through preliminary research, water indexes AWEInsh and WI2019 can more effectively remove the effects of shadows and dark surfaces on surface water differentiation in the study area than other water indexes, but the effect on distinguishing ice, snow and water bodies is poor. Although WI2019 can effectively distinguish ice, snow and water bodies, the effect of distinguishing shadows is not good. Snow and ice in the region are mainly distributed in mountainous areas with high altitudes and large slopes. The shadow is also caused by the slope due to the land’s topography. In places with a large slope, it is difficult to retain water bodies. Some scholars have tried to apply topographic factors to the process of surface water extraction and achieved good results [9,34]. Therefore, using slope data as a mask can effectively eliminate snow and shadow areas that are mistakenly classified as water pixels. Using the GEE cloud platform to call remote sensing images in the database can avoid a lot of image and processing work. Recently, many scholars have used the GEE platform to extract large-scale, long-time series surface water bodies and achieved good extraction results [35,36,37,38,39,40]. During the iteration of water index threshold and slope, the effect of the water extraction image and accuracy verification results can be observed synchronously to drive the final results. Theoretically, the GEE platform can be used to explore the optimal method of water extraction in any image area, and this greatly increases the work efficiency. Furthermore, it can realize the comparison of regional long-time water extraction effects under the GEE platform. The purpose of this paper is: (1) To realize the calculation and display of the water index under the GEE platform, and to explore the applicability of various water indexes under complex terrain; (2) By iterating the water index threshold and slope mask threshold, the most suitable water index method and the best threshold for water extraction in Bosten Lake Basin are determined; (3) To realize the water extraction in the long-time series within the watershed and discuss the stability of different indexes in the long-time series.

2. Materials and Methodology
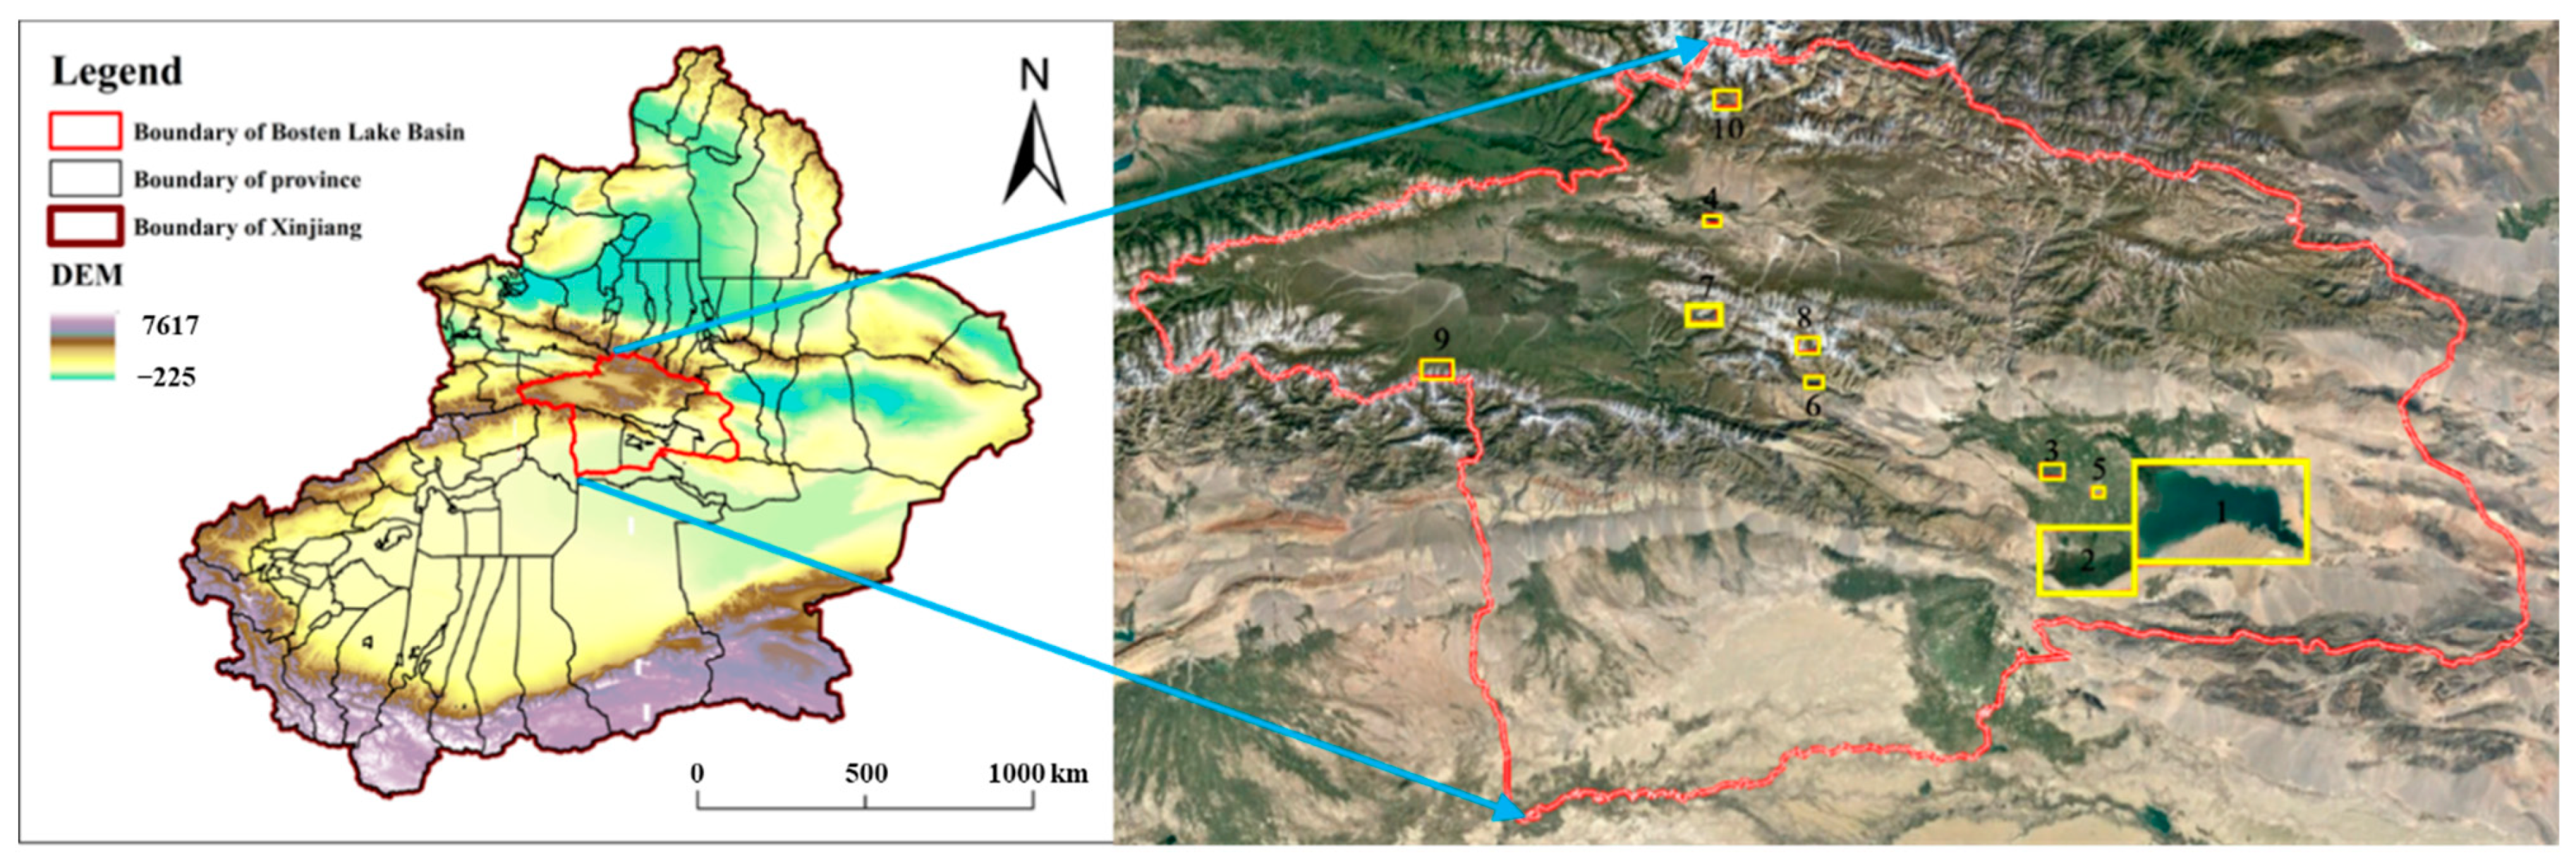
2.1. Study Area

In this paper, the boundaries of seven county and city level administrative divisions are merged as the research boundary of Bosten Lake Basin (Figure 1). Bosten Lake Basin, also known as the Kaidu River-Kongque River Basin, is located in the inland arid area of Xinjiang, China. Its geographical coordinates are 85°20′~87°25′ E, 41°10′~43°30′ N. Although Bosten Lake basin is mainly composed of Kaidu River Basin and Kongque River Basin, it also includes Yanqi Basin and its surrounding mountainous areas, and most areas to the north of the lower reaches of the Tarim River. Bosten Lake Basin is adjacent to Tianshan Mountains in the north and Tarim Basin in the south. The terrain is high in the northwest and low in the southeast. The geomorphic division belongs to the Tianshan Mountains region, including three small areas of Tianshan Mountains, Youledus basin and Yanqi Basin. The entire basin has a total area of 7.7 × 10⁴ km2, accounting for 45.06% of the drainage area. The basin is not totally mountainous as the plain area is 4.26 × 10⁴ km2, accounting for 55.32% of the drainage area. The landform in the area is complex as Bosten Lake Basin is surrounded by mountains on three sides. The overall terrain is high in the north and south, West and low in the East. The geomorphic units in the basin can be divided into intermountain basin landform, canyon landform and alluvial proluvial basin landform, of which the large and small Yudus basins belong to intermountain basin landform. The reach from the source of Kaidu River to the river canyon in the north of Yanqi basin is canyon landform, and the terrain height is obviously graded. The Kaidu River enters the Yanqi Basin from the east of Dashankou. The terrain is relatively flat and open, showing the geomorphic characteristics of an alluvial proluvial basin. The Yanqi basin is a local faulted basin formed between the main vein of the eastern Tianshan Mountains and its branches. Bosten Lake is in the southeast of the Yanqi Basin. There are a large number of relatively small wetland lakes in the southwest and northwest of Bosten Lake. Bayinbuluk grassland also contains many wetland water bodies, and a large number of snow mountains are distributed in the region, with the terrain fluctuating greatly. There are many seasonal rivers and lakes supplied by snow melt under the snow mountain terrain. As the longest river in the region, the Kaidu River flows through the main cities, mountains, deserts, wetlands, and other landforms in the region. These complex landforms jointly increase the difficulty of surface water monitoring and regulation in Bosten Lake Basin.

2.2. Data Resources

The data used in this paper mainly include Landsat8 OLI, Landsat7 ETM, Bosten Lake Basin vector boundary, and Google Earth high-resolution image and (JAXA/ALOS/AW3D30_V1_1) elevation data in GEE platform database.
The image used for the optimal water index threshold and slope and discussion selects the USGS Landsat 8 Collection 1 Tier 1TOA Reflection (“LANDSAT/LC08/C01/T1/TOA”) data with cloud cover less than 8% from May to August 2021. In order to explore the surface water extraction effect of various indexes in the long-term academic column, a total of 108 images with less than 8% cloud cover in the USGS Landsat 8 Collection 1 Tier 1 TOA Reflection (“LANDSAT/LC08/C01/T1/TOA”) from 2013 to 2021 in the Google Earth engine database are used, and 156 images with less than 8% cloud cover in the USGS Landsat 7 Collection 1 Tier 1 TOA Reflection (“LANDSAT/LE07/C01/T1/TOA”) from 2000 to 2012 are used (Figure 2), and the elevation data call (JAXA/ALOS/AW3D30_V1_1) is used, including the latest 2021 Google Earth high-resolution image images provided by Google Earth Pro and Ovey Interactive Maps to compare the extraction effect.

2.3. Methodology

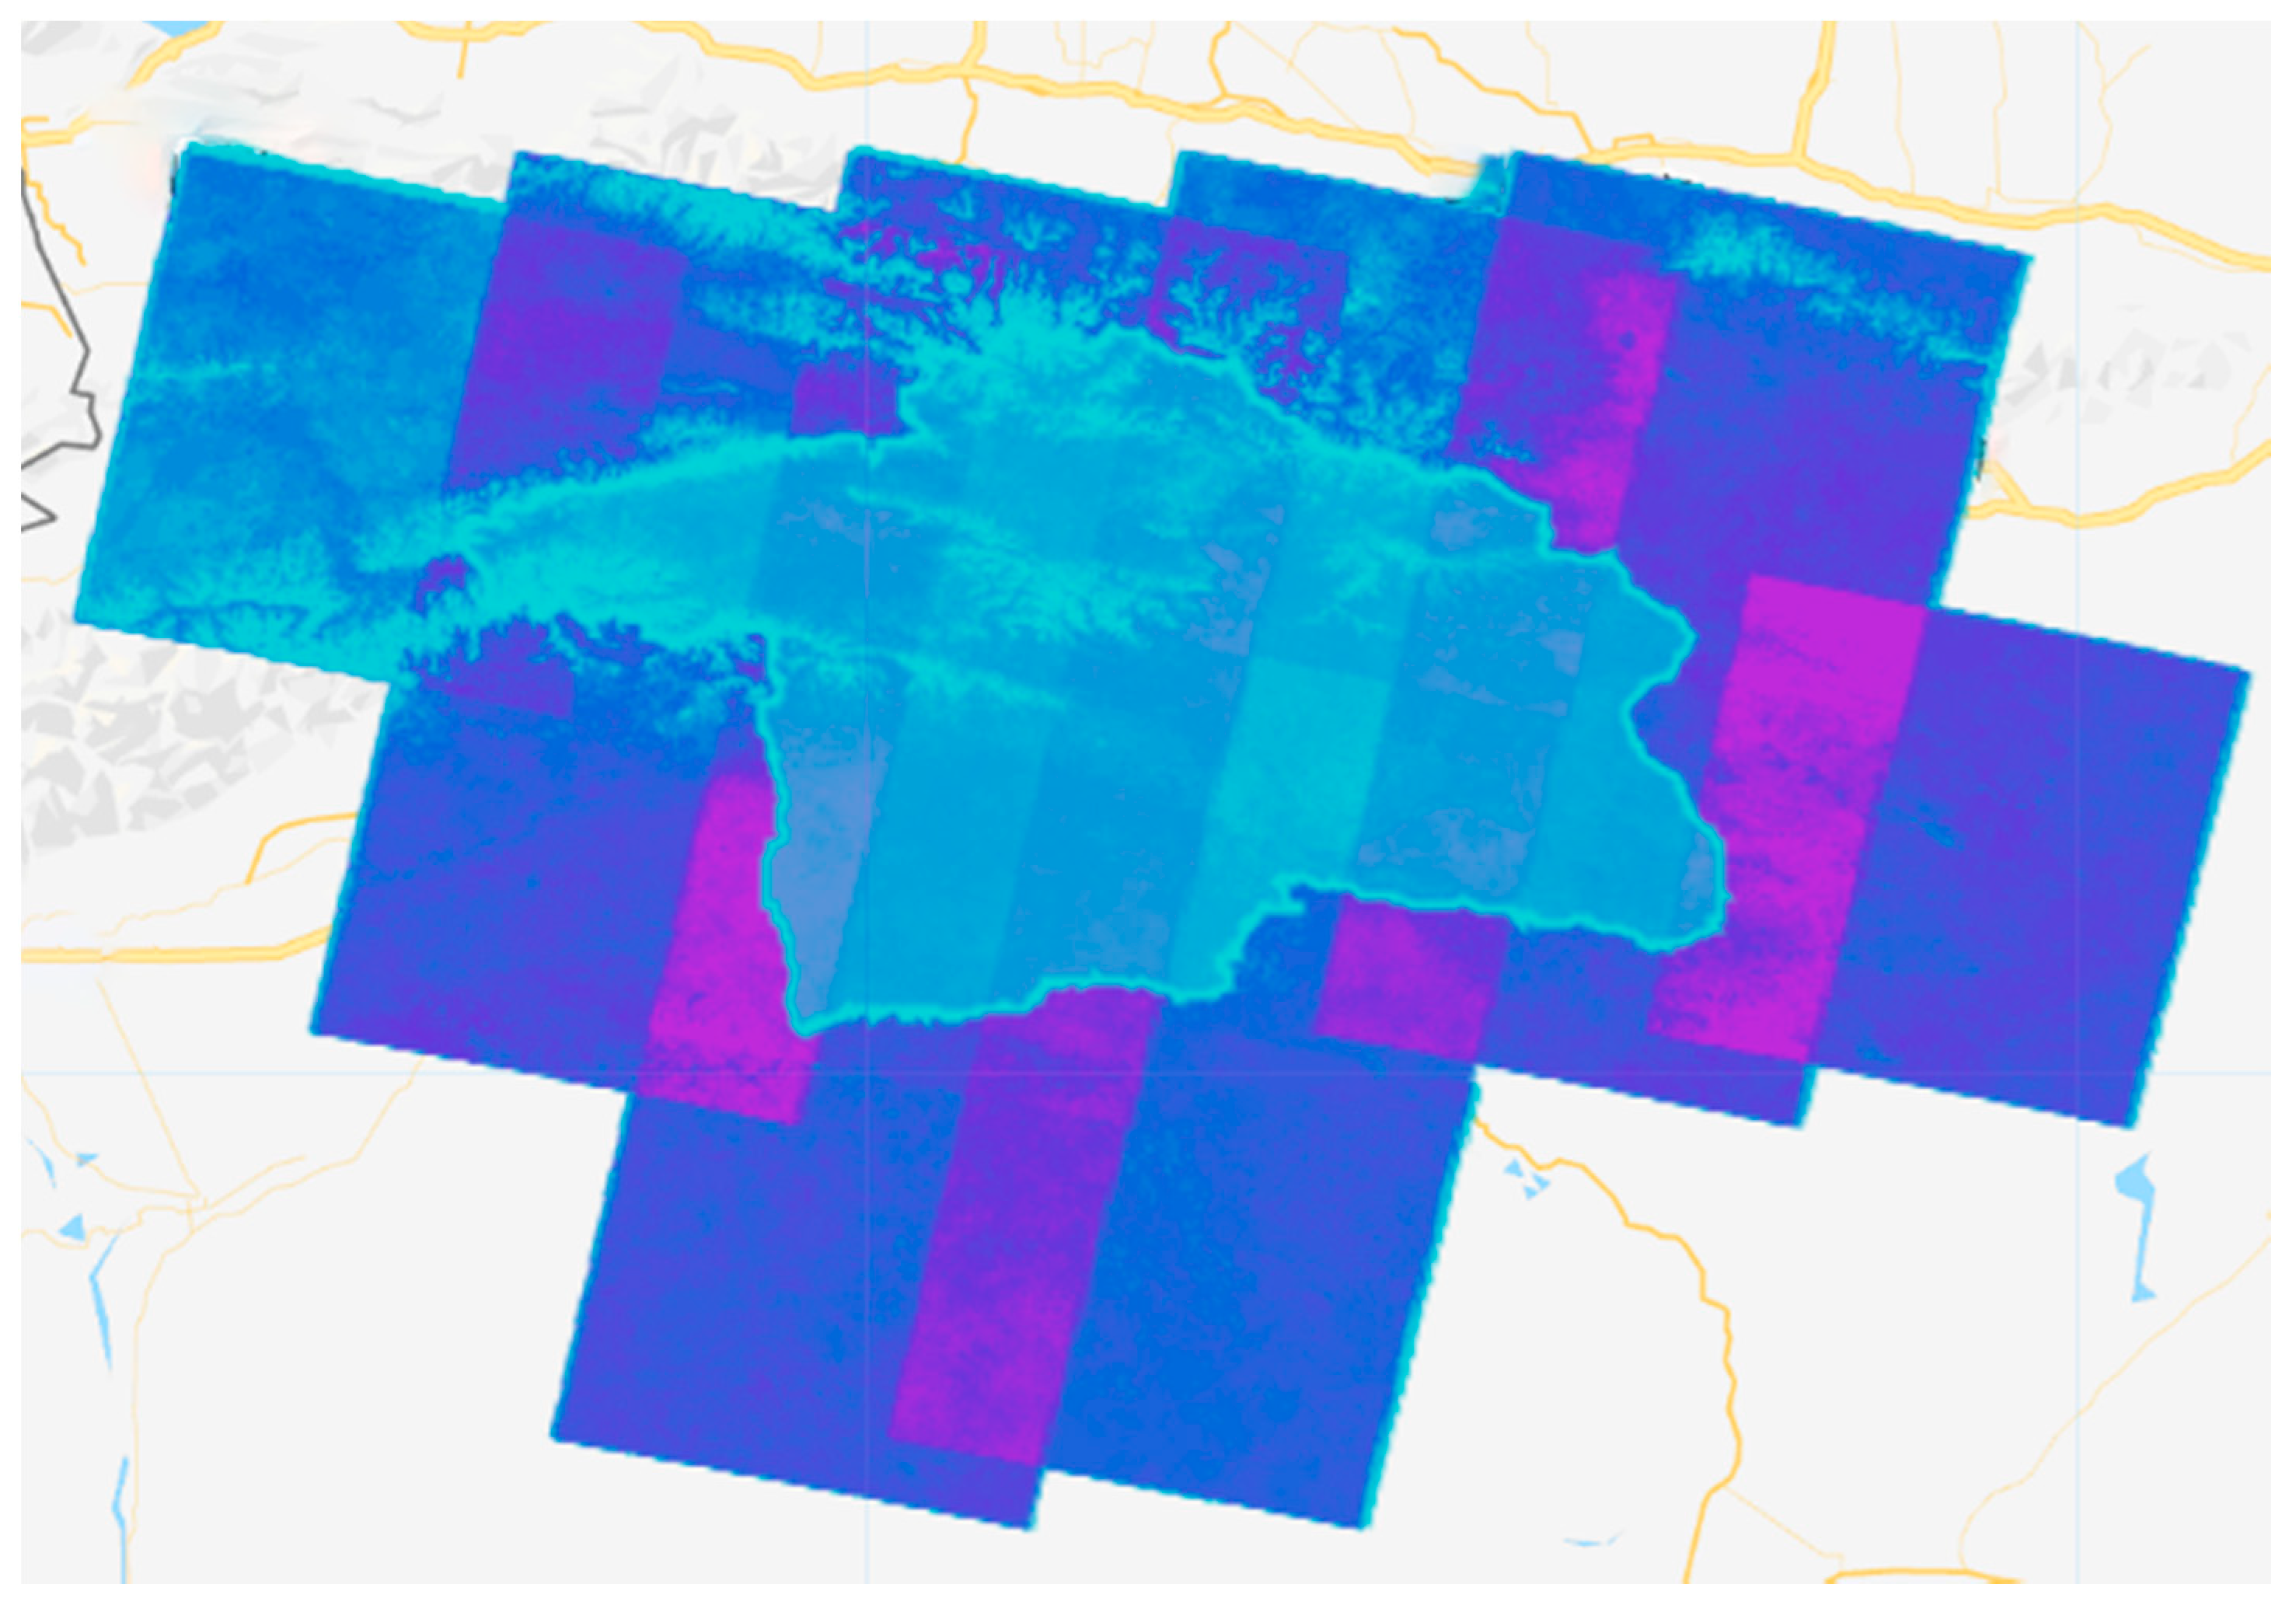
2.3.1. Remote Sensing Image

The ee.ImageCollection function calls the USGS Landsat 8 Collection1 Tier1 TOA Reflection dataset in the GEE database and sets the time interval from May to July 2021. The image BQA band is used for traffic screening and cloud removal. The image ‘B6’, ‘B7’, and ‘B4’ bands are set to the red, green and blue channels, respectively. Map.addlayer function performs false color synthetic display of images, highlighting the differences between water bodies and other ground objects, and serves as the basis for sample point selection and one of the bases for surface water extraction effect.

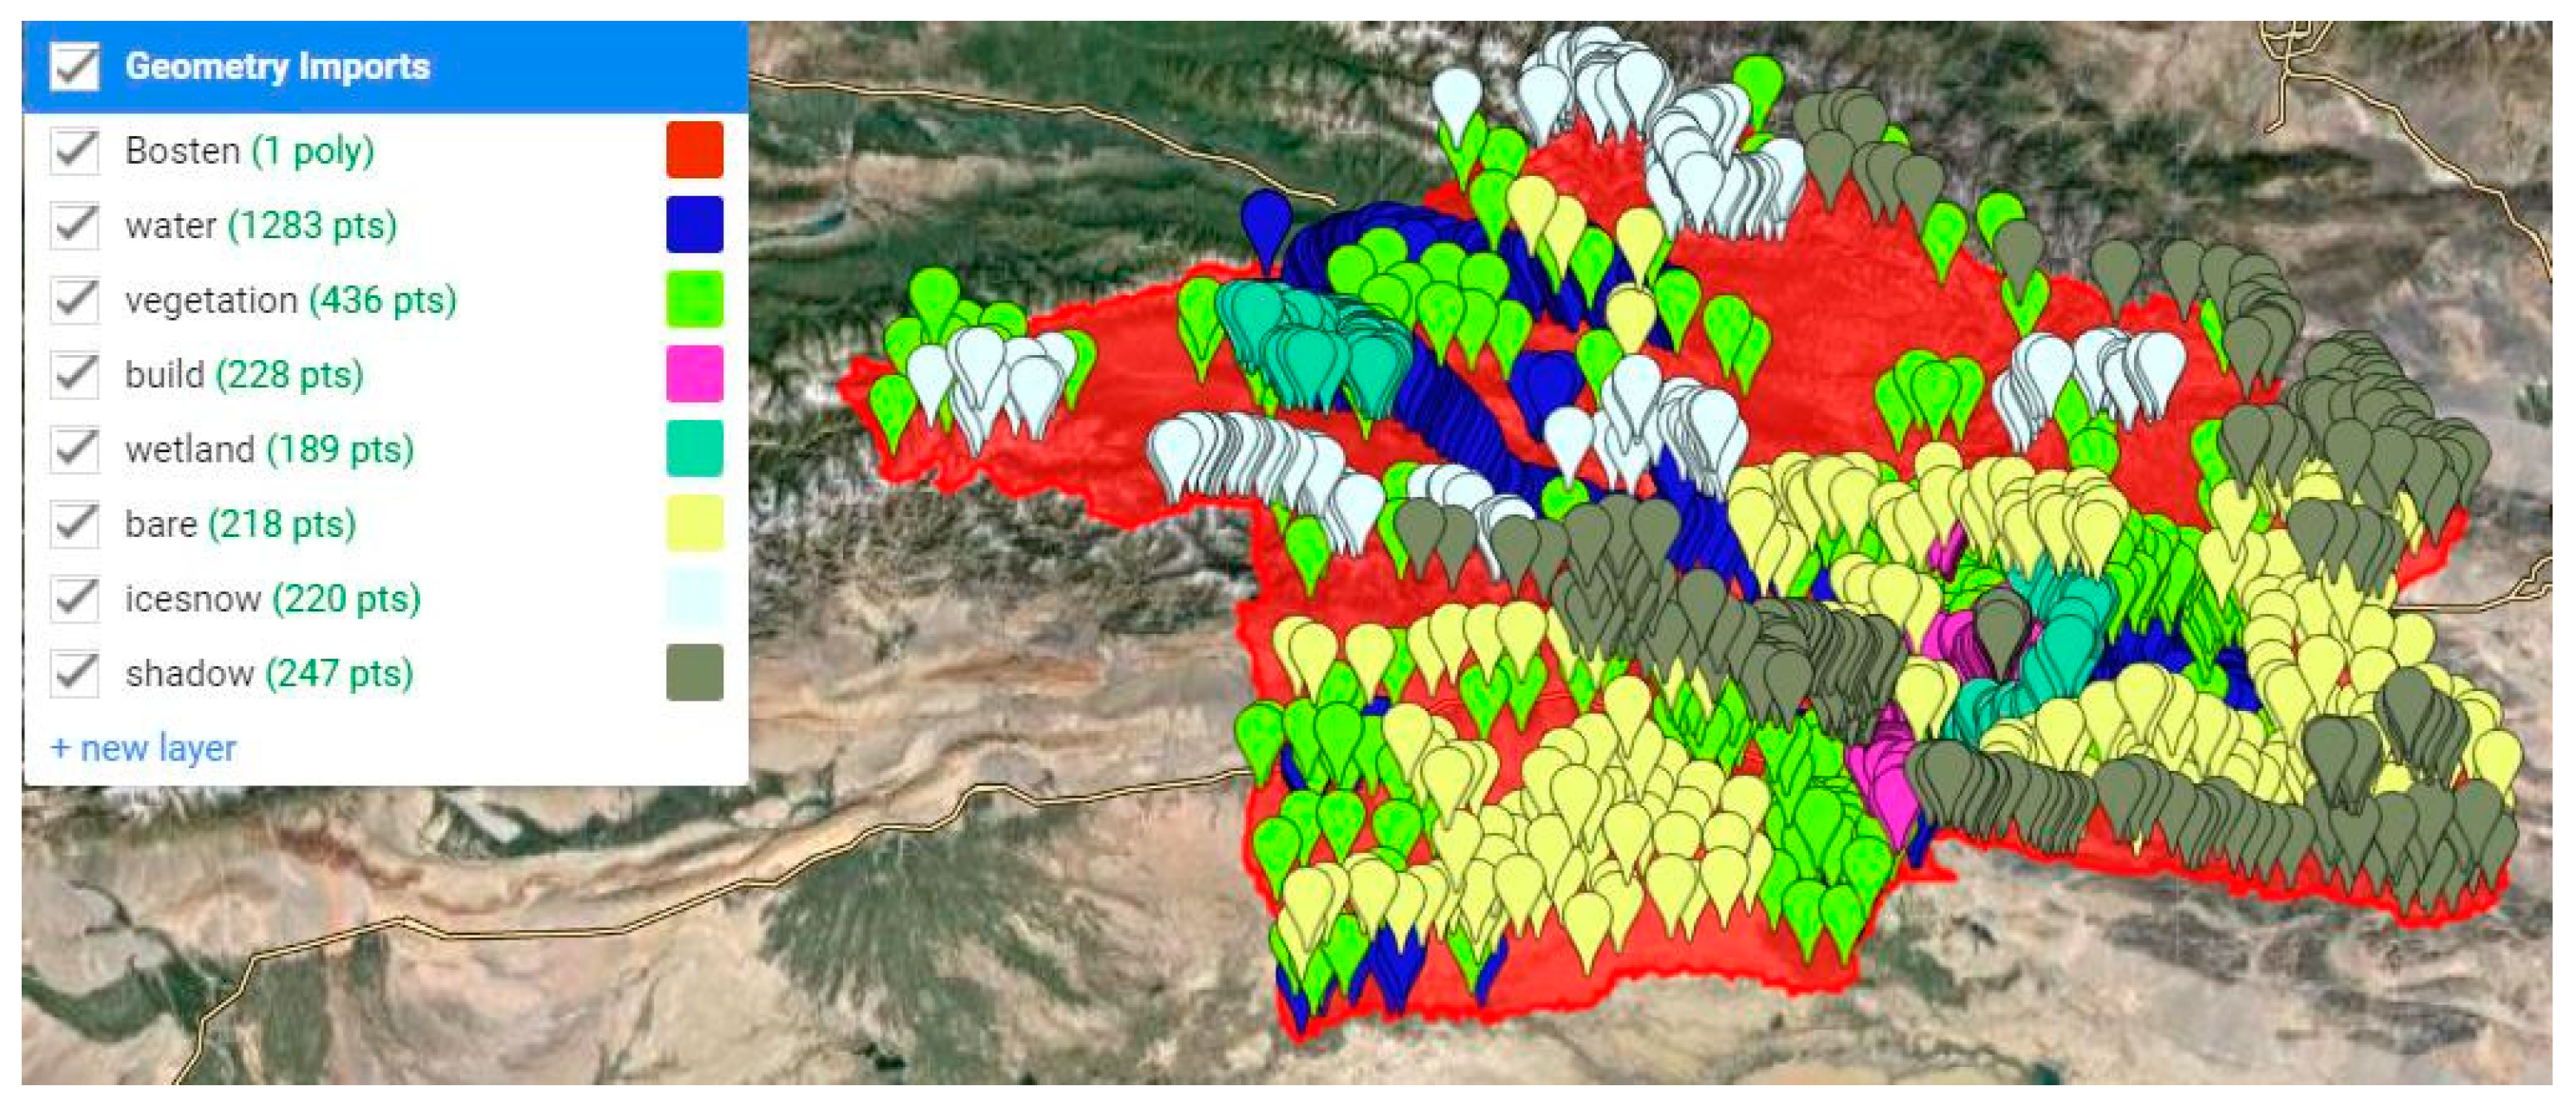
2.3.2. Selection of Sample Points for Accuracy Verification

Based on the GEE platform, the Configure geometry import tool was used to create six categories of ground objects. In combination with Google Earth satellite images and landsat8 false color composite images, 1283 water sample points (Figure 3) and 1538 nonwater sample points were selected in the study area, including 436 vegetation sample points, 228 building sample points, 189 wetland sample points, 218 bare land sample points and 220 snow sample points. Additionally, 247 shadow sample points are used as the basis for verification of water extraction accuracy and supervision and classification.
In order to reflect the correctness of sample point selection, the sampleRegions function is used on the GEE platform to extract the reflectance values of all bands under each sample point of various ground objects, and the average value is obtained to prepare the spectral characteristic curve of typical ground objects in Bosten Lake Basin (Figure 4). It can be seen from the figure that the spectral reflectance characteristics of ground objects in the flow domain conform to the spectral characteristics of typical ground objects, which proves the correctness of sample point selection.

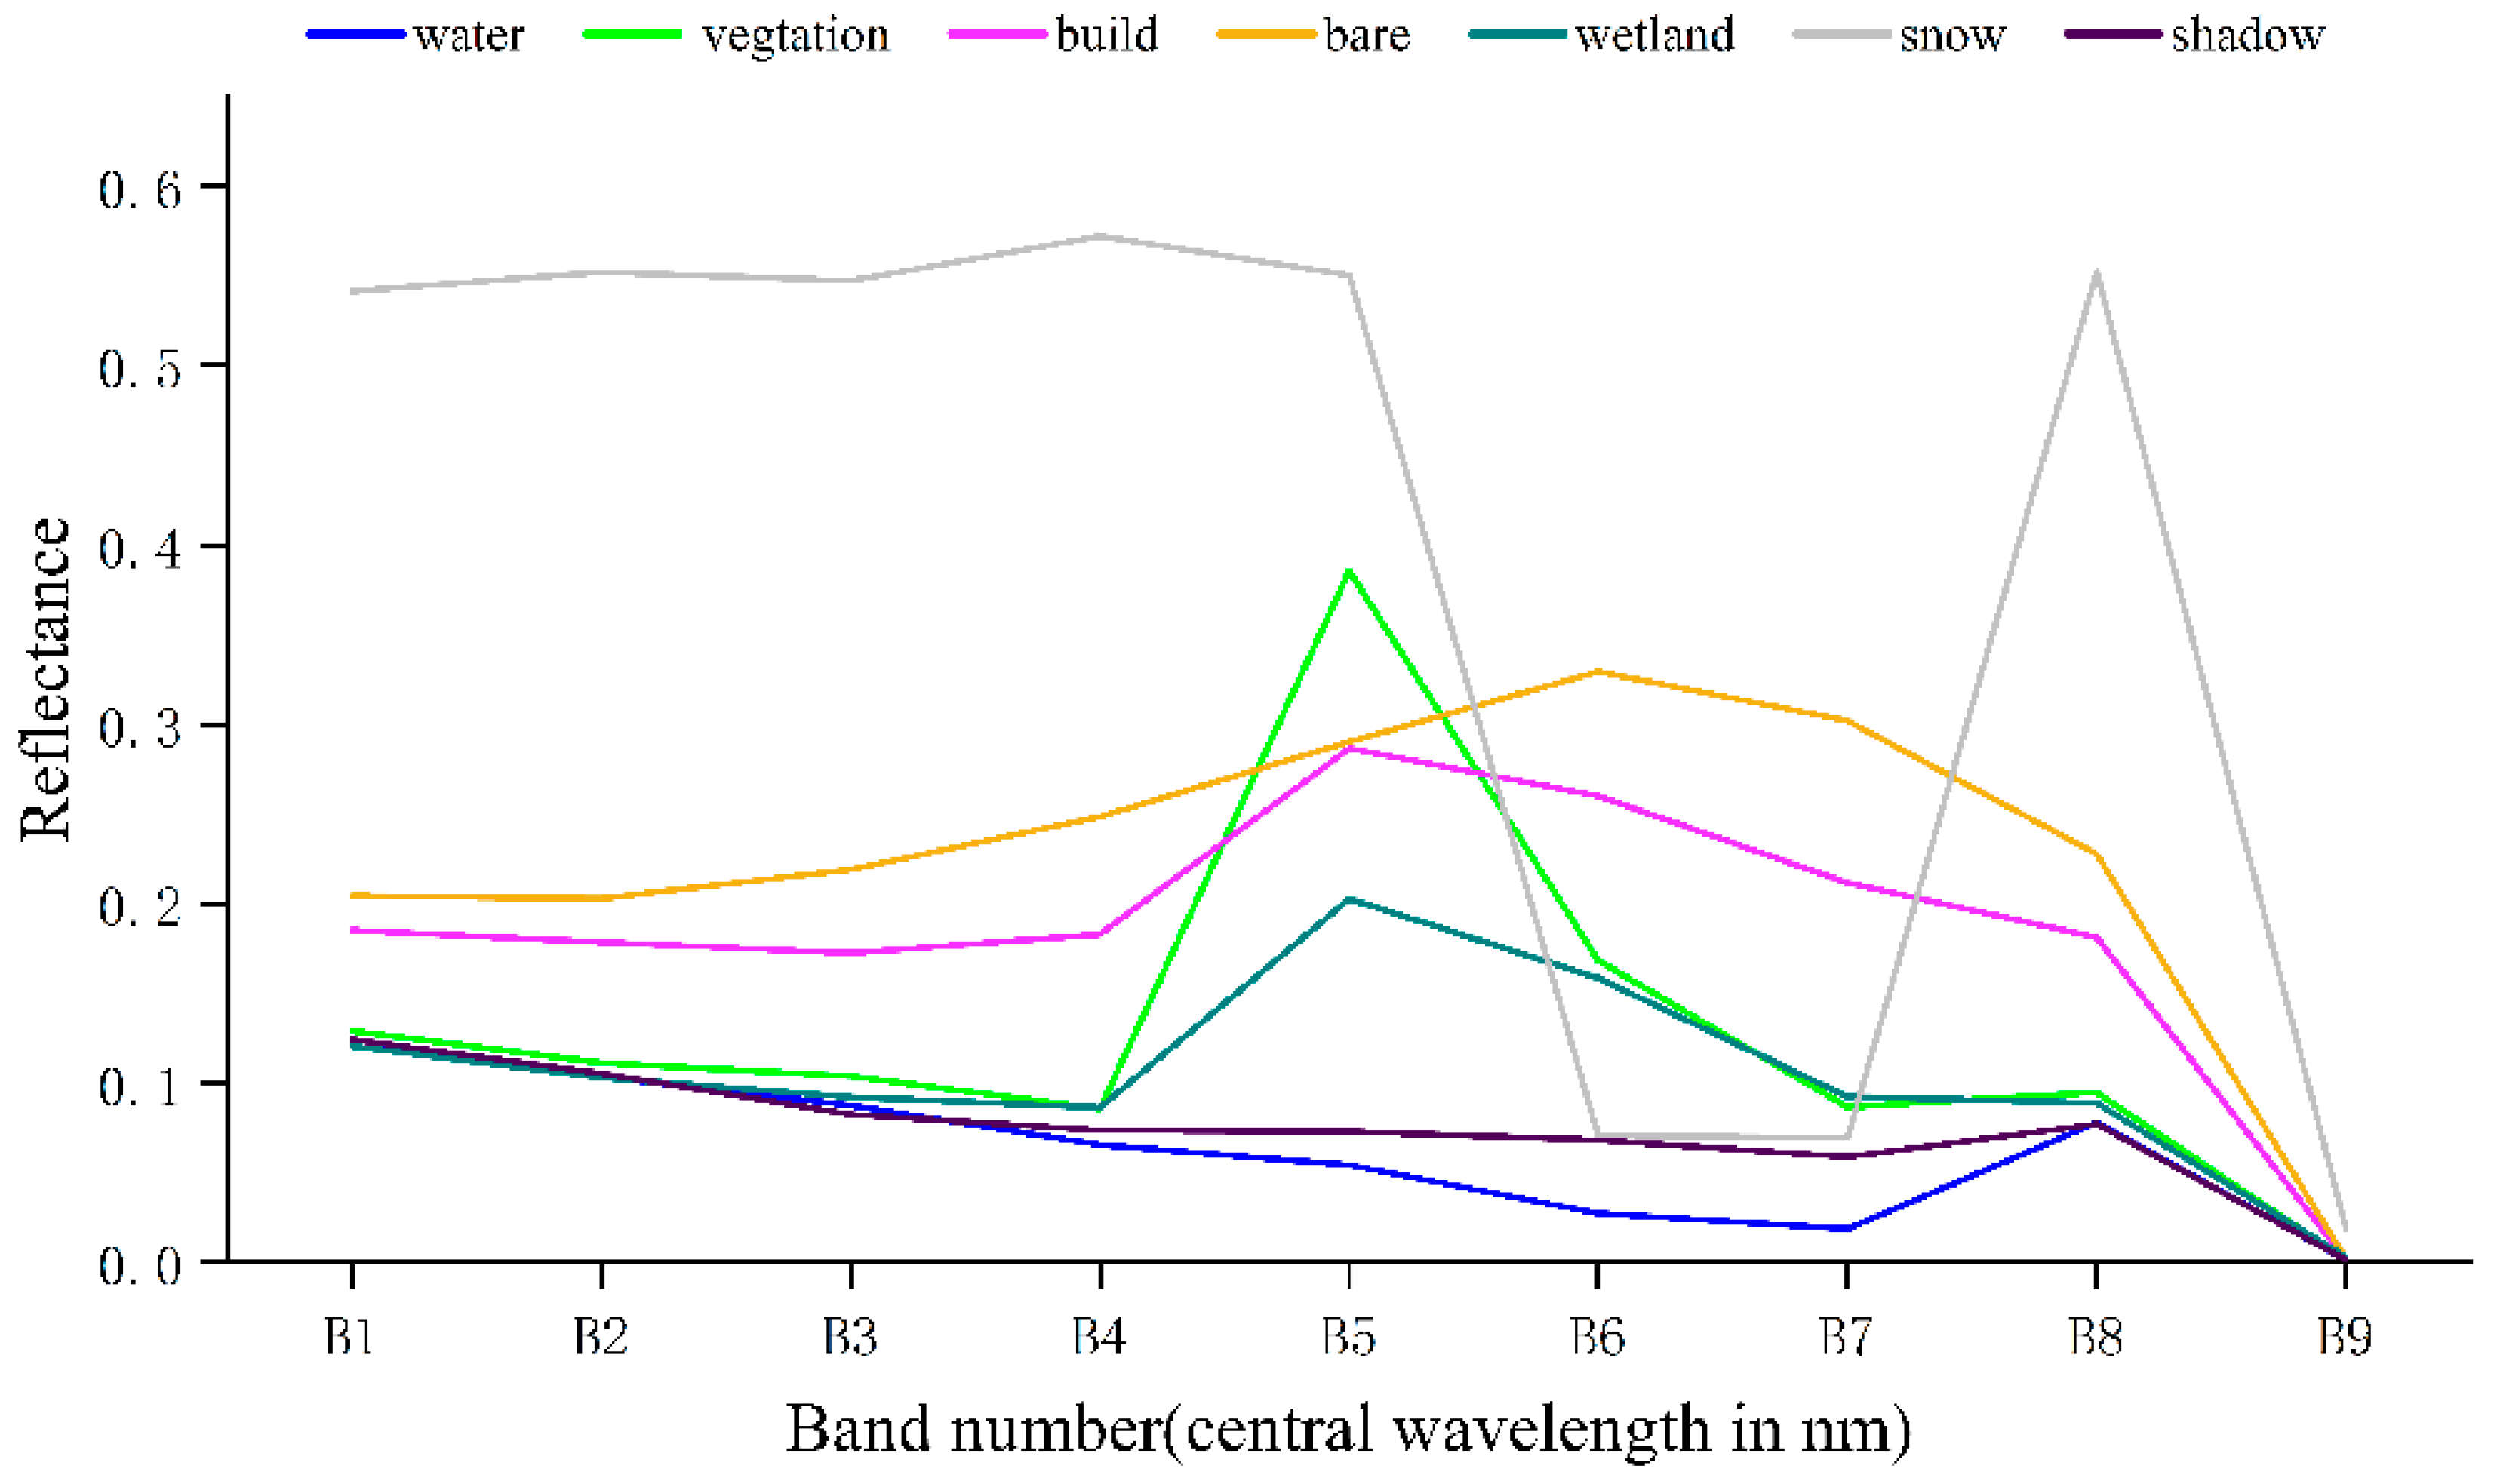
2.3.3. Selection of Water Index and Realization of Index Calculation

By consulting the relevant literature on the construction of the water index, the water index suitable for Landsat series images is selected (Table 1). The normalized difference and expression functions are used to calculate the index band on the GEE platform, and Map.addLayer function shows the result of the exponential operation. The reclassification judgment formula is used to calculate the water index. A pixel greater than 0 in the grid image is assigned as 1 as the surface water pixel, whereas a pixel less than 0 is assigned as 0 as the nonsurface water pixel, so as to distinguish the surface water and nonsurface water with 0 as the threshold. The Map.addLayer function displays the exponential operation results by using Export.image. to drive function exports of the final water extraction grid image to Google cloud disk and downloads it locally. Arcmap10.8 is used to further display and analyze the results.

2.3.4. Use of Slope Mask and Determination of Optimum Threshold of Surface Water

In order to further eliminate the interference of snow and shadow and improve the accuracy of surface water extraction, slope factor judgment conditions are added to the index calculation results, and areas with excessive slope are divided into nonwater bodies. The constructed sample points are used as the verification basis. The Terrain.slope function converts (JAXA/ALOS/AW3D30_V1_1) DEM data into slope data, sets the data type of sample points to FeatureCollection, sets the Property of water extraction sample points to Class1 and the value to 1 and sets various nonwater sample points to FeatureCollection after fusion, with the Property set to class2 and the value set to 0. The Validation.filter function, which outputs the confusion matrix, overall accuracy, user accuracy, producer accuracy and kappa coefficient, are used as the basis for accuracy determination. The change of water extraction accuracy was observed by iterating the index threshold and slope mask. On the basis of threshold iteration, various indices are set at t (threshold) = 0, s (slope) = 0; t = 0, b = 10; t = b (best value), s = 0; water extraction is carried out in the four cases of t = b and s = b, and compared with Google Earth HD image to further identify the effect of water extraction.

2.3.5. Discussion on Extraction Methods of Other Water Bodies

In the process of extraction by the GEE window shows and satellite image layer, preliminary extraction results found that although the various indexes of regional water extraction effects are not the same, the water main area can be extracted by a large number of falsely divided bodies of water feature category, mainly for the mountain shadow and snow body city shadow, wetlands and other false points such as pixels compared to the previous two kinds or types. In order to discuss the classification details, LibSVM, SmileCart and MininumDistance classifiers were used for supervised classification using water sample points and non-water sample points on the GEE platform, and 10 typical water areas were selected in the study area for further visual discrimination of water extraction effect.

2.3.6. Validation of Water Extraction Accuracy in Long-Time Series

The third method of accuracy verification was to verify the stability of the water extraction effect in a long-time series by using the difference between water areas in dry and wet seasons. Therefore, to further explore the water extraction effect of various water indexes in the long-time series under the optimal water index and the optimal slope mask threshold, May–August and September–October were taken as the dry season and the wet season, respectively, in Bosten Lake Basin, and Landsat7 ETM and Landsat8 OLI were used to calculate the water area of various water indexes in the dry season and wet season from 2000 to 2021. The pixel value of surface water is set as 1 and that of non-surface water is set as 0. The pixel value of 1 multiplied by them is defined as the permanent surface water. Formula (1) is used to calculate the misdivided area of surface water in a long-time series. The surface water existing in both the dry season and wet season should be close to the one with the smaller area of the two. The reason why the permanent surface water is smaller is that the misdifferentiated pixels are removed during the superposition operation of surface water results in the dry and wet seasons. Therefore, the smaller the difference value is, the fewer misdifferentiated pixels are and the higher the surface water extraction accuracy is, which can be used as the basis for judging the surface water extraction effect.
E = i = 1 n min ( A d s , A w s ) A p n
Note: in the formula, E represents the annual average misclassified area, Ads represents the extracted area of water in dry season, Aws represents the extracted area of water in wet season, and Ap represents the permanent water area.

3. Results and Analysis

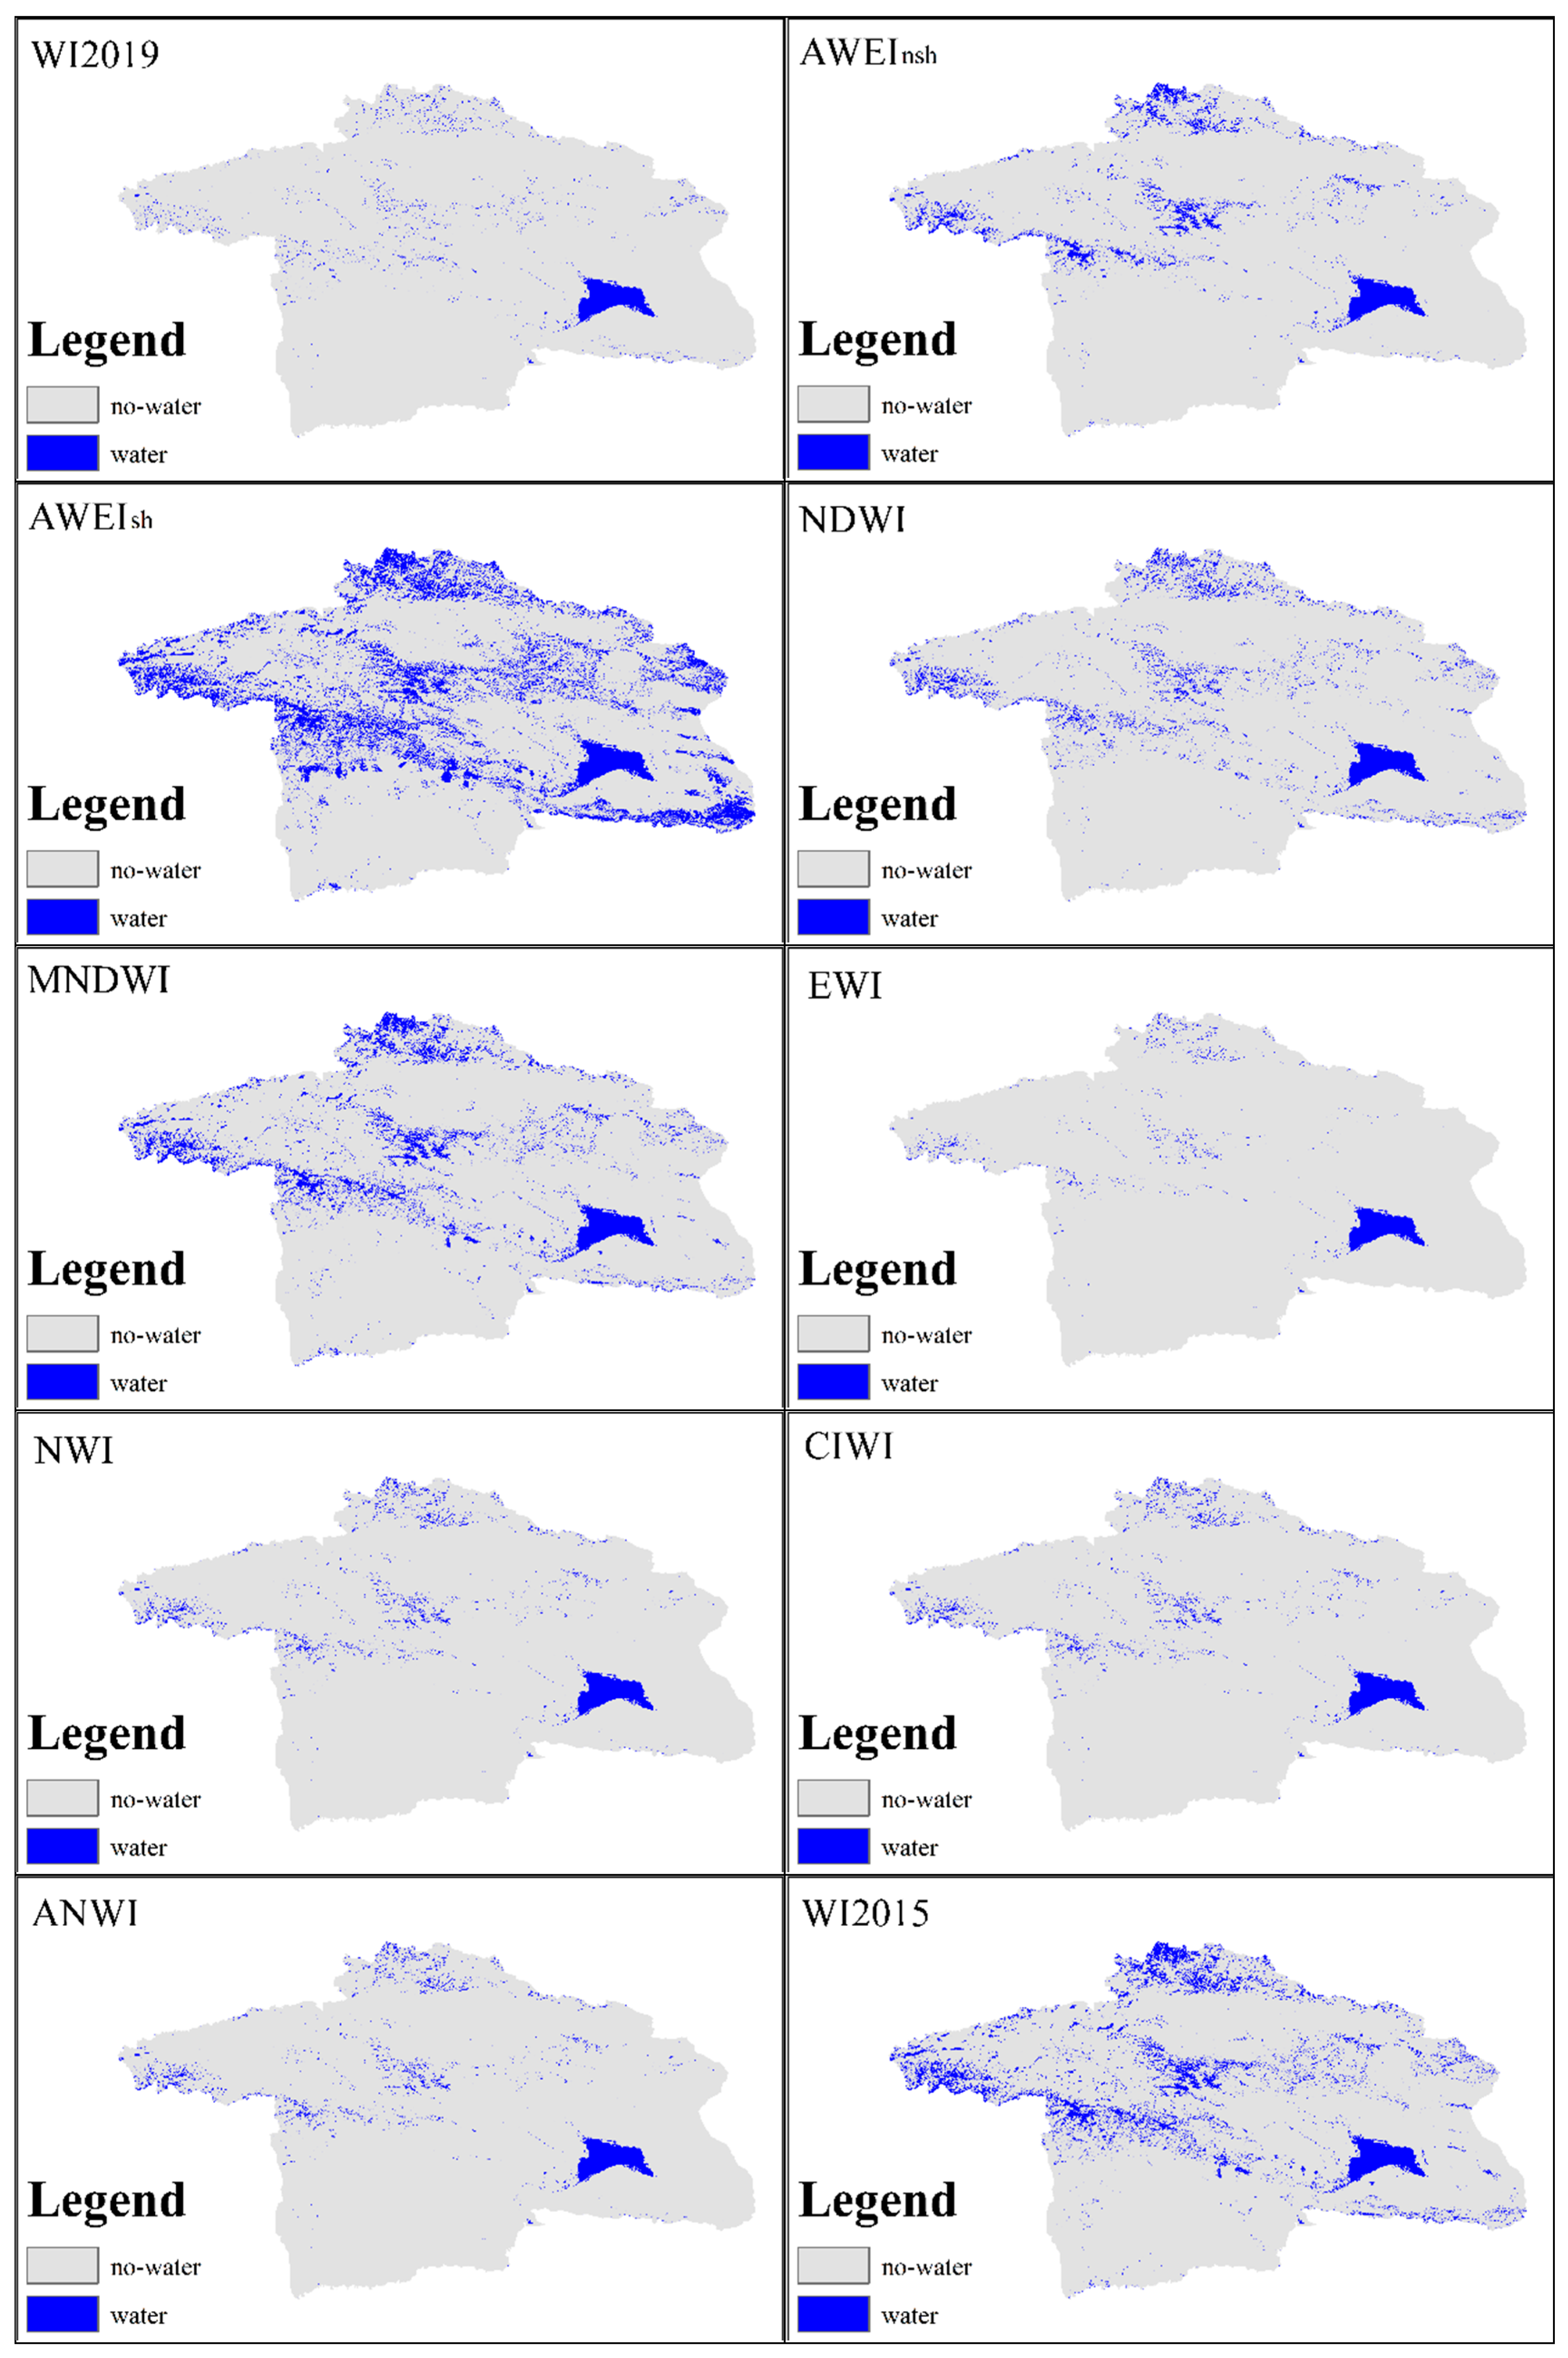
3.1. Extraction Effect of Surface Water with Water Index 0 as Threshold Value

It can be seen from Figure 5 and Figure 6 that a large number of non-water pixels are misclassified into water pixels when various indices are used as the threshold of 0 for water extraction. According to the results, WI2019 and EWI have the best water extraction effect, whereas AWEIsh, MNDWI and WI2015 have poor extraction effects. The water index extraction effect is compared in detail with Site1-lake, Site2-wetland, Site3-river, Site4-small surface water, Site5-city surface water, Site6-mountain surface water and the snow mountain surface water region corresponding to Figure 1 in the region. Results showed that the water index in lakes, rivers and the urban area obtained good results of water extraction, but in complex areas, WI2019 distinguishes better between snow and water effect. However, AWEInsh is better than that of WI2019 for distinguishing shadow and water bodies, as most of the shadow is divided into surface water and the snow pixels, and the slope is the main cause of shadow, where a large amount of snow is also distributed on hills at higher altitudes. Therefore, a slope mask based on index WI2019 can further remove the misclassification pixels caused by mountain snow and mountain shadows.

3.2. Changes of Extraction Accuracy under Water Index Threshold and Slope Iteration

The slope mask is added on the basis of the optimization of water index threshold. Through the continuous iteration of nine water index thresholds and slope thresholds, the accuracy of water extraction results by different methods is evaluated based on the overall accuracy, user accuracy, producer accuracy and kappa coefficient generated by the selected surface feature sample points in the study area, as shown in Table 2.
It can be seen from Table 2 that when the threshold value is 0 and slope is 0 for exponential water extraction, the overall accuracy is between 0.6–0.7 and the kappa coefficient is between 0.25–0.35. The user accuracy and producer accuracy of surface water and non-surface water are very different, with one being higher and the other being lower. With 0 as the threshold index calculation, results for the distinction between water and the water effect is poorer. However, with zero as the slope, and through iteration to find the best threshold value of various index, it was found that all kinds of indexes under the best threshold and under the extraction accuracy, in comparison with 0 as the threshold of the extraction, will only slightly improve accuracy when the threshold value is 0, and the slope for water extraction is 10. When each index of the extraction of the overall accuracy reached 0.8 or more, the user accuracy and producer accuracy exceeded 0.8, and when the gap is not big, the kappa coefficient reached 0.8 above, which can greatly improve the wetland information extraction effect and can effectively remove the water pixels. On the basis of the water index, iteration threshold and the slope, it was found that WI2019 and AWEInsh achieved the highest accuracy with the best threshold and slope threshold. When the threshold of WI2019 was −0.15 and the slope mask threshold was 8, the overall accuracy reached 0.94 and the kappa coefficient reached 0.89. When the AWEInsh threshold is −0.09 and the slope is 5, the overall accuracy reaches 0.937 and the kappa coefficient is 0.87. The three supervised classification methods also achieve high extraction accuracies. Therefore, complex terrain is further selected for visual discrimination of the water extraction effect.

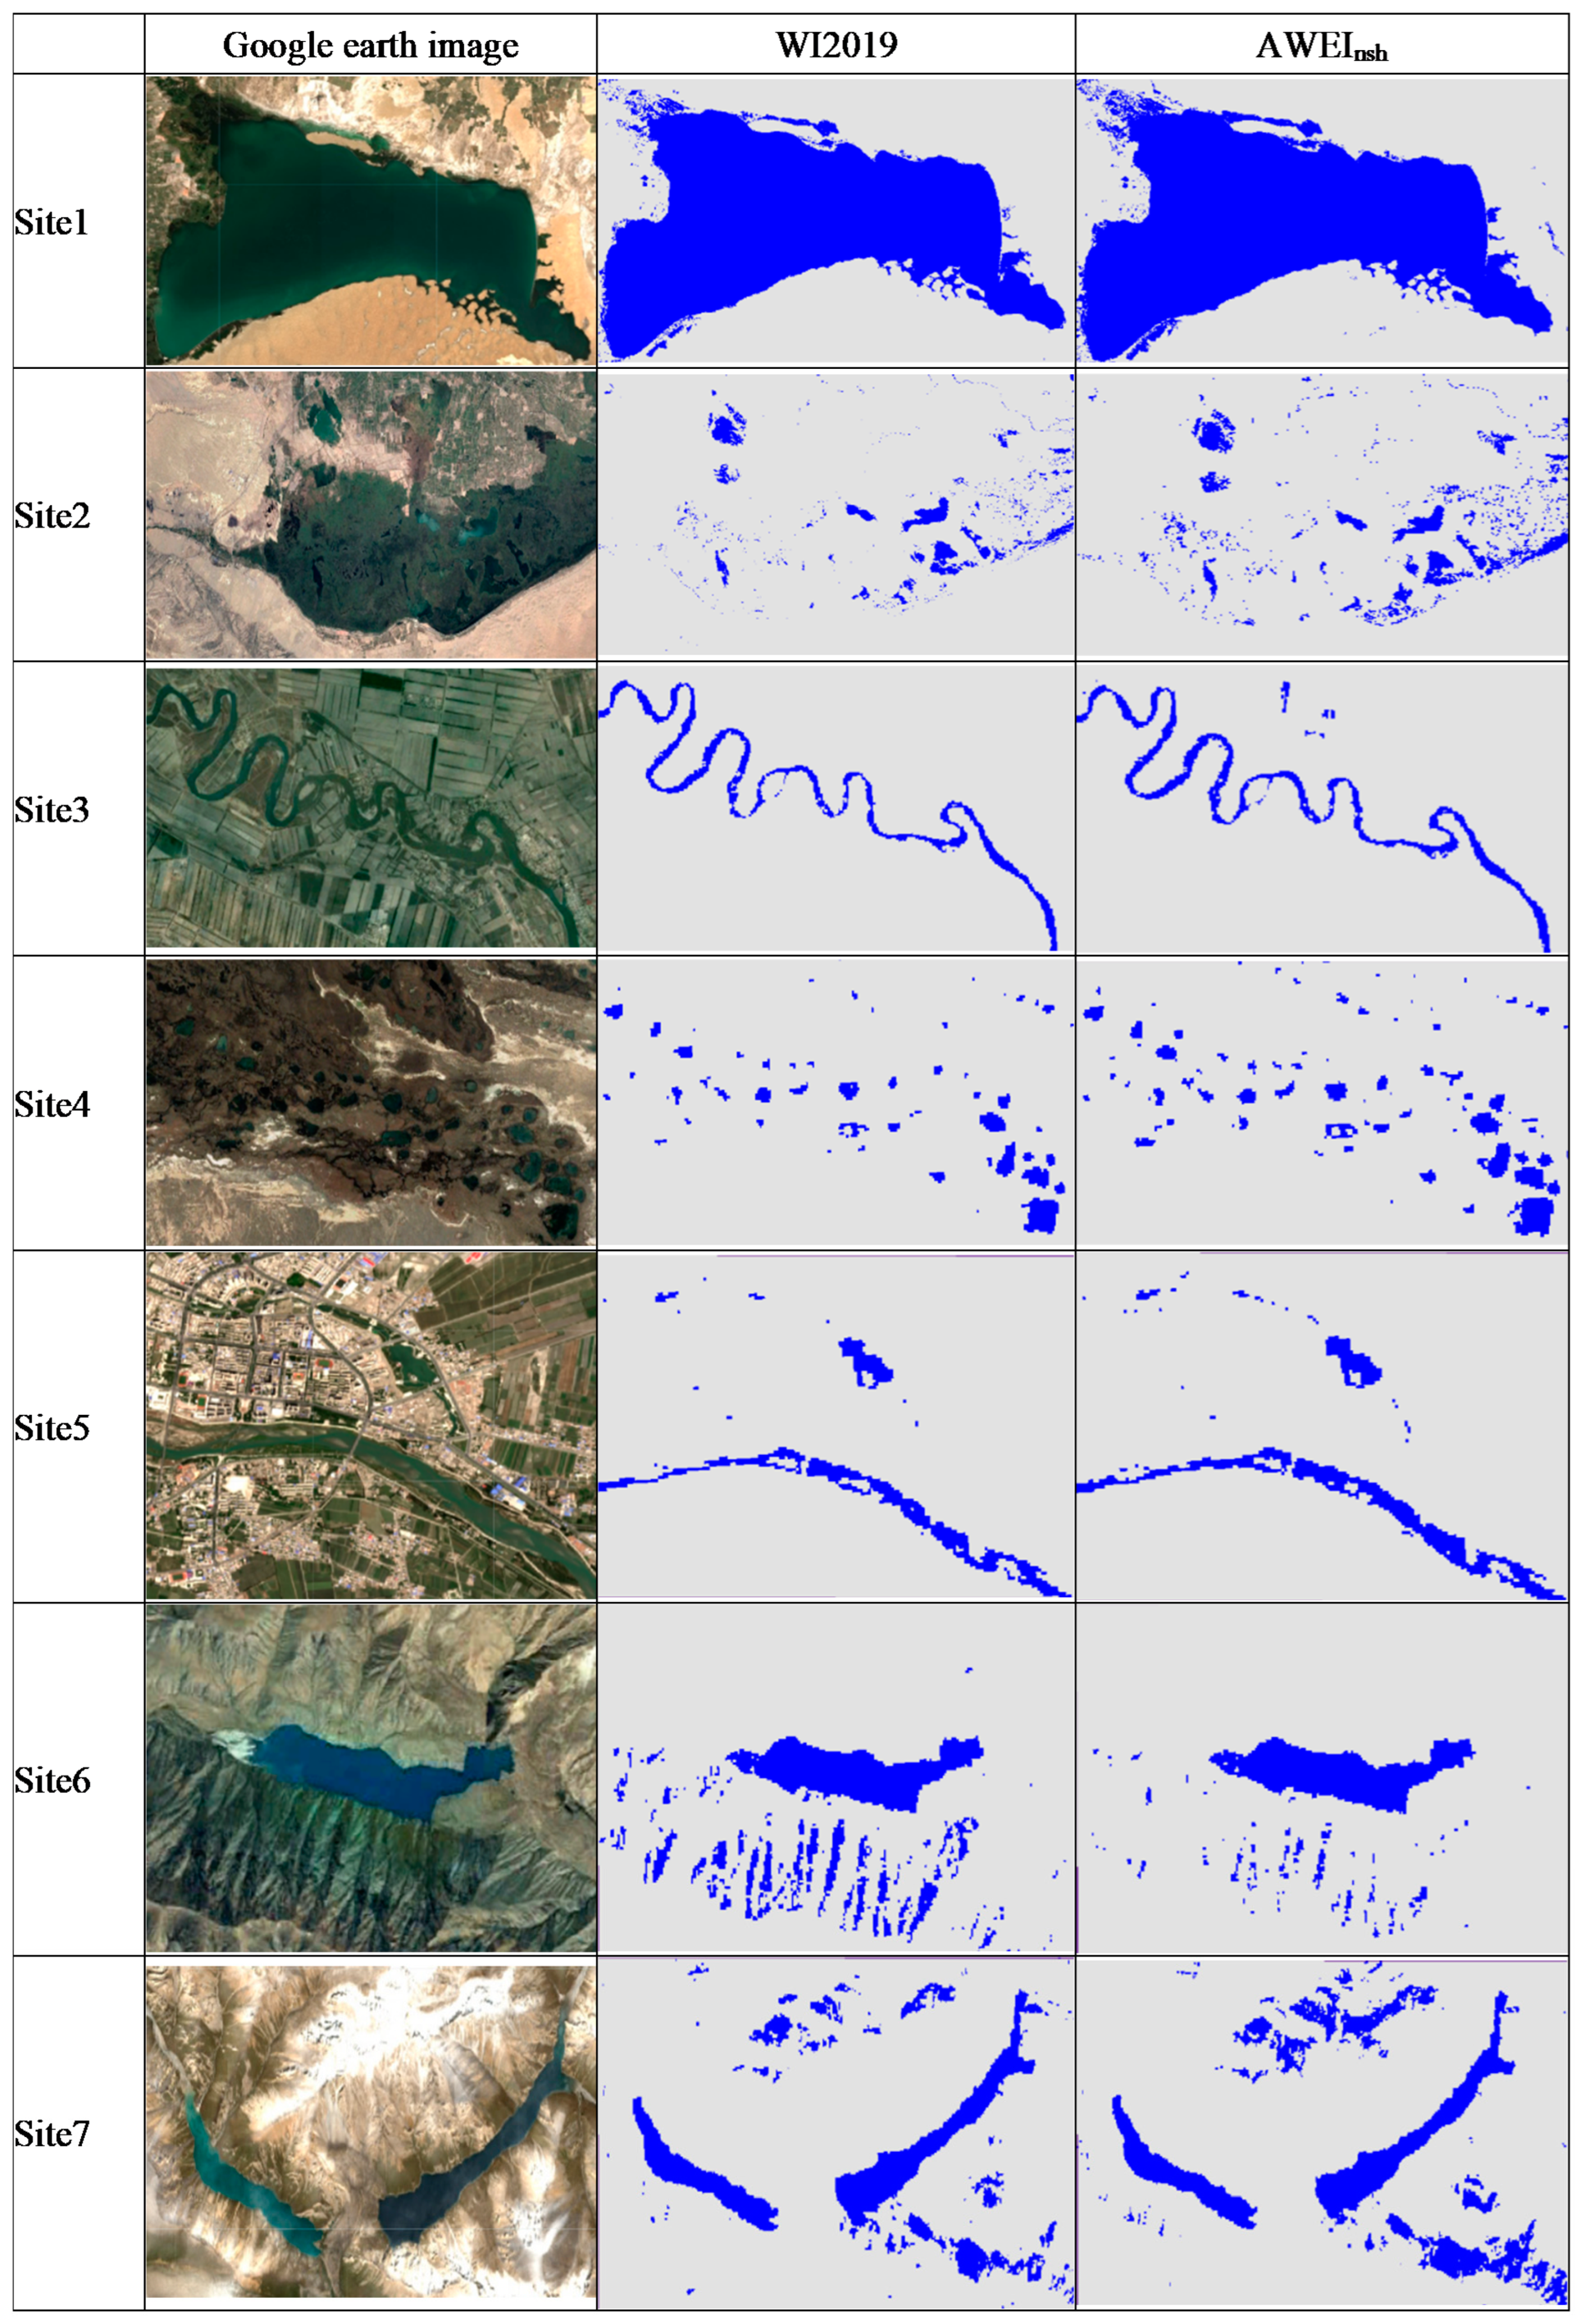
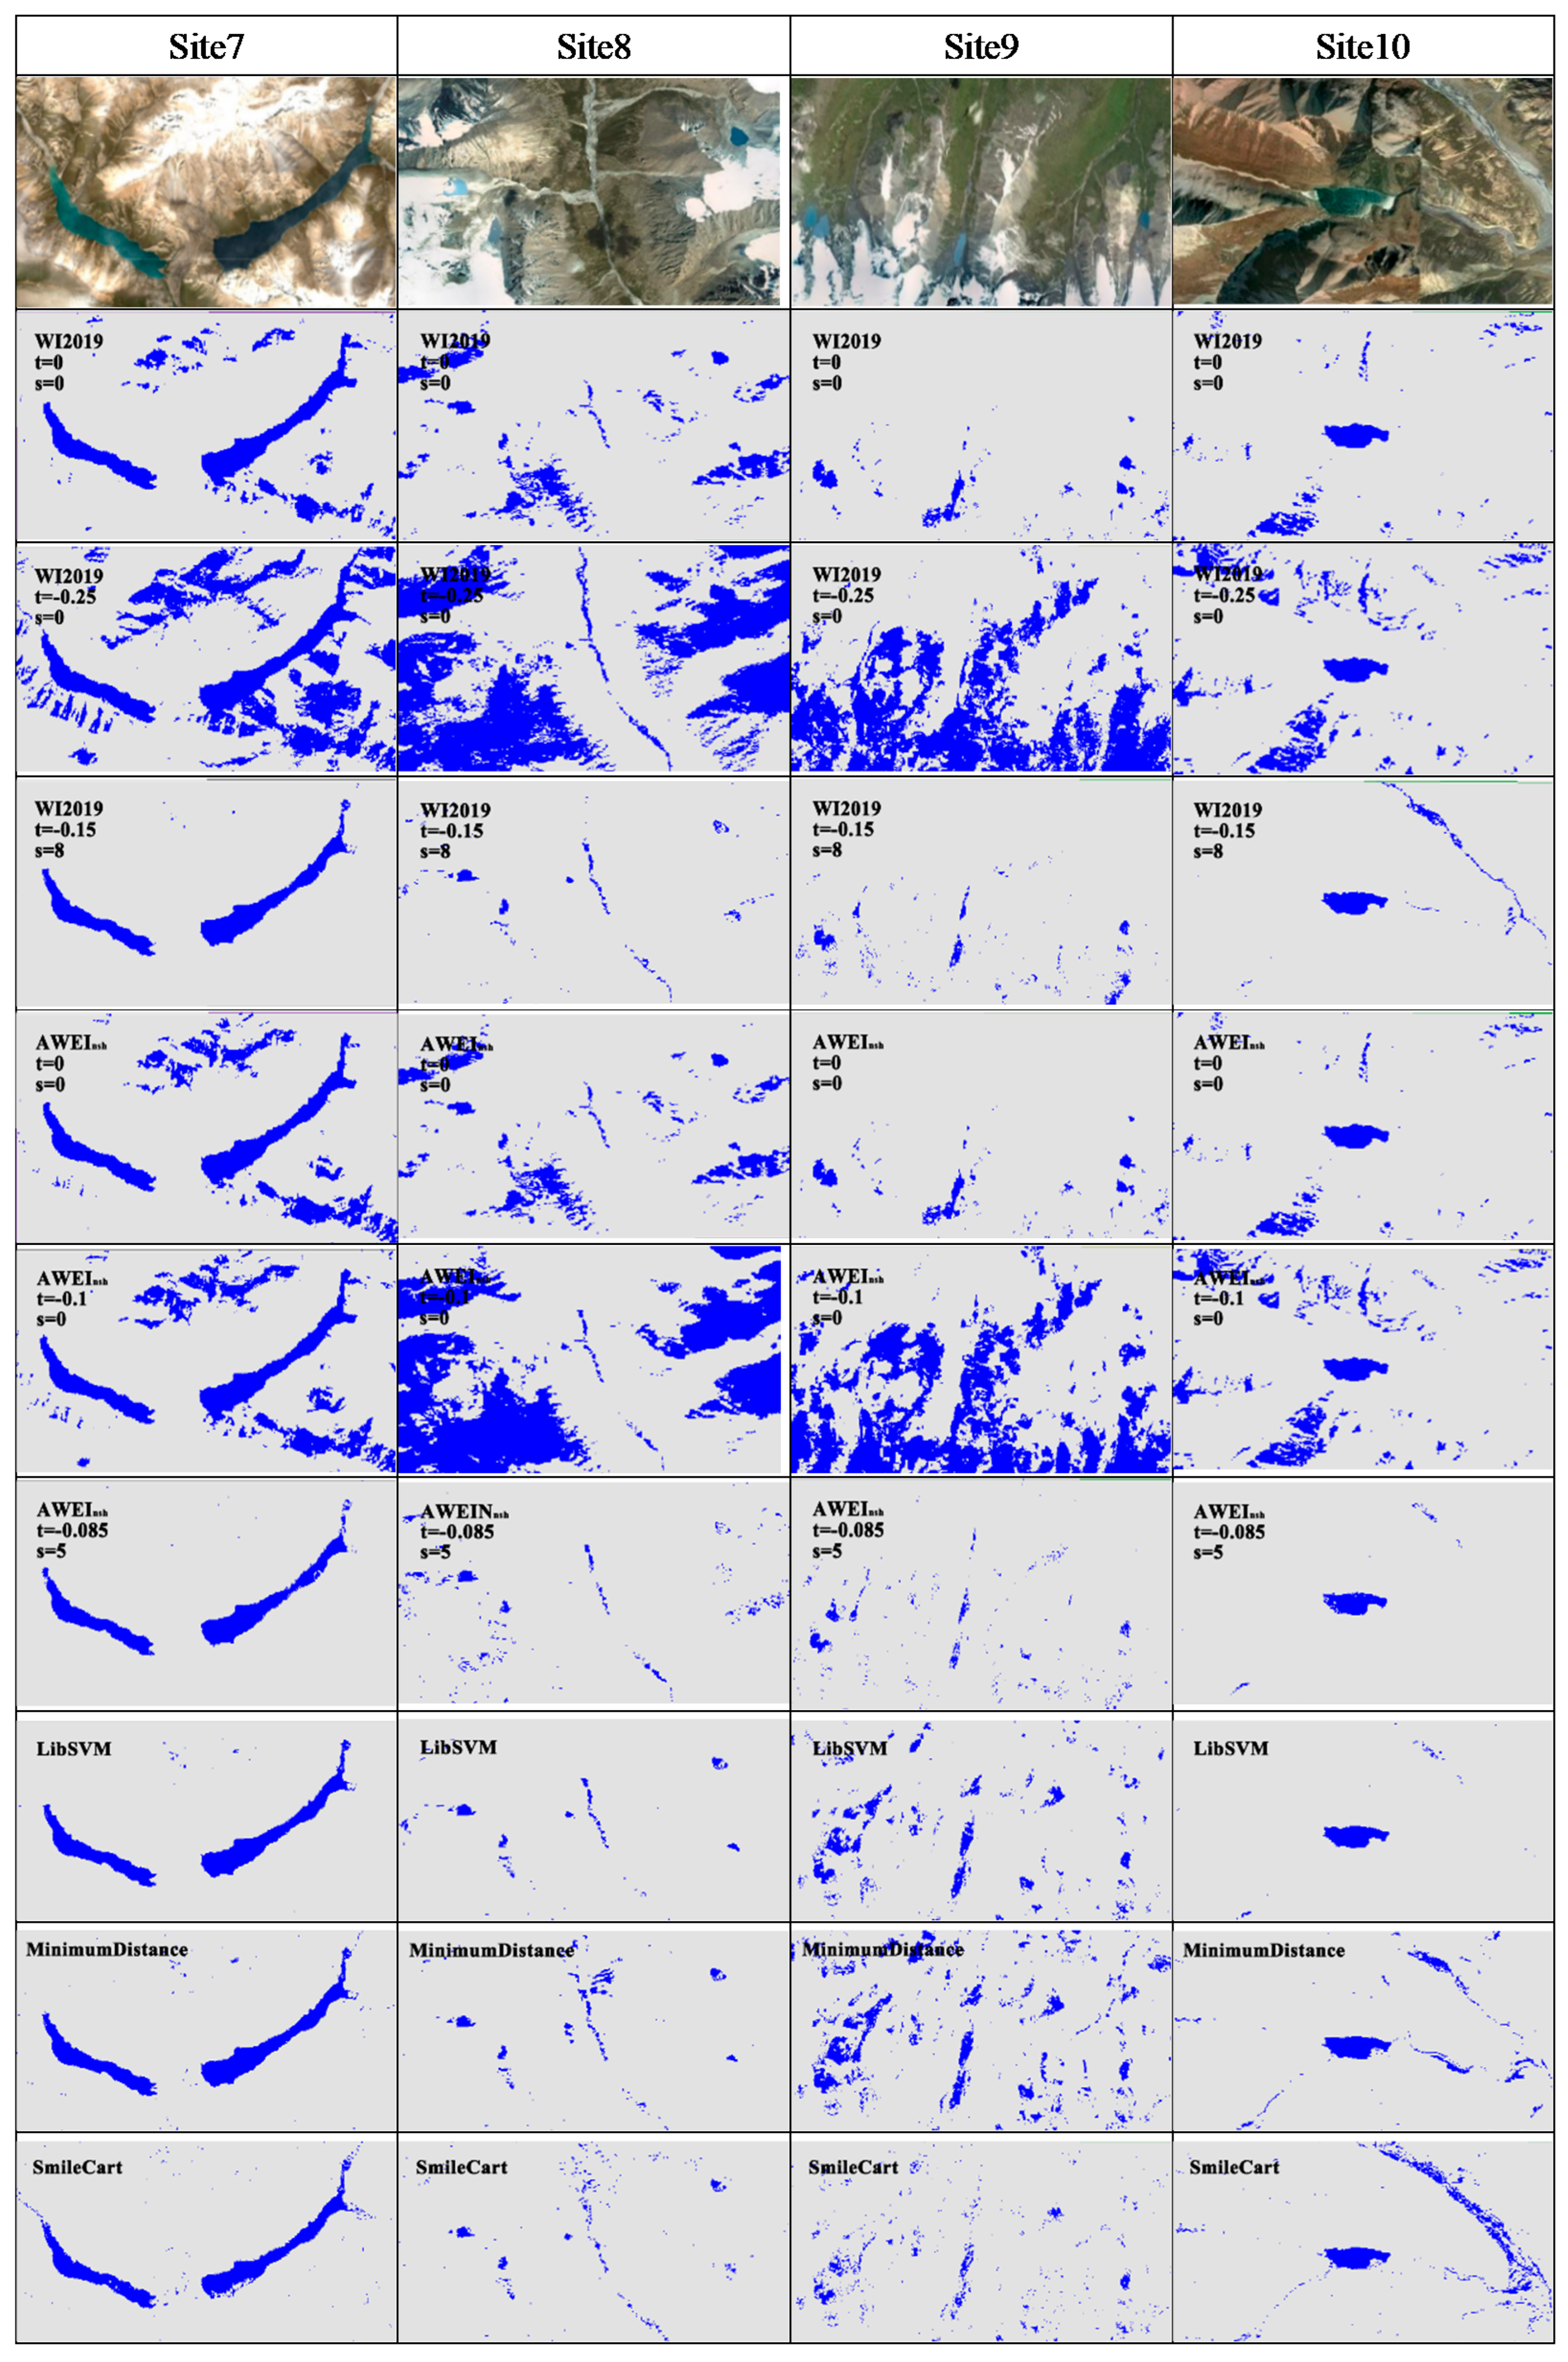
3.3. Comparison of Water Extraction Effects under Complex Terrains

It can be seen from Figure 7 that although water pixels can be effectively extracted under complex terrain (site7–10), a large number of snow and mountain shadows are misclassified into water pixels. When water is extracted with the optimal slope threshold of 0, the misclassified pixel area is further increased. WI2019, AWEInsh and other indexes show the same results. The reason is that although the overall accuracy and kappa coefficients have achieved great results using sample points for accuracy evaluation, there is a large difference between the user accuracy and producer accuracy of water and nonwater bodies, and the threshold value is small. Therefore, the classification results using this threshold value have produced many misclassification pixels. When WI2019 optimal threshold value and slope were used for water extraction, the best water extraction effect was achieved, and snow and mountain shadow misclassification pixels were excluded to the maximum extent, compared with the supervised classification results, and there are still a small number of snow and shadow pixels that are mistakenly classified as water bodies, and the effect is poor.

3.4. Effect Analysis of Long Time Series Water Extraction

Landsat series remote sensing images of GEE platform from 2000 to 2021 were used to extract surface water in Bosten Lake Basin using various water indexes under the optimal index threshold and slope mask threshold, and the annual average water error area under different methods was respectively counted, as shown in Table 3.
The average annual extraction error of WI2019 under the optimal index threshold and slope mask threshold is 140.5183 km2, which is still the optimal extraction effect. The error area of other water indices on long-term series is also small. For example, the average annual error area of AWEIsh, ANWI and NDWI is only 145.478 km2, 177.5806 km2 and 194.1482 km2, respectively, indicating that although its water extraction effect is not as good as WI2019, its extraction effect has good stability, which can be considered as a backup scheme for water extraction in other regions.

4. Discussion and Conclusions

4.1. Discussion

4.1.1. The Relationship between the Optimal Threshold of Water Index and Water Extraction Effect

When slope mask is not used to search for the optimal threshold of surface water, the optimal threshold obtained by using sample points to verify the accuracy of surface water extraction is often too small. In a visual interpretation, it is found that a large number of non-surface water pixels were misclassified into surface water pixels and that surface water extraction was carried out only with the optimal water index threshold. Good results can be achieved in areas with large continuous water areas or relatively flat terrain [3,43,44,45]. However, the results may be unreliable in large areas or areas with a complex geographical pattern. In the process of water extraction with water index, it is found that although the water index has its own advantages, the threshold value is the most critical factor to determine the effect of water extraction, whereas the structure of water index is secondary. Similar conclusions have been drawn in related studies on the optimal threshold value of water index [46,47].

4.1.2. The Optimal Threshold Value of Slope Mask Can Reflect the Effect of Water Index to Distinguish Shadows

The optimal slope mask of index wi2019 is 8, which is greater than the optimal slope mask threshold of water indexes such as AWEIsh and AWEInsh. In the actual process of surface water, the distinguishing effect of water indexes such as AWEIsh and AWEInsh on shadow and surface water without slope mask is better than that of wi2019, indicating that the slope in the optimal threshold slope can reflect the shadow removal effect of water index. This is consistent with the comparison result that the AWEI index is better than other water indexes in the practical application of water index in relevant studies [48,49].

4.1.3. Commonality of Water Extraction Methods

This paper does not validate the water extraction method in other areas because the water extraction method proposed in this paper does not have a fixed index or threshold and can carry out the same workflow in different areas to find the optimal results. When judging the effect of water extraction in the long-time series, the water area in dry seasons in very few years is larger than that in wet seasons. According to the display effect of GEE in the extraction process, the reason is not only the extraction error but also the complex terrain and climate conditions in the region, which have little impact on the water extraction in the long-time series. The slope mask has achieved a good effect in distinguishing water bodies in areas with mountainous shadows and more snow, but it may not be applicable in areas with flat terrain. Although this method has achieved a good effect in extracting water bodies, there are still pixels incorrectly divided into water bodies, and the image resolution has a great impact on the extraction of small water bodies. Therefore, it is necessary to explore the applicability of this method in high-resolution images in future work and increase the comparison of more water extraction methods. The results of this study with a slope of 8 as a threshold are only applicable to specific RS imagery (Landsat series for this study) restricted by specific transit times and specific scanning angles. For example, when the hill slope and aspect are stable, the shadow area at noon must be smaller than that in the morning and evening. Therefore, there may be errors when using this method to extract water area from different remote sensing images. In addition, there is a certain difference in the spectral characteristics between the water pixels under shadow and those under light, and the spectral difference between them is smaller than that between the two. Although the difference between different bands enables the shadow water pixels to be extracted to a certain extent by the exponential method, water pixels, however, cannot be extracted in areas where the reflectance is too low or the water is completely shaded. Although there are few such water pixels, the loss of water pixels will still occur.
Although this method aims to get the higher precision of water extraction, and implements the long time series of water extraction, the prediction about the future of the water area of change need comprehensive consideration of many driving factors. Hence, under the premise of remote sensing image in the future, the lack of basic data is difficult to achieve, but the set of methods can be used in the future the extraction of remote sensing data for water. Previous water extraction results can provide historical data for water resource management and decision making in the region.

4.2. Conclusions

In this study, on the premise of preliminary discussion on various water indexes, the water index is used to extract the surface water of Bosten Lake Basin under the GEE platform. The surface water extraction effects of different water indexes are compared in three ways: sample accuracy verification, visual discrimination, and misclassification of area under long-time series. A method for surface water extraction in complex terrain areas is proposed by adding a slope mask. The interference of slope and snow cover is effectively removed, and the high-precision extraction of surface water in the region is realized through threshold iterative optimization. This method can be applied to the extraction of long-time series water in the region.
The index threshold has been optimized in previous studies on water information extraction using the water index. In this paper, when trying to extract water in the Bosten Lake basin with 0 as the threshold, various water indexes have achieved good water extraction results in lakes, wetlands, cities, and rivers, but the extraction effect in the whole region is generally poor. Therefore, taking 0 as the threshold for water extraction can reflect the advantages and disadvantages of the water extraction effect to a certain extent, but the water extraction result is not reliable, and it is still necessary to improve the water extraction effect through threshold optimization. The accuracy of water extraction has been significantly improved after slope masking of various water indexes. In Bosten Lake Basin, the ground feature types that affect the water extraction effect are mainly shadow and snow. The index wi2019 has a better distinguishing effect on water and snow than other water indexes. Adding the slope mask can further remove the interference of shadow and mountain snow on water extraction. The water index WI2019 takes −0.15 as the threshold and the slope of 8 as the mask, achieving the highest water extraction accuracy and the best visual discrimination effect in the study area, and it is better than the water extraction results of supervised classification. The error area of water extraction in the long-time series is smaller than in other indexes. It can achieve high-precision water extraction in the region under the condition of large topographic relief and more snow. It is of certain significance for monitoring and managing the dynamic changes of surface water in the region.

Author Contributions

Conceptualization, X.L. and F.Z.; methodology, X.L.; software, X.L.; validation, C.L., D.C. and X.L.; formal analysis, X.L.; investigation, F.Z. and C.L.; resources, X.L.; data curation, X.L.; writing—original draft preparation, X.L.; writing—review and editing, N.W.C. and J.S.; visualization, X.L., F.Z. and D.C.; supervision, F.Z.; project administration, F.Z.; funding acquisition, F.Z. All authors have read and agreed to the published version of the manuscript.

Funding

This research was funded by the National Natural Science Foundation of China (U2003205, U1603241), the National Natural Science Foundation of China (Xinjiang Local Outstanding Young Talent Cultivation) (U1503302) and the Tianshan Talent Project (Phase III) of the Xinjiang Uygur Autonomous.

Data Availability Statement

The data presented in this study are available on request from the corresponding author. The data are not publicly available due to confidentiality.

Conflicts of Interest

The authors declare no conflict of interest.

References

  1. Papa, F.; Crétaux, J.-F.; Grippa, M.; Robert, E.; Trigg, M.; Tshimanga, R.M.; Kitambo, B.; Paris, A.; Carr, A.; Fleischmann, A.S. Water resources in Africa under global change: Monitoring surface waters from space. Surv. Geophys. 2022, 20, 1–51. [Google Scholar]
  2. Garrido-Rubio, J.; Calera, A.; Arellano, I.; Belmonte, M.; Fraile, L.; Ortega, T.; Bravo, R.; González-Piqueras, J. Evaluation of remote sensing-based irrigation water accounting at river basin district management scale. Remote Sens. 2020, 12, 3187. [Google Scholar] [CrossRef]
  3. Malahlela, O.E. Inland waterbody mapping: Towards improving discrimination and extraction of inland surface water features. Int. J. Remote Sens. 2016, 37, 4574–4589. [Google Scholar] [CrossRef]
  4. Aznarez, C.; Jimeno-Sáez, P.; López-Ballesteros, A.; Pacheco, J.P.; Senent-Aparicio, J. Analysing the impact of climate change on hydrological ecosystem services in Laguna del Sauce (Uruguay) using the SWAT model and remote sensing data. Remote Sens. 2021, 13, 2014. [Google Scholar] [CrossRef]
  5. Bretreger, D.; Yeo, I.-Y.; Kuczera, G.; Hancock, G. Remote sensing’s role in improving transboundary water regulation and compliance: The Murray-Darling Basin, Australia. J. Hydrol. X 2021, 13, 100112. [Google Scholar] [CrossRef]
  6. Domeneghetti, A.; Schumann, G.J.-P.; Tarpanelli, A. Preface: Remote sensing for flood mapping and monitoring of flood dynamics. Remote Sens. 2019, 11, 943. [Google Scholar] [CrossRef]
  7. Lu, Z.; Wang, D.Q.; Deng, Z.D.; Shi, Y.; Ding, Z.B.; Ning, H.; Zhao, H.F.; Zhao, J.Z.; Xu, H.L.; Zhao, X.N. Application of red edge band in remote sensing extraction of surface water body: A case study based on GF-6 WFV data in arid area. Hydrol. Res. 2021, 52, 1526–1541. [Google Scholar] [CrossRef]
  8. Yang, Y.; Ruan, R.Z. Extraction of Plain Lake Water Body Based on TM Imagery. Remote Sens. Inf. 2010, 3, 60–64. [Google Scholar]
  9. Zhang, Q.; Wu, B.; Yang, Y.K. Extraction of Open Water in Rugged Area with A Novel Slope Adjusted Water Index. Remote Sens. Inf. 2018, 33, 98–107. [Google Scholar]
  10. Vinayaraj, P.; Imamoglu, N.; Nakamura, R.; Oda, A. Investigation on perceptron learning for water region estimation using large-scale multispectral images. Sensors 2018, 18, 4333. [Google Scholar] [CrossRef] [PubMed]
  11. McFeeters, S.K. The use of the Normalized Difference Water Index (NDWI) in the delineation of open water features. Int. J. Remote Sens. 1996, 17, 1425–1432. [Google Scholar] [CrossRef]
  12. Xu, H.Q. A Study on Information Extraction of Water Body with the Modified Normalized Difference Water Index (MNDWI). J. Remote Sens. 2005, 9, 589–595. [Google Scholar]
  13. Danaher, T.; Collett, L. Development, optimisation and multi-temporal application of a simple Landsat based water index. In Proceedings of the 13th Australasian Remote Sensing and Photogrammetry Conference, Canberra, ACT, Australia, 20–24 November 2006. [Google Scholar]
  14. Yan, P.; Zhang, Y.; Zhang, Y. A study on information extraction of water enhanced water index (EWI) and GIS system in semi-arid regions with the based noise remove techniques. Remote Sens. Inf. 2007, 6, 62–67. [Google Scholar]
  15. Xu, H.Q. Comment on the Enhanced Water Index (EWI): A Discussion on the Creation of a Water Index. Geo-Inf. Sci. 2008, 10, 776–780. [Google Scholar]
  16. Cao, R.L.; Li, C.J.; Liu, L.Y.; Wang, J.H.; Yan, G.J. Extracting Miyun reservoirs water area and monitoring its change based on a revised normalized different water index. Sci. Surv. Mapp. 2008, 33, 158–160. [Google Scholar]
  17. Ding, F. Study on information extraction of water body with a new water index (NWI). Sci. Surv. Mapp. 2009, 34, 155–157. [Google Scholar]
  18. Xiao, Y.-F.; Zhu, L. A study on information extraction of water body using band 1 and band 7 of TM imagery. Sci. Surv. Mapp. 2010, 35, 226–227. [Google Scholar]
  19. Feyisa, G.L.; Meilby, H.; Fensholt, R.; Proud, S.R. Automated Water Extraction Index: A new technique for surface water mapping using Landsat imagery. Remote Sens. Environ. 2014, 140, 23–35. [Google Scholar] [CrossRef]
  20. Fisher, A.; Flood, N.; Danaher, T. Comparing Landsat water index methods for automated water classification in eastern Australia. Remote Sens. Environ. 2016, 175, 167–182. [Google Scholar] [CrossRef]
  21. Wang, X.B.; Xie, S.P.; Zhang, X.L.; Chen, C.; Guo, H.; Du, J.K.; Duan, Z. A robust Multi-Band Water Index (MBWI) for automated extraction of surface water from Landsat 8 OLI imagery. Int. J. Appl. Earth Obs. Geoinf. 2018, 68, 73–91. [Google Scholar] [CrossRef]
  22. Yamazaki, D.; Trigg, M.A.; Ikeshima, D. Development of a global similar to 90 m water body map using multi-temporal Landsat images. Remote Sens. Environ. 2015, 171, 337–351. [Google Scholar] [CrossRef]
  23. Allen, G.H.; Pavelsky, T.M. Global extent of rivers and streams. Science 2018, 361, 585–588. [Google Scholar] [CrossRef] [PubMed]
  24. Acharya, T.D.; Subedi, A.; Huang, H.; Lee, D.H. Application of water indices in surface water change detection using Landsat imagery in Nepal. Sens. Mater. 2019, 31, 1429–1447. [Google Scholar] [CrossRef]
  25. Colditz, R.R.; Troche Souza, C.; Vazquez, B.; Wickel, A.J.; Ressl, R. Analysis of optimal thresholds for identification of open water using MODIS-derived spectral indices for two coastal wetland systems in Mexico. Int. J. Appl. Earth Obs. Geoinf. 2018, 70, 13–24. [Google Scholar] [CrossRef]
  26. Ogilvie, A.; Belaud, G.; Massuel, S.; Mulligan, M.; Le Goulven, P.; Calvez, R. Surface water monitoring in small water bodies: Potential and limits of multi-sensor Landsat time series. Hydrol. Earth Syst. Sci. 2018, 22, 4349–4380. [Google Scholar] [CrossRef]
  27. Zou, Z.H.; Xiao, X.M.; Dong, J.W.; Qin, Y.W.; Doughty, R.B.; Menarguez, M.A.; Zhang, G.; Wang, J. Divergent trends of open-surface water body area in the contiguous United States from 1984 to 2016. Proc. Natl. Acad. Sci. USA 2018, 115, 3810–3815. [Google Scholar] [CrossRef]
  28. Chen, J.; Mueller, V. Coastal climate change, soil salinity and human migration in Bangladesh. Nat. Clim. Chang. 2018, 8, 981–985. [Google Scholar] [CrossRef]
  29. Müller, M.F.; Yoon, J.; Gorelick, S.M.; Avisse, N.; Tilmant, A. Impact of the Syrian refugee crisis on land use and transboundary freshwater resources. Proc. Natl. Acad. Sci. 2016, 113, 14932–14937. [Google Scholar] [CrossRef] [PubMed]
  30. Wang, D.Z.; Wang, S.M.; Huang, C. Comparison of Sentinel-2 imagery with Landsat8 imagery for surface water extraction using four common water indexes. Remote Sens. Land Resour. 2019, 31, 157–165. [Google Scholar]
  31. Verpoorter, C.; Kutser, T.; Tranvik, L. Automated mapping of water bodies using Landsat multispectral data. Limnol. Oceanogr. Methods 2012, 10, 1037–1050. [Google Scholar] [CrossRef]
  32. Xu, H.Q. Development of remote sensing water indices:a review. J. Fuzhou Univ. 2021, 49, 613–625. [Google Scholar]
  33. Ji, L.; Zhang, L.; Wylie, B. Analysis of dynamic thresholds for the normalized difference water index. Photogramm. Eng. Remote Sens. 2009, 75, 1307–1317. [Google Scholar] [CrossRef]
  34. Li, X.D.; Ling, F.; Foody, G.M.; Boyd, D.S.; Jiang, L.; Zhang, Y.H.; Zhou, P.; Wang, Y.L.; Chen, R.; Du, Y. Monitoring high spatiotemporal water dynamics by fusing MODIS, Landsat, water occurrence data and DEM. Remote Sens. Environ. 2021, 265, 112680. [Google Scholar] [CrossRef]
  35. Tobón-Marín, A.; Canon Barriga, J. Analysis of changes in rivers planforms using google earth engine. Int. J. Remote Sens. 2020, 41, 8654–8681. [Google Scholar] [CrossRef]
  36. Ismail, M.A.; Waqas, M.; Ali, A.; Muzzamil, M.M.; Abid, U.; Zia, T. Enhanced index for water body delineation and area calculation using Google Earth Engine: A case study of the Manchar Lake. J. Water Clim. Chang. 2022, 13, 557–573. [Google Scholar] [CrossRef]
  37. Deng, Y.; Jiang, W.G.; Tang, Z.G.; Ling, Z.Y.; Wu, Z.F. Long-Term Changes of Open-Surface Water Bodies in the Yangtze River Basin Based on the Google Earth Engine Cloud Platform. Remote Sens. 2019, 11, 2213. [Google Scholar] [CrossRef]
  38. Jin, Y.L.; Xu, M.L.; Gao, S.; Wan, H.W. Analysis on the Dynamic Changes and Driving Forces of Surface Water in the Three-River Headwater Region from 2001 to 2018. Remote Sens. Technol. Appl. 2021, 36, 1147–1154. [Google Scholar]
  39. Chai, X.R.; Li, M.; Wang, G.W. Characterizing surface water changes across the Tibetan Plateau based on Landsat time series and LandTrendr algorithm. Eur. J. Remote Sens. 2022, 55, 251–262. [Google Scholar] [CrossRef]
  40. Yu, Z.Q.; An, Q.; Liu, W.S.; Wang, Y.H. Analysis and evaluation of surface water changes in the lower reaches of the Yangtze River using Sentinel-1 imagery. J. Hydrol. Reg. Stud. 2022, 41, 101074. [Google Scholar] [CrossRef]
  41. Rad, A.M.; Kreitler, J.; Sadegh, M. Augmented Normalized Difference Water Index for improved surface water monitoring. Environ. Model. Softw. 2021, 140, 105030. [Google Scholar] [CrossRef]
  42. Huang, Y.L.; Deng, K.Y.; Ren, C.; Yu, Z.W.; Pan, Y.L. New water index and its stability study. Prog. Geophys. 2020, 35, 829–835. [Google Scholar]
  43. Chen, Y.H.; Mu, Y.C.; Xie, Y.W. Extraction of the wetland information in the middle reaches of Heihe River based on Landsat images. J. Lanzhou Univ. Nat. Sci. 2016, 52, 587–592, 598. [Google Scholar]
  44. Nguyen, U.N.; Pham, L.T.; Dang, T.D. An automatic water detection approach using Landsat 8 OLI and Google Earth Engine cloud computing to map lakes and reservoirs in New Zealand. Environ. Monit. Assess. 2019, 191, 235. [Google Scholar] [CrossRef] [PubMed]
  45. Tew, Y.L.; Tan, M.L.; Samat, N.; Chan, N.W.; Mahamud, M.A.; Sabjan, M.A.; Lee, L.K.; See, K.F.; Wee, S.T. Comparison of Three Water Indices for Tropical Aquaculture Ponds Extraction using Google Earth Engine. Sains Malays. 2022, 51, 369–378. [Google Scholar] [CrossRef]
  46. Yue, H.; Li, Y.; Qian, J.X.; Liu, Y. A new accuracy evaluation method for water body extraction. Int. J. Remote Sens. 2020, 41, 7311–7342. [Google Scholar] [CrossRef]
  47. Yulianto, F.; Kushardono, D.; Budhiman, S.; Nugroho, G.; Chulafak, G.A.; Dewi, E.K.; Pambudi, A.I. Evaluation of the Threshold for an Improved Surface Water Extraction Index Using Optical Remote Sensing Data. Sci. World J. 2022, 2022, 4894929. [Google Scholar] [CrossRef]
  48. Acharya, T.D.; Subedi, A.; Lee, D.H. Evaluation of water indices for surface water extraction in a Landsat 8 scene of Nepal. Sensors 2018, 18, 2580. [Google Scholar] [CrossRef]
  49. Zhao, R.; Fu, P.; Zhou, Y.; Xiao, X.M.; Grebby, S.; Zhang, G.Q.; Dong, J.W. Annual 30-m big Lake Maps of the Tibetan Plateau in 1991–2018. Sci. Data 2022, 9, 164. [Google Scholar] [CrossRef]
Figure 1. Schematic diagram of study area.
Water 14 02809 g001
Figure 2. Image availability analysis in the study area.
Water 14 02809 g002
Figure 3. Selection of typical feature sample points in the study area.
Water 14 02809 g003
Figure 4. Spectral reflectance characteristics of typical ground objects in the study area.
Water 14 02809 g004
Figure 5. Each water index takes 0 as the threshold value to extract surface water results.
Water 14 02809 g005
Figure 6. WI2019 and AWEInsh surface water extraction details.
Water 14 02809 g006
Figure 7. Comparison of extraction effects of different water extraction methods in more complex terrains.
Water 14 02809 g007
Table 1. Main water index calculation formula.
Index NameIndex FormulaReference
NDWI ρ G R E E N ρ N I R ρ G R E E N + ρ N I R [11]
MNDWI ρ G R E E N ρ S W I R 1 ρ G R E E N + ρ S W I R 1 [12]
AWEInsh 4 × ( ρ G R E E N ρ S W I R 1 ) ( 0 . 25 × ρ N I R + 2.75 × ρ S W I R 2 ) [19]
AWEIsh ρ B L U E + 2.5 × ρ G R E E N 1.5 × ( ρ N I R + ρ S W I R 1 ) 0.25 × ρ S W I R 2 [19]
EWI ρ B L U E ρ R E D ρ N I R ρ B L U E + ρ R E D + ρ N I R [14]
ANWI ρ B L U E + ρ G R E E N + ρ R E D ρ N I R ρ S W I R 1 ρ S W I R 2 ρ B L U E + ρ G R E E N + ρ R E D + ρ N I R + ρ S W I R 1 + ρ S W I R 2 [41]
NWI ρ B L U E ρ N I R ρ S W I R 1 ρ S W I R 2 ρ B L U E + ρ N I R + ρ S W I R 1 + ρ S W I R 2 [17]
WI2015 1.7204 + 171 ρ G R E E N + 3 ρ R E D 70 ρ N I R 45 ρ S W I R 1 71 ρ S W I R 2 [20]
WI2019 1.75 ρ G R E E N ρ R E D 1.08 ρ S W I R 1 ρ G R E E N + ρ S W I R 1 [42]
Note: where ρ Represents the band reflectance value, the band reflectance subscript corresponds to the corresponding band of different remote sensing images.
Table 2. Evaluation table of accuracy of water extraction results of different methods.
Classification MethodThresholdSlopeLand Cover ClassOverall
Accuracy
User
Accuracy
Producer
Accuracy
Kappa
WI20190.000.00water0.6690.2740.9940.29
nonwater 0.9990.623
−0.250.00water0.6790.2990.9840.31
nonwater 0.9960.630
0.0010.00water0.9080.8070.9890.81
nonwater 0.9920.861
−0.158.00water0.9400.9120.9540.89
nonwater 0.9640.929
AWEInsh0.000.00water0.6800.2990.9900.31
nonwater 0.9970.630
−0.10.00water0.6820.3060.9870.319
nonwater 0.9970.632
0.0010.00water0.9010.9440.8530.80
nonwater 0.8650.949
−0.095.00water0.9370.9260.9350.87
nonwater 0.9460.939
AWEIsh0.000.00water0.6760.3050.9490.31
nonwater 0.9860.630
0.150.00water0.6680.2740.9860.288
nonwater 0.9970.622
0.0010.00water0.8820.9730.8070.77
nonwater 0.8060.973
0.085.00water0.9220.8990.9260.84
nonwater 0.9400.918
MNDWI0.000.00water0.6810.3070.9730.32
nonwater 0.9930.632
0.150.00water0.6820.3050.9890.32
nonwater 0.9970.632
0.0010.00water0.9030.9760.8370.81
nonwater 0.8410.977
0.005.00water0.9310.9350.9150.86
nonwater 0.9280.945
NDWI0.000.00water0.6750.2890.9870.30
nonwater 0.9970.627
0.150water0.6740.3000.9460.30
nonwater 0.9860.268
0.0010.00water0.9070.8800.9130.81
nonwater 0.9300.903
0.039.00water0.9160.8590.9510.83
nonwater 0.9630.891
EWI0.000.00water0.6570.2480.9910.26
nonwater 0.9980.614
−0.150.00water0.6690.2750.9890.290
nonwater 0.9970.623
0.0010.00water0.8450.6940.9540.68
nonwater 0.9720.792
−0.354.00water0.9270.8940.9420.85
nonwater 0.9540.915
ANWI0.000.00water0.6570.2480.9910.26
nonwater 0.9980.614
−0.150.00water0.6670.2720.9890.287
nonwater 0.9970.622
0.0010.00water0.8390.6700.9640.67
nonwater 0.9790.781
0.16.00water0.9300.9010.9430.86
nonwater 0.9540.920
NWI0.000.00water0.6570.2480.9910.26
nonwater 0.9980.614
−0.40.00water0.6820.3050.9850.319
nonwater 0.9960.632
0.0010.00water0.8390.6700.9640.67
nonwater 0.9790.781
−0.404.00water0.9300.9010.9430.86
nonwater 0.9540.920
WI20150.000.00water0.6820.3060.9800.32
nonwater 0.9950.632
0.050water0.6810.3060.9800.319
nonwater 0.9950.632
0.0010.00water0.9040.9730.8400.81
nonwater 0.9730.975
0.005.00water0.9320.9320.9200.86
nonwater 0.9320.943
SmileCart 0.931 0.88
LibSVM 0.894 0.79
MinimumDistance 0.864 0.87
Table 3. Annual average extraction error area of each water index from 2000 to 2021.
Water IndexWI2019AWEInshAWEIshMNDWINDWIEWIANWINWIWI2015
Error area (km2)140.5183183.524145.4784391.2709194.1482266.785177.5806210.056350.6671
Publisher’s Note: MDPI stays neutral with regard to jurisdictional claims in published maps and institutional affiliations.

