
Numerical Simulation and Experimental Study on Single Point Blasting of Ice Jam of Heilongjiang River Based on ANSYS/LSDYNA
1
Institute of Groundwater in Cold Region, Heilongjiang University, Harbin 150080, China
2
School of Hydraulic & Electric Power, Heilongjiang University, Harbin 150080, China
3
China and Russian Cold Region Hydrology and Water Conservancy Engineering Joint Laboratory, Heilongjiang University, Harbin 150080, China
4
Daxing’anling Hydrology Bureau, Daxing’anling 165000, China
*
Author to whom correspondence should be addressed.
Water 2022, 14(18), 2808; https://doi.org/10.3390/w14182808
Submission received: 3 August 2022
/
Revised: 5 September 2022
/
Accepted: 5 September 2022
/
Published: 9 September 2022
(This article belongs to the Special Issue Sea, River, Lake Ice Properties and Their Applications in Practices)
Abstract
:Based on the thickness of the common ice layer in the Heilongjiang Basin, explosions featuring different methods of firing, different thicknesses of the common ice layer, and different distances between the explosive and the ice are hereby simulated using ANSYS/LSDYNA software. The most suitable blasting scheme after field test verification is obtained, and it is concluded through the field blasting test comparison and verification that the central ignition produces the best blasting effect and the largest blasting volume and radius when the explosion is fired under the ice. A larger ice thickness indicates a worse explosive blasting effect, and the number of explosive packs should be used reasonably to achieve the best blasting effect. An ice blast does not finish at once, but experiences energy transfer in the form of waves. The blasting effect is the best in the case of a distance between the explosive and the ice of about L = 150 cm. The shallower the depth of the river is, the more powerful the blast becomes and the more obvious the blast volume becomes. The ice layer is blasted when the maximum temperature on the day of blasting is stable and positive, which is when the texture of the ice sheet maintains its hardness and high efficiency.
1. Introduction
River ice is an integral component of the hydrological and hydraulic regimes of cold region rivers and affects an extensive portion of the global hydrologic system, particularly in the Northern Hemisphere [1]. It regulates numerous hydrologic, geomorphic, biological, and chemical process in rivers, and provides important socio-economic and ecological benefits [2]. However, river ice can also cause extensive damage to infrastructure, navigation, and hydroelectric production, and can result in detrimental effects to river ecology and water quality [3].
The formation of river ice is a rather complex physical process [4,5], which involves the interaction of hydrodynamic, mechanical and thermal forces, and is also affected by meteorological and hydrological conditions as well as river topography features [6]. There are four main types of river ice formation. In turbulent flow, water flows so fast that the flow can carry away the melting heat so quickly that ice can form at only the tiniest cooling temperature. Ice crystals (known as ice flowers) are generated as many tiny disks and continue to form ice [7]. In calm water, the ice that first appears also takes the shape of a small disk, and the disk shape will develop into a dendritic shape when a critical size is reached. This dendritic ice develops rapidly across the surface of the water until an entire lake or pond is covered with it, often overnight. In addition, the surface is covered with an extremely thin but uniform layer of smooth and unbroken ice. The newly fallen snow is light and loose, with a density ranging from 0.1 to 0.3 kg/m−3. The tension of edges of the crystalline and snow water vapor at the edge is higher than that inside, and the molecules evaporate towards the edges and condense inward, so the crystallization tends to be round [8]. A solid fine substance, known as snow ice, is formed during the deformation, refreezing, recrystallization, and other processes. Recrystallization makes the space between particles more compact and tighter; the density is between 0.82~0.84 kg/m, and the air gap is squeezed out and becomes an impermeable object, i.e., the conversion of snow to ice. Affected by the gravity and centrifugal force, the surface water flows to the concave bank, and the bottom water flows to the convex bank at the curved reach of the river, forming a transverse circulation. The ice flowers floating on the water surface gather towards the concave bank under the action of transverse circulation. When the mechanical force caused by the flow turbulence is less than the bond force between the ice flowers, the ice flowers stick together and result in blockage, and such ice flowers fill the whole river, thereby giving rise to an iceberg [9,10].
River ice impacts local river hydraulics in many different ways [11]. Similarly, in some small river systems, freezing of riverbeds may block groundwater inflows, which may also generate flooding through the aufeis [12]. Ice jams can also change river channel properties and flow paths through ice scouring and erosion [13]. Therefore, it is of great significance to study the blasting of river ice in order to open the river.
Heilongjiang is located in the northernmost part of China, as shown in Figure 1, and its geographical location is 108°20′–141°20′ E and 42°00′–55°45′ N [14]. This section belongs to the Sino–Russian Boundary River, where there is an ice dam of a certain size every 3 years on average, and where there are also serious melting ice floods. However, Heilongjiang is a remote province subject to underdeveloped transportation and communication, as well as backward observation equipment and technology, and relatively little research has been conducted on its ice jam flood disaster prevention and reduction. As the boundary river between China and Russia, the occurrence of ice disasters cannot be controlled, prevented or mitigated by engineering measures (such as the construction of hydraulic structures). Instead, only effective non-engineering measures can be used to prevent the occurrence of ice dams or smoothly break the ice dam [15,16]. Given that the measured ice sheet thickness can reach up to 1.8 m before the upper reach of the Heilongjiang River is opened up, that the ice sheet is of high strength, and that the snow cover on the ice sheet is thick, the measured data show the difficulty of achieving the destruction and movement of large ice structures by non-engineering measures (such as ice surface treatment, mechanical destruction of the ice sheet, cutting of the ice sheet, icebreaking by hovercraft, and river trepanning). In this case, exploding the ice sheet or ice dam using explosives has become the most effective way to prevent or alleviate ice disasters in the Heilongjiang River.
Although there was a record regarding icebreaking by explosives 100 years ago [17], the research is limited by the ice conditions of the river and the surrounding environment of the river, and the measurement is difficult and risky, heavily impeding the research progress [18,19]. Mellor from the United States Army Corps of Engineers obtained a series of explosion data for more than 10 years from the infraglacial blasting experiment and explored the relationship among blasting pit radius, ice sheet thickness and explosive dosage using the regression analysis [20,21]. In China, He Bingshun et al. [22] put forward the icebreaking principle of using the icebreaking and cannon firing technology by dropping a bomb with an aircraft. Based on the freezing layer with thick ice of the Yellow River and Inner Mongolia as the study object, Liang Xiangqian et al. [23,24] studied the vibration velocity of explosive blasting and the change in shock wave pressure in water under two icebreaking methods, i.e., ice contact energy-collected explosion and underwater explosion. Tong Zheng et al. [25] investigated the crack and pressure distribution of ice blocks after blasting by simulating the field blasting and numerical situation of the Yellow River ice run. In terms of the blasting technique, Duan Yuansheng et al. [26] summarized the parameter indexes (such as the arrangement form of explosive holes and the proper channel width of blasting the ice sheet for ice prevention) via engineering practice. Yan Huaitang et al. [27] deduced the relationship between the length of extended explosive charge and the amount of explosives used for icebreaking via blasting under the ice sheet by studying the properties of the explosives. It can be observed from the above research results of infraglacial blasting in the river that the average thickness of the ice sheet is mainly 0.5 m and below, and that the measured maximum ice thickness of the Heilongjiang River can reach as high as 1.8 m. To this end, the field test of infraglacial blasting in the Mohe section in the upper reach of the Heilongjiang River was hereby studied pursuant to the characteristics of the Heilongjiang River (thick ice sheet, solid ice layer, and sub-glacial water depth) to obtain the effective methods and techniques of ice prevention blasting and establish the theoretical relationship between blasting pit radius as well as explosive dosage, ice sheet thickness, and water depth under ice, thereby providing a scientific basis and theoretical support for realizing efficient icebreaking by explosives. Therefore, it is of great significance to develop a blasting method with a good icebreaking effect to prevent the ice run in the Heilongjiang River. Additionally, the Huma section in the Heilongjiang River Basin is one of the main reaches where ice damage occurs, and ice damage of different degrees happens at the moment of closure and ice breakup every year. Therefore, the river at the Huma section of the Heilongjiang River main stream during the freeze-up period is hereby taken as the study object, and numerical simulation of ice explosions is hereby carried out for the river during the freeze-up period under different ice thicknesses and explosive charges, so as to provide the theoretical basis for flood control and disaster reduction, and develop a series of ice explosion methods in the Heilongjiang River Basin [28].
2. Models and Methods
2.1. Selection of Calculation Software
In recent years, blasting engineering has seen much progress due to the use of numerical simulation technology and effective numerical models [29]. ANSYS/LSDYNA (The software version: ANSYS 2021 R1; Creator and the location: John Swanson, New York, NY, USA; Software Sourced: Livermore Software Technology Company, Canonburg, PA, USA.) is the main international explicit dynamic analysis program; it uses ANSYS to simulate the establishment of environmental characteristics and an ANSYS/LSDYNA built-in solver (LS-RUN) to solve K files. Data analysis can be performed using LS-PrePost (The software version: LS-PrePost 4.7; Creator and the location: John Swanson, New York, NY, USA; Software Sourced: Livermore Software Technology Company, Canonburg, PA, USA.), a post-processing software developed by LSDYNA. In the Explosion Analysis Module, ANSYS/LSDYNA not only provides the corresponding explosive material models and equations of state but also simulates the propagation of shock waves and the instantaneous state responses of structures [30]. Therefore, ANSYS/LSDYNA software was selected for simulation studies in this study.
2.2. Software Simulation Process
- (1)
- Model establishment: This step mainly comprises model building, meshing, element-type selection, definition of material parameters, creation of parts, definition of (symmetry) constraints and (non-reflection) boundary conditions, energy settings, solution time control, and output K files.
- (2)
- K-file check: In this step, a K file is opened and checked in LS-PrePost. K files contain material parameter verification, equation of state, Lagrange algorithm, initial conditions for detonation, ignition method, and coupling method.
- (3)
- Solution process: In this step, the modified K file is imported into the LS-RUN solver to solve. Then, the resulting file is saved and used to record the blasting area, blast radius, and other results to draw a corresponding cloud map [31].
- (4)
- Result post-processing viewing: In this step, the LS-PrePost post-processing software is used to open a D3plot in the result file for the viewing and analysis of the solution results.
A numerical model of ice blasting involves the blasting and underwater explosion process of an ice material model, reflecting the coupling between air, explosives, water, and ice, and the whole change process is dynamic, complex, and highly nonlinear. According to universities and research institutes such as the National University of Defense Technology and Dalian University of Technology, ANSYS/LSDYNA procedures are often used for explicit dynamic analysis [32].
2.3. Model Building
2.3.1. The Theory of the Model
In accordance with classification as per the coordinate system, two kinds of methods in the nonlinear continuum mechanics, i.e., the Lagrangian method (mainly for solid mechanics) and Euler’s method (mainly for fluid mechanics), have been developed for numerical calculation [33]. For the Lagrangian method, the mesh is fixed to the object, and will then move or deform with the object, which is used for calculation to intuitively and naturally handle the free surface and boundary surface of the object and accurately describe the stress history of different materials. However, in the case of the occurrence of the large deformation, the mesh will suffer from serious distortion or aberration along with the object, which decreases the calculation accuracy or even causes calculation termination. For Euler’s method, the mesh is fixed to the space, and its shape always remains unchanged, which is suitable for calculating the problem of large deformation. However, considering the difficulty of using Euler’s method to describe the moving boundary or the boundary surface between different substances, the tracking and processing of the boundary surface using some special methods is necessarily important, which is one of the main directions of the current development of Euler’s method.
Given that both the Lagrangian method and Euler’s method are provided with their respective advantages and disadvantages, a batch of problems that cannot be solved merely by either of them can be solved by combining the two organically, fully absorbing their advantages and overcoming their disadvantages. The Arbitrary Lagrangian and Eulerian method (referred to as ALE method for short) is thus produced for this very purpose.
For the ALE method, the mesh can move arbitrarily in space, namely moving independently of the object coordinate system and the space coordinate system, when the moving boundary of the object can be accurately described, and the reasonable shape of the mesh can be maintained by specifying the appropriate motion form of the mesh. In this case, the ALE method has wide applicability in the case of simulating the impact, explosion, and other large deformation problems, and is of practical value to numerical simulation of the underground explosion dynamic process.
The nonlinear continuum mechanics method and the method of Gauss theorem can be used for deducing the governing equation under ALE description.
The following is the mass conservation equation.
In the formula, is the distance from the reference point ξ to the origin, is the material flow velocity of the particle X, is the density of the material, is the moving distance of the particle X, and is the time.
The formula below is the momentum equation.
In the formula, cj is the grid migration velocity, is the Cauchy stress tensor, and is the body force per unit mass.
The following formula is the equation of energy conservation.
In the formula, is the mass specific internal energy and is the heat flux.
The model consisted of four parts: air, ice, explosives, and water. The air model size was 600 cm × 600 cm × 100 cm, the size of the ice model was 600 cm × 600 cm × X cm (X values are 100, 130, and 160 cm), the size of the water body model was 600 cm × 600 cm × 200 cm (in order to ensure greater realism, a non-reflective model was used to prevent the reflected waves at the bottom of the river from affecting the blasting results), and the dynamite model size was 10 cm × 10 cm × 10 cm, as shown in Figure 2.
- (1)
- Meshing was set to a 5 cm × 5 cm × 5 cm grid.
- (2)
- All material units were set using SOLID 164.
- (3)
- After the symmetry of the blasting model, calculation convenience, and calculation time reductions were set, a 1/4 three-dimensional model was established. The YOZ and XOZ planes were symmetrical planes that were set as symmetry boundaries, and symmetric normal constraints were applied.
- (4)
- To simulate infinite air basin and the infinite water basin, the left, back, and bottom boundaries of the model were set to non-reflective boundary. The bottom boundary was set to the free surface.
- (5)
- The ignition positions were determined as being located at the top, center, and bottom of the explosive center axis.
- (6)
- Numerical simulation units were calculated using cm-g-μs.
- (7)
- Considering the duration of the entire blasting process, the model blasting solution time in this paper was set to 1000 μs.
2.3.2. Model Parameters and Algorithms
The main model materials in this study were ice, explosives, water, and air. The ice body was considered with the Lagrange algorithm, and the air, explosives, and water were considered with the ALE algorithm, that is, the multi-substance Arbitrary Lagrange–Euler algorithm [34,35,36]. The model calculation used the multi-substance ALE fluid–structure interaction algorithm so that the mesh did not have serious deformations [37] that were too different from actual situations. The ice body was considered with an isotropic elastic fracture model (MAT_ISOTROPIC_ELASTIC_FAILURE), and the main model parameters are shown in Table 1.
Explosive parameter was set as a TNT explosive parameter, the model was set to adopt the (MAT_HIGH_EX-PLOSIVE_BURN) high-energy explosive model, and the explosion pressure equation of state was calculated using the JWL (Jones–Wilkins–Lee) equation of state [38], which is expressed as follows:
In the above equation, E0 is the initial internal energy, P is the pressure, V is the relative volume, and A, B, R1, R2, and ω are material constants.
TNT material parameters are shown in Table 2.
In the table, C0, C1, C2, C3, C4, C5, and C6 are constants.
2.3.3. Introduction to Working Conditions
In this article, simulations of the working conditions were established with three variables: the distance of the explosives from the ice surface, the ignition location, and the thickness of the ice layer.
Working condition 1:
- (1)
- The upper end of the explosive is ignited, the ice thickness is 100 cm, and the upper end of the explosive is 20 cm from the ice.
- (2)
- Ignition occurs at the center of the explosive, the thickness of the ice layer is 100 cm, and the upper end of the explosive is 20 cm from the ice layer.
- (3)
- Ignition occurs at the bottom of the explosive, the thickness of the ice layer is 100 cm, and the upper end of the explosive is 20 cm from the ice layer.
Working condition 2:
- (1)
- Ignition occurs at the center of the explosive, the thickness of the ice layer is 100 cm, the upper end of the explosive is 20 cm from the ice layer, and the explosive mass is 3.2 kg.
- (2)
- Ignition occurs at the center of the explosive, the thickness of the ice layer is 100 cm, the upper end of the explosive is 20 cm from the ice layer, and the explosive mass is 4.8 kg.
- (3)
- Ignition occurs at the center of the explosive, the thickness of the ice layer is 100 cm, the upper end of the explosive is 20 cm from the ice layer, and the explosive mass is 6.4 kg.
- (4)
- Ignition occurs at the center of the explosive, the thickness of the ice layer is 100 cm, the upper end of the explosive is 20 cm from the ice layer, and the explosive mass is 8.0 kg.
Working condition 3:
- (1)
- Ignition occurs at the center of the explosive, the thickness of the ice layer is 100 cm, and the upper end of the explosive is 30 cm from the ice layer.
- (2)
- Ignition occurs at the center of the explosive, the thickness of the ice layer is 100 cm, and the upper end of the explosive is 40 cm from the ice layer.
- (3)
- Ignition occurs at the center of the explosive, the thickness of the ice layer is 100 cm, and the upper end of the explosive is 50 cm from the ice layer.
- (4)
- Ignition occurs at the center of the explosive, the thickness of the ice layer is 100 cm, and the upper end of the explosive is 60 cm from the ice layer.
- (5)
- Ignition occurs at the center of the explosive, the thickness of the ice layer is 100 cm, and the upper end of the explosive is 70 cm from the ice layer.
- (6)
- Ignition occurs at the center of the explosive, the thickness of the ice layer is 100 cm, and the upper end of the explosive is 80 cm from the ice layer.
- (7)
- Ignition occurs at the center of the explosive, the thickness of the ice layer is 100 cm, and the upper end of the explosive is 90 cm from the ice layer.
- (8)
- Ignition occurs at the center of the explosive, the thickness of the ice layer is 100 cm, and the upper end of the explosive is 100 cm from the ice layer.
- (9)
- Ignition occurs at the center of the explosive, the thickness of the ice layer is 100 cm, and the upper end of the explosive is 110 cm from the ice layer.
- (10)
- Ignition occurs at the center of the explosive, the thickness of the ice layer is 100 cm, and the upper end of the explosive is 120 cm from the ice layer.
- (11)
- Ignition occurs at the center of the explosive, the thickness of the ice layer is 100 cm, and the upper end of the explosive is 130 cm from the ice layer.
- (12)
- Ignition occurs at the center of the explosive, the thickness of the ice layer is 100 cm, and the upper end of the explosive is 140 cm from the ice layer.
- (13)
- Ignition occurs at the center of the explosive, the thickness of the ice layer is 100 cm, and the upper end of the explosive is 150 cm from the ice layer.
- (14)
- Ignition occurs at the center of the explosive, the thickness of the ice layer is 100 cm, and the upper end of the explosive is 160 cm from the ice layer.
- (15)
- Ignition occurs at the center of the explosive, the thickness of the ice layer is 100 cm, and the upper end of the explosive is 170 cm from the ice layer.
3. Results
3.1. Analysis of the Influence of Ignition Location on Ice Sheet
The established ice blasting model was used to analyze condition 1 regarding the impact of different ignition methods on the blast volume of ice bodies when the bottom was set as a non-reflective surface. The equivalent pressure distribution plot is shown in Figure 3.
As can be seen from the figure, the maximum pressure of the equivalent pressure cloud at the center ignition was 6.89966 × 10⁻⁵ GPa, the maximum pressure of the bottom ignition was 5.07765 × 10⁻⁵ GPa, and the minimum pressure of the top ignition was 4.25708 × 10⁻⁵ GPa. In addition, analysis of its pressure distribution showed that the center ignition explosion was generated by the most concentrated pressure distribution, the top of the ignition explosion was generated by the most dispersed pressure distribution, and the bottom of the ignition explosion was generated by the pressure distribution between these. Furthermore, the analysis of pressure distribution showed that the center ignition pressure distribution was the most concentrated, the top ignition pressure distribution was the most dispersed, and the bottom ignition was between the two.
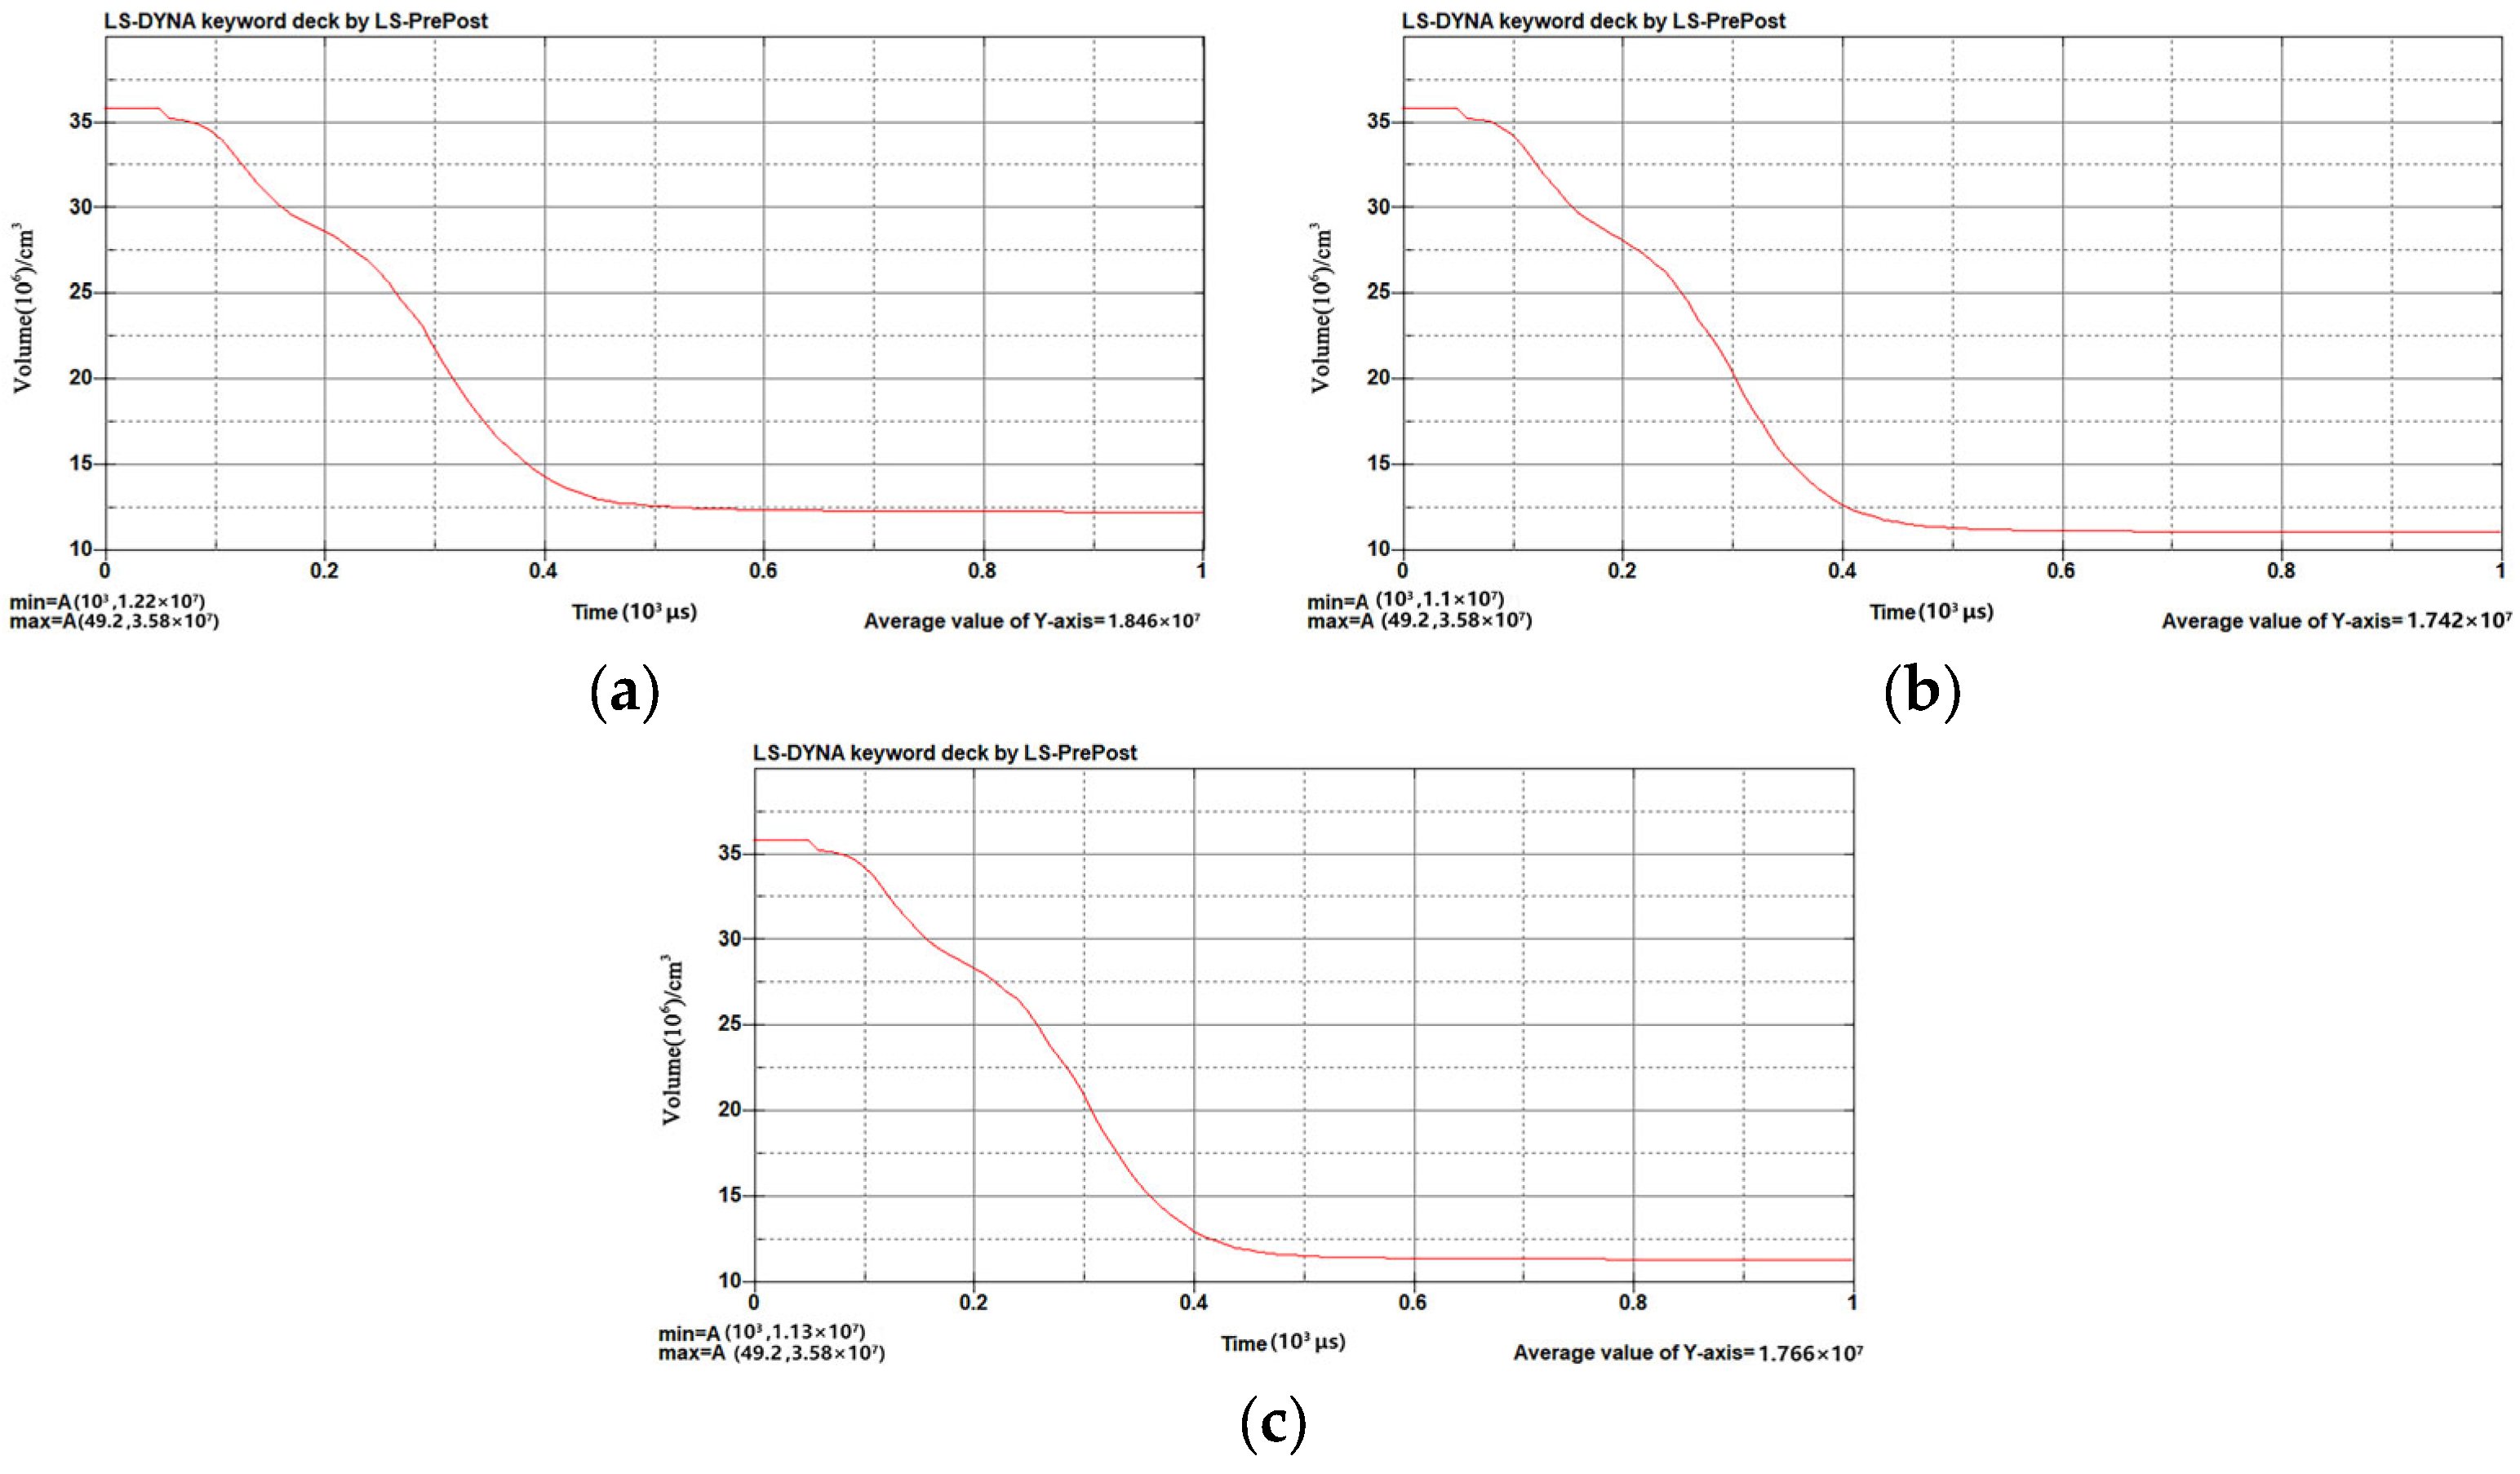
The time variation of ice blast volume for different ignition modes is shown in Figure 4.
An analysis of the blast volume in time at different locations of ignition showed that there was no effect of ignition at different locations at the beginning of blasting, there was a significant volume change from 49.2 μs on, and the remaining volume after blasting was 1.1 × 107 cm3 at the center ignition, 1.13 × 107 cm3 at the bottom ignition, and 1.22 × 107 cm3 at the top ignition. The volume of blasting caused by the center ignition was the largest, followed by the bottom ignition, and the volume of blasting caused by the top ignition was the smallest.
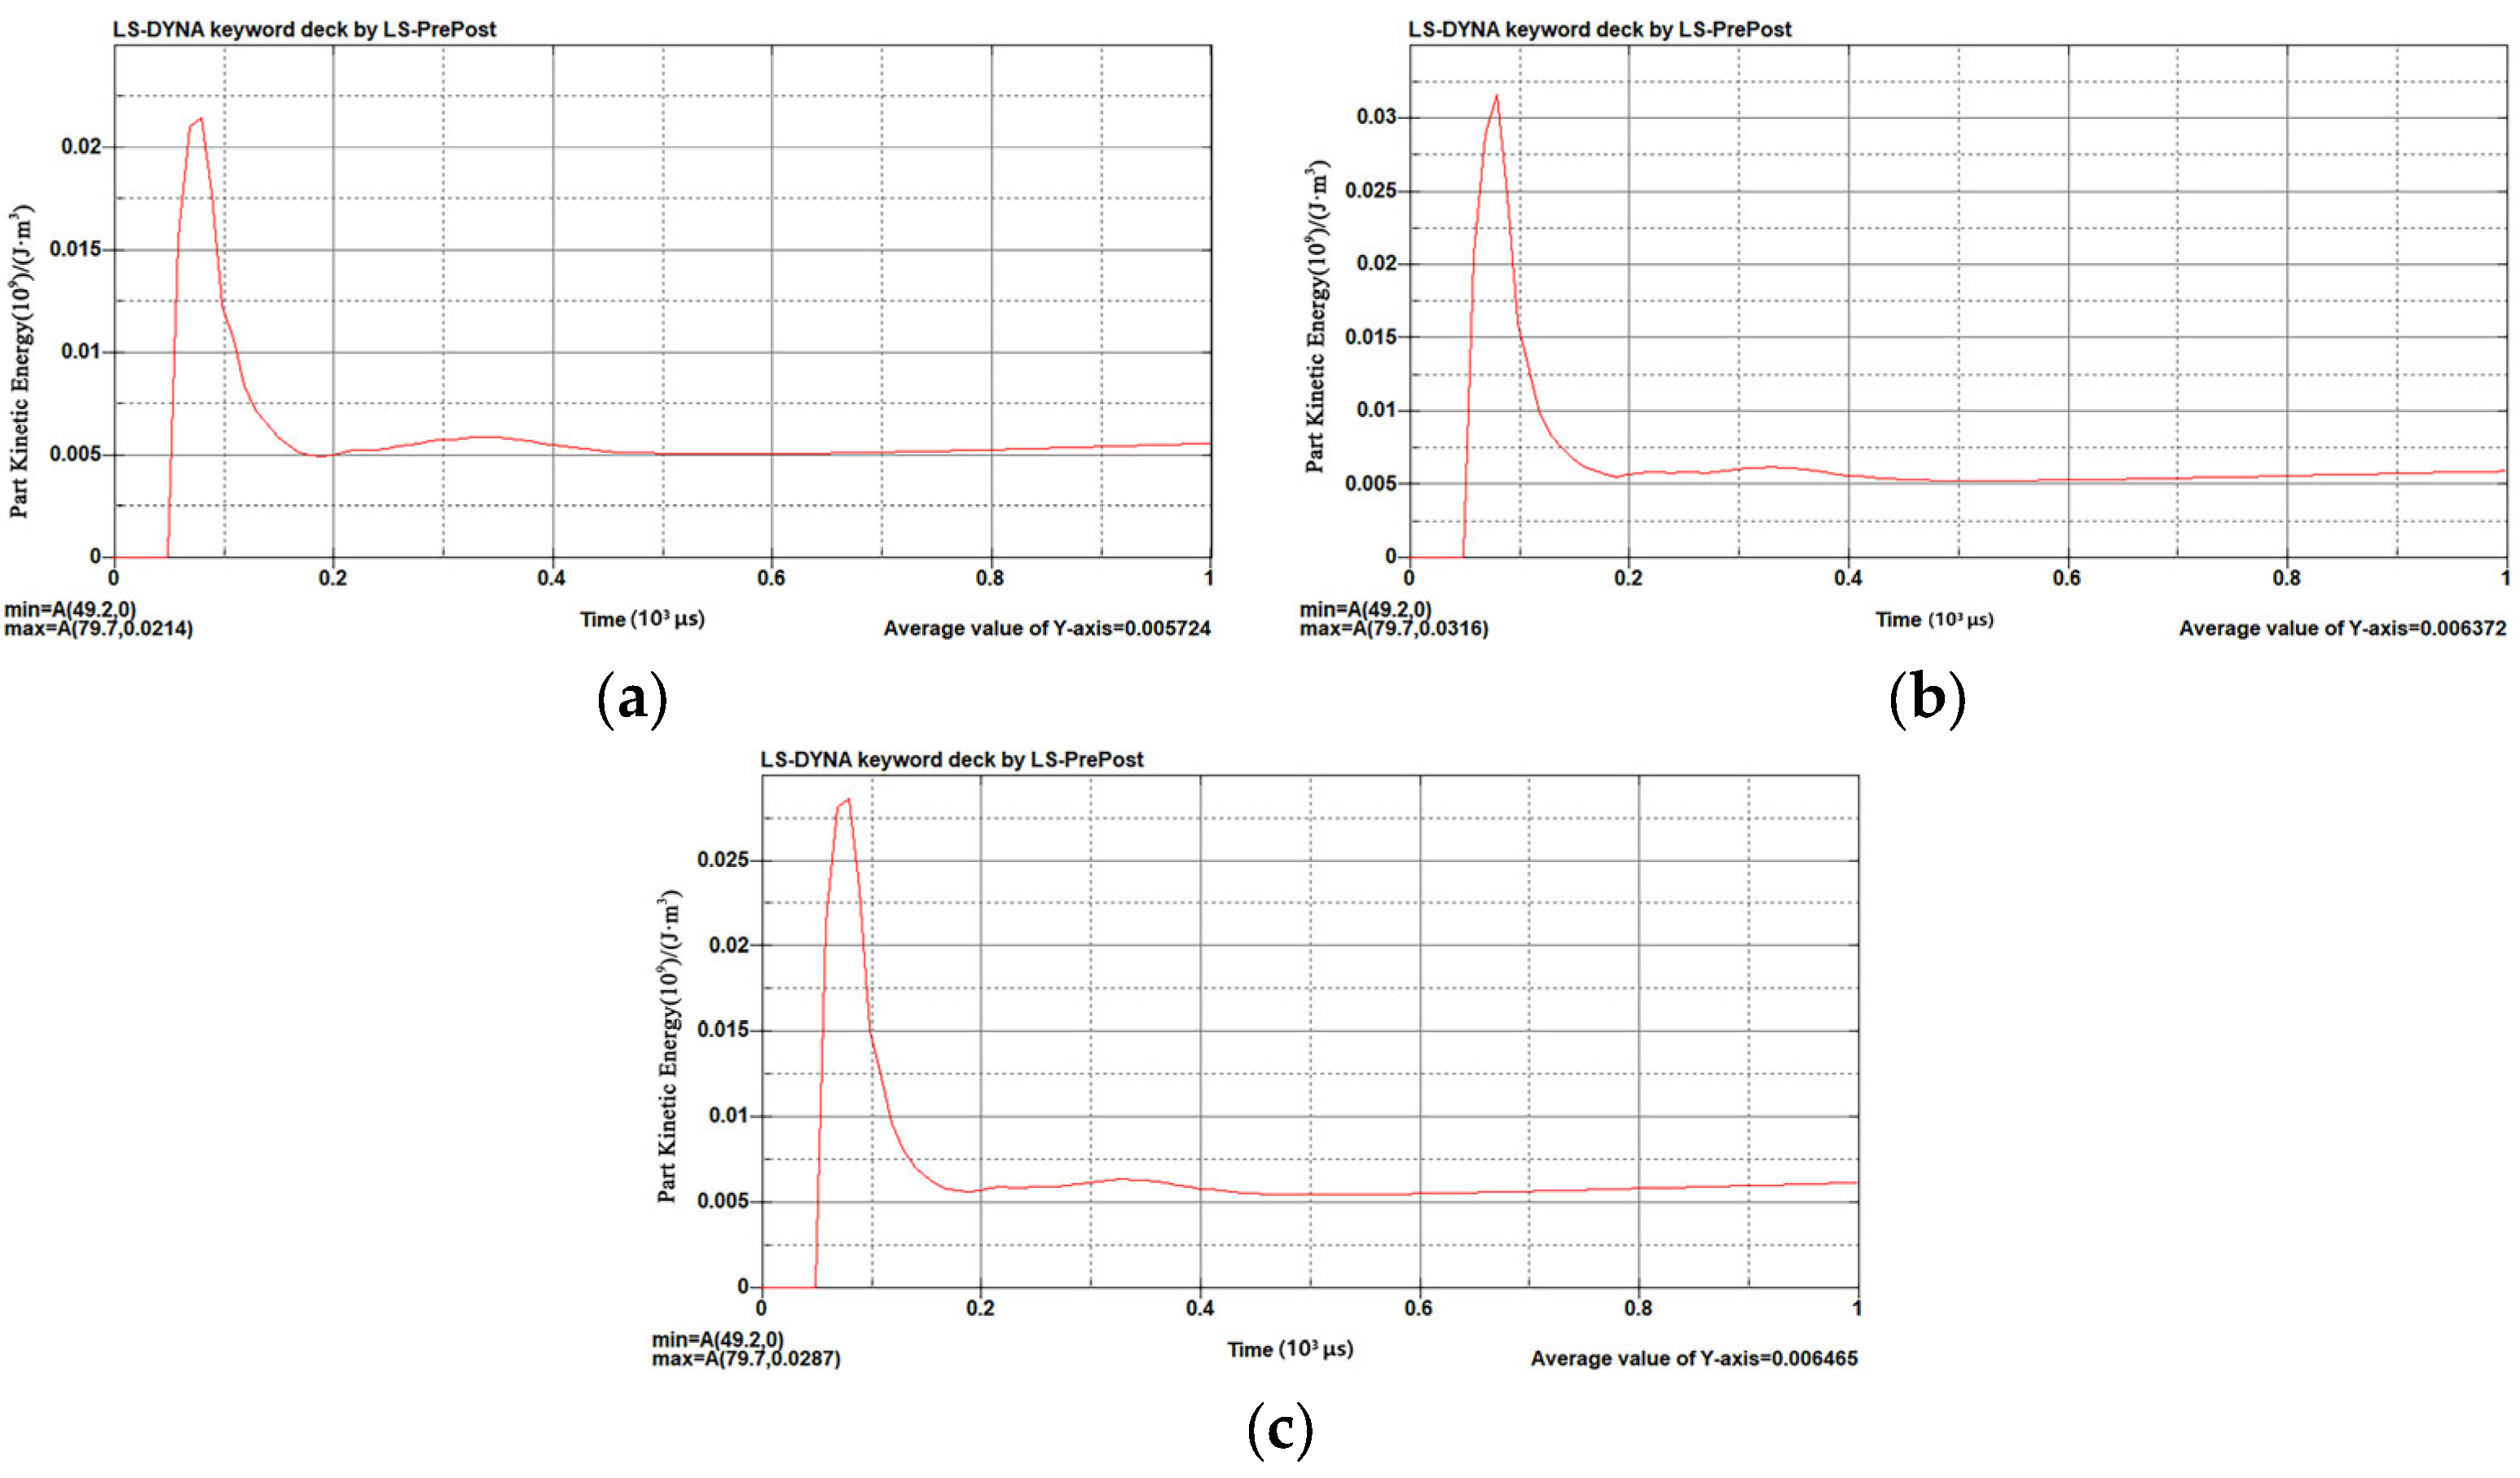
The change in kinetic energy at the moment of detonation for different ignition methods is shown in Figure 5.
The figure shows that all three ignition methods resulted in a maximum kinetic energy at 79.7 μs following the maximum initial kinetic energy directly at 49.2 μs. The maximum initial kinetic energy was reached by wave transmission in a short time, and the maximum initial kinetic energy was 3.16 × 10⁷ J/m−3 at the center ignition, 2.87 × 10⁷ J/m−3 at the bottom ignition, and 2.14 × 10⁷ J/m−3 at the top ignition.
The relationships between ignition position and ice blasting volume, final maximum pressure, and instantaneous kinetic energy are shown in Table 5.
3.2. Analysis of the Influence of Explosive Masses on Ice Sheet
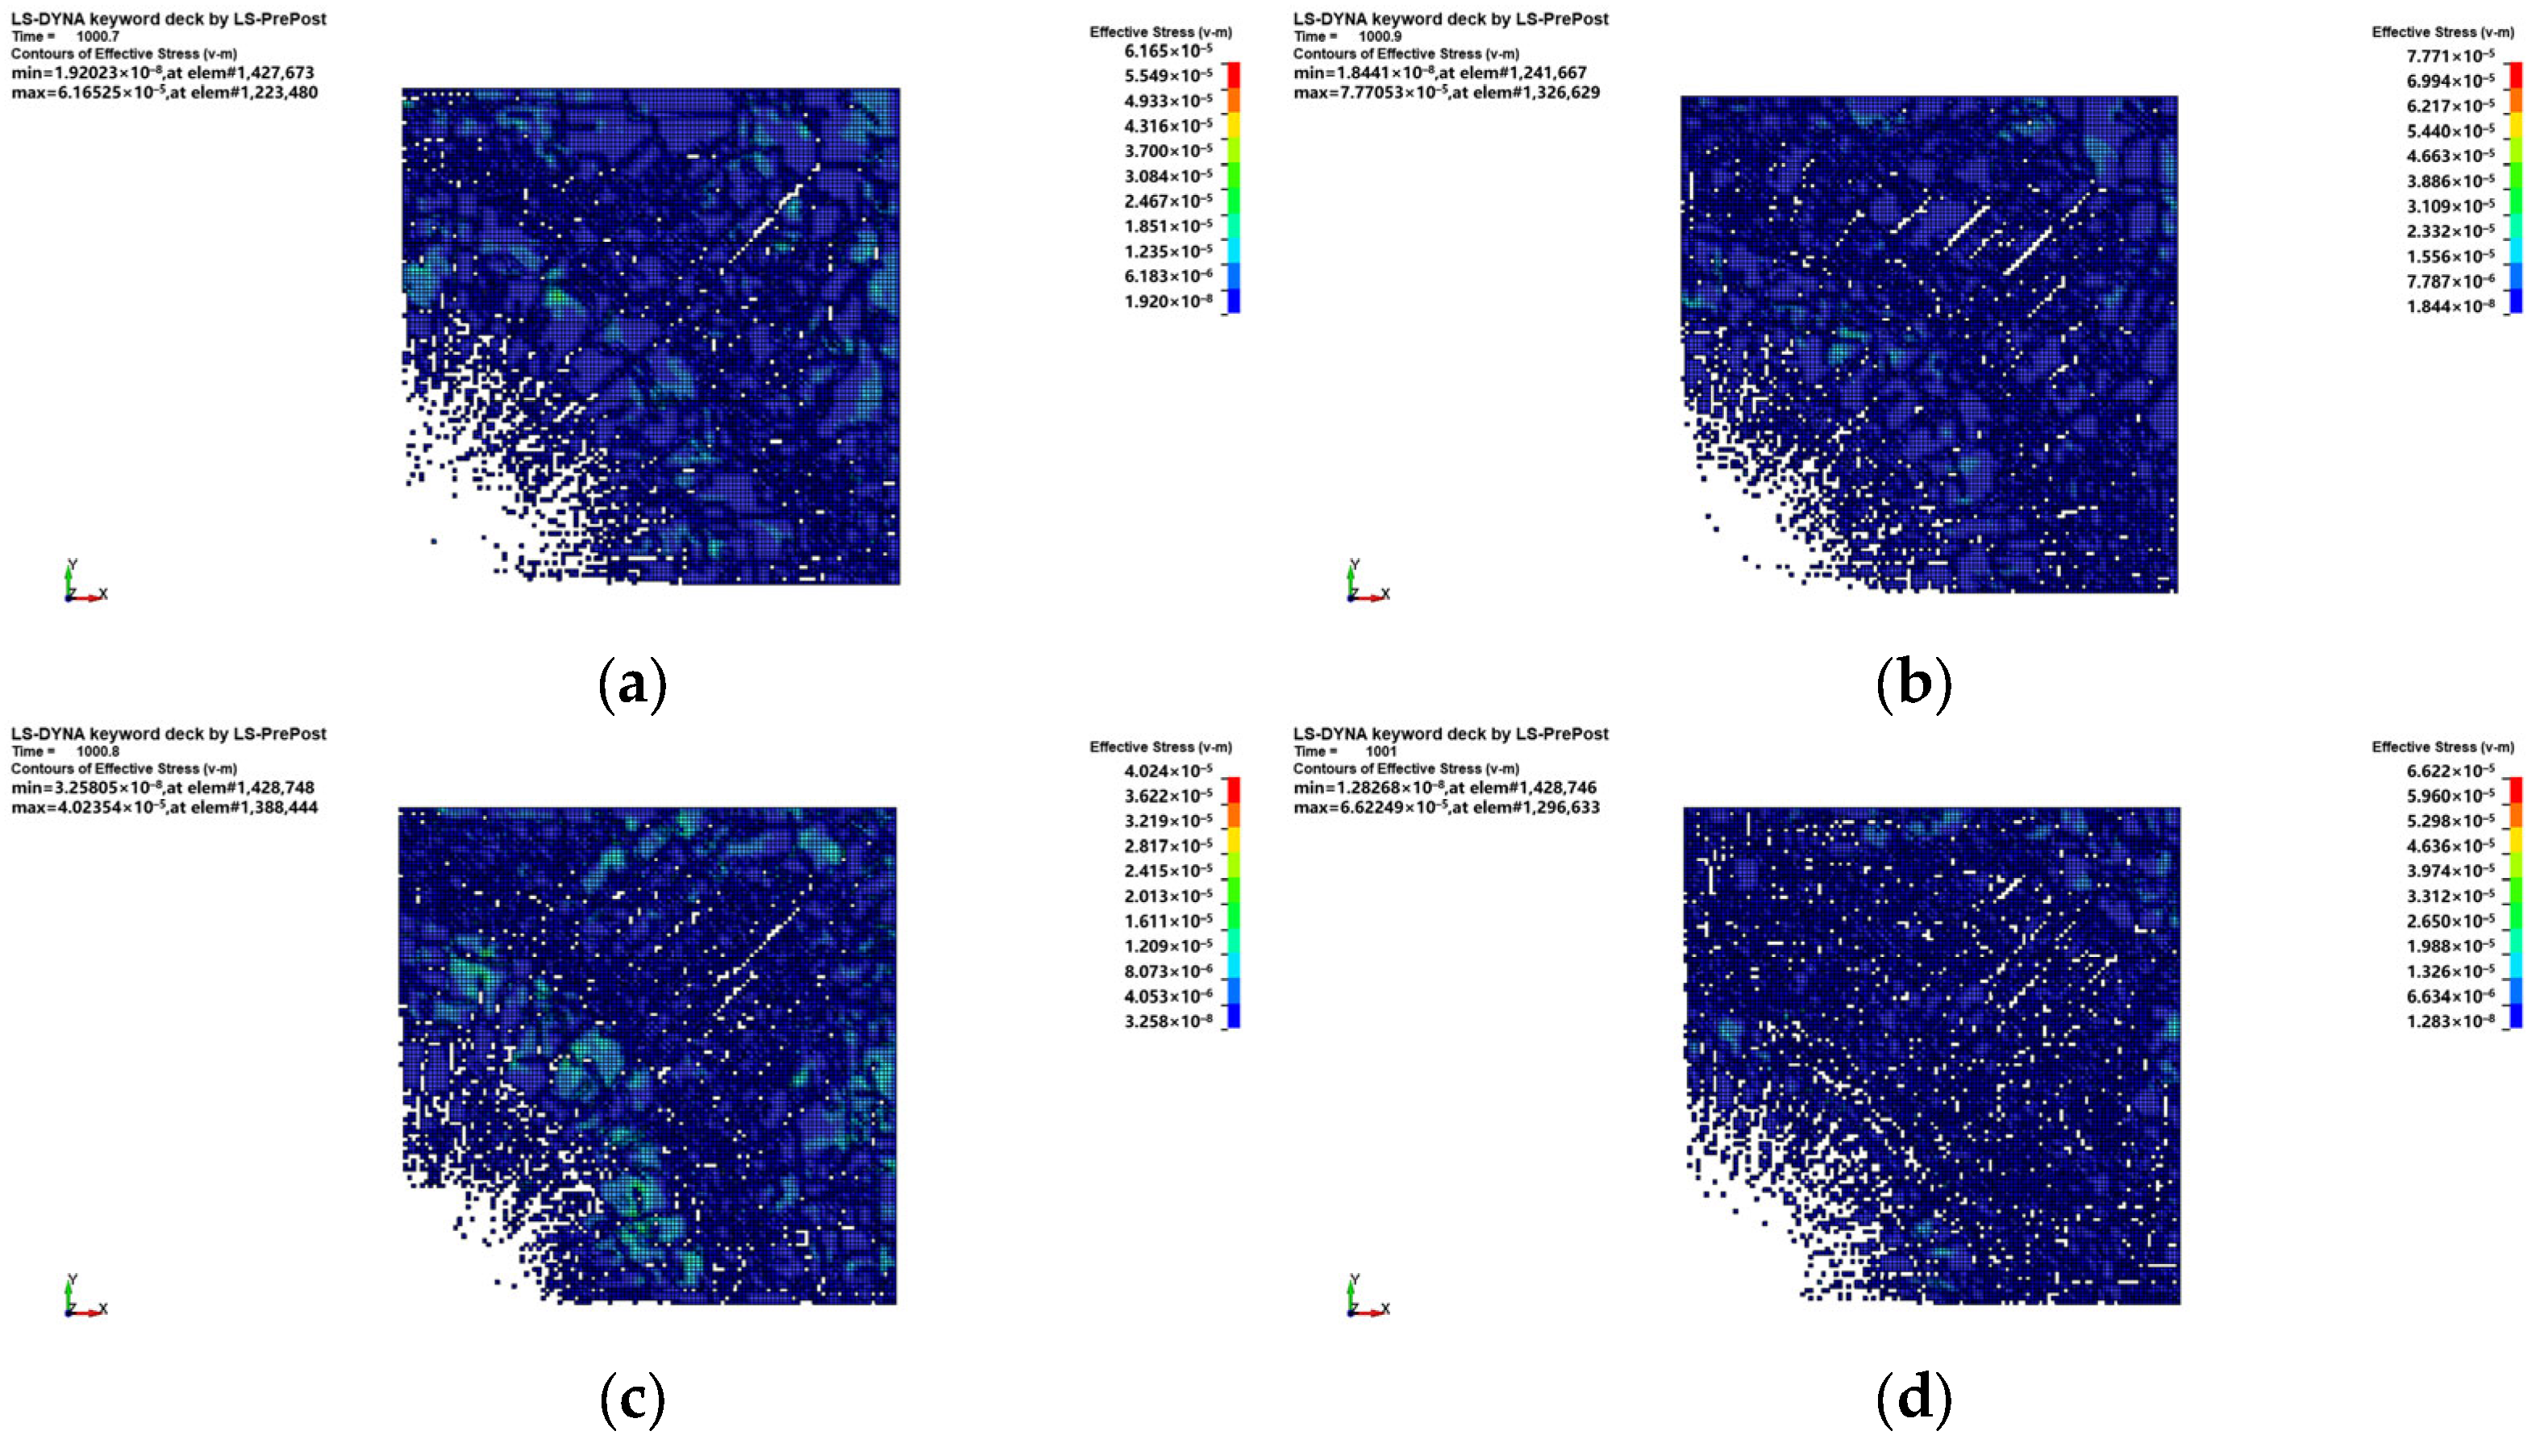
The established ice blasting model was used to analyze simulated condition 2 regarding the effect of different explosive masses on the ice blasting volume at center ignition. Equivalent pressure distributions are shown in Figure 6.
From the figure, it can be seen that the maximum pressure of the equivalent pressure cloud was 6.89966 × 10⁻⁵ GPa when the explosive mass was 1.6 kg, the maximum pressure of the equivalent pressure cloud was 6.16525 × 10⁻⁵ GPa when the explosive mass was 3.2 kg, the maximum pressure of the equivalent pressure cloud was 7.77053 × 10⁻⁵ GPa when the explosive mass was 4.8 kg, the maximum pressure of the equivalent pressure cloud was 4.02354 × 10⁻⁵ GPa when the explosive mass was 6.4 kg, and the maximum pressure of the equivalent pressure cloud was 6.62249 × 10⁻⁵ GPa when the explosive mass was 8.0 kg. The maximum pressure of the equivalent pressure changes in waves.
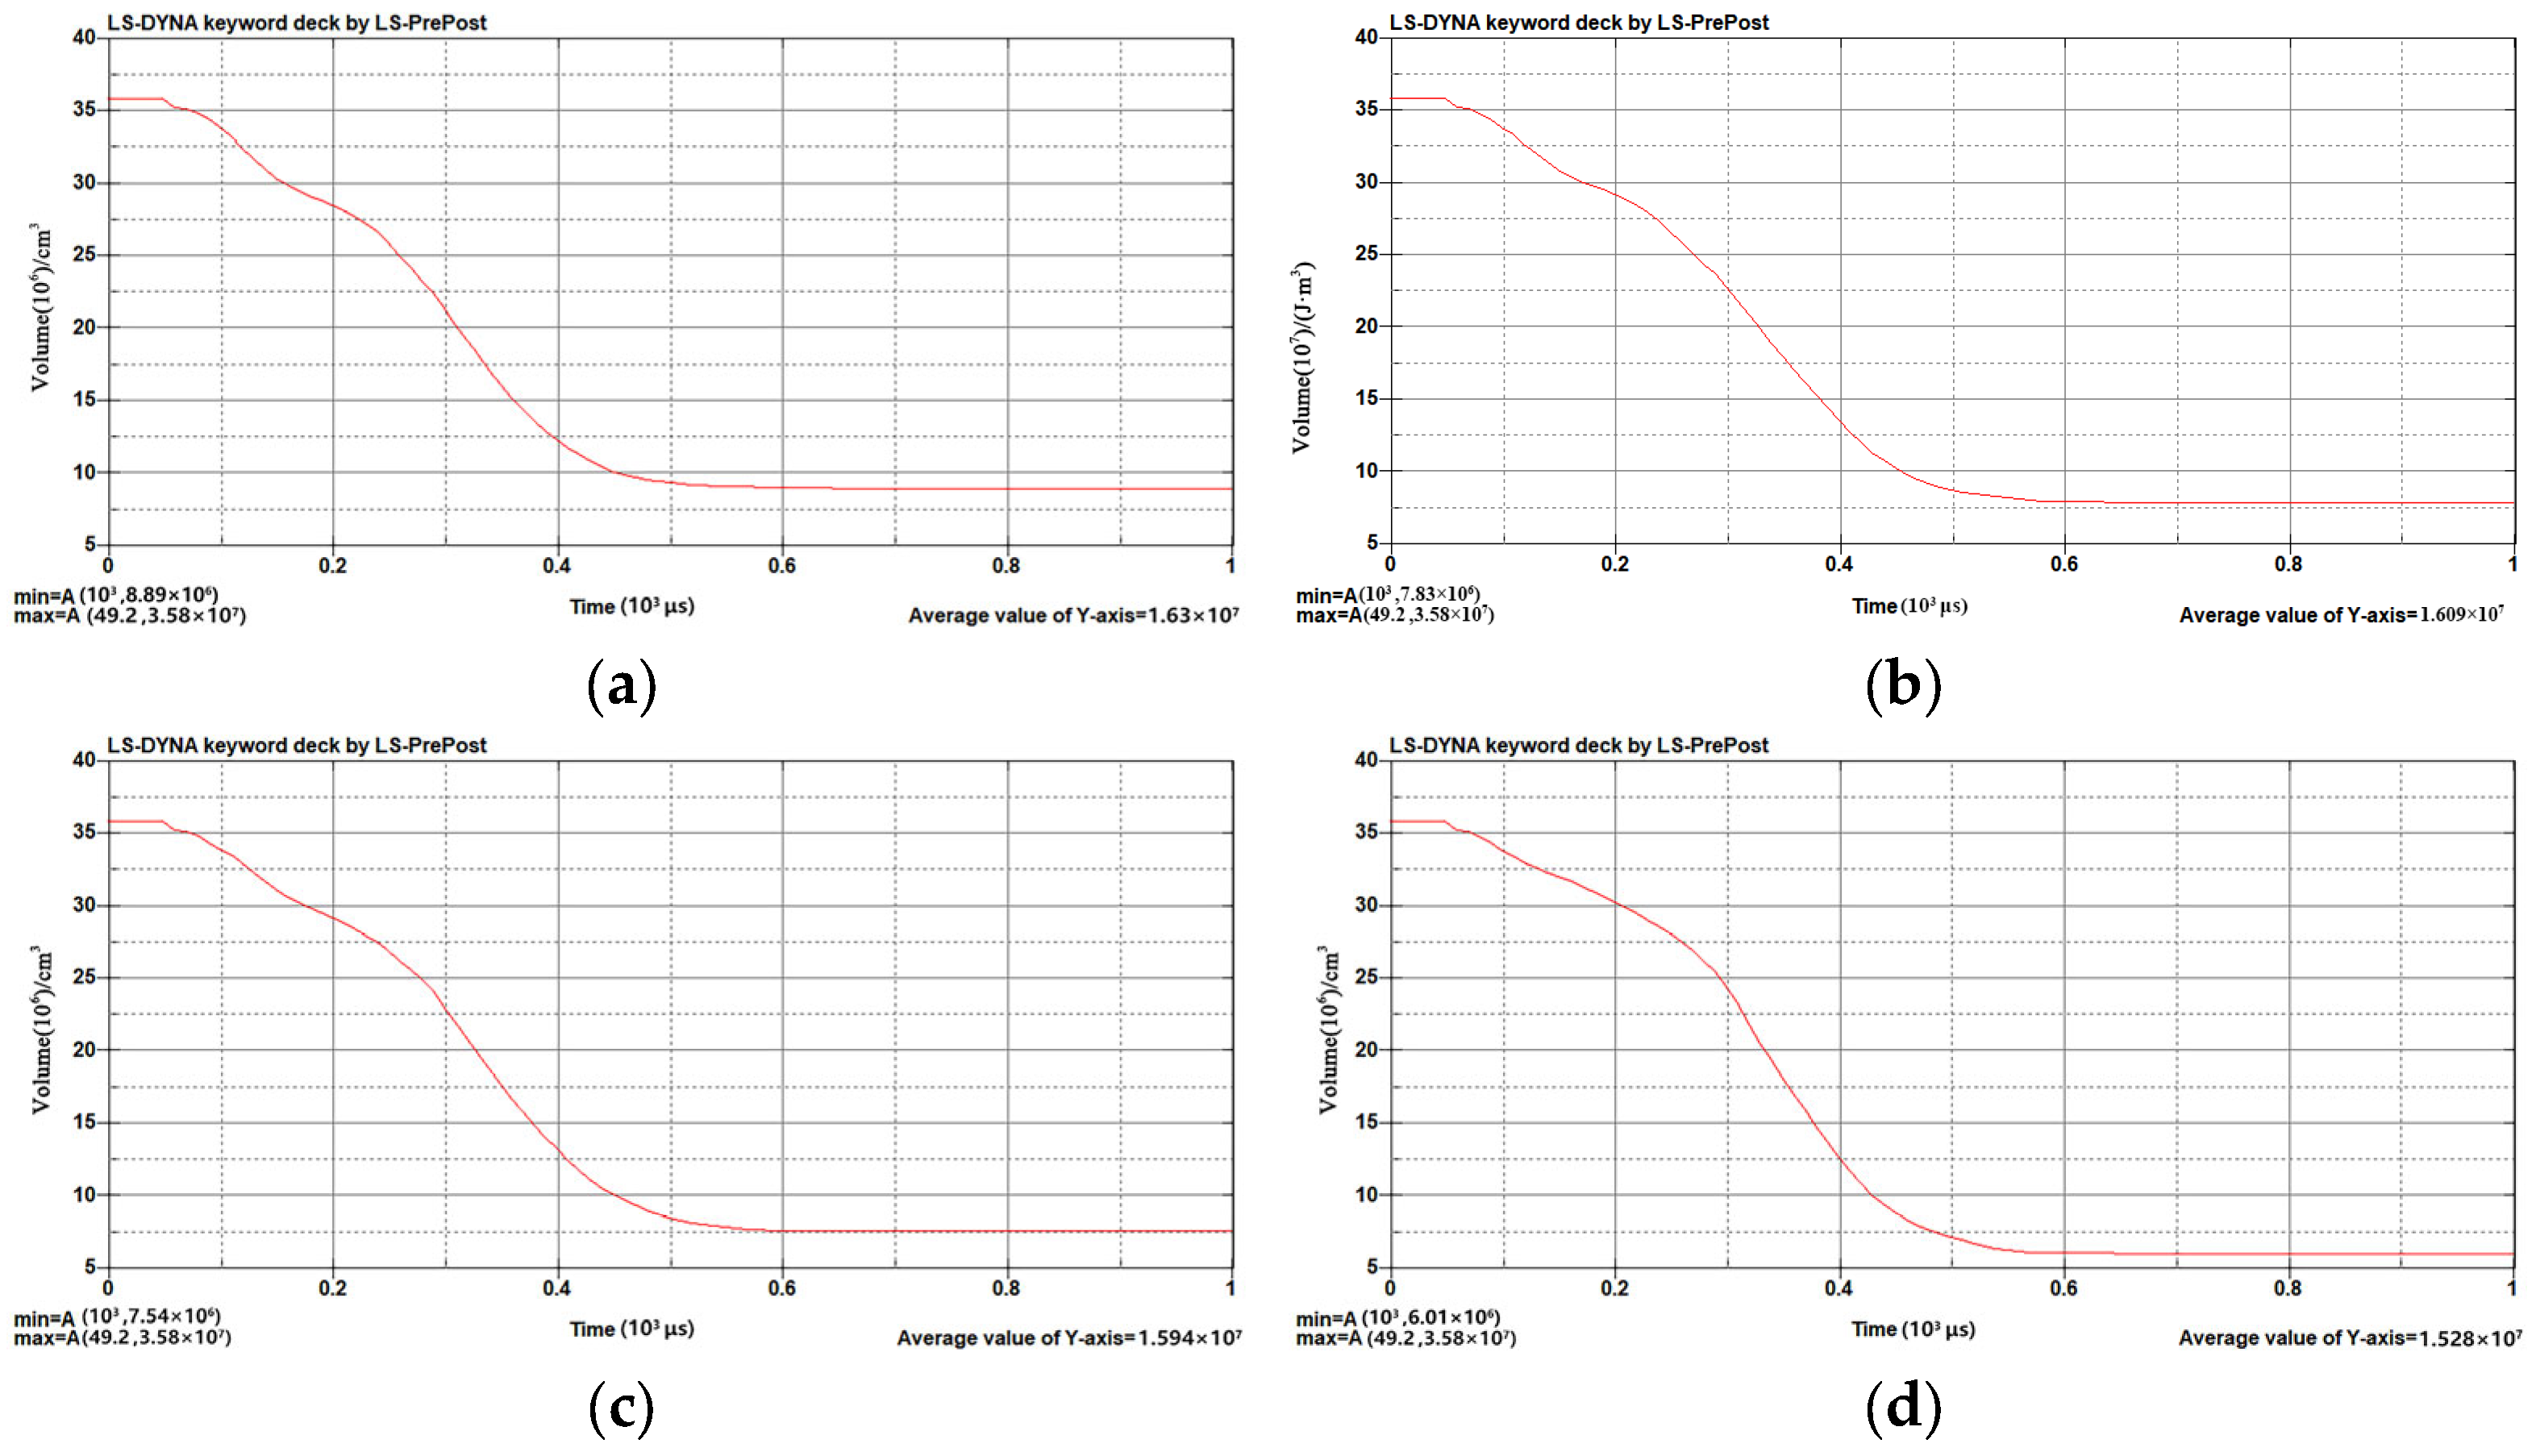
The time variations of the ice blast volume for different explosive masses are shown in Figure 7.
The instantaneous kinetic energy changes for different explosive masses are shown in Figure 8.
The relationships between explosive mass and ice blasting volume, maximum pressure at the end, instantaneous kinetic energy, and average kinetic energy are shown in Table 6.
From the above table, the volume of explosive blast is found to increase gradually as the mass of explosive increases. However, in the third column of the table, the blast volume is not found to increase linearly when the explosive mass increases from 1.6 kg to 6.4 kg. Here, the blast volume is found to increase gradually and more slowly, but when the explosive mass reaches 8 kg, a significant increase in blast volume can be observed. Therefore, an increase in blasting efficiency is assumed to be possible by increasing the number of explosive packages. However, as the number of individual explosive packages increases, the blasting effect will gradually approach its limit. This limit can only be exceeded by using a large quantity of explosives. When observing the maximum kinetic energy when blasting different masses of explosives, it was found that the maximum kinetic energy (3.16 × 10⁷ J/m−3) was generated when the mass of explosives was 4.8 kg. As the explosive mass increased, the average kinetic energy of the ice layer was gradually increasing. However, the average kinetic energy generated by the explosion of 6.4 kg of explosives did not exhibit a significant change compared to the average kinetic energy generated by the explosion of 4.8 kg of explosives.
3.3. Analysis of the Effect of Explosive Location on Ice Blasting Model
The established ice blasting model was used to analyze simulated working condition 3 regarding the effect of different positions of explosives on the blasting volume of the ice body at the center ignition and an ice thickness of 100 cm. The stress effects are shown in Figure 9a–o.
The simulation results regarding the effects of different distances between explosives and the ice model on the ice blasting under working condition 3 are shown in Table 7.
Table 7 shows that at different distances between the explosive and ice model, the blasting effects were also different. Figure 10, Figure 11 and Figure 12 illustrate the relationships between different distances between the explosive and ice model and ice blasting volume, maximum pressure at the end, instantaneous kinetic energy, and average kinetic energy.
Figure 10 shows that when the distance between the dynamite and ice model was 20 to 120 cm, the larger the distance between the dynamite and ice model, the smaller the residual volume of the ice model after explosion and the more obvious the blasting effect. When the distance between the explosive and the ice model exceeded 160 cm, the residual volume of the ice model after explosion increased with the increase in the distance. As the distance between the dynamite and ice model increased, the maximum pressure at the end of the ice model changed in a wave-like manner, similar to the propagation of underwater explosion waves.
As the distance between the explosive and ice model increased, the maximum kinetic energy of the ice model reached a peak at 40 cm between the explosive and ice model. When the distance between the explosive and ice model was 70 to 160 cm, the maximum kinetic energy of the ice model increased with the increase in distance. When the distance between the explosive and ice model exceeded 160 cm, the maximum kinetic energy decreased with the increase in the distance.
Figure 12 shows that when the distance between the explosive and ice model was 20 to 150 cm, the average kinetic energy of the ice model increased with the increase in the distance; when the distance between the explosive and the ice model exceeded 150 cm, its average kinetic energy decreased with the increase in the distance.
4. Discussion
In the downstream section of Beiji Village, Mohe, between navigation mark 812 and 818, the ice thickness of approximately 100 cm was selected for the blasting experiments with three different ignition methods. The experimental results show that the central ignition blasting method produces the best explosion effect and the largest explosion radius, and the measured explosion radius is 387.5 cm, which is in line with the results obtained in condition 1 (working conditions of three different ignition methods), thus proving the reasonability of the simulation. In addition, after the explosion, it was found by observing the shape of the ice body that the explosion in the center produces a nearly circular blasting pit, but there are circular cracks in its outer ring, indicating that the ice explosion is not finished at one time, but carries on the energy transfer in the form of waves.
With the increase in the explosive mass, the blasting effect decreased gradually, and the impact could be increased by increasing the number of charge bags; however, as the number of individual charge bags increased, the blasting effect gradually approached the limit. Experimental verification indicated that when 1.6 kg TNT explosive explodes in a river section with an ice thickness of 1 m, the effective blasting area is a circular area with a radius of 8 m, thereby proving the reasonability of the simulation results in working condition 2.
In this case, it can be concluded that the explosive bags should be reasonably laid in a staggered arrangement in two rows of ice holes in the adjacent upstream and downstream sections along the direction of water flow, and the distance between the holes in the row and the distance of the adjacent row should be roughly equal. In addition, the effect of the broken ice sheet is the best in the case of an equal charge amount of each hole. The layout of explosive package hole distance is restricted by the water depth, ice thickness, and single hole charge, and the hole distance cannot be too large, or it cannot blast through the ice hole, and the icebreaking effect will be unfavorable as well, even if the single hole charge is large. If the blasting ice holes are arranged in the direction of the water flow along the river and the front and back rows are staggered, the blasting effect will be rather favorable and can effectively destroy the ice sheet and ensure that the scale of the ice is in line with the requirements of the river conditions for transporting the ice sheet.
Under the condition of an ice thickness of approximately 100 cm in the river section and an explosive mass of 1.6 kg, the blasting test was carried out in the ice area where the distance between the explosive and the ice was 20–200 cm (with 20 cm as the difference value). In order to facilitate the analysis, the explosion radius was measured, and it was found that the explosion effect on site is highly similar to the results simulated using the ANSYS model. The experimental results show that the blasting radius is the largest and the fracture effect of the ice body is the best in the case of a distance of 160 cm, which is in line with the results obtained in condition 3.
At the same time, the breakup of the ice of the main stream of the Heilongjiang River was performed after blasting for 4 days, during which the typical ice dam was observed near the 10 km overland route opening in the upper reach of the Mohe cross section at the blasting location during the period, since the ice blocks from the upper reach were accumulated and blocked. The field observation and theoretical reasoning results indicate a high probability that the ice dam will occur in the blasting river reach, and the resulting force will also be greater if the lower reach cross section of the ice dam is not blasted, without conditions for ice block transport in the blasting area. Since the slope of the river reach is small and has a great degree of curvature, it is considered the place where the water flow is mixed violently in the river. In this case, it is rather obvious that the river ice blasting plays a critical role in preventing an ice disaster in the Heilongjiang River.
5. Conclusions
The main conclusions drawn are as follows:
- It can be concluded through model simulation and experimental comparison that the blasting effect in the center is the best, and the blasting volume and radius are the largest when the explosive is ignited under the ice;
- With the increase in the explosive mass, the blasting effect will decrease gradually, and the impact can be increased by increasing the number of charge bags but will gradually approach the limit as the number of individual charge bags increases. Experimental verification indicates that 1.6 kg TNT can blast the river section with an ice thickness of 1 m, and the effective blasting area is a circular area with a radius of about 8 m;
- The explosive bags should be reasonably laid, in staggered arrangement in two rows of ice holes in the adjacent upstream and downstream section along the direction of water flow, and the distance between the holes in the row and the distance of the adjacent row should be roughly equal;
- In addition, the effect of the broken ice sheet is the best in the case of an equal charge amount of each hole. An ice blast is not finished at once, but experiences energy transfer in the form of waves. When the distance between the explosive and the ice is about L = 150 cm, the blasting effect is the best.
However, the simulation of the model needs to be improved in some areas. In the simulation, the temperature was not set, but the effect of temperature on the strength of the ice sheet is indeed the main factor. In general, the ice sheet intensity decreases with the decrease in temperature, and the blasting effect of river ice should be different at different temperatures. According to the experimental and field observation data of the blasting observation, ice sheet blasting can be carried out in the case of a stable and positive maximum temperature of the day, when the ice sheet is still hard in texture and high in efficiency. Breaking ice will break too early and will refreeze, and even destroy all previous efforts, resulting in waste. In this case, it is advisable to carry out ice blast 3–5 days before the opening of the river. During the opening period, the existence time of river ice is short, making it difficult to grasp the timing of the blasting simulation and field experiment, and the number of experiments is rather limited. Considering the influence of river hydraulic and thermal factors, the numerical simulation is combined under hydraulic and thermal conditions, and it is more difficult to simulate under complex hydraulic conditions. To this end, the following solutions to close the gap are hereby proposed: (i) to improve the cross application of multiple disciplines; (ii) to fully combine the method with various coupling factors, consider turbulent conditions of hydrothermal conditions, and carry out a deeper theoretical analysis of the model under the boundary treatment and scene setting; and (iii) to combine with practice, perform more field tests, provide data for laboratory tests, and create similarity analyses at the same time.
Author Contributions
Conceptualization, D.L. and C.D.; methodology, D.L.; software, D.L.; validation, C.D., C.Y. and Y.M.; formal analysis, D.L.; investigation, C.D. and Y.M.; resources, C.D.; data curation, D.L.; writing—original draft preparation, D.L.; writing—review and editing, C.D. and C.Y.; visualization, D.L. and Y.M.; funding acquisition, C.D. All authors have read and agreed to the published version of the manuscript.
Funding
This work was funded by the National Natural Science Foundation of China, the State Key Laboratory of Permafrost Engineering Open Fund Grant and Research on optimal matching and regulation of soil and water resources in the Sanjiang Plain, and numbers are as follows: National Natural Science Foundation of China, No. 41202171, The State Key Laboratory of Permafrost Engineering Open Fund Grant, No. SKLFSE201310, Research on optimal matching and regulation of soil and water resources in the Sanjiang Plain, No. 22053.
Institutional Review Board Statement
Not applicable.
Informed Consent Statement
Not applicable.
Data Availability Statement
Not applicable.
Conflicts of Interest
The authors declare no conflict of interest.
References
- Yang, X.; Pavelsky, T.M.; Allen, G.H. The past and future of global river ice. J. Nat. 2020, 577, 69–73. [Google Scholar] [CrossRef] [PubMed]
- Prowse, T.D. River-Ice ecology. I: Hydrologic, geomorphic, and water-quality aspects. J. Cold Reg. Eng. 2001, 15, 1–16. [Google Scholar] [CrossRef]
- Beltaos, S.; Burrell, B.C. Hydrotechnical advances in Canadian river ice science and engineering during the past 35 years. J. Can. J. Civ. Eng. 2015, 42, 583–591. [Google Scholar] [CrossRef]
- Shen, H.T.; Wang, D.S. Under cover transport and accumulation of frazil granules. J. Hydraul. Eng. 1995, 121, 184–195. [Google Scholar] [CrossRef]
- Chen, J.G.; Zeng, Q.H.; Wang, Z.Y. The transport properties of ice sheet currents. J. Sediment Res. 1992, 1, 61–69. (In Chinese) [Google Scholar] [CrossRef]
- Lu, S.B.; Huang, Q.; Wu, C.G.; Gao, F. Ice disaster in the Ningmeng section of the Yellow River and measures to prevent flooding in reservoirs. J. Nat. Dis. 2010, 19, 43–47. (In Chinese) [Google Scholar] [CrossRef]
- Wang, Y.S.; Yang, K.L.; Zhang, B. Design Manual for River Ice Management and Control Engineering; China Water Resources and Hydropower Press: Beijing, China, 2013. [Google Scholar]
- Ashton, G.D. River and Lake Ice Engineering; Water Resources Publications: Littleton, CO, USA, 1986. [Google Scholar]
- Shen, H.T.; Su, J.; Liu, L. SPH simulation of river ice dynamics. J. Comput. Phys. 2000, 165, 752–770. [Google Scholar] [CrossRef]
- Shen, H.T. Mathematical modeling of river ice processes. J. Cold Reg. Sci. Technol. 2010, 62, 3–13. [Google Scholar] [CrossRef]
- Beltaos, S.; Prowse, T.D. Climate impacts on extreme ice-jam events in Canadian rivers. Hydrol. Sci. J. 2001, 46, 157–181. [Google Scholar] [CrossRef]
- Beltaos, S. River Ice Formation; Committee on River Ice Processes and the Environment: Whitehorse, YT, Canada, 2013. [Google Scholar]
- Boucher, É.; Bégin, Y.; Arseneault, D. Impacts of recurring ice jams on channel geometry and geomorphology in a small high-boreal watershed. Geomorphology 2009, 108, 273–281. [Google Scholar] [CrossRef]
- Song, C.; Zhu, X.; Han, H.; Lin, L.; Yao, Z. The influence of riverway characteristics on the generation and dissipation of ice dam in the upper reaches of Heilongjiang River. J. Hydraul. Eng. 2020, 51, 1256–1266. [Google Scholar] [CrossRef]
- Spyros, B. River Ice Jams; Water Resource Publication: New York, NY, USA, 1995. [Google Scholar]
- Spyros, B. River Ice Breakup; Water Resource Publication: New York, NY, USA, 2008. [Google Scholar]
- Shen, H.T. Research on river ice processes: Progress and missing links. J. Cold Reg. Eng. 2003, 12, 135–142. [Google Scholar] [CrossRef]
- Shen, H.T. River Ice Transport Theories: Post, Present, and Future. In Proceedings of the 15th IAHR Symposium on Ice, Gdansk, Poland, 28 August–1 September 2000. [Google Scholar]
- Tao, W.; Kailin, Y.; Yongxin, G. Application of artificial neural networks to forecasting ice conditions of the Yellow River in the Inner Mongolia Reach. J. Hydrol. Eng. 2008, 13, 811–816. [Google Scholar] [CrossRef]
- Malcolm, M. Breaking Ice with Explosives; Cold Regions Research &Engineering Laboratory: New York, NY, USA, 1982. [Google Scholar]
- United States Army Corps of Engineers. Ice Engineering: Engineering and Design; Department of the Army: Washington, DC, USA, 2002.
- He, B.S.; Ding, L.Q.; Yan, X.G. Research Report on Artificial Intervention in Kaihe River Prevention Measures and Program Development; China Water Resources and Hydropower Science Research Institute: Beijing, China, 2009. (In Chinese) [Google Scholar]
- Liang, X.Q.; He, B.S.; Xie, W.H. Explosive ice breaking and action effect test of the Yellow River ice. Eng. Blast. 2012, 2, 83–85. (In Chinese) [Google Scholar] [CrossRef]
- Liang, X.Q.; Xiong, F.; Lu, X.L. Experimental study on underwater shock wave characteristics of the Yellow River blasting ice. Blasting 2014, 4, 1–4. (In Chinese) [Google Scholar] [CrossRef]
- Tong, Z.; Yang, X.S.; Xue, P.X. Research on the mechanism of ice blasting in the Yellow River. In China Blasting Technology III; Metallurgical Industry Press: Beijing, China, 2012. (In Chinese) [Google Scholar]
- Duan, Y.S.; Wang, X.H.; Liu, S.B.; Li, Y.S. Discussion on ice blasting technology. J. Glaciol. Geocryol. 2003, 25, 220–226. (In Chinese) [Google Scholar] [CrossRef]
- Yin, H.T.; Yang, X.H.; Jiang, M.; Jin, J.L. Experimental study on blasting ice-breaking with extended charge pack in ice-cold water. Eng. Blast. 2010, 3, 12–15. (In Chinese) [Google Scholar] [CrossRef]
- Mair, H.U. Review: Hydrocodes for structural response to underwater explosions. Shock Vib. 1999, 6, 81–96. [Google Scholar] [CrossRef]
- Hu, H.P. Influence of Tunnel Blasting Vibration on Nearby Bridge and Safety Assessment. Master’s Thesis, Chongqing Jiaotong University, Chongqing, China, 2013. [Google Scholar]
- Yan, G.B.; Yu, Y.L. Numerical simulation of air and water medium decoupling charge blasting. Eng. Blast. 2009, 15, 13–19, 65. [Google Scholar] [CrossRef]
- Yang, X.M. Numerical Simulation of the Phenomenon of Explosion Shock; University of Science and Technology of China Press: Hefei, China, 2010. [Google Scholar]
- Wang, H. Numerical Simulation of Underwater Drilling Blasting. Master’s Thesis, North University of China, Taiyuan, China, 2014. [Google Scholar]
- Zhang, X.; Lu, M.W.; Wang, J.J. Research progress of arbitrary Lagrange-Eulerian description method. Chin. J. Comput. Mech. 1997, 1, 93–104. Available online: http://a.xueshu.baidu.com/usercenter/paper/show?paperid=185f3a1b64261c77a90f6af3e315eadf (accessed on 7 March 2022).
- Zhang, J.P.; Yu, Y.L. Field experiments and theoretical analysis on blasting craters of ice layers by near charge. Eng. Blast. 2006, 12, 5–9. [Google Scholar] [CrossRef]
- Zufelt, J.E.; Ettenma, R. Fully coupled model of ice-jam dynamics. J. Cold Reg. Eng. 2000, 14, 24–41. [Google Scholar] [CrossRef]
- Li, S.B.; Dong, Z.X.; Qi, Y.J.; Jiao, J.F. Numerical simulation for spread decay of blasting shock wave in different media. J. Vib. Shock. 2009, 28, 115–117. [Google Scholar] [CrossRef]
- Guo, Y.K.; Han, X.Y.; Meng, W.Y. Finite element analysis of the bridge pier safety under ice collisions. J. North China Univ. Water Res. Electr. Power 2013, 34, 16–18. [Google Scholar] [CrossRef]
- David, B. MSC/DYTRAN User’s Manual; MacNeal-Schwendler Corporation: New York, NY, USA, 1991. [Google Scholar]
- Gao, X.N.; Wu, Y.J. Numerical calculation and influence parameters for TNT explosion. Chin. J. Explos. Propellants 2015, 38, 32–39. [Google Scholar] [CrossRef]
Figure 1.
Location diagram of Heilongjiang Basin.

Figure 2.
Numerical model of ice blast.

Figure 3.
(a) Top ignition; (b) central ignition; (c) bottom ignition.


Figure 4.
(a) Top ignition; (b) central ignition; (c) bottom ignition.

Figure 5.
(a) Top ignition; (b) central ignition; (c) bottom ignition.

Figure 6.
(a) Blasting with 3.2 kg TNT; (b) blasting with 4.8 kg TNT; (c) blasting with 6.4 kg TNT; (d) blasting with 8.0 kg TNT.
Figure 6.
(a) Blasting with 3.2 kg TNT; (b) blasting with 4.8 kg TNT; (c) blasting with 6.4 kg TNT; (d) blasting with 8.0 kg TNT.

Figure 7.
(a) Blasting with 3.2 kg TNT; (b) blasting with 4.8 kg TNT; (c) blasting with 6.4 kg TNT; (d) blasting with 8.0 kg TNT.
Figure 7.
(a) Blasting with 3.2 kg TNT; (b) blasting with 4.8 kg TNT; (c) blasting with 6.4 kg TNT; (d) blasting with 8.0 kg TNT.

Figure 8.
(a) Blasting with 3.2 kg TNT; (b) blasting with 4.8 kg TNT; (c) blasting with 6.4 kg TNT; (d) blasting with 8.0 kg TNT.
Figure 8.
(a) Blasting with 3.2 kg TNT; (b) blasting with 4.8 kg TNT; (c) blasting with 6.4 kg TNT; (d) blasting with 8.0 kg TNT.

Figure 9.
(a) the upper end of the explosive is 30 cm from the ice layer; (b) the upper end of the explosive is 40 cm from the ice layer; (c) the upper end of the explosive is 50 cm from the ice layer; (d) the upper end of the explosive is 60 cm from the ice layer; (e)the upper end of the explosive is 70 cm from the ice layer; (f) the upper end of the explosive is 80 cm from the ice layer; (g) the upper end of the explosive is 90 cm from the ice layer; (h) the upper end of the explosive is 100 cm from the ice layer; (i) the upper end of the explosive is 110 cm from the ice layer; (j) the upper end of the explosive is 120 cm from the ice layer; (k) the upper end of the explosive is 130 cm from the ice layer; (l) the upper end of the explosive is 140 cm from the ice layer; (m) the upper end of the explosive is 150 cm from the ice layer; (n) the upper end of the explosive is 160 cm from the ice layer; (o) the upper end of the explosive is 170 cm from the ice layer.

Figure 10.
The relationship between ice distance, final volume, and final maximum pressure.

Figure 11.
Relationship between ice distance, final volume, and maximum kinetic energy.

Figure 12.
Relationship between ice distance, final volume, and average kinetic energy.


Table 1.
Mechanical property parameters of ice materials.
| Density/(g·cm−3) | Shear Modulus/GPa | Yield Stress/MPa | Plastic Hardening Modulus/GPa | Volume Modulus/GPa | Plastic Failure Strain | Truncation Pressure/MPa |
|---|---|---|---|---|---|---|
| 0.9 | 2.2 | 2.12 | 4.26 | 5.26 | 0.35 | −4 |
Table 2.
Material parameters of TNT.
| Density/(g·cm−3) | D/(m·s−1) | PCJ/GPa | A/GPa | B/GPa | R1 | R2 | ω | E0/(J/m−3) | V0 |
|---|---|---|---|---|---|---|---|---|---|
| 1.63 | 6930 | 21 | 373.8 | 3.747 | 4.15 | 0.90 | 0.35 | 7.0 × 10⁹ | 1 |
Table 3.
Parameters of water materials.
| Density/(g·cm−3) | C | α | γ0 | S1 | S2 | S3 | E0/(J/m−3) |
|---|---|---|---|---|---|---|---|
| 1.02 | 0.165 | 0 | 0.35 | 1.92 | −0.096 | 0 | 0 |
Note: C is the intercept of the shear-compression wave velocity curve, γ0 is a constant, α is the volume correction amount, and S1, S2, and S3 are constants. The air modeling was set to use a (MAT_NULL) material model, with the material parameters shown in Table 4.
Table 4.
Air material parameters.
| Density/(g·cm−3) | C0 | C1 | C2 | C3 | C4 | C5 | C6 | E0/(J/m−3) | V0 |
|---|---|---|---|---|---|---|---|---|---|
| 0.00125 | 0 | 0 | 0 | 0 | 0.4 | 0.4 | 0 | 2.5 × 10⁵ | 1 |
Table 5.
Relationship between ignition position and ice blasting volume, final maximum pressure, and instantaneous kinetic energy.
Table 5.
Relationship between ignition position and ice blasting volume, final maximum pressure, and instantaneous kinetic energy.
| Ignition Mode | Final Volume VEnd (cm3) | Maximum Pressure Pexplosion (GPa) | Maximum Instantaneous Kinetic Energy (J/m−3) | Maximum Blast Radius (cm) |
|---|---|---|---|---|
| Top ignition | 1.22 × 10⁷ | 4.25708 × 10⁻⁵ | 2.14 × 10⁷ | 341.5 |
| Center ignition | 1.10 × 10⁷ | 6.89966 × 10⁻⁵ | 3.16 × 10⁷ | 390.4 |
| Bottom end ignition | 1.13 × 10⁷ | 5.07765 × 10⁻⁵ | 2.87 × 10⁷ | 363.8 |
Table 6.
Relationship between ice thickness and ice blasting volume, maximum pressure at the end, instantaneous kinetic energy, and average kinetic energy.
Table 6.
Relationship between ice thickness and ice blasting volume, maximum pressure at the end, instantaneous kinetic energy, and average kinetic energy.
| Explosive Mass (kg) | Volume Burst Rate (%) | Volume Burst Rate for Every 1.6 kg Increase (%) | Maximum Pressure Pburst (GPa) | Maximum Kinetic Energy (J/m−3) | Average Kinetic Energy (J/m−3) |
|---|---|---|---|---|---|
| 1.6 | 69.44 | 6.89966 × 10⁻⁵ | 3.16 × 10⁷ | 6.372 × 10⁶ | |
| 3.2 | 75.31 | 5.87 | 6.16525 × 10⁻⁵ | 3.48 × 10⁷ | 9.586 × 10⁶ |
| 4.8 | 78.25 | 2.94 | 7.77053 × 10⁻⁵ | 3.79 × 10⁷ | 1.311 × 10⁷ |
| 6.4 | 79.06 | 0.81 | 4.02354 × 10⁻⁵ | 2.41 × 10⁷ | 1.320 × 10⁷ |
| 9.0 | 83.31 | 4.25 | 6.62249 × 10⁻⁵ | 3.71 × 10⁷ | 2.132 × 10⁷ |
Table 7.
Relationship between explosive ice distance and ice blasting volume, maximum pressure at the end, instantaneous kinetic energy, and average kinetic energy.
Table 7.
Relationship between explosive ice distance and ice blasting volume, maximum pressure at the end, instantaneous kinetic energy, and average kinetic energy.
| Distance from Ice (cm) | Volume at the End V0 (cm3) | Maximum Pressure P Explosion (GPa) | Maximum Kinetic Energy (J/m−3) | Average Kinetic Energy (J/m−3) |
|---|---|---|---|---|
| 20 | 1.10 × 10⁷ | 6.89966 × 10⁻⁵ | 3.16 × 10⁷ | 6.372 × 10⁶ |
| 30 | 8.84 × 10⁶ | 6.48349 × 10⁻⁵ | 4.84 × 10⁷ | 8.786 × 10⁶ |
| 40 | 7.96 × 10⁶ | 4.64357 × 10⁻⁵ | 5.55 × 10⁷ | 9.816 × 10⁶ |
| 50 | 7.56 × 10⁶ | 1.37037 × 10⁻⁴ | 5.00 × 10⁷ | 1.080 × 10⁷ |
| 60 | 7.13 × 10⁶ | 3.87005 × 10⁻⁵ | 3.71 × 10⁷ | 1.107 × 10⁷ |
| 70 | 6.76 × 10⁶ | 4.12181 × 10⁻⁵ | 3.33 × 10⁷ | 1.145 × 10⁷ |
| 80 | 6.11 × 10⁶ | 5.45746 × 10⁻⁵ | 4.19 × 10⁷ | 1.302 × 10⁷ |
| 90 | 5.56 × 10⁶ | 6.85551 × 10⁻⁵ | 5.64 × 10⁷ | 1.489 × 10⁷ |
| 100 | 5.23 × 10⁶ | 7.15330 × 10⁻⁵ | 6.77 × 10⁷ | 1.661 × 10⁷ |
| 110 | 5.00 × 10⁶ | 6.24793 × 10⁻⁵ | 7.63 × 10⁷ | 1.787 × 10⁷ |
| 120 | 4.91 × 10⁶ | 5.82885 × 10⁻⁵ | 8.05 × 10⁷ | 1.959 × 10⁷ |
| 130 | 4.62 × 10⁶ | 5.95254 × 10⁻⁵ | 8.19 × 10⁷ | 2.084 × 10⁷ |
| 140 | 4.67 × 10⁶ | 6.85479 × 10⁻⁵ | 8.34 × 10⁷ | 2.139 × 10⁷ |
| 150 | 4.63 × 10⁶ | 5.87875 × 10⁻⁵ | 8.52 × 10⁷ | 2.229 × 10⁷ |
| 160 | 4.58 × 10⁶ | 6.88285 × 10⁻⁵ | 8.53 × 10⁷ | 2.207 × 10⁷ |
| 170 | 4.87 × 10⁶ | 7.06496 × 10⁻⁵ | 8.00 × 10⁷ | 2.126 × 10⁷ |
Publisher’s Note: MDPI stays neutral with regard to jurisdictional claims in published maps and institutional affiliations. |
© 2022 by the authors. Licensee MDPI, Basel, Switzerland. This article is an open access article distributed under the terms and conditions of the Creative Commons Attribution (CC BY) license (https://creativecommons.org/licenses/by/4.0/).
Share and Cite
MDPI and ACS Style
Liu, D.; Dai, C.; Yu, C.; Ma, Y. Numerical Simulation and Experimental Study on Single Point Blasting of Ice Jam of Heilongjiang River Based on ANSYS/LSDYNA. Water 2022, 14, 2808. https://doi.org/10.3390/w14182808
AMA Style
Liu D, Dai C, Yu C, Ma Y. Numerical Simulation and Experimental Study on Single Point Blasting of Ice Jam of Heilongjiang River Based on ANSYS/LSDYNA. Water. 2022; 14(18):2808. https://doi.org/10.3390/w14182808
Chicago/Turabian StyleLiu, Dong, Changlei Dai, Chenggang Yu, and Yaodong Ma. 2022. "Numerical Simulation and Experimental Study on Single Point Blasting of Ice Jam of Heilongjiang River Based on ANSYS/LSDYNA" Water 14, no. 18: 2808. https://doi.org/10.3390/w14182808
Note that from the first issue of 2016, this journal uses article numbers instead of page numbers. See further details here.