
The Effect and Influence Mechanism of Soil Salinity on Phosphorus Availability in Coastal Salt-Affected Soils

State Key Laboratory of Soil and Sustainable Agriculture, Institute of Soil Science, Chinese Academy of Sciences, Nanjing 210008, China
*
Author to whom correspondence should be addressed.
Water 2022, 14(18), 2804; https://doi.org/10.3390/w14182804
Submission received: 29 July 2022
/
Revised: 3 September 2022
/
Accepted: 6 September 2022
/
Published: 9 September 2022
(This article belongs to the Special Issue Monitoring, Reclamation and Management of Salt-Affected Lands)
Abstract
:Soil salinization is a problem that arouses the world’s attention. Soil salinity is an important limitation for agriculture production in coastal area. Phosphorus is a very important nutrient element in the process of plant growth, and its effectiveness affects plant growth to a great extent. In this study, soil available phosphorus and its component in Hedley phosphorus classification were found to be affected by soil salinity in coastal areas of Jiangsu Province. Several key environmental factors changed under the saline environment of the coastal areas, such as soil salinity, soil pH, and soil alkaline phosphatase activity. These environmental factors were significantly correlated with soil available phosphorus. Results showed that there were significant correlations between soil salinity and other environmental factors, and soil salinity and alkaline phosphatase activity were the main influencing factors of soil available phosphorus in this study. Significant positive correlation was found between alkaline phosphatase activity and soil salt content, and soil salinity was considered as the most important impact factor for soil available phosphorus as it affected the surrounding environment, and the soil alkaline phosphatase could be considered as the direct influencing factor for soil available phosphorus. Analysis between the soil alkaline phosphatase activity and phosphorus component showed that soil alkaline phosphatase activity could increase the proportion of active inorganic phosphorus and medium active inorganic phosphorus in soil phosphorus pool, which explained the effect of soil alkaline phosphatase activity on soil available phosphorus.
1. Introduction
Soil salinization has become a worldwide resource and environmental problem [1,2,3], which seriously affects the stability of the agricultural ecosystem and the development of agricultural economy [4]. About 9.30 × 10⁸ ha of land is currently threatened by soil salinization [5,6]. About 9.9 × 10⁷ hectares of land in China are under the threat of soil salinization [7], and the coastal region is one of the regions with a wide distribution of salinized soil in China [8].
In saline soil, due to the influence of soil salinity or alkalinity, the phosphorus applied to the soil existed in the form of insoluble phosphate with low availability [9,10]. The increase of electrical conductivity not only affected soil physical and chemical properties such as soil structure, bulk density, and permeability [11], but also reduced the activities of soil microbial biomass and alkaline phosphatase [12,13], affected the transformation of phosphorus in soil and hinders the absorption of phosphorus by crops, resulting in the reduction of chemical and biological availability of phosphorus. Phosphorus deficiency and saline alkali were two major ecological problems limiting crop production. The adsorption of phosphorus on the soil surface was strengthened due to the existence of salt, and this adsorption was enhanced with the increase of soil pH. Therefore, under saline conditions, due to factors such as high pH, high conductivity, and low soil organic matter, the availability of phosphorus was reduced, aggravating the degree of phosphorus deficiency in plants [14,15]. Plants mainly absorb HPO42− or H2PO4−, while PO43− was not easy to be absorbed. Due to the existence of high pH, the available phosphorus will be quickly changed into invalid phosphorus through adsorption fixation, precipitation, or microbial absorption.
Obstacle factors of soil saline and alkali of coastal saline soil in Northern Jiangsu seriously restricted crop growth. The existence of a large amount of Na+ and Cl− in the soil had a toxic effect on plants, inhibiting the growth of crop roots and their absorption of nutrients such as Ca2+, K+, N, and P. At least, the growth was limited and the yield was reduced. Seriously, it would affect the emergence of seedlings and result in no harvest [16] In addition, obstacle factors of soil saline and alkali also had a direct impact on the soil’s physical and chemical properties and reduced soil nutrient availability. The results of the second national soil survey showed that the content of available phosphorus in coastal saline farmland in Northern Jiangsu was very low, and the average content of the whole region was 4.91 mg/kg, and nearly 70% of the soil was generally lacking in phosphorus. In recent years, with the large-scale application of chemical phosphorus fertilizer, the total amount of phosphorus in farmland soil increased [17]. However, due to the characteristics of coastal saline soil, a large amount of phosphorus was fixed in the soil, which was difficult to migrate to the crop rhizosphere, resulting in the phosphorus utilization rate of only 10–25% in that season [18]. A large number of studies pointed out that the increase of soil conductivity led to the destruction of soil structure, resulting in soil compaction and expansion, poor ventilation and water permeability, and easy hardening of topsoil [11]. In addition, the existence of high soil salinity and pH would also affect the structure and activity of the soil microbial community, reduce the activities of soil microbial biomass and alkaline phosphatase [12], seriously restrict the availability of soil nutrients, especially phosphorus, hinder the absorption of phosphorus by crops, and reduce the utilization rate of phosphorus. Therefore, at present, it seemed that soil salinization and low nutrient availability were important problems in the agricultural production process of coastal farmland in Northern Jiangsu [19].
Our study focused on the influence of salinity soil on phosphorus availability, the possible impact factors of soil available phosphorus in coastal area, and the possible influence mechanism of possible factors on phosphorus availability and provide possible measures for improving the availability of phosphorus.
2. Material and Methods
2.1. Soil Properties
Soil samples were collected from newly reclaimed coastal area of Tiaozini in Dongtai county, Jiangsu Province (120°54′8.04″ E, 32°38′42.01″ N). This farmland is located nearly 1 km from the Yellow Sea. The soils which represented the characteristics of three different salt contents were collected and showed in Table 1.
2.2. Soil Properties Analysis Method
(1) Available phosphorus: Soil total P was determined using the molybdenum blue colorimetric method [21]. After extraction by 0.5 mol/L NaHCO3, soil available P was measured using the same method as total P [22].
(2) Soil Electrical conductivity and pH: Soil pH and EC were analyzed in a 1:5 soil-water extract using probes provided by Mettler-Toledo Ltd.
(3) Soil salt ion composition: Soluble Na+ and K+ were estimated with a flame photometry. Concentrations of Ca2+, Mg2+, SO42−, Cl−, HCO3−, and CO32− were analyzed by titration.
(4) Alkaline phosphatase activity: Alkaline phosphatase was determined by P-Nitrobenzene phosphate method.
(5) Soil Hedley phosphorus classification
The forms of phosphorus in soil determined the phosphorus supply capacity of soil to the crops. Phosphorus classification proposed by Hedley was applied in our research, as this method took into account both soil inorganic phosphorus and organic phosphorus, which is more reasonable and widely recognized abroad.
Soil phosphorus classification: using Hedley phosphorus classification method modified by Tissen and Moir (1993), soil was extracted by deionized water, 0.5 mol/L NaHCO3 (pH 8.5), 0.1 mol/L NaOH, and 1 mol/L HCl in turn. The contents of inorganic phosphorus (Pi) in the above extracts (H2O-Pi, NaHCO3-Pi, NaOH-Pi, and HCl-Pi) were determined by molybdenum antimony anti-colorimetric method, and then the NaHCO3 and NaOH extracts were digested with sulfuric acid–ammonium persulfate. After the determination of total phosphorus (Pt) content, the organophosphorus (Po) content (the difference between Pt and Po) (H2O-Po, NaHCO3-Po, and NaOH-Po) was calculated. Finally, the residual phosphorus content (R-P) was determined by H2SO4-HClO4 digestion-molybdenum-antimony anti-colorimetric method.
2.3. Data Processing and Analysis
The experimental data were statistically analyzed using Microsoft Excel 2010. The data were analyzed using a single-factor analysis of variance (ANOVA) and the correlation analysis was processed using SPSS Version 16.0. Diagrams were created using Excel 2010, the Origin8.0 software, R software and tools on hiplot website.
3. Result and Discussion
3.1. Available Phosphorus (AP) in Coastal Saline Soil with Different Salt Content
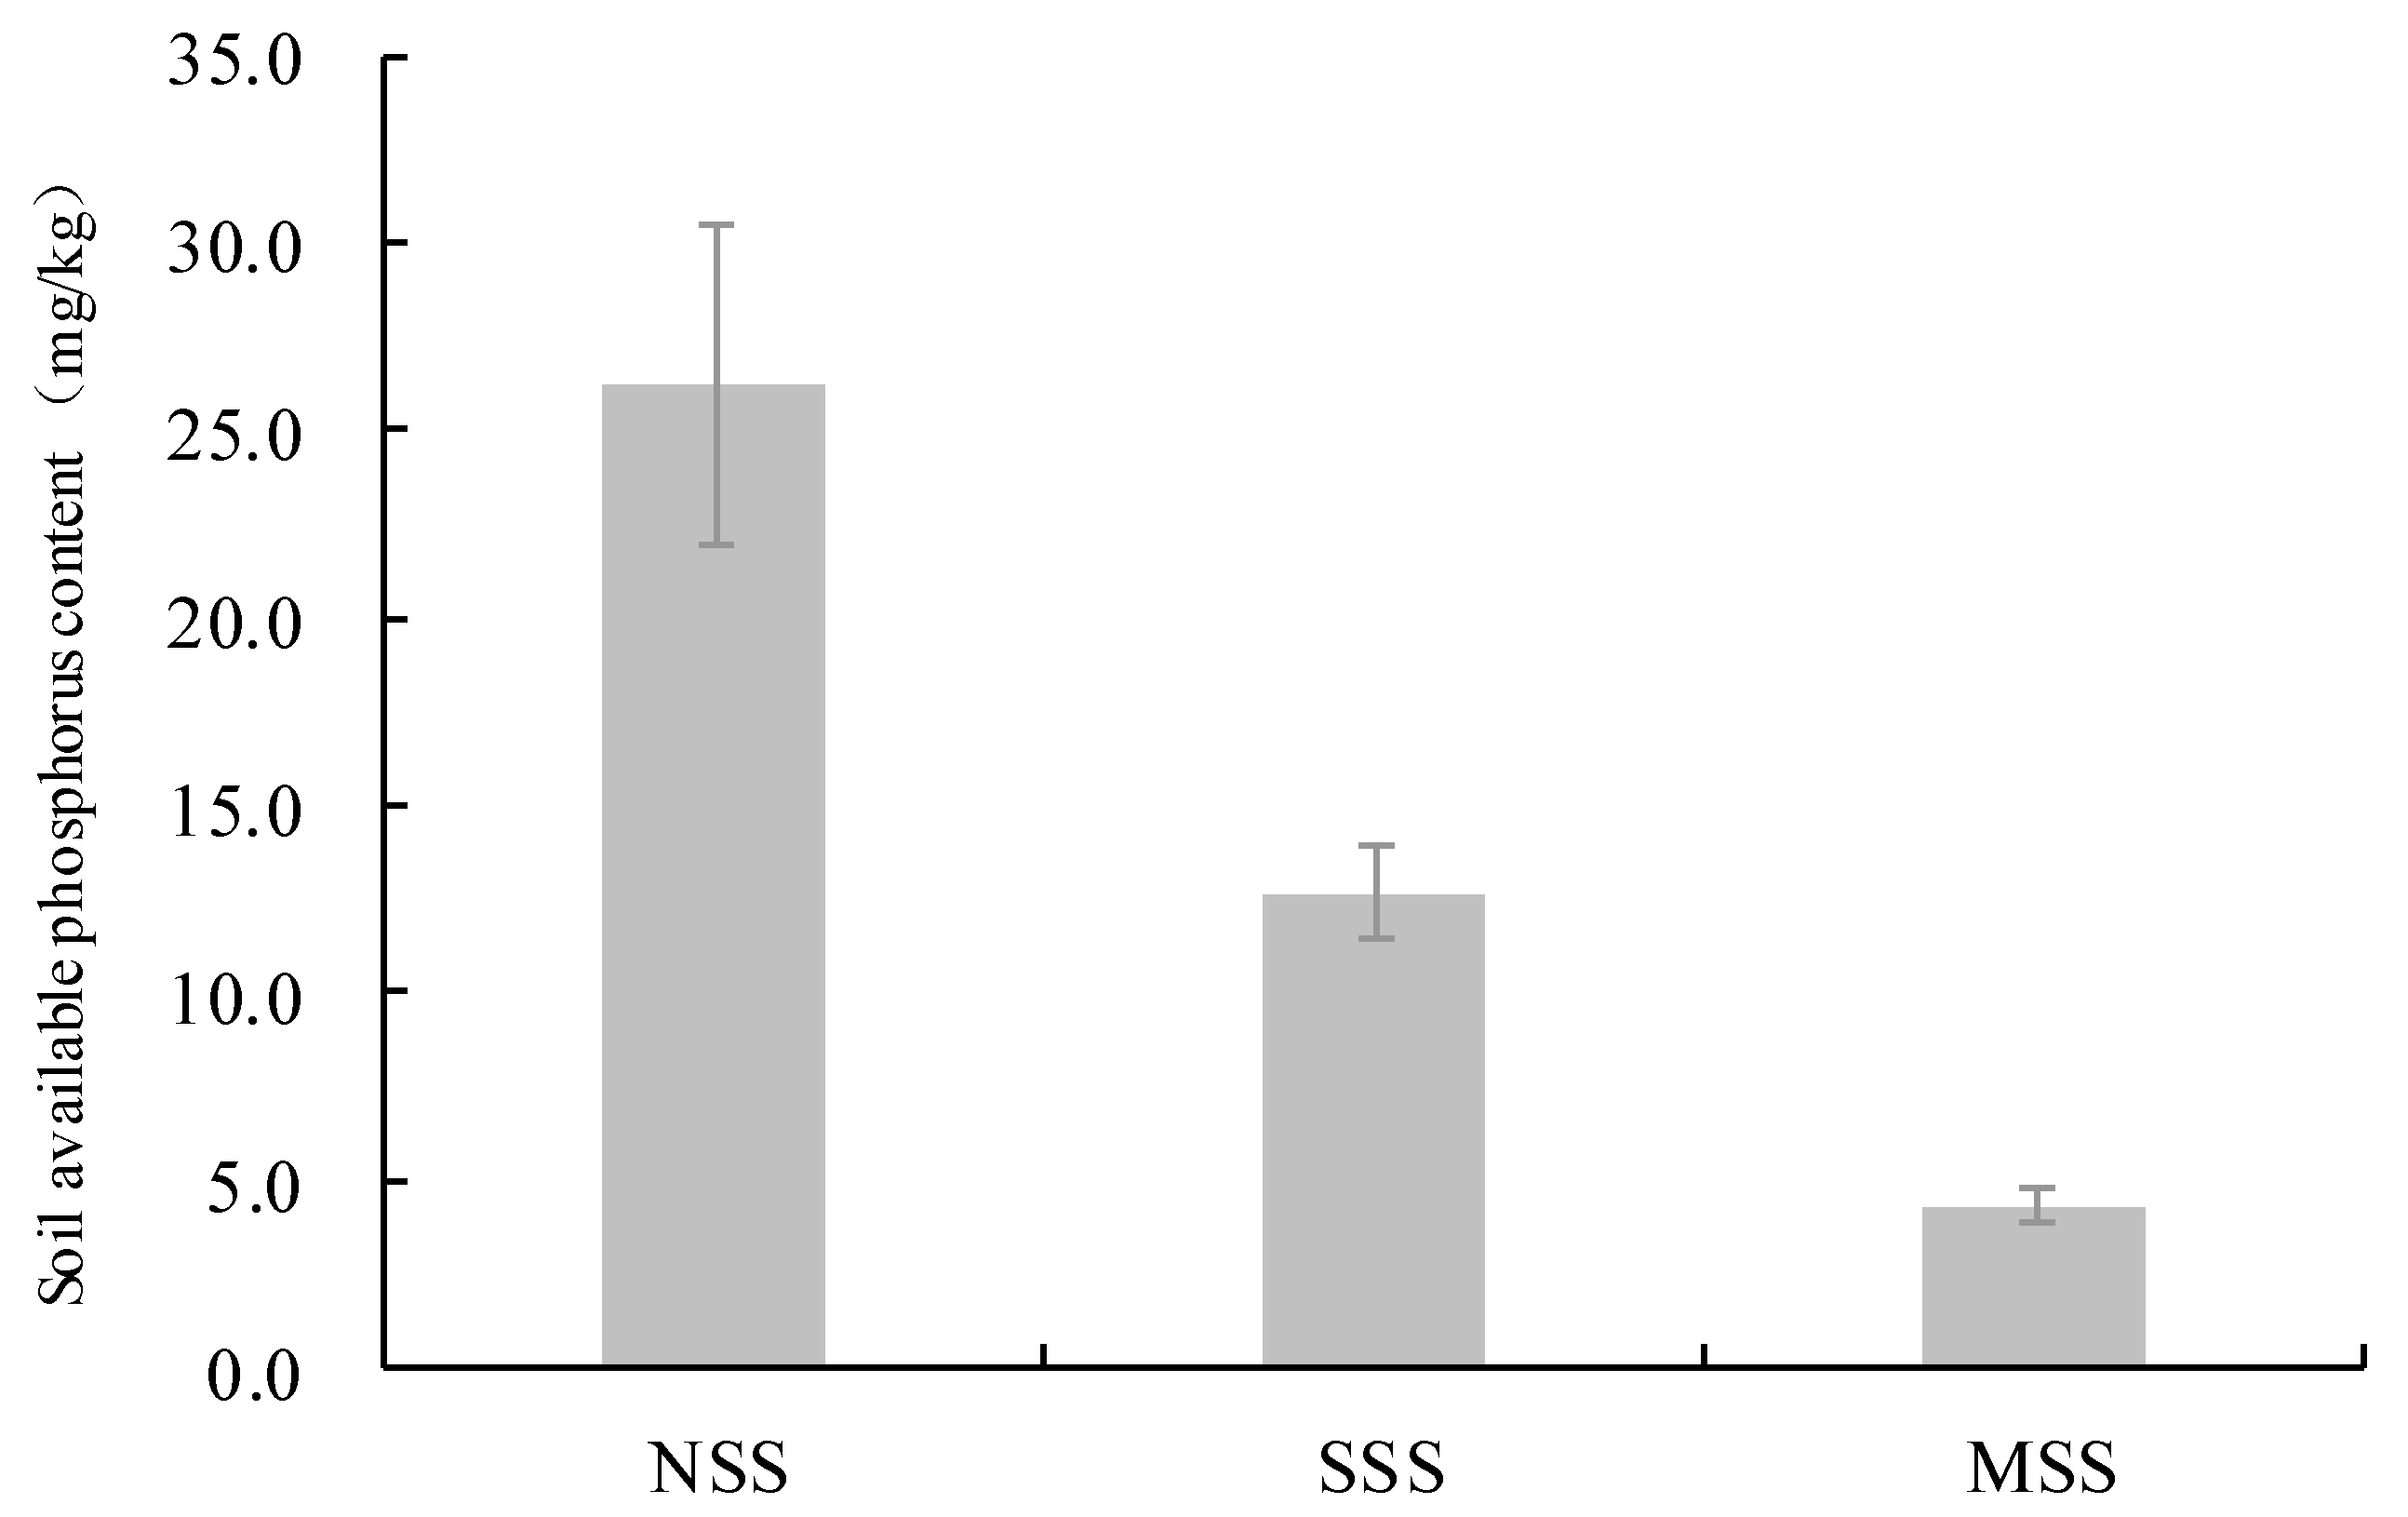
We chose three salt gradients of soils, and they were named the soils NSS (non-salinized soil), SSS (slightly salinized soil), MSS (moderately salinized soil), with the salt content of 0.51 g kg−1, 1.55 g kg−1, and 2.53 g kg−1, respectively. It was obvious that there were significant differences in salt content among different soils, and there were also significant differences in available phosphorus in corresponding soils. Results showed that the available phosphorus of non-salinized soil was significantly higher than that of salinized soil, and the phosphorus availability of MSS was the lowest among the three (Figure 1). Assumption could be made that the available phosphorus decreased significantly as soil salinity increased, and we could infer that soil phosphorus availability maybe inhibited by soil salinization. Meanwhile, a negative correlation between salt content and available phosphorus was found. The result was similar to some relevant research. Relevant research showed that soil salinization indicators observed had a positive correlation with soil nutrients [23]. Salinization generally decreased fluxes of soluble reactive phosphorus from both sediments and soils [24].
3.2. Characteristics of Various Forms of Phosphorus in Hedley Phosphorus Classification in Coastal Saline Soil with Different Salt Content
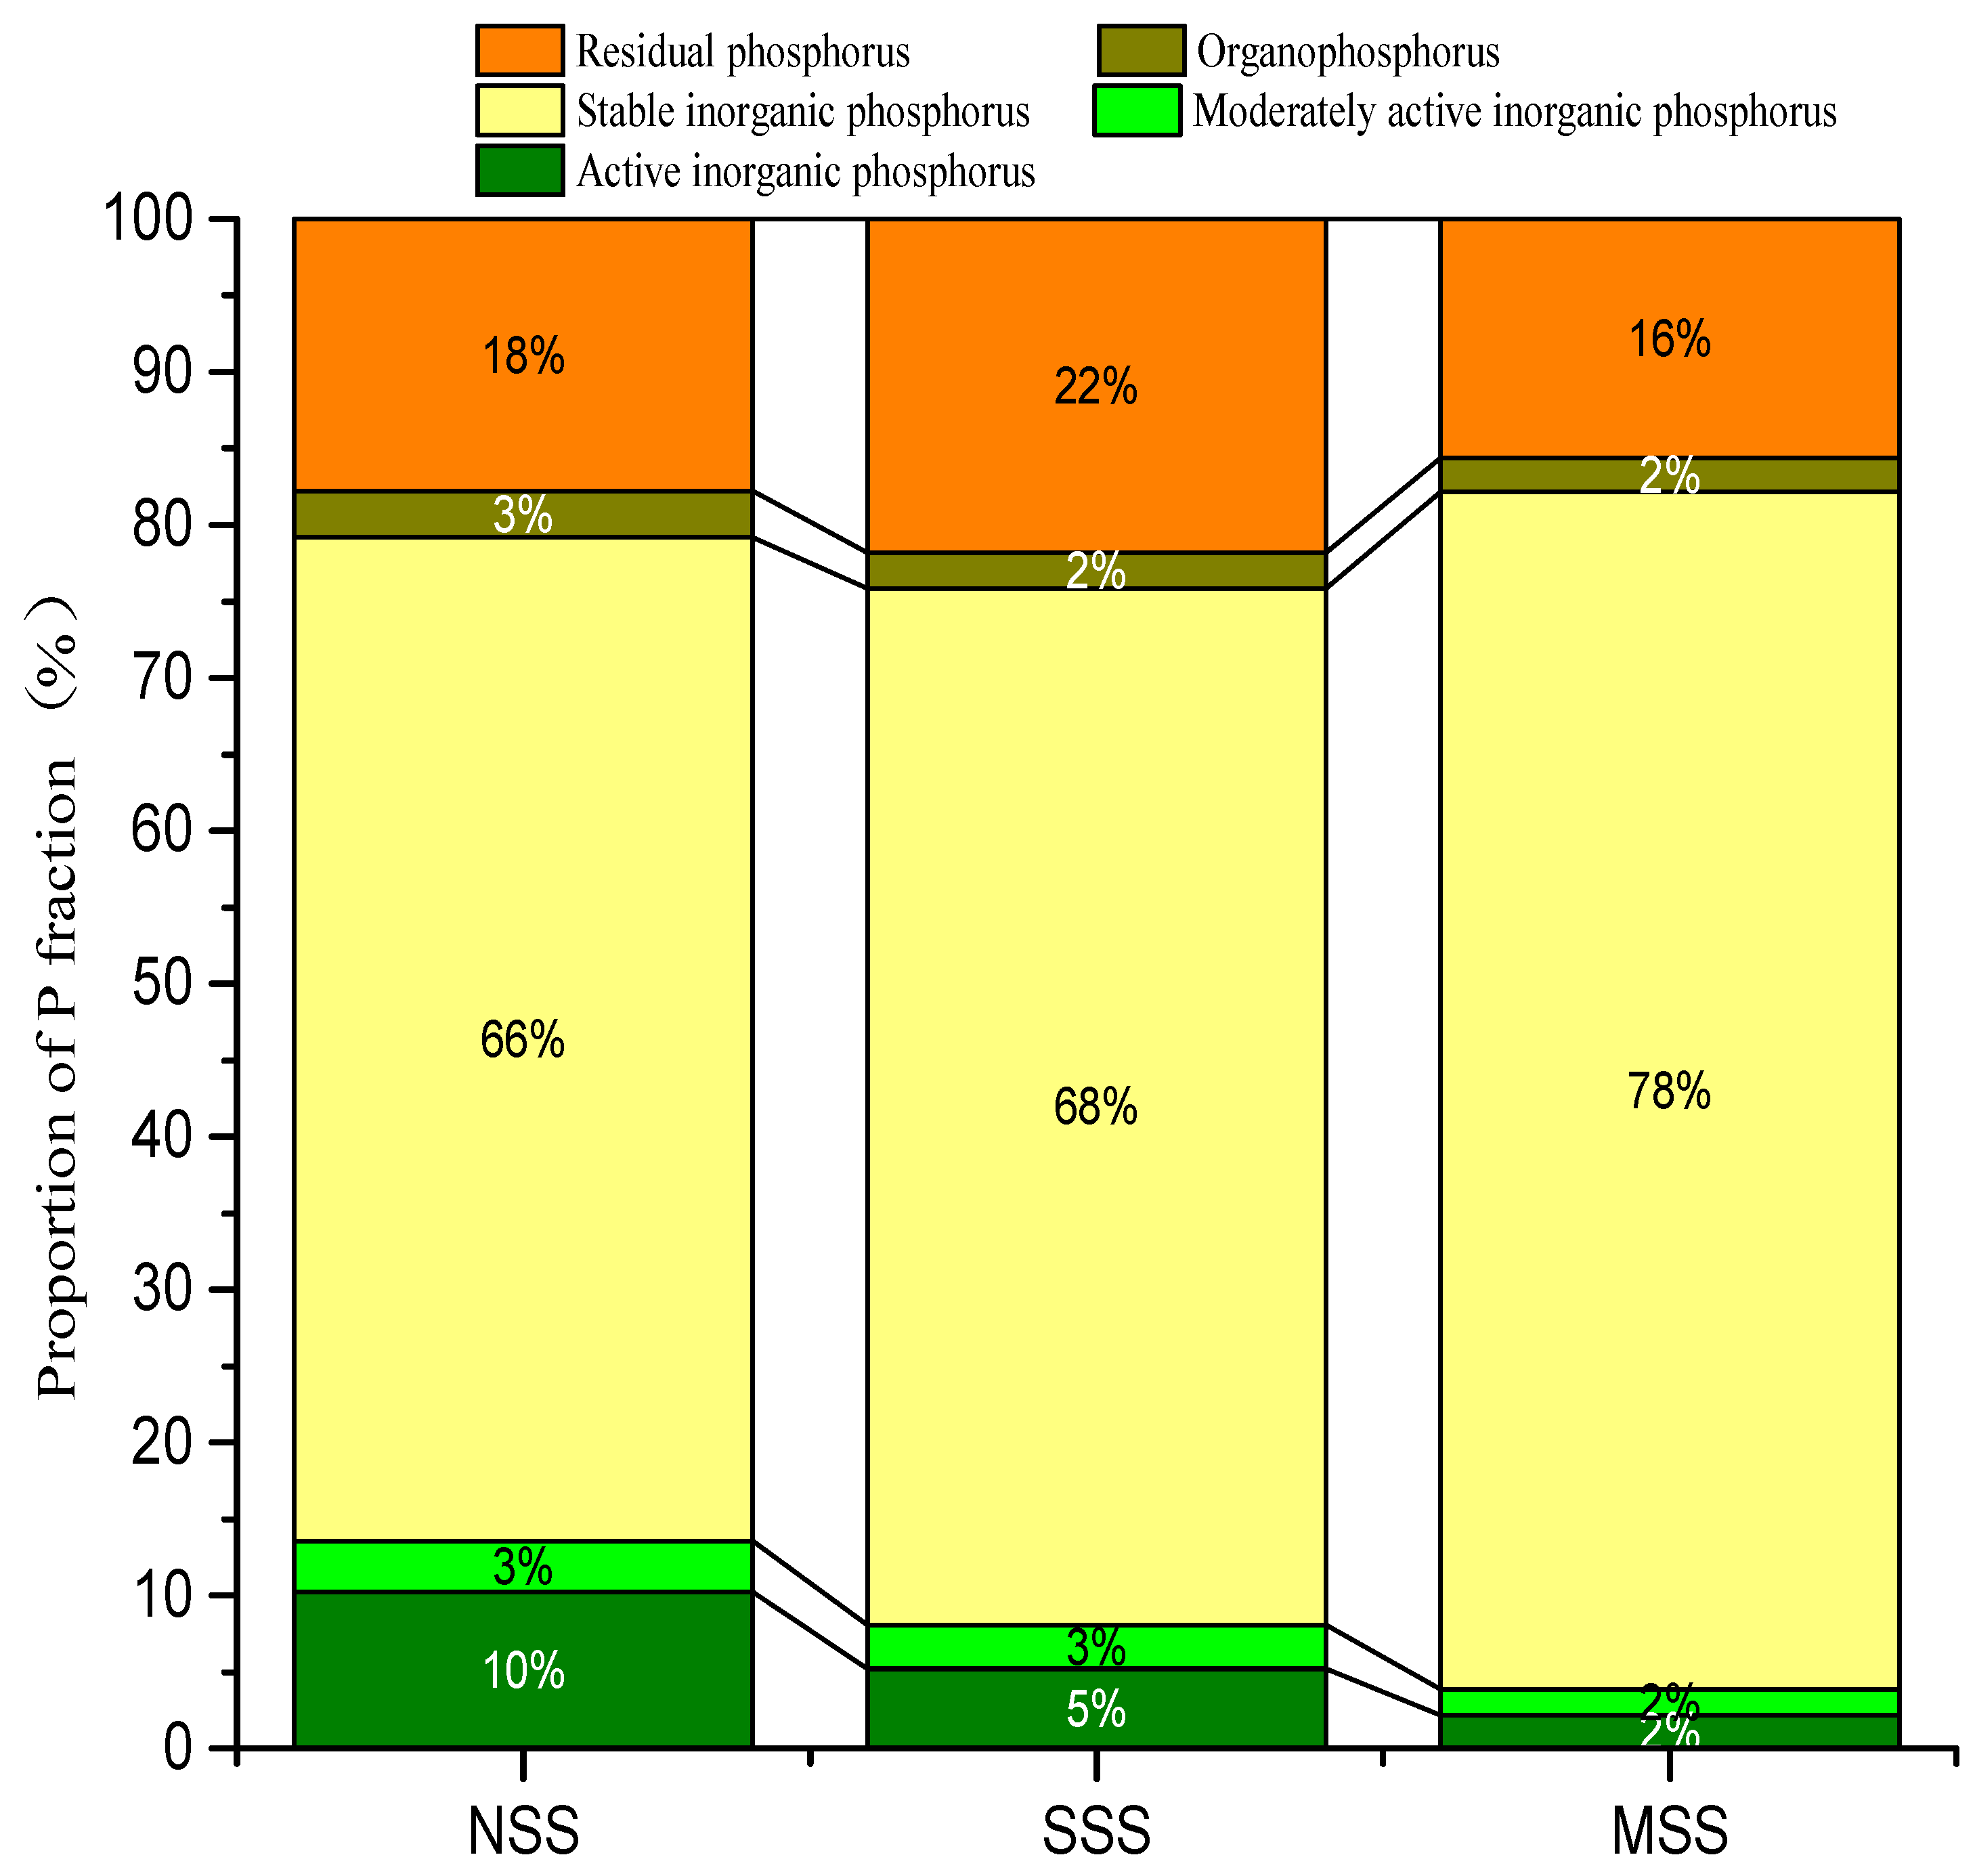
The occurrence form of phosphorus in soil determines the supply capacity of soil to crop phosphorus. It can be seen from Table 2 that, phosphorus in the phosphorus pool of coastal saline soil mainly existed in the form of HCl-Pi, accounting for about 65~78% of the extractable phosphorus content. Compared with non-saline soil, the proportion of soil H2O-Pi and NaHCO3-Pi reduced as the salt content increased, which represented active inorganic phosphorus decreased. Additionally, the proportion of NaHCO3-Po, NaOH-Po, and NaOH-Pi was the lowest on moderately saline soil. In Hedley’s phosphorus classification method, H2O-Pi and NaHCO3-Pi are the main forms of phosphorus absorbed and utilized by plants and are the main components of soil active phosphorus pool. NaOH-Pi can be used as a potential phosphorus source to slowly mineralize and supplement available phosphorus in soil owing to its low availability to plants, and it belonged to moderately active inorganic phosphorus [25]. NaHCO3-Po is mainly kind of soluble organic phosphorus, which can supplement available phosphorus to soil solution. However, NaOH-Po is mainly the organic phosphorus combined with humic acid in soil [26]. HCl-Pi is difficult to be transformed into available phosphorus and used by plants, so it is considered as stable phosphorus [27].
In conclusion, with the increase of soil salinity, the proportion of soil active inorganic phosphorus decreased and the proportion of stable inorganic phosphorus increased (Figure 2), which was consistent with the regulation of available phosphorus affected by soil salinity described in 3.1.
3.3. Possible Influencing Factors of Soil Available Phosphorus in Different Salinization Degrees
3.3.1. Relationship between Available Phosphorus and Different Phosphorus Forms in Hedley Phosphorus Classification
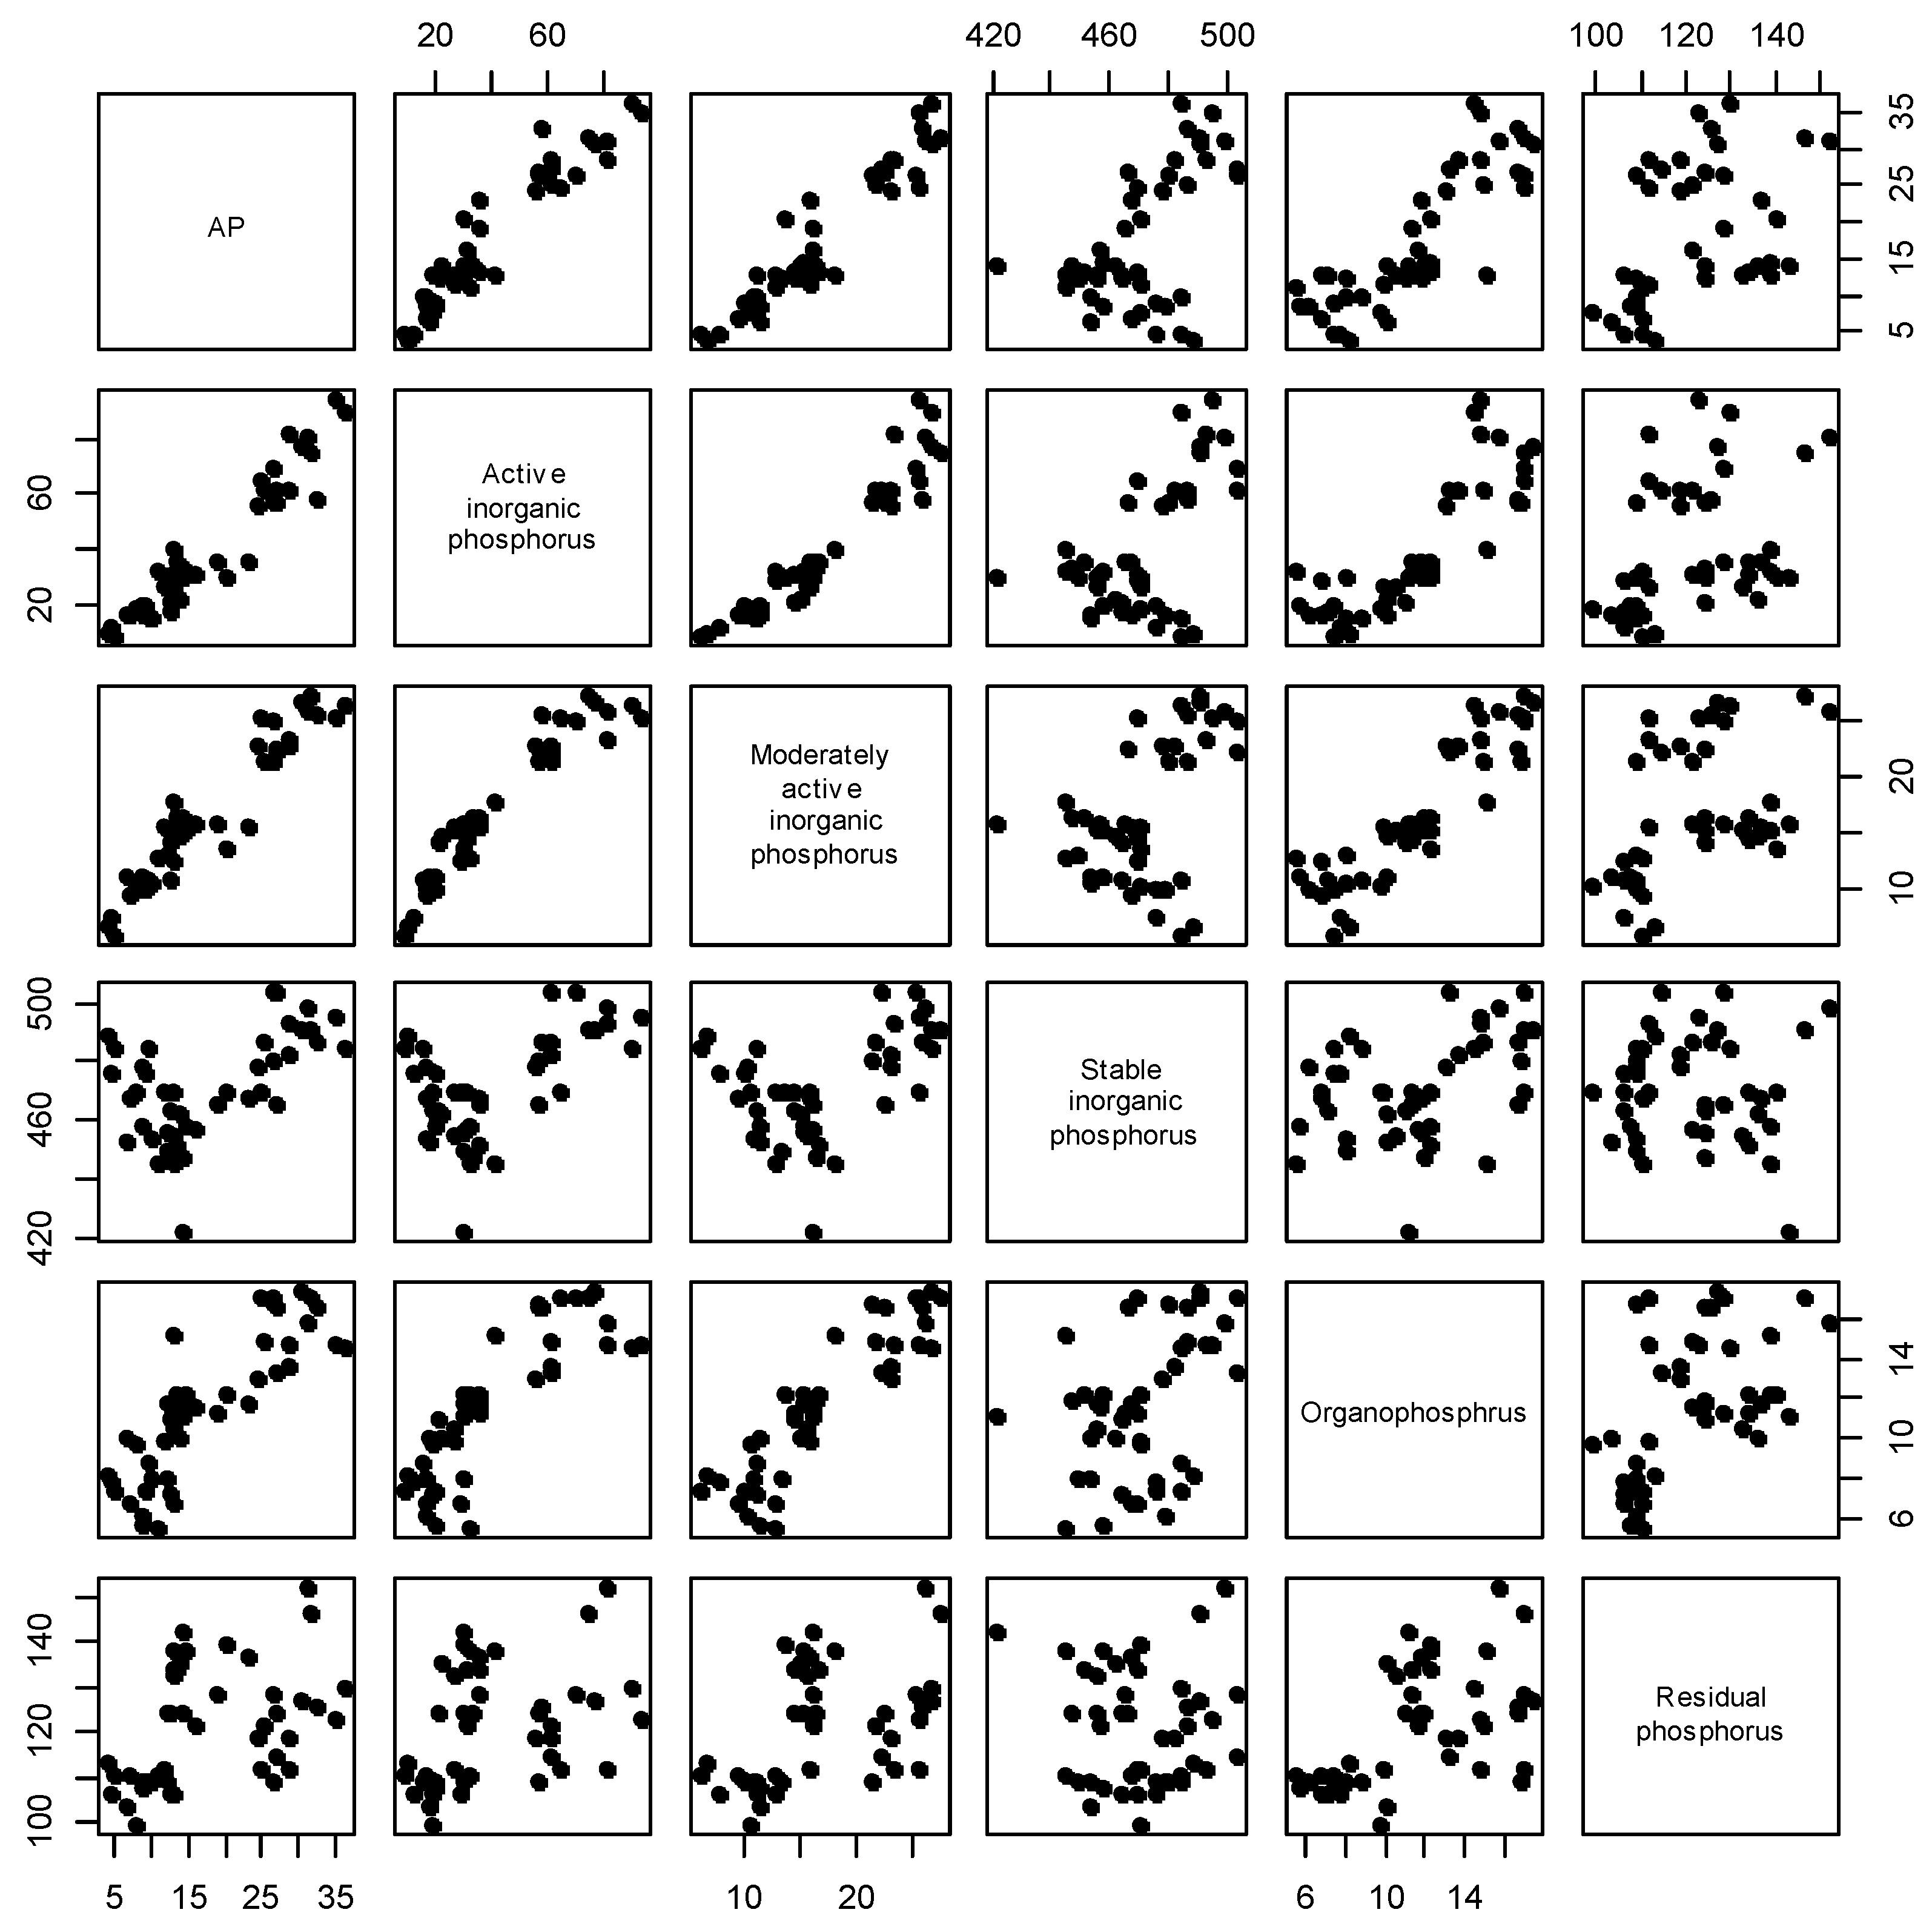
Correlations between soil available phosphorus content and various forms of phosphorus were analyzed (Table 3). The results showed that the content of available phosphorus was positively correlated with H2O-Pi, NaHCO3-Pi, NaOH-Pi, and NaOH-Po (p < 0.01), and the order of the correlation was NaHCO3-Pi > NaOH-Pi > H2O-Pi > NaOH-Po. Correlation analysis was performed between available phosphorus and similar P forms (Figure 3). Results showed that the correlation between available phosphorus and active inorganic phosphorus and moderately active inorganic phosphorus reached was 0.951 (p < 0.001) and 0.949 (p < 0.001). This illustrated that active inorganic phosphorus (H2O-Pi and NaHCO3-Pi) and moderately active inorganic phosphorus (NaOH-Pi) were effective and direct phosphorus sources in saline soil. There were significant correlations between the content of available phosphorus and NaHCO3-Po, NaOH-Po, and the correlation coefficient between available phosphorus and organophosphorus (NaHCO3-Po and NaOH-Po) reached 0.841 (p < 0.001). And NaOH-Po in organophosphorus could be transformed to available phosphorus to some extent. However, the correlation coefficients between the content of available phosphorus and HCl-Pi reached 0.534 (p < 0.001), and the correlation coefficients between the content of available phosphorus and R-P was 0.442 (p < 0.05), which meant that the contribution of the two forms to the available phosphorus was small.
We classified the components with large contribution together and found that active inorganic phosphorus and moderately active inorganic phosphorus had the greatest contribution to available phosphorus in phosphorus classification. While organophosphrus had a certain impact on available phosphorus, which may be related to the fact that organophosphrus could provide available phosphorus through the transformation process.
3.3.2. Soil Salinity
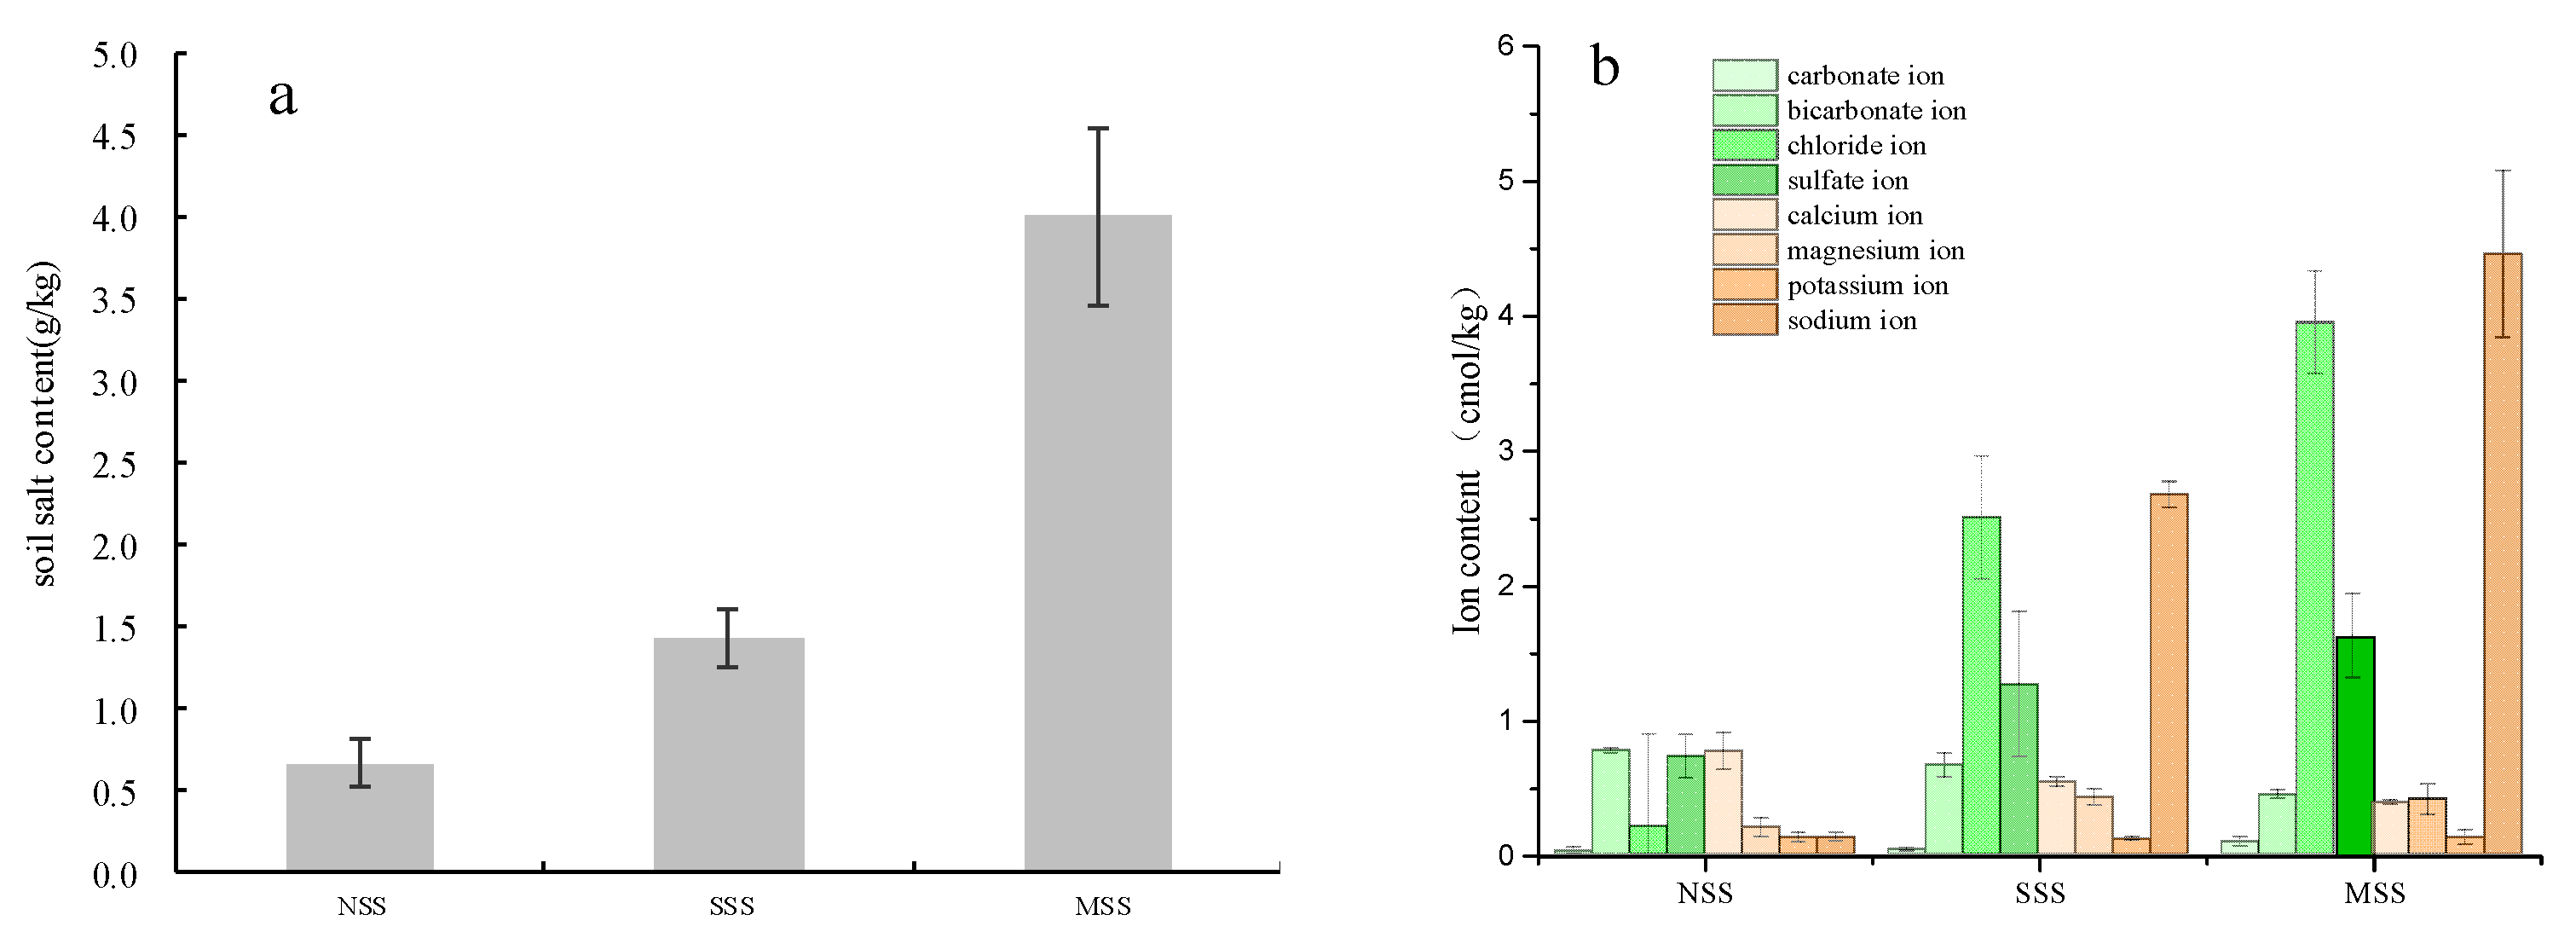
We analyzed the soil ion composition, and result showed that the slightly salinized and moderately salinized soils were mainly dominated by chloride ions and sodium ions (Figure 4). The contents of sodium and chloride ions in non-salinized soil, mild salinized soil and medium and severe salinized soil showed significant differences. The contents of chloride and sodium ions in moderate salinized soil were the highest, followed by those in slight salinized soil, and the contents of sodium and chloride ions in non-salinized soil were lowest among the three soils. A large amount of chloride ion has ion antagonism with dihydrogen phosphate ion in soil solution and inhibits the absorption of phosphate ions by crops [28]
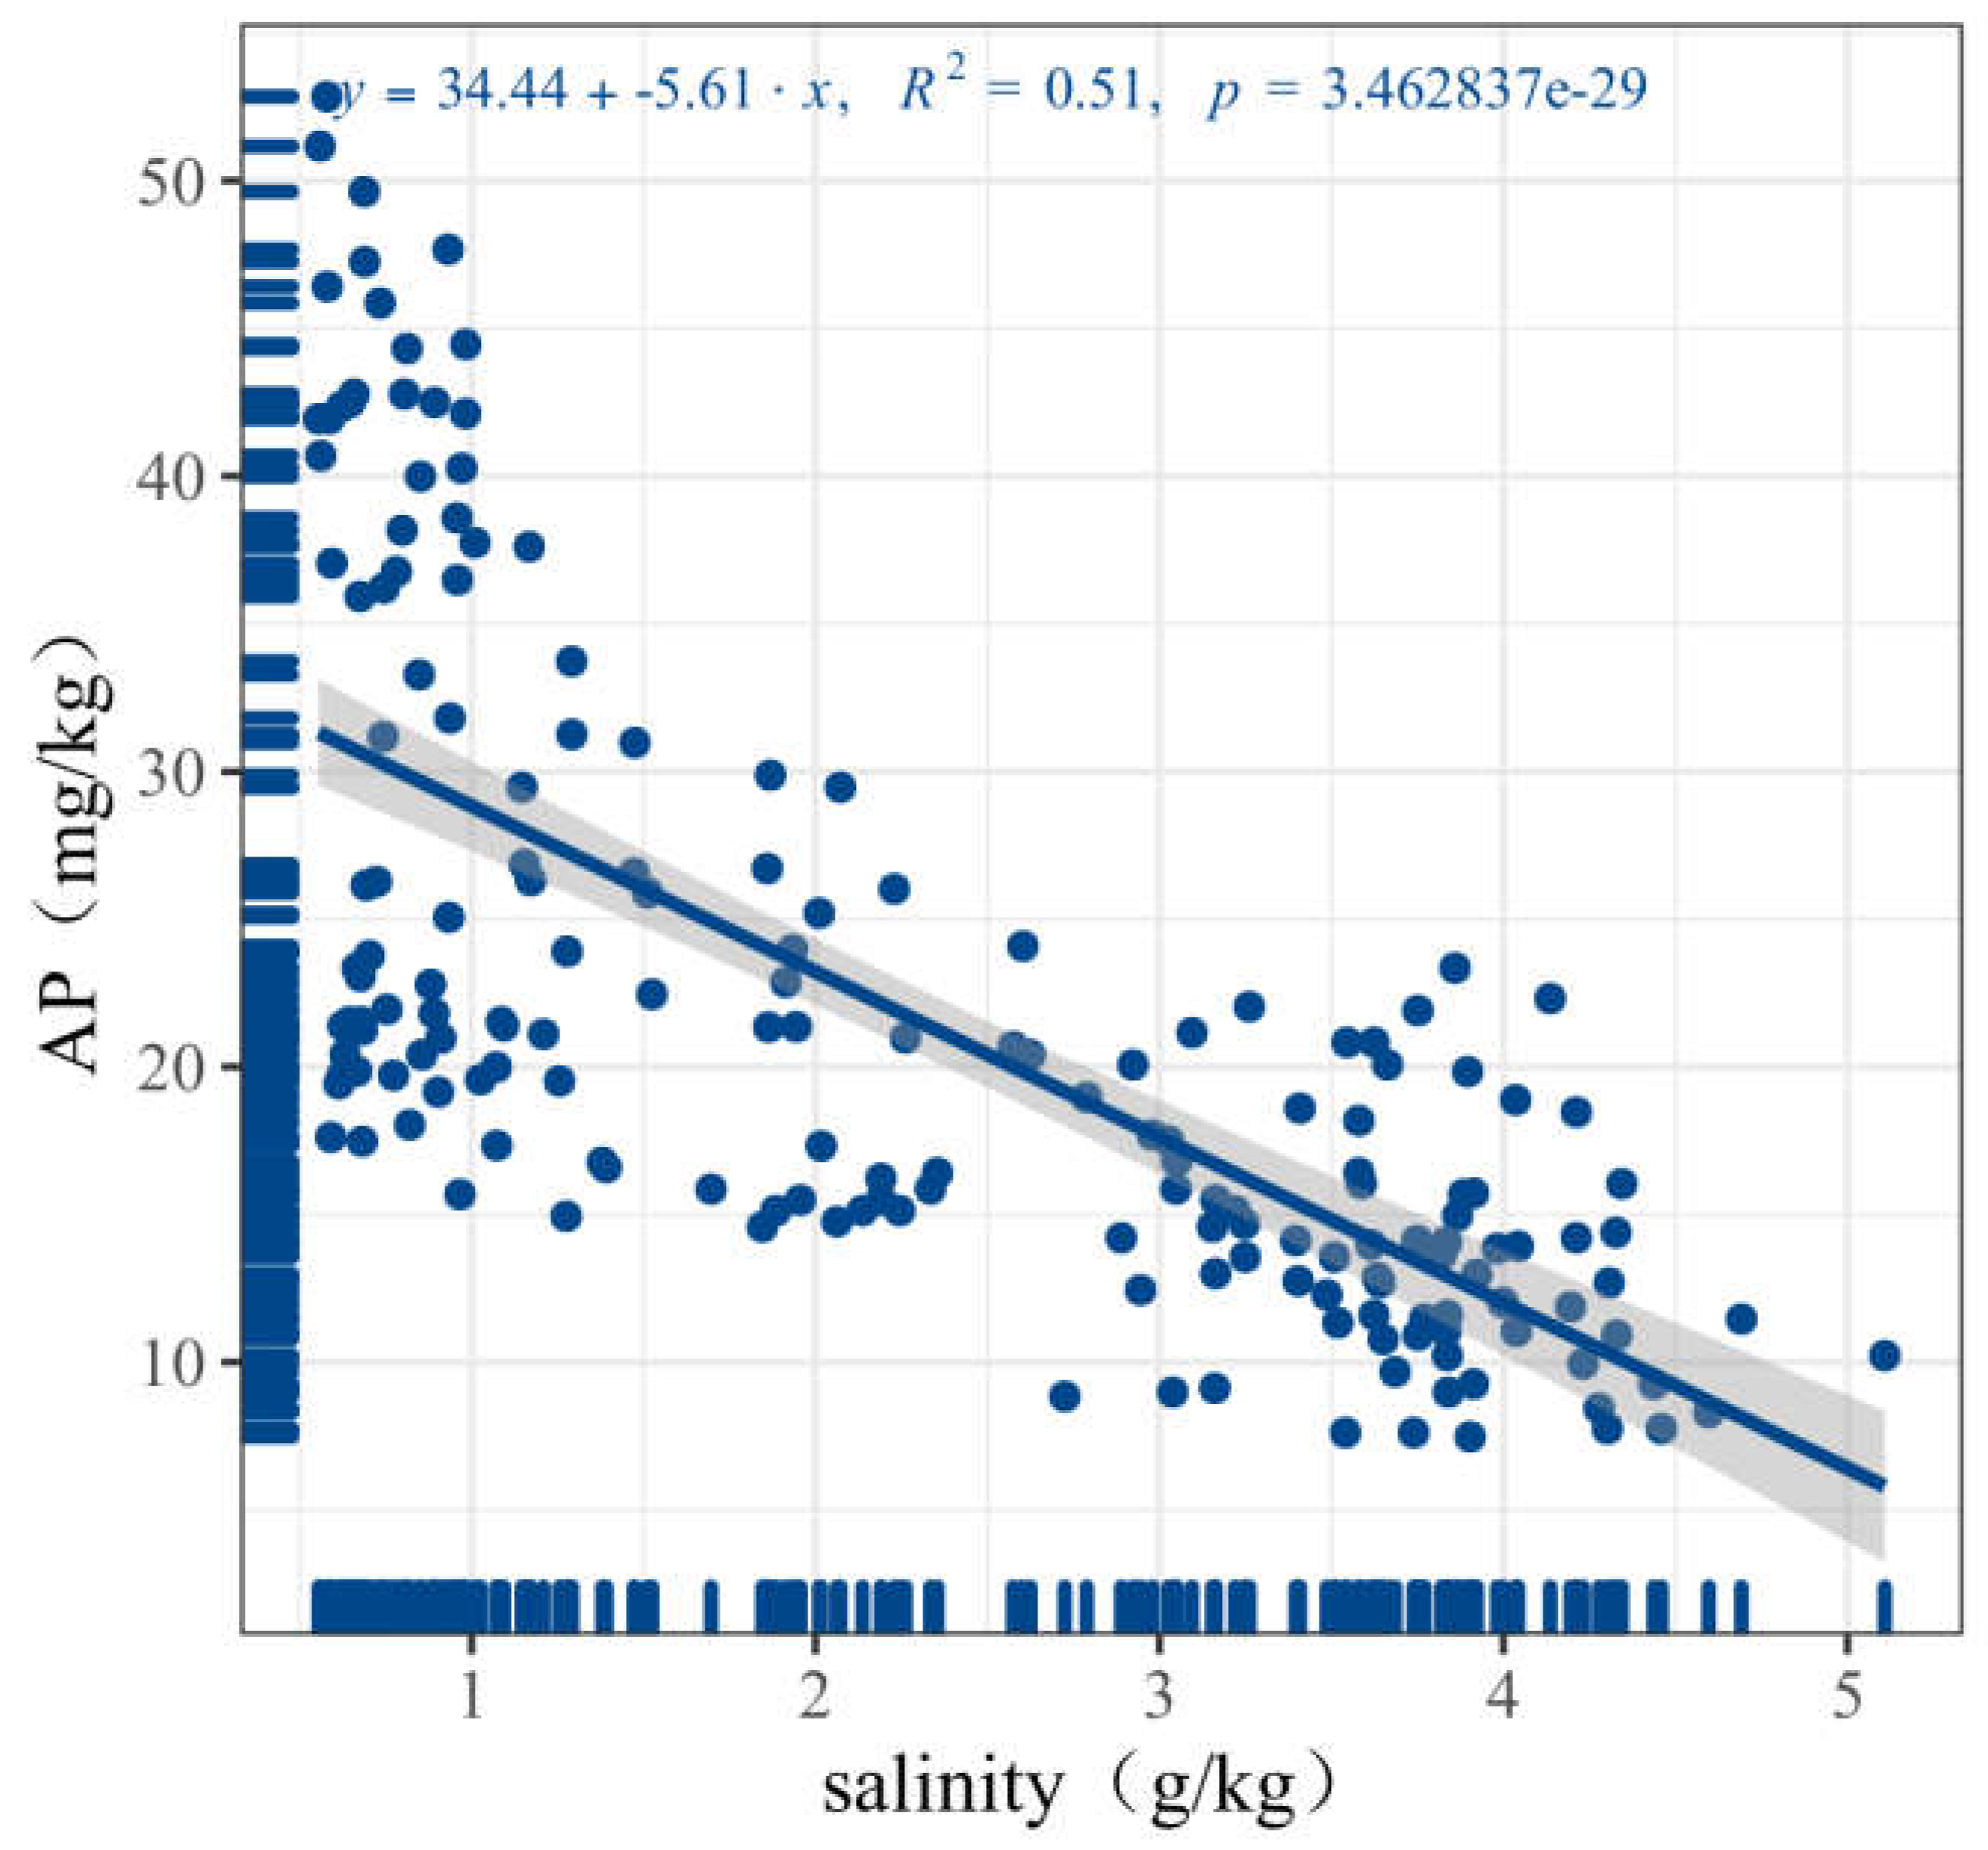
Correlation between soil salt content and available phosphorus was analyzed using soil survey data of different salt gradients (Figure 5). Result showed that there was significant negative correlation (R = 0.714, p < 0.001) between soil salt content and available phosphorus. Available phosphorus showed a downward trend with the increase of soil salt, so it could be inferred that salt was a very important environmental factor affecting available phosphorus. The mechanism of reducing the bioavailability of phosphorus under saline alkali barrier maybe mainly due to two reasons [29]: Crop ion toxicity and nutrient deficiency caused by salt. Under the influence of soil parent material and soil forming process, the salt ion composition of coastal saline soil is mainly sodium chloride. On the one hand, sodium ion in saline soil can directly poison plants. On the other hand, under salt stress, salt ions in soil can compete and inhibit mineral nutrition, resulting in imbalance of nutrient ion absorption by plants. Salinization unexpectedly led to a dose dependent decreased availability of phosphorus in the sediment, both in the short and in the long term [30].
3.3.3. Soil pH Value
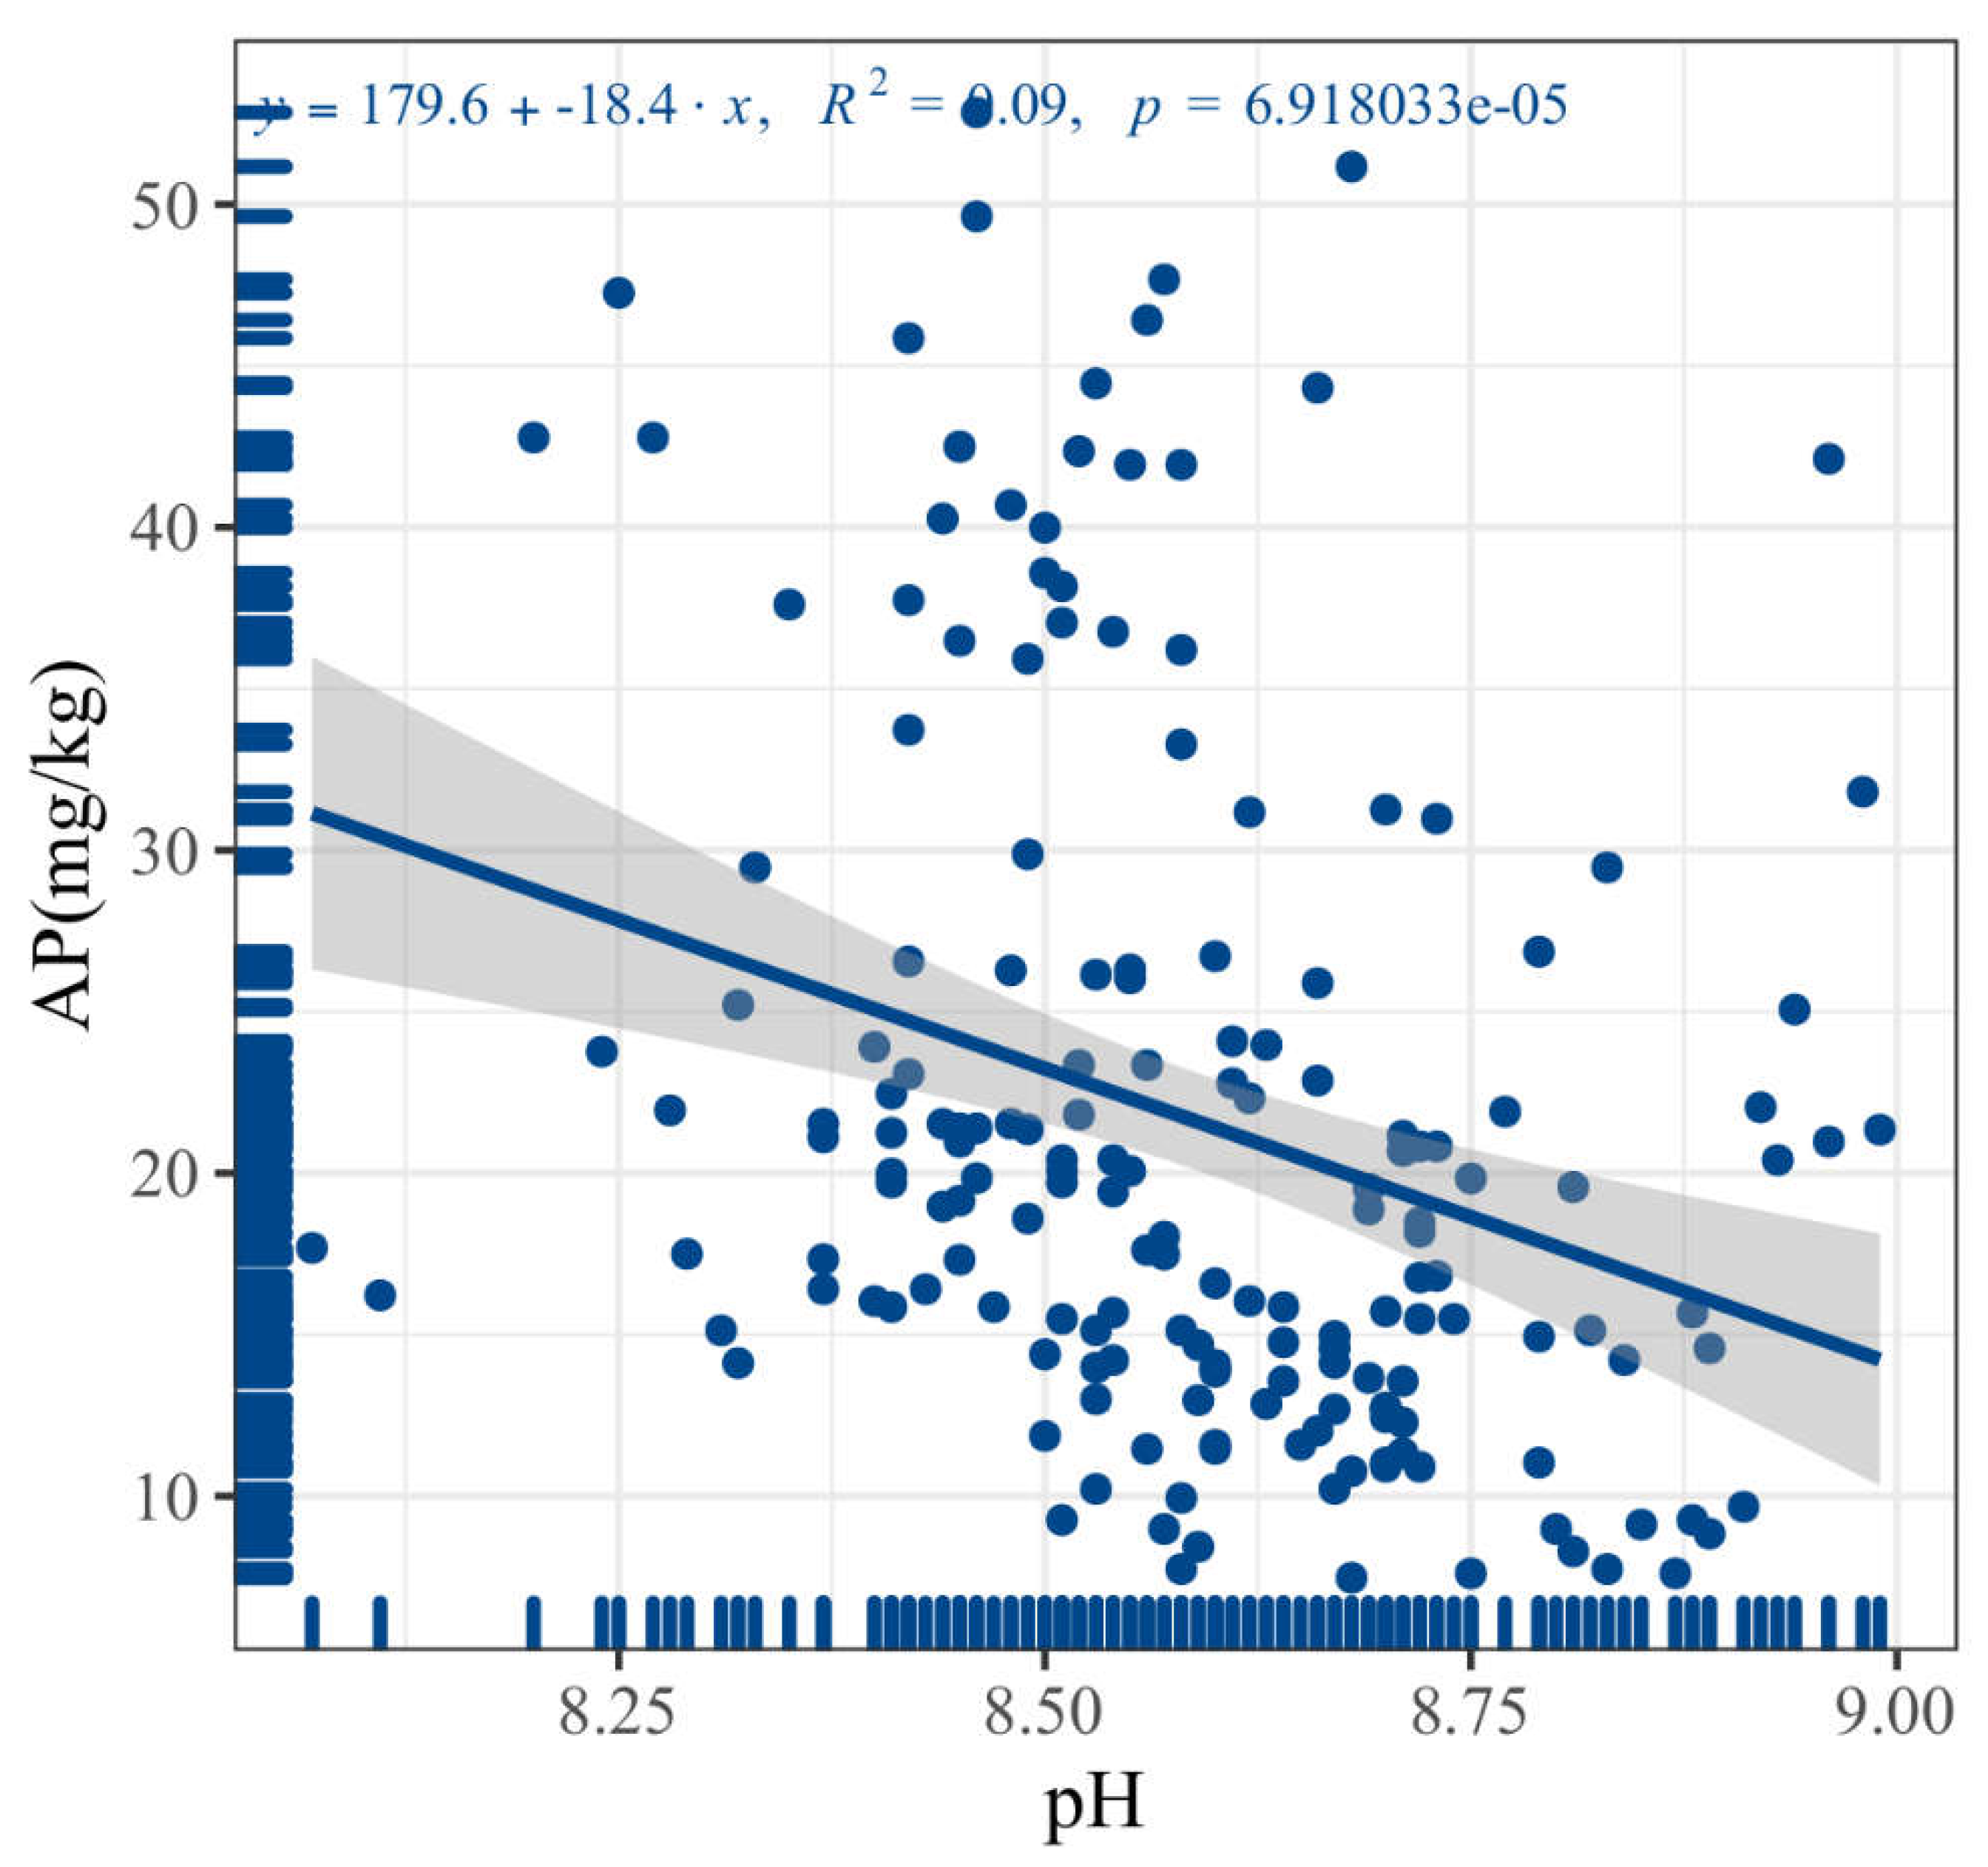
In saline soil, the available phosphorus decreased as the soil pH increased. In our study, the correlation between pH and soil available phosphorus was analyzed (Figure 6), and the result showed that there was significant negative correlation between them (R = 0.3, p < 0.001). Generally speaking, availability of soil phosphorus was closely related to soil pH value. As it was saline soil, soil pH was always above 8. Due to the influence of high pH value of saline soil, more than 75% of phosphorus fertilizer was combined with calcium in the soil to form a series of phosphates with low solubility, resulting in the reduction of phosphorus availability and phosphorus fertilizer utilization [31]. Soil pH is an important factor that affects the occurrence and transformation of phosphorus forms in soil and affects many processes such as chemical fixation and precipitation dissolution of phosphorus in soil [32].
3.3.4. Soil Alkaline Phosphatase Activity
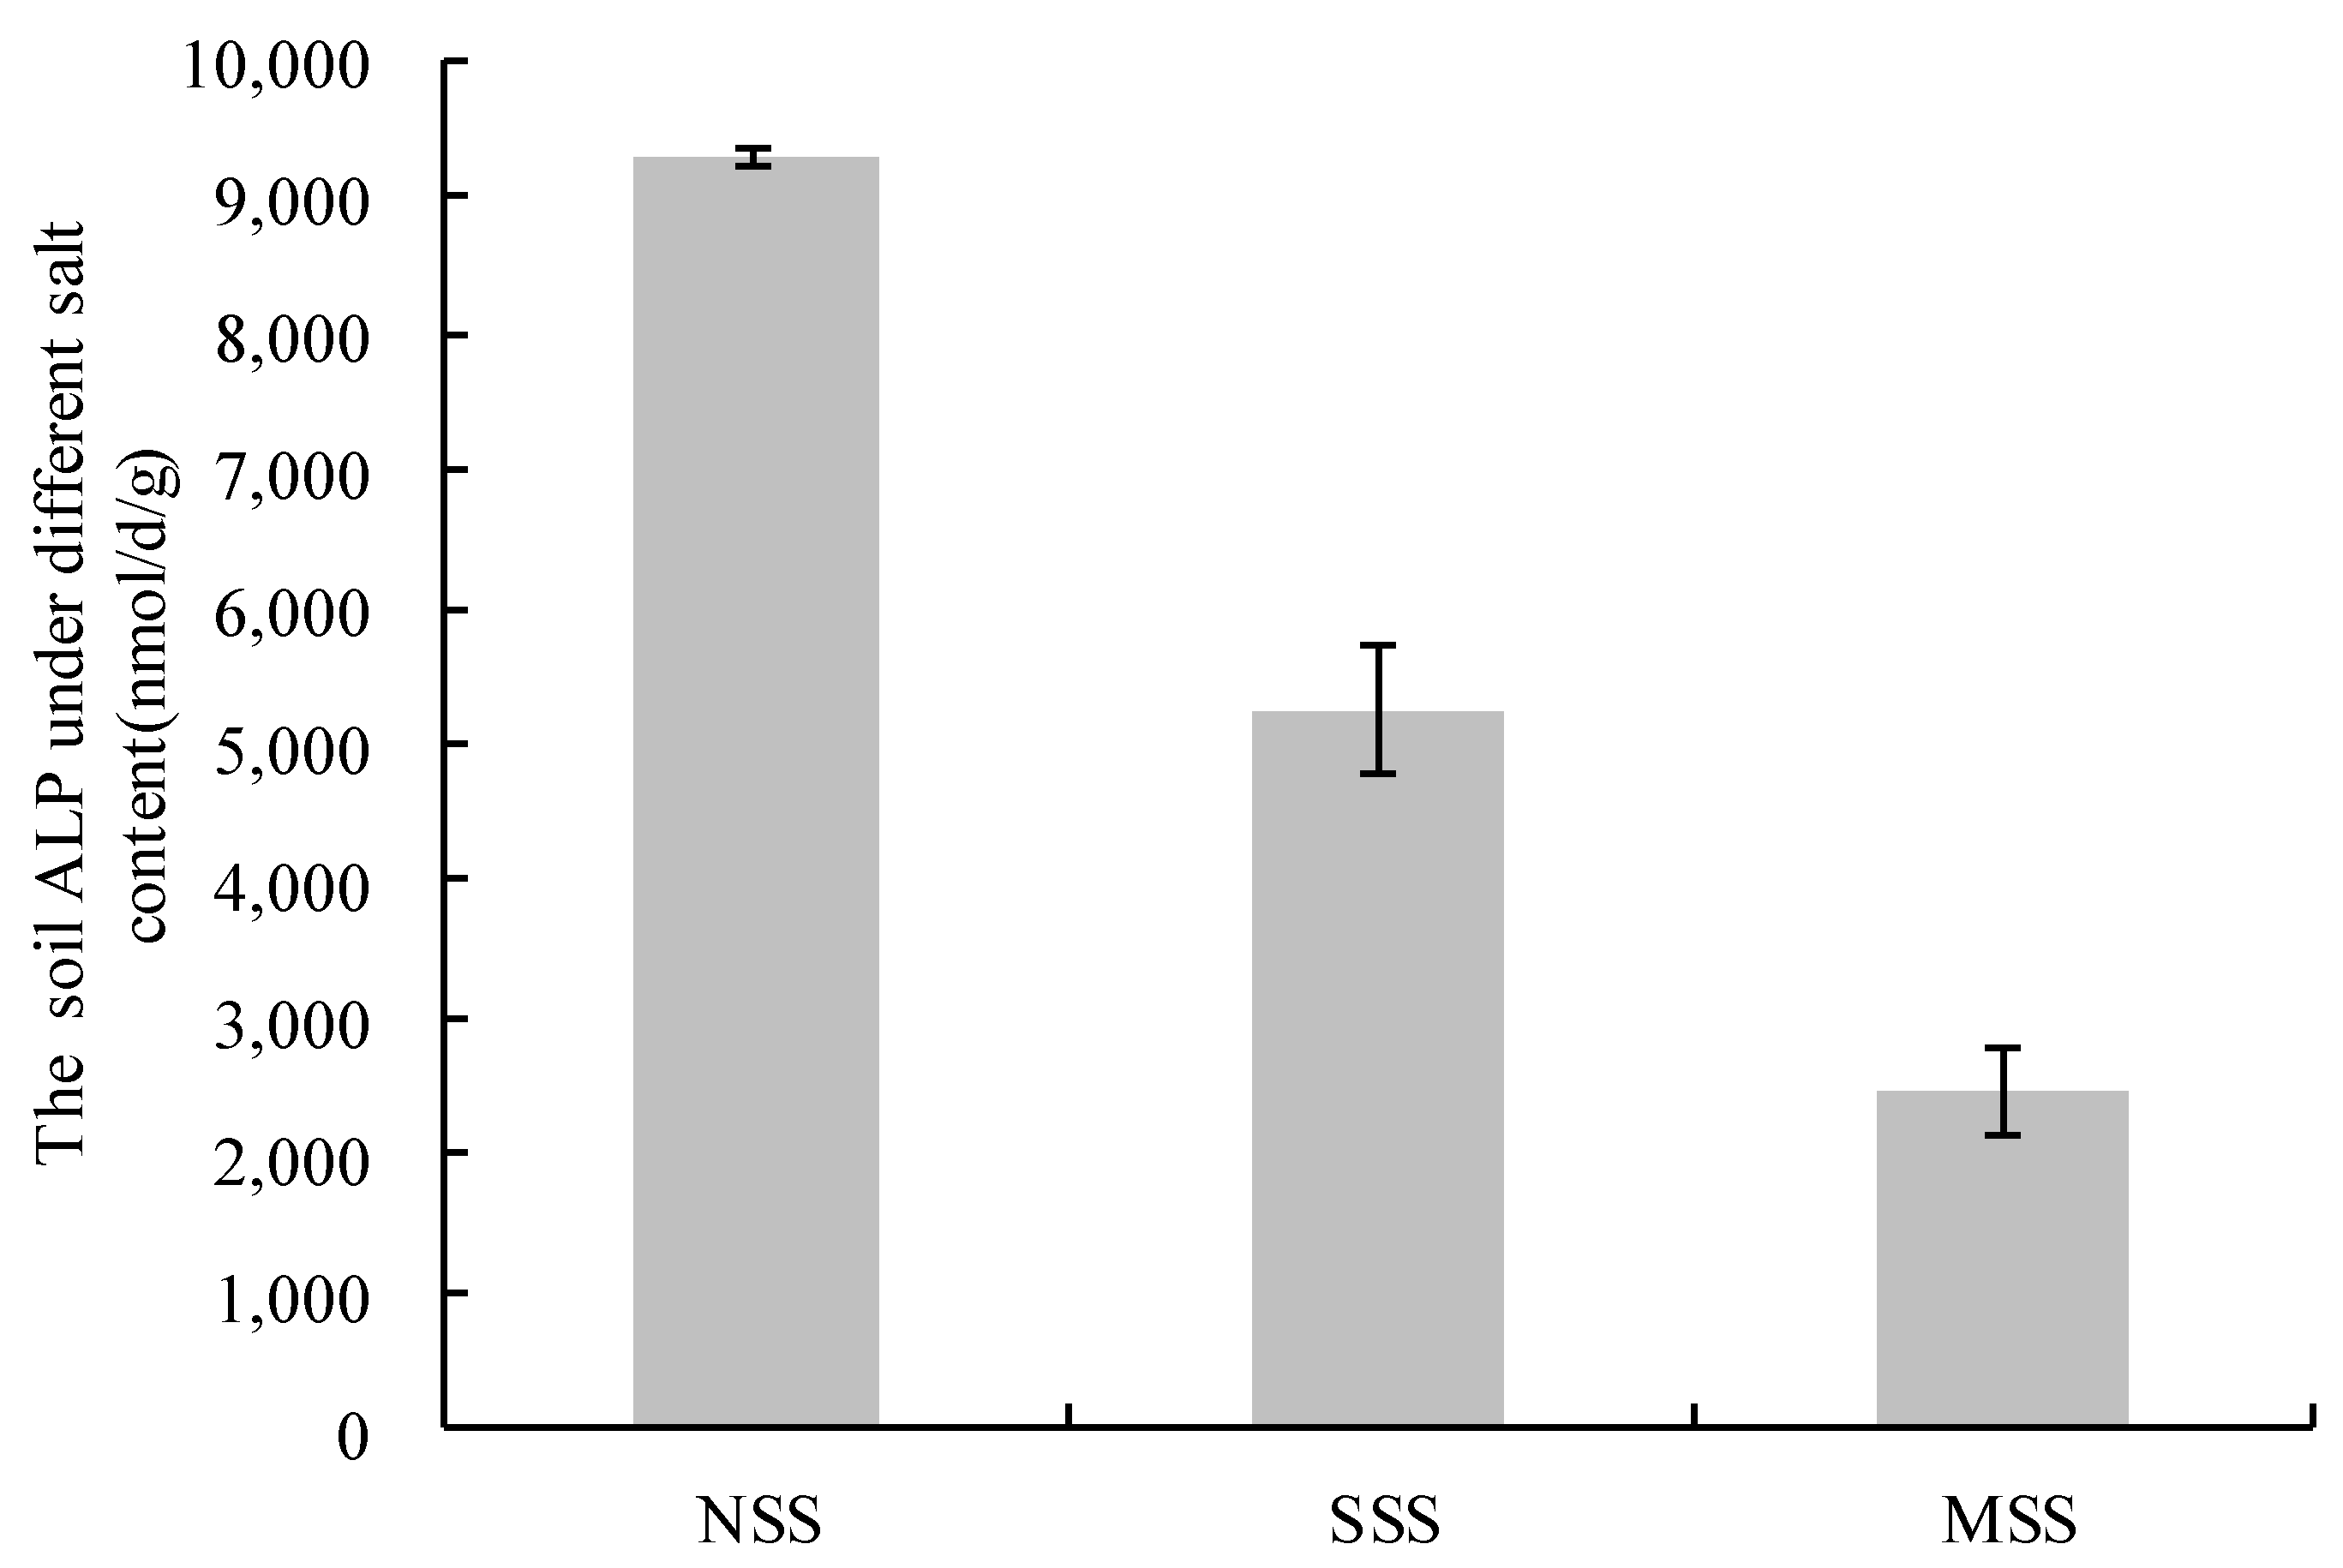
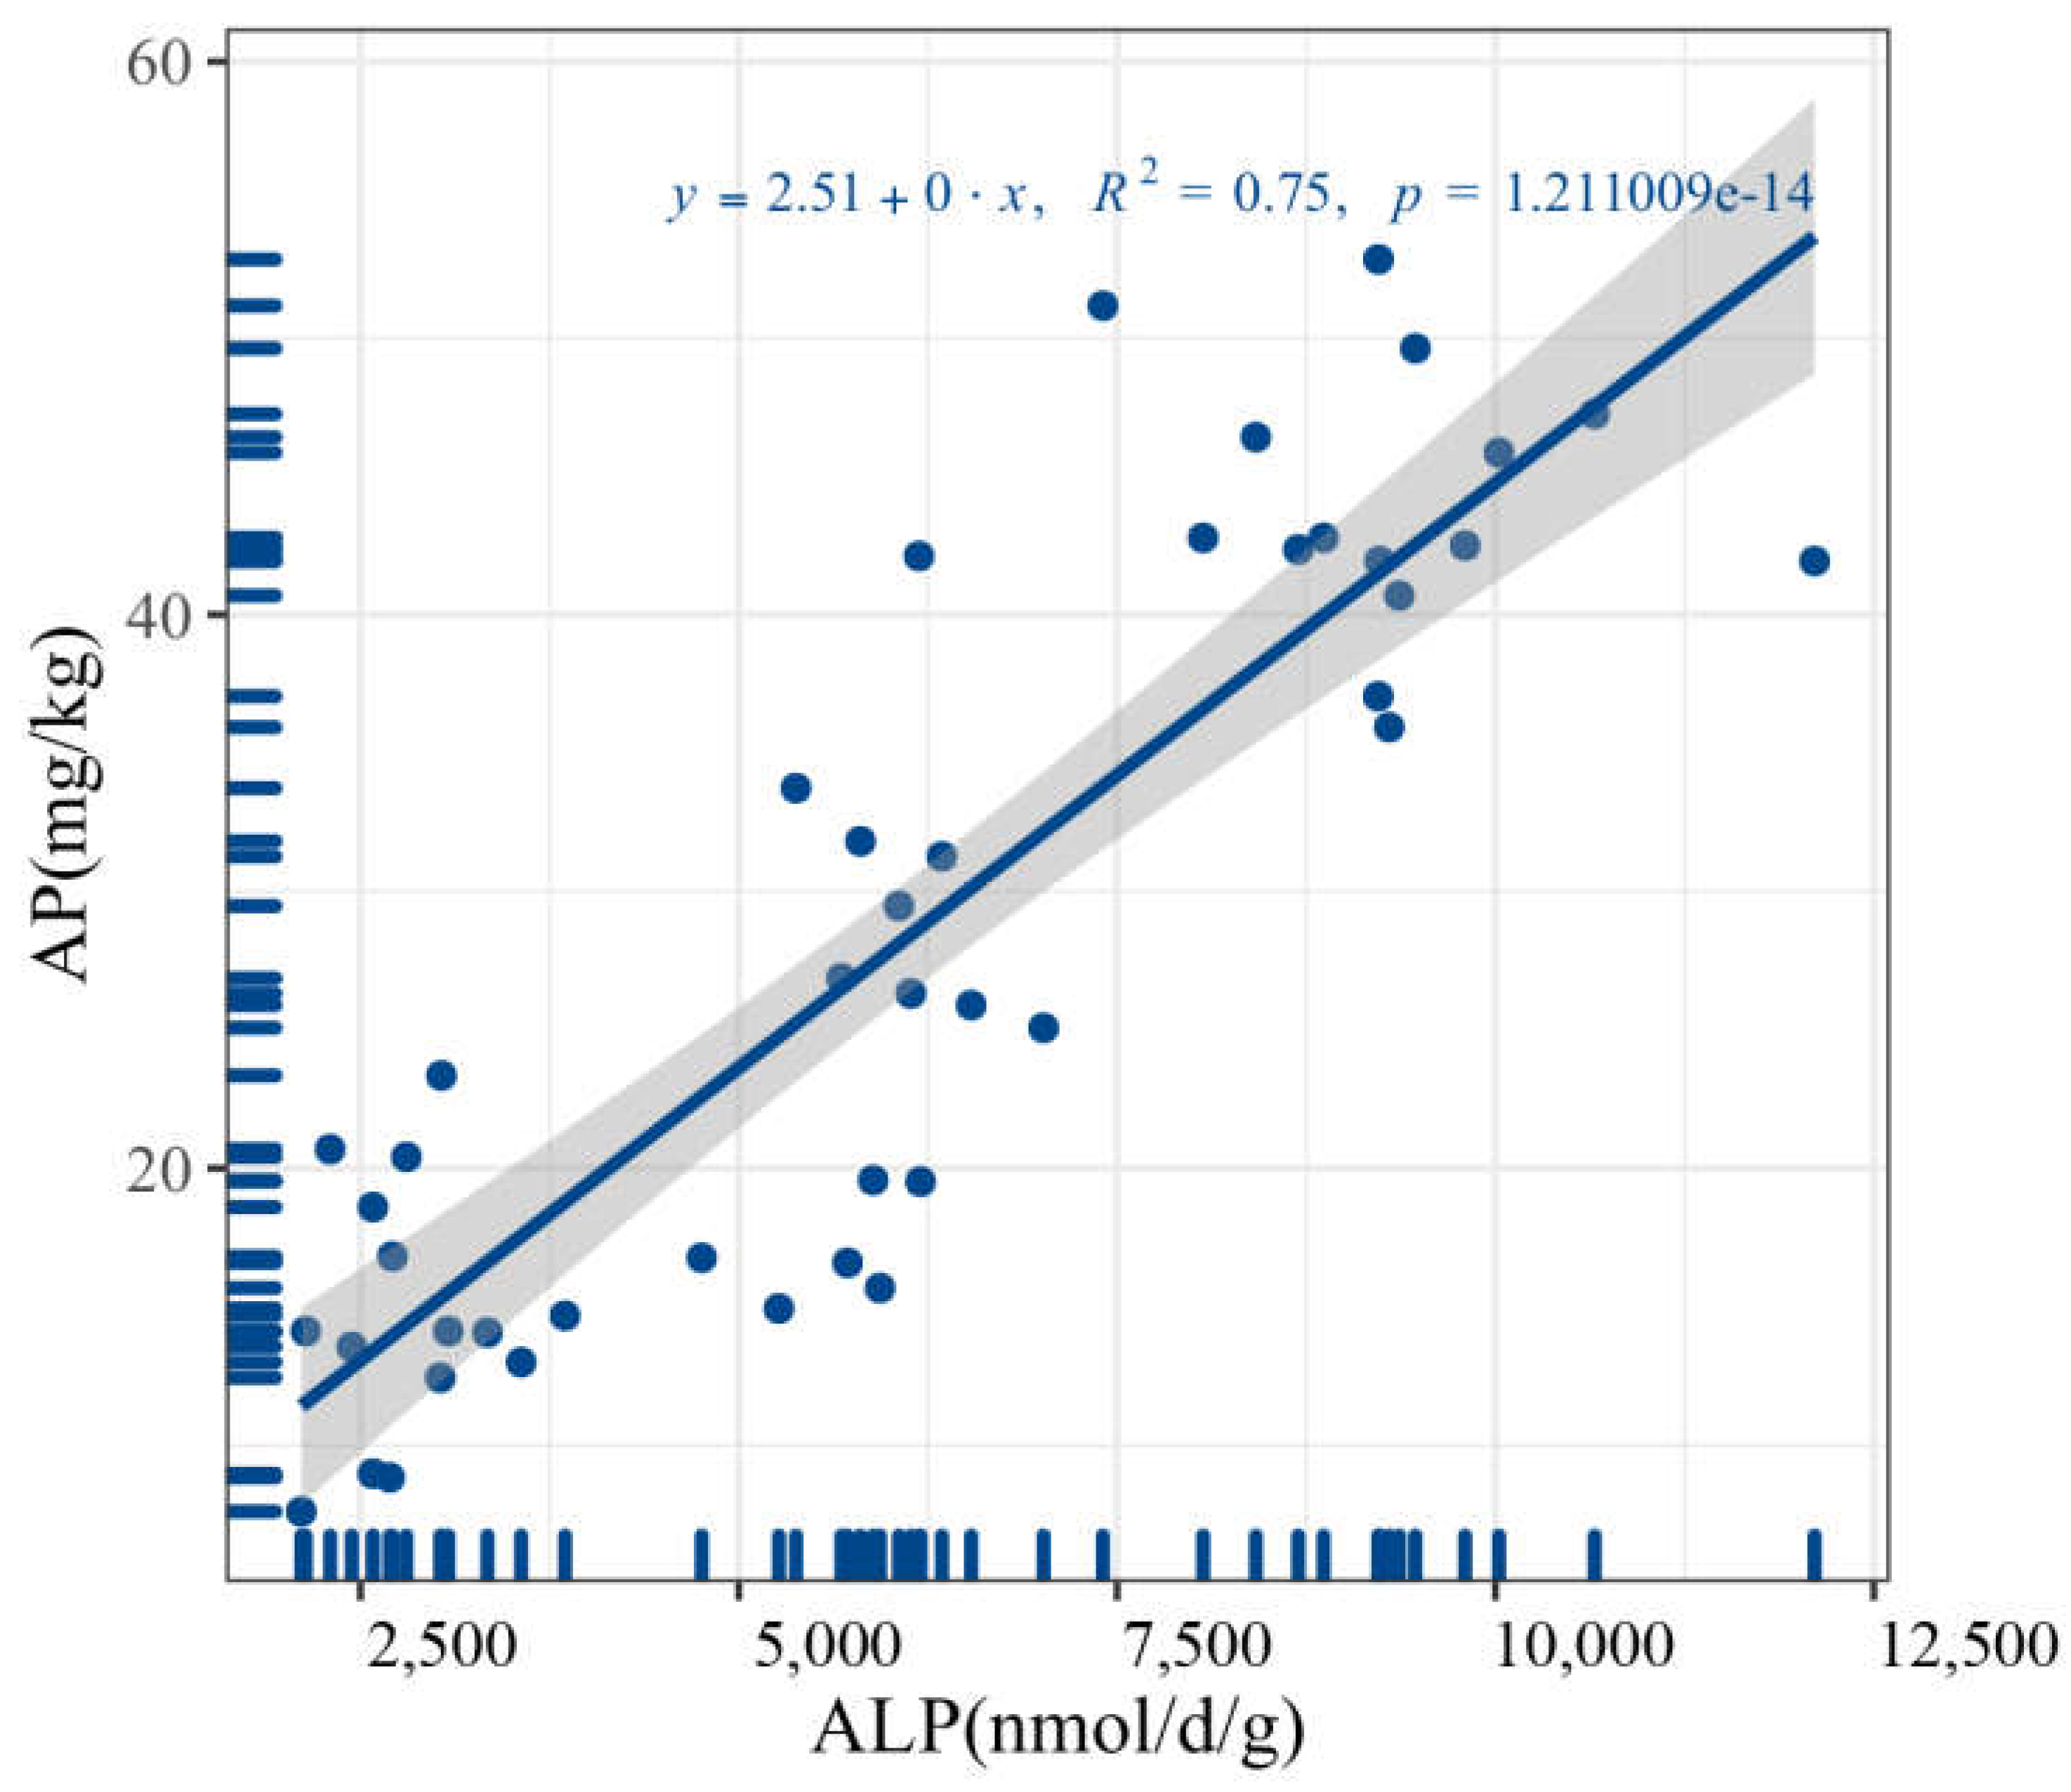
Soil phosphatase is a kind of enzyme that catalyzes the mineralization of soil organic phosphorus. Its activity directly affects the form and bioavailability of organic phosphorus in soil. It is an index to evaluate the direction and intensity of soil phosphorus biotransformation [33]. Due to the relatively high pH of saline soil, alkaline phosphatase is dominant in soil phosphatase [34]. We analyzed the alkaline phosphatase activity of three gradient saline soils, and results showed that the alkaline phosphatase activity of non-salinized soil was the highest, that of slightly salinized soil was lower, and that of moderately salinized soil was the lowest (Figure 7). The correlation between soil available phosphorus and alkaline phosphatase activity was analyzed (Figure 8), and soil available phosphorus was found to be significantly positive correlated with the alkaline phosphatase activity (R = 0.842, p < 0.001). In conclusion, the activity of alkaline phosphatase could be inferred as one of the impact factors of available phosphorus. Soil enzymes may persist for a long time, as they are protected by clay minerals and/or humic colloids, which provide them with a great resistance against thermal denaturation, dehydration, and proteolysis [35].
3.4. Relationships between Possible Impact Factors of Soil Available Phosphorus
As from the results above, while soil available phosphorus decreased with the increase of soil salinity, other factors which may affect the content of soil available phosphorus also showed the same or opposite trend. The results in Section 3.3 showed that available phosphorus had a very significant negative correlation with soil salt content and soil pH value, and a significant correlation with alkaline phosphatase activity. Active inorganic phosphorus and moderately active inorganic phosphorus in Hedley phosphorus classification contributed most part of available phosphorus.
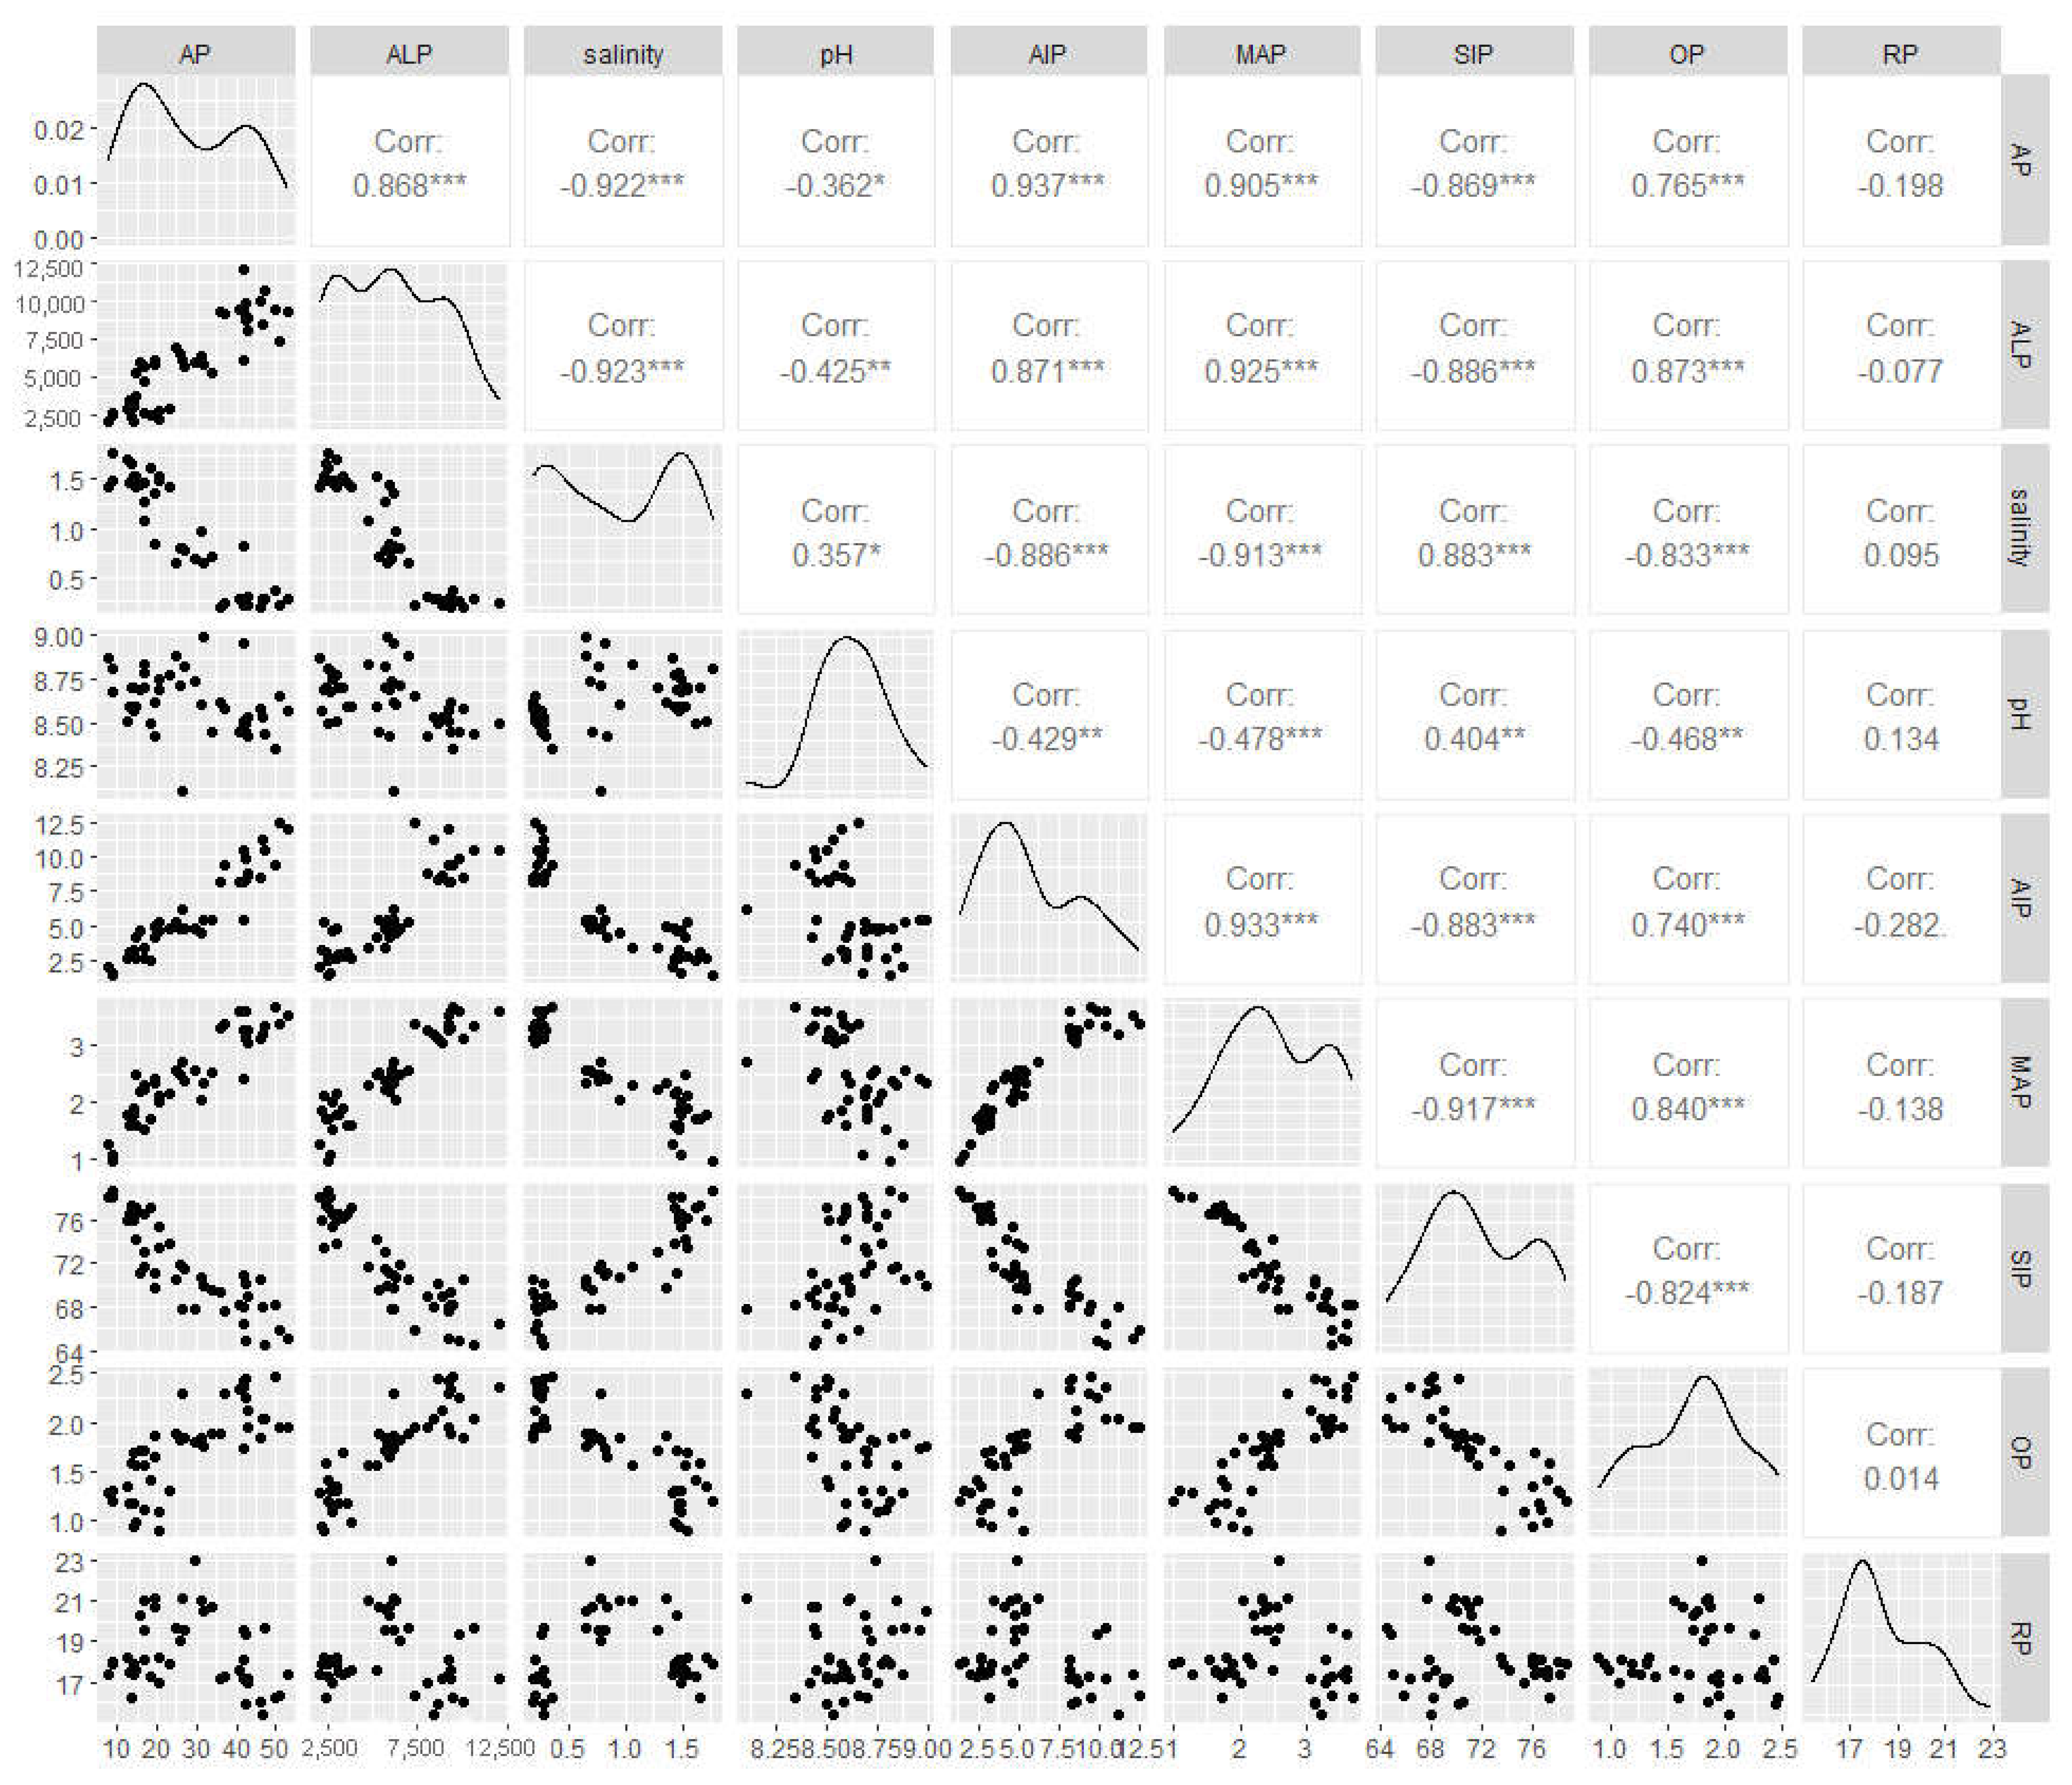
We gathered all the possible factors together and found that the correlation coefficient between soil salinity and soil available phosphorus was the best among all the environmental factors, followed by soil alkaline phosphatase activity, and the lowest was soil pH value (Figure 9). It was reflected from the side that soil salt and alkaline phosphatase activity are the main influencing factors of soil available phosphorus in this study, while the effects of soil pH on soil available phosphorus were less than that of soil salinity. Moreover, the influencing factors are also closely related. In the correlation diagram, soil salinity was negatively correlated with alkaline phosphatase activity, and the correlation coefficient reached −0.922 (p < 0.01), which showed that alkaline phosphatase activity was affected by soil salinity. Additionally, there was a significant correlation between soil salinity and soil pH, which showed that pH was also affected by soil salinity.
Among all the phosphorus classification, active inorganic phosphorus contributed most part of available phosphorus, followed by moderate active phosphorus and organophosphorus. While active inorganic phosphorus, moderate active phosphorus, and organophosphorus were all correlated with soil salinity, soil alkaline phosphatase activity, and pH value. And result showed that soil alkaline phosphatase activity was a little more important than soil salinity in the process of affecting active inorganic phosphorus, moderate active phosphorus and organophosphorus. The results showed that the increase of soil alkaline phosphatase activity could increase the proportion of active inorganic phosphorus and medium active inorganic phosphorus in soil phosphorus pool, promote the transformation of stable phosphorus inorganic phosphorus to other forms of phosphorus, and then improve the availability of phosphorus in saline soil.
We can conclude that soil salinity changed the soil salinity environment, affected soil alkaline phosphatase activity, and indirectly influenced the soil available phosphorus by changing the inorganic phosphorus pool.
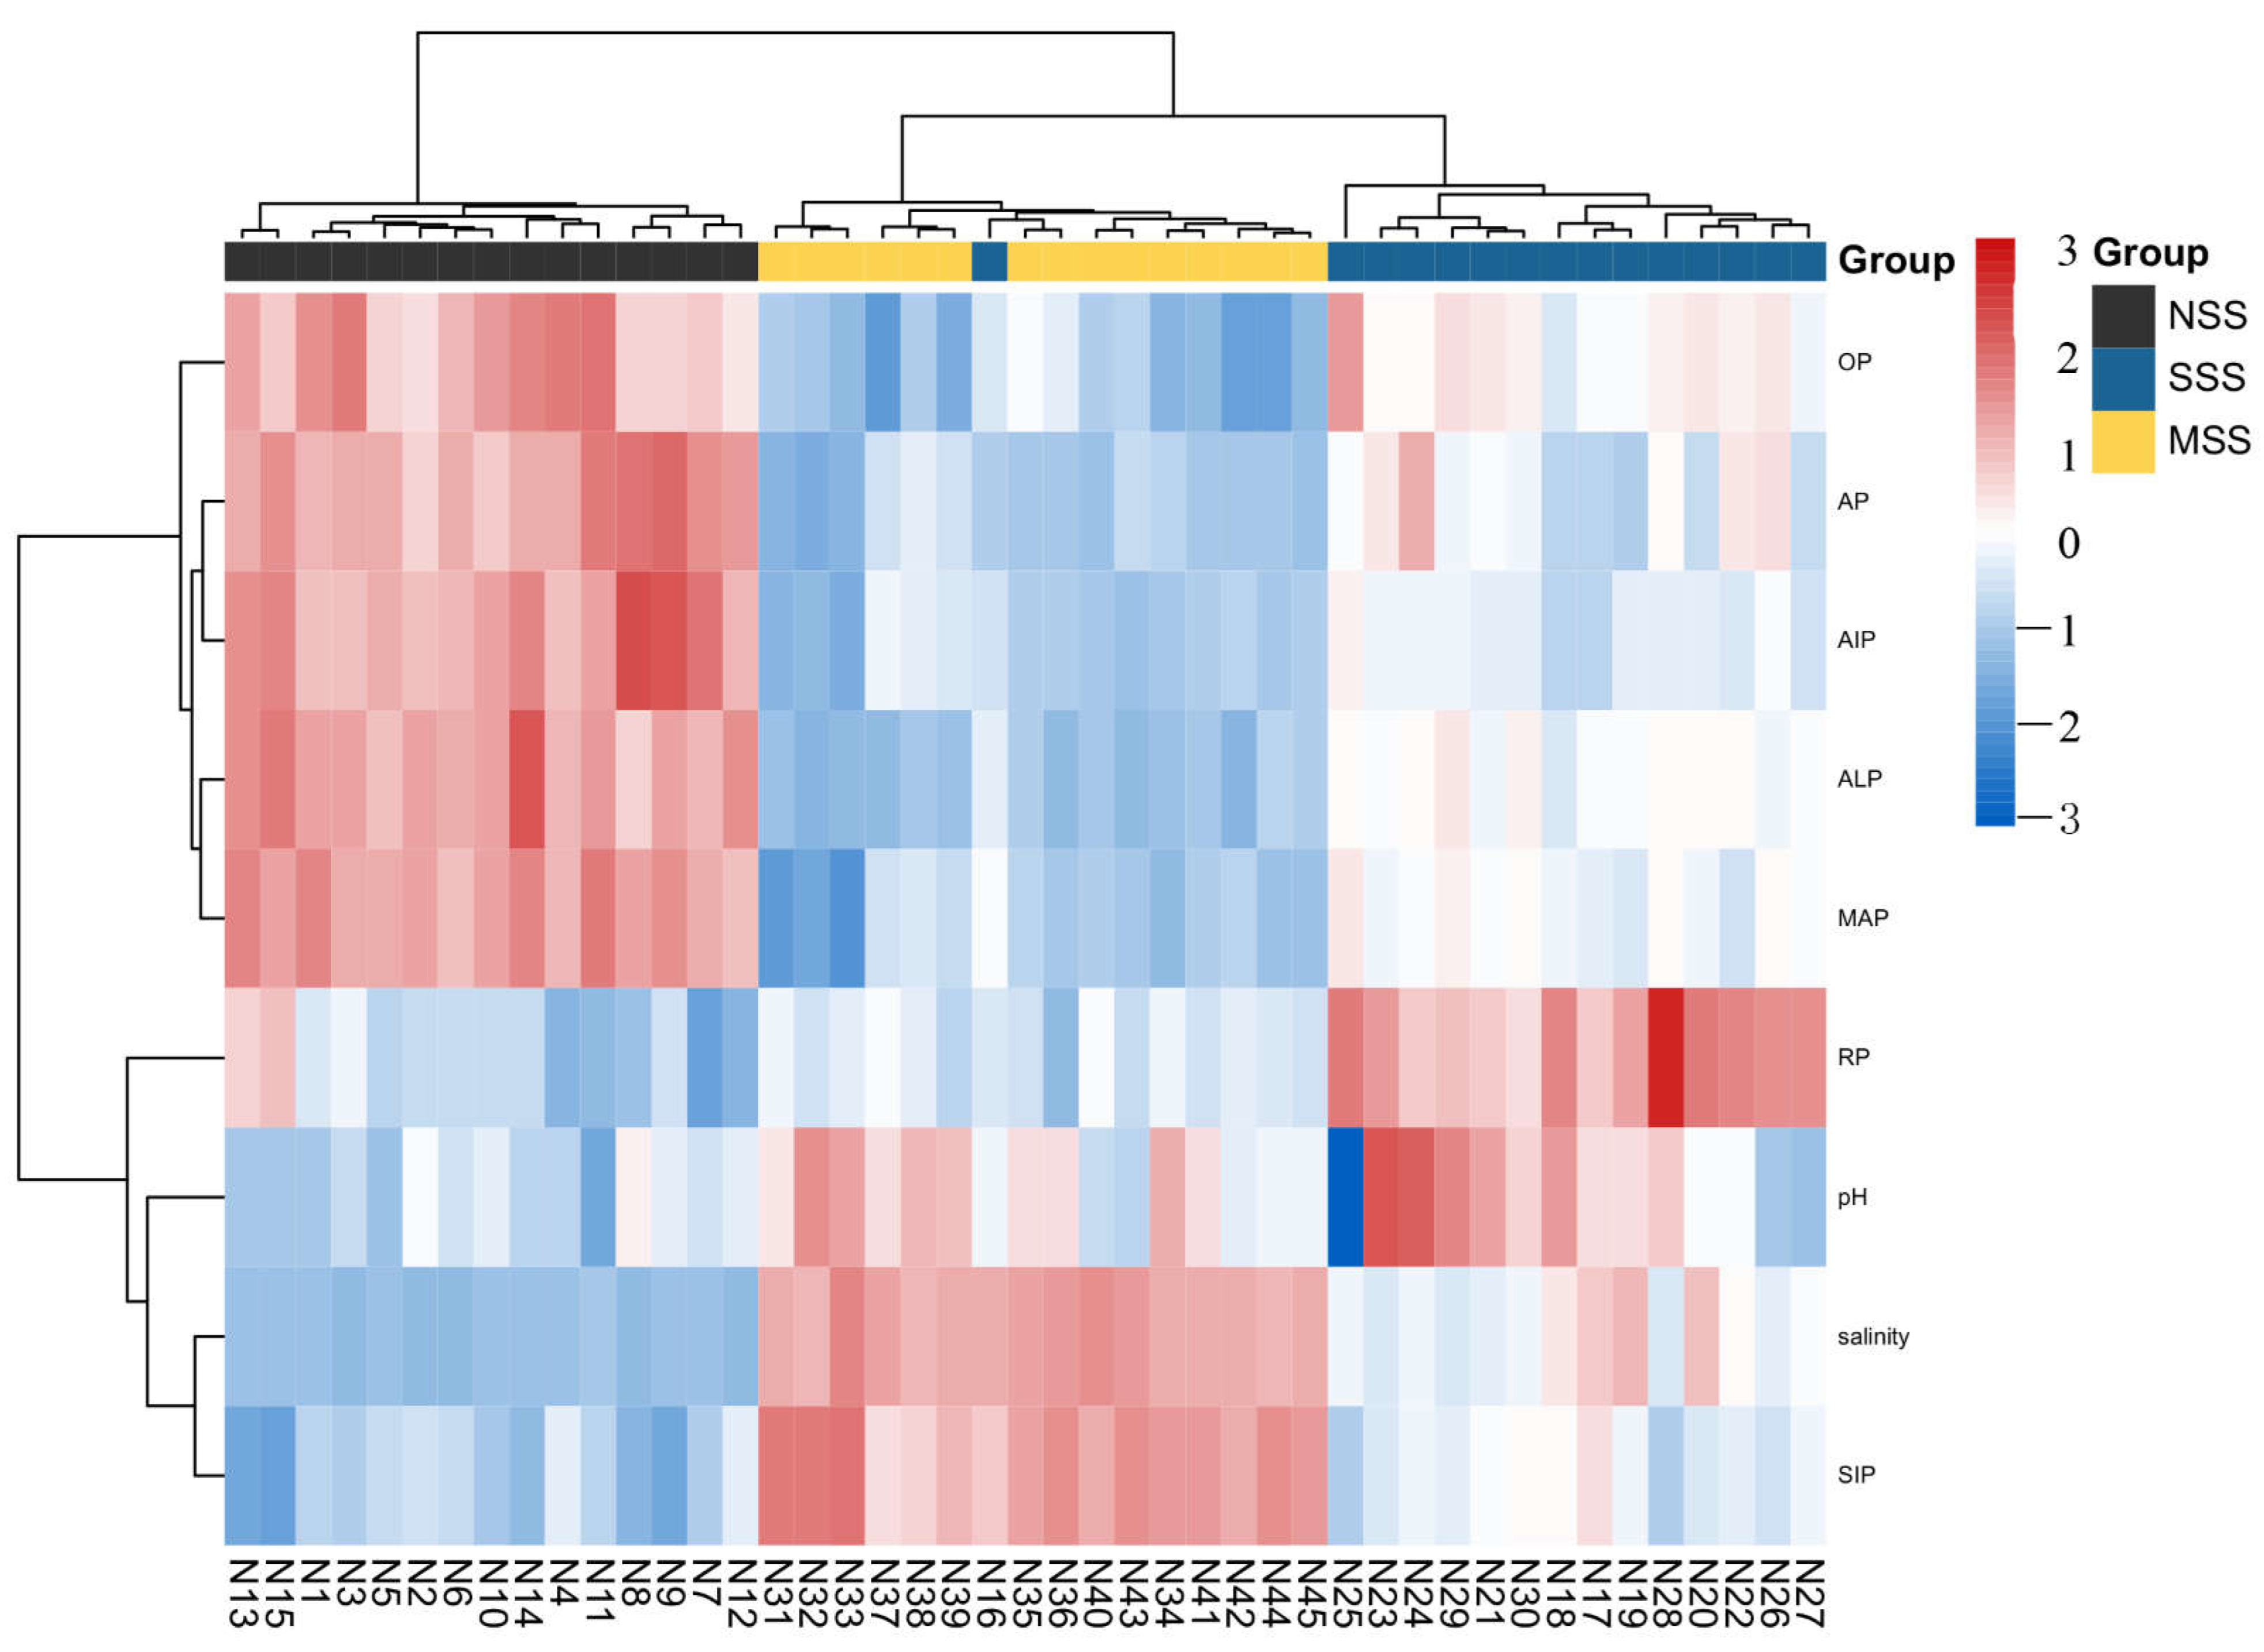
The cluster analysis method was used to analyze all relevant indicators, to study and verify the most important environmental indicators among these environmental indicators, as well as the relationship between indicators. The heat map showed that different factors were distinguished obviously by salt differences. RP and pH were clustered together and presented higher content in SSS, while SIP, salinity, and pH were clustered together and presented higher content in MSS.AP, relatively active phosphorus fraction (e.g., AIP, MAP, and OP) and ALP were clustered together (Figure 10), and showed the lowest value in MSS, slightly higher in SSS, but the highest in NSS. The result that relatively active phosphorus fraction (e.g., AIP, MAP, and OP) and ALP were clustered together echoed the conclusion that ALP was more closely related to phosphorus components in the previous paragraph, which verified the direct effect of ALP on the components of available phosphorus.
In conclusion, soil salt content changed the soil salinity environment, affected soil alkaline phosphatase activity, and indirectly influenced the soil available phosphorus by changing the inorganic phosphorus pool. Soil salinity was the most important factor in affecting relative indicators. AP, ALP, and relatively active phosphorus in Hedley classification were clustered together, which explained ALP was the direct environmental factor affecting available phosphorus. Additionally, ALP also affected the content of active phosphorus, which provided a source of AP.
4. Discussion
Our study showed that soil salinity affected the soil environment led to the lack of soil nutrient conditions and affected the alkaline phosphatase activity and the content of Hedley labile phosphorus, thus comprehensively affected the content of soil available phosphorus.
Inorganic phosphorus in Hedley classification was positively correlated with available phosphorus, which determined the change of available phosphorus. Active inorganic phosphorus, moderately active inorganic phosphorus, and part of organophosphorus were effective phosphorus sources in saline soil. The content of stable phosphorus in saline soil was high, and active inorganic phosphorus, moderately active inorganic phosphorus and NaOH-Po were relatively low. The research of Xu et al. [36] chose similar coastal area of the Yellow River Delta and found that the occluded forms (Dil.-HCl-P) of P constitute the major total P whereas the labile and moderately labile forms are relatively minor, suggesting that availability of P to plants in these soils was low.
In our study, sodium ion and chloride ion were the main salt ions in SSS and MSS, and available phosphorus in MSS was significantly lower than that in SSS, and available phosphorus in NSS was the highest. It was reflected from the side that the phosphorus supply of salt inhibited soil was limited. Previous studies showed that salinity stress was the main factor affecting crop growth and rhizosphere nutrient availability in saline soil [37,38], which was similar to our research results. Review paper of Li Y and Li G [39] put forward that there had been intense efforts to counter the salinity and improve the phosphorus availability of saline soils, which reflected the negative effect of salt on phosphorus availability.
Additionally, pH was one of important factors that affected the available phosphorus in our research. The research of Ye et al. [40] showed that salinity, pH value, and other relevant factors were important influencing factors of available phosphorus. The species and concentration of ions in soil solution were affected by soil pH, which made the form of soil phosphorus different [41].
Soil alkaline phosphatase activity was one of the most important factors in affecting soil available phosphorus, with a positive correlation between them. Soil alkaline phosphatase activities decreased significantly with the increase in salinity, while available phosphorus concentration increased significantly [42]. This result supported the conclusion that alkaline phosphatase was affected by soil salinity. While the reason why the results were inconsistent with our research may be attributed to different areas and soil forming processes, as the land we focused on was formed with high sediment content and lack of nutrients, which resulted in low background content of phosphorus in soil. Alkaline phosphatase activity was found to be closely connected with available phosphorus and ECe [43], which was similar to our results.
Previous studies showed that the activity of soil phosphatase was affected by soil pH value [44], and result showed that alkaline phosphatase activity was negatively correlated with soil pH value. We also found from the result that there was negative correlation between pH and alkaline phosphatase activity, which was consistent with the result of previous study. However, the effect of salt on alkaline phosphatase activity was significantly higher than that of pH in the coastal area with more obvious characteristics of salinity. Impact factors were distinguished obviously by soil salinity in our study, and salinity was the dominant factor, affecting the relevant environmental factors. Soil salinity affected environmental indicators. ALP and relatively active phosphorus in Hedley classification were more closely related to AP. Additionally, AP, ALP and the fact that relatively active phosphorus in Hedley classification were clustered together, which explained ALP was the direct environmental factor affecting available phosphorus, affected the content of active phosphorus, which provided a source of AP.
5. Conclusions
In conclusion, soil available phosphorus decreased, and the availability of phosphorus was inhibited in coastal areas, Jiangsu Province, China. With the increase of soil salinity, the proportion of soil active inorganic phosphorus decreased and the proportion of stable inorganic phosphorus increased, which explained the regulation of available phosphorus.
Soil available phosphorus was affected by several factors, such as soil salinity, soil pH, and soil alkaline phosphatase activity. All the factors were correlated with the soil available phosphorus. However, salinity was the soil salt and alkaline phosphatase activity were the main influencing factors of soil available phosphorus in this study. As there was a very significant positive correlation between alkaline phosphatase activity and soil salt, salt content could be considered as the environmental factor and the soil alkaline phosphatase could be considered as the direct influencing factor. The increase of soil alkaline phosphatase activity could increase the proportion of active inorganic phosphorus and medium active inorganic phosphorus in soil phosphorus pool, promote the transformation of stable phosphorus inorganic phosphorus to other forms of phosphorus, and then improve the availability of phosphorus in saline soil. Soil salinity was the most influential factor of AP in coastal salt-affected soil in Jiangsu Province, China. Due to the influence of salt restriction factors, relevant environmental factors have changed significantly, containing soil pH, alkaline phosphatase activity, etc. Among all the factors, soil alkaline phosphatase had the closest relationship with available phosphorus. In terms of internal mechanism, the change of soil available phosphorus was mainly controlled by the change of active phosphorus pool, which was also affected by salinity and surrounding environmental factors. Soil salinity affected influenced the surrounding environment, changed the soil alkaline phosphatase activity and liable phosphorus pool, and finally reduced soil AP.
Nevertheless, as affected by the soil forming process and parent material, coastal saline soil has a series of characteristics. The whole coastal soil profile contains a large amount of soluble salt, and the composition of soil salt ions is mainly sodium chloride, which is similar to that of seawater. There may be differences in the influencing factors of available phosphorus in salt-affected soil with alkaline characteristics, as coastal soils are mainly characterized by salinity, while saline soils in some inland areas are mainly characterized by alkalinity. High pH of the alkaline soil reduced the solubility of inorganic P, and adversely influenced processes involved in the transformation and release of available P by affecting its microbial community structure, biomass, carbon content, phosphatase, and other enzyme activities [45,46]. Therefore, relevant studies in other non-coastal saline areas need to be reconsidered because of different salinization process.
Author Contributions
W.X. and J.Y. designed the research. S.G. performed the experiments. R.Y. and X.W. provided technical assistance. W.X. wrote the manuscript. All authors have read and agreed to the published version of the manuscript.
Funding
This work was jointly supported by the National Key Research and Development Program of China (2019YFD0900702), the National Natural Science Foundation of China (No. 41977015, U1806215), the National Key Research & Development Program of China (2019YFD1002702, 2021YFD1900600, 2021YFC3201200).
Institutional Review Board Statement
Not applicable.
Informed Consent Statement
Not applicable.
Data Availability Statement
Not applicable.
Conflicts of Interest
The authors declare no conflict of interest.
Abbreviations
| Indicators | Abbreviation |
| available phosphorus | AP |
| alkaline phosphatase activity | ALP |
| active inorganic phosphorus | AIP |
| moderately active inorganic phosphorus | MAP |
| stable inorganic phosphorus | SIP |
| Organophosphorus | OP |
References
- Yang, W.Z.; Yang, M.D.; Wen, H.Y.; Jiao, Y. Global Warming Potential of CH4 uptake and N2O emissions in saline-alkaline soils. Atmos. Environ. 2018, 191, 172–180. [Google Scholar] [CrossRef]
- Shahbaz, M.; Ashraf, M. Improving Salinity Tolerance in Cereals. Crit. Rev. Plant Sci. 2013, 32, 237–249. [Google Scholar] [CrossRef]
- Qadir, M.; Oster, J.D.; Schubert, S.; Noble, A.D.; Sahrawat, K.L. Phytoremediation of Sodic and Saline-Sodic Soils. Adv. Agron. 2007, 96, 197–247. [Google Scholar]
- Liu, G.; Li, J.; Zhang, X.; Wang, X.; Lv, Z.; Yang, J.; Shao, H.; Yu, S. GIS-mapping spatial distribution of soil salinity for Eco-restoring the Yellow River Delta in combination with Electromagnetic Induction. Ecol. Eng. 2016, 94, 306–314. [Google Scholar] [CrossRef]
- Wang, Y.G.; Deng, C.Y.; Liu, Y.; Ziru, N. Identifying change in spatial accumulation of soil salinity in an inland river watershed, China. Sci. Total Environ. 2018, 621, 177–185. [Google Scholar] [CrossRef]
- Metternicht, G.I.; Zinck, J.A. Remote Sensing of Soil Salinity: Potentials and Constraints. Remote Sensitive Environ. 2003, 85, 1–20. [Google Scholar] [CrossRef]
- Wang, J.; Yuan, G.; Lu, J.; Wu, J.; Wei, J. Effects of biochar and peat on salt-affected soil extract solution and wheat seedling germination in the Yellow River Delta. Arid Land Res. Manag. 2019, 34, 287–305. [Google Scholar] [CrossRef]
- Yang, J.S. Development and prospect of the research on salt-affected soils in China. Acta Pedol. Sin. 2008, 5, 837–845. (In Chinese) [Google Scholar]
- Liu, M.; Hou, L.; Xu, S.; Ou, D.; Yang, Y.; Zhang, B.; Liu, Q. Adsorption of phosphate on tidal flat surface sediments from the Yangtze Estuary. Environ. Geol. 2002, 42, 657–665. [Google Scholar]
- Bruland, G.L.; DeMent, G. Phosphorus Sorption Dynamics of Hawaii’s Coastal Wetlands. Estuaries Coasts 2009, 32, 844–854. [Google Scholar] [CrossRef]
- Tejada, M.; Garcia, C.; Gonzalez, J.L.; Hernandez, M.T. Use of organic amendment as a strategy for saline soil remediation: Influence on the physical, chemical and biological properties of soil. Soil Biol. Biochem. 2006, 38, 1413–1421. [Google Scholar] [CrossRef]
- Rietz, D.N.; Haynes, R.J. Effects of irrigation-induced salinity and sodicity on soil microbial activity. Soil Biol. Biochem. 2003, 35, 845–854. [Google Scholar] [CrossRef]
- Garcia, C.; Hernandez, T. Influence of salinity on the biological and biochemical activity of a calciorthird soil. Plant Soil 1996, 178, 255–263. [Google Scholar] [CrossRef]
- Penn, C.J.; Camberato, J.J. A critical review on soil chemical processes that control how soil pH affects phosphorus availability to plants. Agriculture 2019, 9, 120. [Google Scholar] [CrossRef]
- Reddy, M.P.; Shah, M.T.; Patolia, J.S. Salvadora persica, a potential species for industrial oil production in semiarid saline and alkali soils. Ind. Crop Prod. 2008, 28, 273–278. [Google Scholar] [CrossRef]
- Yan, K.; Xu, H.; Zhao, S.; Shan, J.; Chen, X. Saline soil desalination by honeysuckle (Lonicera japonica Thunb.) depends on salt resistance mechanismKun. Ecol. Eng. 2016, 88, 226–231. [Google Scholar] [CrossRef]
- Gu, L.L. Effects of Long-Term Located Fertilization and Paddy Field Continuous Cropping on Phosphorus Speciation in Farmland Soils. Ph.D. Thesis, Huazhong Agriculture University, Wuhan, China, 2017. [Google Scholar]
- Perassi, I.; Borgnino, L. Adsorption and surface precipitation of phosphate onto CaCO3–montmorillonite: Effect of pH, ionic strength and competition with humic acid. Geoderma 2014, 232–234, 600–608. [Google Scholar] [CrossRef]
- Yang, J.S.; Yao, R.J. Evaluation of soil quality in reclaimed coastal regions in North Jiangsu Province. Chin. J. Eco-Agric. 2009, 17, 410–415. [Google Scholar] [CrossRef]
- Zhao, Q.G.; Shi, X.Z. Introduction to Soil Resources; Chinese Science Publication: Beijing, China, 2007. [Google Scholar]
- Murphy, J.; Riley, J.P. A modified single solution method for the determination of phosphate in natural waters. Analytia Chimca Acta 1962, 27, 31–36. [Google Scholar] [CrossRef]
- Olsen, S.R.; Cole, C.V.; Watanabe, F.S. Estimation of Available Phosphorus in Soils by Extraction with Sodium Bicarbonate; USDA Circular 939; US Department of Agriculture: Washington, DC, USA, 1954.
- Xie, X.; Pu, L.; Zhu, M.; Xu, Y.; Wang, X. Linkage between soil salinization indicators and physicochemical properties in a long-term intensive agricultural coastal reclamation area, Eastern China. J. Soil Sediments 2019, 19, 3699–3707. [Google Scholar] [CrossRef]
- Duan, S.; Kaushal, S.S. Salinization alters fluxes of bioreactive elements from stream ecosystems across land use. Biogeosciences 2015, 12, 7331–7347. [Google Scholar] [CrossRef]
- Rose, T.J.; Hardiputra, B.; Rengel, Z. Wheat, canola and grain legume access to soil phosphorus fractions differs in soils with contrasting phosphorus dynamics. Plant Soil 2010, 326, 159–170. [Google Scholar] [CrossRef]
- Maranguit, D.; Guillaume, T.; Kuzyakov, Y. Land-use change affects phosphorus fractions in highly weathered tropical soils. Catena 2017, 149, 385–393. [Google Scholar] [CrossRef]
- Hedley, M.J.; Stewart, J.W.B.; Chauhan, B.S. Changes in Inorganic and Organic Soil Phosphorus Fractions Induced by Cultivation Practices and by Laboratory Incubations. Soil Sci. Soc. Am. J. 1982, 46, 970–976. [Google Scholar] [CrossRef]
- Hu, Y.; Schmi, U. Drought and salinity: A comparison of their effects on mineral nutrition of plants. J. Plant Nutr. Soil Sci. 2005, 168, 541–549. [Google Scholar] [CrossRef]
- Yang, J.S. Characteristics of Crop Response on Different Salt Stresses/Management and the Regulation of Crop Salt Resistance. Ph.D. Thesis, Nanjing Agriculture University, Nanjing, China, 2006. [Google Scholar]
- Dijk, G.V.; Lamers, L.; Loeb, R.; Westendorp, P.J.; Kuiperij, R.; van Kleef, H.H.; Klinge, M.; Smolders, A.J. Salinization lowers nutrient availability in formerly brackish freshwater wetlands; unexpected results from a long-term field experiment. Biogeochemistry 2019, 143, 67–83. [Google Scholar] [CrossRef]
- Hill, J.O.; Simpson, R.J.; Moore, A.D.; Graham, P.; Chapman, D.F. Impact of phosphorus application and sheep grazing on the botanical composition of sown pasture and naturalised, native grass pasture. Aust. J. Agric. Res. 2005, 55, 1213–1225. [Google Scholar] [CrossRef]
- Stevenson, F.J.; Cole, M.A. Cycles of Soils: Carbon, Nitrogen, Phosphorus, Sulfur, Micronutrients; John Wiley & Sons: Hoboken, NJ, USA, 1999. [Google Scholar]
- Wang, C.; Xue, L.; Jiao, R. Stoichiometric imbalances and the dynamics of phosphatase activity and the abundance of phoC and phoD genes with the development of Cunninghamia lanceolata (Lamb.) Hook plantations. Appl. Soil Ecol. 2022, 173, 104373. [Google Scholar] [CrossRef]
- Zhang, T.B.; Kang, Y.; Liu, S.H.; Liu, S.P. Alkaline phosphatase activity and its relationship to soil properties in a saline–sodic soil reclaimed by cropping wolfberry (Lycium barbarum L.) with drip irrigation. Paddy Water Environ. 2014, 12, 309–317. [Google Scholar] [CrossRef]
- Pant, H.K.; Warman, P.R. Enzymatic hydrolysis of soil organic phosphorus by immobilized phosphatases. Biol. Fertil. Soils 2000, 30, 306–311. [Google Scholar] [CrossRef]
- Xu, G.; Shao, H.B.; Sun, J.N.; Chang, S.X. Phosphorus fractions and profile distribution in newly formed wetland soils along a salinity gradient in the Yellow River Delta in China. J. Plant Nutr. Soil Sci. 2012, 175, 721–728. [Google Scholar] [CrossRef]
- Javed, S.A.; Shahzad, S.M.; Ashraf, M.; Kausar, R.; Arif, M.S.; Albasher, G.; Rizwana, H.; Shakoor, A. Interactive effect of different salinity sources and their formulations on plant growth, ionic homeostasis and seed quality of maize. Chemosphere 2022, 291, 132678. [Google Scholar] [CrossRef] [PubMed]
- Paul, D.; Lade, H. Plant-growth-promoting rhizobacteria to improve crop growth in saline soils: A review. Agron. Sustain. Dev. 2014, 34, 737–752. [Google Scholar] [CrossRef]
- Li, Y.; Li, G. Mechanisms of straw biochar’s improvement of phosphorus bioavailability in soda saline-alkali soil. Environ. Sci. Pollut. Res. 2022, 29, 47867–47872. [Google Scholar] [CrossRef] [PubMed]
- Ye, X.F.; Bai, J.H.; Lu, Q.Q.; Zhao, Q.Q.; Wang, J.J. Spatial Distribution of Phosphorus in Surface Soils of Wetlands with Different Plant Communities in the Yellow River Delta, China. Adv. Mater. Res. 2013, 726–731, 1383–1386. [Google Scholar] [CrossRef]
- Devau, N.; Le Cadre, E.; Hinsinger, P.; Jaillard, B.; Gérard, F. Soil pH controls the environmental availability of phosphorus: Experimental and mechanistic modelling approaches. Appl. Geochem. 2009, 24, 2163–2174. [Google Scholar] [CrossRef]
- Pan, C.; Liu, C.; Zhao, H.; Wang, Y. Changes of soil physico-chemical properties and enzyme activities in relation to grassland salinization. Eur. J. Soil Biol. 2013, 55, 13–19. [Google Scholar] [CrossRef]
- Kang, Y.H.; Liu, S.H.; Wan, S.Q.; Wang, R.S. Assessment of soil enzyme activities of saline–sodic soil under drip irrigation in the Songnen plain. Paddy Water Environ. 2013, 11, 87–95. [Google Scholar] [CrossRef]
- Wang, A.S.; Angle, J.S.; Chaney, R.L.; Delorme, T.A.; McIntosh, M. Changes in soil biological activities under reduced soil pH during Thlaspi caerulescens phytoextraction. Soil Biol. Biochem. 2006, 38, 1451–1461. [Google Scholar] [CrossRef]
- Gao, M.H.; Li, N.; Peng, J.; Chen, K.; Gao, T.Y.; Han, X.R. Efects of straw and biochar returning on soil aggregates distribution and organic carbon content in brown soil. J. Plant Nutr. Fert. 2020, 26, 1978–1986. [Google Scholar]
- Zhao, W.; Zhou, Q.; Tian, Z.; Cui, Y.; Liang, Y.; Wang, H. Apply biochar to ameliorate soda saline-alkali land, improve soil function and increase corn nutrient availability in the Songnen Plain. Sci. Total Environ. 2020, 722, 137428. [Google Scholar] [CrossRef] [PubMed]
Figure 1.
Soil available phosphorus under different soil salinity environment.

Figure 2.
Proportion of various phosphorus forms in Hedley classification.

Figure 3.
Correlation diagram between available phosphorus and various forms of phosphorus in Hedley classification.
Figure 3.
Correlation diagram between available phosphorus and various forms of phosphorus in Hedley classification.

Figure 4.
Salt content and soluble ion under different salinity environment. ((a): salt content; (b): soluble ion).
Figure 4.
Salt content and soluble ion under different salinity environment. ((a): salt content; (b): soluble ion).

Figure 5.
Scatter diagram between soil salt content and available phosphorus.

Figure 6.
Scatter diagram between soil pH and soil available phosphorus.

Figure 7.
Soil alkaline phosphatase activity under different soil salinity environment.

Figure 8.
Scatter diagram between soil alkaline phosphatase activity and available phosphorus.

Figure 9.
Correlation diagram among possible influence factors. Note: * p ≤ 0.05, ** p ≤ 0.01, *** p ≤ 0.001, level of significance (two-tailed) by least significant difference (LSD).
Figure 9.
Correlation diagram among possible influence factors. Note: * p ≤ 0.05, ** p ≤ 0.01, *** p ≤ 0.001, level of significance (two-tailed) by least significant difference (LSD).

Figure 10.
Heat map of relative impact factors in different degree of saline soil. Note: The clustering heatmap represented values of impact factors in different degree of saline soil, and data of different indicators are normalized due to the range of different measured values of indicators.
Figure 10.
Heat map of relative impact factors in different degree of saline soil. Note: The clustering heatmap represented values of impact factors in different degree of saline soil, and data of different indicators are normalized due to the range of different measured values of indicators.


Table 1.
Main properties of the survey soil.
| Salinity Classification | pH | Soil Salt Content (g kg−1) | Total Phosphorus (mg kg−1) | Available Phosphorus (mg kg−1) |
|---|---|---|---|---|
| Non-saline soil | 8.77 | 0.51 | 812.45 | 44.41 |
| Slightly salinized soil | 9.00 | 1.55 | 709.95 | 21.04 |
| Moderately salinized soil | 9.30 | 2.53 | 651.20 | 11.05 |
Note: In the table, non-saline soil represented the soil with salt content less than 1 g kg−1; slightly salinized soil represented soil with salt content between 1 g kg−1 and 2 g kg−1; moderately salinized soil represented with salt content more than 2 g kg−1 [20].
Table 2.
The proportion of various forms of phosphorus in Hedley under different soil salinity environment.
Table 2.
The proportion of various forms of phosphorus in Hedley under different soil salinity environment.
| Soil Type | H2O-Pi | NaHCO3-Pi | NaOH-Pi | HCl-Pi | NaHCO3-Po | NaOH-Po | R-P |
|---|---|---|---|---|---|---|---|
| NSS | 1.34 | 8.79 | 0.48 | 3.70 | 2.02 | 64.78 | 18.89 |
| SSS | 0.61 | 4.60 | 0.82 | 2.74 | 1.31 | 69.09 | 20.81 |
| MSS | 0.32 | 1.87 | 0.85 | 1.66 | 1.09 | 77.90 | 16.31 |
Table 3.
Correlation between available phosphorus and various forms of phosphorus in Hedley classification.
Table 3.
Correlation between available phosphorus and various forms of phosphorus in Hedley classification.
| H2O-Pi | NaHCO3-Pi | NaHCO3-Po | NaOH-Pi | NaOH-Po | HCL-Pi | R-P | |
|---|---|---|---|---|---|---|---|
| Pearson Correlation with AP | 0.805 | 0.954 | 0.560 | 0.949 | 0.878 | 0.534 | 0.442 |
| Sig. (2-tailed) | 0.000 | 0.000 | 0.000 | 0.000 | 0.000 | 0.000 | 0.002 |
Publisher’s Note: MDPI stays neutral with regard to jurisdictional claims in published maps and institutional affiliations. |
© 2022 by the authors. Licensee MDPI, Basel, Switzerland. This article is an open access article distributed under the terms and conditions of the Creative Commons Attribution (CC BY) license (https://creativecommons.org/licenses/by/4.0/).
Share and Cite
MDPI and ACS Style
Xie, W.; Yang, J.; Gao, S.; Yao, R.; Wang, X. The Effect and Influence Mechanism of Soil Salinity on Phosphorus Availability in Coastal Salt-Affected Soils. Water 2022, 14, 2804. https://doi.org/10.3390/w14182804
AMA Style
Xie W, Yang J, Gao S, Yao R, Wang X. The Effect and Influence Mechanism of Soil Salinity on Phosphorus Availability in Coastal Salt-Affected Soils. Water. 2022; 14(18):2804. https://doi.org/10.3390/w14182804
Chicago/Turabian StyleXie, Wenping, Jingsong Yang, Shan Gao, Rongjiang Yao, and Xiangping Wang. 2022. "The Effect and Influence Mechanism of Soil Salinity on Phosphorus Availability in Coastal Salt-Affected Soils" Water 14, no. 18: 2804. https://doi.org/10.3390/w14182804
Note that from the first issue of 2016, this journal uses article numbers instead of page numbers. See further details here.