


Impacts of Climate Change and Human Activities on Streamflow of Upper Yongding River Basin, North China

Key Laboratory of Agricultural Water Resources, Hebei Key Laboratory of Agricultural Water-Saving, Center for Agricultural Resources Research, Institute of Genetics and Developmental Biology, Chinese Academy of Sciences, Shijiazhuang 050021, China
*
Author to whom correspondence should be addressed.
Water 2022, 14(18), 2798; https://doi.org/10.3390/w14182798
Submission received: 8 August 2022
/
Revised: 1 September 2022
/
Accepted: 5 September 2022
/
Published: 8 September 2022
(This article belongs to the Topic Hydrology and Water Resources in Agriculture and Ecology)
Abstract
:Streamflow in semiarid areas, especially in North China, was rapidly decreasing, which made it important to analyze the characteristics and influencing factors of streamflow. Using the hydro-meteorological data series of 1961–2017 in the upper Yongding River Basin (UYRB) (including the Yang River Basin (YRB) and Sanggan River Basin (SRB)), spatio-temporal variation characteristics of air temperature, precipitation, and potential evapotranspiration (E0) were analyzed. The results showed that precipitation has no significant trend; the temperature showed a significant increase of 0.1–0.5 °C per decade; E0 showed a significant decrease of approximately −2 mm/10yr (in 18 stations); the estimated rates of streamflow change were −7 and −8 mm/10yr for SRB and YRB. As for spatial distribution, the YRB presented a higher E0 value than the SRB; the mountain areas had more precipitation than the plain areas. The change points of streamflow occurred in 1982 and 2003. Both the Budyko and the DMC methods were used to evaluate the impacts of climate change and human activities on the mean annual streamflow. In variation stage I (1983~2003), impacts of human activities account for 90.6% and 62.7% of the mean annual streamflow changes in YRB and SRB, respectively. In variation stage II (2004~2017), the percentages were 99.5% and 93.5%, respectively. It is also noted that the first change point in streamflow was indeed at the beginning of China’s land reform, when the farmers could manage their reallocated lands and, therefore, there was an increase in agricultural water consumption. The second change point coincided with “Capital Water Resources Planning”, including water conservation projects and irrigation district construction programs. In general, human activities were mainly responsible for the significant decline in the annual streamflow of UYRB. This paper will provide valuable results for water resources planning and give guidance on the construction of water conservation function areas and ecological environment support areas in the capital.

1. Introduction
Streamflow, a key link in the water cycle, is of great value to anthropogenic activities and ecosystems [1]. Additionally, it can directly meet social-economic demands as well as the needs of river ecosystems. Nevertheless, such water resources are facing various challenges due to overexploitation and climate change [2,3,4], leading to diverse variation patterns globally [5]. These phenomena are especially serious in semi-arid areas, and are becoming a pressing topic to be addressed [6]. Streamflow in semi-arid areas has higher spatial and temporal variability due to the complexity of rainfall [7]. Lots of researchers have found that the streamflow in semi-arid areas is more vulnerable to climate change and human activities [8,9]. Therefore, more attention needs to be focused on the semi-arid areas, so as to develop the regional economy and eco-environment in a sustainable way. This paper mainly focuses on the impacts of climate change and human activities on streamflow in the upper Yongding River Basin (UYRB), a semi-arid basin in North China.
Various methods have been applied to quantify the impacts of climate change and human activities on streamflow, which produce lots of valuable results [10,11]. Commonly used methods include hydrological modelling [8,12], conceptual approaches [13,14], analytical approaches [15], and methods based on hydrological observed data [16,17]. All methods mentioned above have advantages and disadvantages summarized by Dey and Mishra [10]. The method used in this paper is based on the Budyko hypothesis (called the Budyko method hereafter), a conceptual approach that describes the relationship between water evaporated and energy available at a basin scale. Additionally, several functions have been derived based on this hypothesis, from generic formulae to basin-specific ones. The Budyko method has a relatively simple structure, and fewer data is needed compared with the hydrological model, which has been applied to separate the influences of climate change from human activities at home and abroad in recent years [18,19]. One of the most popular formulae is Fu’s equation with one parameter, which is obtained by dimensional analysis and differential derivation [20]. This research will adopt Fu’s equation to analyze the drivers of streamflow change in the UYRB.
The Yongding River, one tributary of the Haihe River, is the mother river of Beijing, and plays a key role in the development of Beijing City [21]. Most of the catchment, however, is located in the UYRB controlled by Guanting Reservoir. The water scarcity in this area has become increasingly severe [22], and several relevant studies have been conducted in this area, which provide certain scientific guidance for improving water resource management. The study conducted by Ren et al. [23] reveals that the increasing amount of water taken from the river course is the direct cause leading to the observed streamflow decrease in the northern part of China. Yang et al. [24] inferred that the key factor leading to the streamflow decreasing in this area in the 1980s was agricultural water consumption. Xia et al. [25] applied a modelling method to the UYRB and found that climate change and human activities were estimated to account for 10.5–12.6% and 87.4–89.5% of the reduction in annual runoff, respectively, indicating that human activities are the main driving factors for the reduction in runoff. The results from Zeng et al. [26] indicate that the water resources in the UYRB will decrease in the early 21st century and increase in the middle of the 21st century, which will further intensify the water resources crisis. Mo et al. [27] conducted a similar study (data 1957–2010) through an elastic coefficient method, and the results showed that the streamflow change rate caused by climate change is 28% and 72% for human activities. However, Zhang’s results [28] (data 1957–2010) showed that climate change is the dominant influence factor with a contribution of 65.4%.
To sum up, the UYRB is experiencing a severe water shortage, which makes it a pressing topic to clarify the mechanism of the water cycle. In addition, the research mentioned above mainly focused on the period before 2012, and some views are contradictory. To provide guidance in the construction of water conservation function areas and in ecological environment support areas in the capital (two areas in the capital), it is essential to conduct further studies on the UYRB to clarify the hydrological mechanisms. The objectives of this paper, therefore, are (1) to assess the spatial and temporal variation of hydro-meteorological variables and (2) to quantify the impacts of climate change and human activities on streamflow in the UYRB.
2. Materials and Methods
2.1. Study Area
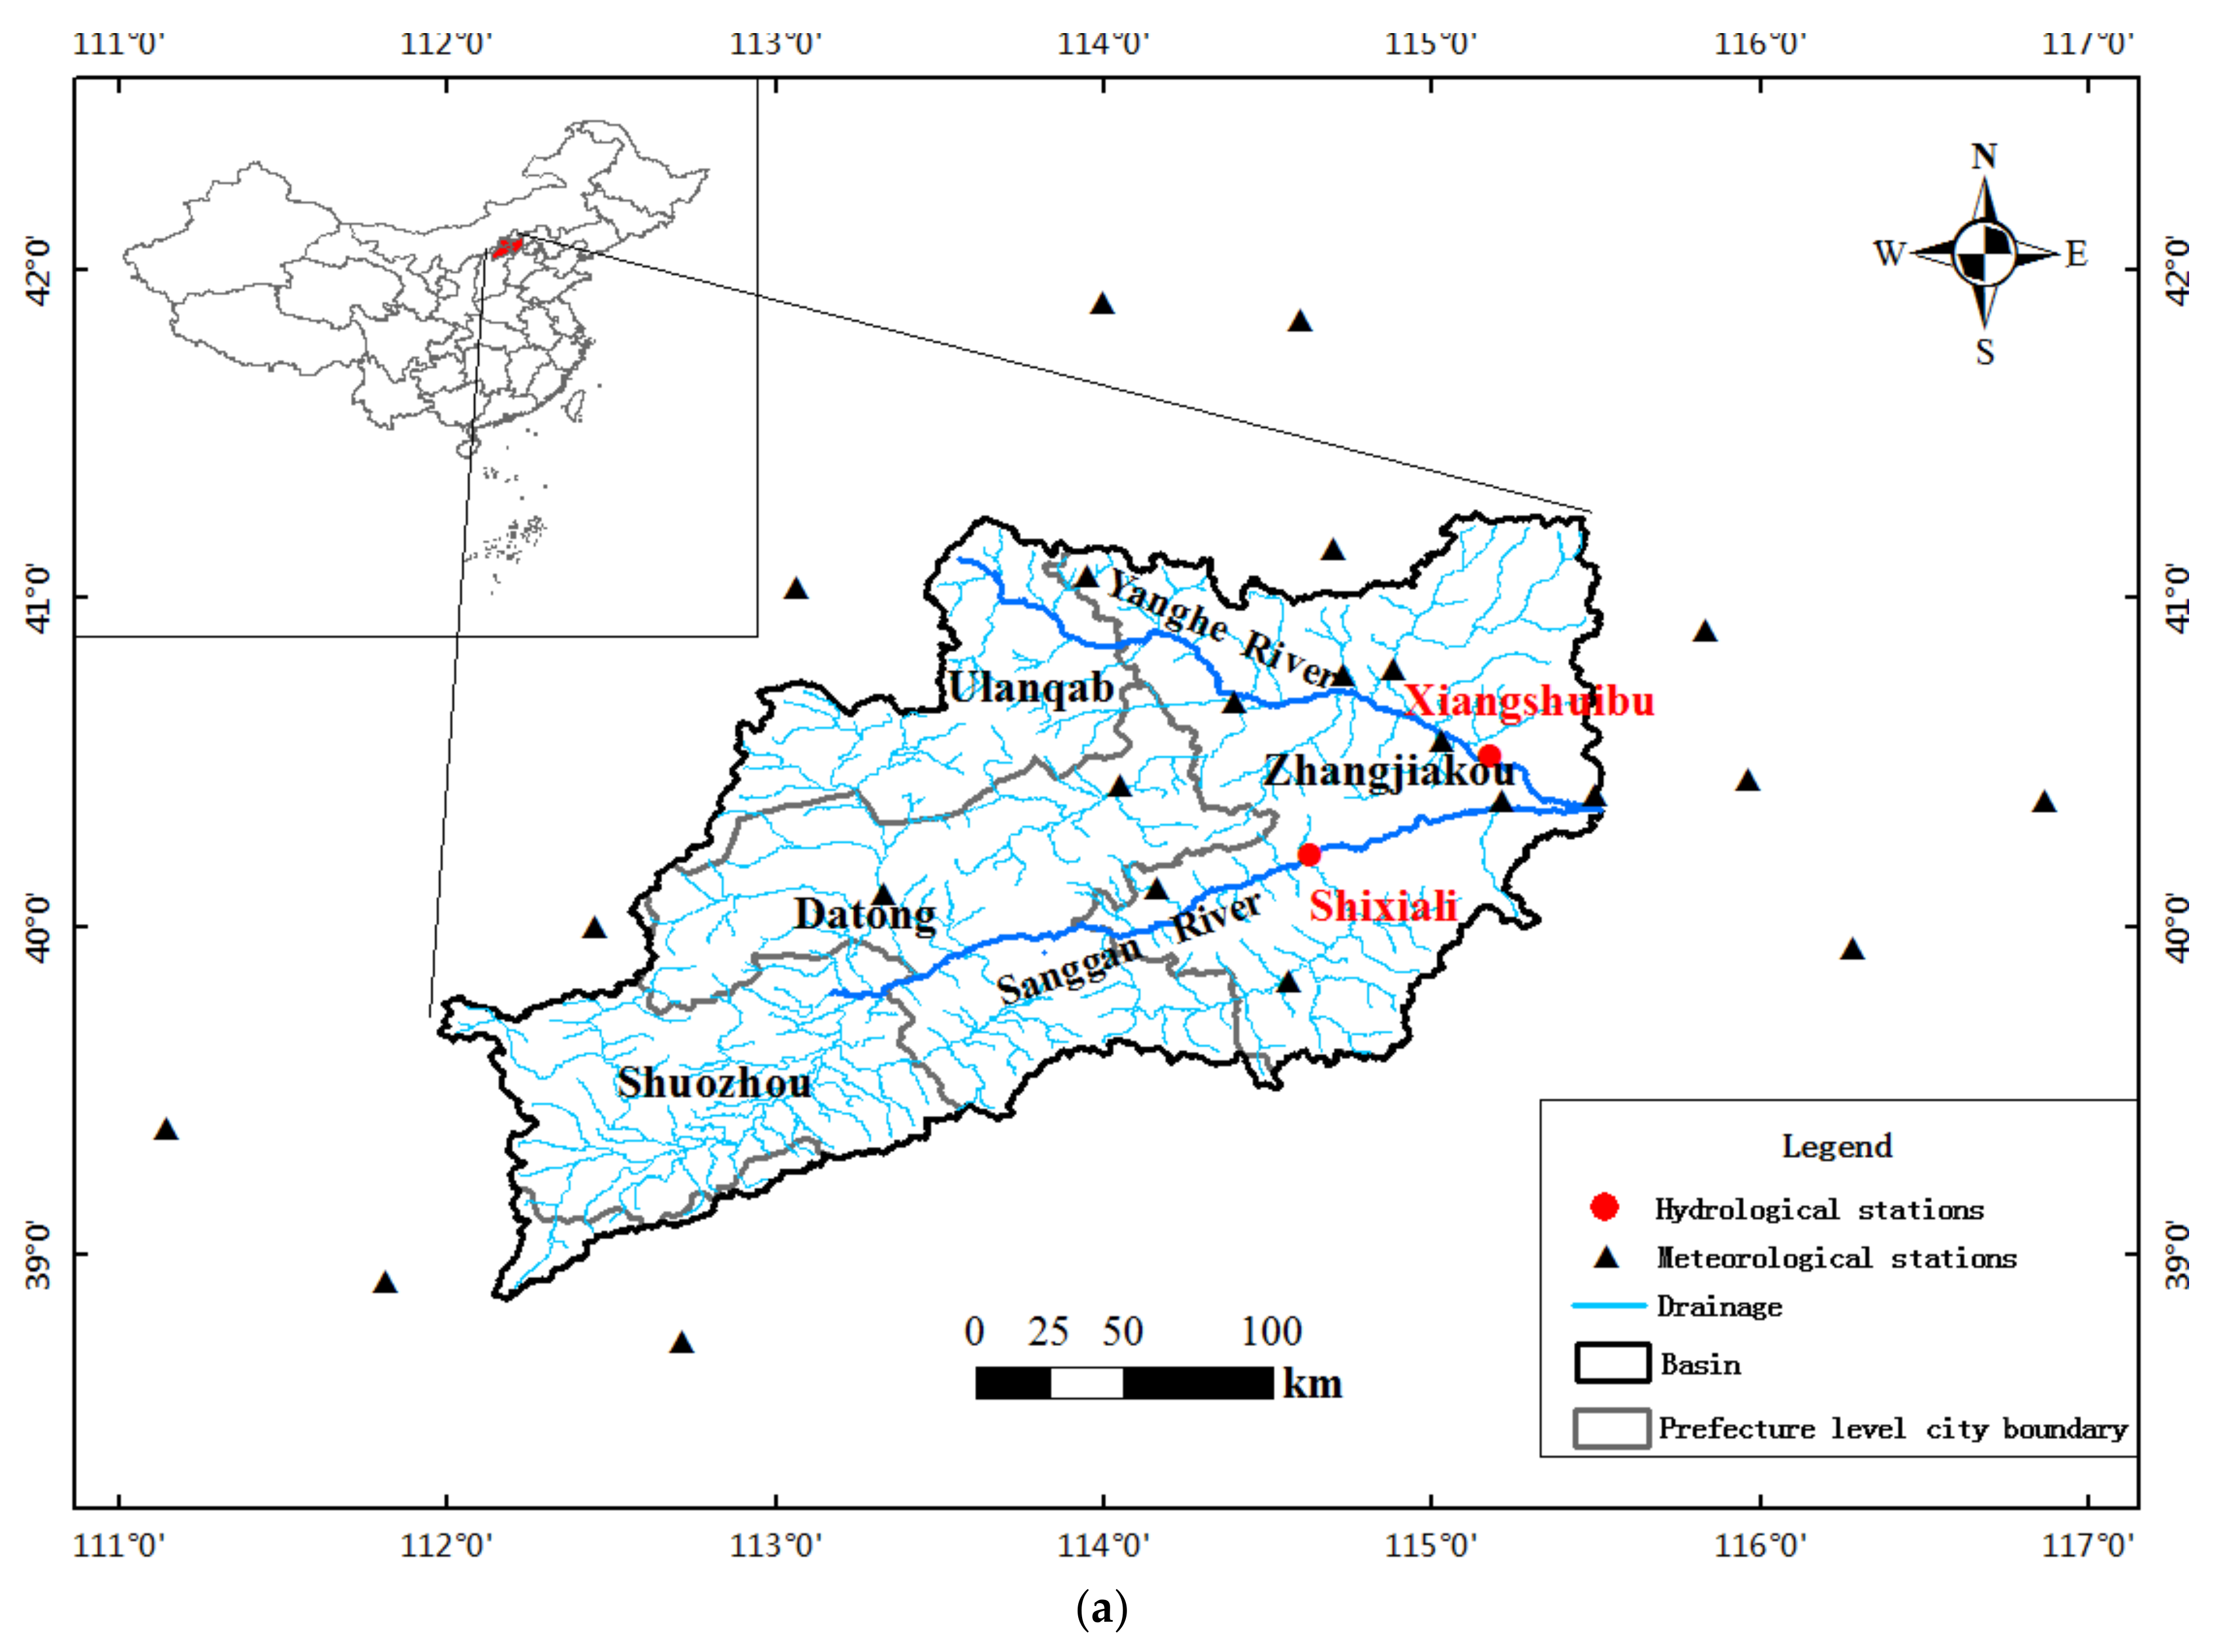
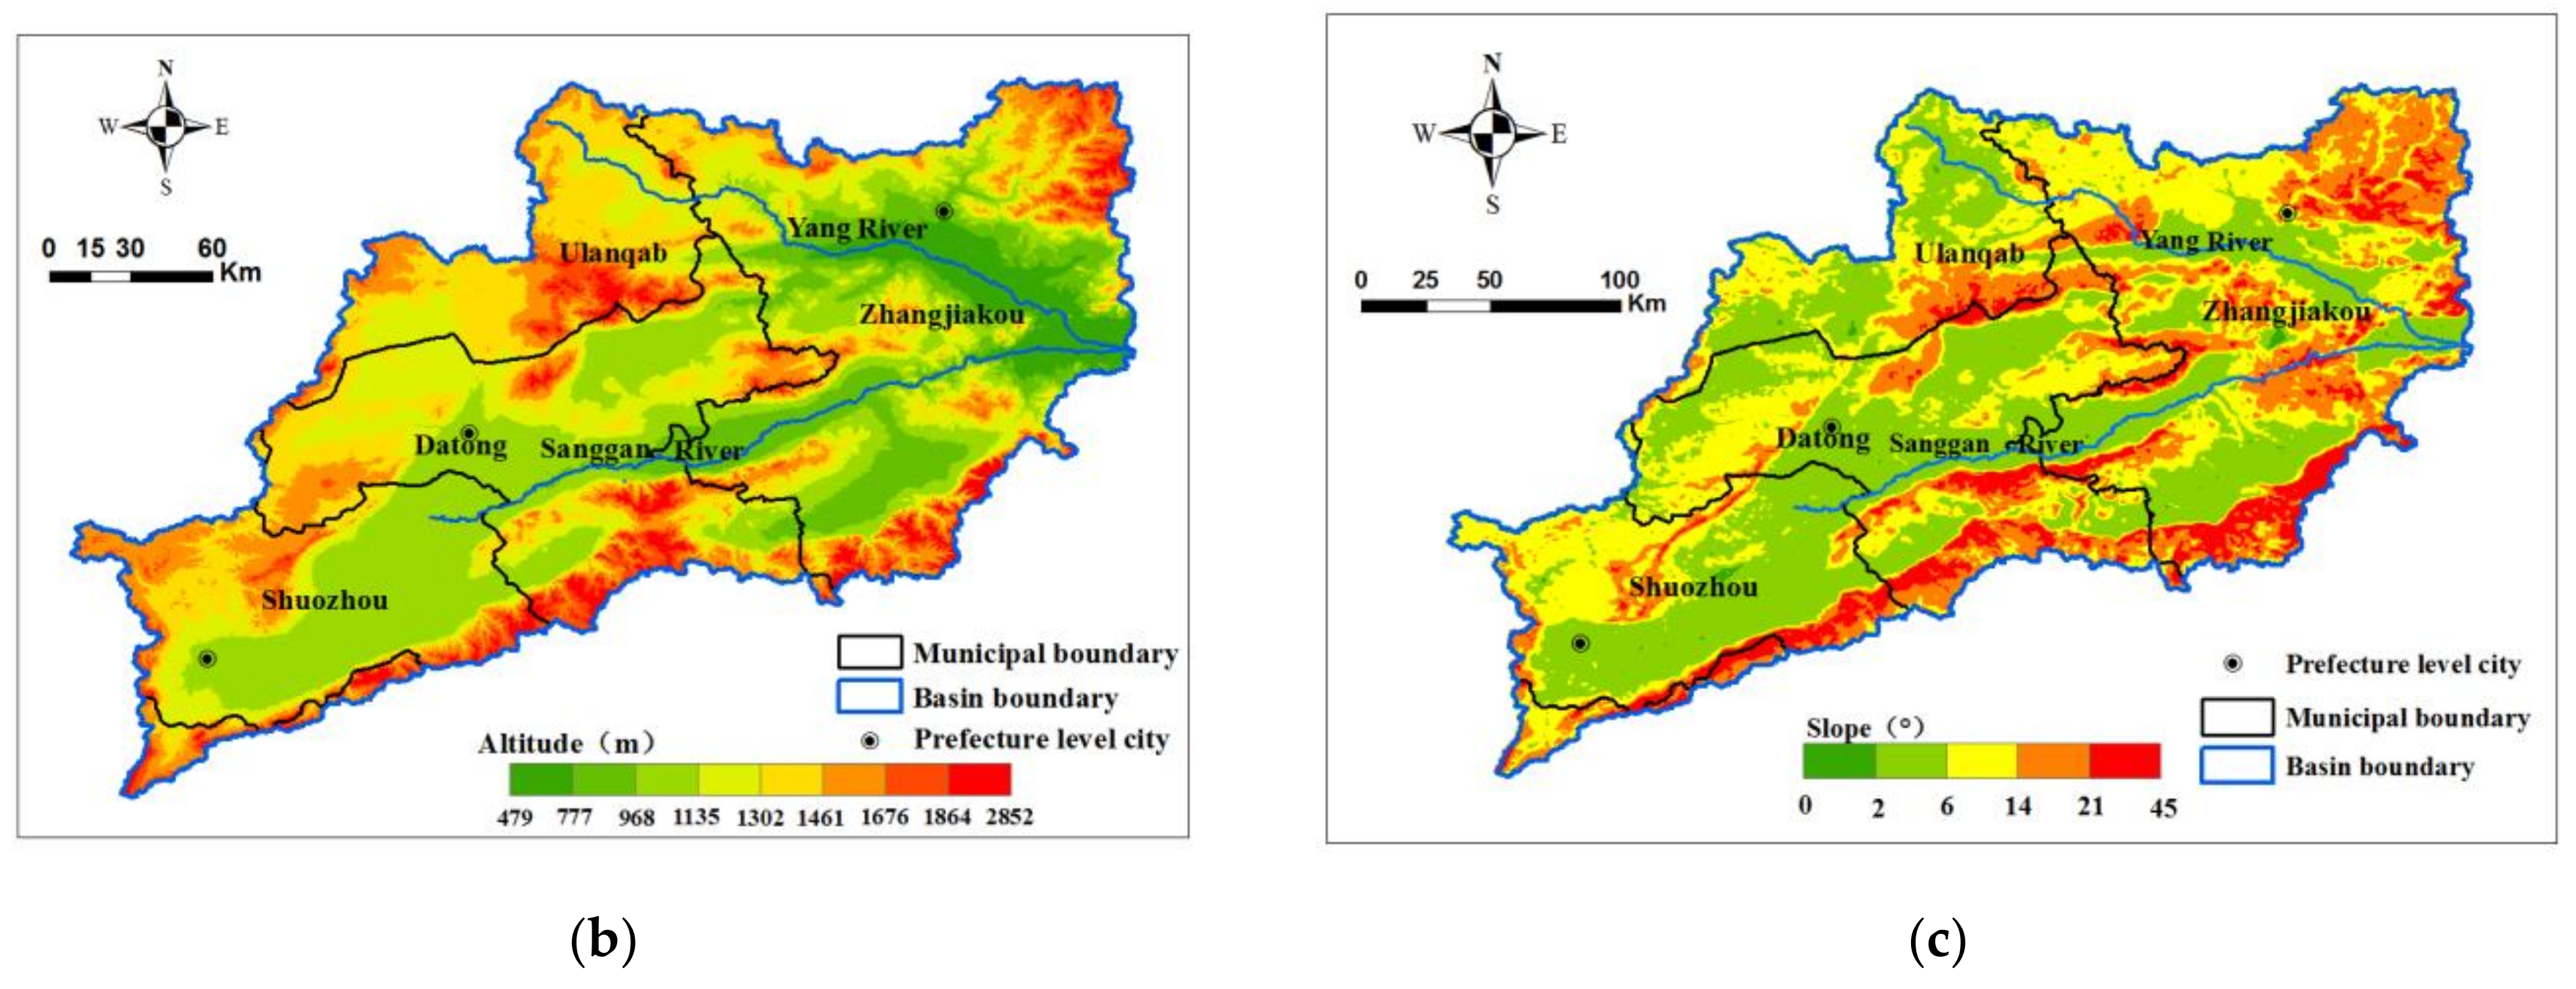
The UYRB, belonging to Haihe River Basin, covers part of Hebei Province, Shanxi province, and the inner Mongolia Autonomous Region, with a total area of ≈ 43,000 km2 and a population of ≈ 9.13 million (2017). The study area lies at an elevation of 479–2852 m above the mean sea level, stretching between longitudes 111°58′–116°22′ E and latitudes 38°50′–41°16′ N (Figure 1). Continental monsoon climate prevails in this area with cold dry winters and hot rainy summers. The annual average precipitation in the basin is 389 mm (1961–2017), approximately 75% falls in rainy months of June–September. Average annual temperature in the study area is 6.8 °C (1961–2017). Main land use/land cover types (2015) are farmland (≈42%), grassland (≈29%), and forest (≈10%), and the forests consist mainly of deciduous broad-leaved forests. Maize is the dominant cultivated crop in the single-crop rotation system in the study area. Rainfall is often unable to meet crop water demand so that irrigated lands are increasingly reliant on groundwater pumping and river water. Hence, as the largest water user, agricultural water consumption has a significant impact on the streamflow. There are two sub-basins in the UYRB, named Yang River Basin (YRB) controlled by Xiangshuibu station and Sanggan River Basin (SRB) controlled by Shixiali station (See Table 1 in detail). This paper will focus on this two sub-basins.
2.2. Data
Data of 23 meteorological stations from China Meteorological Administration (Figure 1) were selected (among them, 11 within the UYRB and 12 surround it), during 1961–2017 for this study, including mean daily temperature, precipitation, mean relative humidity, mean wind speed, and sunshine duration. Then Penman–Monteith equation was applied to obtain potential evapotranspiration using meteorological data [29]. Kriging interpolation was applied to obtain the spatial distribution of hydro-meteorological variables and the average annual values of the study area were calculated by processing the average grid values. Daily streamflow data were collected for the same period from two hydrological gauge stations situated at the outlets of the YRB and SRB, then, were used to calculate the annual streamflow. The DEM data with a resolution of 30m from ASTER GDEM was used.
2.3. Methods
2.3.1. Trend Detection
The nonparametric Mann–Kendall (M–K) test was applied to detect trends in the hydro-climatic time series [30,31]. For the given time series X(x1, x2, ..., xn), the statistic S is defined as:
Its variance is as follows:
The standardized statistic is:
The null hypothesis of no trend is rejected if |Z| > 1.96 at a 5% significance level. If the Z value is positive then an upward trend exists, otherwise this indicates a downward trend.
2.3.2. Change Point Detection
The double mass curve (DMC) is a simple statistical method to detect the change point of a hydro-meteorological data series [32]. The procedure of plotting the graph with two variable series is as follows. Given the observed variable series Xi and Yj, the cumulative amount is calculated:
where Xi represents precipitation, and Yj represents streamflow. Then, plot the curve with Xi and Yj series on the graph. Finally, the change point can be determined by the slope change in the curve. In order to accurately determine the abrupt change time, this paper also takes into account the field survey data and existing research, making the abrupt change points closer to reality. Therefore, the study period can be divided into baseline and changed period.
2.3.3. Budyko Method
The Budyko assumption describes the water-energy coupling balance in a comparatively long-term scale [33], to put it simply, the water evaporated in a watershed can be expressed as the function of the climate dryness index. The calculation procedures of the Budyko method are as follows:
The basin-scale water balance can be shown as follows:
where Q is the streamflow depth (mm), P is precipitation (mm), Ea is the actual evapotranspiration (mm), and ΔS is the water storage changes in the basin (mm). According to the Budyko hypothesis, ΔS is assumed to be zero over a comparatively long period. The actual evapotranspiration is computed by Fu’s equation [20]:
where φ = E0/P is the climate dryness index, E0 is potential evapotranspiration calculated by the Penman–Monteith equation following the procedure outlined in FAO-56 [20]. α is a model parameter fitted by long-term observed data. As one form of the Budyko theoretical framework. Fu’s equation has been widely used to model long-term basin-scale water balance [18,34]. A detailed description of Fu’s equation is available in [35].
Ea = PF(ϕ)
F(φ) = 1+φ−1 + ϕα)1/α
The change of average annual streamflow between baseline and changed period is calculated as:
where represents the change in average annual streamflow; and are average annual streamflow during the baseline period and changed period, respectively. The baseline period has no significant human activities, while the changed period is associated with significant human activities.
The total change in the observed mean annual streamflow ΔRtotal can be decomposed into climate variability ΔRclima and human activities ΔRhuman,
Precipitation and E0 directly determine streamflow in the descriptions of Fu’s equation. Therefore, the impact of climate change on streamflow can be calculated by the following formula:
where ΔP and ΔE0 are the changes in precipitation and E0, respectively. Addditionally, the partial differential expression in Equation (11) can be derived by the combination of Equations (6)–(8), the results are expressed as:
2.3.4. Determination of the Parameter α in Fu’s Equation
In Budyko’s original hypothesis, the Budyko curve was regarded as ‘‘universal’’ for comparatively large basins on a long-term scale, which cannot be applied to small watersheds or watersheds with intensive impacts from human activities. Then, the Fu’s equation, one of the most popular Budyko equations, with one parameter, was proposed: each basin has a distinct relationship between precipitation (P), potential evaporation (E0), and actual evapotranspiration (Ea) on a comparatively long-term scale. The parameter α of Fu’s equation represents the integrated effects of catchment attributes (such as climate, vegetation cover, soil properties, and catchment topography) and human activities [35,36]. That is to say, the curve shape parameter α controls how much of the available water will be evaporated given the available energy. The relationship indicates that two factors limit the evapotranspiration: the water supply, when φ > 1, and the energy supply, when φ < 1. α can be estimated by minimizing the difference between water-balance-based Ea (P−Q) and simulated Ea with Fu’s equation. The parameter α obtained through this method is also called the “basin-specific α” [34]. Consequently, the ‘‘basin-specific’’ value α will provide a good basis for applying Fu’s equation.
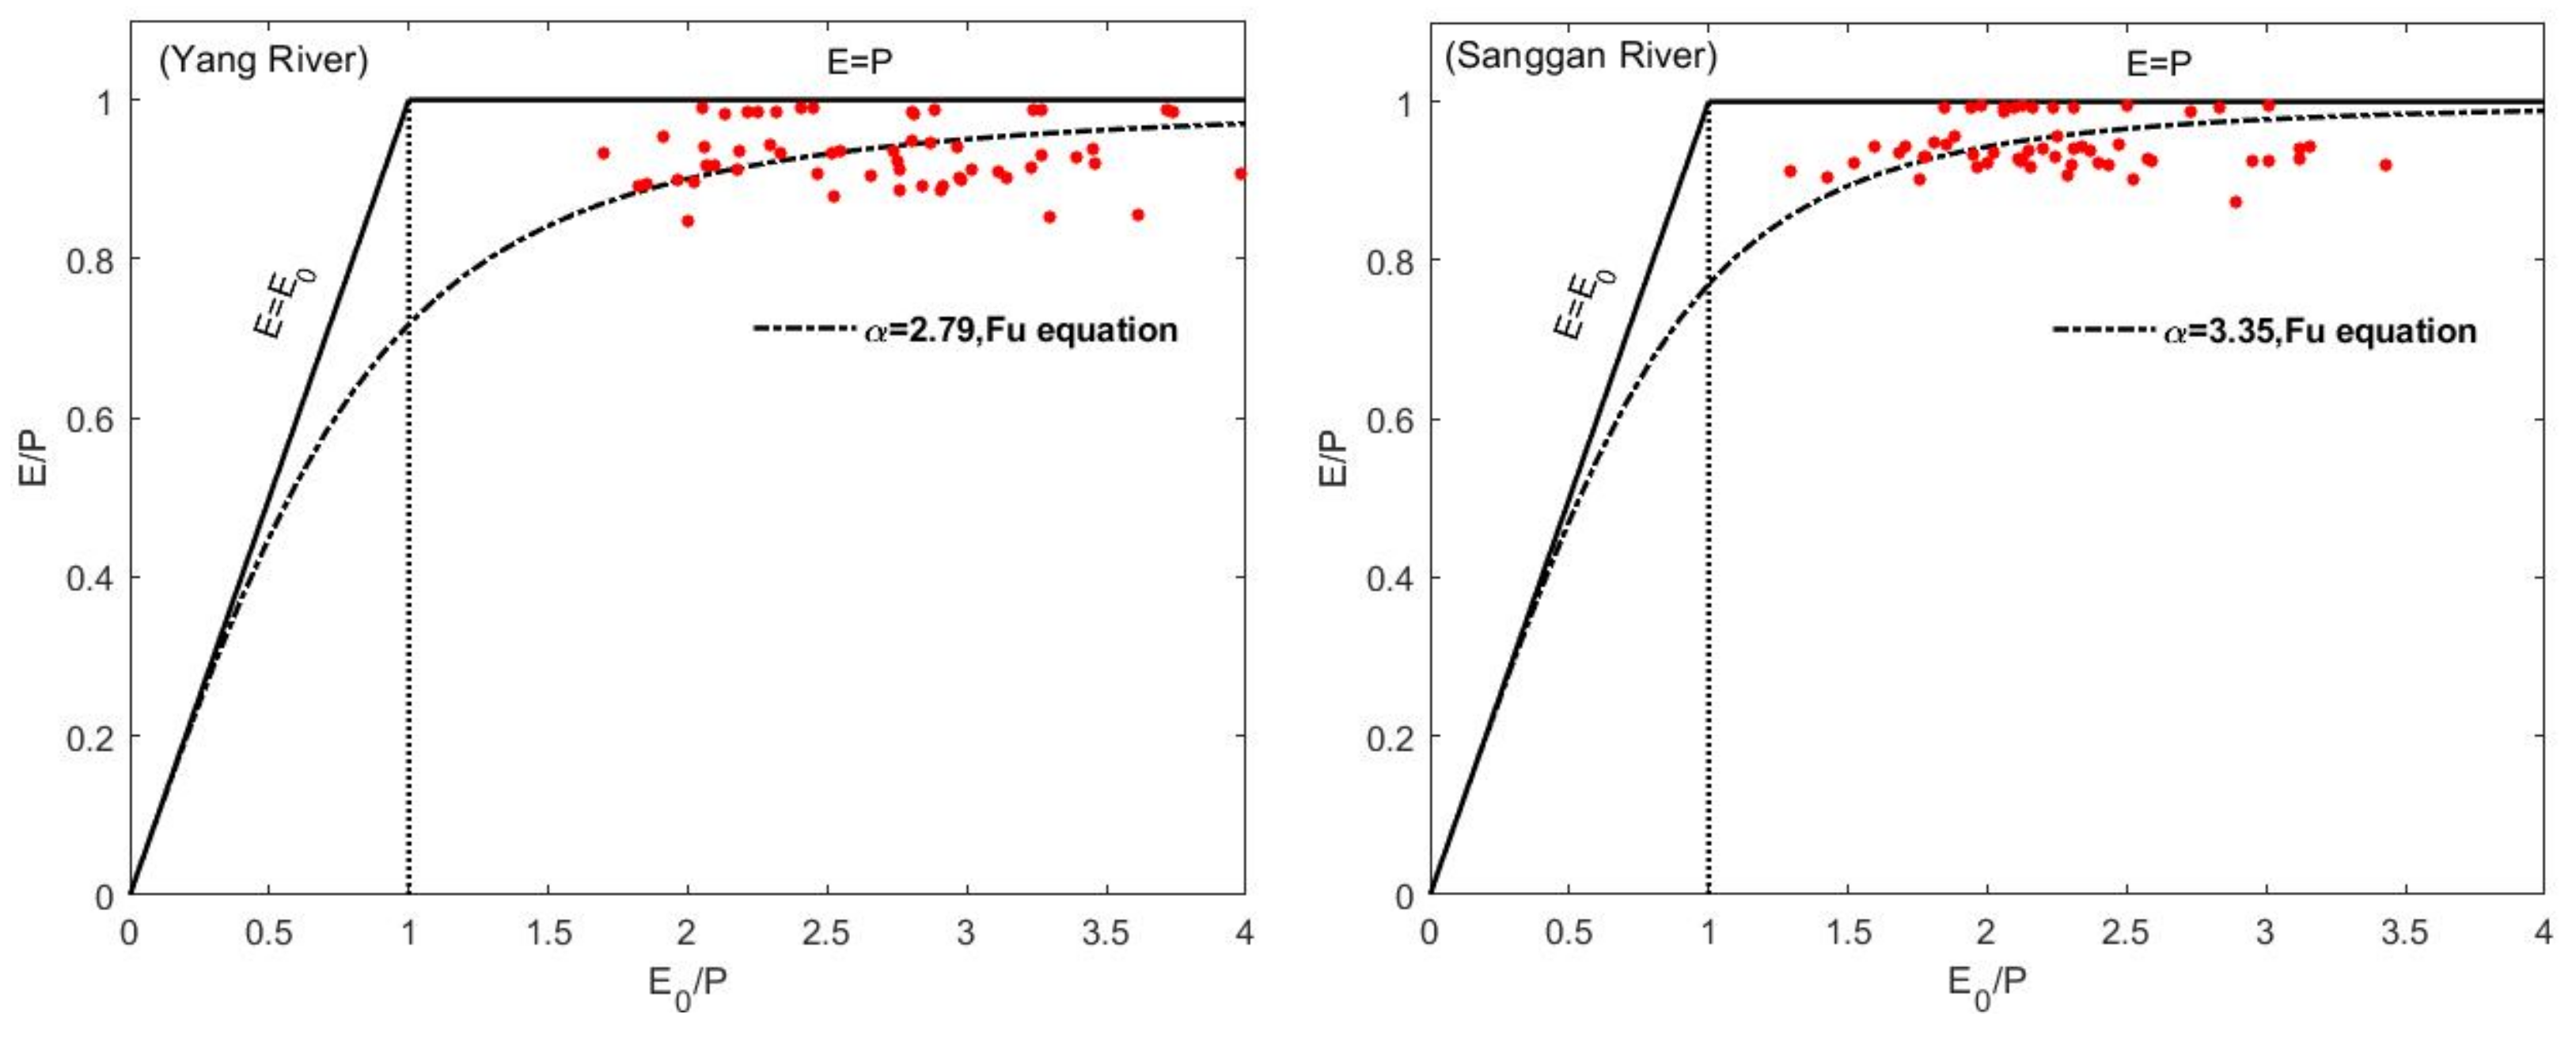
In this study, the parameter α was fitted through the annual observation data series (Figure 2), and the parameter α is 2.79 and 3.35 for YRB and SRB, respectively. A larger α indicates less water yield capacity for a basin given sufficient energy. Obviously, the water yield capacity of YRB is larger than SRB, in other words, there will be more streamflow in YRB given the same amount of precipitation. For both sub-basins, all annual dryness indices (φ = ET0/P) are greater than one, that is to say, the limiting factor to evapotranspiration is water supply.
2.3.5. Assessing the Impacts of Climate Change and Human Activities on Streamflow by the DMC Method
Previous studies have demonstrated that the predominant climate factor to control the streamflow is precipitation in a closed watershed. Therefore, the DMC method, involving two variable series, can determine the impacts of climate change and human activities on streamflow [37]. The calculation procedure of the DMC method is as follows.
R and P are annual streamflow and precipitation (mm), respectively, in the baseline period; k is slope and b is intercept.
where δhi and δci are streamflow depth variation caused by human activities and climate change, respectively (mm), Qg represents the contribution rate (%) of human activities and climate change to streamflow reduction. R2m represents measured values in the variation period. R2c represents calculated values in the variation period. R1m represents measured values in the baseline period.
δhi = R2m − R2c
δci = R2c − R1m
Qg = (δhi or δci)/Rd
3. Results
3.1. Spatio-Temporal Variation Characteristics of Hydro-Meteorological Factors
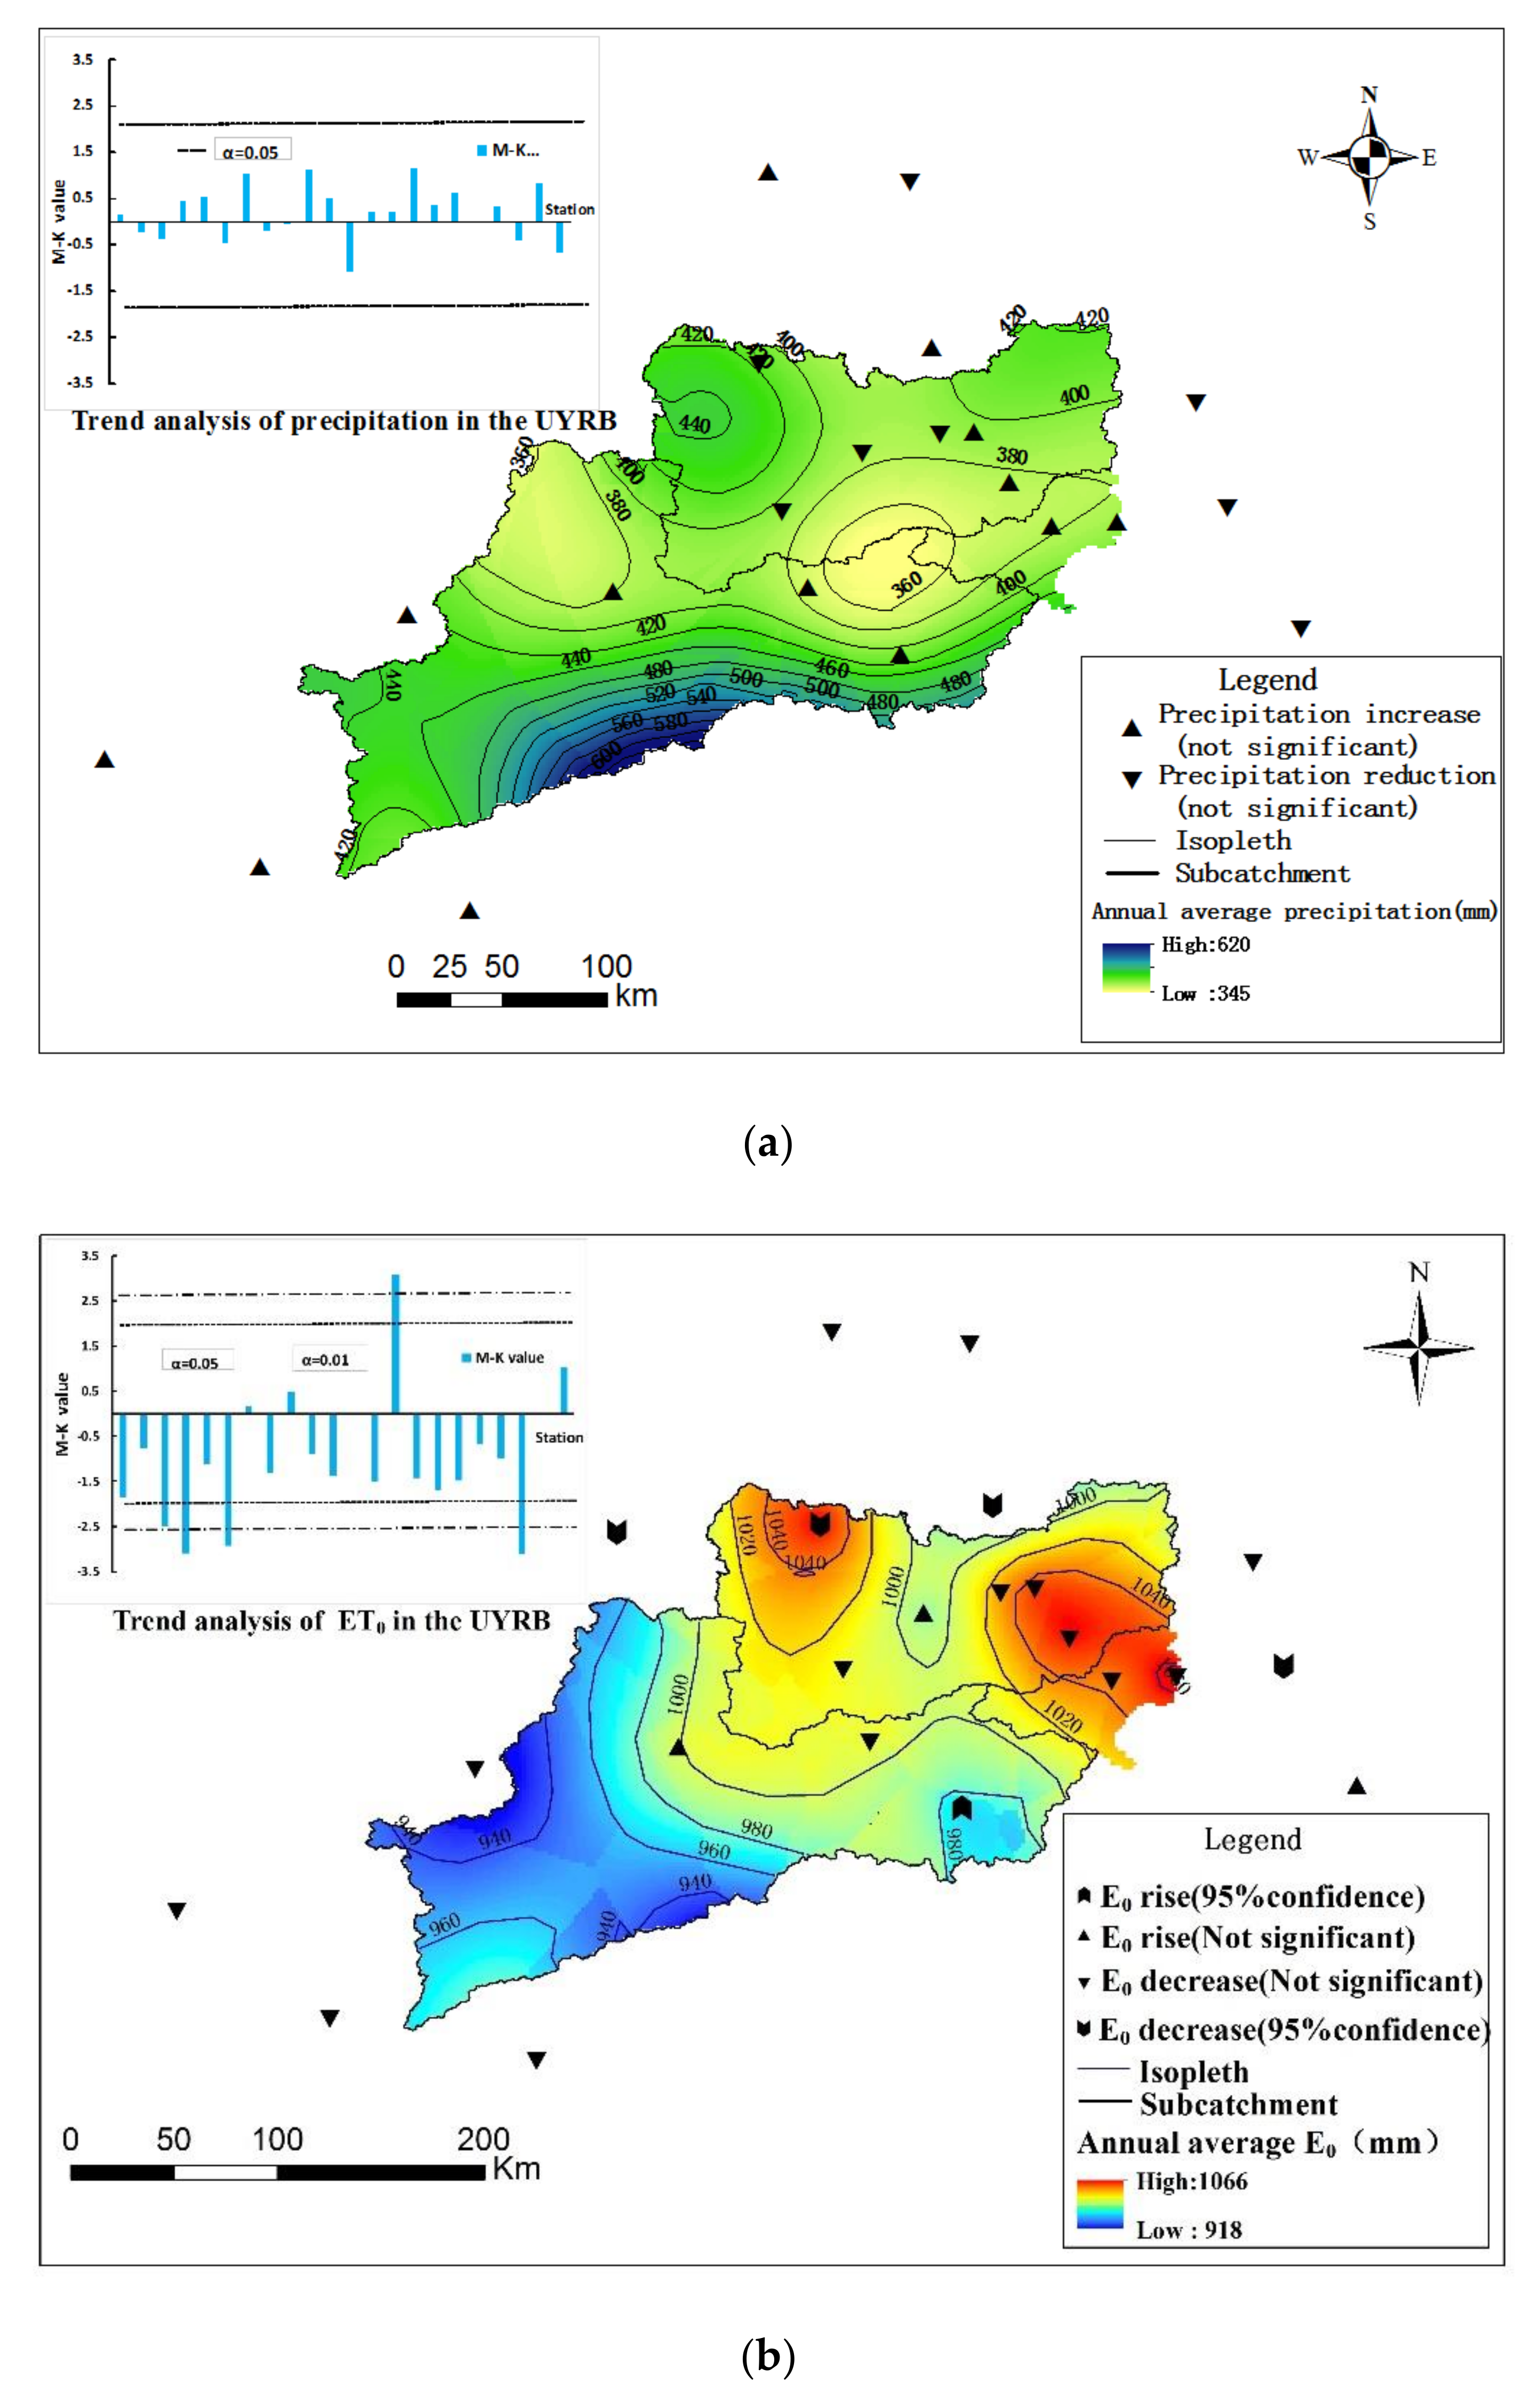
The average annual precipitation (for each station) for the UYRB is 319–554 mm and has no significant trend during 1961–2017, as shown in Figure 3a. The Z value of the M–K test shows positive values at 14 stations and negative values at 9 stations, which are not significant at the 5% level. Combining Figure 1b and Figure 3a, we found that precipitation and altitude have roughly similar distribution patterns, which means the mountain area has more precipitation and the plain area has less. Meanwhile, the temperature at 22 stations increased by 0.1–0.5 °C per decade (obtained by linear regression, not shown in this study), which is related to the tendency of global warming.
The annual average E0 values (for each station during 1961–2017) ranged from 702 to 1112 mm/yr and have a negative trend at 18 stations, which decreased approximately −2 mm/10yr over the study period (Figure 3b). This phenomenon is consistent with the global evaporation paradox [38,39], which may be caused by several climatic variables. The measured data witnessed a significant reduction in wind speed, which may have caused the decline in the E0 value. The data on wind are not shown in this work. From the perspective of spatial distribution, the northern part of the UYRB presents a higher E0 value, while the southern part is relatively low.
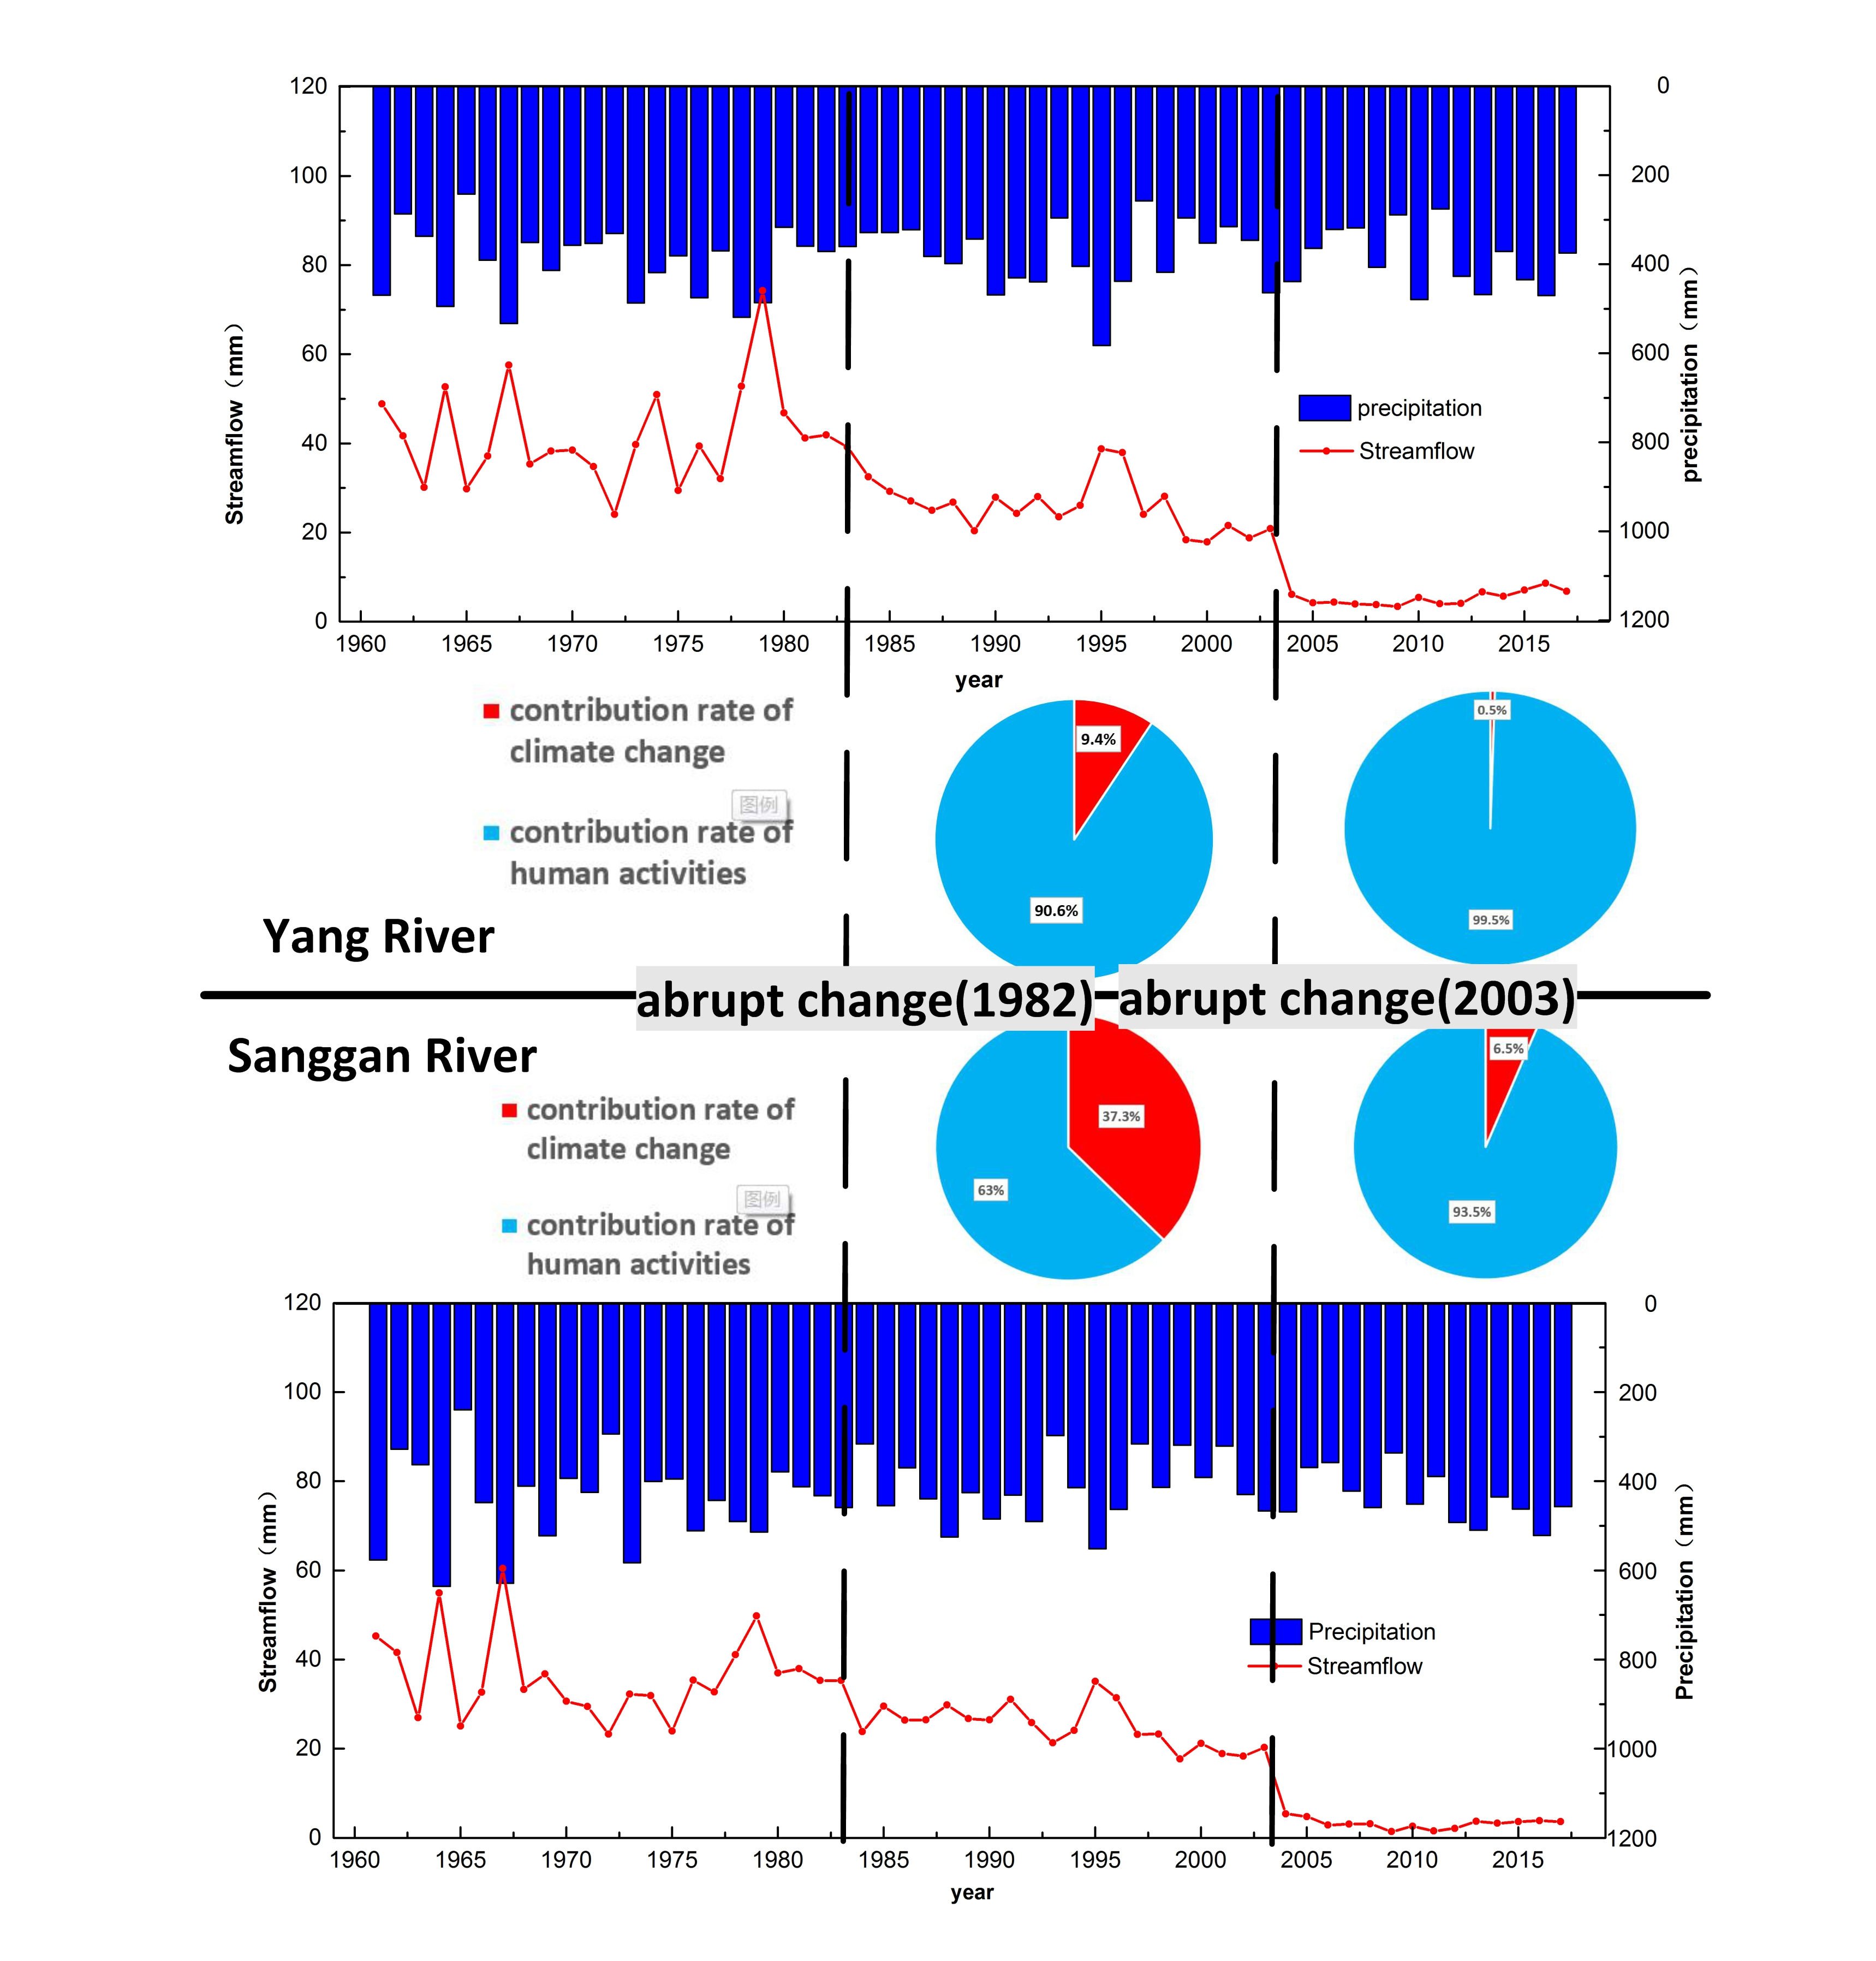
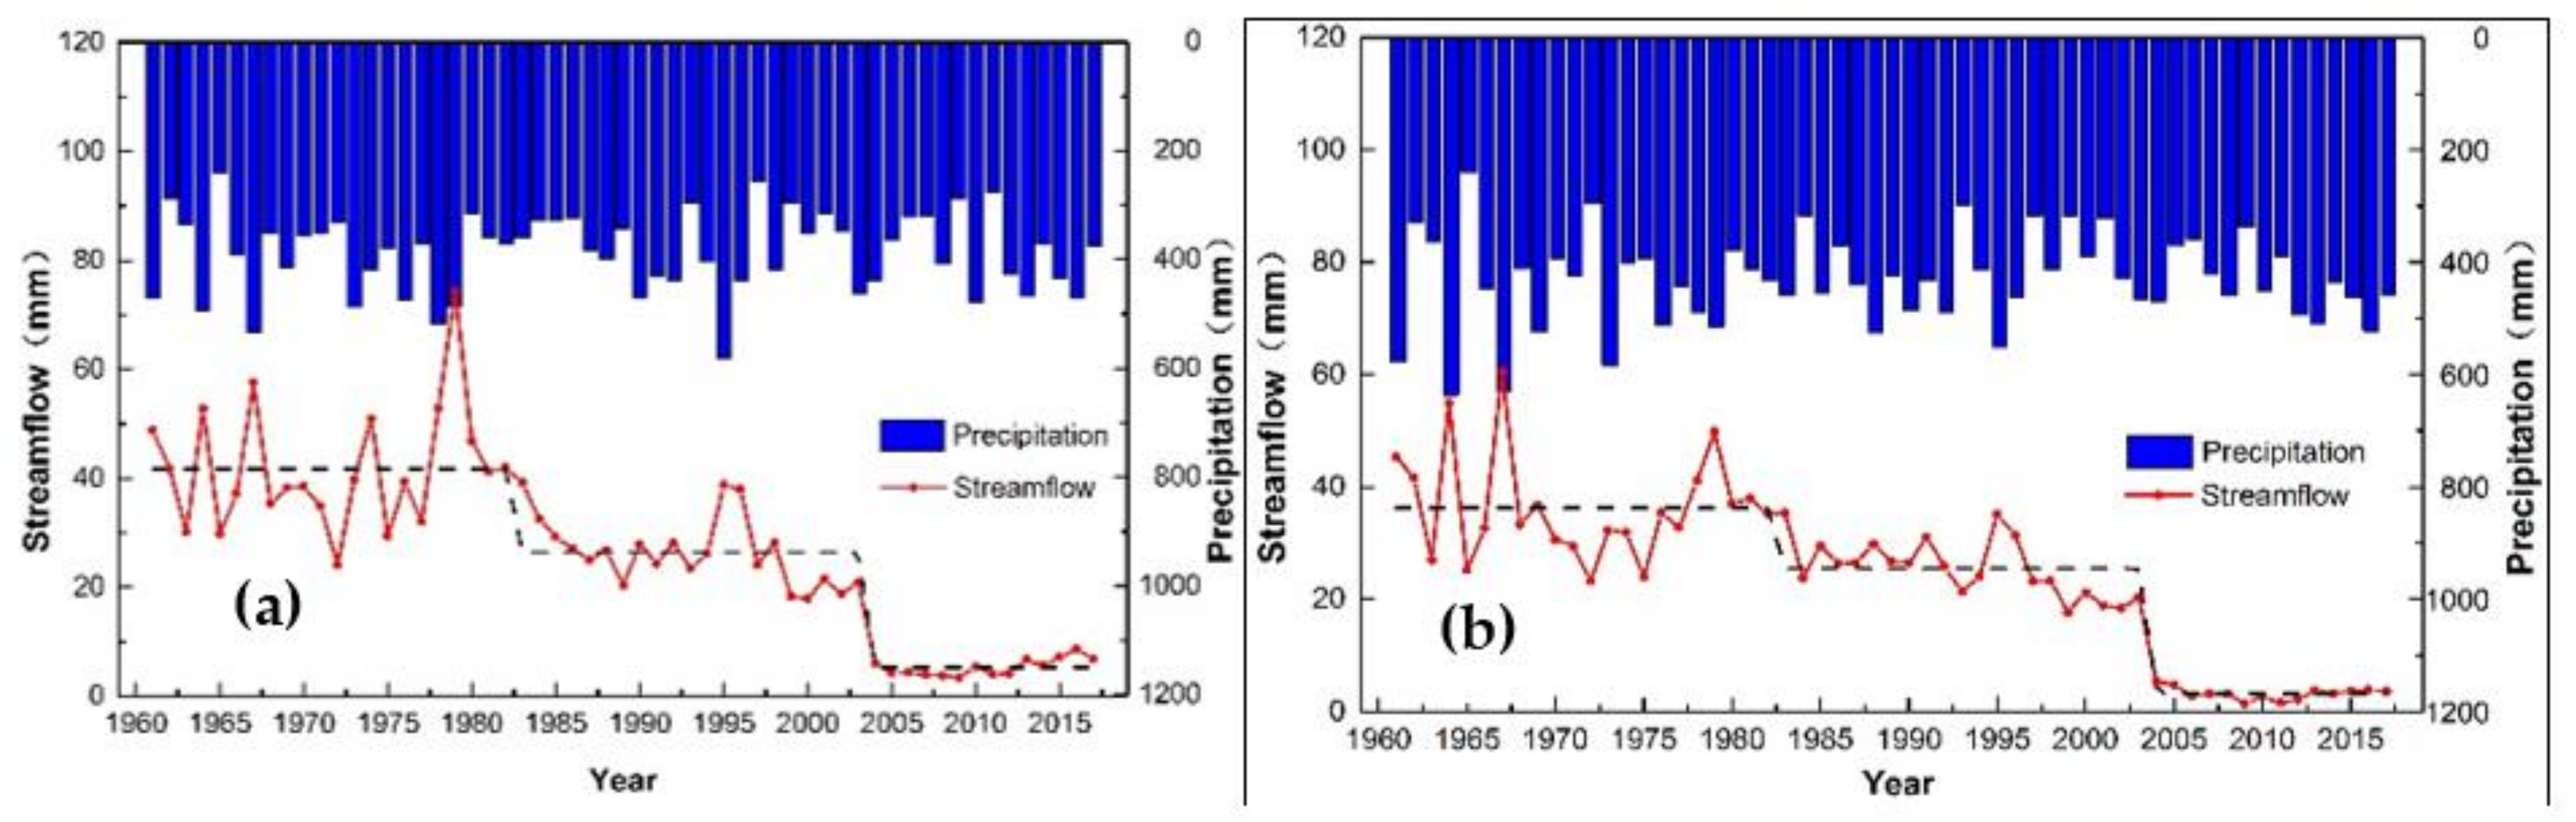
In this study, characteristics of annual streamflow at two hydrological stations (Shixiali and Xiangshuibu) are described during the period 1961–2017 (Figure 4). The linear regression analysis shows a significant decline in annual streamflow for YRB and SRB (not shown in this work). The estimated rates of change are −7 and −8 mm/10yr for Shixiali and Xiangshuibu, respectively, from 1961 to 2017. From the 1960s to the 1980s, streamflow declined by 20.01% and 22.28% for Xiangshuibu and Shixiali, respectively, and from the 1980s to the 2000s, the percentage was 68.23% and 67.77%, respectively. As Figure 4 shows, the streamflow of both sub-basins decreased rapidly during 1961–2017, which can be obviously divided into three stages. It is worth noting that the first decline appeared approximately in 1985, and the second decline appeared approximately in 2003.
3.2. Abrupt Changes in Streamflow
As just described, the study period can be divided into three stages. In order to determine the change points more precisely, the method of DMC was applied to examine the change points in annual streamflow at two sub-basins (Figure 5). According to the slope change in the curve, the first abrupt changes of these two sub-basins most likely occurred in the early 1980s; this pattern can be largely attributed to the increased agricultural water consumption [40]. The second abrupt change in the annual streamflow occurred approximately in 2003, where the curve slope changes significantly. This change predominantly resulted from the “Capital water resources planning”, which includes large-scale soil and water conservation practices and irrigation district construction. In general, the first change point occurred approximately in 1980. To further prove this claim, we organized a two-week field survey in the UYRB, obtaining the details of water consumption during 1961–2017. We found that it was in 1982 that the household contract responsibility system was implemented in the study area, and the ‘Capital Water Resources Planning’ was mainly constructed in 2003. Such findings were consistent with the analysis above, therefore, the study period for both sub-basins can be divided into three periods: the baseline period (1961–1982), the variation stage I (1983–2003), and the variation stage II (2004–2017). Previous studies often divided the period into two stages [25,40,41] with one change point. However, we obtained two change points as mentioned above, and the first change point in this paper is roughly consistent with previous studies. Division of study period may be a little subjectivity in our study, nevertheless, the results conform to the region’s reality.
3.3. Effects of Climate Change and Human Activities on Streamflow
The streamflow at the two sub-basins decreased rapidly from 1961–2017, when the streamflow of YRB decreased by 36% (stage I) and 87% (stage II), respectively, compared with the baseline period. Additionally, the percentages for SRB are 30% (stage I) and 91% (stage II). Human activities account for most of this reduction in the mean annual streamflow for both sub-basins (Table 2). In the variation stage I, human activities contribute 90.6% and 62.7% of the mean annual streamflow change in the YRB and SRB, respectively. In the variation stage II, the percentages were 99.5% and 93.5%. This means that the impact of human activities on streamflow increased during the whole period of the UYRB. In general, the contribution rate of human activities to the streamflow of the Yang River is higher than that of the Sanggan River. The impact of climate change on streamflow in the study area is relatively small, which indicates intensive human activities, e.g., agricultural water consumption.
4. Discussion
4.1. Impacts of Climate Change and Human Activities on Streamflow by the DMC Method
To further clarify the causes of streamflow variation, the DMC method was applied to show the correlation between cumulative annual streamflow and precipitation (Figure 5). In general, the predominant climate variable impacting the streamflow is precipitation, thus, the DMC was roughly a straight line given that streamflow was mainly influenced by climate [42]. As mentioned above, there are slope changes in the DMCs, suggesting that the relationship between streamflow and precipitation was altered by human activities. The results estimated by the DMC method are shown in Table 3, which are roughly consistent with the results of the Budyko method, except for a slight difference.
By comparing the results of the two methods, it is obvious that the major climate variable impacting the streamflow is precipitation. The minor differences between the two methods cannot be clarified because the Budyko method describes a nonlinear relationship between the streamflow and climate variables. It is hard to know how many variables are affecting the streamflow. It is also hard to determine the main variable. In any case, the results obtained with the Budyko method are convincing, with a combination of quantitative and qualitative descriptions.
The results in this paper are roughly consistent with Mo et al. [27] (data from 1957–2010), who found that the abrupt change point of the streamflow series occurred in 1983 and human activities were responsible for 72% of the total reduction in mean annual streamflow in the UYRB. The difference may be due to the method adopted and the length of the data series. Hou [43] also obtained a similar result, that human activities account for 80% of the streamflow change with the Budyko method. However, Zhang et al. [28] found that climate change is the major factor influencing the streamflow in the UYRB, which is mainly due to the data series applied (during 1957–2000).
4.2. Impacts of Human Activities on Streamflow in the UYRB
In 1978, the land reform policy was enacted in China, since then, farmers have been progressively managing their own lands [44]. According to the field survey, it was in 1982 that the implementation of this policy in the UYRB led to a rapid increase in agricultural water consumption. The rapid development of the economy also led to the rapid increase in industrial and domestic water use, which further aggravated the reduction in streamflow [41,43]. The “Capital water resources planning” was started in 2002, and it was completed in 2003. The accumulated area of soil and water loss control in the study area is 1841 km2, and the engineering measures, such as fish scale pit, horizontal ditch, and check dam, play an important role [45]. In addition, forest and grass measures have been extensively taken, and a large number of irrigation areas have been built [46]. According to the field survey, flood irrigation is widely used on farmland in the YRB and SRB, up to 600~800 m3/mu/year, which greatly reduces the streamflow. On the other hand, the climate dryness index (φ = E0/P) increased from 2.627 (baseline period) to 2.648 (variation stage I) and 2.635 (variation stage II) in the YRB, indicating a trend towards a drier climate. The SRB is in the same situation, the value ranges from 2.105 to 2.218 and 2.188. This means that the impact of climate change is increasing, however, covered up by the impacts of strong human activities. Beyond question, human activities are the main driving factor of declining streamflow in the study area, more specifically, agricultural water consumption is the major role in the influence factors of streamflow. Beijing, the capital of China, began to carry out systematic management of the UYRB in 2019, to restore water conservation and ecological environmental support functions. This study can provide a valuable scientific basis for the systematic planning of the UYRB.
5. Conclusions
This study examines the spatial distribution and temporal variation of precipitation, potential evapotranspiration (E0), temperature, and streamflow using data series from 1961 to 2017 in the UYRB. The impacts of climate change and human activities were investigated, and possible causes of the streamflow changes were analyzed. The conclusion of this study can be summarized as follows:
The results from the M–K test show that a general decrease in the annual E0 (approximately −2 mm/10yr at 18 stations) and a rising temperature trend (0.1–0.5 °C per decade at 22 stations) have been detected. Nevertheless, the precipitation has no significant trend. The average annual streamflow shows a significant decrease at both YRB and SRB. From the perspective of spatial distribution, the northern part of the UYRB presents a higher E0 value, while the southern part is relatively low. Additionally, mountain areas have more precipitation than plain areas. Abrupt changes in streamflow occurred in 1982 and 2003, which may be mainly caused by the implementation of land reform policy and “Capital water resources planning”.
The impacts of climate change and human activities on streamflow were analyzed. Additionally, consistent results were obtained from both the Budyko method and the DMC method, in spite of a slight discrepancy between the two methods. Generally, the major climate variables impacting the streamflow are precipitation and human activities, where human activities accounted for most of the streamflow changes in the YRB (>78%) and SRB (>62%). The adoption of the household contract responsibility system in 1982 altered the natural streamflow regimes and led to a significant decrease in streamflow. The “Capital water resources planning” further led to a rapid reduction in streamflow circa 2003. All in all, human activities, such as agricultural irrigation (mainly flood irrigation), soil and water conservation measures, and the construction of water control projects seem to be the major causes in the significant decline in the annual streamflow in the UYRB.
Author Contributions
Conceptualization, Y.S. and L.D.; methodology, L.D.; software, Y.G.; validation, Y.-J.S., Y.Q. and Y.G.; formal analysis, Y.S.; investigation, L.D.; resources, Y.Q.; data curation, Y.G.; writing—original draft preparation, L.D.; writing—review and editing, L.D.; visualization, L.D.; supervision, Y.S.; project administration, Y.Q.; funding acquisition, Y.-J.S. All authors have read and agreed to the published version of the manuscript.
Funding
This study was supported by the Hebei Provincial Key R&D Programme (No. 22377001D), the Natural Science Foundation of Hebei Province — China (No. D2021503001) and the pioneer “Hundred Talents Program” of Chinese Academy of Science.
Data Availability Statement
The data may be available to the corresponding author upon request, subject to approval.
Acknowledgments
This paper acknowledges the Zhangjiakou Water Resources Bureau of Hebei Province for partial data support.
Conflicts of Interest
The authors declare no conflict of interest.
References
- Oki, T.; Kanae, S. Global Hydrological Cycles and World Water Resources. Science 2006, 313, 1068–1072. [Google Scholar] [CrossRef] [PubMed]
- Schiermeier, Q. Increased flood risk linked to global warming. Nature 2011, 470, 316. [Google Scholar] [CrossRef] [PubMed]
- Mekonnen, M.; Hoekstra, A. Four billion people facing severe water scarcity. Sci. Adv. 2016, 2, e1500323. [Google Scholar] [CrossRef] [PubMed]
- Bouimouass, H.; Fakir, Y.; Tweed, S.; Leblanc, M. Groundwater Sustainability in a Semiarid Traditional Irrigation Piedmont Supplied by High Mountain Streamflow. In Proceedings of the EGU General Assembly Conference Abstracts, Online, 19–30 April 2021. EGU21-9925. [Google Scholar] [CrossRef]
- Milly, P.C.D.; Dunne, K.A.; Vecchia, A.V. Global pattern of trends in streamflow and water availability in a changing climate. Nature 2005, 438, 347–350. [Google Scholar] [CrossRef]
- Hoekstra, A.Y.; Mekonnen, M.M.; Chapagain, A.K.; Mathews, R.E.; Richter, B.D. Global monthly water scarcity: Blue water footprints versus blue water availability. PLoS ONE 2012, 7, e32688. [Google Scholar] [CrossRef]
- Yakir, H.; Morin, E. Hydrologic response of a semi-arid watershed to spatial and temporal characteristics of convective rain cells. Hydrol. Earth Syst. Sci. 2011, 15, 393–404. [Google Scholar] [CrossRef]
- Kazemi, H.; Hashemi, H.; Maghsood, F.F.; Hosseini, S.H.; Sarukkalige, R.; Jamali, S.; Berndtsson, R. Assessment of streamflow decrease due to climate vs. human influence in a semiarid area. Hydrol. Earth Syst. Sci. Discuss. 2020. Available online: https://hess.copernicus.org/preprints/hess-2019-618/ (accessed on 7 August 2022). [CrossRef]
- Tariku, T.B.; Gan, K.E.; Tan, X.; Gan, T.Y.; Tilmant, A. Global warming impact to river basin of blue nile and the optimum operation of its multi-reservoir system for hydropower production and irrigation. Sci. Total Environ. 2021, 767, 144863. [Google Scholar] [CrossRef]
- Dey, P.; Mishra, A. Separating the impacts of climate change and human activities on streamflow: A review of methodologies and critical assumptions. J. Hydrol. 2017, 548, 278–290. [Google Scholar] [CrossRef]
- Milly, P.; Dunne, K.A. Colorado river flow dwindles as warming-driven loss of reflective snow energizes evaporation. Science 2020, 367, 1252–1255. [Google Scholar] [CrossRef]
- Zhang, H.; Wang, B.; Liu, D.L.; Zhang, M.; Feng, P.; Cheng, L.; Yu, Q.; Eamus, D. Impacts of future climate change on water resource availability of eastern Australia. J. Hydrol. 2019, 573, 49–59. [Google Scholar] [CrossRef]
- Wang, D.; Hejazi, M. Quantifying the relative contribution of the climate and direct human impacts on mean annual streamflow in the contiguous United States. Water Resour. Res. 2011, 47, 411. [Google Scholar] [CrossRef]
- Bai, P.; Liu, W.; Guo, M. Impacts of climate variability and human activities on decrease in streamflow in the Qinhe River, China. Theor. Appl. Climatol. 2014, 117, 293–301. [Google Scholar] [CrossRef]
- Wang, S.; Zhang, Z.; McVicar, T.; Guo, J.; Tang, Y.; Yao, A. Isolating the impacts of climate change and land use change on decadal streamflow variation: Assessing three complementary approaches. J. Hydrol. 2013, 507, 63–74. [Google Scholar] [CrossRef]
- Wang, W.; Shao, Q.; Yang, T.; Peng, S.; Xing, W.; Sun, F.; Luo, Y. Quantitative assessment of the impact of climate variability and human activities on runoff changes: A case study in four catchments of the Haihe River basin, China. Hydrol. Process. 2013, 27, 1158–1174. [Google Scholar] [CrossRef]
- Zhang, L.; Zhao, F.F.; Brown, A.E. Predicting effects of plantation expansion on streamflow regime for catchments in Australia. Hydrol. Earth Syst. Sci. 2012, 16, 2109–2121. [Google Scholar] [CrossRef]
- Zhao, G.; Tian, P.; Mu, X.; Jiao, J.; Wang, F.; Gao, P. Quantifying the impact of climate variability and human activities on streamflow in the middle reaches of the Yellow River basin, China. J. Hydrol. 2014, 519, 387–398. [Google Scholar] [CrossRef]
- Andaryani, S.; Nourani, V.; Ball, J.; Asl, S.J.; Keshtkar, H.; Trolle, D. A comparison of frameworks for separating the impacts of human activities and climate change on river flow in existing records and different near-future scenarios. Hydrol. Process. 2021, 35, e14301. [Google Scholar] [CrossRef]
- Fu, B. On the calculation of land surface evaporation. Atmos. Sci. 1981, 5, 25–33. (In Chinese) [Google Scholar]
- Jinbo, L. Geological background along the banks of the yongding river. Urban Geol. 2012, 7, 1. [Google Scholar]
- Wang, L.; Wang, Z.; Koike, T.; Yin, H.; Yang, D.; He, S. The assessment of surface water resources for the semi-arid Yongding River Basin from 1956 to 2000 and the impact of land use change. Hydrol. Process. 2010, 24, 1123–1132. [Google Scholar] [CrossRef]
- Ren, L.; Wang, M.; Li, C.; Zhang, W. Impacts of human activity on river runoff in the northern area of China. J. Hydrol. 2002, 261, 204–217. [Google Scholar] [CrossRef]
- Yang, Y.; Ren, D.; Yang, Y.; Tian, F.; Hu, Y.; Han, S. Advances in clarification of the driving forces of water shortage in Haihe River Catchment. Chin. J. Eco-Agric. 2018, 26, 1443–1453. [Google Scholar]
- Xia, J.; Zeng, S.; Du, H.; Zhan, C. Quantifying the effects of climate change and human activities on runoff in the water source area of Beijing, China. Hydrol. Sci. J. 2014, 59, 1794–1807. [Google Scholar] [CrossRef]
- Zeng, S.; Zhang, L.; Xia, J.; Yang, Z. Water cycle characteristic and its responses to climate change of the Yongding river basin. J. Basic Sci. Eng. 2013, 21, 501–511. [Google Scholar]
- Mo, C.; Ruan, Y.; Mo, G.; Zhu, X.; Sun, G. Studying Response of Runoff to Climate Change and Human Activities Based on Elastic Coefficient. J. China Hydrol. 2018, 38, 41–45. (In Chinese) [Google Scholar]
- Zhang, L.; Yu, S.; Duan, Y.; Shan, L.; Chen, X.; Xu, Z. Quantitative Assessment of the Effects of Climate Change and Human Activities on Runoff in the Yongding River Basin. Clim. Change Res. 2013, 9, 391–397. (In Chinese) [Google Scholar]
- Allen, R.G.; Pereira, L.S.; Raes, D.; Smith, M. Crop Evapotranspiration Guidelines for Computing Crop Water Requirements. In FAO Irrigation and Drainage Paper No. 56; FAO: Rome, Italy, 1998. [Google Scholar]
- Mann, H.B. Non-parametric test against trend. Econometrika 1945, 13, 245–259. [Google Scholar] [CrossRef]
- Kendall, M.G. Rank Correlation Methods; Charles Griffin: London, UK, 1975. [Google Scholar]
- Searcy, J.K.; Hardison, C.H. Double-Mass Curves. U. S. Geological-Survey-Water-Supply; U. S. Government Printing Office: Washington, DC, USA, 1960; Volume 1541-B, pp. 31–66. [Google Scholar]
- Marlatt, W.E.; Budyko, M.I.; Miller, D.H. Climate and Life. J. Range Manag. 1975, 28, 160. [Google Scholar] [CrossRef]
- Li, D.; Pan, M.; Cong, Z.; Zhang, L.; Wood, E. Vegetation control on water and energy balance within the Budyko framework. Water Resour. Res. 2013, 49, 969–976. [Google Scholar] [CrossRef]
- Zhang, L.; Dawes, W.R.; Walker, G.R. Response of mean annual evapotranspiration to vegetation changes at catchment scale. Water Resour. Res. 2001, 37, 701–708. [Google Scholar] [CrossRef]
- Zhou, G.; Wei, X.; Chen, X.; Zhou, P.; Liu, X.; Xiao, Y.; Sun, G.; Scott, D.F.; Zhou, S.; Han, L.; et al. Global pattern for the effect of climate and land cover on water yield. Nat. Commun. 2015, 6, 5918. [Google Scholar] [CrossRef]
- Pirnia, A.; Golshan, M.; Darabi, H.; Adamowski, J.; Rozbeh, S. Using the Mann–Kendall test and double mass curve method to explore stream flow changes in response to climate and human activities. J. Water Clim. Chang. 2018, 10, 725–742. [Google Scholar] [CrossRef]
- Pockley, P. The evaporation paradox. Australas. Sci. 2009, 396, 30. [Google Scholar]
- Liu, C.; Zhang, D. Temporal and Spatial Change Analysis of the Sensitivity of Potential Evapotranspiration to Meteorological Influencing Factors in China. Acta Geogr. Sin. 2011, 66, 579–588. (In Chinese) [Google Scholar]
- Yang, Y.; Tian, F. Abrupt change of runoff and its major driving factors in haihe river catchment, China. J. Hydrol. 2009, 374, 373–383. [Google Scholar] [CrossRef]
- Ding, A.; Zhao, Y.; Hao, D.; Zhang, S.; Qiao, G. Analysis of variation characteristics of runoff and their influencing factors in the yongding river basin. South North Water Transf. Water Sci. Technol. 2013, 11, 17–22. (In Chinese) [Google Scholar]
- Zhang, S.; Lu, X. Hydrological responses to precipitation variation and diverse human activities in a mountainous tributary of the lower Xijiang, China. Catena 2009, 77, 130–142. [Google Scholar] [CrossRef]
- Hou, L. Study on Mechanism of Ecohydrological Response at the Water resources Shortage Watershed in Northern China—A Case Study of Yongding River. Ph.D. Thesis, China Institute of Water Resources and Hydropower Research, Beijing, China, 2019. [Google Scholar]
- Gibson, J. Aggregate and distributional impacts of China’s household responsibility system. Aust. J. Agric. Resour. Econ. 2020, 64, 14–29. [Google Scholar] [CrossRef]
- Tan, G. Analysis on the implementation of sustainable utilization planning of water resources in the capital in the early 21st century. Haihe Water Conserv. 2004, 4, 25–26. (In Chinese) [Google Scholar]
- Wang, D. Analysis on the progress and measures of implementing the capital water resources planning project in Zhangjiakou. Haihe Water Conserv. 2003, 5, 12–13. (In Chinese) [Google Scholar]
Figure 1.
Location of the UYRB showing meteorological and hydrological stations (a) and background topography (b,c).
Figure 1.
Location of the UYRB showing meteorological and hydrological stations (a) and background topography (b,c).


Figure 2.
Budyko curve showing the relation between ε (ratio of Ea to P) as a function of φ (E0/P) in the YRB and SRB. The bold black lines serve as an envelope (energy limit and water limit) to the Budyko curve family. The curve corresponds to α = 2.79 and α = 3.35 for YRB and SRB, respectively.
Figure 2.
Budyko curve showing the relation between ε (ratio of Ea to P) as a function of φ (E0/P) in the YRB and SRB. The bold black lines serve as an envelope (energy limit and water limit) to the Budyko curve family. The curve corresponds to α = 2.79 and α = 3.35 for YRB and SRB, respectively.

Figure 3.
Trend analysis of precipitation (a) and potential evapotranspiration (b) in the UYRB. The inset shows the Z values of Mann–Kendall test.
Figure 3.
Trend analysis of precipitation (a) and potential evapotranspiration (b) in the UYRB. The inset shows the Z values of Mann–Kendall test.

Figure 4.
Temporal variations of annual streamflow (red line) and precipitation (blue column) for: (a) Xiangshuibu and (b) Shixiali.
Figure 4.
Temporal variations of annual streamflow (red line) and precipitation (blue column) for: (a) Xiangshuibu and (b) Shixiali.

Figure 5.
Double mass curve of the annual precipitation and runoff for: (a) Yanghe River Basin and (b) Sanggan River Basin during the period 1961–2017.
Figure 5.
Double mass curve of the annual precipitation and runoff for: (a) Yanghe River Basin and (b) Sanggan River Basin during the period 1961–2017.


Table 1.
Summary of main features of the two sub-basins in the UYRB.
| Basin | Hydrological Station | River Basin Area (km2) | Average Annual Precipitation (mm) | Average Annual Runoff (mm) | CV |
|---|---|---|---|---|---|
| Yang River | Xiangshuibu | 14600 | 389 | 27 | 0.59 |
| Sanggan River | Shixiali | 23300 | 433 | 24 | 0.59 |
CV = coefficient of variation for annual runoff.
Table 2.
Effects of climate change and human activities on streamflow in the UYRB with the Budyko method.
Table 2.
Effects of climate change and human activities on streamflow in the UYRB with the Budyko method.
| Watershed | Period | P (mm/Year) | E0 (mm/Year) | R (mm/Year) | ΔRc (mm) | ΔRh (mm) | ΔRc (%) | ΔRh (%) |
|---|---|---|---|---|---|---|---|---|
| Yang River Basin | 1961–1982 | 398 | 1044 | 42 | ||||
| 1983–2003 | 380 | 1006 | 27 | −1 | −14 | 9.4 | 90.6 | |
| 2004–2017 | 389 | 1024 | 5 | −0 | −36 | 0.5 | 99.5 | |
| Sanggan River Basin | 1961–1982 | 447 | 940 | 36 | ||||
| 1983–2003 | 416 | 928 | 26 | −4 | −7 | 37.3 | 62.7 | |
| 2004–2017 | 438 | 970 | 3 | −2 | −31 | 6.5 | 93.5 |
Table 3.
Climate change and human activities on streamflow in the UYRB by the the DMC method.
| Watershed | Period | P (mm/Year) | R2m (mm) | R2c (mm) | ΔRc (mm) | ΔRc (%) | ΔRh (mm) | ΔRh (%) |
|---|---|---|---|---|---|---|---|---|
| Yang River Basin | 1961–1982 | 398 | 42 | 40 | ||||
| 1983–2003 | 380 | 27 | 38 | −3 | 21.4 | −12 | 78.6 | |
| 2004–2017 | 389 | 5 | 40 | −2 | 5.9 | −34 | 94.1 | |
| Sanggan River Basin | 1961–1982 | 447 | 36 | 36 | ||||
| 1983–2003 | 416 | 26 | 34 | −3 | 24.9 | −8 | 75.1 | |
| 2004–2017 | 438 | 3 | 36 | −1 | 1.8 | −32 | 98.2 |
R2m and R2c represent measured values and calculated values in changed period, respectively. ΔRh and ΔRc represent runoff depth variation caused by human activities and climate change, respectively. ΔRh and ΔRc represent the contribution rate (%) of human activities and climate change to runoff reduction, respectively.
Publisher’s Note: MDPI stays neutral with regard to jurisdictional claims in published maps and institutional affiliations. |
© 2022 by the authors. Licensee MDPI, Basel, Switzerland. This article is an open access article distributed under the terms and conditions of the Creative Commons Attribution (CC BY) license (https://creativecommons.org/licenses/by/4.0/).
Share and Cite
MDPI and ACS Style
Deng, L.; Guo, Y.; Qi, Y.; Shen, Y.-J.; Shen, Y. Impacts of Climate Change and Human Activities on Streamflow of Upper Yongding River Basin, North China. Water 2022, 14, 2798. https://doi.org/10.3390/w14182798
AMA Style
Deng L, Guo Y, Qi Y, Shen Y-J, Shen Y. Impacts of Climate Change and Human Activities on Streamflow of Upper Yongding River Basin, North China. Water. 2022; 14(18):2798. https://doi.org/10.3390/w14182798
Chicago/Turabian StyleDeng, Liqiang, Ying Guo, Yongqing Qi, Yan-Jun Shen, and Yanjun Shen. 2022. "Impacts of Climate Change and Human Activities on Streamflow of Upper Yongding River Basin, North China" Water 14, no. 18: 2798. https://doi.org/10.3390/w14182798
Note that from the first issue of 2016, this journal uses article numbers instead of page numbers. See further details here.