
Reactivity of Nitrate with Zero-Valent Iron
1
Salt Lake County Extension, Utah State University, Salt Lake City, UT 84190, USA
2
Plant and Soil Sciences, University of Kentucky, Lexington, KY 40546, USA
*
Author to whom correspondence should be addressed.
Water 2022, 14(18), 2796; https://doi.org/10.3390/w14182796
Submission received: 15 July 2022
/
Revised: 30 August 2022
/
Accepted: 31 August 2022
/
Published: 8 September 2022
(This article belongs to the Special Issue Control and Remediation of Contaminants in Soil and Groundwater)
Abstract
:Elevated nitrate concentrations in groundwater and surface water supplies can negatively impact the quality of the environment and human health. Recent studies have examined the use of zero-valent iron technology to treat nitrate-contaminated groundwater. Mechanistic aspects of nitrate reduction by zero-valent iron are unresolved. This project investigated the kinetics and mechanism of nitrate reduction by zero-valent iron under anoxic conditions and under oxic conditions. Stirred-batch reactions were studied over environmentally relevant ranges of reactant concentration, pH, and temperature. A complex rate expression was derived with a 1.8 order dependence on nitrate, a 1.4 order dependence on zero-valent iron, and a fractional order (0.8) dependence on proton concentrations under anoxic conditions. An apparent activation energy of 35 kJ mol−1 was observed indicating that nitrate reduction was diffusion controlled under our conditions. Furthermore, the calculated entropy of activation value of −162 J mol−1K−1 indicates that this reaction occurred by an associative mechanism. Under oxic conditions, there was a lag period in nitrate reduction where oxygen was preferentially utilized, leading to a slower rate of nitrate reduction when compared with anoxic conditions. These rate data can be used in predicting nitrate disappearance in nitrate-contaminated groundwater and wastewater treated with zero-valent iron.
1. Introduction
Nitrate is weakly retained and prone to leaching in most soil environments due to its anionic character and the predominance of soil particle surfaces that bear a net negative charge [1,2]. As a result, it can readily contaminate groundwater and surface water supplies. There are multiple consequences of nitrate contamination in water. Cyanobacteria involved in producing algal blooms have the potential to produce more toxic compounds when the N:P ratio increases [3]. Consumption of water with elevated levels of nitrate can lead to nitrite-induced methemoglobinemia in infants, which is potentially harmful [4,5]. Nitrite, an intermediate of the denitrification of nitrate, figures prominently in atmospheric chemistry [6,7]. Thus, concern over the fate of nitrate has led to technologies being implemented to remove it from groundwater and wastewater [8,9].
The use of metallic or zero-valent iron (Fe0) as a chemical removal strategy has received attention. Early studies showed that zero-valent iron can effectively reduce nitrate [10,11,12] because it is a good reductant under anoxic conditions. As a result, it has been used in permeable reactive barriers for the passive reduction of nitrate-contaminated groundwater [9,13]. More recently, it has been added to filter media to remove pathogens from drinking water and can remove several co-occurring chemical pollutants (along with nitrate) from domestic sewage [14,15,16].
Despite the recognition that zero-valent iron can reduce nitrate, there has been some discrepancies among cited rate expressions for this reaction. For example, the reduction rate of nitrate was positively related to Fe0 levels [17,18], whereas others have noted a zero order dependence [12], meaning that the nitrate reduction rate is independent of the Fe0 concentration under anoxic conditions. The reaction rate dependence on the initial nitrate concentration is uncertain as well. In some studies, the dependence on the initial nitrate concentration was first order [10,19], while others have noted an apparent reaction order of 1.7 [11]. Alowitz and Scherer [12] reported first order dependence on nitrate at lower pH values, which shifted to zero order at a higher pH.
Most of the studies involving nitrate reduction by Fe0 mentioned above have been conducted at one temperature. Temperature studies are useful to shed light on the rate-limiting step in a process by fitting time series data at various temperatures to the Arrhenius expression, allowing one to estimate the activation energy [20,21]. The few temperature studies that have been performed to understand nitrate reduction by Fe0 have yielded contrasting results. In some cases, nitrate reduction by Fe0 was predicted to be diffusion controlled based on activation energy values of 21.7, 22, and 28.2 kJ/mol [22,23,24]. In contrast, Kim and Cha [25] recently reported an activation energy value of 50 kJ/mol, placing this reaction under surface chemical control. Furthermore, the same set of temperature data can be fitted to the Eyring expression to assess whether a dissociative or associative ligand exchange mechanism is involved [26,27], but this has not been performed for nitrate reduction by Fe0.
The impact of oxygen (O2) on nitrate reduction by Fe0 is unclear. As mentioned above, Fe0 serves as a good reductant and can be coupled to nitrate reduction under anoxic conditions with the concomitant production of ferrous iron (Fe2+(aq)) [11]. The presence of oxygen affects the corrosion of Fe0 [28], so under oxic conditions, one might expect O2 to compete with nitrate as an oxidant and impact the amount of nitrate removed from water. Indeed, Yang and Lee [29] reported that oxygen was preferentially used over nitrate at early stages of the reaction, thus lowering the reducing capacity of Fe0 for nitrate. However, Westerhoff and James [22] noted that increasing the initial O2 level led to an increase in the percentage nitrate removal. There is a need to resolve some of this uncertainty regarding the role of O2 in nitrate reduction by Fe0.
The objectives of this study are to: (1) characterize the kinetics of nitrate reduction by zero-valent iron under anoxic conditions over a range in initial reactant concentrations and pH; (2) follow the reactivity of nitrate with zero-valent iron over a range in temperatures; (3) assess the kinetics of nitrate reduction by zero-valent iron under oxic conditions in laboratory studies.
2. Materials and Methods
2.1. Chemicals and Materials
Zero-valent iron (Fe0) powder was purchased from Fisher, containing 99% Fe and sieved with 100 mesh size. The specific surface area of the unreacted Fe0 powder was 0.12 m2g−1 as measured using the Brunauer-Emmett-Teller (BET) N2 gas adsorption method. All reagents including sodium nitrate, sodium nitrite, biological pH buffers (MES-[2-(N-morpholino) ethanesulfonic acid monohydrate]; PIPES-[1,4-Piperazine Diethane Sulfonic Acid]), ferrozine [3-(2-pyridyl)-5,6-diphenyl-1,2,4-triazine-4′,4″-disulfonic acid monosodium salt], and iron(II) salts were ACS grade and obtained from Sigma. All solutions were prepared using deoxygenated MilliQ water (18 MΩ).
2.2. Stirred-Batch Anoxic and Oxic Reactions
The stirred-batch kinetic experiments were run in 250 mL Nalgene polycarbonate bottles placed within water jacketed flasks connected to a VWR Scientific Products circulating water bath for temperature control. In light of the challenges in stirring iron particles with a magnetic stirrer [30], mixing was accomplished using an overhead motor-driven paddle stirrer. Prior to the start of the reaction, and during all experiments, solutions were purged with argon to establish anoxic conditions. The reaction was initiated by the addition of a calculated aliquot of NaNO3 from a stock solution and two mL samples were pulled from solution at increasing time intervals and filtered into anoxic test tubes using 10 mL syringes and 25 mm filter holders loaded with 0.2 µm membrane Fisherbrand filter paper. The experimental protocol was adjusted to derive a rate expression describing nitrate reduction by zero-valent iron as a function of four variables: changes in initial nitrate concentrations (0.5, 1.0, 3.0, and 5.0 mM NO3−), initial Fe0 levels (0.5, 1.0, 3.0, and 5.0 g L−1), pH (5.5, 6.0, 7.0, and 7.5), and the impact of temperature (10, 15, 25, 30, and 40 °C). Nitrite experiments were also conducted with the addition of 1 mM NO2− and 5.0 g L−1 Fe0 to 0.3 M MES buffer at pH 5.5. Additional experiments referred to as ‘buffer free’ were conducted by substituting the MES buffer for a Metrohm Model 716 automatic titrator, which controlled the pH at 5.5 with the addition of 0.5 M HCl. The purpose of the ‘buffer-free’ runs was to verify the stoichiometry of the zero-valent reaction with nitrate. Control bottles (no nitrate added) were included as well under anoxic conditions. Reactions were run in duplicate or triplicate bottles. The reaction solution was mixed with a motor-driven paddle stirrer and constantly purged with argon gas to maintain anoxic conditions.
Oxic reaction solutions were compared with anoxic experiments to evaluate nitrate reduction by Fe0 by inserting a Strathkelvin Instruments 782 Oxygen Meter probe to monitor dissolved oxygen (DO) levels throughout the reaction. Reaction solutions were purged with argon gas until an initial DO level of 5.7 ppm was reached. Afterwards, one mM nitrate and 5 g L−1 Fe0 were added with 0.3 M MES buffered to pH 5.5. After the initiation of the reaction no further action was taken to control DO levels. Suspensions were removed at increasing time intervals as before, immediately filtered, and complexed with ferrozine to quantify Fe(II) and N species (see below).
2.3. Analytical Techniques
One mL aliquots of the filtrate were immediately complexed with ferrozine [3-(2-pyridyl)-5,6-diphenyl-1,2,4-triazine-4′,4″-disulfonic acid monosodium salt] and pH buffer to complex dissolved Fe(II). Quantification of the Fe(II)-ferrozine complex was achieved by recording absorbance spectra at 562 nm [31] in Suprasil quartz cuvettes with a 1 cm optical pathlength using a double-beam Shimadzu UV-3101PC spectrophotometer referenced against appropriate Fe(II) standards. The estimated method detection limit is 0.5 mmol/L. Total dissolved iron (Fe2+ plus Fe3+) was quantified with flame atomic adsorption spectrometry (Shimadzu AA-6800). The difference between total iron and Fe(II) concentrations was used to estimate the Fe(III) concentration. Nitrate and nitrite concentrations (NO3−, NO2−) were determined with use of an anion exchange column on a Metrohm 792 Basic ion chromatograph with method detection limits of 4.7 and 2.5 μg/L. Ammonium was measured with a cation exchange column (Dionex, ICS2500) to circumvent problems with colorimetric quantification in high Fe(II) as mentioned elsewhere [23]. Mineralogy of unreacted and reacted iron powder was characterized by X-ray diffraction (XRD) using a PW 1840 Phillips diffractometer equipped with CoKα radiation on wet mounts dried under argon. Scans were made from 0 to 60°2θ. Reacted solids were observed by scanning electron microscopy using a Hitachi S-3200 scanning electron microscope equipped with a Noran Voyager energy dispersive X-ray system. Argon dried samples were deposited onto carbon tape attached to Al holders in the glovebox, transported to the microscopy facility in an anoxic desiccator, and immediately sputter coated with Au and Pd to reduce sample charging in the beam.
3. Results
3.1. Stoichiometry of Nitrate Reduction by Zero-Valent Iron
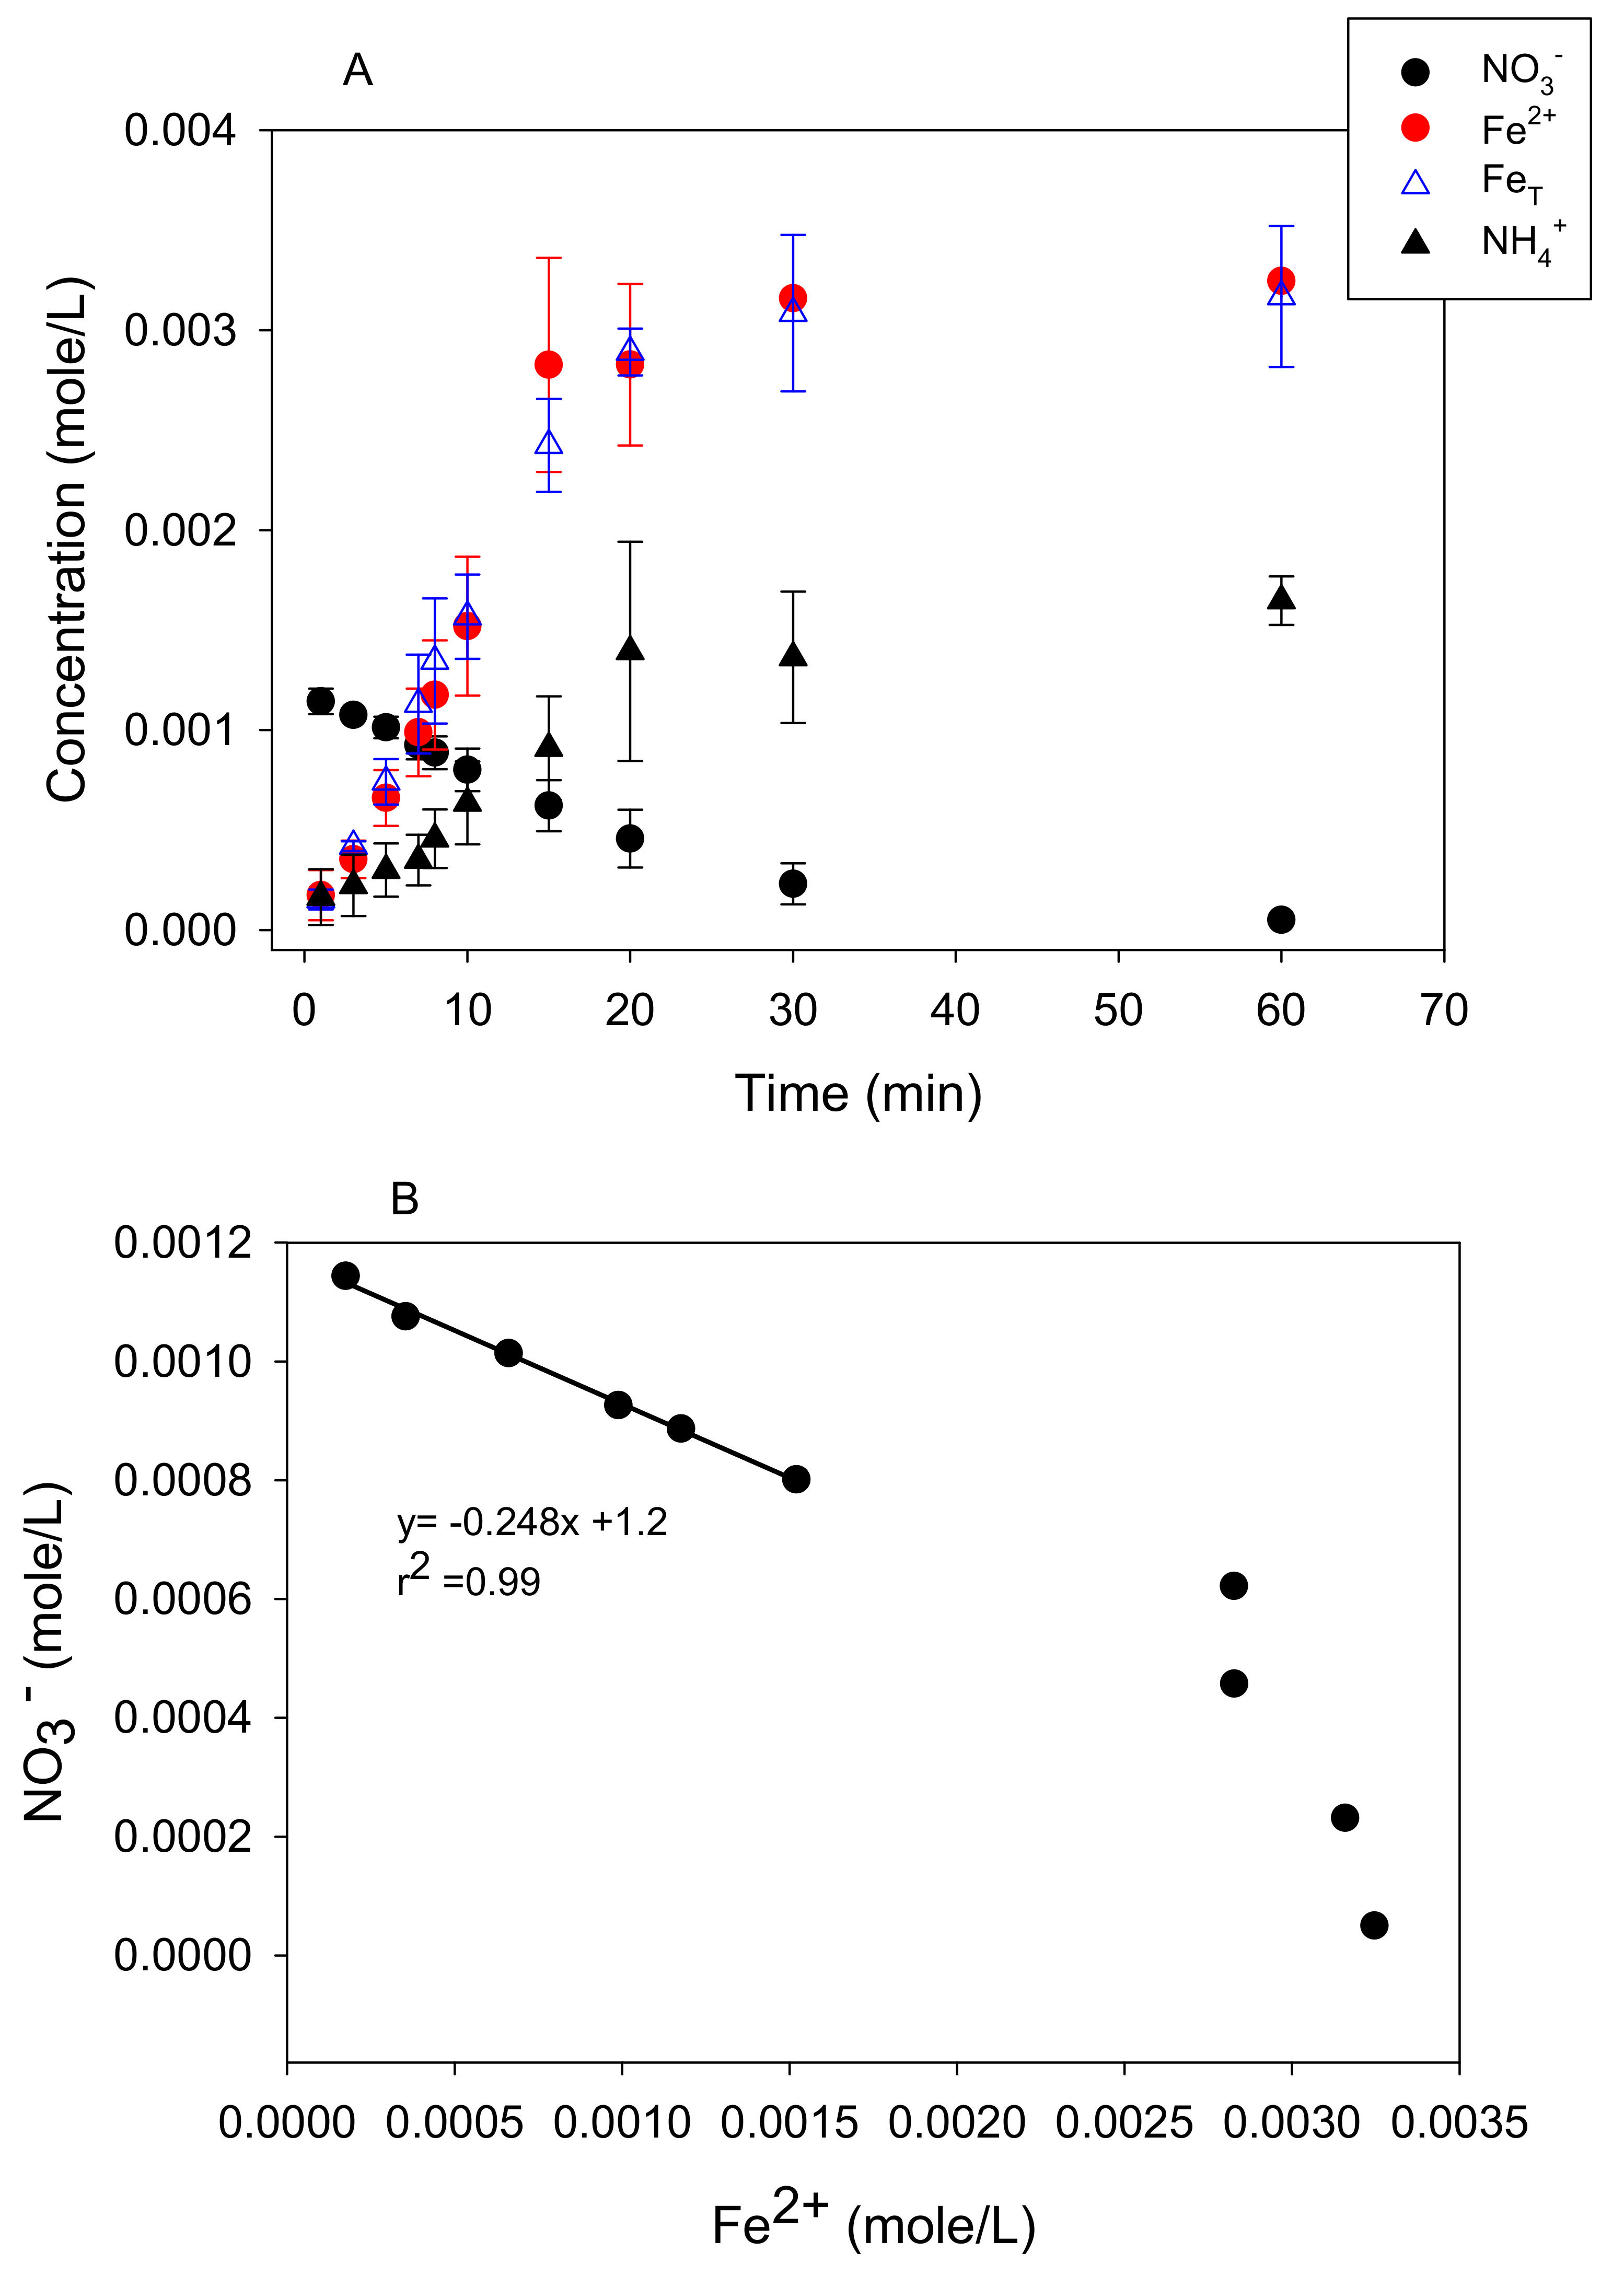
Nitrate loss from a solution in the presence of metallic iron was rapid under anoxic conditions. For example, there was, roughly, a 92% loss of 1 mM NO3− after 60 min of reaction time in the presence of 5 g L−1 Fe0 suspension at pH 5.5 and 25 °C (Figure 1A). The appearance of dissolved ammonium in, roughly, a 1:1 ratio with nitrate consumed during the initial part of the reaction (See Supplementary Materials, Figure S1) confirms that the loss of nitrate was due to reduction. Dissolved nitrite as an intermediate product was below detectable levels (data not shown). Separate experiments were performed using 1 mM of NO2− and it was removed more rapidly than NO3− (See Supplementary Materials, Figure S2), suggesting that, if formed, nitrite would behave as a transient intermediate. Other investigators have reported ammonium as the end product of nitrate reduction and heightened reactivity of nitrite in the presence of zero-valent iron [11,12,32].
Dissolved Fe(II) appeared in the solution concurrent with nitrate reduction (Figure 1A) in much greater quantities than in the anoxic control bottles (no nitrate added) (See Supplementary Materials, Figure S3A). Separate experiments showed minimal reactivity between dissolved Fe2+ with nitrate after 60 min of reaction, requiring 7200 min (5 days) before nitrate levels declined (See Supplementary Materials, Figure S4), suggesting that Fe0 was involved. During the initial stages of the reaction, the slope of the line of nitrate reduced by Fe0 to Fe(II) produced translates to a molar ratio of 1:4 (Figure 1B). This ratio approached 1:1 at longer reaction times. Total dissolved Fe coincided with dissolved Fe(II), indicating that any dissolved Fe(III) produced was below detectable levels (Figure 1A). The same trend was observed for anoxic control bottles (no nitrate added) (See Supplementary Materials, Figure S3A).
Protons were consumed during the reaction. The average acid addition in pH-stat experiments (buffer free) indicated that 11 mM L−1 of H+ were consumed. Thus, the overall reaction depicted in Equation (1) was verified in our experiments at the early stages of the reaction.
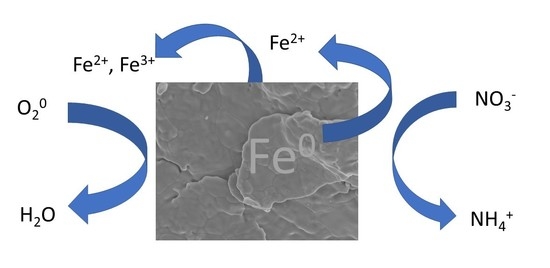
NO3− + 4Fe0 + 10H+ → 4Fe2+ + NH4+ + 3H2O
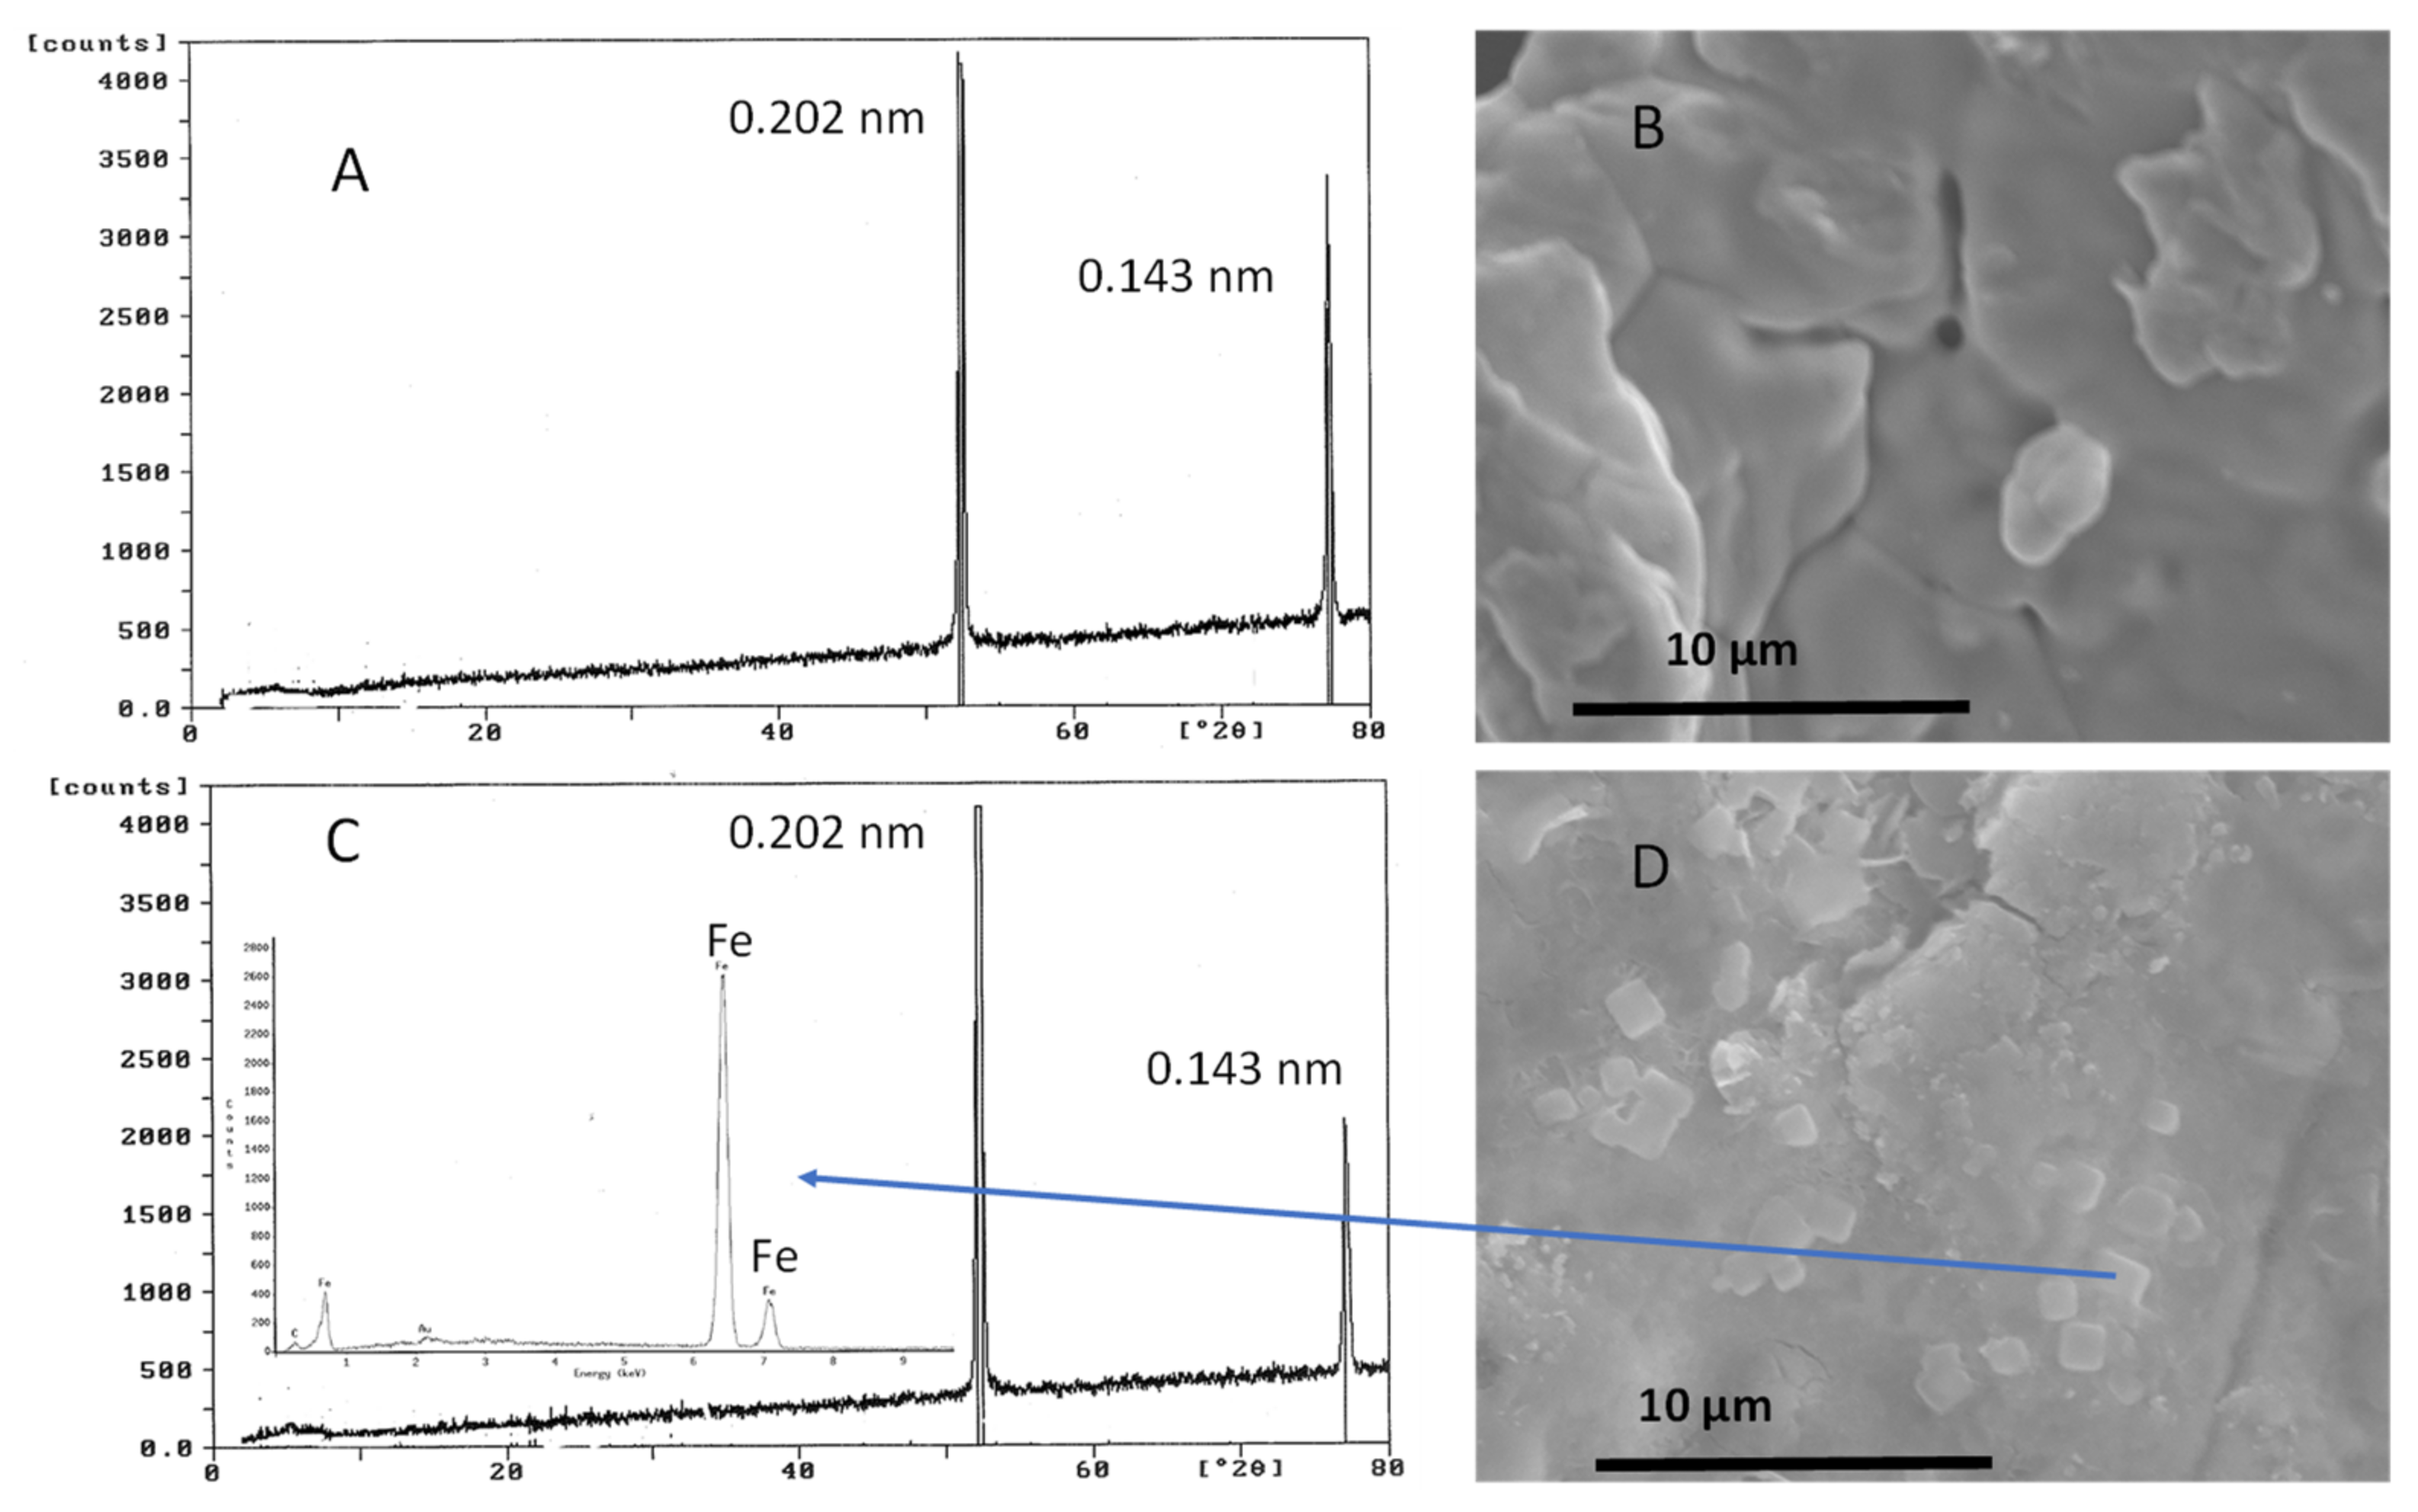
Unreacted and reacted samples of Fe0(s) are depicted in Figure 2. Inspection of the reacted Fe0 solids was performed using X-ray diffraction (XRD) and scanning electron microscopy-energy dispersive x-rays (SEM-EDS). Residual Fe0 (labelled alpha iron) was observed based on XRD peaks at 0.202 nm and 0.143 nm, respectively (Figure 2A). Zero-valent (Fe0(s)) samples from the control (no nitrate) were large particles typified by smooth surfaces (Figure 2B). Small secondary mineral precipitates (~2 mm) were observed in close association with larger and presumably residual Fe0 particles using SEM-EDS after 60 min of reaction time (Figure 2C). These smaller precipitates are suggestive of the presence of magnetite (Fe3O4(s)), a secondary mineral that has been reported in Fe0 systems under anoxic conditions [32,33,34]. This could explain the nonstoichiometric behavior in Fe(II) production at longer reaction times as mentioned above.
3.2. Kinetic Analysis
Based on THE previous literature and Equation (1), one can assume the removal of NO3− is dependent on reactant concentrations.
where is the rate of nitrate reduction (mol L−1 min−1), is the overall reaction rate coefficient (L2 mol−1 min−1 g−1), and a, b, and c represent the reaction orders with respect to NO3− (M), Fe0 (g/L), and H+ (M), respectively. This assumes that the forward reaction in Equation (1) predominates. The initial rate and isolation methods were employed to evaluate the basic rate expression in Equation (2) [20,21]. The initial linear portion in NO3− concentration versus time plots, denoted as R (mol L−1 min−1), was plotted against the concentration (M) of the reaction component (NO3−, H+, or Fe0). Calculations were limited to data from the initial portion of the reaction to minimize side reactions. This approach is further justified based on the nonstoichiometry at longer times (Figure 1B).
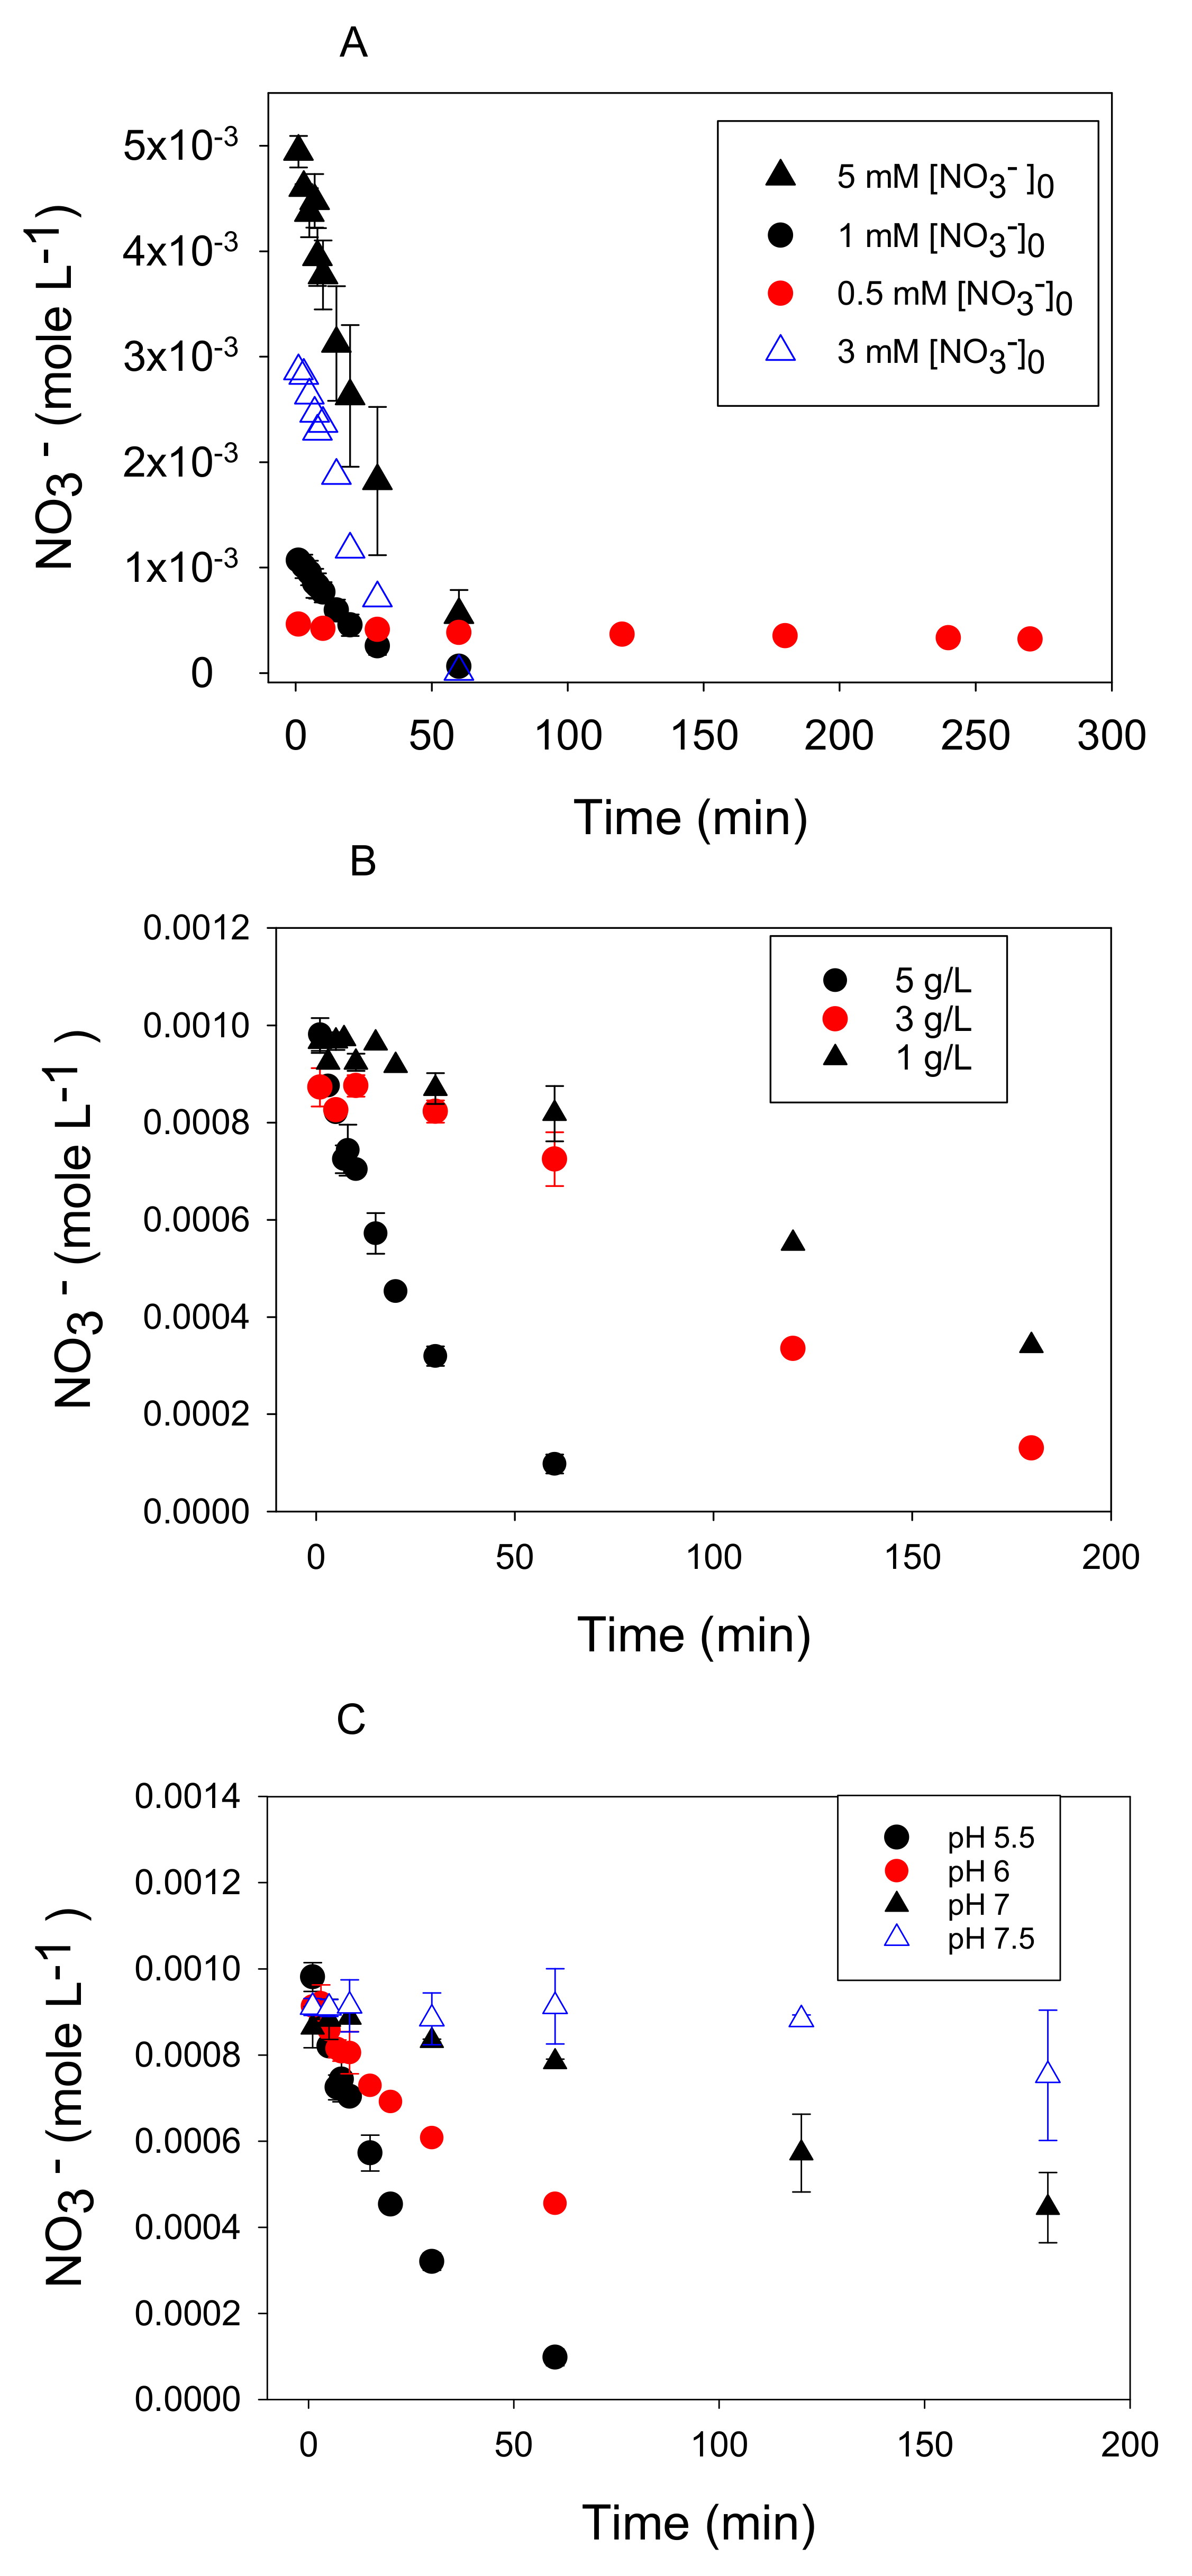
Reaction rates increased with increasing initial nitrate concentrations (Figure 3A). The apparent reaction order with respect to nitrate at 25 °C was determined from conditions where Fe0 was in excess and H+ was held constant at pH 5.5 as shown in Equation (3).
R (mol L−1 min−1) = k′obs[NO3−]a where k′obs = k[Fe0]b [H+]c
Taking the log of both sides linearizes Equation (3), giving a slope (a) representative of the reaction order for nitrate.
log R = log k′obs + a log [NO3−]
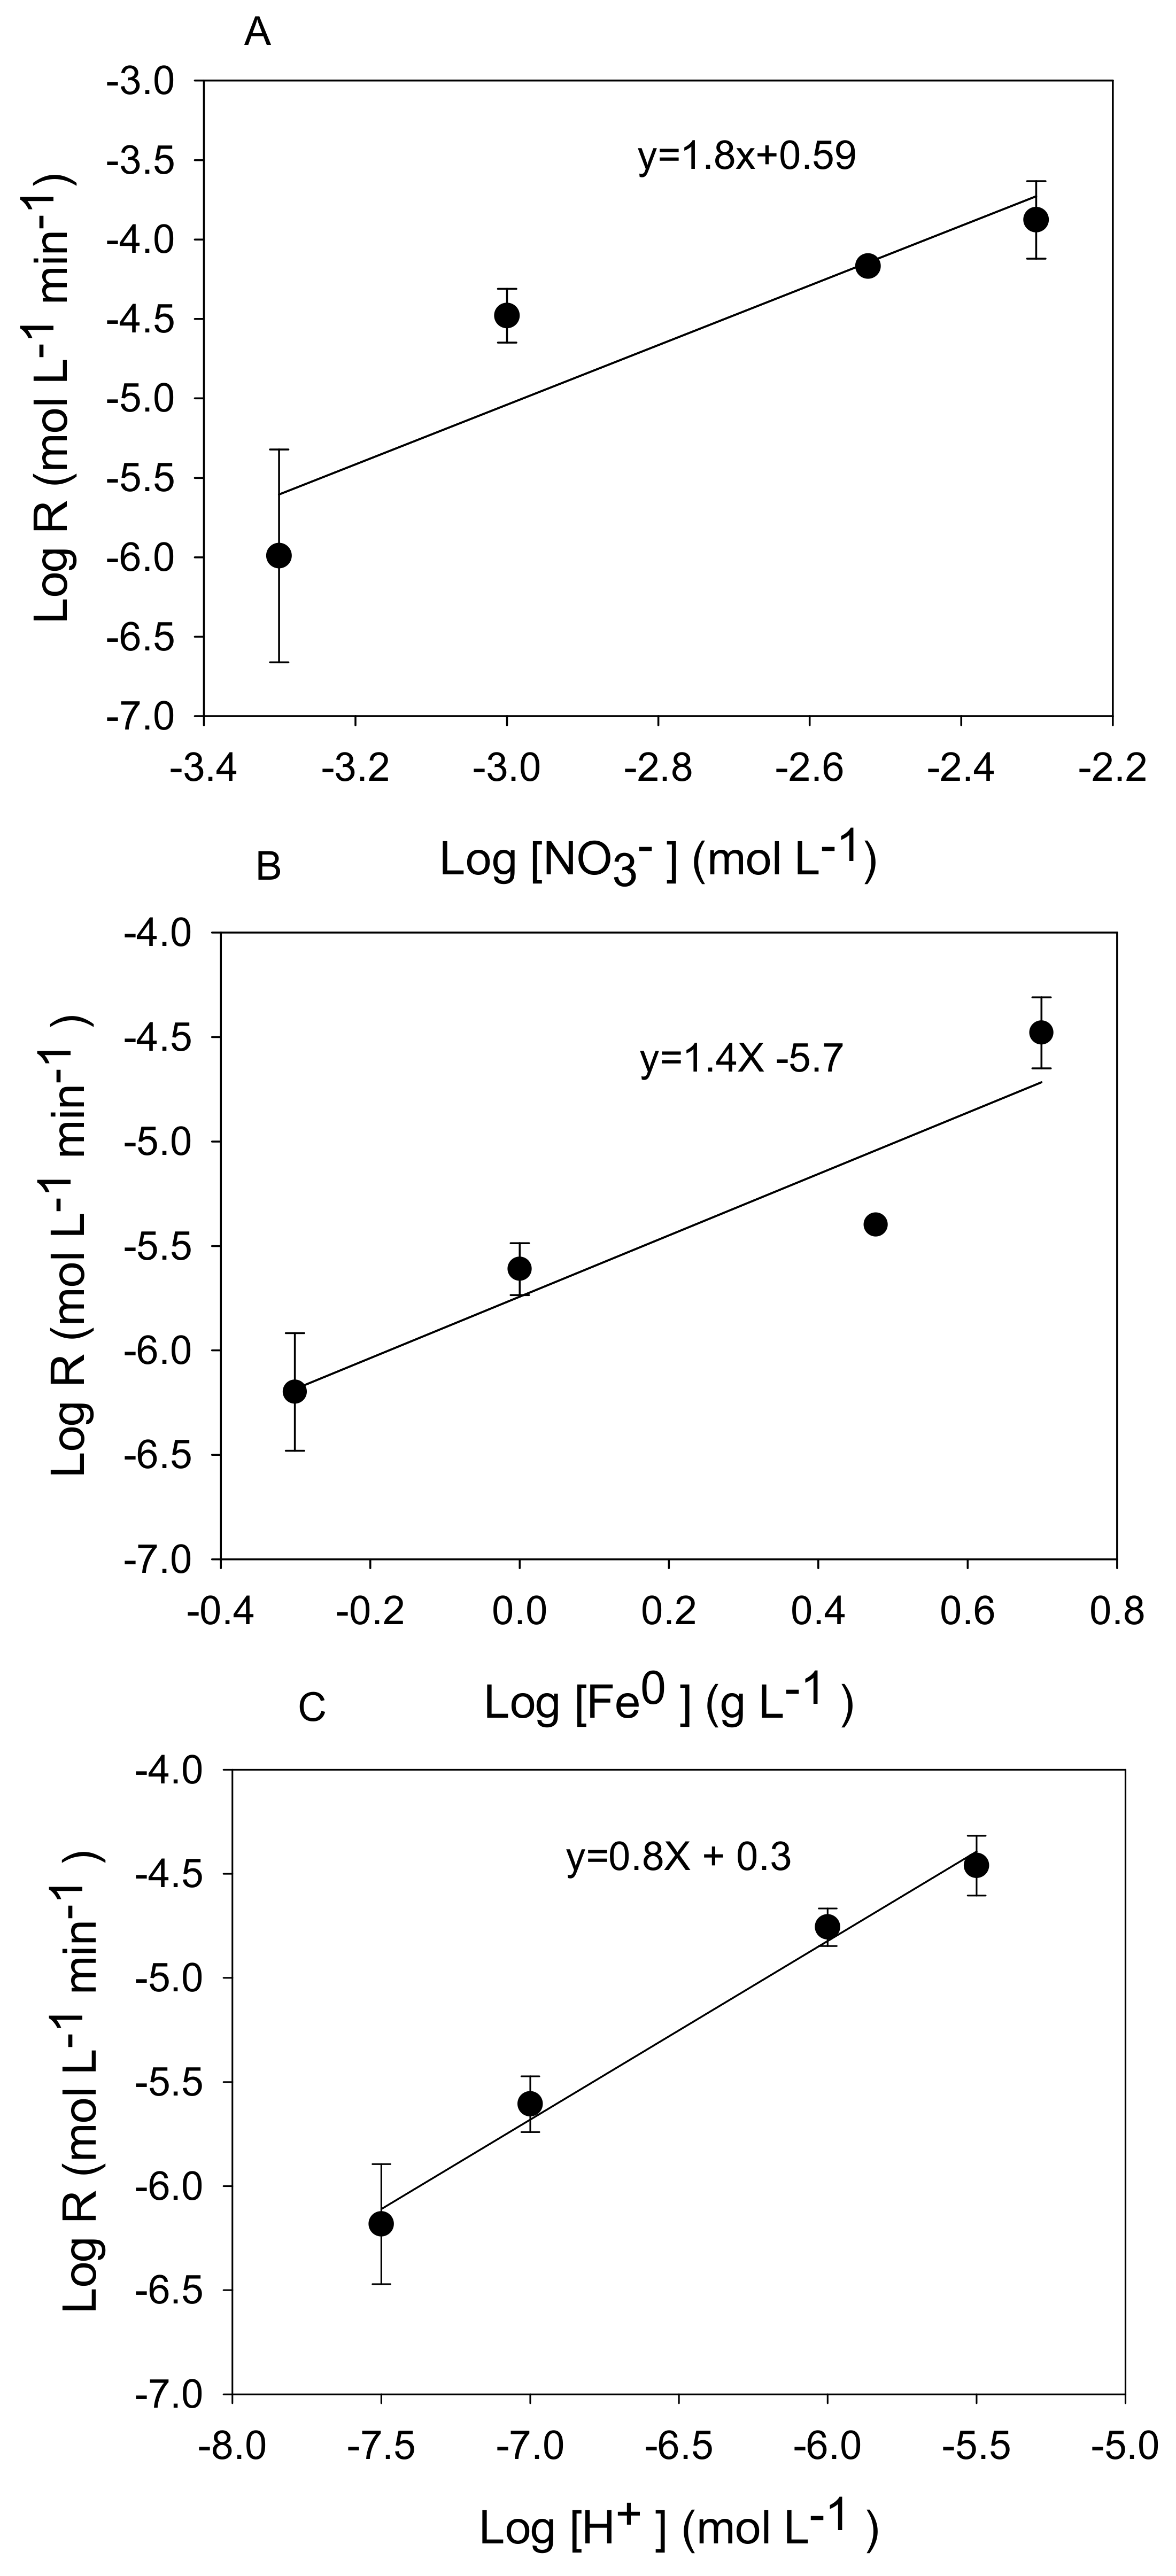
The reaction order with respect to nitrate was 1.8 (Figure 4A) indicating a strong dependence on nitrate concentration. Huang et al. [11] reported a similar dependence on nitrate (1.7), whereas others have reported a first order dependence of the reaction rate on nitrate concentration based on fitting time series data describing the disappearance of one nitrate concentration [10,19].
Figure 3.
Time series data of nitrate removal as a function of (A) initial nitrate concentration at 5 g/L Fe0 level and pH 5.5, (B) initial Fe0 concentration at 0.001 M nitrate and pH 5.5, and (C) pH at 5 g/L Fe0 and 0.001 M nitrate. All experiments were performed at 25 °C.
Figure 3.
Time series data of nitrate removal as a function of (A) initial nitrate concentration at 5 g/L Fe0 level and pH 5.5, (B) initial Fe0 concentration at 0.001 M nitrate and pH 5.5, and (C) pH at 5 g/L Fe0 and 0.001 M nitrate. All experiments were performed at 25 °C.

Reaction rates increased with increasing Fe0 concentrations under conditions of pH 5.5 and initial nitrate concentration of 0.001 M (Figure 3B). This translated to an apparent reaction order of 1.4 based on the slope of the log-log plot (Figure 4B). This value slightly exceeded the first order dependence on solid concentration typically observed in heterogeneous reactions [21,35]. Other studies have reported a positive linear dependence of Fe0 concentration on nitrate reduction [11,17]. Our finding disagrees with Alowitz and Scherer [12] who reported that nitrate reduction was independent of Fe0 concentration. This could be due to the higher pH value employed by these authors (pH 7) where Fe0 dependence was studied.
There was a strong increase in the nitrate reduction rate with a decrease in pH (Figure 3C) with an apparent reaction order with respect to a proton of 0.8 (Figure 4C). Other studies have reported increasing nitrate reduction rates by zero-valent iron with a decrease in pH [11,32], and in one case, a fractional order dependence (0.49) on pH was observed [12]. This finding agrees with Equation (1) because nitrate reduction by metallic iron is an acid-consuming reaction under anoxic conditions.
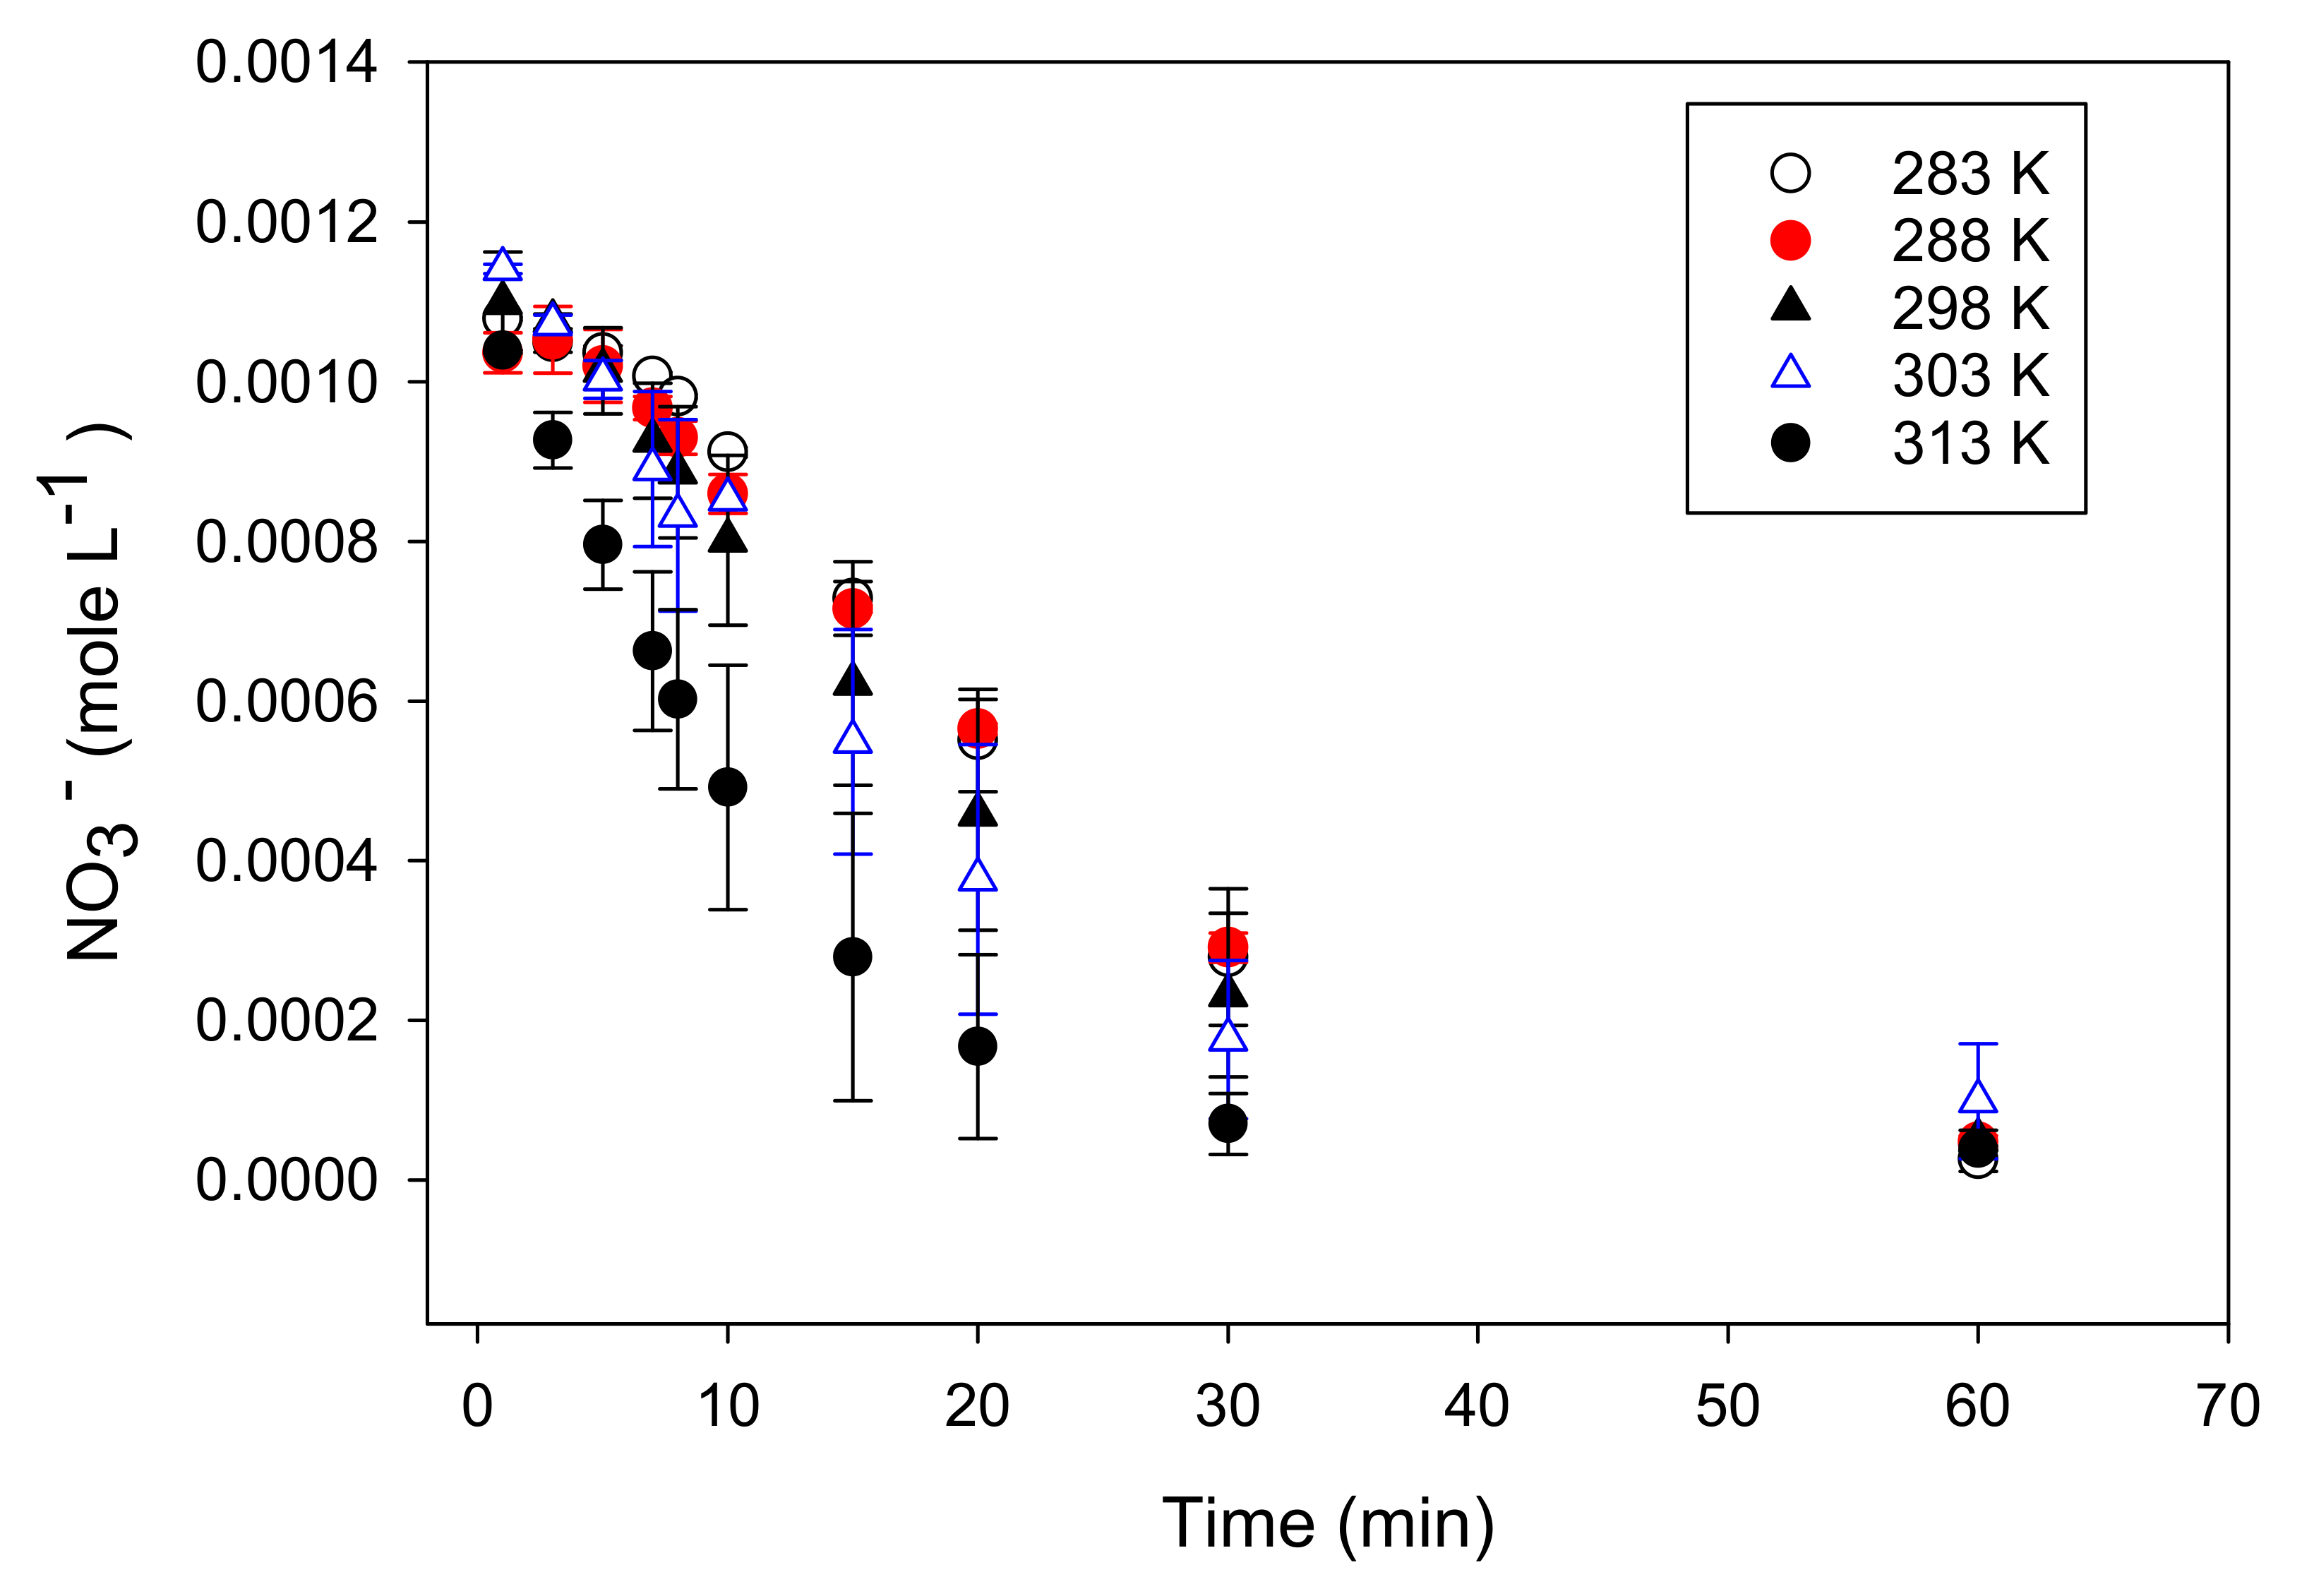
All of the experiments mentioned above were performed at ambient temperature (25 °C). In order to determine activation parameters, additional experiments were performed at 10 °C, 15 °C, 30 °C, and 40 °C. Reaction rates slightly increased with higher temperatures (Figure 5). Reaction rates were fit to the Arrhenius equation
where Ea is the activation energy (kJ mol−1), R is the molar gas constant (0.008314 kJ mol−1K−1), and T is absolute temperature (K). The linear form of this equation
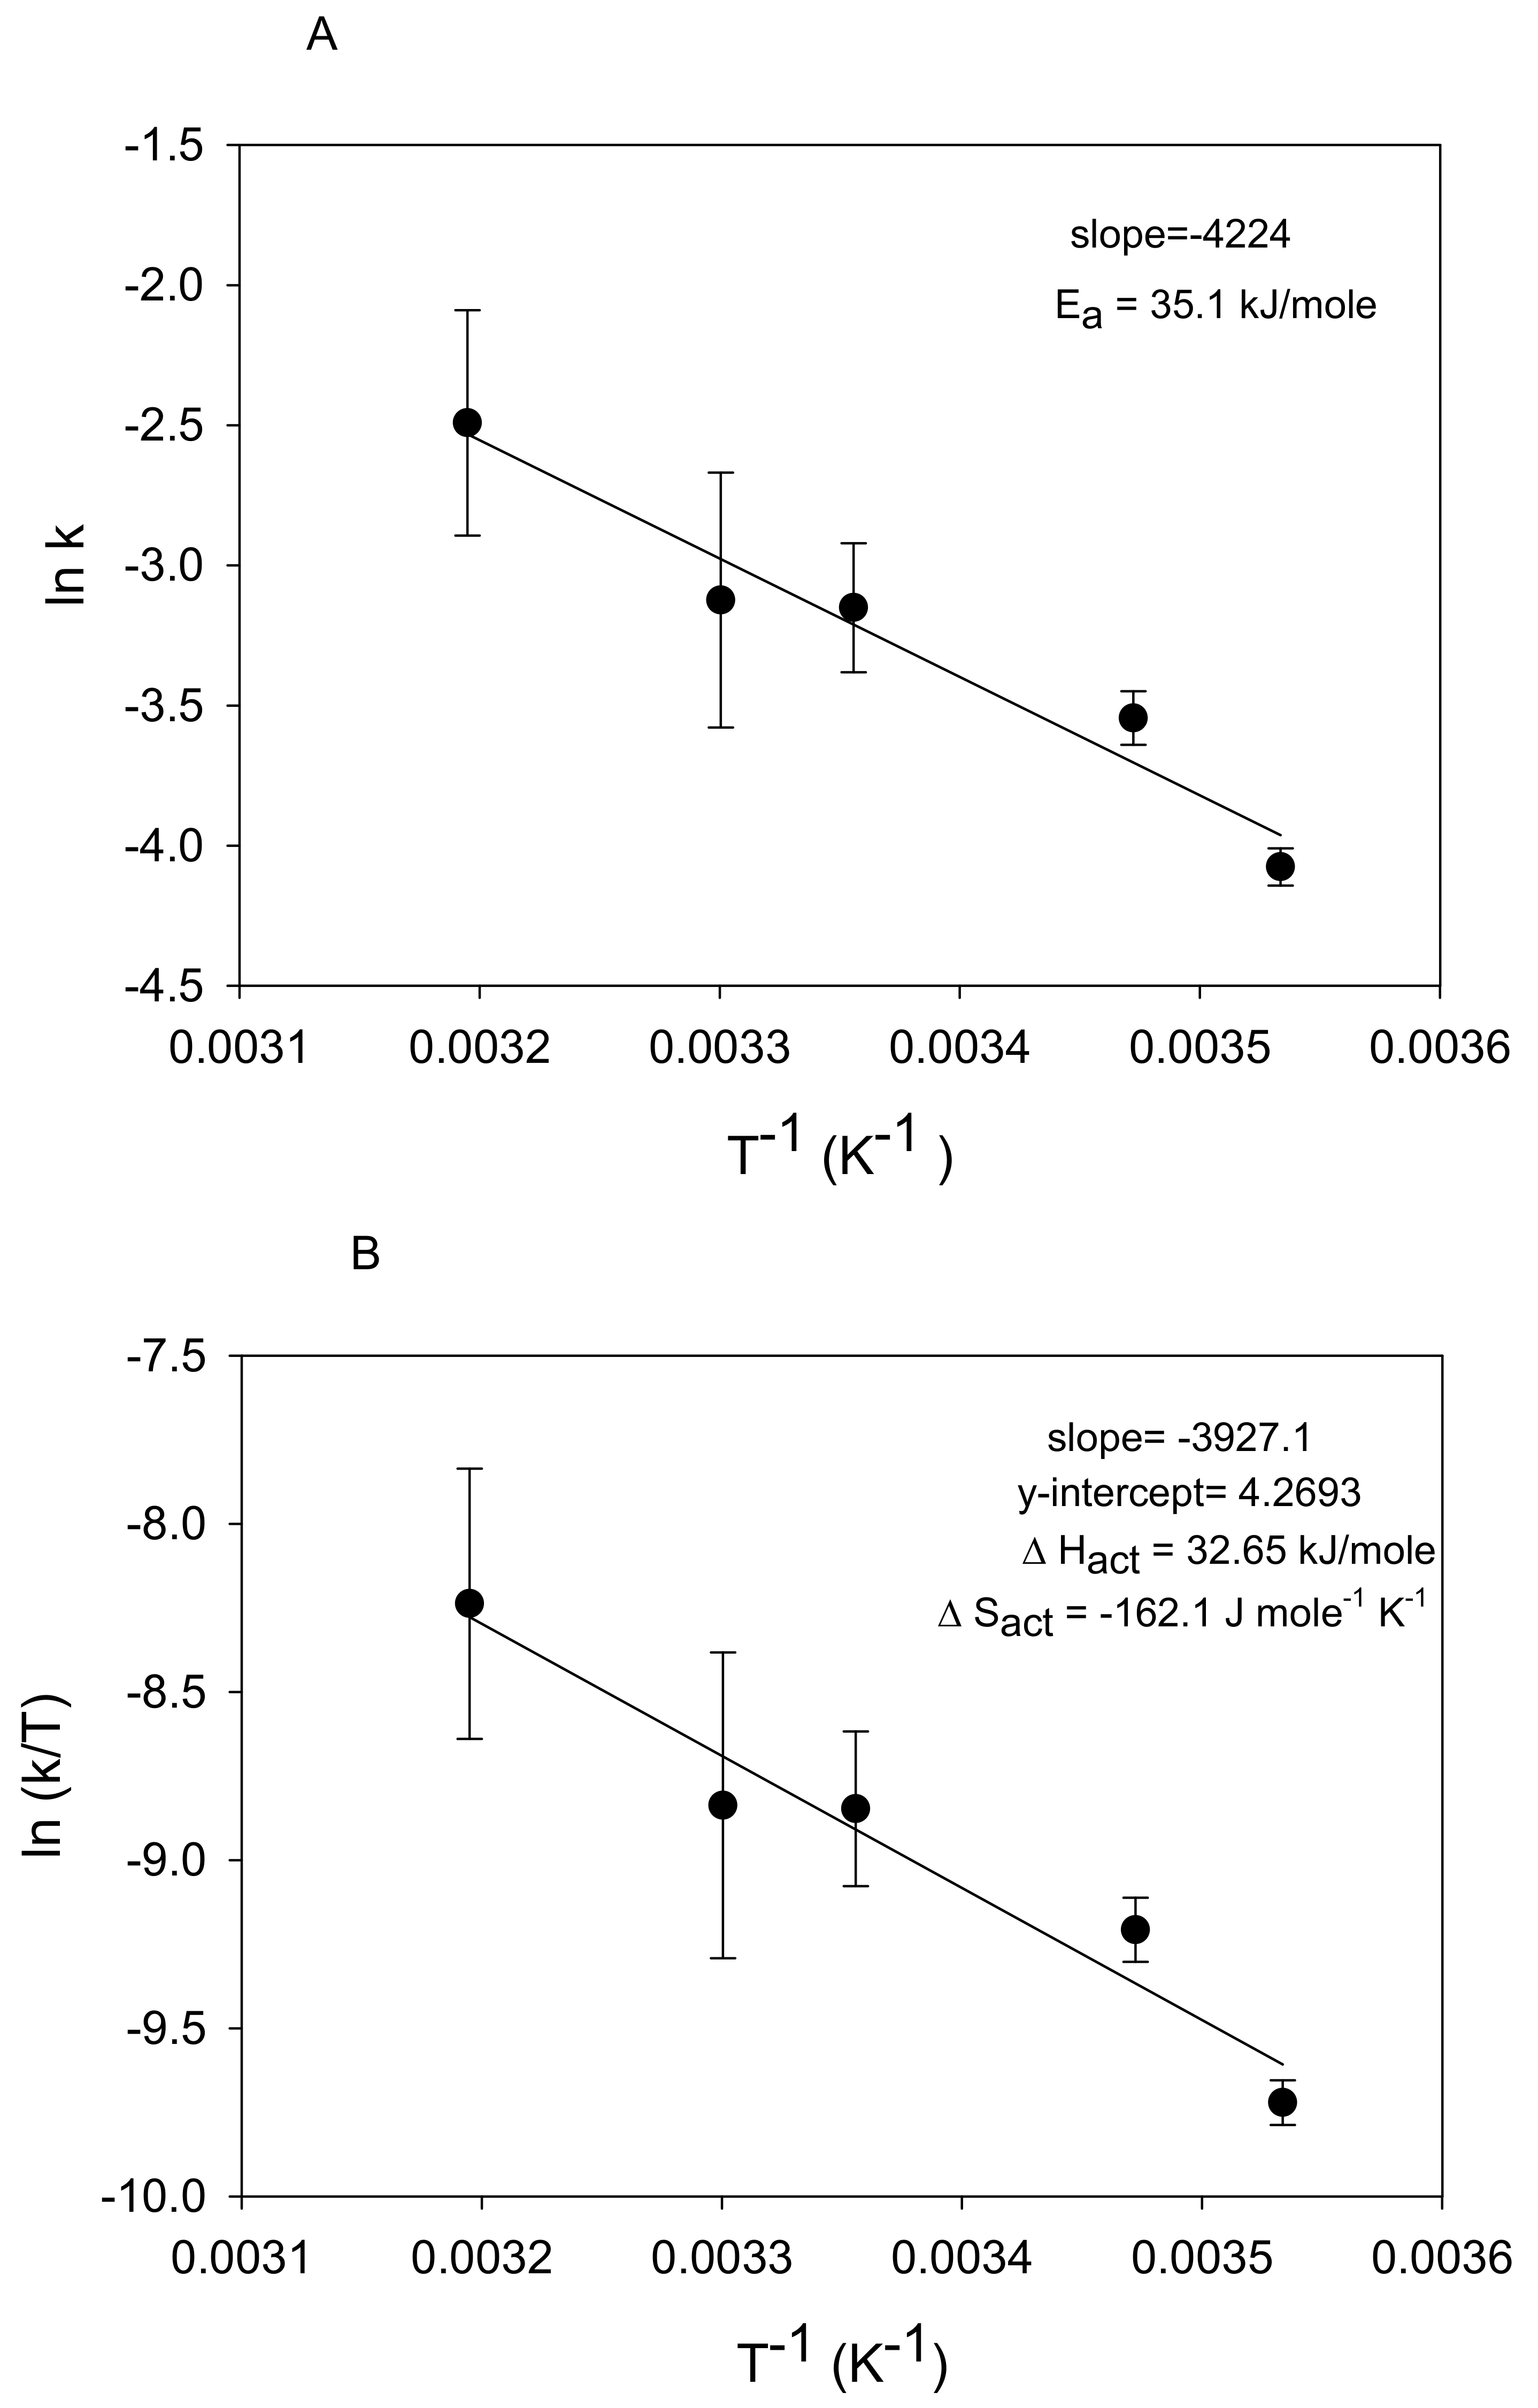
is plotted in Figure 6A as ln k versus 1/T. The slope value revealed a calculated value of 35.1 kJ mole−1 indicating that nitrate reduction is diffusion controlled as opposed to surface chemical-controlled. Sparks [20] and Luther [26] reported diffusion-controlled reactions have activation energies <42 kJ mol−1. This value is slightly greater than Ginner et al. [23] and Ahn et al. [24], who reported values of 21.7 kJ mol−1 and 28.2 kJ mol−1, respectively, for nitrate reduction by Fe0.
k = A exp−Ea/RT
The Eyring Equation (7) relates the rate constant found in the Arrhenius equation to the free energy of activation (ΔG‡) [27] where k is the rate constant at a given temperature T (K), h is Planck’s constant (6.626 × 10⁻³⁴ J s), k′ is Boltzmann’s constant (1.381 × 10⁻²³ J K−1), and R is the molar gas constant (0.008314 kJ mol−1 K−1).
k = (k′T/h)exp(−ΔG‡/RT)
Substituting the Gibbs free energy equation (ΔG‡ = ΔH‡ − TΔS‡) into Equation (7) yields ΔH‡ and ΔS‡ for the temperature data. The linear form of the equation is found by taking the logarithm of both sides of Equation (7), as shown in Equation (8).
ln(k/T) = −ΔH‡/RT + ln(k′/h) + ΔS‡/R
A plot of ln(k/T) vs. T−1 produces a line with ΔH‡/R as the slope and ln(k′/h) + ΔS‡/R as the y-intercept (Figure 6B). The calculated value of ΔS‡ is useful in determining the reaction mechanism, whether it is a dissociative or associative mechanism [27]. The ΔS‡ value (ΔSact) derived from the y-intercept in Figure 6B under our conditions was −162.1 J mol−1 K−1. A ΔS‡ value > 10 J mol−1 K−1 is indicative of a dissociative reaction and a value < −10 J mol−1 K−1 indicates an associative reaction [26,27]. This indicates that nitrate reduction by Fe0 in our experiments followed an associative mechanism. An associative mechanism involves a step in which an intermediate product is formed with a higher coordination number than the original complex [36]. The heightened reactivity of nitrite when compared with nitrate (Figure S2) corroborates an associative mechanism since this mechanism is sensitive to changes in the entering group [36]. The enthalpy of activation (ΔH‡ value or ΔHact) was 32.7 kJ/mole, consistent with slight temperature dependence.
3.3. Nitrate Reduction under Oxic Conditions
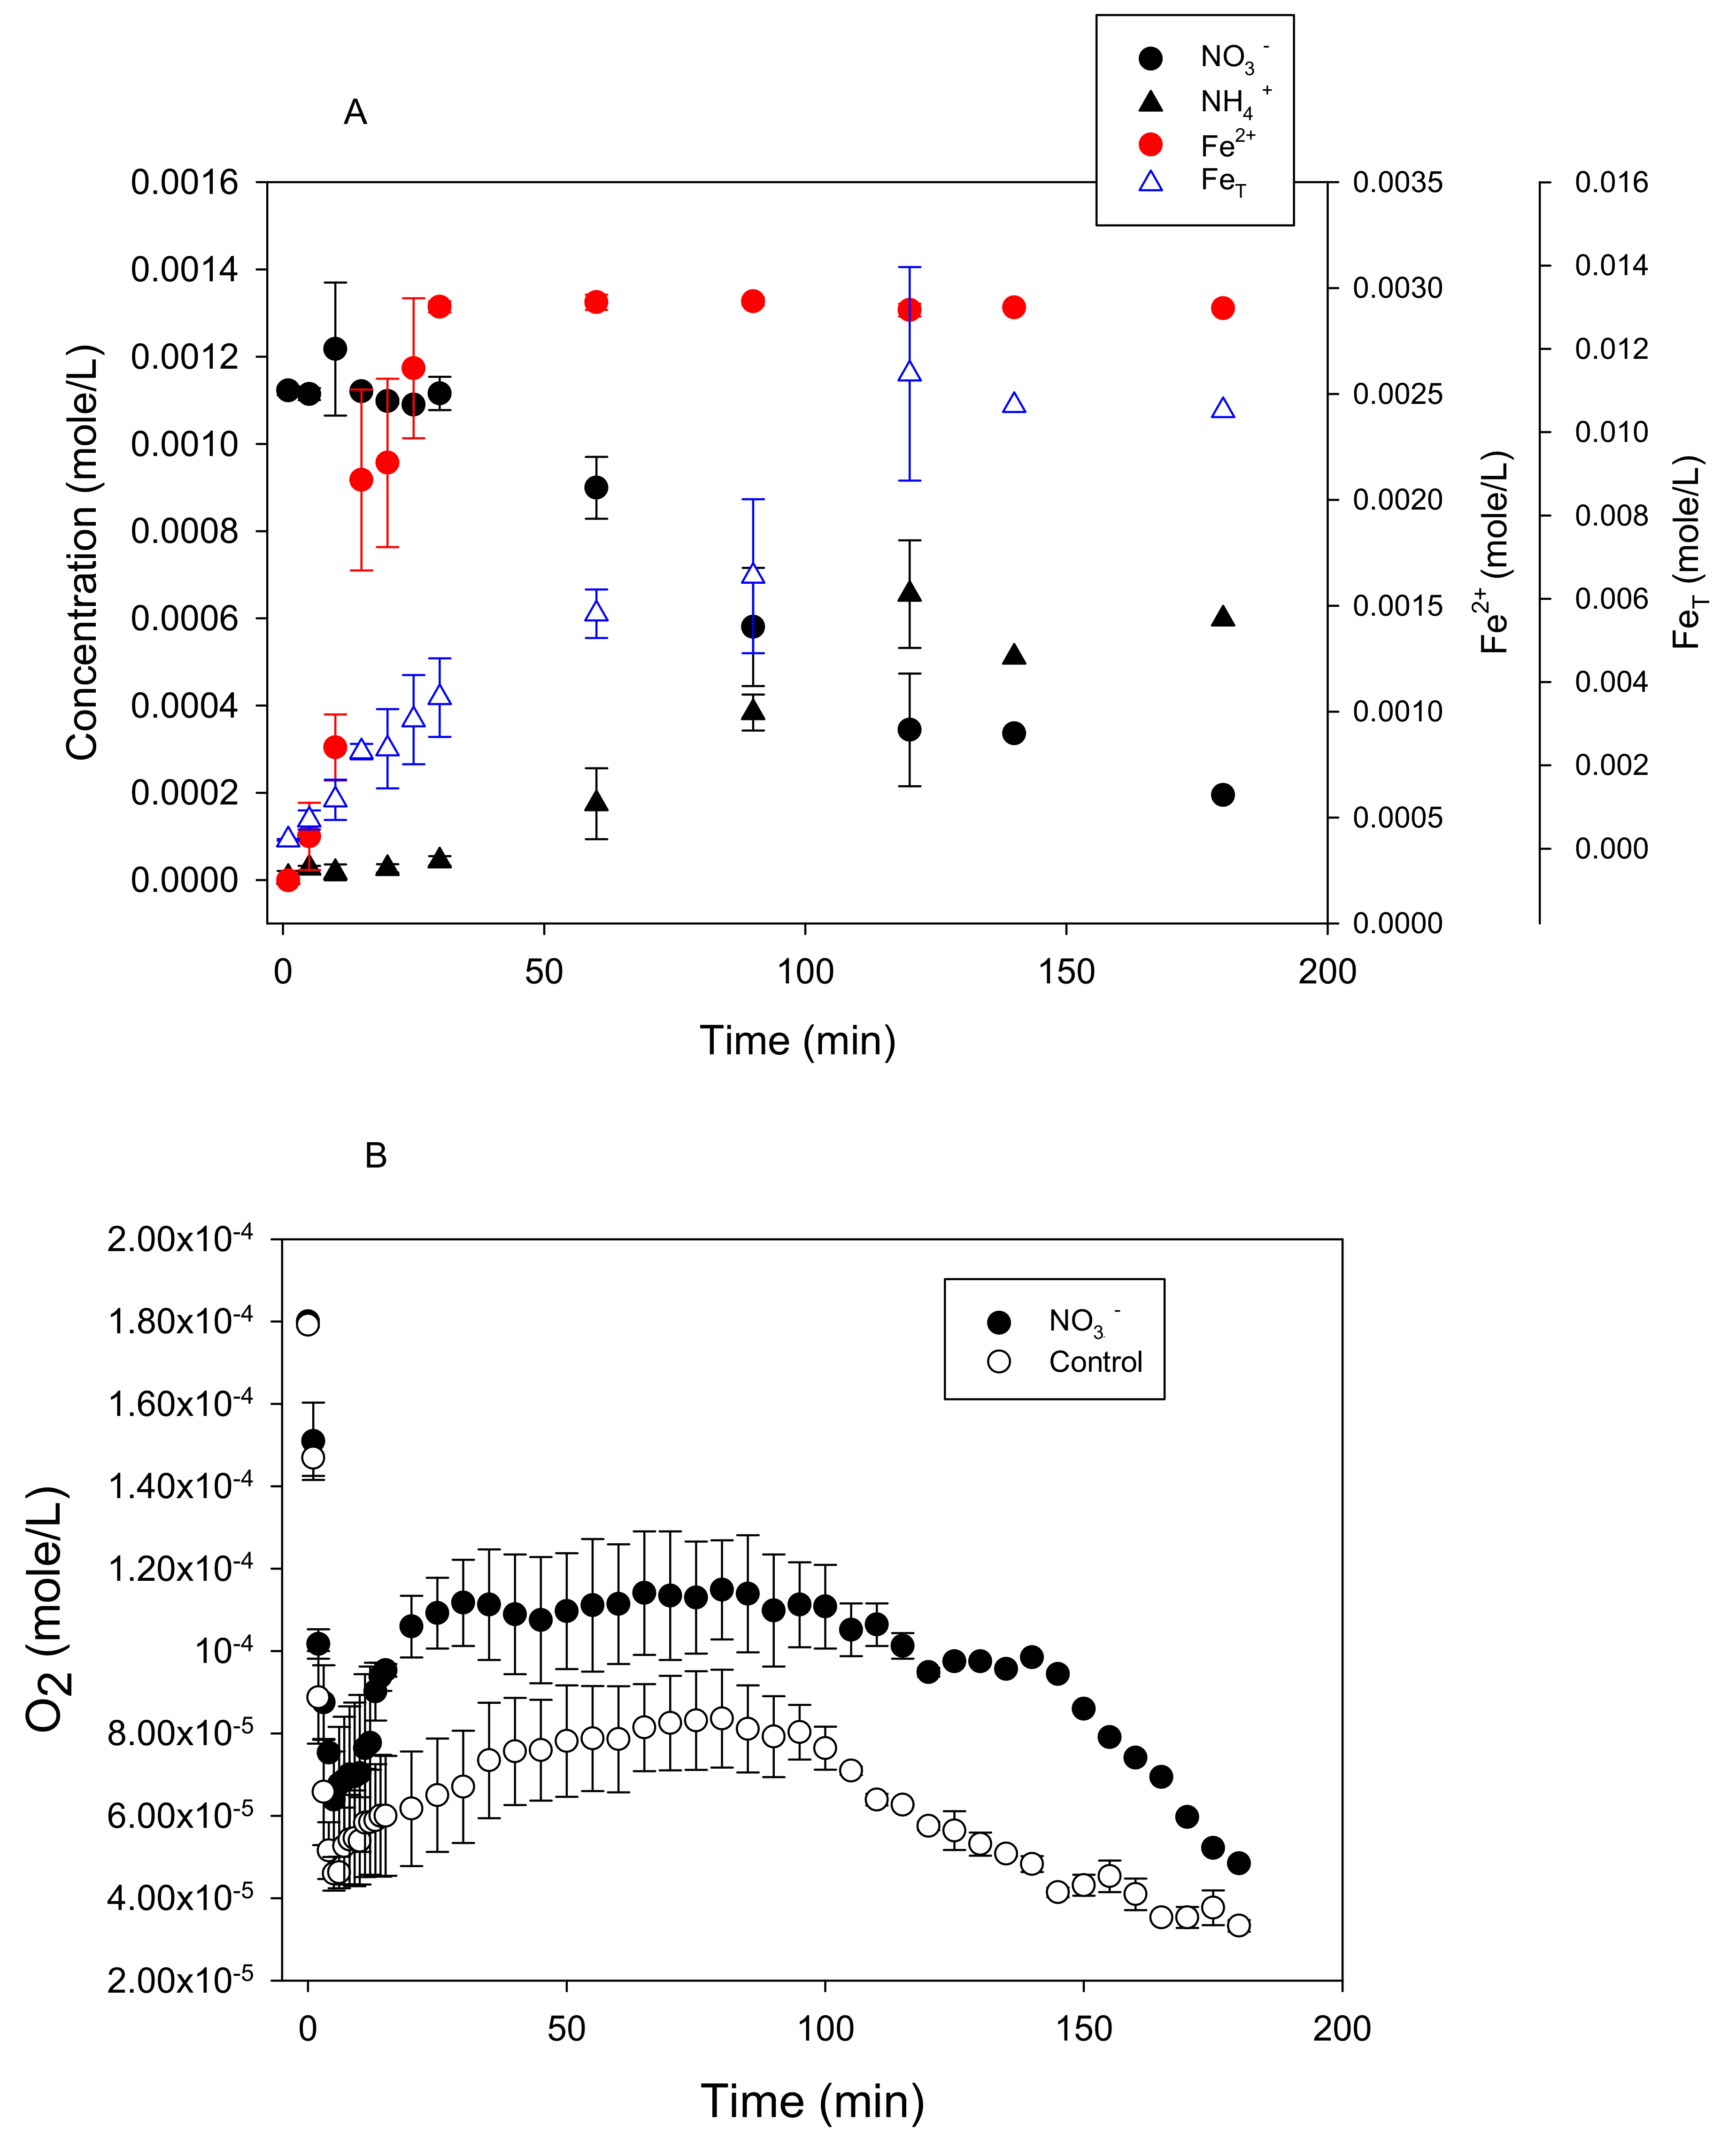
Under oxic conditions, there was a lag period of approximately 30 min before nitrate reduction began (Figure 7A). During this lag period, O2 concentrations dropped sharply and this was accompanied by an increase in Fe2+ production (Figure 7A,B). This suggests that O2 was used preferentially over NO3− as an oxidant for Fe0 oxidation. In the absence of added nitrate (control), there was a greater drop in O2 levels and there was a comparable increase in dissolved Fe2+ (Figure S3B) as in the experiments where nitrate was added. The rate of nitrate reduction, measured after the lag period (30–90 min), was 8.8 × 10⁻⁶ mole L−1 min−1, which is almost four-fold less than the reduction rate under anoxic conditions (~ 3.48 × 10⁻⁵ mole L−1 min−1) at 25 °C (Figure 1A).
Total dissolved iron (FeT) exceeded that of dissolved Fe2+ in both the control and nitrate-added experiments at longer reaction times (Figure 7A and Figure S3B). This indicates the presence of dissolved Fe3+ in oxic experiments because total Fe is a sum of dissolved Fe2+ and dissolved Fe3+. This contrasts with anoxic experiments, where FeT and dissolved Fe2+ coincided with one another in both nitrate-treated and control reactors (Figure 1A and Figure S3A).
4. Discussion
When considering the standard reduction potentials of zero-valent iron oxidation to Fe2+ coupled to nitrate reduction to ammonium [37], there is a strong thermodynamic driving force for the overall reaction denoted by Equation (1) to proceed in the forward direction. In our study, we evaluated the rate of nitrate reduction coupled to zero-valent oxidation by collecting fundamental kinetic data over a range of experimental conditions under anoxic conditions.
The experimental results indicate the following overall rate equation describing nitrate reduction by zero-valent Fe0(s):
where the overall rate coefficient (k) was found to be 3.1 × 10⁻³ L2 mol−1min−1g−1. This overall process can thus be conceptualized as occurring in five steps: (1) proton (H+) adsorption on an active site of Fe0(s) to form [18], (2) diffusion of nitrate to the (3) formation of a precursor surface complex between nitrate and (4) reduction of adsorbed nitrate to form ammonium and Fe(II), and (5) release of ammonium and Fe(II) to a solution. The slowest step that determines the rate must include the terms in Equation (9) [20]. The activation energy (35 kJ mol−1) predicts that nitrate reduction was diffusion controlled under our conditions. This suggests that either steps 2 or 5 are rate-limiting.
The finding that an associative mechanism is involved to describe nitrate reduction by Fe0 allows one to infer that an inner sphere redox process is operative [36]. In other words, significant bond formation occurs from the nitrate to the Fe0(s) surface site. To our knowledge, there are no spectroscopic studies showing the binding environment of NO3− with Fe0(s); however, there are some studies showing that nitrate adsorbs in a mono- and bi-dentate configuration with platinum (Pt) surface sites (NO2-O-Pt, NO-(O)2-Pt) [38] and in a bi-dentate configuration with elemental copper (Cu) surface sites [39]. Future work is needed to interrogate the nitrate-Fe0 interface to elucidate the nature of the surface complex.
It is reasonable to assume that the 8-electron transfer from nitrate to ammonium in Equation (1) consists of two elementary steps; the first being the reduction of nitrate to nitrite, a two electron transfer reaction, and the second, the reduction of nitrate to ammonium, a six electron transfer reaction. Once formed, nitrite was immediately reduced. This finding was further supported by observed nitrite concentrations remaining consistently below the detection limit throughout the nitrate reduction reactions and experiments showing the rapid reduction of nitrite with zero-valent iron (See Supplementary Materials, Figure S1). Nitrite occurring as a transient intermediate in the nitrate reduction by Fe0(s) agrees with past studies [10,40].
One of the uncertainties in our study is the role of the proton (H+). The fractional order dependence (0.8) based on our derived rate expression, in agreement with other studies where fractional order dependence has been reported [12], could be a composite of both the sorption of H+ on Fe0(s) active sites [18] and, in a complex manner, the reduction of H+ to form hydrogen gas (H2(g)) during anoxic oxidation of Fe0. The net reaction of the latter [28] is shown in Equation (10)
Fe0(s) + 2H+ ↔ Fe2+(aq) + H2(g)
Siantar et al. [10] reported extremely rapid nitrate reduction by zero-valent iron when performing the reaction in an H2 headspace. Further studies would be useful to tease out the role of H+ and H2 in nitrate reduction by zero-valent iron.
Wastewater and groundwater with nitrate might contain dissolved oxygen (DO). Therefore, we were interested in comparing rates of nitrate reduction by zero-valent iron under anoxic and oxic conditions. There was a lag period of approximately 30 min before nitrate reduction began under oxic conditions. During this lag period, there was an initial rapid decrease in DO concentration (Figure 7A,B). The initial decrease in O2 concentration in the early stages of the oxic treatment may be due to the rapid consumption of O2 by hydrogen gas (H2) formed during the corrosion of water-derived protons as in Equation (10).
O2 + 2H2 → 2H2O
In addition, the initial decrease in dissolved O2 may be due to a reaction with Fe0(s).
Fe0(s) + 0.5O2 +2H+ → Fe2+(aq) + H2O
The nearly four-fold slower rate of nitrate reduction (after the lag period) when compared with anoxic experiments might be due to the passivation of Fe0(s) surfaces by secondary mineral precipitates [33,34], leading to lower reactivity. Another possibility is nitrate reduction by the dissolved Fe2+ and secondary minerals present, such as magnetite [32]. While we do not have direct evidence to support these explanations, dissolved Fe3+ production becomes more pronounced in oxic experiments at longer reaction times (>30 min), corresponding to where nitrate reduction is engaged (Figure 7A).
The results from this study add to the body of knowledge concerning the reactivity of nitrate with zero-valent iron, which is important in light of the fact that iron represents the most used metal to remove nitrate from water [41]. It would be useful in future experiments to evaluate the reactivity of scrap iron, especially considering that these materials would be more readily available as filters to remove contaminants. Nonetheless, the fundamental kinetic data collected from this study describing nitrate reduction by zero-valent iron could be used to predict nitrate removal rates where permeable reactive barriers are installed to treat nitrate-contaminated groundwater. The groundwater flow rate is an important factor to consider in these models given the diffusion-controlled nature of nitrate reduction. If groundwater contains significant oxygen concentrations, our data show that the nitrate reduction rates are curtailed. Future experiments could be designed to identify the nature of the reactive species by including measurements of hydrogen gas throughout the nitrate reduction process. It might also be useful to run the reaction while separating the solution from the reacting solid and identify whether nitrate is directly reduced on the zero-valent iron surface or in the solution using spectroscopic techniques. These data could potentially provide a clearer explanation of the reaction mechanism.
Supplementary Materials
The following supporting information can be downloaded at: https://www.mdpi.com/article/10.3390/w14182796/s1, Figure S1: The stoichiometry of nitrate reduced to ammonium produced during the reaction between nitrate (0.001 M) and Fe0 (5 g/L) at pH 5.5 and 25 °C under anoxic conditions; Figure S2: Reactivity of 0.001 M nitrite in the presence of 5 g/L Fe0 at pH 5.5 and 25 °C under anoxic conditions; Figure S3: (A) Production of dissolved Fe2+ and total Fe (FeT) in control (no nitrate) of the anoxic treatments with 5 g/L Fe0 at pH 5.5 and 25 °C; (B) production of dissolved Fe2+ and total Fe (FeT) in control (no nitrate) of the oxic treatments with 5 g/L Fe0 at pH 5.5 and 25 °C. Figure S4: Reaction between dissolved Fe2+ and nitrate at pH 5.5 at 25 °C.
Author Contributions
Conceptualization, C.J.M. and K.M.W.; methodology, K.M.W., C.J.M. and T.K.; validation, C.J.M. and K.M.W.; formal analysis, C.J.M. and K.M.W.; resources, C.J.M.; data curation, K.M.W.; writing—original draft preparation, K.M.W. and C.J.M.; writing—review and editing, C.J.M., K.M.W. and T.K.; supervision, C.J.M.; project administration, C.J.M.; funding acquisition, C.J.M. All authors have read and agreed to the published version of the manuscript.
Funding
This research was funded by National Research Initiative Competitive Grant no. 2002-35107-12214 from the USDA Cooperative State Research, Education, and Extension Service.
Data Availability Statement
The data presented in this study are available in the article.
Acknowledgments
We are thankful to Yvonne Thompson for assistance in collecting X-ray diffraction data (UK), Larry Rice in ASTECC (UK) for assistance with SEM-EDS, and Tricia Coakley and John May in ERTL (UK) for analyzing ammonium data using the cation exchange chromatography.
Conflicts of Interest
The authors declare no conflict of interest. The funders had no role in the design of the study; in the collection, analyses, or interpretation of data; in the writing of the manuscript, or in the decision to publish the results.
References
- Adyasari, D.; Oehler, T.; Afiati, N.; Moosdorf, N. Groundwater nutrient inputs into an urbanized tropical estuary system in Indonesia. Sci. Total Environ. 2018, 627, 1066–1079. [Google Scholar] [CrossRef] [PubMed]
- Eick, M.J.; Brady, W.D.; Lynch, C.K. Charge Properties and Nitrate Adsorption of Some Acid Southeastern Soils. J. Environ. Qual. 1999, 28, 138–144. [Google Scholar] [CrossRef]
- Van de Waal, D.B.; Verspagen, J.M.; Lürling, M.; Van Donk, E.; Visser, P.M.; Huisman, J. The ecological stoichiometry of toxins produced by harmful cyanobacteria: An experimental test of the carbon-nutrient balance hypothesis. Ecol. Lett. 2009, 12, 1326–1335. [Google Scholar] [CrossRef] [PubMed]
- Sar, C.; Mwenya, B.; Pen, B.; Takaura, K.; Morikawa, R.; Tsujimoto, A.; Kuwaki, K.; Isogai, N.; Shinzato, I.; Asakura, Y.; et al. Effect of ruminal administration of Escherichia coli wild type or a genetically modified strain with enhanced high nitrite reductase activity on methane emission and nitrate toxicity in nitrate-infused sheep. Br. J. Nutr. 2005, 94, 691–697. [Google Scholar] [CrossRef] [PubMed]
- Rathod, S.K.; Velmurugan, S.; Ahluwalia, A. A ‘green’diet-based approach to cardiovascular health? Is inorganic nitrate the answer? Mol. Nutr. Food Res. 2016, 60, 185–202. [Google Scholar] [CrossRef]
- Su, H.; Cheng, Y.; Oswald, R.; Behrendt, T.; Trebs, I.; Meixner, F.X.; Andreae, M.O.; Cheng, P.; Zhang, Y.; Pöschl, U. Soil Nitrite as a Source of Atmospheric HONO and OH Radicals. Science 2011, 333, 1616–1618. [Google Scholar] [CrossRef]
- Wu, D.; Horn, M.A.; Behrendt, T.; Müller, S.; Li, J.; Cole, J.A.; Xie, B.; Ju, X.; Li, G.; Ermel, M.; et al. Soil HONO emissions at high moisture content are driven by microbial nitrate reduction to nitrite: Tackling the HONO puzzle. ISME J. 2019, 13, 1688–1699. [Google Scholar] [CrossRef]
- Tugaoen, H.; Garcia-Segura, S.; Hristovski, K.; Westerhoff, P. Challenges in photocatalytic reduction of nitrate as a water treatment technology. Sci. Total Environ. 2017, 599, 1524–1551. [Google Scholar] [CrossRef]
- Zhao, B.; Sun, Z.; Liu, Y. An overview of in-situ remediation for nitrate in groundwater. Sci. Total Environ. 2021, 804, 149981. [Google Scholar] [CrossRef]
- Siantar, D.P.; Schreier, C.G.; Chou, C.-S.; Reinhard, M. Treatment of 1,2-dibromo-3-chloropropane and nitrate-contaminated water with zero-valent iron or hydrogen/palladium catalysts. Water Res. 1996, 30, 2315–2322. [Google Scholar] [CrossRef]
- Huang, C.-P.; Wang, H.-W.; Chiu, P.-C. Nitrate reduction by metallic iron. Water Res. 1998, 32, 2257–2264. [Google Scholar] [CrossRef]
- Alowitz, J.M.; Scherer, M.M. Kinetics of nitrate, nitrite, and Cr (VI) reduction by iron metal. Environ. Sci. Technol. 2002, 36, 299–306. [Google Scholar] [CrossRef]
- Henderson, A.D.; Demond, A.H. Long-Term Performance of Zero-Valent Iron Permeable Reactive Barriers: A Critical Review. Environ. Eng. Sci. 2007, 24, 401–423. [Google Scholar] [CrossRef]
- Tepong-Tsindé, R.; Ndé-Tchoupé, A.I.; Noubactep, C.; Nassi, A.; Ruppert, H. Characterizing a Newly Designed Steel-Wool-Based Household Filter for Safe Drinking Water Provision: Hydraulic Conductivity and Efficiency for Pathogen Removal. Processes 2019, 7, 966. [Google Scholar] [CrossRef]
- Bakari, O.; Njau, K.N.; Noubactep, C. Fe0-Supported Anaerobic Digestion for Organics and Nutrients Removal from Domestic Sewage. Water 2022, 14, 1623. [Google Scholar] [CrossRef]
- Yang, H.; Hu, R.; Ndé-Tchoupé, A.I.; Gwenzi, W.; Ruppert, H.; Noubactep, C. Designing the Next Generation of Fe0-Based Filters for Decentralized Safe Drinking Water Treatment: A Conceptual Framework. Processes 2020, 8, 745. [Google Scholar] [CrossRef]
- Huang, Y.H.; Zhang, T.C. Kinetics of Nitrate Reduction by Iron at Near Neutral pH. J. Environ. Eng. 2002, 128, 604–611. [Google Scholar] [CrossRef]
- Rodríguez-Maroto, J.; García-Herruzo, F.; García-Rubio, A.; Gómez-Lahoz, C.; Vereda-Alonso, C. Kinetics of the chemical reduction of nitrate by zero-valent iron. Chemosphere 2009, 74, 804–809. [Google Scholar] [CrossRef]
- Cheng, I.; Muftikian, R.; Fernando, Q.; Korte, N. Reduction of nitrate to ammonia by zero-valent iron. Chemosphere 1997, 35, 2689–2695. [Google Scholar] [CrossRef]
- Sparks, D.L. Kinetics of Soil Chemical Processes; Academic Press: Cambridge, MA, USA, 2013. [Google Scholar]
- Lasaga, A.C. 1. Rate Laws of Chemical Reactions. In Kinetic Theory in the Earth Sciences; Princeton University Press: Princeton, NJ, USA, 1998. [Google Scholar] [CrossRef]
- Westerhoff, P.; James, J. Nitrate removal in zero-valent iron packed columns. Water Res. 2003, 37, 1818–1830. [Google Scholar] [CrossRef]
- Ginner, J.L.; Alvarez, P.J.; Smith, S.L.; Scherer, M.M. Nitrate and nitrite reduction by Fe0: Influence of mass transport, temperature, and denitrifying microbes. Environ. Eng. Sci. 2004, 21, 219–229. [Google Scholar] [CrossRef]
- Ahn, S.C.; Oh, S.-Y.; Cha, D.K. Enhanced reduction of nitrate by zero-valent iron at elevated temperatures. J. Hazard. Mater. 2008, 156, 17–22. [Google Scholar] [CrossRef] [PubMed]
- Kim, I.; Cha, D.K. Effect of low temperature on abiotic and biotic nitrate reduction by zero-valent Iron. Sci. Total Environ. 2020, 754, 142410. [Google Scholar] [CrossRef] [PubMed]
- Luther, G.W., III. Inorganic Chemistry for Geochemistry and Environmental Sciences: Fundamentals and Applications; John Wiley & Sons: Hoboken, NJ, USA, 2016. [Google Scholar]
- Atwood, J.D. Inorganic and Organometallic Reaction Mechanisms; John Wiley & Sons: Hoboken, NJ, USA, 1997. [Google Scholar]
- Powell, R.M.; Puls, R.W.; Hightower, S.K.; Sabatini, D.A. Coupled Iron Corrosion and Chromate Reduction: Mechanisms for Subsurface Remediation. Environ. Sci. Technol. 1995, 29, 1913–1922. [Google Scholar] [CrossRef]
- Yang, G.C.; Lee, H.-L. Chemical reduction of nitrate by nanosized iron: Kinetics and pathways. Water Res. 2005, 39, 884–894. [Google Scholar] [CrossRef]
- Huang, Y.H.; Zhang, T.C. Effects of low pH on nitrate reduction by iron powder. Water Res. 2004, 38, 2631–2642. [Google Scholar] [CrossRef]
- Stookey, L.L. Ferrozine—A new spectrophotometric reagent for iron. Anal. Chem. 1970, 42, 779–781. [Google Scholar] [CrossRef]
- Huang, Y.H.; Zhang, T.C.; Shea, P.J.; Comfort, S.D. Effects of Oxide Coating and Selected Cations on Nitrate Reduction by Iron Metal. J. Environ. Qual. 2003, 32, 1306–1315. [Google Scholar] [CrossRef]
- Furukawa, Y.; Kim, J.-W.; Watkins, J.; Wilkin, R.T. Formation of Ferrihydrite and Associated Iron Corrosion Products in Permeable Reactive Barriers of Zero-Valent Iron. Environ. Sci. Technol. 2002, 36, 5469–5475. [Google Scholar] [CrossRef]
- Tang, C.; Huang, Y.H.; Zeng, H.; Zhang, Z. Reductive removal of selenate by zero-valent iron: The roles of aqueous Fe2+ and corrosion products, and selenate removal mechanisms. Water Res. 2014, 67, 166–174. [Google Scholar] [CrossRef]
- Wieland, E.; Wehrli, B.; Stumm, W. The coordination chemistry of weathering: III. A generalization on the dissolution rates of minerals. Geochim. Cosmochim. Acta 1988, 52, 1969–1981. [Google Scholar] [CrossRef]
- Shriver, D.; Atkins, P.; Langford, C.H. Inorganic Chemistry; Oxford University Press: Oxford, UK, 1994; p. 790. [Google Scholar]
- Bard, A. Standard Potentials in Aqueous Solution; Routledge: Oxfordshire, UK, 2017. [Google Scholar]
- Nakata, K.; Kayama, Y.; Shimazu, K.; Yamakata, A.; Ye, S.; Osawa, M. Surface-enhanced infrared absorption spectroscopic studies of adsorbed nitrate, nitric oxide, and related compounds 2: Nitrate ion adsorption at a platinum electrode. Langmuir 2008, 24, 4358–4363. [Google Scholar] [CrossRef]
- Bae, S.-E.; Stewart, A.K.L.; Gewirth, A.A. Nitrate Adsorption and Reduction on Cu(100) in Acidic Solution. J. Am. Chem. Soc. 2007, 129, 10171–10180. [Google Scholar] [CrossRef]
- Su, C.; Puls, R.W. Nitrate Reduction by Zerovalent Iron: Effects of Formate, Oxalate, Citrate, Chloride, Sulfate, Borate, and Phosphate. Environ. Sci. Technol. 2004, 38, 2715–2720. [Google Scholar] [CrossRef]
- Curcio, G.M.; Limonti, C.; Siciliano, A.; Kabdaşlı, I. Nitrate Removal by Zero-Valent Metals: A Comprehensive Review. Sustainability 2022, 14, 4500. [Google Scholar] [CrossRef]
Figure 1.
Reactivity experiments showing anoxic NO3− (0.001 M) removal from solution by Fe0 (5 g/L) at pH 5.5 and 25 °C concomitant with (A) Fe2+, FeT, and NH4+ production. The stoichiometry between NO3− removal and (B) Fe2+ production.
Figure 1.
Reactivity experiments showing anoxic NO3− (0.001 M) removal from solution by Fe0 (5 g/L) at pH 5.5 and 25 °C concomitant with (A) Fe2+, FeT, and NH4+ production. The stoichiometry between NO3− removal and (B) Fe2+ production.

Figure 2.
X-ray diffraction (XRD) analysis (A) and scanning electron micrograph (SEM) (B) of unreacted Fe0 and XRD and SEM coupled with energy dispersive X-rays (SEM-EDS) (C,D) of reacted Fe0 in anoxic reactivity experiments with 0.001 M NO3− (5 g Fe0/L) at pH 5.5 and 25 °C. The inset of the XRD in (C) is the EDS spectrum of the cube-shaped precipitates.

Figure 4.
Representative log-log plots of log R versus (A) log (nitrate), (B) log (Fe0), and (C) log (H+).
Figure 4.
Representative log-log plots of log R versus (A) log (nitrate), (B) log (Fe0), and (C) log (H+).

Figure 5.
Reduction of nitrate as a function of temperature (10–40 °C, 283–313 K) at pH 5.5 and an initial nitrate concentration of 0.001 M and 5 g Fe0 L−1.
Figure 5.
Reduction of nitrate as a function of temperature (10–40 °C, 283–313 K) at pH 5.5 and an initial nitrate concentration of 0.001 M and 5 g Fe0 L−1.

Figure 6.
The Arrhenius (A) and Eyring (B) plots for the temperature data in Figure 5.
Figure 6.
The Arrhenius (A) and Eyring (B) plots for the temperature data in Figure 5.

Figure 7.
Reactivity experiments showing oxic NO3− (0.001 M) removal from solution by Fe0 (5 g/L) at pH 5.5 and 25 °C concomitant with (A) Fe2+, FeT, and NH4+ production and (B) dissolved O2 removal.
Figure 7.
Reactivity experiments showing oxic NO3− (0.001 M) removal from solution by Fe0 (5 g/L) at pH 5.5 and 25 °C concomitant with (A) Fe2+, FeT, and NH4+ production and (B) dissolved O2 removal.

Publisher’s Note: MDPI stays neutral with regard to jurisdictional claims in published maps and institutional affiliations. |
© 2022 by the authors. Licensee MDPI, Basel, Switzerland. This article is an open access article distributed under the terms and conditions of the Creative Commons Attribution (CC BY) license (https://creativecommons.org/licenses/by/4.0/).
Share and Cite
MDPI and ACS Style
Wagner, K.M.; Karathanasis, T.; Matocha, C.J. Reactivity of Nitrate with Zero-Valent Iron. Water 2022, 14, 2796. https://doi.org/10.3390/w14182796
AMA Style
Wagner KM, Karathanasis T, Matocha CJ. Reactivity of Nitrate with Zero-Valent Iron. Water. 2022; 14(18):2796. https://doi.org/10.3390/w14182796
Chicago/Turabian StyleWagner, Katie M., Tasios Karathanasis, and Christopher J. Matocha. 2022. "Reactivity of Nitrate with Zero-Valent Iron" Water 14, no. 18: 2796. https://doi.org/10.3390/w14182796
Note that from the first issue of 2016, this journal uses article numbers instead of page numbers. See further details here.