
Topographical Characteristics of Frequent Urban Pluvial Flooding Areas in Osaka and Nagoya Cities, Japan
by
 ,
,
Daisuke Komori
1,*,
Kota Nakaguchi
2,
Ryosuke Inomata
1,
Yuika Oyatsu
1,
Ryohei Tachikawa
1 and
So Kazama
1 1
Department of Civil and Environmental Engineering, Tohoku University, Sendai 980-8579, Japan
2
Public-Use Systems Department 1, Kobe Works, Mitsubishi Electric Corporation, Kobe 652-8555, Japan
*
Author to whom correspondence should be addressed.
Water 2022, 14(18), 2795; https://doi.org/10.3390/w14182795
Submission received: 8 August 2022
/
Revised: 30 August 2022
/
Accepted: 6 September 2022
/
Published: 8 September 2022
(This article belongs to the Special Issue Urban Water-Related Problems)
Abstract
:Flooding area records have been available since 1993 in Japan; however, there have been no studies that have utilised these records to elucidate urban pluvial flooding formation mechanisms. Therefore, frequent urban pluvial flooding areas using 20 years of urban pluvial flooding area records during 1993–2012 were identified and analysed using the principal component analysis of their topographical characteristics in Osaka and Nagoya Cities, Japan. The results showed that the topographical characteristics of the frequent urban pluvial flooding areas in both cities were different, with particularly conflicting trends in principal component 1. Furthermore, the urban pluvial flooding in Osaka City could not be described solely by topographical characteristics, and the influence of anthropogenic factors such as dominant structures that may influence inundated water flows in and around frequent urban pluvial flooding areas and stormwater drainage improvements on the occurrence of urban pluvial flooding were shown to be influential. In addition, most of the frequent urban pluvial flooding areas in Nagoya City were located on almost no gradient with a slope of less than 1 degree, and thus, the mere presence of dominant structures around it would dam up the inundated water and cause urban pluvial flooding. The results of this study quantitatively showed the paradigm shift of urban pluvial flooding factors from topographical characteristics to anthropogenic characteristics by the statistical analysis of newly defined urban pluvial flooding frequency areas.
1. Introduction
Urban flooding has had a strong negative impact on many cities around the world for most of human history and certainly in recent decades [1,2,3]. More than half of the global population lives in urbanised areas, and the frequency as well as the intensity of hydro-meteorological extremes are on the rise [4,5]. Urban flooding is therefore likely to cause greater losses in the coming decades. For example, urban flooding and associated property damage accounted for 73% of the total damage caused by flooding in the USA from 1960 to 2016, amounting to USD 107.8 billion [6]. Of the total damage caused by flooding in Japan’s three largest cities, namely Tokyo’s 23 wards, Osaka City, and Nagoya City, from 2006 to 2013, 82% of the total damage was caused by urban pluvial flooding [7]. Urban pluvial flooding is one of the typical urban floodings and flood damage that occurs when rainwater is not discharged to mainstream or tributary rivers because rainfall exceeds the design capacity of a drainage facility. In recent years, severe urban pluvial flooding has been caused by the reduction of rainwater soil penetration amounts because of changes in land use and increased strong downpour occurrence frequency. Furthermore, according to the IPCC assessment report [8], the risk of urban pluvial flooding in urban areas will increase in the future as a result of increased strong downpours due to climate change. Therefore, it is important to clarify the characteristics of past urban pluvial flooding areas in large cities and urbanising cities, where damage from urban pluvial flooding will become more apparent in the future, and take efficient countermeasures against urban pluvial flooding.
Managing urban flood risk is a high priority worldwide, as suggested by a large number of cities, from all continents, taken as case studies in recent research papers dedicated to urban flood modelling [9]. In Japan, it has become mandatory for local authorities to publish urban pluvial flooding hazard maps as a measure against urban pluvial flooding. On the other hand, the spatial and temporal characteristics of flooding in urban areas are complex due to extensive changes to land use [10] that introduce micro-urban features such as buildings, roads, and drainage networks [11,12], and most inundation simulations cannot accurately simulate flooding in urban areas [13]. Thus, flooding simulations using physical models represent the flooding mechanism through known physical analyses. Therefore, if the unknown factors are mainly important for the inundation mechanism, the accuracy will be low. On the other hand, the statistical analytical approach is considered to be able to elucidate the distribution of areas where urban pluvial flooding frequently occurs (hereafter referred to as frequent urban pluvial areas) based on past flooding area records and to quantitatively evaluate their characteristics, including unknown factors that cannot be considered in flooding simulations [14].
A statistical analytical approach has been greatly developed by utilising several appropriate factors, such as bedrock geology, soil properties, land use, drainage networks, road networks, building, and precipitation. Some previous studies have identified flood mechanisms. For example, Fariza et al. (2019) used fuzzy multi-criteria decision making (FMCDM) to assess urban flood risk levels in Sidoarjo, Indonesia [15]. Sato and Hayashi (2014) used principal component analysis (PCA) to analyse the main topographic characteristics of inundation in the Musashino Plateau of Tokyo and Saitama [16]. However, no report of an earlier study describes the quantitative assessment of the universal characteristics of flood-prone areas because they analysed areas where inundation has occurred at least once [14], and most of the earlier studies were limited to case studies of one city or one case study.
Djamres et al. (2021) identified the frequent urban pluvial flooding areas using seven years of urban pluvial flooding area records during 2008–2015 and analysed, using the PCA, their topographical characteristics in Tangerang, Indonesia [14]. Results showed that frequent urban pluvial flooding areas in Tangerang emerged because of a slope in the upstream condition, the correlation between concave and flow length conditions, the correlation of the slope condition and distance to a river, and relationships among flow length in upstream characteristics and distance to a pond. Furthermore, 29% of frequent urban pluvial flooding areas had low topographical similarity because of anthropogenic factors such as changes in overland flow directions due to the change of a slope in the upstream condition by land-use change and trapping of flood water by “dominant structures” that may influence inundated water flows in and around frequent urban pluvial flooding areas. Mignot and Dewals (2022) argued that a particular impediment to progress in urban flood modelling science is that the conclusions of most studies remain genuinely site-specific formulations and that significant progress could be made by attempting to extract general knowledge from the collection of existing case studies [9]. They also suggested that this may be achieved by designing appropriate metrics for classifying and standardizing the definition of flooding scenarios, investigated processes, and effects of analysed factors [9]. As the newly defined urban pluvial flooding frequency areas contain primary factors related to flooding mechanisms, statistical analysis of frequent urban pluvial flooding areas may reveal previously unknown factors such as anthropogenic factors and their relative influence on the flooding mechanism.
In Japan, flooding area records have been available since 1993, and Kakehashi et al. (2014) [17] used these records to identify frequent river flooding areas throughout Japan and to elucidate their formation mechanisms. However, there have been no studies that have utilised these records for urban pluvial flooding. Therefore, the objectives of this study were to identify the frequent urban pluvial flooding area using these records for 20 years during 1993–2012 in Osaka and Nagoya Cities, the two cities with the largest proportion of urban pluvial flooding damage from 2006 to 2013 [7], and to analyse the topographical characteristics of frequent urban pluvial flooding areas and their distribution at both cities by applying methods reported by Djamres et al. (2021) [14]. This study also aimed to elucidate anthropogenic characteristics of urban pluvial flooding from the views of the location of “dominant structures” and the impact of drainage system improvement.
2. Materials and Methods
2.1. Study Area
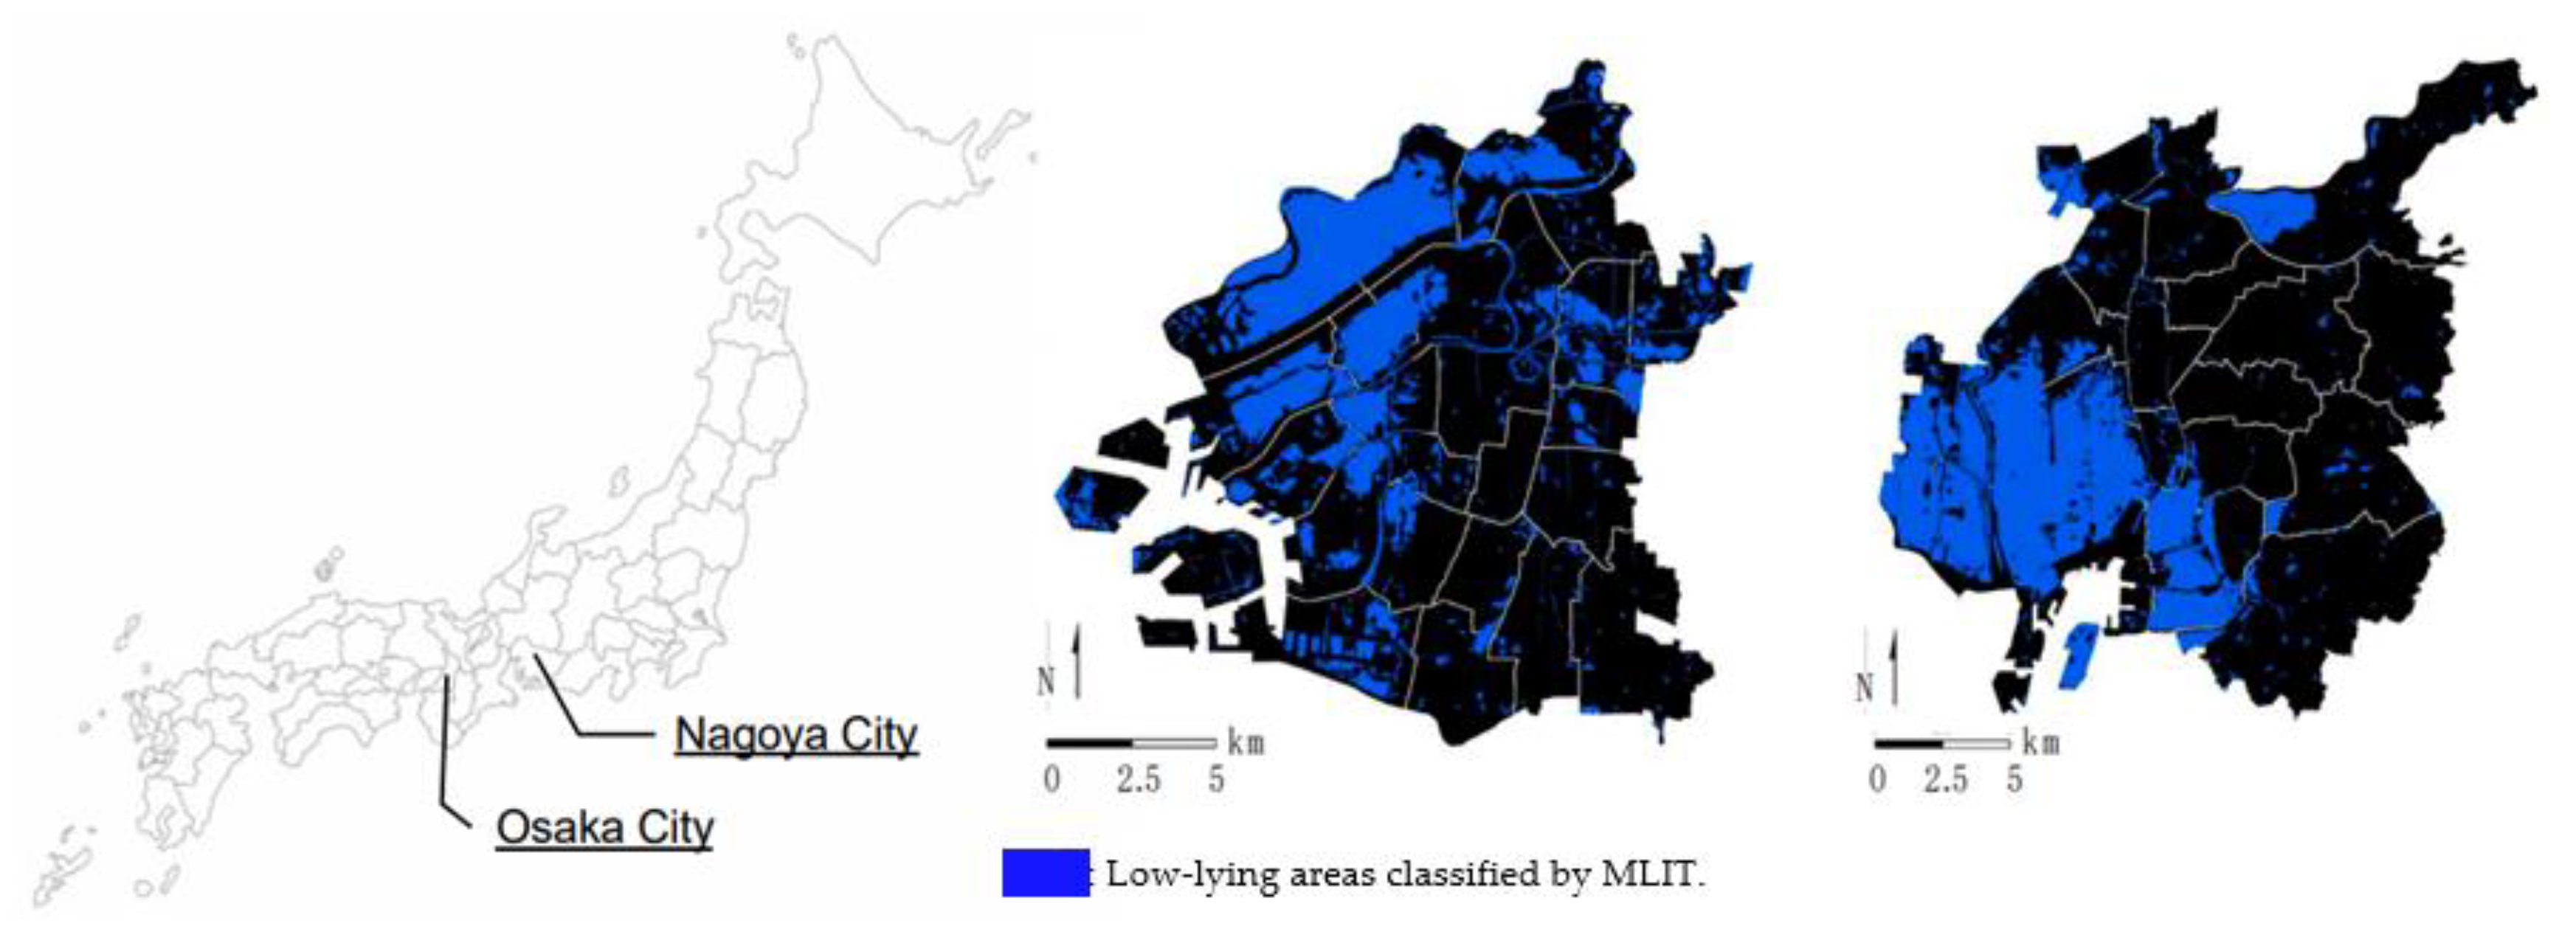
In this study, two cities, namely Osaka and Nagoya Cities in Japan, were selected as the study area. The location and detailed information of the target cities in Japan are shown in Figure 1 and Table 1. These cities were selected because their urbanised areas cover more than 90% of the city area, while they have differences in urban population, urban area population, and other factors related to the urban scale of the cities, and therefore, they are suitable for this study to compare characteristics of urban pluvial flooding areas due to differences in an urban scale. Furthermore, there were relatively more urban pluvial flooding area records than in other cities, and it was thought that more reliable analysis results could be obtained (in detail, see Section 2.2). In addition, the amount of capital expenditure on sewerage projects in each city was large, and it was considered that cities with larger investments in sewerage projects were more likely to have experienced more urban pluvial flooding in the past (Table 1).
The annual maximum one-hour rainfall data as short-time extreme rainfall causing urban pluvial flooding in the study area for 20 years during 1993–2012 in Osaka and Nagoya Cities are shown in Table 2. One-hour precipitation data from JMA AMeDAS stations (Osaka: 34°40.9′ N, 135°31.1′ E; Nagoya: 35°10.0′ N, 136°57.9′ E) were used [19]. The average annual maximum one-hour rainfall was 33.2 mm in Osaka City and 39.4 mm in Nagoya City, respectively. Above-average annual maximum one-hour rainfalls were recorded seven times in Osaka and nine times in Nagoya, with no bias towards increased annual maximum one-hour rainfall through the 20-year period 1993–2012.
2.2. Identification of Frequent Urban Pluvial Flooding Areas
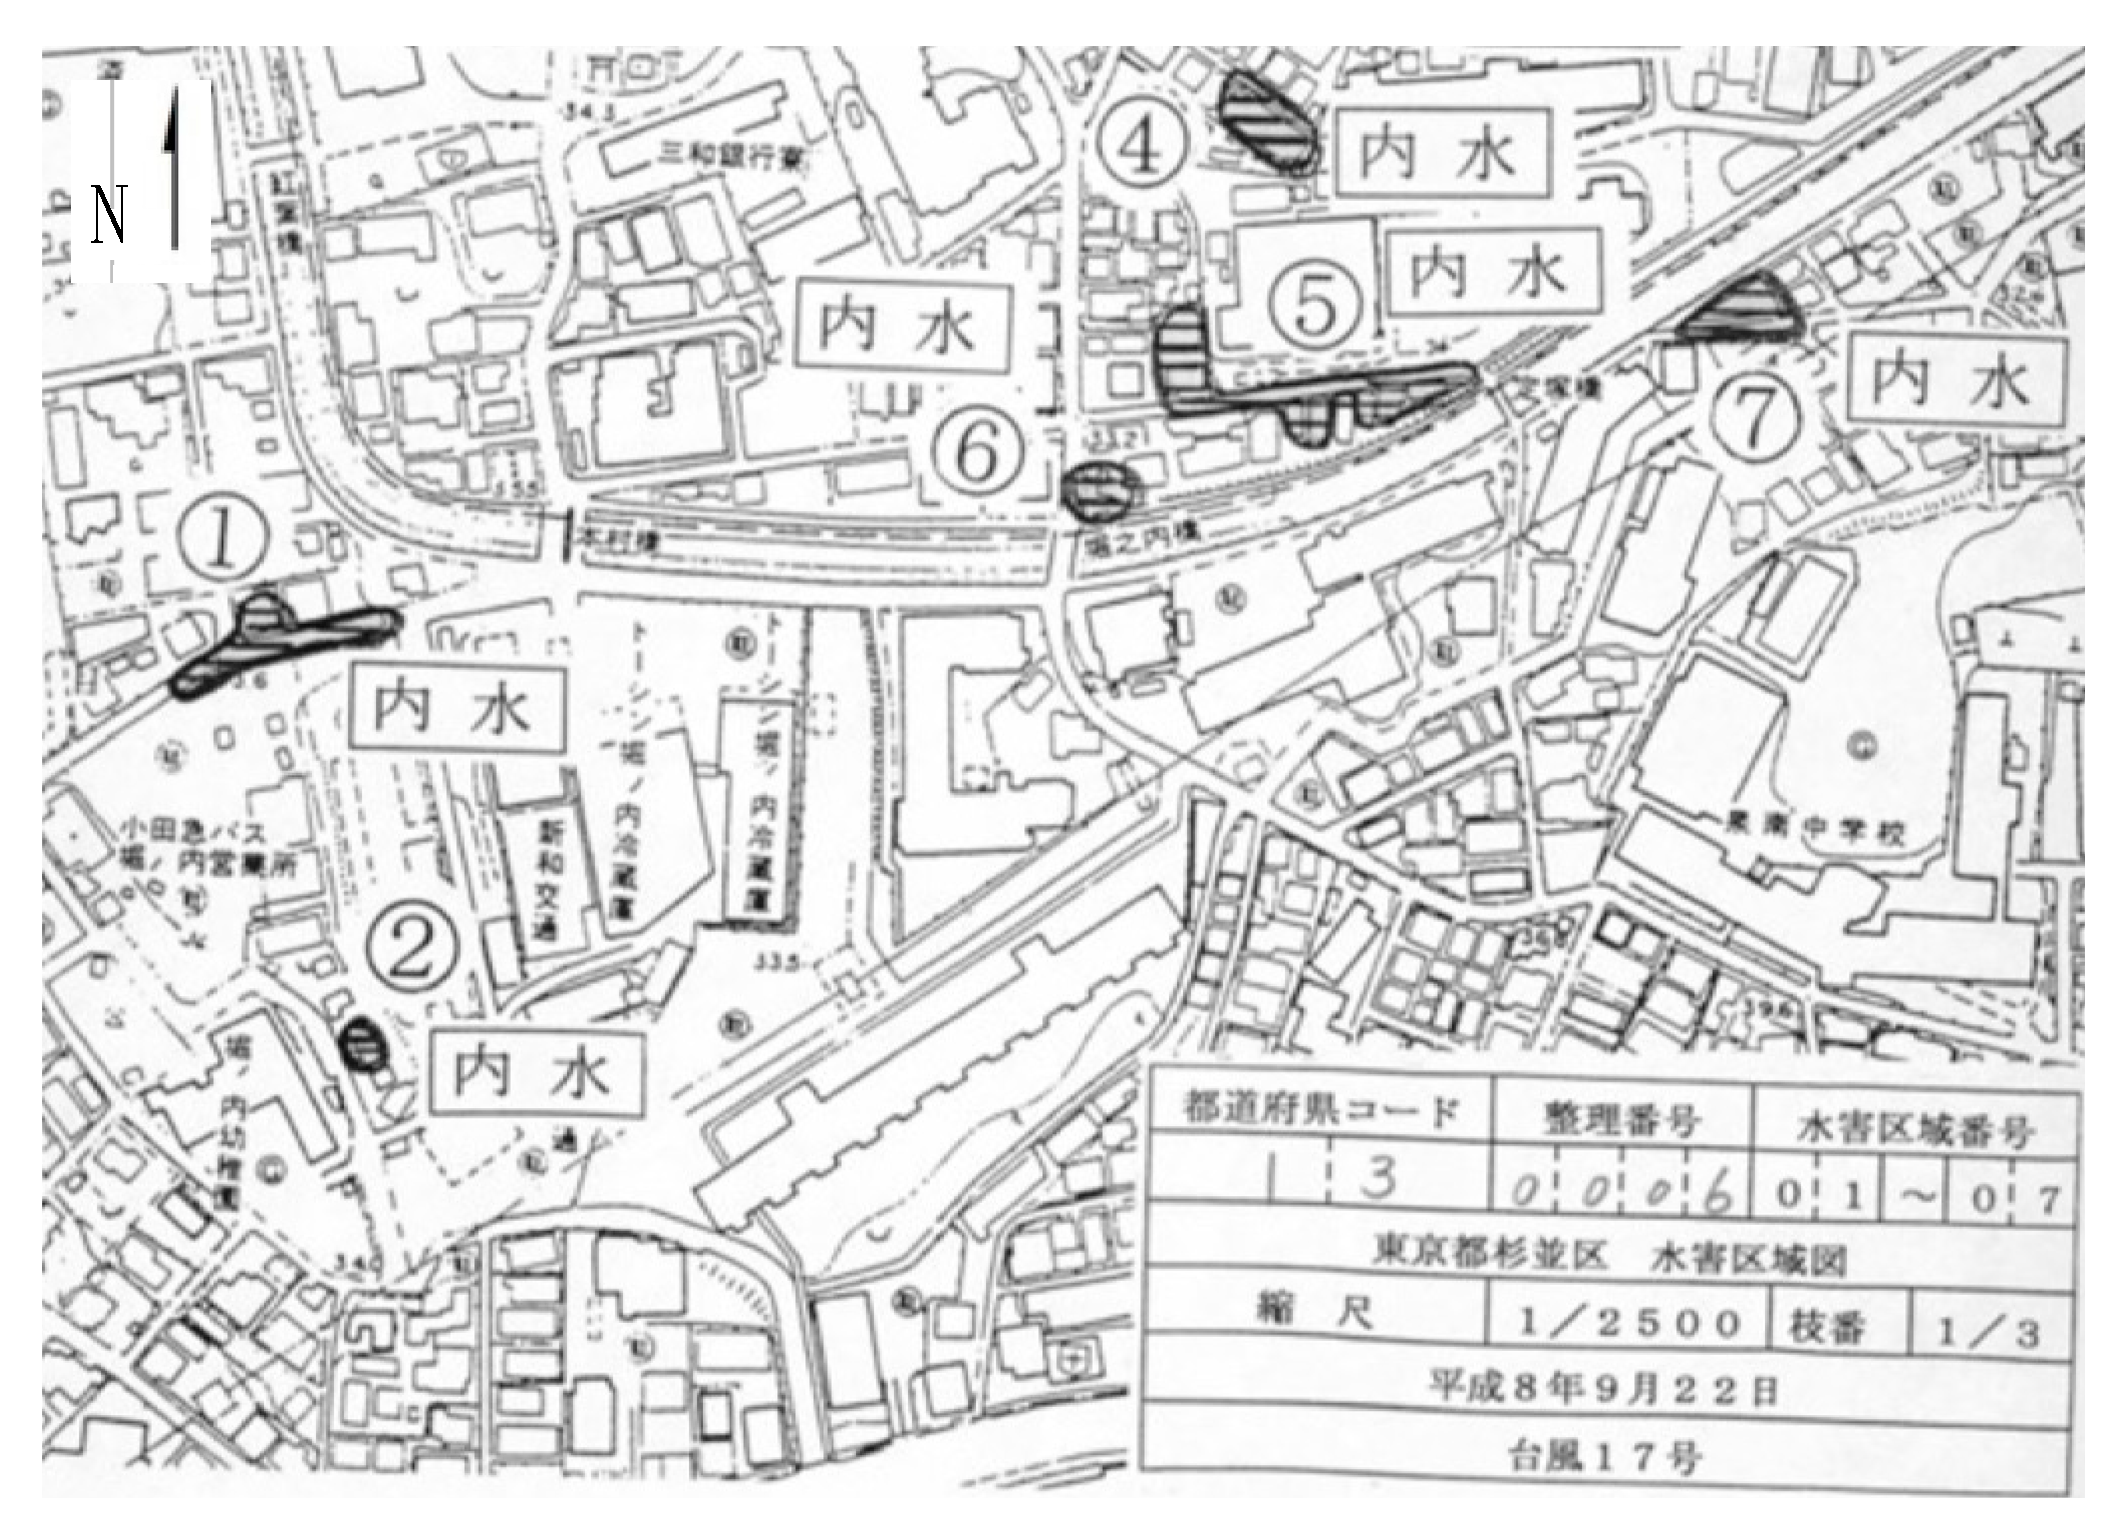
An example of a flooding area record in the case of urban pluvial flooding (urban pluvial flooding area records) is shown in Figure 2. Flooding area records are produced by each municipality as part of flood damage statistical surveys. Flooding area records since 1993 are stored as image data (pdf format) by MLIT. In this study, a total of 457 urban pluvial flooding area records for 20 years from 1993 to 2012 in Osaka and Nagoya Cities were obtained from MLIT, and frequent urban pluvial flooding areas were identified.
To confirm the reliability of urban pluvial flooding area records in the study area, these records were compared with the presence or absence of flood damage caused by urban pluvial flooding in the flood damage statistics. It was confirmed that 89.5% of urban pluvial flooding in Osaka City and 97.4% in Nagoya City were correctly recorded as the urban pluvial flooding area records. Here, these ratios were calculated by dividing the number of urban pluvial flooding area records by the number of urban pluvial flooding events recorded in the flood statistics. The reason why the flood pluvial flooding area record did not reach 100% might be that the flooding area record has been allowed not to record cases where the flooded area was less than 1000 m2, and the number of flooded houses was less than 10 [17]. Namely, it was possible that although urban pluvial flooding damage was recorded in the flood damage statistics, flooding area was not recorded in the urban pluvial flooding area record.
These urban pluvial flooding area records for the 20 years from 1993 to 2012 in Osaka and Nagoya Cities were input into GIS, and vector data were created for each year for the identification of frequent urban pluvial flooding areas. The areas where urban pluvial flooding occurred in Osaka and Nagoya Cities each year were converted into raster data of 10 m, 30 m, 50 m, 100 m, 200 m, and 400 m meshes. If even a small amount of urban pluvial flooding occurred within a mesh, that mesh was regarded as having been subject to urban pluvial flooding. The total years of urban pluvial flooding that occurred in each mesh over the 20 years from 1993 to 2012 were calculated by adding up the raster data for each year.
2.3. Topographical Characteristics of Frequent Urban Pluvial Flooding Area
2.3.1. Topographical Factors
Referring to Djamres et al. (2021) [14], the topographical factors of each mesh in the target city were quantified. The topographical factors used were “Elevation”, “Slope”, “Depth of concave”, “Capacity of concave”, “Catchment area”, “Slope of upstream”, “Slope of downstream”, “Difference of slope”, “Flow length of upstream”, “Flow length of downstream”, and “Difference of flow length”. The method used to create each topographical factor is shown in Table 3. In this study, the 5 m mesh digital elevation model (DEM) provided by the Geospatial Information Authority of Japan (2013) [20] was used as the elevation data. This digital elevation model is produced based on Lidar data.
2.3.2. Visualisation of the Topographical Characteristics of Urban Pluvial Flooding
Based on Djamres et al. (2021) [14], it was attempted to identify areas with similar topographical characteristics to those of frequent urban pluvial flooding areas as areas that are strongly influenced by topographical factors of urban pluvial flooding, based on the results of the PCA. First, from the principal component loadings evaluated in the PCA, each principal component score for the whole area mesh of each city was calculated using the following formula:
where is the principal component score of number n at mesh (i,j); is the standardised value of factor m at mesh (i,j); and is the factor loading of factor m. To assess similarity rates of topographical characteristics in frequent urban pluvial flooding areas and other areas in the city, we computed the deviation value of the averaged principal component score of urban pluvial flooding areas and scores of every mesh in the targeted areas using the following formula:
where is the indicator of how similar topographical characteristics with frequent urban pluvial flooding areas at mesh (x,y); is the principal component score of number n at mesh (i,j); is the mean principal component score of number n in the frequent urban pluvial flooding area; is the contribution rate of the principal component of number n. In other words, the smaller is, the more the location has similar topographical characteristics to the frequent urban pluvial flooding area, and the greater the influence of topographical factors on urban pluvial flooding.
3. Results
3.1. Identification of Frequent Urban Pluvial Flooding Areas
There are two points to consider in identifying frequent urban pluvial flooding areas: the frequency and extent of urban pluvial flooding. First, the frequency of urban pluvial flooding was examined. The relationship between the total years of urban pluvial flooding and the number of urban pluvial flooding areas in the raster data for each mesh size is shown in Table 4. The maximum total years of urban pluvial flooding in Osaka City and Nagoya City was 5–7 years. It is natural that when the criterion for the total years of urban pluvial flooding is small, areas that are not suitable for frequent urban pluvial flooding areas are selected. However, when the criterion is too large, the number of identified urban pluvial flooding areas becomes small, and it is not possible to obtain sufficient areas for analysis. In this study, urban pluvial flooding areas were identified as areas where urban pluvial flooding occurred more than four years (more than once every five years) in the 20 years from 1993 to 2012, considering more than half of the maximum total number of years in Osaka and Nagoya Cities.
Next, the mesh size of frequent urban pluvial flooding areas was examined. In Table 4b, the number of frequent urban pluvial flooding areas in Nagoya City decreased as the mesh size increased in terms of the reference total years (more than four years) of frequent urban pluvial flooding. This could be since large urban pluvial flooding areas that were duplicated and over-accounted for in smaller meshes were accounted for as a single area when the mesh size increased. Furthermore, this was also considered to be since some urban pluvial flooding areas that were closely located were accounted as one area with increasing the mesh size. On the other hand, in Osaka City, the number of identified frequent urban pluvial flooding areas increased when the mesh size was larger than 30 m and was almost the same when the mesh size was larger than 100 m (Table 4a). This suggested that the urban pluvial flooding areas in Osaka City were smaller and less closely located than in Nagoya City and that a mesh size of 100 m or larger would enable the frequent urban pluvial flooding areas to be identified.
Since the objective of this study is to elucidate the specific distribution of frequent urban pluvial flooding areas and their topographical characteristics, the smaller the mesh size to be identified, the better. It is considered that the applicable mesh size to be identified was about 30 m mesh because the flooding area record has been allowed not to record cases where the flooded area was less than 1000 m2, and the number of flooded houses was less than 10 [17], as mentioned above. However, the urban pluvial flooding area record has been produced manually, and some errors may be included between the actual urban pluvial flooding area and its record. For example, a discrepancy of about 1 m to 50 m between them was recognised in the field survey, and if the mesh size was too small, the frequent urban pluvial flooding area could not be identified properly because flooded areas that occurred at the same location might be accounted for separately. Therefore, the mesh size was set to 100 m x 100 m in this study.
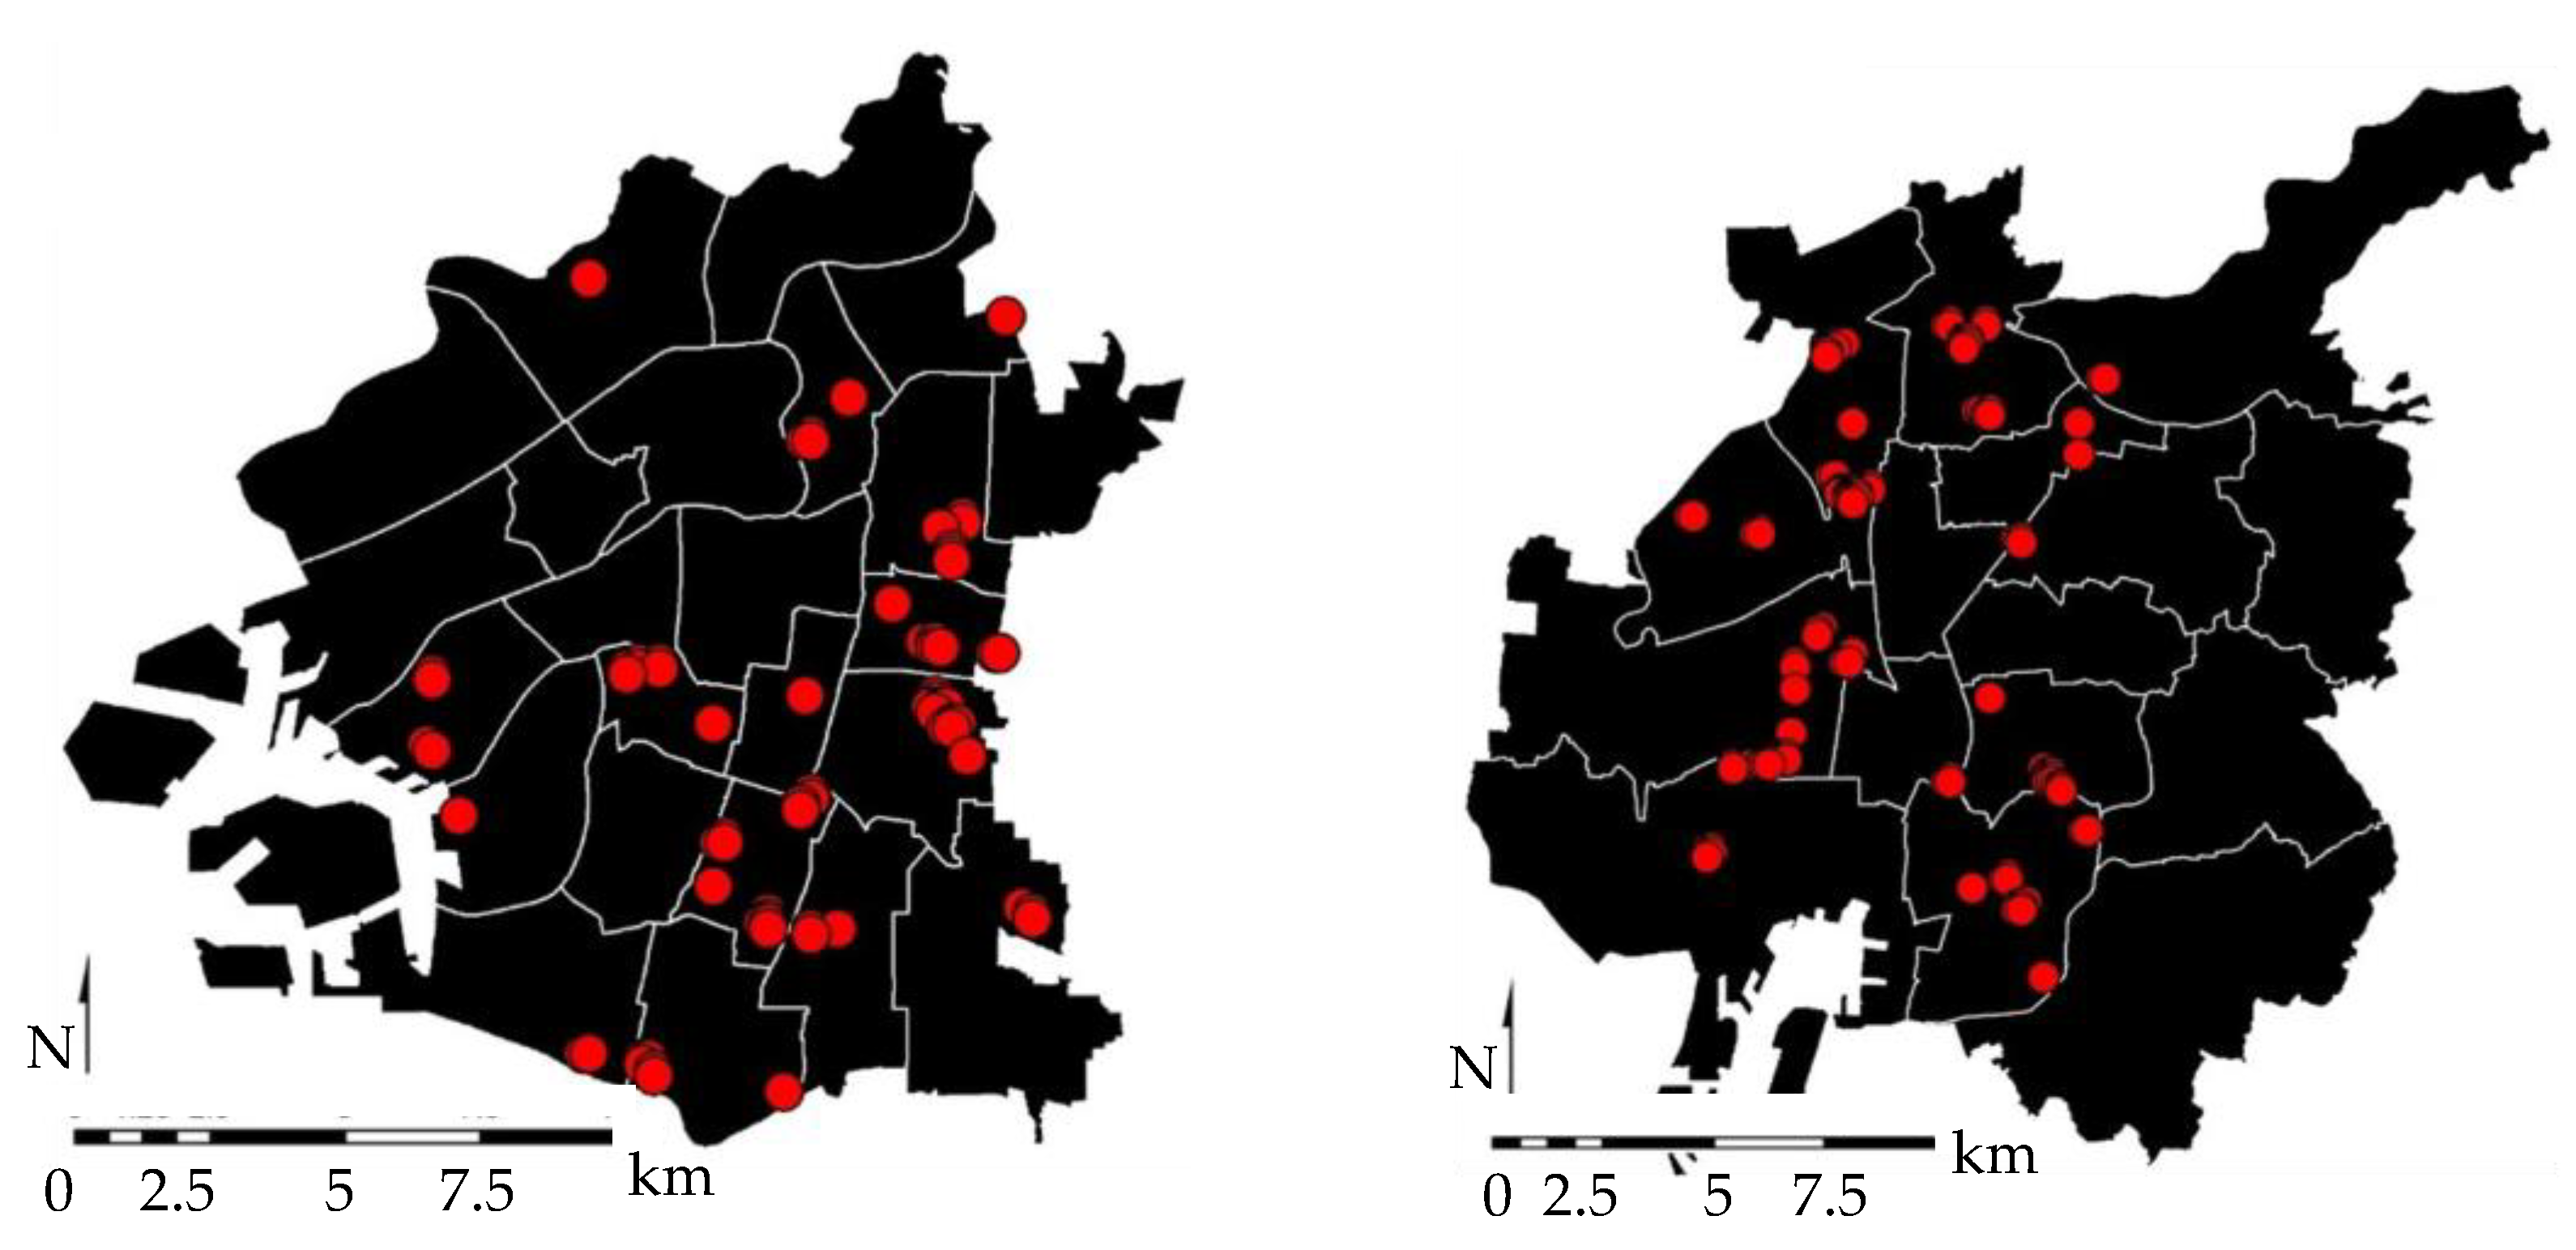
The frequent urban pluvial flooding areas in Osaka and Nagoya Cities identified according to the above-mentioned identifications are shown in Figure 3. In total, 70 frequent urban pluvial flooding areas were identified in Osaka City and 108 in Nagoya City. The proportion of frequent urban pluvial flooding areas in the area of each city was 0.34% in Osaka City and 0.33% in Nagoya City.
3.2. Topographical Characteristics of Frequent Urban Pluvial Flooding Areas
Principle Component Analysis (PCA) of Topographical Characteristics
The PCA of frequent urban pluvial flooding areas on topographical characteristics was performed using the topographical factors quantified in the previous chapter. Detailed results are shown in Table 5. The principal components with eigenvalues exceeding 1 were up to the fourth principal component (PCs) in both cities, with cumulative contribution rates of 85.7% for Osaka City and 88.6% for Nagoya City. This indicated that the topographical factors used in this study were appropriate for describing frequent urban pluvial flooding areas.
In Osaka City, the first principal component (PC1) accounted for 34.3% of the total variance. The factors that correlated the most with the PC1 were “Slope upstream” (0.404) and the difference of slope (0.390) in positive values. One can infer that frequent urban pluvial flooding areas had an upstream slope that was higher than the downstream slope. Principal component 2 (PC2) was negatively correlated with “Slope of downstream” and “Difference of flow length” and positively correlated with “Flow length of downstream”. Therefore, PC2 was considered to be the component that aggregates the downstream situation, and one can conclude that frequent urban pluvial flooding areas had a downstream slope gentler than upstream, downstream flow length longer than upstream, and the location at a low elevation. In contrast, the third component (PC3) showed strong positive correlations with “Flow length of upstream” and “Catchment area”. Therefore, PC3 was considered to be the component that aggregates the upstream situation. Principal component 4 (PC4) had negative correlations with “Depth of concave” and “Capacity of concave” and a positive correlation with “Slope of downstream”. Therefore, PC4 was considered to be the component that aggregates the concave situation.
In Nagoya City, PC1 had negative correlations for all factors except “Depth of concave” and “Capacity of concave”, showing the opposite trend to that of Osaka City. PC2 was negatively correlated with three factors: “Flow length of upstream”, “Catchment area”, and “Difference of flow length”. Therefore, PC2 was considered to be the component that aggregates the upstream situation and the factors related to the flow channel. PC3 had a strong positive correlation with “Flow length of downstream” and negative correlations with “Slope of downstream” and “Difference of flow length”. Therefore, PC3 was considered to be the component that aggregates the downstream situation. PC4 had negative correlations with “Depth of concave” and “Capacity of concave”, as did Osaka City. The results of the PCA for Osaka and Nagoya Cities showed that the topographical characteristics of the frequent urban pluvial flooding areas in both cities were different, with particularly conflicting trends in PC1.
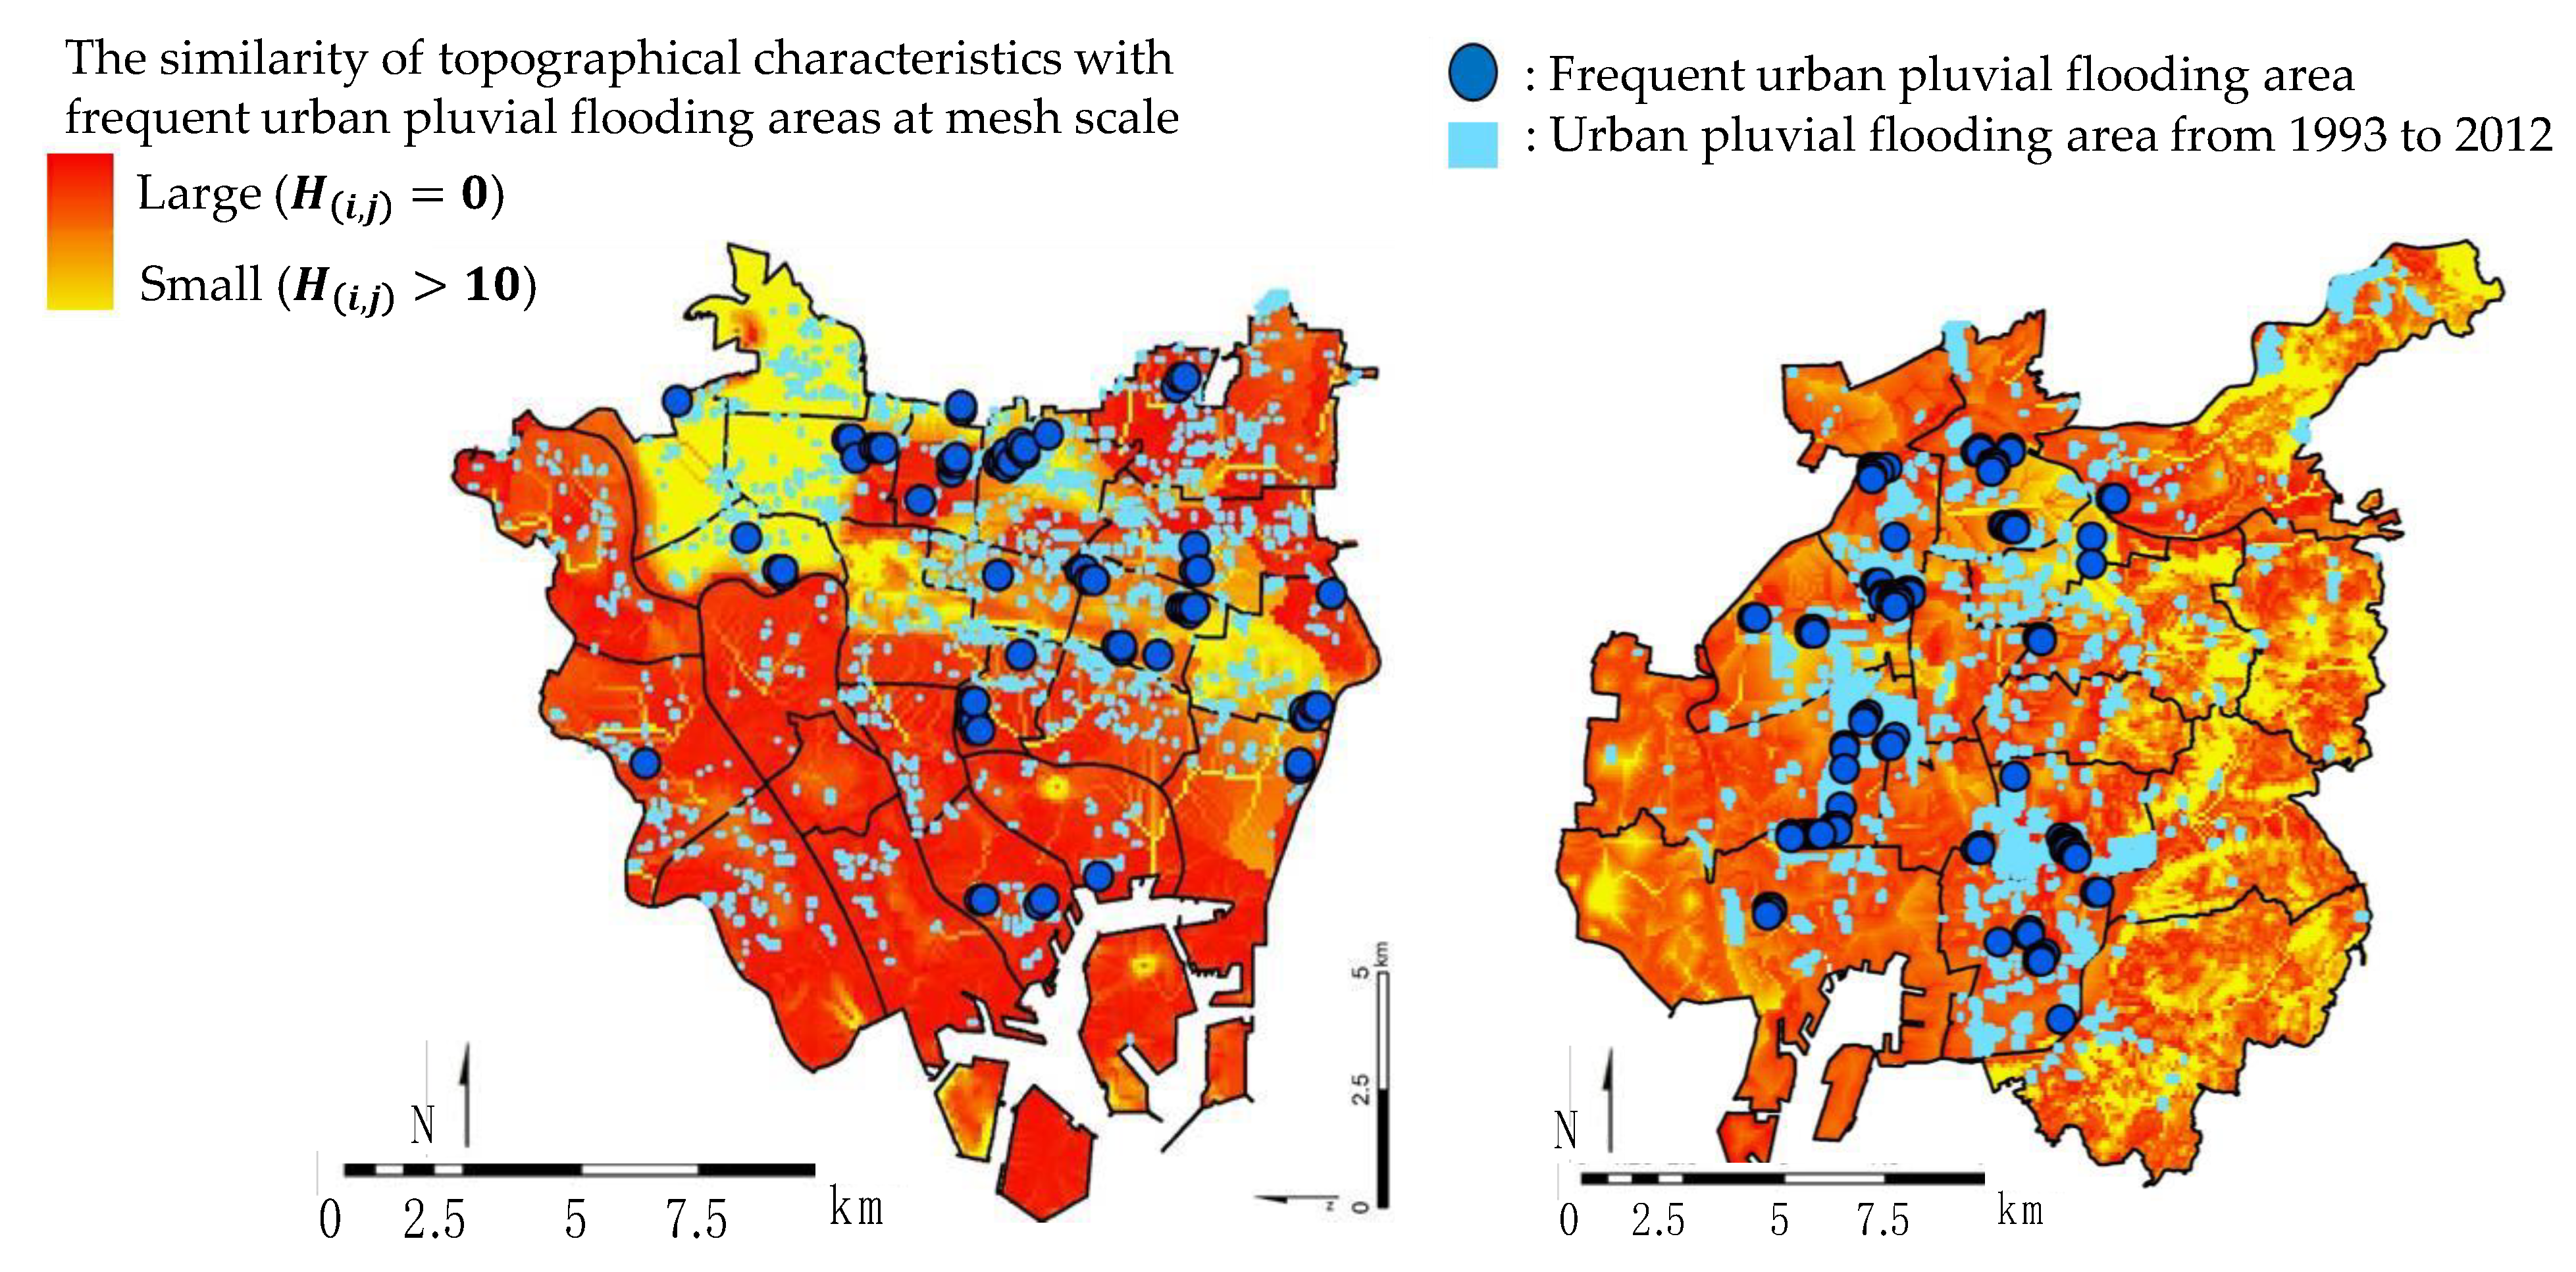
The distribution of and the urban pluvial flooding areas of each city is shown in Figure 4. Many urban pluvial flooding areas were located in areas with small , which has similar topographical characteristics to the frequent urban pluvial flooding areas. On the other hand, especially in Osaka City, the urban pluvial flooding areas were also distributed in areas with relatively large , which do not have similar topographical characteristics to the frequent urban pluvial flooding areas. This suggested that factors other than topographical characteristics that caused urban pluvial flooding were largely responsible for such areas in many parts of Osaka City and some parts of Nagoya City.
In addition, the average in the inundated areas by urban pluvial flooding from 1993 to 2012 (areas shown in the light blue dot in Figure 4) was calculated to be 3.26 in Osaka City and 2.81 in Nagoya City. This suggested that the distribution of urban pluvial flooding areas in Nagoya was better described by topographical characteristics than in Osaka City. Furthermore, the average for the whole area of each city, which was 2.64 in Osaka City and 3.18 in Nagoya City, was smaller in Osaka City than the average for the inundated area. This indicated that the urban pluvial flooding in Osaka City could not be described solely by topographical characteristics.
3.3. Other Characteristics of Frequent Urban Pluvial Flooding Areas
3.3.1. Impact of Structures in Frequent Urban Pluvial Flooding Areas
Referring to Djamres et al. (2021) [14], the location of “dominant structures” was examined as another characteristic of these areas. Here, “dominant structures” are roads that divide sewers, railway lines (excluding subways and elevated lines), embankments, and structures with a site of more than 100 m per side. In addition, a road dividing a sewer is not a road with a sewer pipe buried directly under the centre of the road but a road with a sewer pipe buried under each side of the road. These are roads with a median strip or large road widths, such as dual carriageways in one direction, which were included in the analysis in this section because they influenced the flow of water.
Frequent urban pluvial flooding areas were classified according to the relationship between the location of “dominant structures” and the direction of inclination to “dominant structures”. A conceptual diagram of the classification conditions and the proportions of the classified frequent urban pluvial flooding areas are shown in Figure 5 and Table 6. Figure 5a,d,g,h (the red line enclosure in Figure 5) show areas where “dominant structures” were located in the direction of inclination (direction of inundated water flow). In Osaka City, there were 90% of the total frequent urban pluvial flooding areas in which one or more “dominant structures” existed within 8 mesh around the area. Of the frequent urban pluvial flooding areas with “dominant structures” within 8 mesh of the perimeter, 74% of the areas had “dominant structures” in the direction of inundated water flow (Figure 5a,d,g,h).
In Nagoya City, there were 67% of the all-frequent urban pluvial flooding areas in which one or more “dominant structures” existed within 8 mesh around the area. Of the frequent urban pluvial flooding areas where “dominant structures” existed within 8 mesh of the perimeter, 28% of the areas had “dominant structures” in the direction of inundated water flow (Figure 5a,d,g,h).
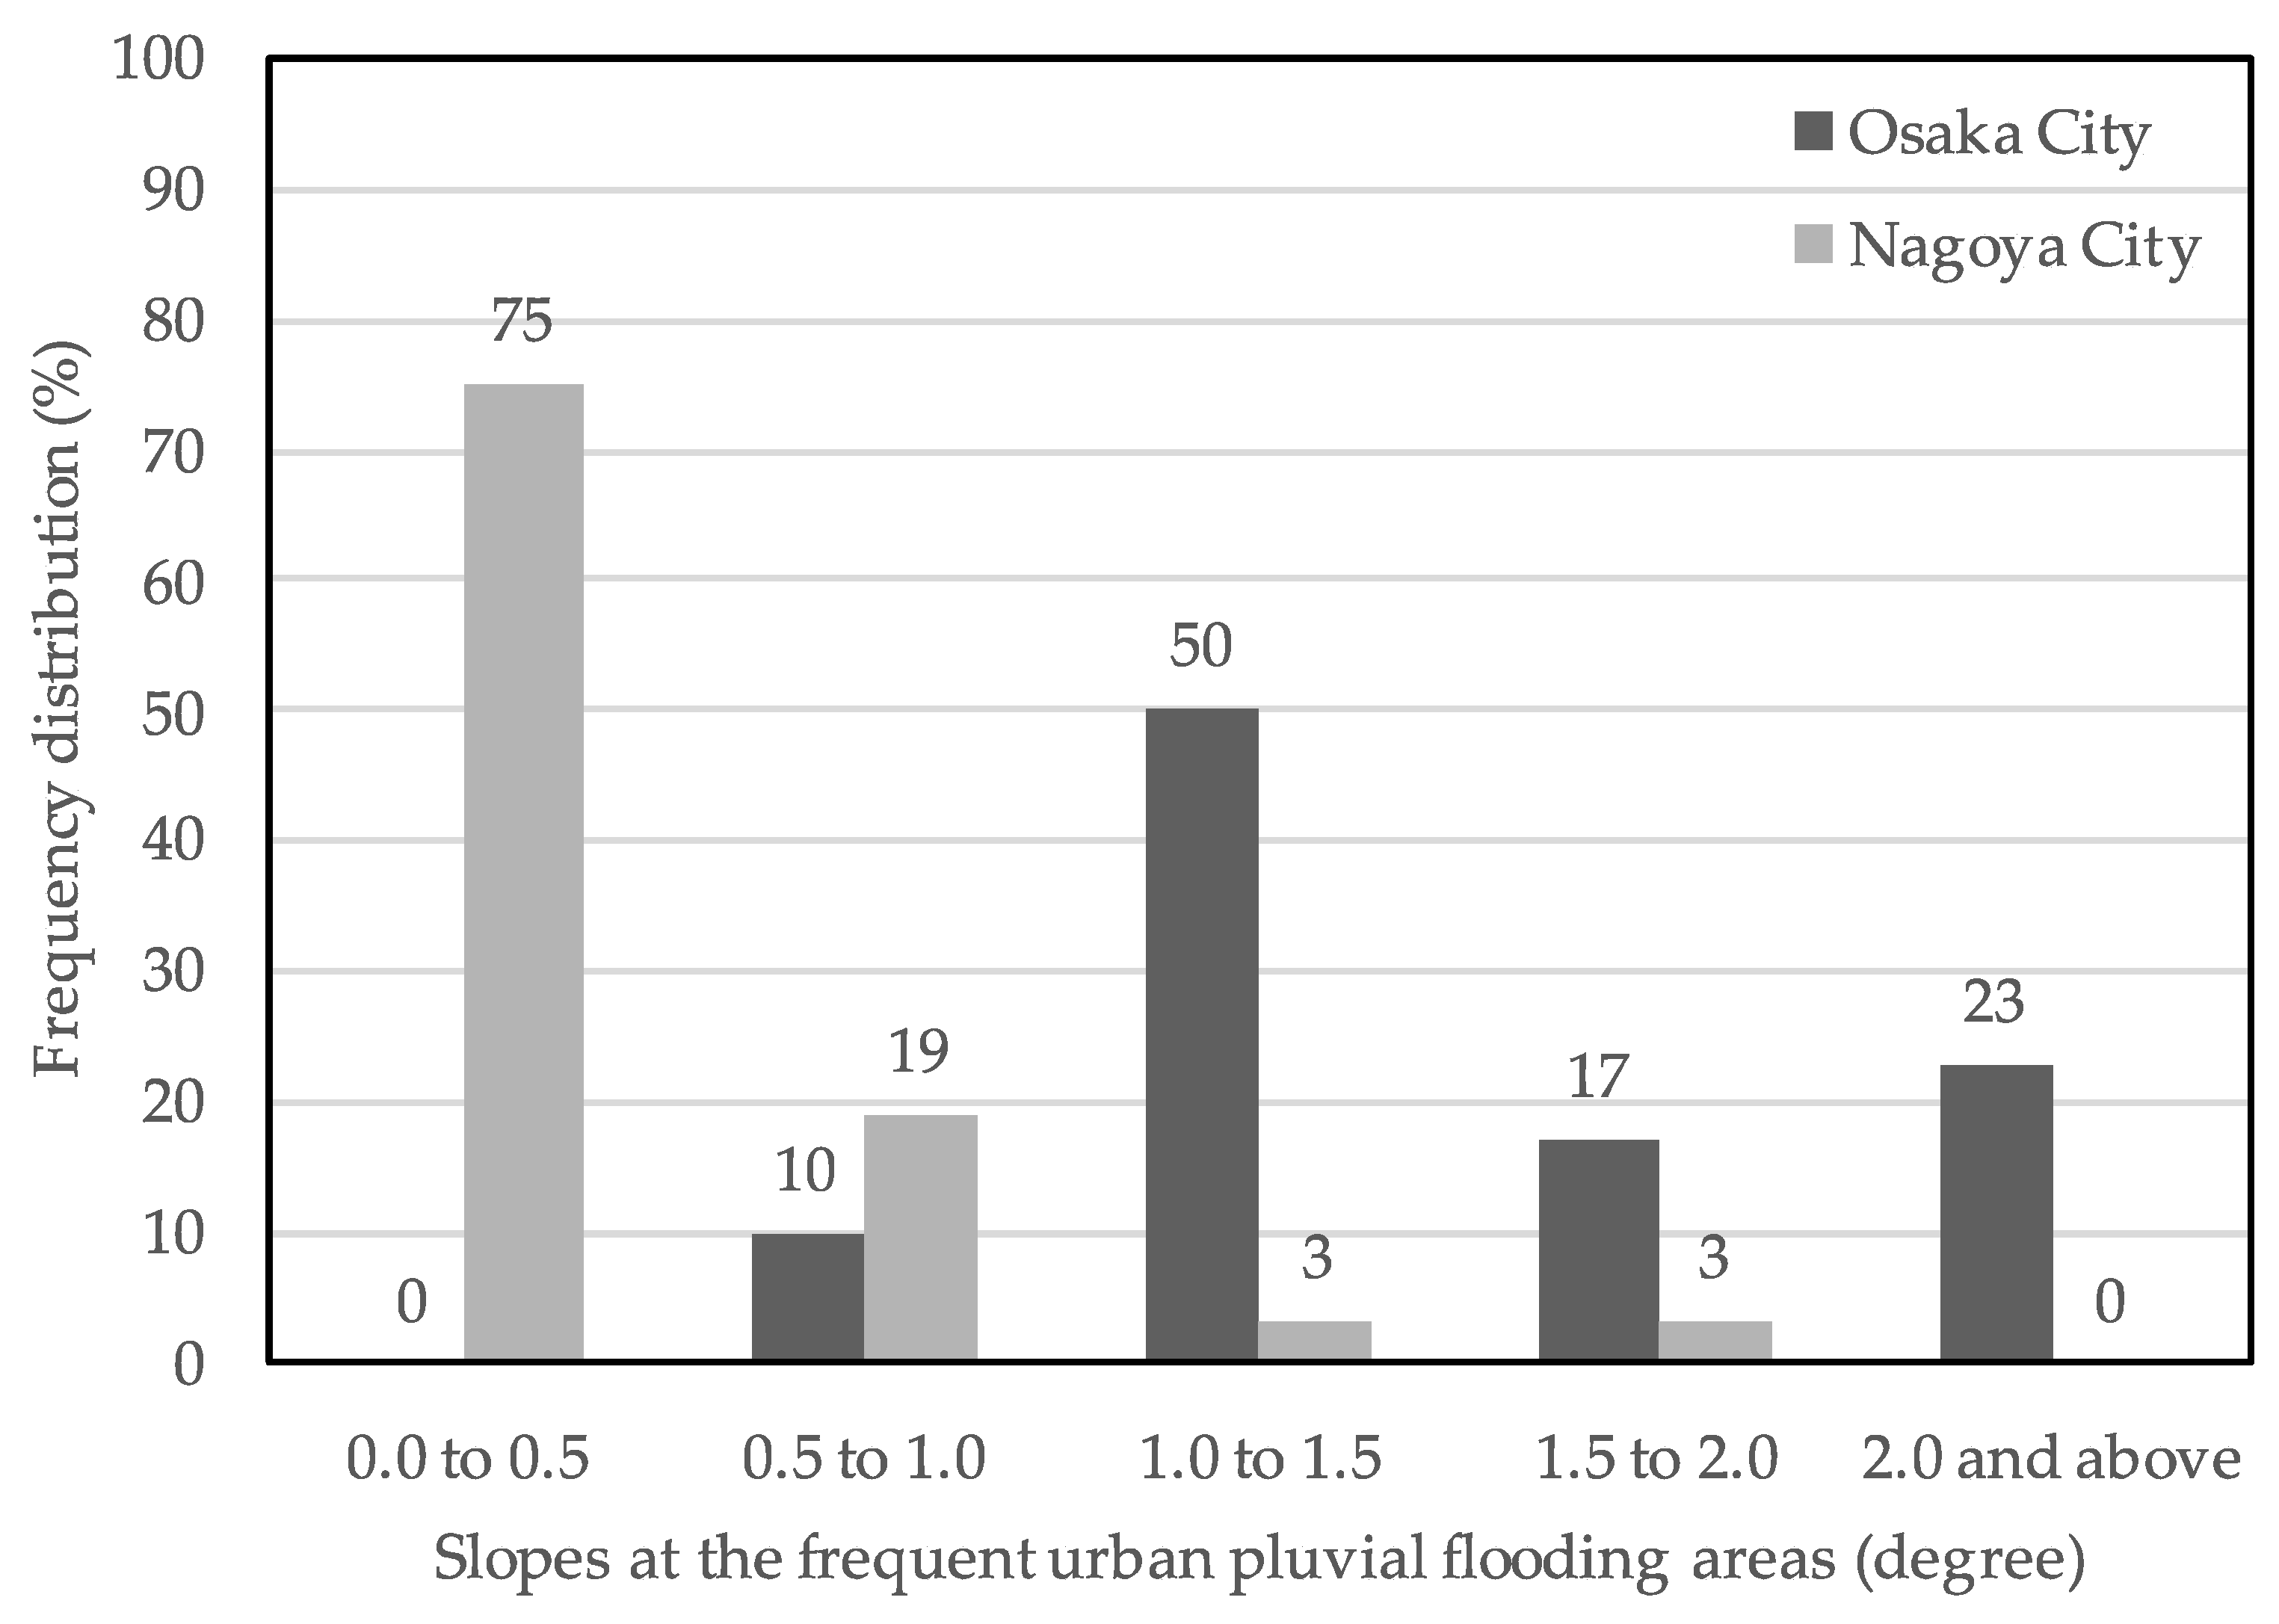
A comparison of the results for Osaka and Nagoya Cities showed that the proportion of frequent urban pluvial flooding areas with “dominant structures” in Nagoya City was smaller than that in Osaka City, and in particular, the proportion of frequent urban pluvial flooding areas with “dominant structures” in the direction of the inundated water was much smaller. Therefore, the distribution of elevation and slope in frequent urban pluvial flooding areas in Osaka and Nagoya Cities was calculated based on the assumption that the topographical differences in frequent urban pluvial flooding areas might influence the characteristics of frequent urban pluvial flooding areas in both cities. The average elevation of the frequent urban pluvial flooding areas was 3.30 m in Osaka City and 3.61 m in Nagoya City, respectively. Although the elevation was higher in Nagoya City, there was no significant difference. On the other hand, the average slopes of all frequent urban pluvial flooding areas in Osaka City and Nagoya City were 2.20% and 0.33%, respectively, indicating that the slopes of the frequent urban pluvial flooding areas in Nagoya City were much smaller than those in Osaka City. The frequency distribution of slopes at the frequent urban pluvial flooding areas in Osaka and Nagoya Cities is shown in Figure 6. Most of the frequent urban pluvial flooding areas in Nagoya City were located on almost no gradient with a slope of less than 1 degree. It was inferred that in such areas, regardless of the location of “dominant structures”, the mere presence of “dominant structures” around it would dam up the inundated water and cause urban pluvial flooding. In addition, this was considered to be one of the reasons why “Slope” and “Slope of upstream” were not correlated as PCs in the PCA as the topographical characteristics of the frequent urban pluvial flooding area in Nagoya City described in the previous section.
3.3.2. Impact of Drainage System Improvements in Frequent Urban Pluvial Flooding Areas
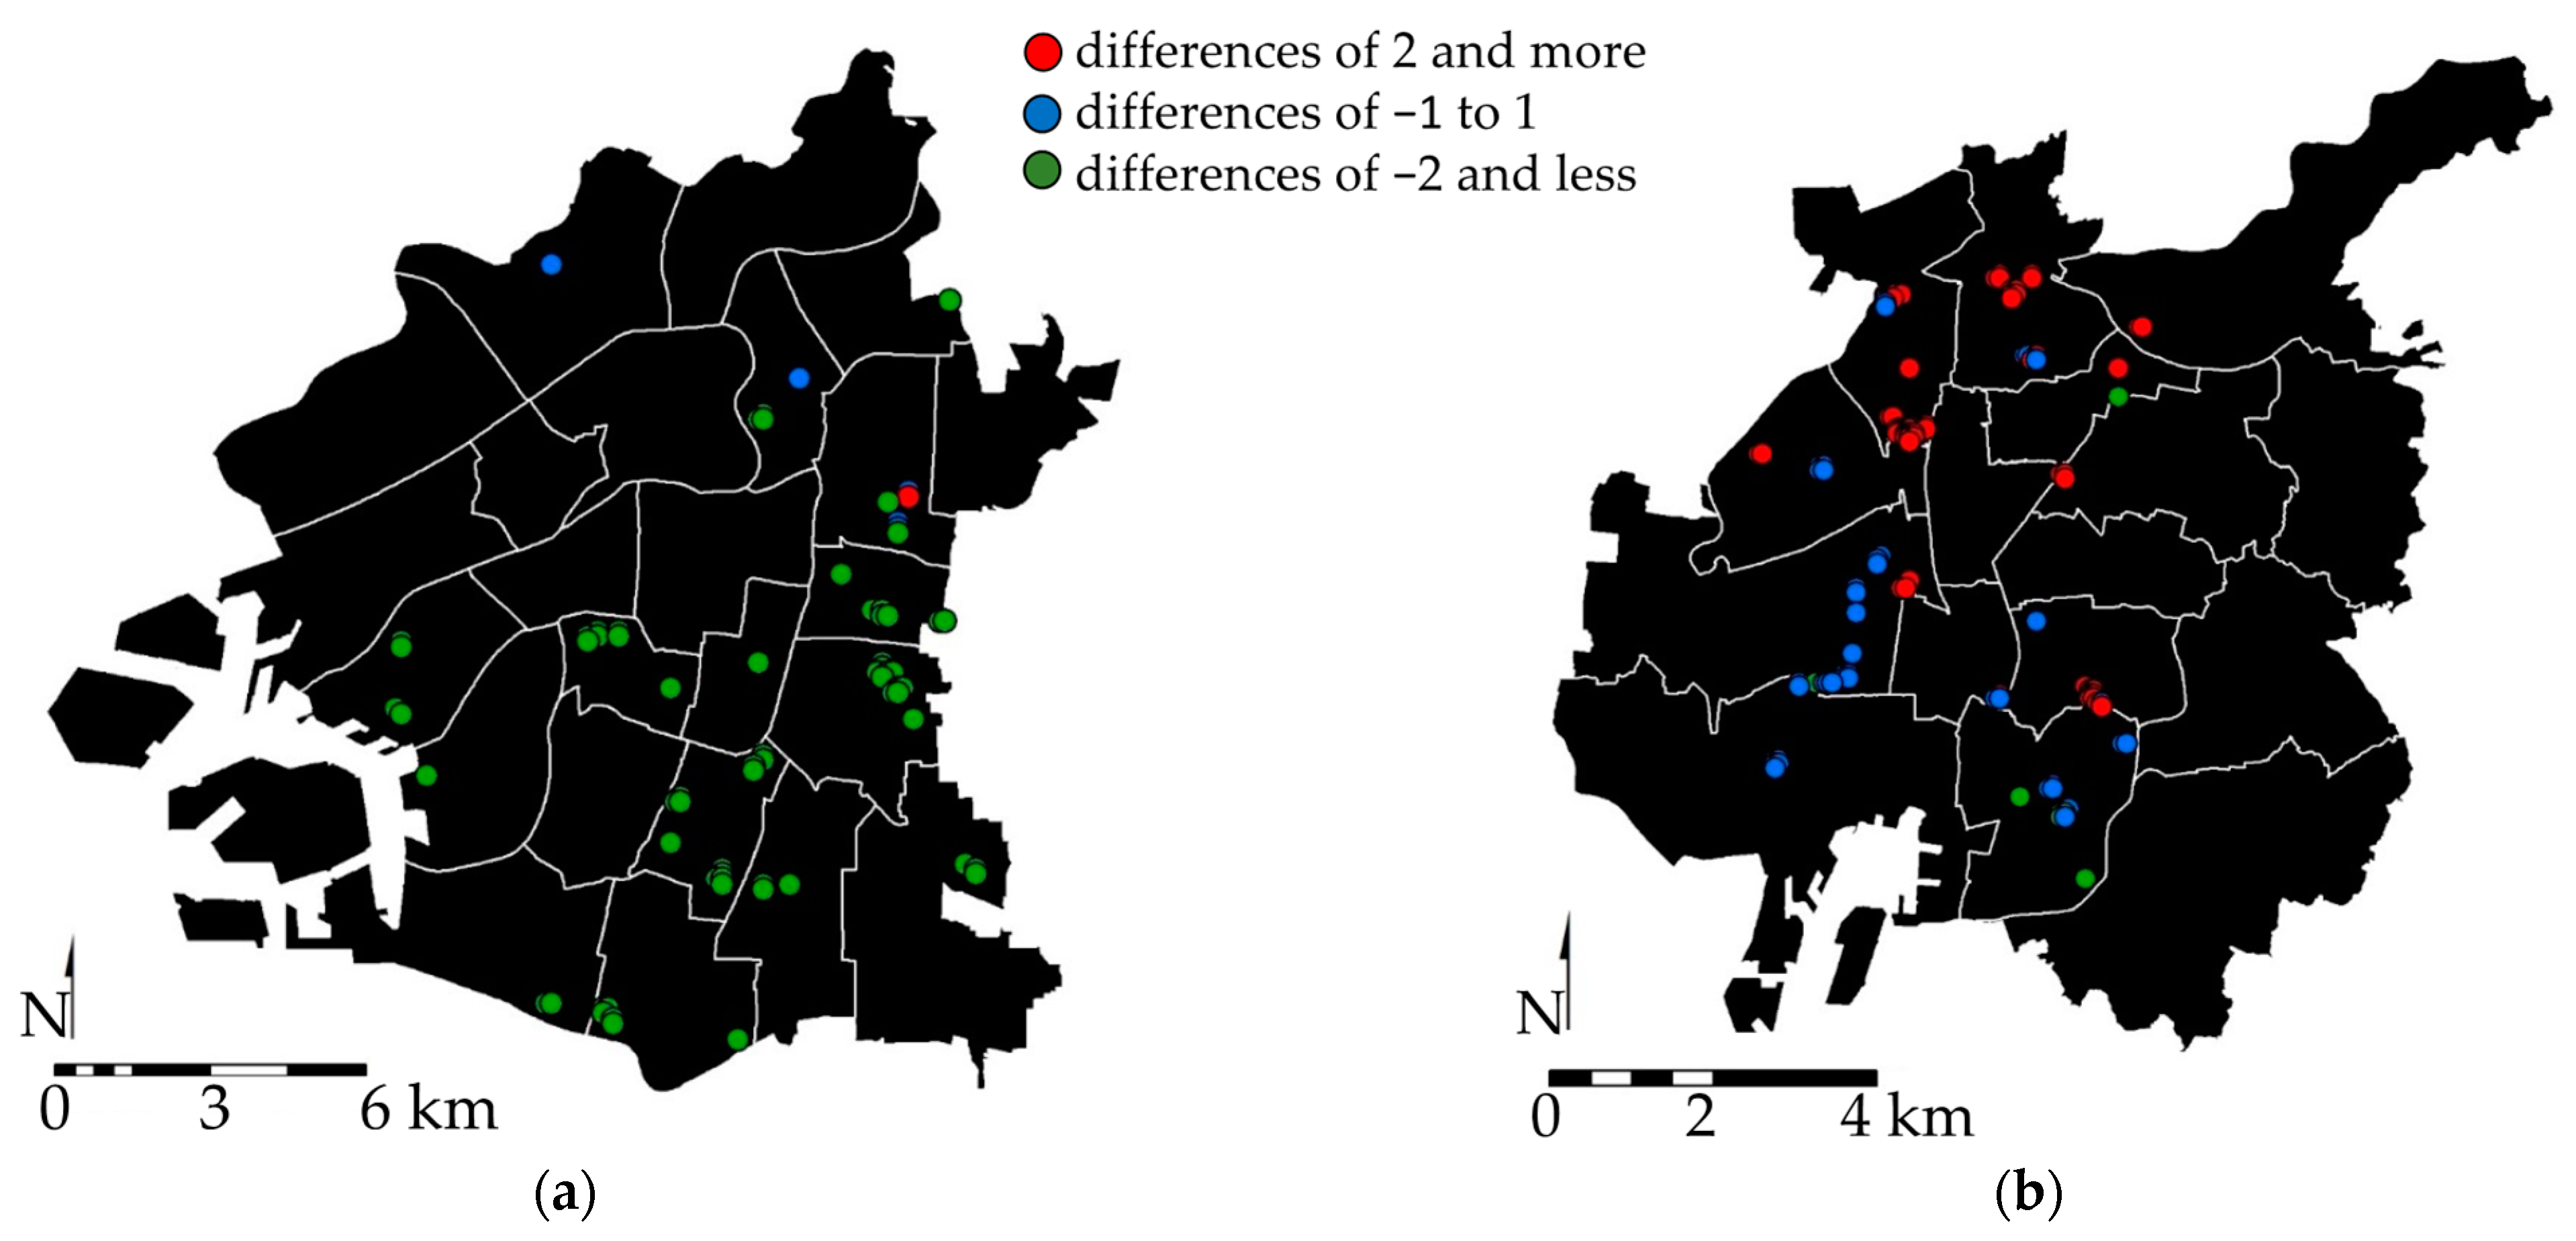
To examine the impact of the improvement of drainage systems as another characteristic of frequent urban pluvial flooding areas, the occurrence trends of urban pluvial flooding in the urban pluvial flooding areas of Osaka and Nagoya Cities were investigated. The difference in urban pluvial floodings between the first 10 years (1993–2002) and the second 10 years (2003–2012) of the 20 years (1993–2012) is shown in Figure 7. Of the areas classified as green (1993–2002), 64 (91%) were in Osaka City compared with 8 (7%) in Nagoya City. On the other hand, red areas (2003–2012) were only 1 (1%) in Osaka City compared with 56 (52%) in Nagoya City. In addition, blue areas (1993–2012) were also only 5 (7%) in Osaka City compared with 44 (41%) in Nagoya City.
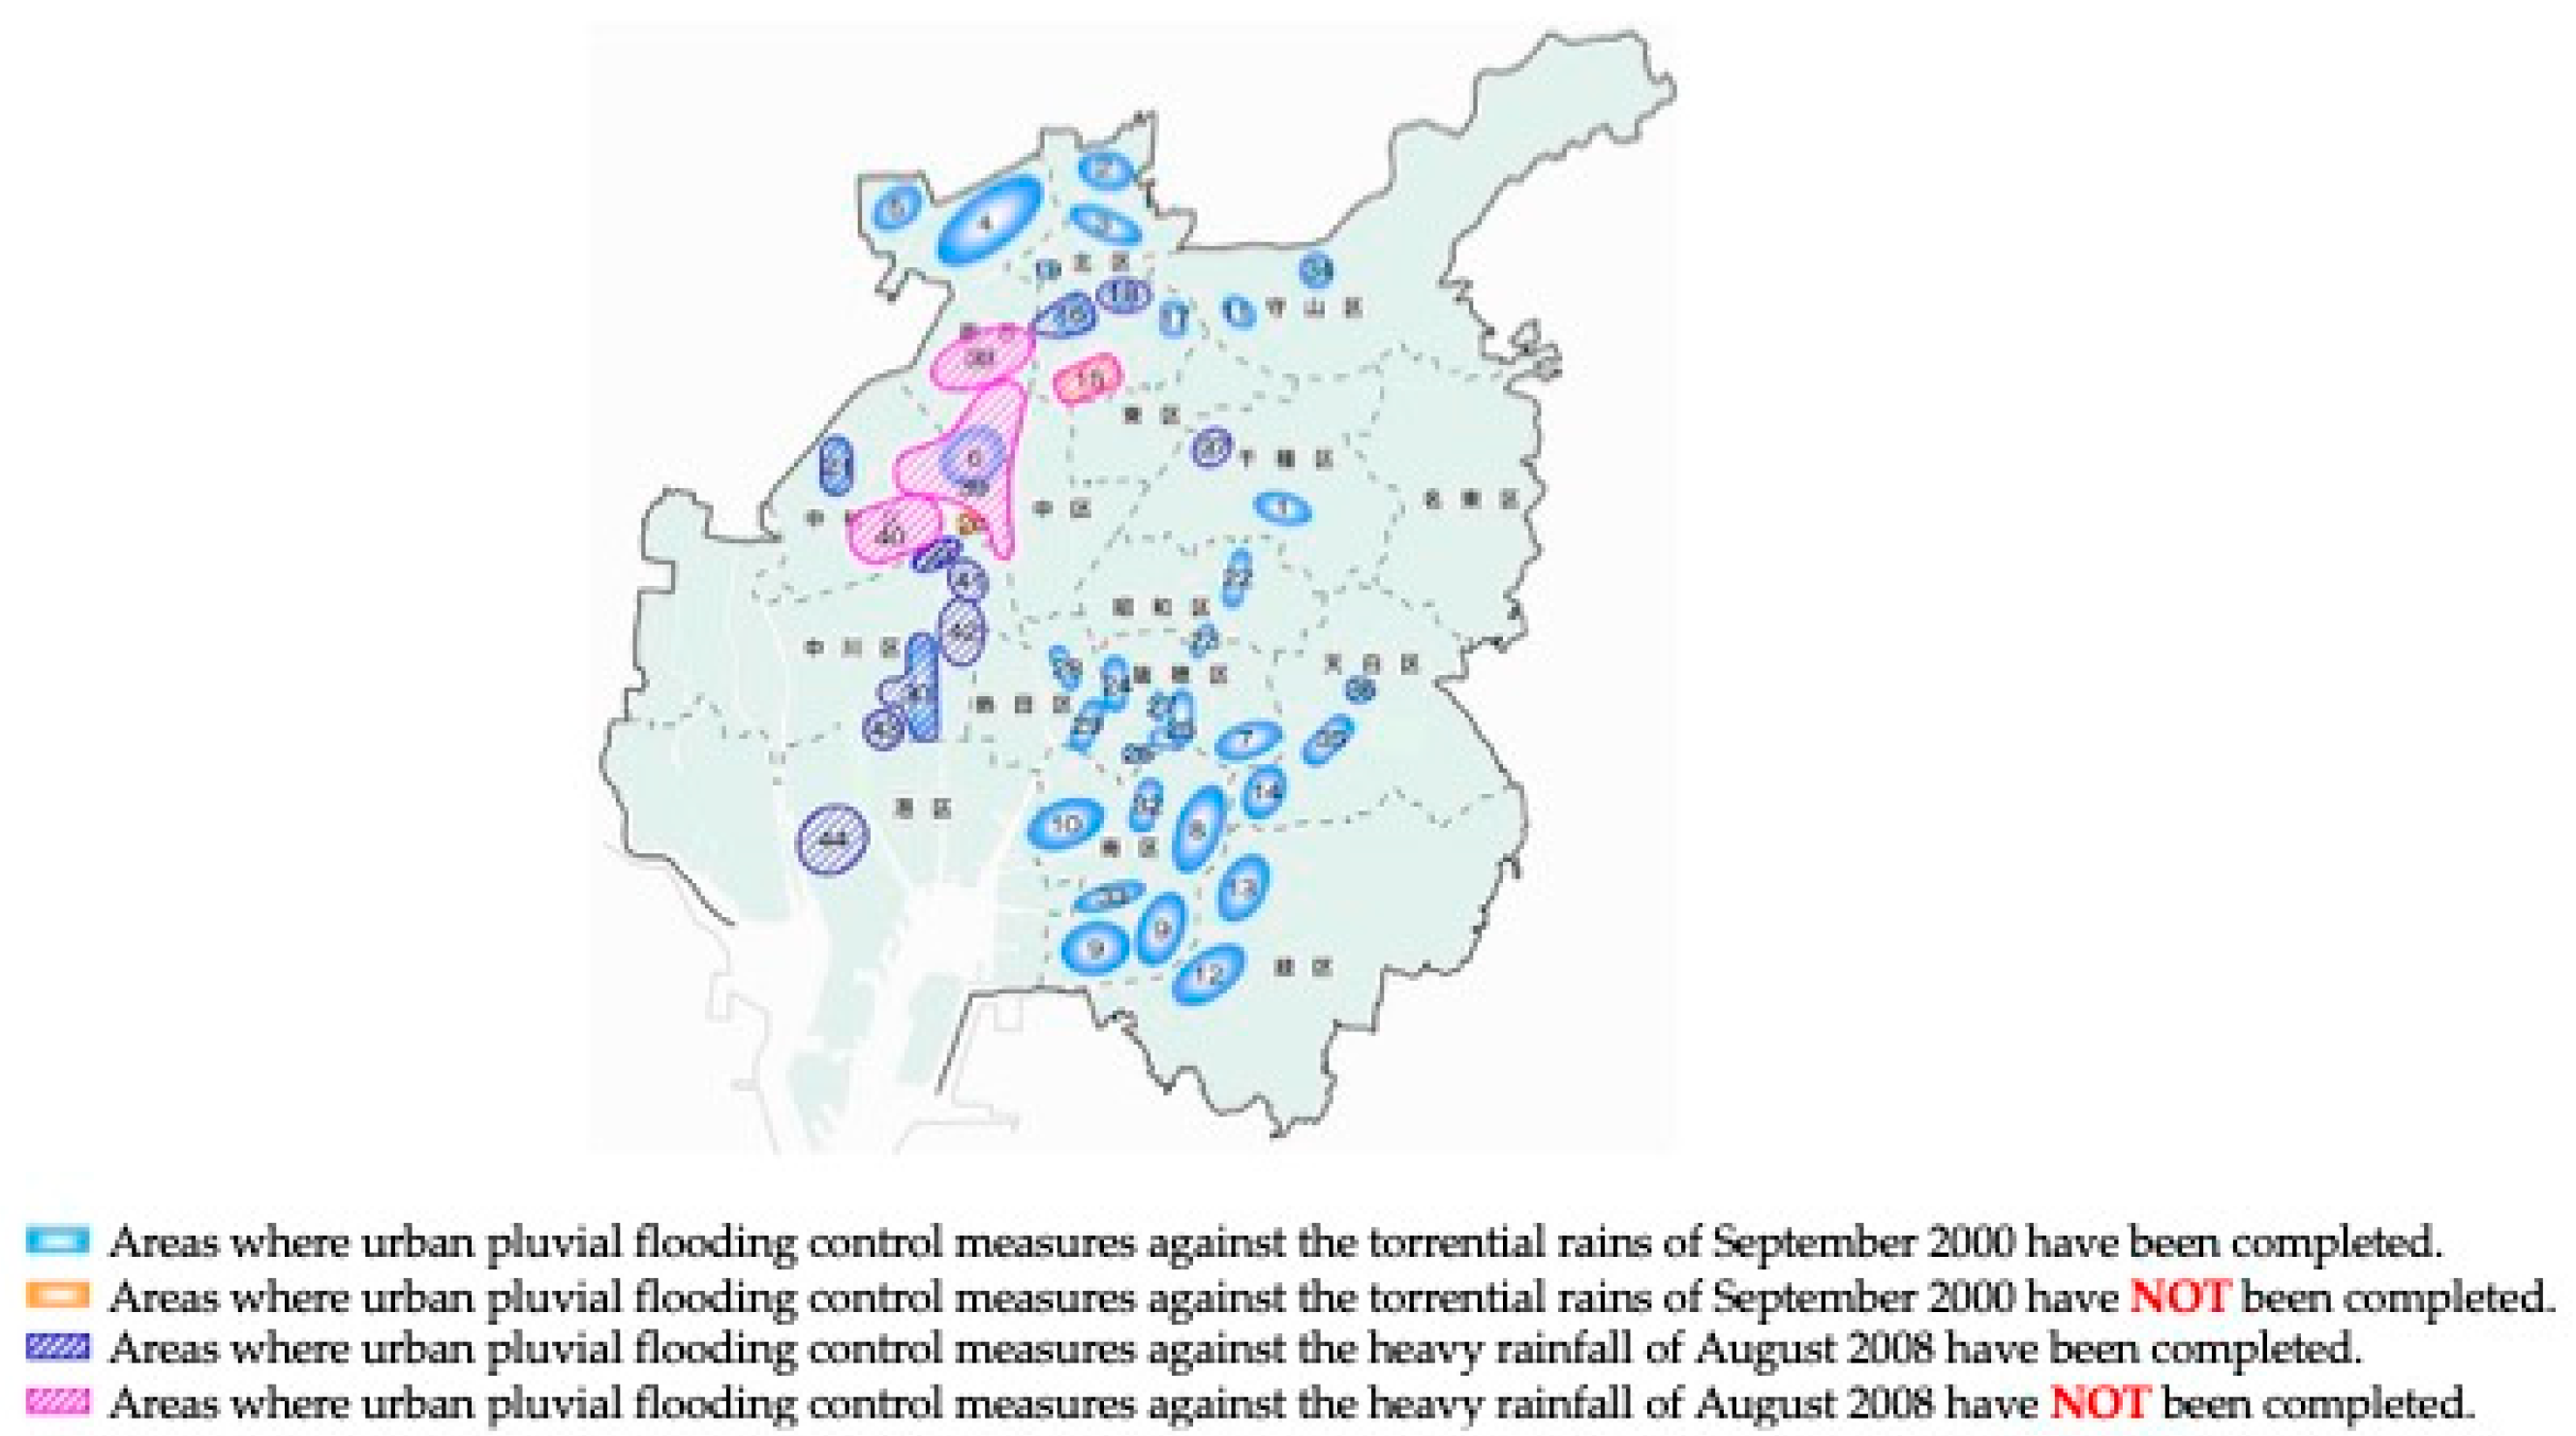
Regarding the improvement of drainage systems, in Osaka City, the Naniwa Underground Discharge Channel (total length of 12.2 km), a large-scale drainage system to drain rainwater from the south-eastern area of Osaka City into the Sumiyoshi River, began to be constructed in 1984 and was completed in 2000, following the large-scale urban pluvial flooding caused by Typhoon No. 19 in September 1979 and Typhoon No. 10 in August 1982. As a result of such progress made in countermeasures against urban flooding, it can be inferred that urban pluvial flooding ceased to occur in frequent urban pluvial flooding areas during 2003–2012. On the other hand, Nagoya City, which is on a smaller urban scale than Osaka City, has been implementing emergency drainage system improvements in response to the large-scale urban pluvial flooding caused by the torrential rains of September 2002 and September 2006. However, it was found that most of the frequent urban pluvial flooding areas during 2003–2012 were located in areas where the improvement had not yet been completed (Figure 8). These results indicated that anthropogenic factors such as “dominant structures” and drainage system improvements influence the occurrence of urban pluvial flooding as characteristics other than topographical characteristics.
4. Discussion and Summary
This study clarified the distribution of frequent urban pluvial flooding areas in Osaka and Nagoya Cities by using urban pluvial flooding area records. The identified frequent urban pluvial flooding areas were 70 in Osaka City and 108 in Nagoya City, and their proportion to the area of each city was 0.34% in Osaka City and 0.33% in Nagoya City. Analyses of their characteristics revealed the following:
- The PCA of frequent urban pluvial flooding areas using the eleven topographical factors showed high cumulative contribution rates for Osaka and Nagoya Cities, which indicated that the topographical factors used in this study were appropriate for describing frequent urban pluvial flooding areas. The results of the PCA quantitively showed that the topographical characteristics of the frequent urban pluvial flooding areas in both cities were different.
- Using the results of PCA of topographical characteristics in the frequent urban pluvial flooding area, the similarity with these topographical characteristics at a 100 m mesh scale in both cities was quantified. Although many urban pluvial flooding areas were located in areas with similar topographical characteristics, especially in Osaka City, the urban pluvial flooding areas were also distributed in areas without similar topographical characteristics. This suggested that factors other than topographical characteristics that caused urban pluvial flooding were largely responsible for such areas in many parts of Osaka City and some parts of Nagoya City.
- Anthropogenic factors such as “dominant structures” and drainage system improvements as characteristics other than topographical characteristics on the occurrence of urban pluvial flooding were shown to be influential. The results also showed that the impact of anthropogenic factors was greater in Osaka City, which is on a larger urban scale than Nagoya City.
In general, urbanisation increases the accumulation of assets in topographically flood-prone areas, and the risk of urban pluvial flooding increases. On the other hand, urban pluvial flood risk has been reduced through the improvement of drainage systems in such areas; however, urban pluvial flooding has also been observed in topographically less-flood-prone areas due to changes in land use and land cover. In other words, as urbanisation progresses, the main cause of urban pluvial flooding is likely to shift from topographical factors to anthropogenic factors. The results of this study quantitatively showed this paradigm shift of urban pluvial flooding factors by the statistical analysis of newly defined urban pluvial flooding frequency areas. This is demonstrated as one of the methods for a major advance in urban flood modelling science proposed by Mignot and Dewals [9]. Furthermore, this study showed that it is difficult to describe past urban pluvial flooding areas in Osaka and Nagoya Cities solely based on topographical characteristics. This was consistent with the findings of the numerical experiment [22] and statistical analyses [14] and showed that in some cases that artificial structures formed areas vulnerable to urban pluvial flooding even outside topographically flood-prone areas.
In addition, it is particularly difficult to collect flow velocity and depth observations during urban floods, as they are usually of short duration. The recent proliferation of mobile phones and online video-sharing platforms gives access to countless amateur videos [23,24,25], which are being used in most geophysical sciences, but difficulties with retrieving the location and time of the scenes impair the use of these data for detailed model validation [9]. The urban pluvial flooding area record used in this study and the newly defined frequent urban pluvial flooding area could be important sources for this validation.
On the other hand, although this study succeeded in quantitatively assessing the differences in the impact of topographical characteristics on the formation of frequent urban pluvial flooding areas due to urban scale by comparative analyses in Osaka and Nagoya Cities, this study only compared two cities, and the relationship between urban scale and frequent urban pluvial flooding areas has not been quantitively clarified. Further quantitative comparison with the characteristics of frequent urban pluvial flooding areas in other cities of different urban scales would help to understand the characteristics of urban pluvial flooding and their transition from topographical factors to anthropogenic factors, which is associated with urbanisation. Furthermore, socio-hydrology [26,27], which deals with the interaction between water systems and human activities, has been recently applied worldwide for flooding and water resources management [28]. Further quantitative comparative analysis of the characteristics of frequent urban pluvial flooding areas among different urban scale cities would provide a quantitative understanding of the system dynamics of urban pluvial flooding interacting with urbanisation, namely human activities.
Author Contributions
Conceptualization, D.K.; methodology, D.K. and K.N.; formal analysis and investigation, D.K., K.N., R.I., Y.O. and R.T.; writing—original draft preparation, D.K. and K.N.; writing—review and editing, D.K. and S.K.; visualization, D.K. and K.N.; supervision, D.K. and S.K.; funding acquisition, D.K. and S.K. All authors have read and agreed to the published version of the manuscript.
Funding
This research was partly funded by the Nomura Foundation for Membrane Structure Technology and the Obayashi Foundation, and the APC was funded by the Masaki Sawamoto Research Publication Grant.
Institutional Review Board Statement
No applicable.
Informed Consent Statement
No applicable.
Data Availability Statement
No applicable.
Acknowledgments
This research was supported by CSIS Joint Research No. 1123, University of Tokyo. The urban pluvial flooding area record was provided by the River Planning Division, Water Management and Land Conservation Bureau, Ministry of Land, Infrastructure and Transport. The authors would like to express their gratitude.
Conflicts of Interest
The authors declare no conflict of interest.
References
- Hammond, M.J.; Chen, A.S.; Djordjević, S.; Butler, D.; Mark, O. Urban flood impact assessment: A state-of-the-art review. Urban Water J. 2015, 12, 14–29. [Google Scholar] [CrossRef]
- Lowe, R.; Urich, C.; Domingo, N.S.; Mark, O.; Deletic, A.; Arnbjerg-Nielsen, K. Assessment of urban pluvial flood risk and efficiency of adaptation options through simulationse a new generation of urban planning tools. J. Hydrol. 2017, 550, 355–367. [Google Scholar] [CrossRef]
- Wang, Y.; Chen, A.S.; Fu, G.; Djordjević, S.; Zhang, C.; Savić, D.A. An integrated framework for high-resolution urban flood modelling considering multiple information sources and urban features. Environ. Model. Softw. 2018, 107, 85–95. [Google Scholar] [CrossRef]
- Economic Lossess from Climate-Related Extremes in Europe. Available online: https://www.eea.europa.eu/data-and-maps/indicators/river-floods-3/assessment (accessed on 5 August 2022).
- Hirabayashi, Y.; Mahendran, R.; Koirala, S.; Konoshima, L.; Yamazaki, D.; Watanabe, S.; Kanae, S. Global flood risk under climate change. Nat. Clim. Chang. 2013, 3, 816–821. [Google Scholar] [CrossRef]
- National Academies of Sciences, Engineering, and Medicine. Framing the Challenge of Urban Flooding in the United States; National Academies Press: Washington, DC, USA, 2019. [Google Scholar]
- Statistics of Flood Damage. Available online: https://www.mlit.go.jp/river/toukei_chousa/kasen/suigaitoukei/index.html (accessed on 5 August 2022).
- The Fifth Assessment Report (AR5) WG2-Climate Change 2014: Impacts, Adaptation, and Vulnerability. Available online: https://www.ipcc.ch/report/ar5/wg2/ (accessed on 5 August 2022).
- Mignot, E.; Dewals, B. Hydraulic modelling of inland urban flooding: Recent advances. J. Hydrol. 2022, 609, 127763. [Google Scholar] [CrossRef]
- Jacobson, C.R. Identification and quantification of the hydrological impacts of imperviousness in urban catchments: A review. J. Environ. Manag. 2011, 92, 1438–1448. [Google Scholar] [CrossRef] [PubMed]
- Zhang, W.; Villarini, G.; Vecchi, G.A.; Smith, J.A. Urbanization exacerbated the rainfall and flooding caused by hurricane Harvey in Houston. Nature 2018, 563, 384–388. [Google Scholar] [CrossRef] [PubMed]
- Shuster, W.D.; Bonta, J.; Thurston, H.; Warnemuende, E.; Smith, D. Impacts of impervious surface on watershed hydrology: A review. Urban Water J. 2005, 2, 263–275. [Google Scholar] [CrossRef]
- Wang, X.; Kinsland, G.; Poudel, D.; Fenech, A. Urban flood prediction under heavy precipitation. J. Hydrol. 2019, 577, 123984. [Google Scholar] [CrossRef]
- Djamres, E.K.D.; Komori, D.; Kazama, S. Topographical Characteristics of Frequent Inland Water Flooding Areas in Tangerang City, Indonesia. Front. Water 2021, 3, 661299. [Google Scholar] [CrossRef]
- Fariza, A.; Basofi, A.; Prasetyaningrum, I.; Pratiwi, V.I. Urban flood risk assessment in sidoarjo, indonesia, using fuzzy multi-criteria decision making. J. Phys. Conf. Ser. 2019, 1444, 012027. [Google Scholar] [CrossRef]
- Sato, R.; Hayashi, T. Topographical and topographical characteristics of flooded areas and visualization of potential for pluvial flooding. J. Jpn. Soc. Hydrol. Water Resour. 2014, 27, 158–169. [Google Scholar] [CrossRef]
- Guidelines for Statistics of Flood Damage. Available online: http://www.mlit.go.jp/river/toukei_chousa/kasen/suigaitoukei/shiryou.html (accessed on 5 August 2022).
- National Land Information Division. Available online: https://nlftp.mlit.go.jp/ksj/index.html (accessed on 25 August 2022).
- Japan Meteorological Agency AMeDAS. Available online: https://www.jma.go.jp/jp/amedas/ (accessed on 25 August 2022).
- Geospatial Information Authority of Japan. Available online: https://fgd.gsi.go.jp/download/menu.php (accessed on 5 August 2022).
- Nagoya City Water and Sewerage Bureau: Countermeasures in Response to the Torrential Rains in Tokai, Japan. Available online: https://www.water.city.nagoya.jp/category/saigaisonae/2174.html (accessed on 5 August 2022).
- de Almeida, G.A.; Bates, P.; Ozdemir, H. Modelling urban floods at submetre resolution: Challenges or opportunities for flood risk management? J. Flood Risk Manag. 2018, 11, S855–S865. [Google Scholar] [CrossRef]
- Le Coz, J.; Patalano, A.; Collins, D.; Guillén, N.F.; García, C.M.; Smart, G.M.; Braud, I. Crowdsourced data for flood hydrology: Feedback from recent citizen science projects in Argentina, France and New Zealand. J. Hydrol. 2016, 541, 766–777. [Google Scholar] [CrossRef]
- Kankanamge, N.; Yigitcanlar, T.; Goonetilleke, A.; Kamruzzaman, M. Determining disaster severity through social media analysis: Testing the methodology with South East Queensland Flood tweets. Int. J. Disaster Risk Reduct. 2020, 42, 101360. [Google Scholar] [CrossRef]
- Zhang, Y.; Chen, Z.; Zheng, X.; Chen, N.; Wang, Y. Extracting the location of flooding events in urban systems and analyzing the semantic risk using social sensing data. J. Hydrol. 2021, 603, 127053. [Google Scholar] [CrossRef]
- Sivapalan, M.; Savenjie, H.H.G.; Blöschl, G. Sociohydrology: A new science of people and water. Hydrol. Process. 2012, 26, 1270–1276. [Google Scholar] [CrossRef]
- Di Baldassarre, G.; Sivapalan, M.; Rusca, M.; Cudennec, C.; Garcia, M.; Kreibich, H.; Konar, M.; Mondino, E.; Mård, J.; Pande, S.; et al. Sociohydrology: Scientific challenges in addressing the sustainable development goals. Water Resour. Res. 2019, 55, 6327–6355. [Google Scholar] [CrossRef] [PubMed]
- Kreibich, H.; Schröter, K.; Di Baldassarre, G.; Van Loon, A.; Mazzoleni, M.; Abeshu, G.W.; Agafonova, S.; AghaKouchak, A.; Aksoy, H.; Alvarez-Garreton, C.; et al. Panta Rhei benchmark dataset: Socio-hydrological data of paired events of floods and droughts. GFZ Data Serv. 2022. [Google Scholar] [CrossRef]
Figure 1.
Location of the target cities in Japan and low-lying areas in the target cities. Low-lying areas are classified by the Ministry of Land, Infrastructure, Transport, and Tourism (MLIT) as areas where the elevation is lower than the surrounding [18].
Figure 1.
Location of the target cities in Japan and low-lying areas in the target cities. Low-lying areas are classified by the Ministry of Land, Infrastructure, Transport, and Tourism (MLIT) as areas where the elevation is lower than the surrounding [18].

Figure 2.
An example urban pluvial flooding area record (in Japanese). The seven shaded areas indicate the area where urban pluvial flooding occurred by Typhoon No. 17 on 22 September 1996. The scale of the map is 1/2500.
Figure 2.
An example urban pluvial flooding area record (in Japanese). The seven shaded areas indicate the area where urban pluvial flooding occurred by Typhoon No. 17 on 22 September 1996. The scale of the map is 1/2500.

Figure 3.
The distribution of frequent urban pluvial flooding areas (red circle) in (a) Osaka City and (b) Nagoya City.
Figure 3.
The distribution of frequent urban pluvial flooding areas (red circle) in (a) Osaka City and (b) Nagoya City.

Figure 4.
The distribution of and the urban pluvial flooding areas (light blue dot) in (a) Osaka City and (b) Nagoya City.
Figure 4.
The distribution of and the urban pluvial flooding areas (light blue dot) in (a) Osaka City and (b) Nagoya City.

Figure 5.
A conceptual diagram of the classification conditions of the classified frequent urban pluvial flooding areas. (a–h) are areas where “dominant structures” were located within 8 mesh around the urban pluvial flooding area, while (i,j) are areas where “dominant structures” were not located within 8 mesh around the urban pluvial flooding area. (h) is the area where “dominant structures” were located in three directions around the frequent urban pluvial flooding area, and “dominant structures” were located in the front of the slope direction. The red line enclosure are areas where “dominant structures” was located in the direction of inclination (direction of inundated water flow).

Figure 6.
The frequency distribution of slopes at the frequent urban pluvial flooding areas in Osaka and Nagoya Cities.
Figure 6.
The frequency distribution of slopes at the frequent urban pluvial flooding areas in Osaka and Nagoya Cities.

Figure 7.
The difference in urban pluvial floodings between the first 10 years (1993–2002) and the second 10 years (2003–2012) of the 20 years (1993–2012) in (a) Osaka City and (b) Nagoya City. The differences of 2 or more are shown in red, −1 to 1 in blue, and −2 or less in green. Red indicates areas where urban pluvial flooding occurred more frequently in the second 10 years, blue indicates areas where urban pluvial flooding occurred continuously throughout the 20 years, and green indicates areas where urban pluvial flooding occurred more frequently in the first 10 years.

Figure 8.
Urban flood management plan in Nagoya City (Progress as at the end of 2015) [21].
Figure 8.
Urban flood management plan in Nagoya City (Progress as at the end of 2015) [21].


Table 1.
Detailed information on Osaka and Nagoya Cities.
| Osaka City | Nagoya City | |
|---|---|---|
| Population (person) | 2,717,000 | 2,311,000 |
| Population density (person/km2) | 12,000 | 7000 |
| Urbanised area ratio (%) | 93.9 | 92.6 |
| Gross domestic product (trillion yen) | 20.0 | 14.4 |
| Urban pluvial flooding area records | 155 1 | 302 1 |
Note: 1 In detail, see Section 2.2.
Table 2.
Annual maximum one-hour rainfall during 1993–2012 in Osaka and Nagoya Cities. The shaded values are greater than the average for each city.
Table 2.
Annual maximum one-hour rainfall during 1993–2012 in Osaka and Nagoya Cities. The shaded values are greater than the average for each city.
| Rank | Osaka City | Nagoya City | ||
|---|---|---|---|---|
| Date | Annual Maximum One-Hour Rainfall (mm) | Date | Annual Maximum One-Hour Rainfall (mm) | |
| 1 | 16:00 27 Aug. 2011 | 73 | 19:00 18 Sep. 2000 | 93 |
| 2 | 15:00 18 Aug. 2012 | 52 | 6:00 08 Oct. 2009 | 67 |
| 3 | 1:00 29 Aug. 1996 | 49.5 | 0:00 29 Aug. 2008 | 55 |
| 4 | 11:00 03 July 1995 | 45.5 | 0:00 28 July 1998 | 49.5 |
| 5 | 15:00 05 Aug. 1977 | 45.5 | 15:00 05 Sep. 2004 | 49.5 |
| 6 | 18:00 20 Oct. 2004 | 38 | 23:00 21 Aug. 1999 | 49 |
| 7 | 2:00 11 Aug. 1999 | 36 | 21:00 17 Sep. 1994 | 46.5 |
| 8 | 15:00 24 Sep. 2003 | 31 | 16:00 20 Sep. 2011 | 43.5 |
| 9 | 15:00 28 July 2008 | 30.5 | 18:00 25 July 1993 | 40.5 |
| 10 | 2:00 16 June 2010 | 29.5 | 14:00 20 July 2012 | 37 |
| 11 | 3:00 05 July 1993 | 28.5 | 5:00 23 Aug. 2007 | 33.5 |
| 12 | 15:00 30 Aug. 2005 | 27 | 5:00 11 July 1997 | 33 |
| 13 | 8:00 08 Sep. 1994 | 26.5 | 9:00 21 July 1995 | 28.5 |
| 14 | 5:00 13 July 2002 | 26.5 | 18:00 26 Aug. 2003 | 27 |
| 15 | 0:00 17 July 2007 | 26 | 9:00 06 Sep. 2002 | 26 |
| 16 | 22:00 16 May 1998 | 23 | 9:00 20 Aug. 2005 | 24.5 |
| 17 | 18:00 11 Sep. 2000 | 22 | 20:00 30 Aug. 2001 | 23.5 |
| 18 | 8:00 01 Oct. 2001 | 21 | 1:00 16 June 2006 | 23.5 |
| 19 | 6:00 19 July 2006 | 19 | 11:00 08 Sep. 2010 | 21.5 |
| 20 | 1:00 30 July 2009 | 13.5 | 6:00 09 May 1996 | 17 |
Table 3.
The method used to create each topographical factor.
| Topographical Factor | Unit | Methodology for Creating Dataset |
|---|---|---|
| Elevation | m | DEM is converted to raster data. |
| Slope | % | The slope at each mesh is calculated from “Elevation”. |
| Depth of concave | m | The area where the elevation is lower than the surrounding area and the contour lines are closed is extracted as a concave area, and the depth and volume of the concave area are calculated. |
| Capacity of concave | m3 | |
| Catchment area | m2 | Flow direction data are created from “Elevation”, and the area is calculated from the number of meshes upstream of each mesh. |
| Slope of upstream | % | The average of the slope in the catchment area of each mesh is calculated. |
| Slope of downstream | % | The average of the slopes in the downstream channel of each mesh is calculated. |
| Difference of slope | % | The difference between “Slope of upstream” and “Slope of downstream” at each mesh is calculated. |
| Flow length of upstream | m | The length of longest upstream channel in each mesh is extracted from the flow direction data. |
| Flow length of downstream | m | The length of the downstream channel to a sink or outlet of the catchment area in each mesh is extracted from the flow direction data. |
| Difference of flow length | m | The difference between “Flow length of upstream” and “Flow length of downstream” at each mesh is calculated. |
Table 4.
(a) The relationship between the total years of urban pluvial flooding and the number of urban pluvial flooding areas in the raster data for each mesh size in Osaka City. (b) The relationship between the total years of urban pluvial flooding and the number of urban pluvial flooding areas in the raster data for each mesh size in Nagoya City.
| (a) | ||||||
| Osaka City | ||||||
| Total Years of Urban Pluvial Flooding (Year) | Mesh Size | |||||
| 10 m | 30 m | 50 m | 100 m | 200 m | 400 m | |
| 1 | 38,687 | 7648 | 4089 | 1879 | 898 | 337 |
| 2 | 3820 | 1082 | 692 | 462 | 323 | 210 |
| 3 | 645 | 261 | 189 | 138 | 116 | 99 |
| 4 | 70 | 36 | 45 | 49 | 42 | 45 |
| 5 | 4 | 8 | 10 | 20 | 23 | 18 |
| 6 | 1 | 1 | 4 | 5 | ||
| 7 | 2 | |||||
| More than 4 | 74 | 45 | 55 | 70 | 69 | 70 |
| (b) | ||||||
| Nagoya City | ||||||
| Total Years of Urban Pluvial Flooding (Year) | Mesh Size | |||||
| 10 m | 30 m | 50 m | 100 m | 200 m | 400 m | |
| 1 | 632,915 | 73,366 | 27,436 | 7406 | 2093 | 542 |
| 2 | 102,193 | 13,330 | 5540 | 1920 | 743 | 303 |
| 3 | 11,737 | 1931 | 929 | 435 | 261 | 161 |
| 4 | 1243 | 256 | 153 | 83 | 54 | 51 |
| 5 | 172 | 35 | 22 | 16 | 17 | 19 |
| 6 | 39 | 16 | 12 | 9 | 5 | 6 |
| 7 | 1 | 2 | ||||
| More than 4 | 1454 | 307 | 187 | 108 | 77 | 78 |
Table 5.
(a) The PCA result for Osaka City. The shaded values are the factors that correlated the most in each PC. “-” indicates that no topographical factors in the principal components satisfied the 95% confidence interval. (b) The PCA result for Nagoya City. The shaded values are the factors that correlated the most in each PC.
| (a) | ||||
| Factor Loading | PC1 | PC2 | PC3 | PC4 |
| Standard deviation (eigenvalue) | 1.94 | 1.63 | 1.39 | 1.04 |
| Contribution ratio | 0.343 | 0.241 | 0.176 | 0.098 |
| Cumulative contribution ratio | 0.343 | 0.584 | 0.759 | 0.857 |
| Elevation | 0.373 | −0.017 | −0.016 | 0.162 |
| Slope | 0.354 | −0.387 | - | 0.008 |
| Depth of concave | −0.278 | −0.311 | −0.051 | −0.539 |
| Capacity of concave | −0.308 | −0.331 | −0.049 | −0.401 |
| Catchment area | −0.027 | 0.060 | 0.683 | 0.018 |
| Slope of upstream | 0.404 | −0.295 | 0.102 | −0.212 |
| Slope of downstream | 0.213 | −0.435 | −0.043 | 0.391 |
| Difference of slope | 0.390 | −0.210 | 0.125 | −0.337 |
| Flow length of upstream | −0.070 | 0.014 | 0.687 | −0.018 |
| Flow length of downstream | 0.310 | 0.409 | 0.045 | −0.333 |
| Difference of flow length | −0.319 | −0.389 | 0.163 | 0.315 |
| (b) | ||||
| Factor Loading | PC1 | PC2 | PC3 | PC4 |
| Standard deviation (eigenvalue) | 1.93 | 1.77 | 1.34 | 1.05 |
| Contribution ratio | 0.338 | 0.285 | 0.164 | 0.100 |
| Cumulative contribution ratio | 0.338 | 0.623 | 0.786 | 0.886 |
| Elevation | −0.387 | 0.193 | 0.078 | −0.249 |
| Slope | −0.366 | 0.195 | −0.297 | −0.322 |
| Depth of concave | 0.352 | −0.172 | −0.126 | −0.581 |
| Capacity of concave | 0.383 | −0.120 | −0.131 | −0.547 |
| Catchment area | −0.147 | −0.463 | 0.201 | −0.073 |
| Slope of upstream | −0.434 | −0.217 | −0.025 | −0.172 |
| Slope of downstream | −0.317 | 0.200 | −0.416 | −0.180 |
| Difference of slope | −0.349 | −0.309 | 0.128 | −0.118 |
| Flow length of upstream | −0.104 | −0.495 | 0.212 | −0.040 |
| Flow length of downstream | −0.054 | 0.206 | 0.647 | −0.271 |
| Difference of flow length | −0.012 | −0.443 | −0.422 | 0.204 |
Table 6.
The proportions of the classified frequent urban pluvial flooding areas in Figure 5. The grey values are areas where “dominant structures” were located in the direction of inundated water flow.
Table 6.
The proportions of the classified frequent urban pluvial flooding areas in Figure 5. The grey values are areas where “dominant structures” were located in the direction of inundated water flow.
| Classified Frequent Urban Pluvial Flooding Areas in Figure 5 | Osaka City | Nagoya City |
|---|---|---|
| (a) | 29% | 14% |
| (b) | 7% | 21% |
| (c) | 3% | 19% |
| (d) | 20% | 4% |
| (e) | 9% | 6% |
| (f) | 4% | 2% |
| (g) | 1% | 1% |
| (h) | 17% | 0% |
| (i) | 9% | 22% |
| (j) | 1% | 11% |
| Total | 100% | 100% |
Publisher’s Note: MDPI stays neutral with regard to jurisdictional claims in published maps and institutional affiliations. |
© 2022 by the authors. Licensee MDPI, Basel, Switzerland. This article is an open access article distributed under the terms and conditions of the Creative Commons Attribution (CC BY) license (https://creativecommons.org/licenses/by/4.0/).
Share and Cite
MDPI and ACS Style
Komori, D.; Nakaguchi, K.; Inomata, R.; Oyatsu, Y.; Tachikawa, R.; Kazama, S. Topographical Characteristics of Frequent Urban Pluvial Flooding Areas in Osaka and Nagoya Cities, Japan. Water 2022, 14, 2795. https://doi.org/10.3390/w14182795
AMA Style
Komori D, Nakaguchi K, Inomata R, Oyatsu Y, Tachikawa R, Kazama S. Topographical Characteristics of Frequent Urban Pluvial Flooding Areas in Osaka and Nagoya Cities, Japan. Water. 2022; 14(18):2795. https://doi.org/10.3390/w14182795
Chicago/Turabian StyleKomori, Daisuke, Kota Nakaguchi, Ryosuke Inomata, Yuika Oyatsu, Ryohei Tachikawa, and So Kazama. 2022. "Topographical Characteristics of Frequent Urban Pluvial Flooding Areas in Osaka and Nagoya Cities, Japan" Water 14, no. 18: 2795. https://doi.org/10.3390/w14182795
Note that from the first issue of 2016, this journal uses article numbers instead of page numbers. See further details here.