Article

Innovative Vulnerability and Risk Assessment of Urban Areas against Flood Events: Prognosis of Structural Damage with a New Approach Considering Flow Velocity

1
Earthquake Damage Analysis Center (EDAC), Bauhaus-Universität Weimar, Marienstraße 13B, 99423 Weimar, Germany
2
Department of Building Construction/Building Refurbishment, University of Applied Sciences Dresden (HTW Dresden), Friedrich-List-Platz 1, 01069 Dresden, Germany
*
Author to whom correspondence should be addressed.
Water 2022, 14(18), 2793; https://doi.org/10.3390/w14182793
Submission received: 28 July 2022 / Revised: 30 August 2022 / Accepted: 6 September 2022 / Published: 8 September 2022
(This article belongs to the Special Issue Flood Risk Management and Resilience)

Abstract

:
The floods in 2002 and 2013, as well as the recent flood of 2021, caused billions Euros worth of property damage in Germany. The aim of the project Innovative Vulnerability and Risk Assessment of Urban Areas against Flood Events (INNOVARU) involved the development of a practicable flood damage model that enables realistic damage statements for the residential building stock. In addition to the determination of local flood risks, it also takes into account the vulnerability of individual buildings and allows for the prognosis of structural damage. In this paper, we discuss an improved method for the prognosis of structural damage due to flood impact. Detailed correlations between inundation level and flow velocities depending on the vulnerability of the building types, as well as the number of storeys, are considered. Because reliable damage data from events with high flow velocities were not available, an innovative approach was adopted to cover a wide range of flow velocities. The proposed approach combines comprehensive damage data collected after the 2002 flood in Germany with damage data of the 2011 Tohoku earthquake tsunami in Japan. The application of the developed methods enables a reliable reinterpretation of the structural damage caused by the August flood of 2002 in six study areas in the Free State of Saxony.

1. Introduction

All Federal States in Germany are legally obliged to prepare and regularly update flood risk assessments and action programs for their rivers in accordance with the EU Flood Directive (2007/60/EC). However, there is a lack of uniform methods for analysis of the vulnerability of potentially affected buildings and to determine their potential damage for risk and cost-benefit considerations. Currently adopted area-related statistical damage values, particularly in urban areas, significantly underestimate the actual costs of radiation of damage caused by flooding.
The frequent sequence of devastating floods in Germany (2002, 2011, 2013 and 2021) highlights the relevance of studying extreme flood scenarios, considering that the probability of occurrence is not as low as previously assumed and that damage could be catastrophic for the affected areas and overdemanding for the responsible authorities and decision makers. In particular, the 2002 flood, along with flash flood events, such as the 2016 flood in Braunsbach [1,2] and the flood of 2021 in Rhineland-Palatinate and North Rhine-Westphalia [3], have shown that in addition to moisture penetration and water impact, the severity of structural damage identified in buildings can vary. Conventional flood loss models (e.g., overview in [4]) are usually limited to the prognosis of loss, considering the inundation level, and cannot adequately address the structural damage caused by dynamic flood processes.
Previous studies of structural damage to buildings have examined the correlation between flood actions (i.e., flow velocity and inundation level) and the collapse of structures [5,6,7]. Additionally, criteria for the delimitation of partial failure were set in [8]. However, these studies lack a refined methodology according to which various damage patterns of structural damage can be differentiated and transformed into tangible loss statements.
The flood damage model developed by the Earthquake Damage Analysis Center–(EDAC) [9,10] can predict and classify such structural damage in the form of damage grades. The vulnerability functions developed for the prognosis take into account the vulnerability of individual building types, the inundation level and the flow velocity.
The particular characteristics of flash flood events (cf. [1,3]), with their high flow velocities, are currently not sufficiently supported by damage data in this damage model.
Therefore, one objective of the INNOVARU research project funded by the German Federal Ministry of Education and Research (BMBF) was the development of an improved application-ready model for the monetary assessment of expected flood damage to buildings as an essential basis for planning flood risk management measures in the Free State of Saxony, Germany. Application target groups are primarily the Dam Authority of the Free State of Saxony (“Landestalsperrenverwaltung Sachsen”; LTV) and engineering offices, which can use the damage model for cost-benefit analyses in preliminary studies on flood protection measures, as well as in the selection of measures for future flood risk management plans.
The objective of the investigations presented in this paper is to provide an improved model for the prognosis of structural damage caused by flooding at the microscale level (individual buildings) depending on the flow velocity, inundation level and the vulnerability of the building (building type, state of maintenance and number of storeys). This ultimately serves as the basis for conversion into detailed synthetic loss statements.
The examined new damage prognosis tools will be applied to different investigation areas in Saxony (Germany) on a microscale level. The results are compared and validated based on the observed damage grades in the corresponding investigation areas.
Some sections and graphs presented this paper have already been published in [11] to discuss the interim results of the INNOVARU project at the FLOODrisk 2020 conference. The present paper completes these investigations, addressing the necessary coefficients for the application of the proposed damage model and providing more detailed explanations. Based on the reinterpretation of the damage caused by the 2002 flood in Saxony and the associated error analysis, the most suitable calculation variants are identified. The influence of flow velocity and the number of storeys on the scenarios is highlighted.
The accompanying paper [12] will link the subsequently presented methodology with newly derived synthetic damage functions covering the entire range of residential building stock in a more differentiated manner. An overview of efforts to reduce procedures using improved open geodata on a microscale level is provided in [13].

2. Basic Elements of the Procedure
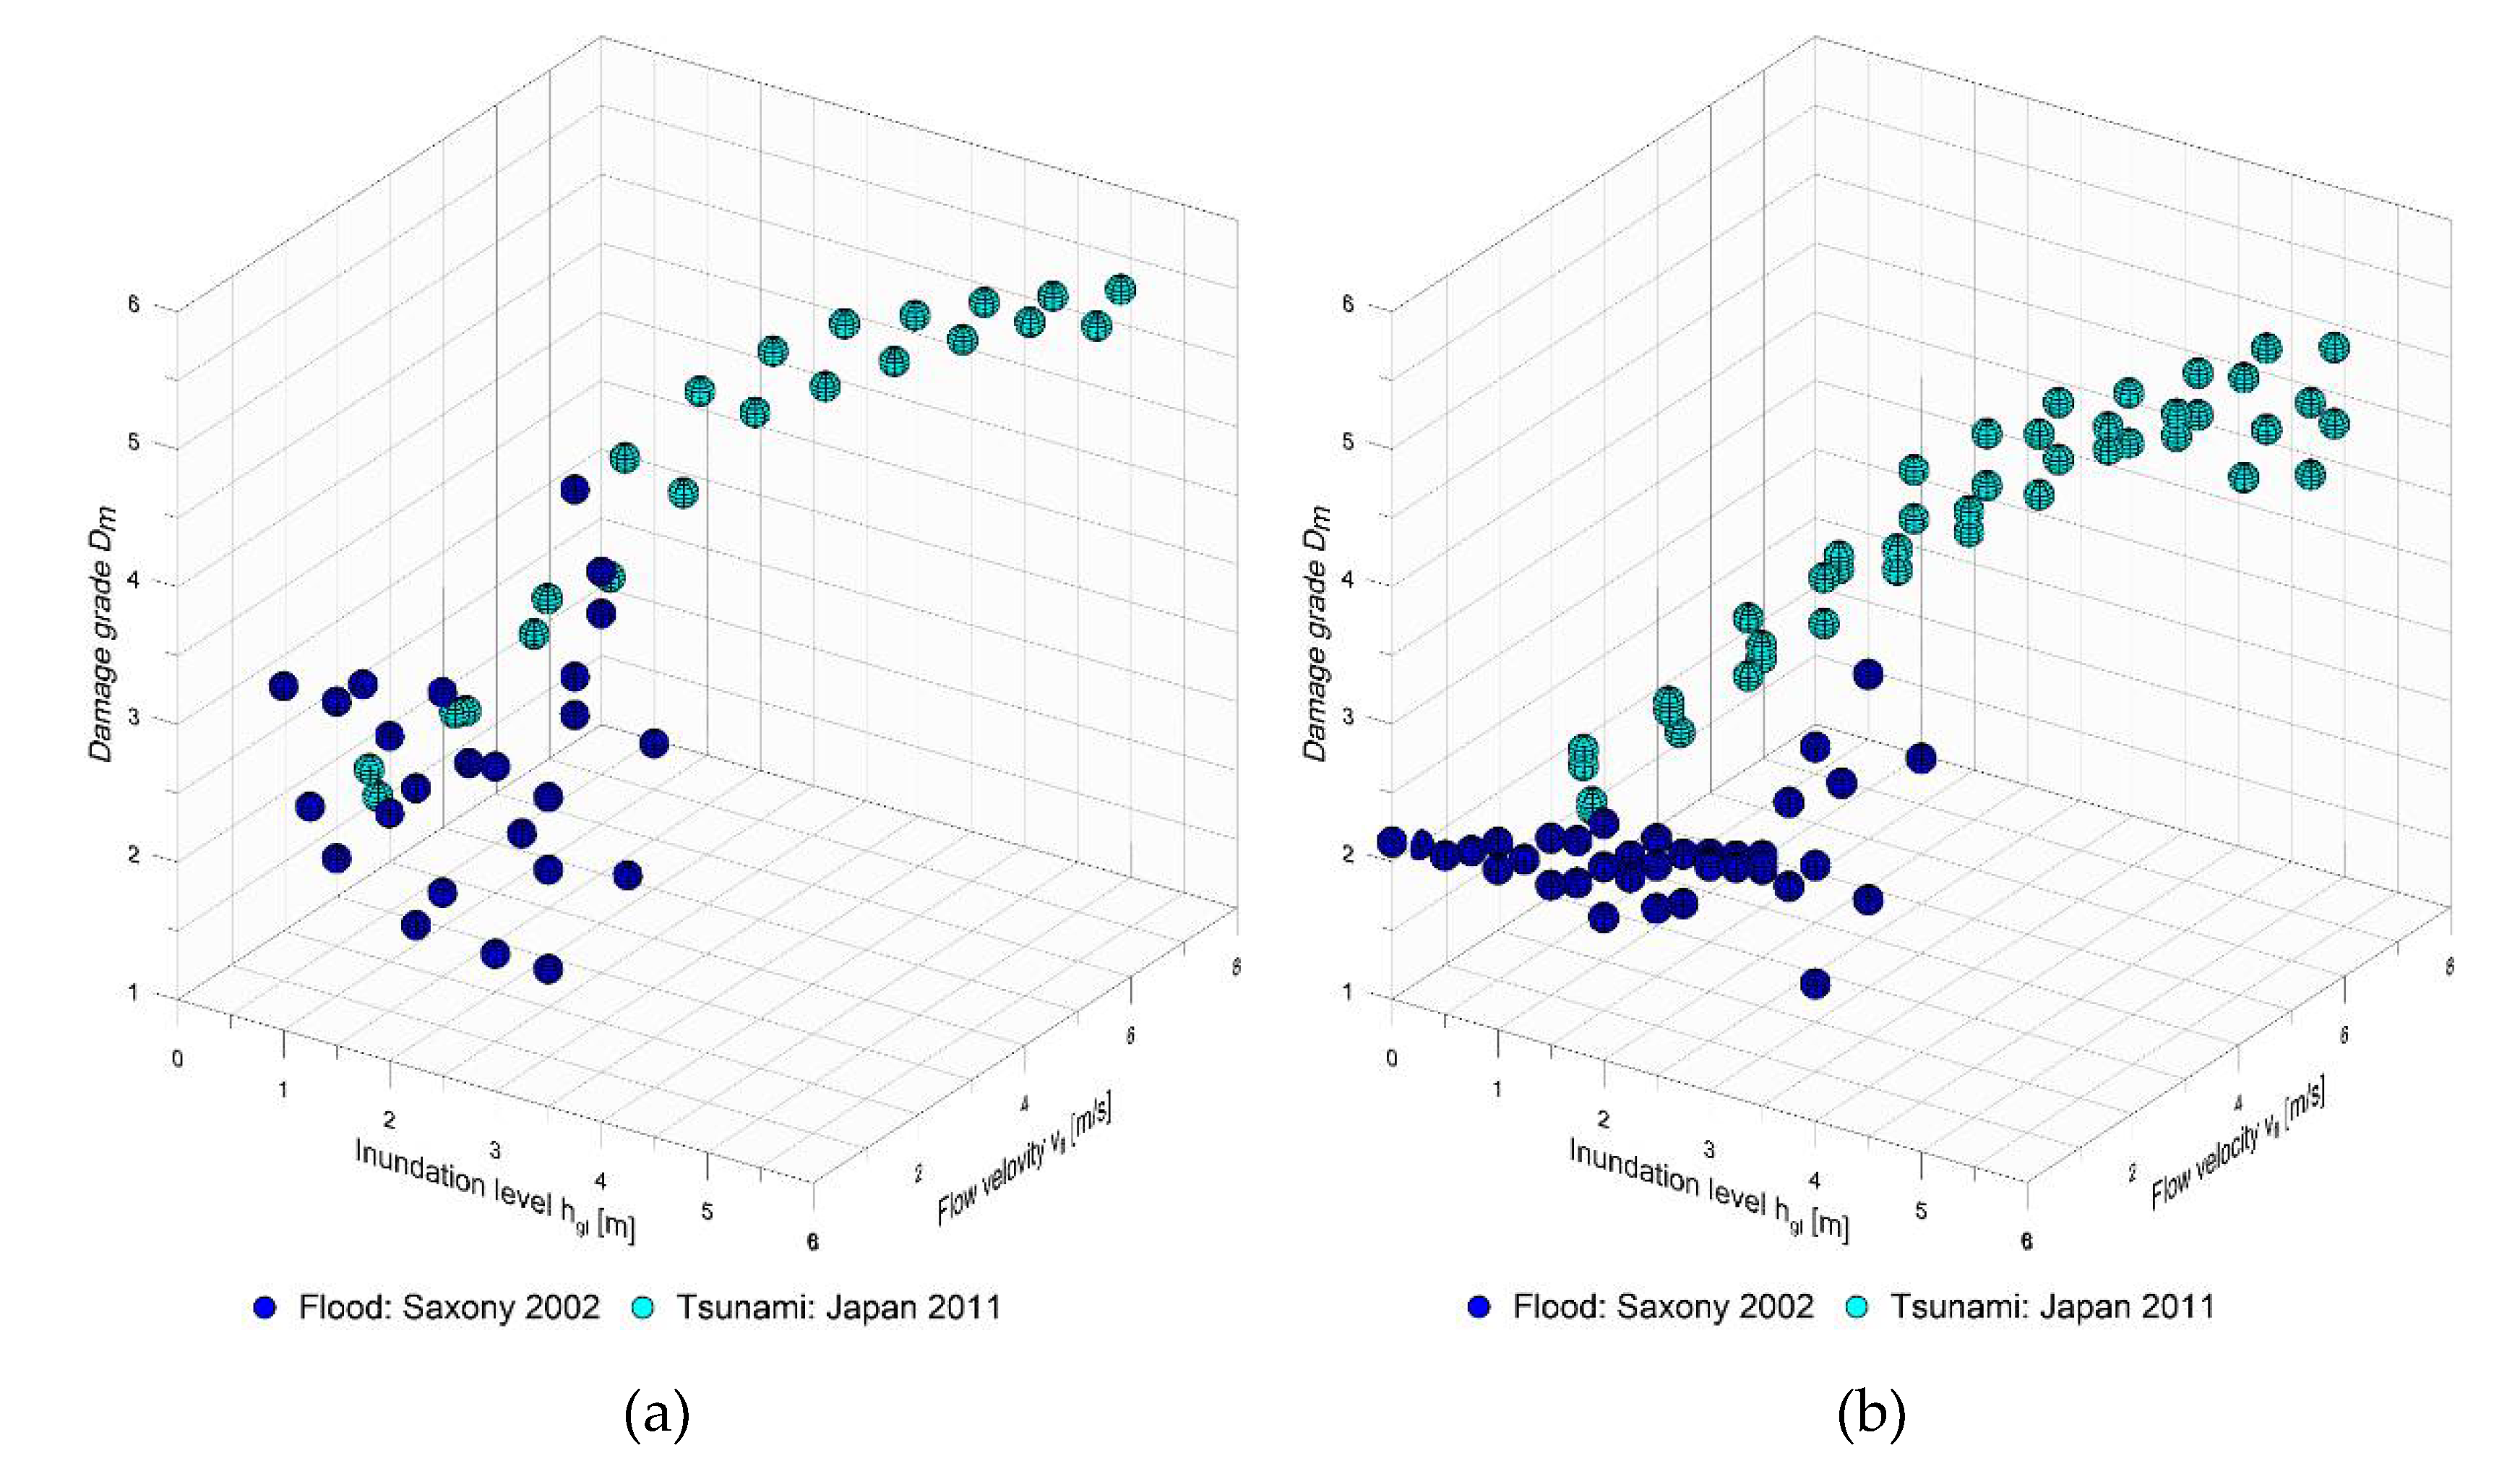
2.1. Damage Data

2.1.1. EDAC Flood Damage Database

The damage caused by the 2002 flood in Saxony exceeded the financial resources of most homeowners in Saxony. The recovery of residential buildings was supported by grants from the Saxonian Relief Bank (SAB). For recovery costs of more than EUR 30,000, damage reports had to be prepared and submitted. The SAB funded more than 22,000 applications for financial support to recovery [14]. Detailed damage reports were available for approximately 8000 buildings covering nearly all districts in Saxony affected by the 2002 flood.
These damage reports were processed and analyzed by EDAC on behalf of the Dam Authority of the Free State of Saxony. Reliable damage functions for residential buildings were derived from the first evaluations, which were required in the context of cost-benefit calculations for planned flood protection measures in the Free State of Saxony, Germany [15].
The relevant building parameters, the observed damage patterns, the impact parameters (inundation level) and the actual recovery costs were documented. Approximately 5000 cases of damage were evaluated, which currently form the core of the EDAC flood damage database. Additional damage data from previous research projects [16,17] are available but were not considered in this study because of possible data overlaps.
For approximately 1200 damage cases, flow velocities were assigned based on hydraulic calculations (see Section 2.3) in four of the selected investigation areas in Saxony [18]. The value for the assigned flow velocities was vmax ≈ 2.5 m/s, which corresponds to moderate water movement typical of river floods. Data on damage cases caused by higher flow velocities (such as those that occur with flash floods) were not available. Therefore, an unconventional but innovative approach had to be implemented in the INNOVARU project. The damage data of the 2011 Tohoku earthquake tsunami were included, assuming that tsunamis represent an extreme form of (cyclic) flooding.

2.1.2. Tsunami Damage Data

In general, inherent differences can be assumed between the impact of a flood and that of a tsunami, including the difference in quality of time-dependent characteristics. Changes in the direction of flow with incoming and outgoing waves or the surge forces of the wave front are more pronounced in the event of a tsunami.
Tsunamis generate large amounts of debris, the impact of which can significantly increase structural damage to buildings. This is usually not the case for river floods with low flow velocities. However, the flood of 2021, in particular, showed that in flash flood events, the impact of debris has a significant effect on structural damage [3]. For higher flow velocities, the application of tsunami damage data seems justified.
The damage data in the EDAC flood damage database also include damage cases in which the impact of debris contributed to structural damage. Thus, the impact of debris is included in the two damage databases, although not specifically extracted. More detailed investigations are to be carried out in the future, including damage data on the 2021 flood [3].
In this paper, comparable forces of hydrostatic and hydrodynamic pressure are assumed, as well as the impact of floating debris and buoyancy, which act on the affected buildings, making it possible to enrich the dataset for higher flow velocities.
Data on building damage sustained during the 2011 Tohoku earthquake tsunami were collected in a comprehensive damage database (n ≈ 252.000) and are available in an aggregated form [19]. So-called “fragility functions” were derived in [20,21] from this damage data depending on the inundation level (h) and building type for damage prognosis due to tsunami impact. Based on the concept of damage grades for earthquakes according to the European Macroseismic Scale (1998-EMS-98) [22], a six-stage damage scale for tsunamis was introduced for these investigations.
The additional damage grade D6 was assigned to buildings that were completely washed away or completely overturned (see [21]), whereas the lowest damage grade assigned is D1, as buildings not affected by the tsunami (i.e., D0) are not included in the evaluations (see also [23]).
The unified damage scales for the main natural hazards—earthquake, flood and wind—in the sense of a multihazard approach in [24] consider the damage classification described in [20,21]. The MLIT database [19] was re-evaluated in [25] to derive a mathematically based vulnerability table for tsunami impact (analogous to EMS-98). The various building types in the database were classified into vulnerability classes and their ranges of scatter.
Using the flow velocities estimated from video recordings in [26,27], Froude numbers were derived for the coastal characteristics (“plain coast” and “ria coast”). This enables an estimation of the flow velocities associated with the water levels in the MLIT database (see [25]).
The classification of vulnerability classes ensures the comparability of the behavior (i.e., the expected damage) of the considered individual building types in the two datasets (see also Section 3.2).
The application of the unified damage scales in [24] contributes to the compatibility and comparability between the damage grades of the individual natural hazards and, therefore, also between the available damage data.
Information on the damaged buildings in the EDAC flood damage database, for which the flow velocities were determined, as well as the tsunami damage data, were used to derive the vulnerability functions described in Section 4.

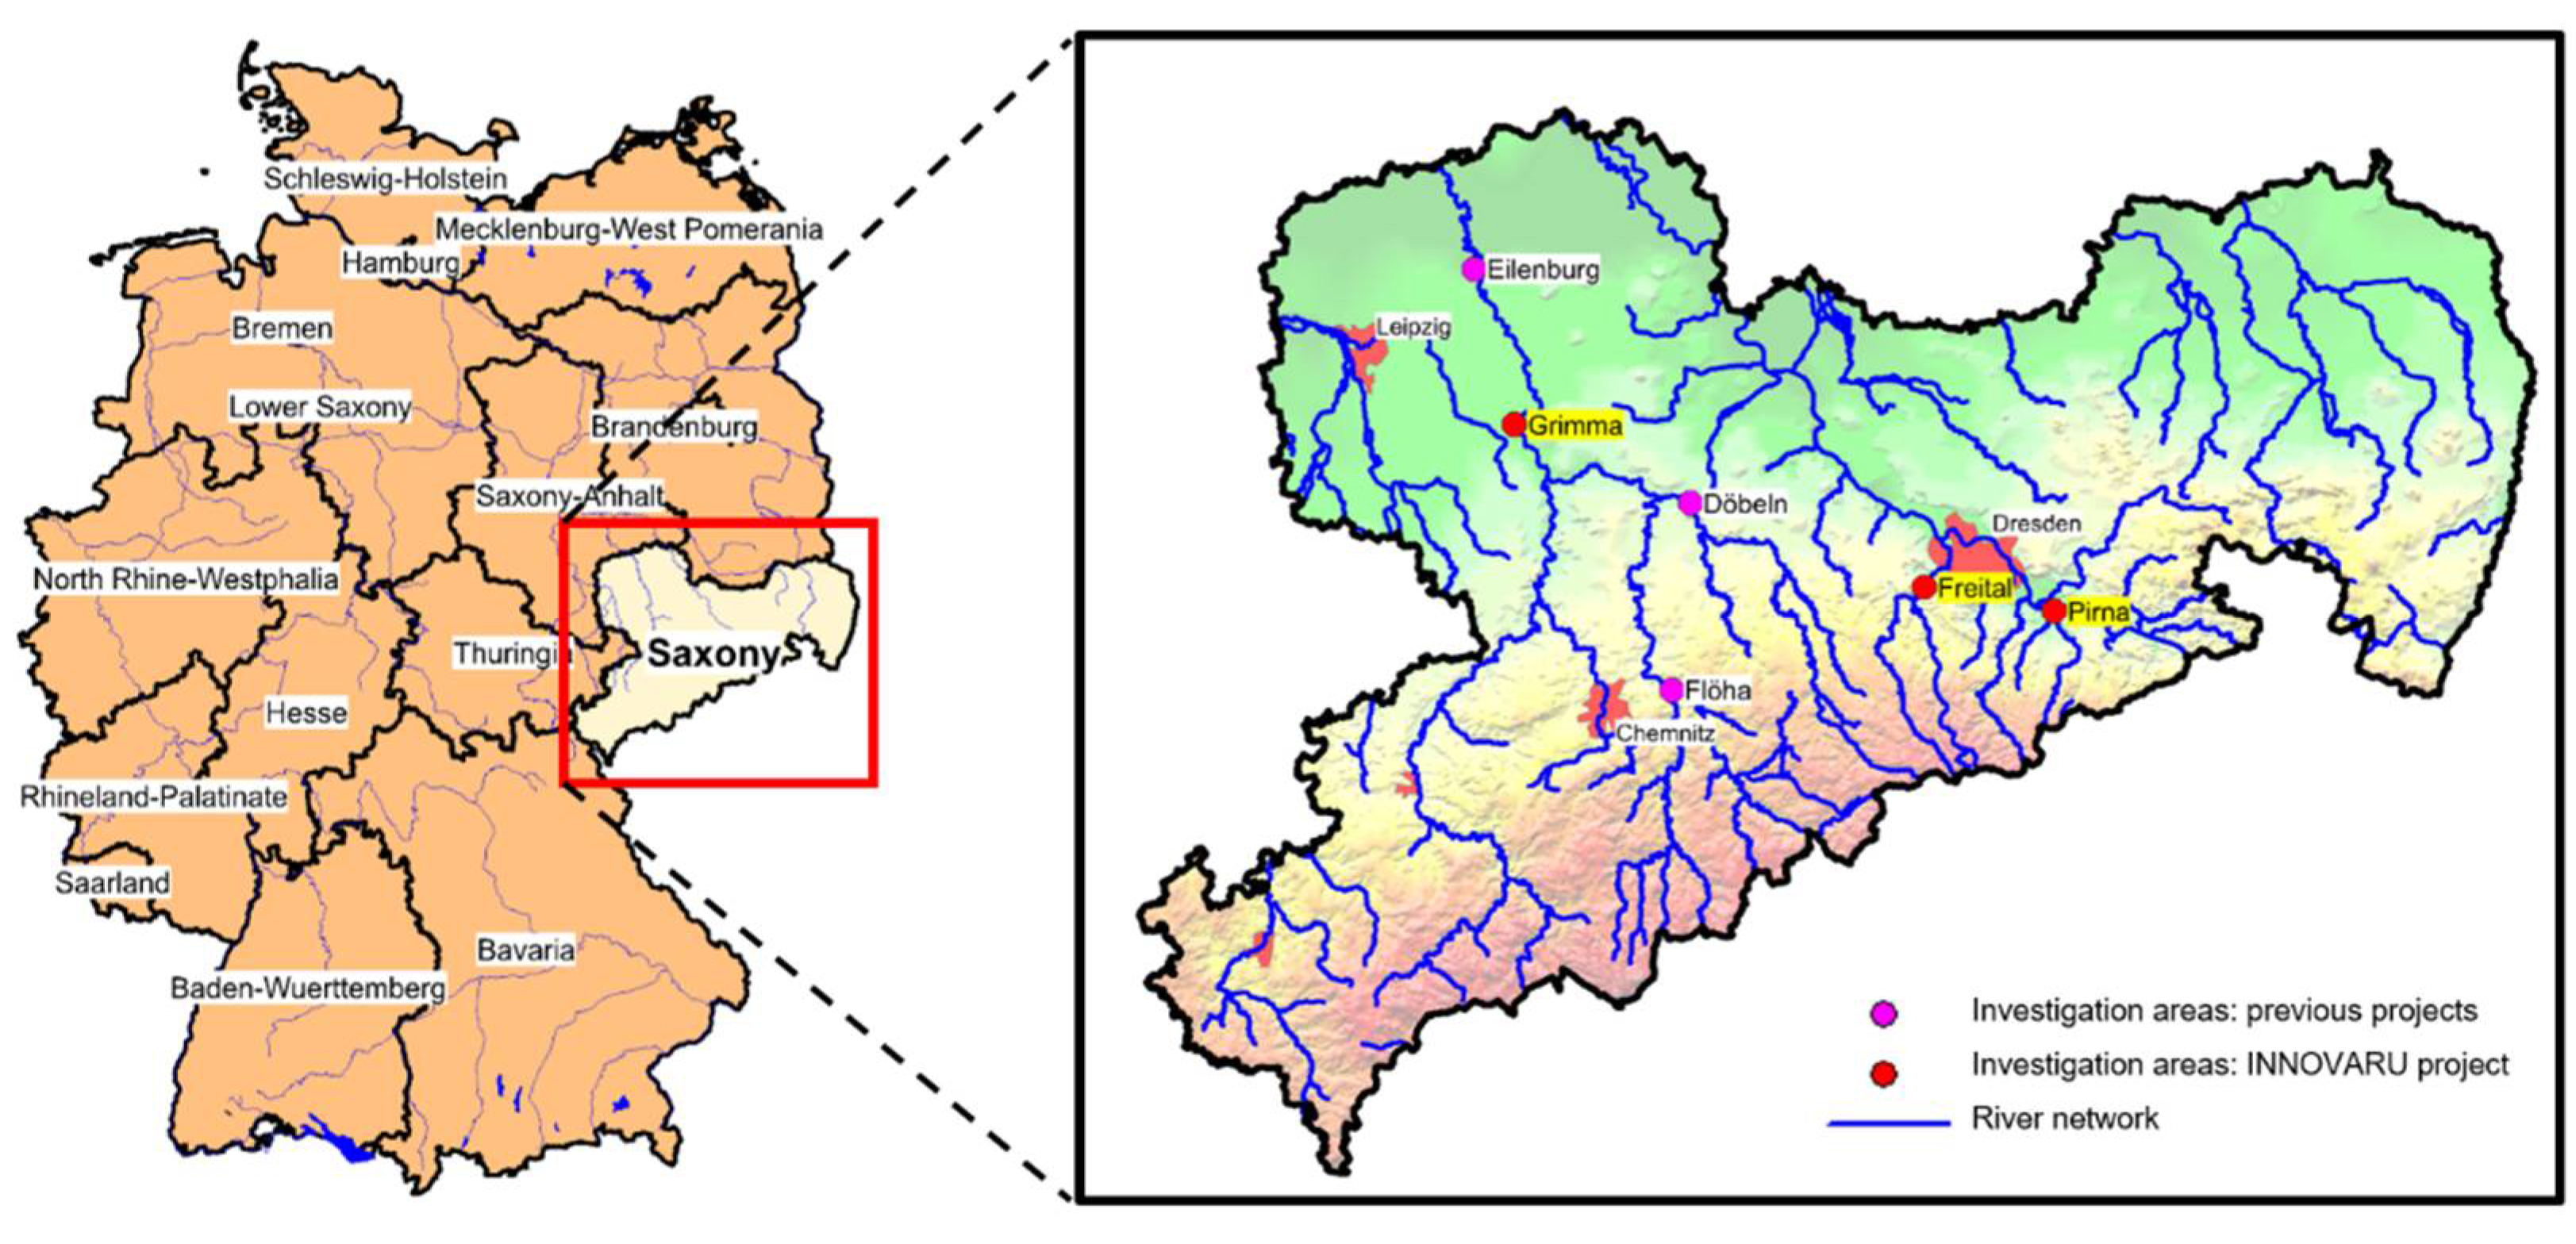
2.2. Investigation Areas

For the validation of the developed model on a microscale level, the building data from various flood-affected investigation areas in Saxony had to be collected. These data form the basis for the vulnerability assessment (see Section 3.2) and the application of the corresponding vulnerability functions to predict the structural damage in Section 5.
To this end, towns in the Free State of Saxony were taken as case studies, and different flooding parameters (i.e., inundation level and flow velocities) describe the events that occurred. Figure 1 displays the location of the investigated areas, and Table 1 provides an overview with respect to the inspected buildings per study area. Existing buildings in the Saxonian towns of Döbeln, Eilenburg, Grimma and Flöha affected by the 2002 flood were systematically investigated in previous research projects and formed the basis for the validation of the previous EDAC flood damage model with respect to real observed damage [9,10,18,28]. In addition to the relevant building parameters, the existing flood marks were also documented during building inspections. The towns of Pirna, Grimma and Freital were selected as study areas for joint investigations with INNOVARU project partners.
The building stock data of the investigation area of Grimma were updated in 2017 as part of a previous research project and are also available as part of INNOVARU.
Pirna is located at the confluence of the tributary rivers Gottleuba and Seidewitz with the Elbe River. The town experienced severe flooding in recent years, particularly in 2002 and 2013. Therefore, both state and local authorities developed various flood protection concepts that had to be assessed and prioritized. In this context, potential flood damage to residential buildings was previously analyzed in [29,30] for selected scenarios in Pirna.
The affected buildings on the northeastern bank of the Elbe remain unconsidered. Therefore, the number of SAB damage cases for Pirna apparently exceeds the number of residential buildings in Table 1.
The building stock of the city of Freital was documented on a microscale level using a coordinated parameter list, which was implemented in an updated version of the EQUIP building survey tool developed by EDAC (cf. [31,32]). The EQUIP (elaboration, qualification and interpretation) tool supports the documentation of building characteristics for subsequent detailed vulnerability analyses and damage modelling.
In the course of data collection, building plans (e.g., the building outlines of the official real estate cadaster information system, ALKIS®) were integrated into EQUIP and linked to the internal database of the program (Figure 2). The database fields can be activated in the program by simply selecting of the relevant building plan. Predefined selection fields and the option of entering free text enable exceedingly efficient data input. The various background maps that can be activated (satellite, street map or hybrid view), in combination with the display of the present location (on GPS-capable tablet PCs), simplify orientation in the investigation area. For the identification and classification of flood-prone buildings in the investigation areas, and an established building typology approach (cf. [12,30]) is used.
This approach was implemented in the applied version of the EQUIP tool as a quick selection matrix (Figure 3), providing windows with lists of predefined inspection parameters, which are adjustable to fit the real building properties. Therefore, the tool considerably accelerates data collection. Photographs of the structures were taken for plausibility checks and data supplementation. A further increase in efficiency can be expected as a result of future integration of a building typology for non-residential buildings.
Following the local building surveys, the data records of the individual members of the survey team were merged, GIS-specifically prepared and checked. A plausibility check and supplementation of partially non-visible parameters (especially in the roof areas of the buildings) was performed with high-resolution 3D models of Freital and Pirna, which are available in Google Earth®.

2.3. Flood Scenarios

The proposed approaches were validated by evaluating the damage prognosis in comparison to the damage that was actually observed after the 2002 flood. Hydraulic simulations of the 2002 flood event in the study areas are required to determine the impact parameters (inundation levels and flow velocities) on the affected buildings.
Due to the influence of flow velocity on damage, detailed hydraulic models are necessary. Velocity can change by a factor of ten within a few meters of buildings that are closely spaced.
Such accurate hydraulic models were provided for the INNOVARU study areas (Freital, Grimma, Pirna) and also for the town of Döbeln. For the investigation areas of Eilenburg and Flöha, hydraulic calculations were available, in which the existing building stock is taken into account with a mean surface roughness. Table 2 provides an overview of the applied 2D scenarios.
2D hydraulic calculations were compiled for the study areas of Grimma, Flöha, Döbeln and Eilenburg. In this project, the flow velocities for Eilenburg were derived from the calculations initiated and presented by the RIMAX project MEDIS (cf. [17]). The hydraulic models for Grimma and Flöha were provided by the Dam Authority of the Free State of Saxony (Landestalsperrenverwaltung; LTV). The LTV also later submitted a refined hydraulic model for Döbeln [33] for the investigations in [18]. Figure 4a shows the spatial distribution of inundation levels and flow velocities in Grimma.
The INNOVARU project comprises the reinterpretation of the 2002 flood event in the investigation area of Freital (Figure 4b). Two-dimensional (2D) unsteady-flow modeling was performed. Flow hydrographs of the tributaries “Rote Weisseritz” and “Wilde Weisseritz” were analyzed by rainfall–runoff models. Manning’s values were calibrated considering the observed flood line of the 2002 flood. Interestingly the maximum inundation level and maximum flow velocity are not simultaneous as a result of the unsteady flow. Discharge conditions at the maximum inundation level were selected for further analysis of flood damage.
A hydraulic calculation for the river “Elbe” for the 2002 flood was provided by the Dam Authority of Saxony for the investigation area of Pirna. The “HQ100” scenario was used for the “Gottleuba” and “Seidewitz” tributaries, demonstrating a satisfactory match with the observed flood areas of 2002 (Figure 4c).
Hydraulic calculations for the reinterpretation of extreme flood events, such as the 2002 flood, are usually subject to considerably uncertainties, as the hydraulic boundary conditions change due to erosion and rearrangement processes during the event. Therefore, the documented flood marks were used in the investigation areas of Eilenburg, Flöha and Döbeln to derive a simplified but realistic inundation level model based on the digital elevation model (DEM) with a resolution of 2 m × 2 m [28].

3. Flood Damage and Vulnerability of Buildings

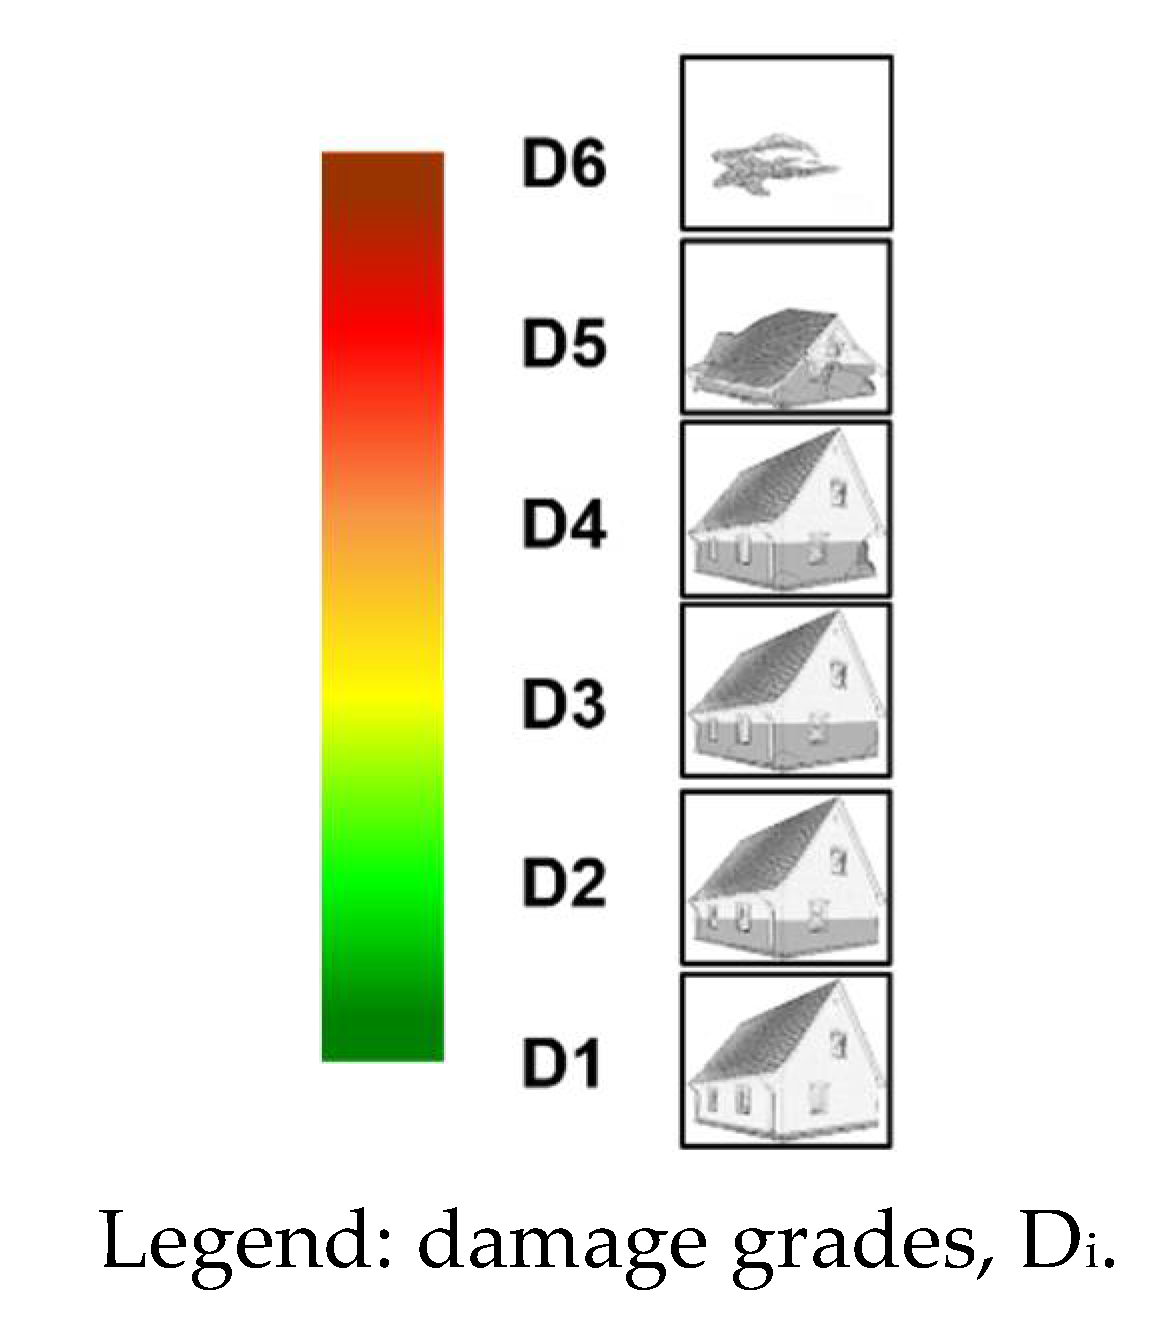
3.1. Damage Scale for Flooding

One of the elements of the EDAC flood damage model [9] is a five-stage damage scale, which was developed in [23] based on the observed damage from the 2002 flood.
Research on the unification of the description of building damage and the assessment of vulnerability for different natural hazards in terms of a multihazard approach [31,32] also led to further development of the damage scale for floods in [24], which is illustrated in Table 3. The examples for damage grades D1–D5 show damage cases of the 2002 flood in Saxony documented by EDAC in the days after the flood.
The damage cases of the 2021 flood in Germany show that damage patterns are possible in which buildings are completely washed away [3]. Such damage patterns have rarely been observed during previous floods but can occur during “flash flood” events.
Furthermore, considering the experience of tsunami damage [34], damage grade D6 (cf. Table 3) was introduced in [24] in order to differentiate these extreme damage cases from the grade of common collapse (D5).
The introduction of damage grade D6 in the flood damage scale enables comprehensive identification of damage patterns. Although damage grades D5 and D6 both represent total loss, there are differences that still need to be investigated.
With damage grade D5, additional demolition and disposal costs must be contemplated, which does not apply to buildings that have been completely washed away (i.e., damage grade D6).
The example of the washed away building for damage grade D6 in Table 3 was recently documented during a damage field survey immediately after the flood in Germany in 2021 in the Ahr Valley (Federal State of Rhineland Palatinate, cf. [3]). In principle, damage grade D6 can also be assigned to damage cases in which the building has been moved from its foundation or the building has tilted as a whole due to the scour of the foundation, which can be characterized as a disproportionate collapse.

3.2. Flood Vulnerability Classes

The concept of vulnerability classes was originally established by the European Macroseismic Scale (1998–EMS 98) [22] to define the intensity of an earthquake (and its shaking) based on observed effects, including, for higher intensities, the quality and quantity of damage to buildings as the most relevant indicator. One of the EMS 98 achievements is a vulnerability table, which enables a simple assessment of the vulnerability of various types of structures (cf. [25]).
The building type and the structural system of the buildings are taken into account. Additional factors, such as the quality of construction, state of disrepair, irregularities in shape, floor plan and design “defects”, can be considered according to the specified ranges of scatter (most likely, still probable and exceptional cases). The concept was successfully introduced for flood damage prognosis in [23] and further developed in [31]. Vulnerability classes categorize building types with a comparable vulnerability. A similar damage expectation (in the form of damage grades) is assumed for the same impact level from a natural hazard.
The introduced vulnerability tables for earthquakes [22], floods and wind [31] provide four vulnerability classes (A to D) for the consideration of the typical building stock and two classes (E and F) for buildings specially designed for the corresponding natural hazard [35].
Buildings of class HW-E (i.e., HW, referring to German “Hochwasser”, can be read as “High Water”) usually consist of reinforced concrete or masonry in a flood-resistant design and are characterized by a separation of vulnerable building parts from the flood water level, for instance, by raising the ground floor onto storey-high columns of steel or reinforced concrete [10]. Vulnerability class HW-F (newly introduced in [31]) is related to constructions such as floating homes (e.g., [36]), which represent a construction method specially adapted to floods.
Built on steel or concrete pontoons, these buildings avoid flooding by floating when the water level rises. Because only the pontoon is exposed to the flood water, the construction of the actual building is of minor importance with respect to the vulnerability. No damage data are currently available for the HW-E and HW-F vulnerability classes; therefore these classes were excluded from the investigations presented in this paper.
An essential criterion for determining flood vulnerability classes is structural damage (described by the mean damage grades, Dm) of similar impact levels.
The flood vulnerability classes were determined according to the method described in [10]. Evaluation of the damage cases in the EDAC flood damage database reveals significant differences in the mean damage grades (Dm) for the various main building types depending on the impact (inundation) level. Owing to these differences, damageability levels could be defined that are assumed to be typical for the vulnerability classes HW-A to HW-D. New or previously unclassified construction methods are classified based on their mean damage grades (Dm) for the corresponding impact level [10].
The most likely classes were determined by the engineering evaluation of various damage cases and confirmed using procedure presented in [10,25]. The range of scatter is initially determined on the basis of empirical values. In the vulnerability table for floods (cf. Table 4), the symbols of the EMS-98 are used to identify the most likely vulnerability class and the range of scatter. Exact classification is then performed for the corresponding building type, inspecting the condition and structural design of the building.
The final determination requires a competent, engineering-based assignment of the vulnerability class. For example, in the investigation areas, the quality of the materials used, which is related to the age of the building, and any previous damage (settlement cracks, plaster detachment, etc.) was evaluated as part of the vulnerability assessment. With a more detailed level of knowledge about the internal building construction, changes to buildings could also be taken into account in the vulnerability assessment, such as the removal of walls, which can weaken the building and degrade the structural performance.

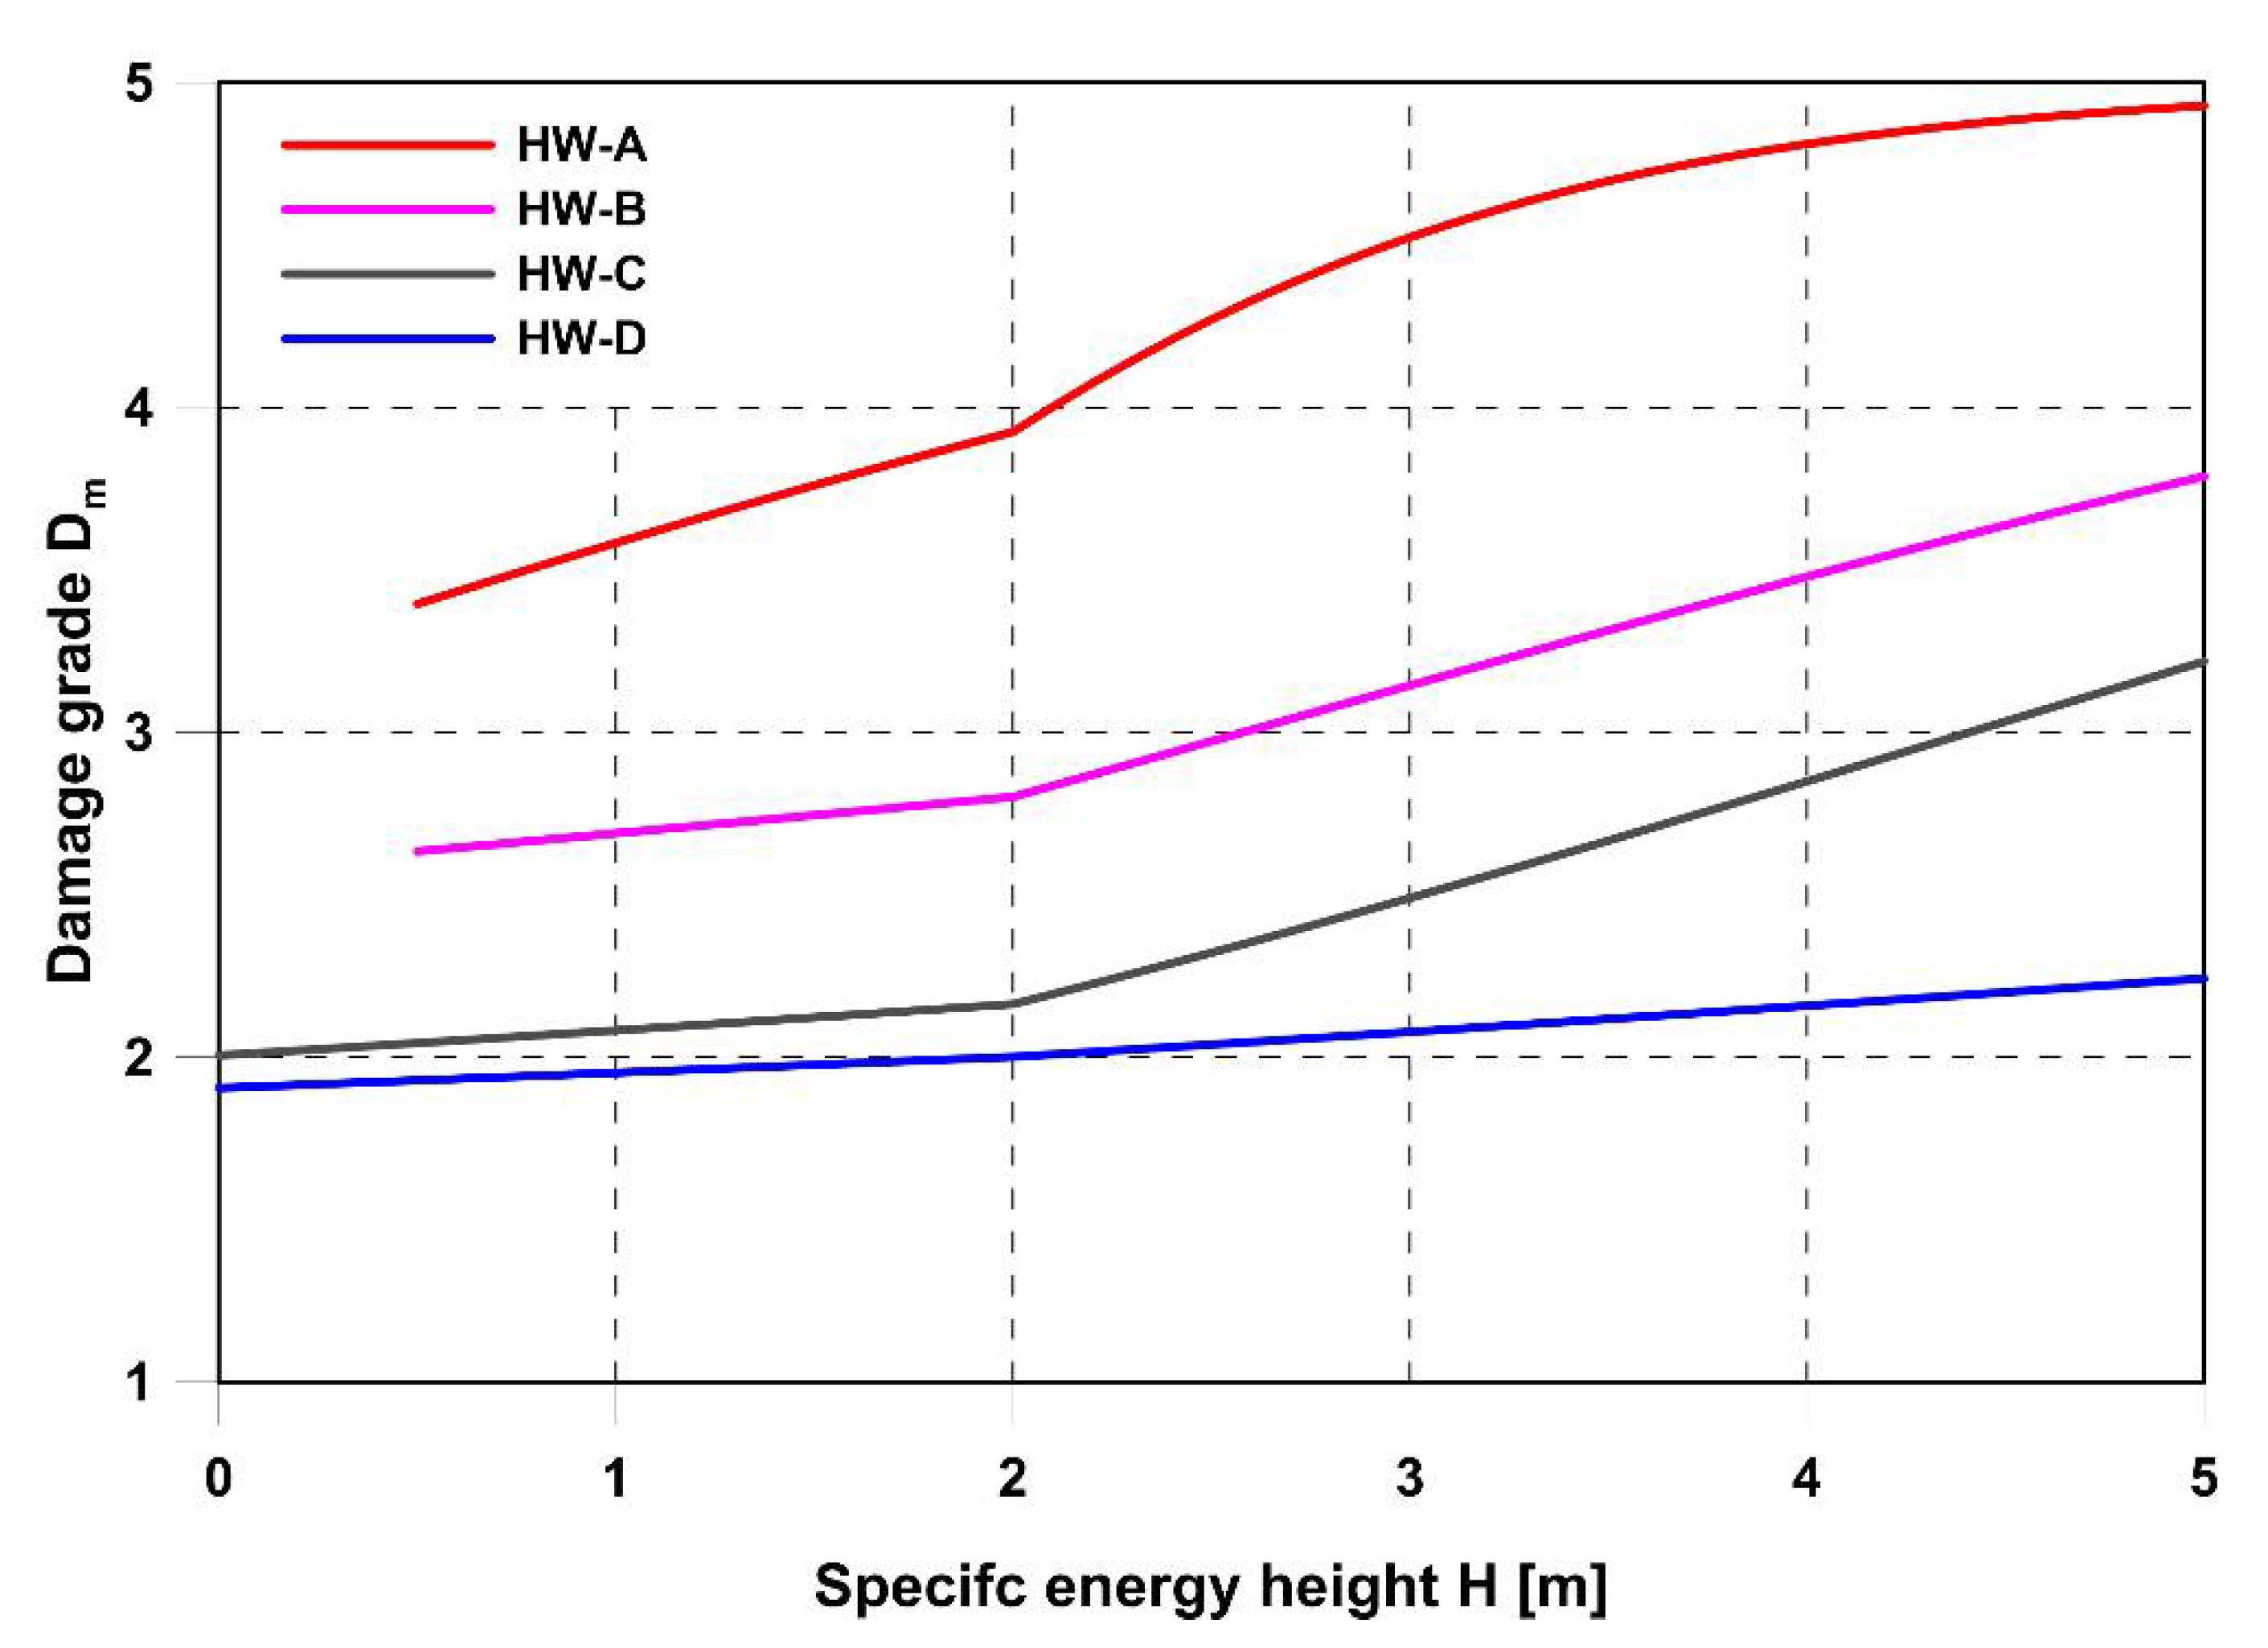
3.3. Prognosis of Structural Damage

The vulnerability-based approach of the EDAC flood damage model [9,10,23] considers the inundation level and the flow velocity in the form of the specific energy height (H) (see Equation (1)) to predict structural damage considering the building type.
I.It could be demonstrated that this approach provides the best correlations with structural damage and losses in residential buildings. However, due to comparatively moderate flow velocities, the correlations are not clearly visible in the existing datasets [10].
H = h g l + v f l 2 2 g
The basis for the derivation of the specific vulnerability function (SVF) type 2b in Figure 5 [9,10,18] were 1200 damage cases from the 2002 flood, for which flow velocities were assigned based on hydraulic calculations (see Section 2.1.1).
A hyperbolic tangent function was selected as a mathematical approach according to Equations (2) and (3) to determine the mean damage grades (Dm) in the original interval (1 to 5; D1 to D5) depending on the vulnerability class.
D m = 2 · tanh f h g l , v f l + 3
D m = 2 · tanh A · H 2 + B + 3

3.4. Loss Prediction

In the existing EDAC flood damage model, the vulnerability-relevant parameters (building type or vulnerability classes) are also considered in the loss prognosis [9,10,23,28,37].
One type of specific damage functions takes into account the building type (SDF Type 1a) or the vulnerability class (SDF type 1b), depending on the inundation level. The second type of specific damage functions (SDF type 2) converts the calculated damage grades (Dm) into relative losses. For all of the developed damage functions, the number of storeys and the presence of a cellar is considered [9]. An exponential approach is selected as a mathematical formulation of the various specific damage functions [9,10,23].
The main application is the general residential building stock. An application for other uses should also be possible for similar building constructions [9,10].
The results of the specific damage functions are expressed as relative losses in relation to the recovery value. The specific damage function calculates the losses (L) as a relative fraction of the replacement value. In Germany, so-called normal construction costs (Normalherstellungskosten-NHK 2000 [38] provide an efficient means of determining the replacement costs for the affected buildings. These still have to be scaled to the corresponding reference year using the building price index of the Federal Statistical Office [39].
The reliability and prognosis quality of the specific damage functions of the EDAC flood damage model were verified on the basis of the reported losses caused by the 2002 flood to residential buildings in the cities Eilenburg, Döbeln, Grimma and Flöha [10,18,28]. Additionally, the results for the losses based on the improved methods for the prognosis of structural damage presented in this paper are in agreement with the observed losses of the 2002 flood in all of the considered investigation areas [11].
However, due to the special boundary conditions in the loss compensation after the extreme flood in 2002 and the existence of an affected building stock with considerable renovation backlog, overcompensation likely occurred. Thus, application in other areas would require an adjustment of the damage functions and provision of further damage data.
Nevertheless, this would mitigate the general limitations of empirical damage models (i.e., large scatter of damage data, and insufficient damage data for some individual groups of buildings).
Therefore, the empirically supported prognosis of damage grades—as a measure of structural damage—and the adapted damage functions of a synthetic damage model (cf. [29,30]) are combined in the outcome of INNOVARU project. The procedure and the results of the loss calculations are presented in detail in the accompanying paper [12].

4. Improved Prognosis of Structural Damages

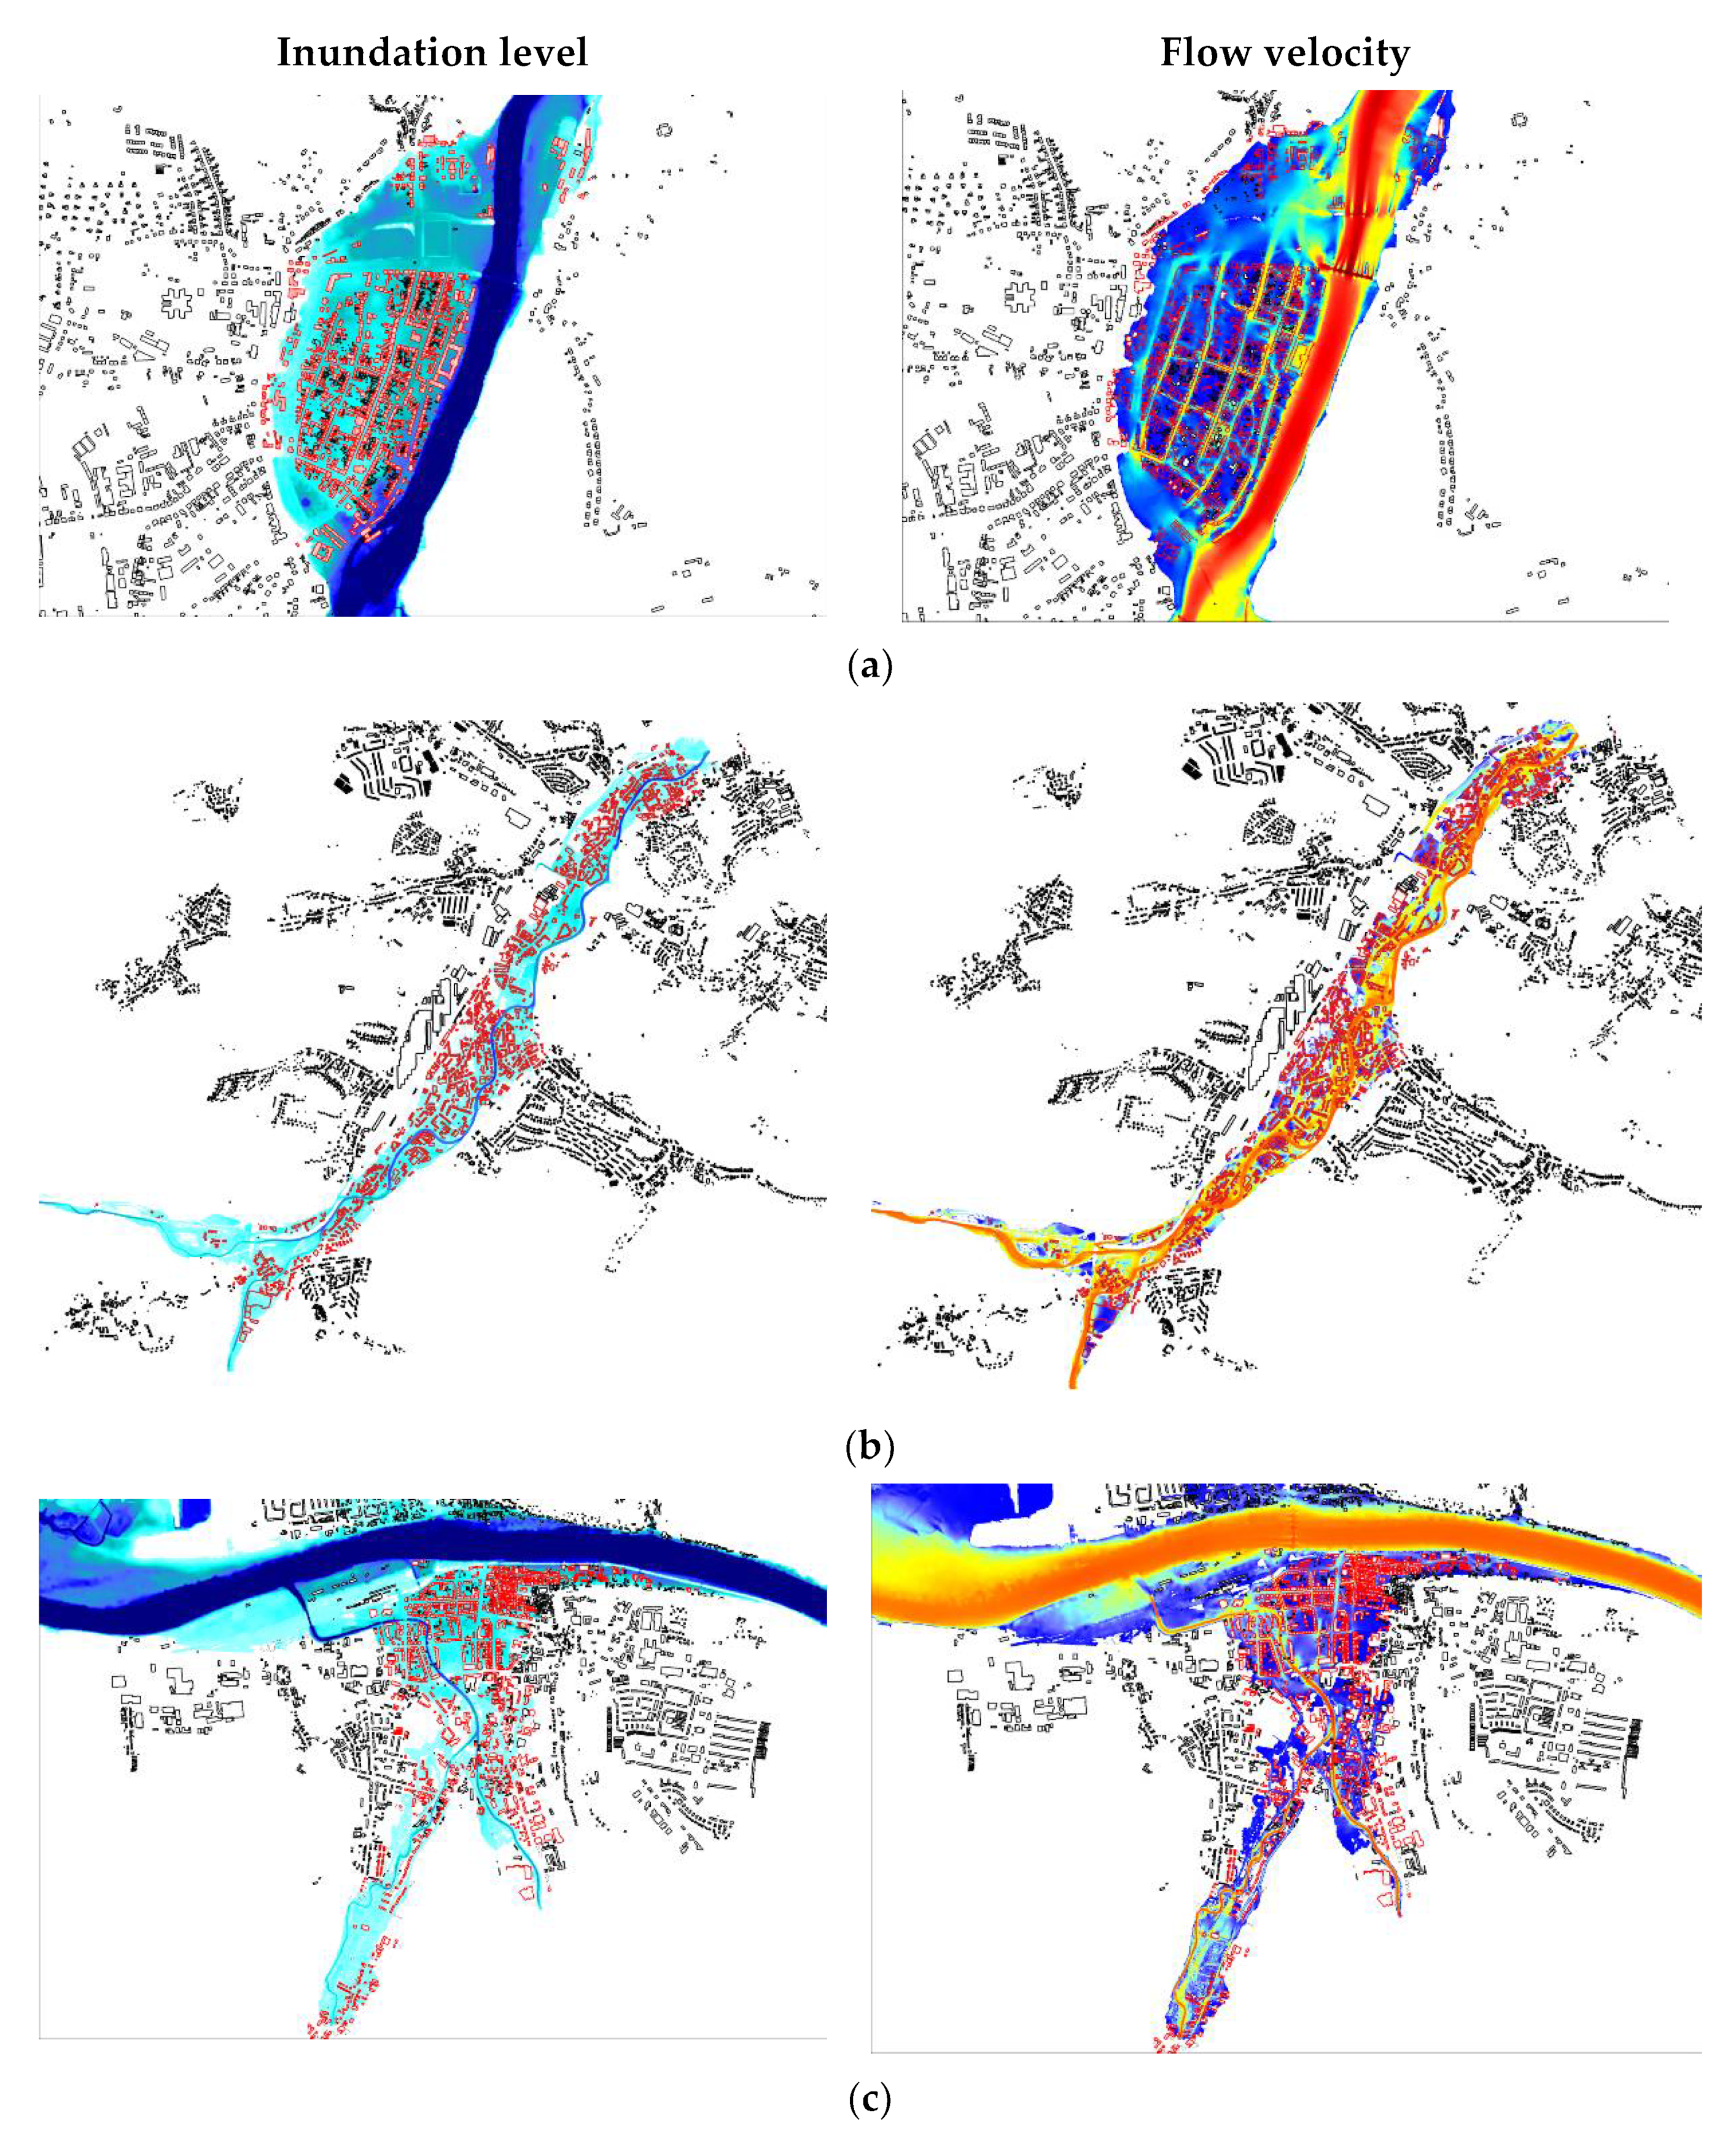
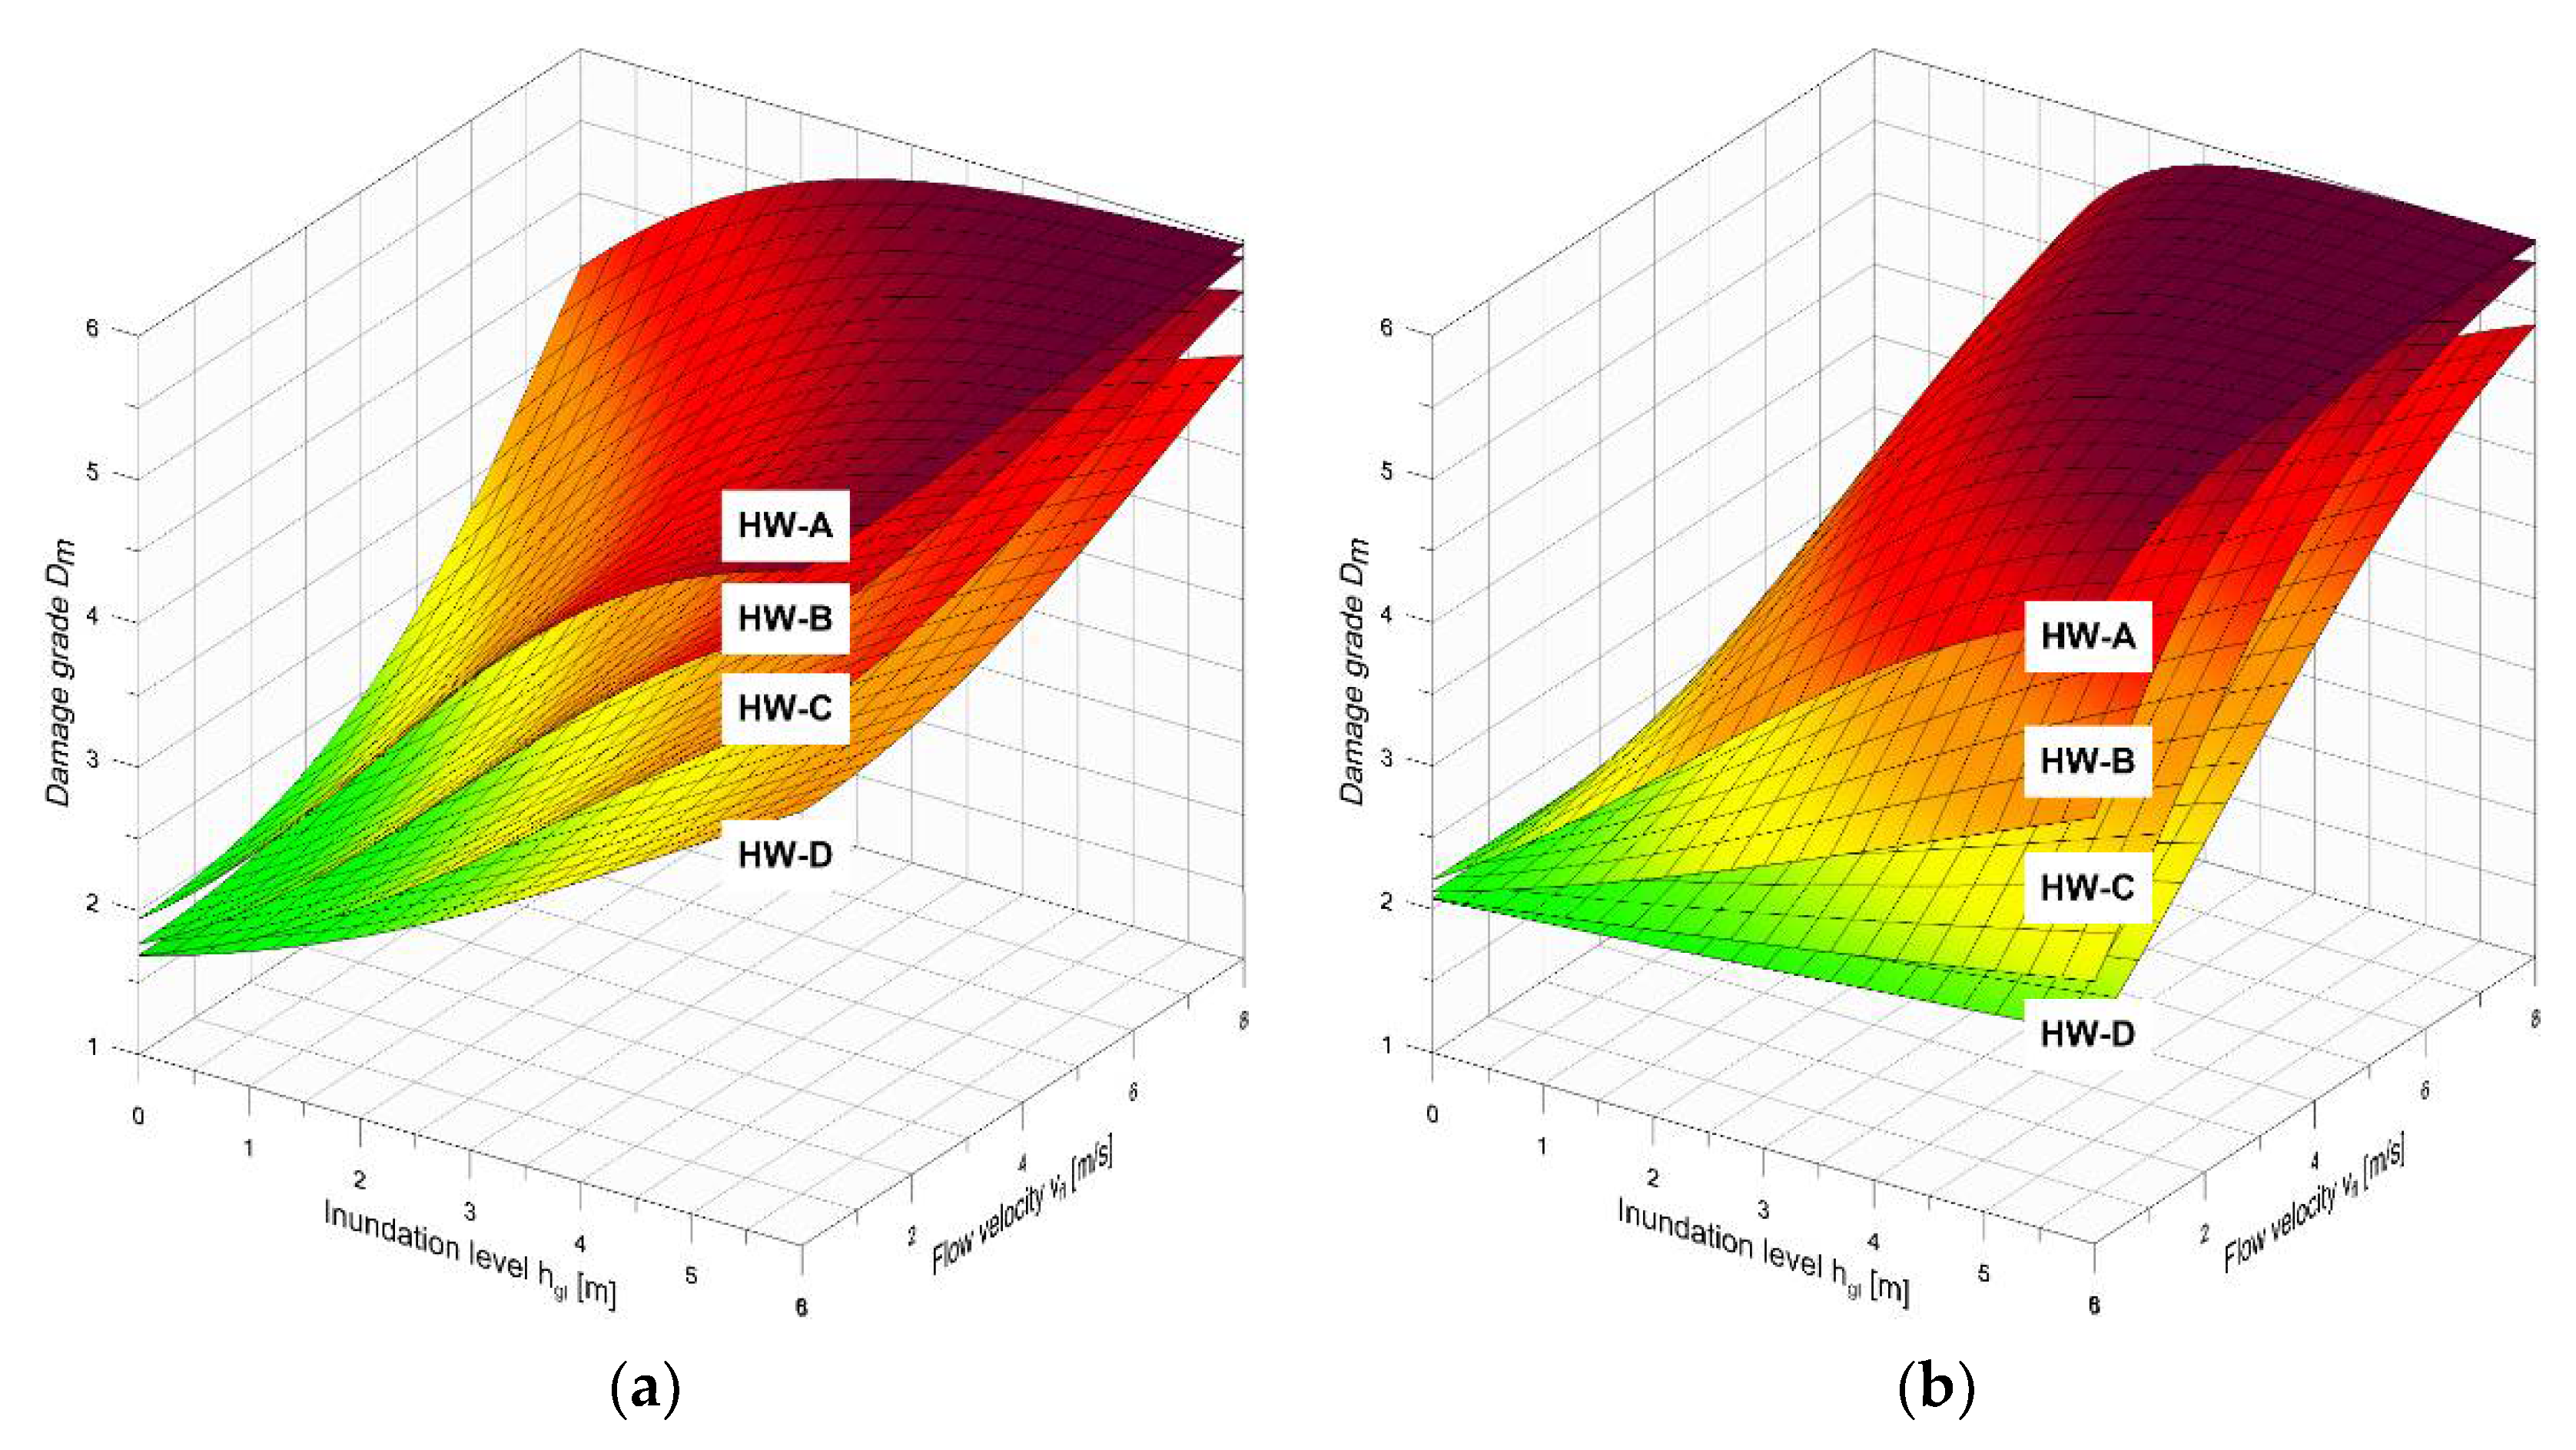
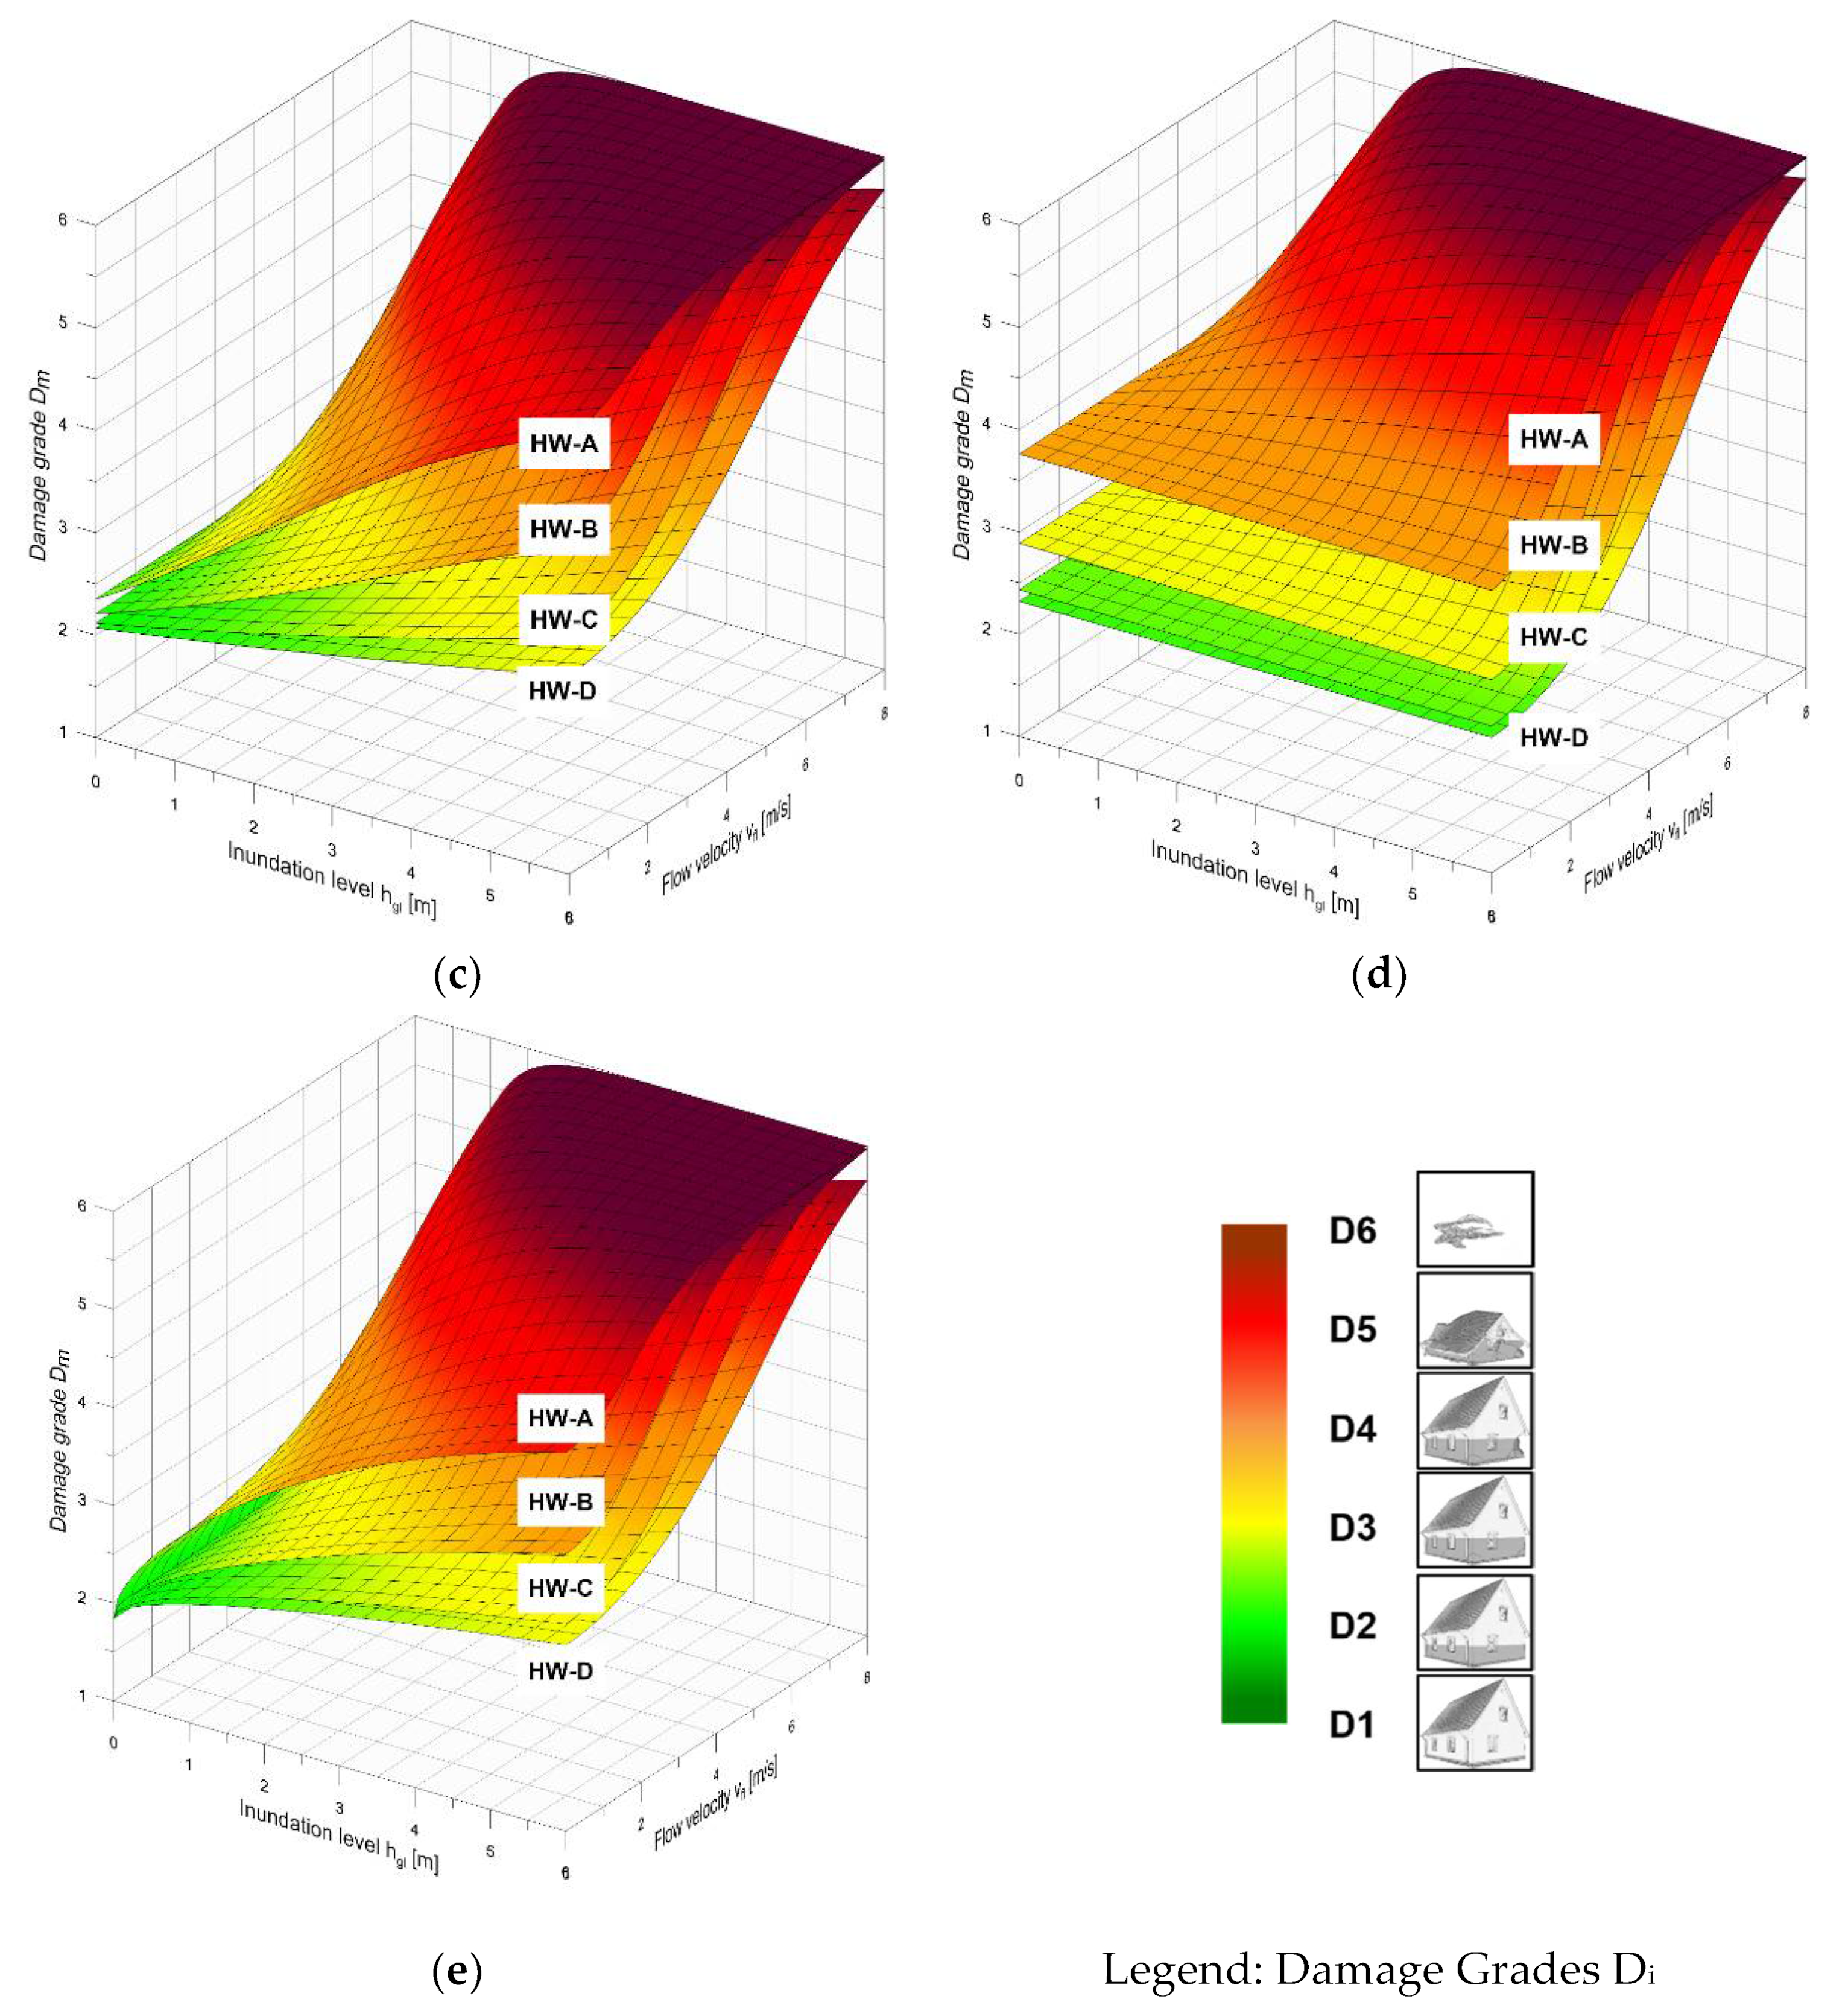
4.1. Consideration of Inundation Level and Flow Velocity

Validations of the existing model (see Section 3.3) showed good agreement with the actually observed damage (cf. [9,10,28]) However, when using the mathematical formulation of the specific energy height (H) (cf. Equation (1)), the contribution of the flow velocity is relatively small. In addition, the introduction of damage grade D6 requires an adjustment of the vulnerability functions.
The unified damage scales proposed in [24] and the vulnerability table for flood and tsunami impact [31] enable the combination of the two damage datasets described in Section 2.1. This combined, well-adjusted damage database can be analyzed for the different vulnerability classes. Because the evaluations are carried out for a flood damage model, tsunami damage cases with an inundation level of up to 6 m are taken into account. However, an extension to higher water heights, such as those that occurred in the Ahr Valley (cf. [3]), is also possible.
The combination of the two datasets based on the mean damage grades (Dm) of the clustered damage data for vulnerability classes HW-B and HW-C is shown in Figure 6a,b, respectively. Due to the simplified relationship between inundation level and flow velocity, the tsunami damage data follow a clearly defined area with respect to the impact level. However, assuming a plausible mathematical regression model, a realistic damage model can be derived. For this purpose, the previous approach of a hyperbolic tangent function for prognosis of the mean damage grades (Dm) is extended to intervals 1 to 6 (D1 to D6) according to Equation (4).
Five variants acc. to Equations (5) to (9) were initially investigated in [11]:
  • Variant V1 only converts the existing approach from [18] to the six-stage damage scale;
  • Variant V2 uses the inundation level (hgl) and flood intensity (Ifl = hgl × vfl) from the so-called “Swiss model”, representing a combination of inundation level and flow velocity but without an extended physical background;
  • Variant V3 includes the inundation level (hgl) and the momentum flux (hgl × vfl2) (which is related to the hydrodynamic forces);
  • Variant V4 considers only the momentum flux as a physically based input parameter;
  • Variant V5 is similar to Variant 3 but weights the influence of the inundation level in a differentiated way.
The terms in Equations (6), (7) and (9) are not true to the unit, but they consider that, according to low or unavailable flow velocities, the inundation level alone has an influence on structural damage.
D m = 2.5 · tanh f h g l , v f l + 3.5
Variant V1: specific energy height (H):
D m = 2.5 · tanh C 1 · H + C 2 + 3.5
Variant V2: inundation level (hgl) + flood intensity (hgl × vfl):
D m = 2.5 · tanh C 1 · h g l + C 2 · h g l · v f l + C 3 + 3.5
Variant V3: inundation level (hgl) + momentum flux (hgl × vfl2):
D m = 2.5 · tanh C 1 · h g l + C 2 · h g l · v f l 2 + C 3 + 3.5
Variant V4: momentum flux (hgl × vfl2):
D m = 2.5 · tanh C 1 · h g l · v f l 2 + C 2 + 3.5
Variant V5: Inundation level (hgl) + momentum flux (hgl × vfl2):
D m = 2.5 · tanh C 1 · h g l + C 2 · h g l · v f l 2 + C 3 + 3.5
C1, C2, >C3–Regression parameters (coefficients)
The regression parameters of the individual calculation variants can are presented in Table 5. For vulnerability classes HW-B to HW-D, these parameters were determined by a non-linear regression procedure. Due to the lack of damage data, the coefficients for vulnerability class HW-A were determined using an extrapolation procedure. In order to avoid overlapping or an intersection of the functions, the coefficients of some functions were slightly modified.
Improvements to the regression model analogous to the investigations in [40,41] have to be discussed in the future. However, assignment of the impact parameter, building type and other vulnerability-related parameters to the damage data is associated with considerable uncertainties. An improvement of the model is therefore unlikely at this point of the research [11].
Figure 7 displays the developed mathematical relationships in a 3D parameter surface. The mean damage grade (Dm) starts with values >D1, even at the 0 m inundation level above ground level, as groundwater inundation could also cause structural damage. Figure 7 graphically demonstrates that there are (practically) implausible relationships in some variants. Here, the physically consistent variants prove to be problematic with respect to their qualitative course (cf. [11]):
Variant V1 implies increasing structural damage at an inundation level of hgl = 0 m with increasing flow velocities (which cannot occur here).
Variant V4 does not take into account the increase in structural damage with increasing inundation levels when the flow velocity is still vfl = 0 m/s.
Although variants 2, 3 and 5 represent meaningful correlations from an engineering point of view, variants 1 and 4 are considered further.

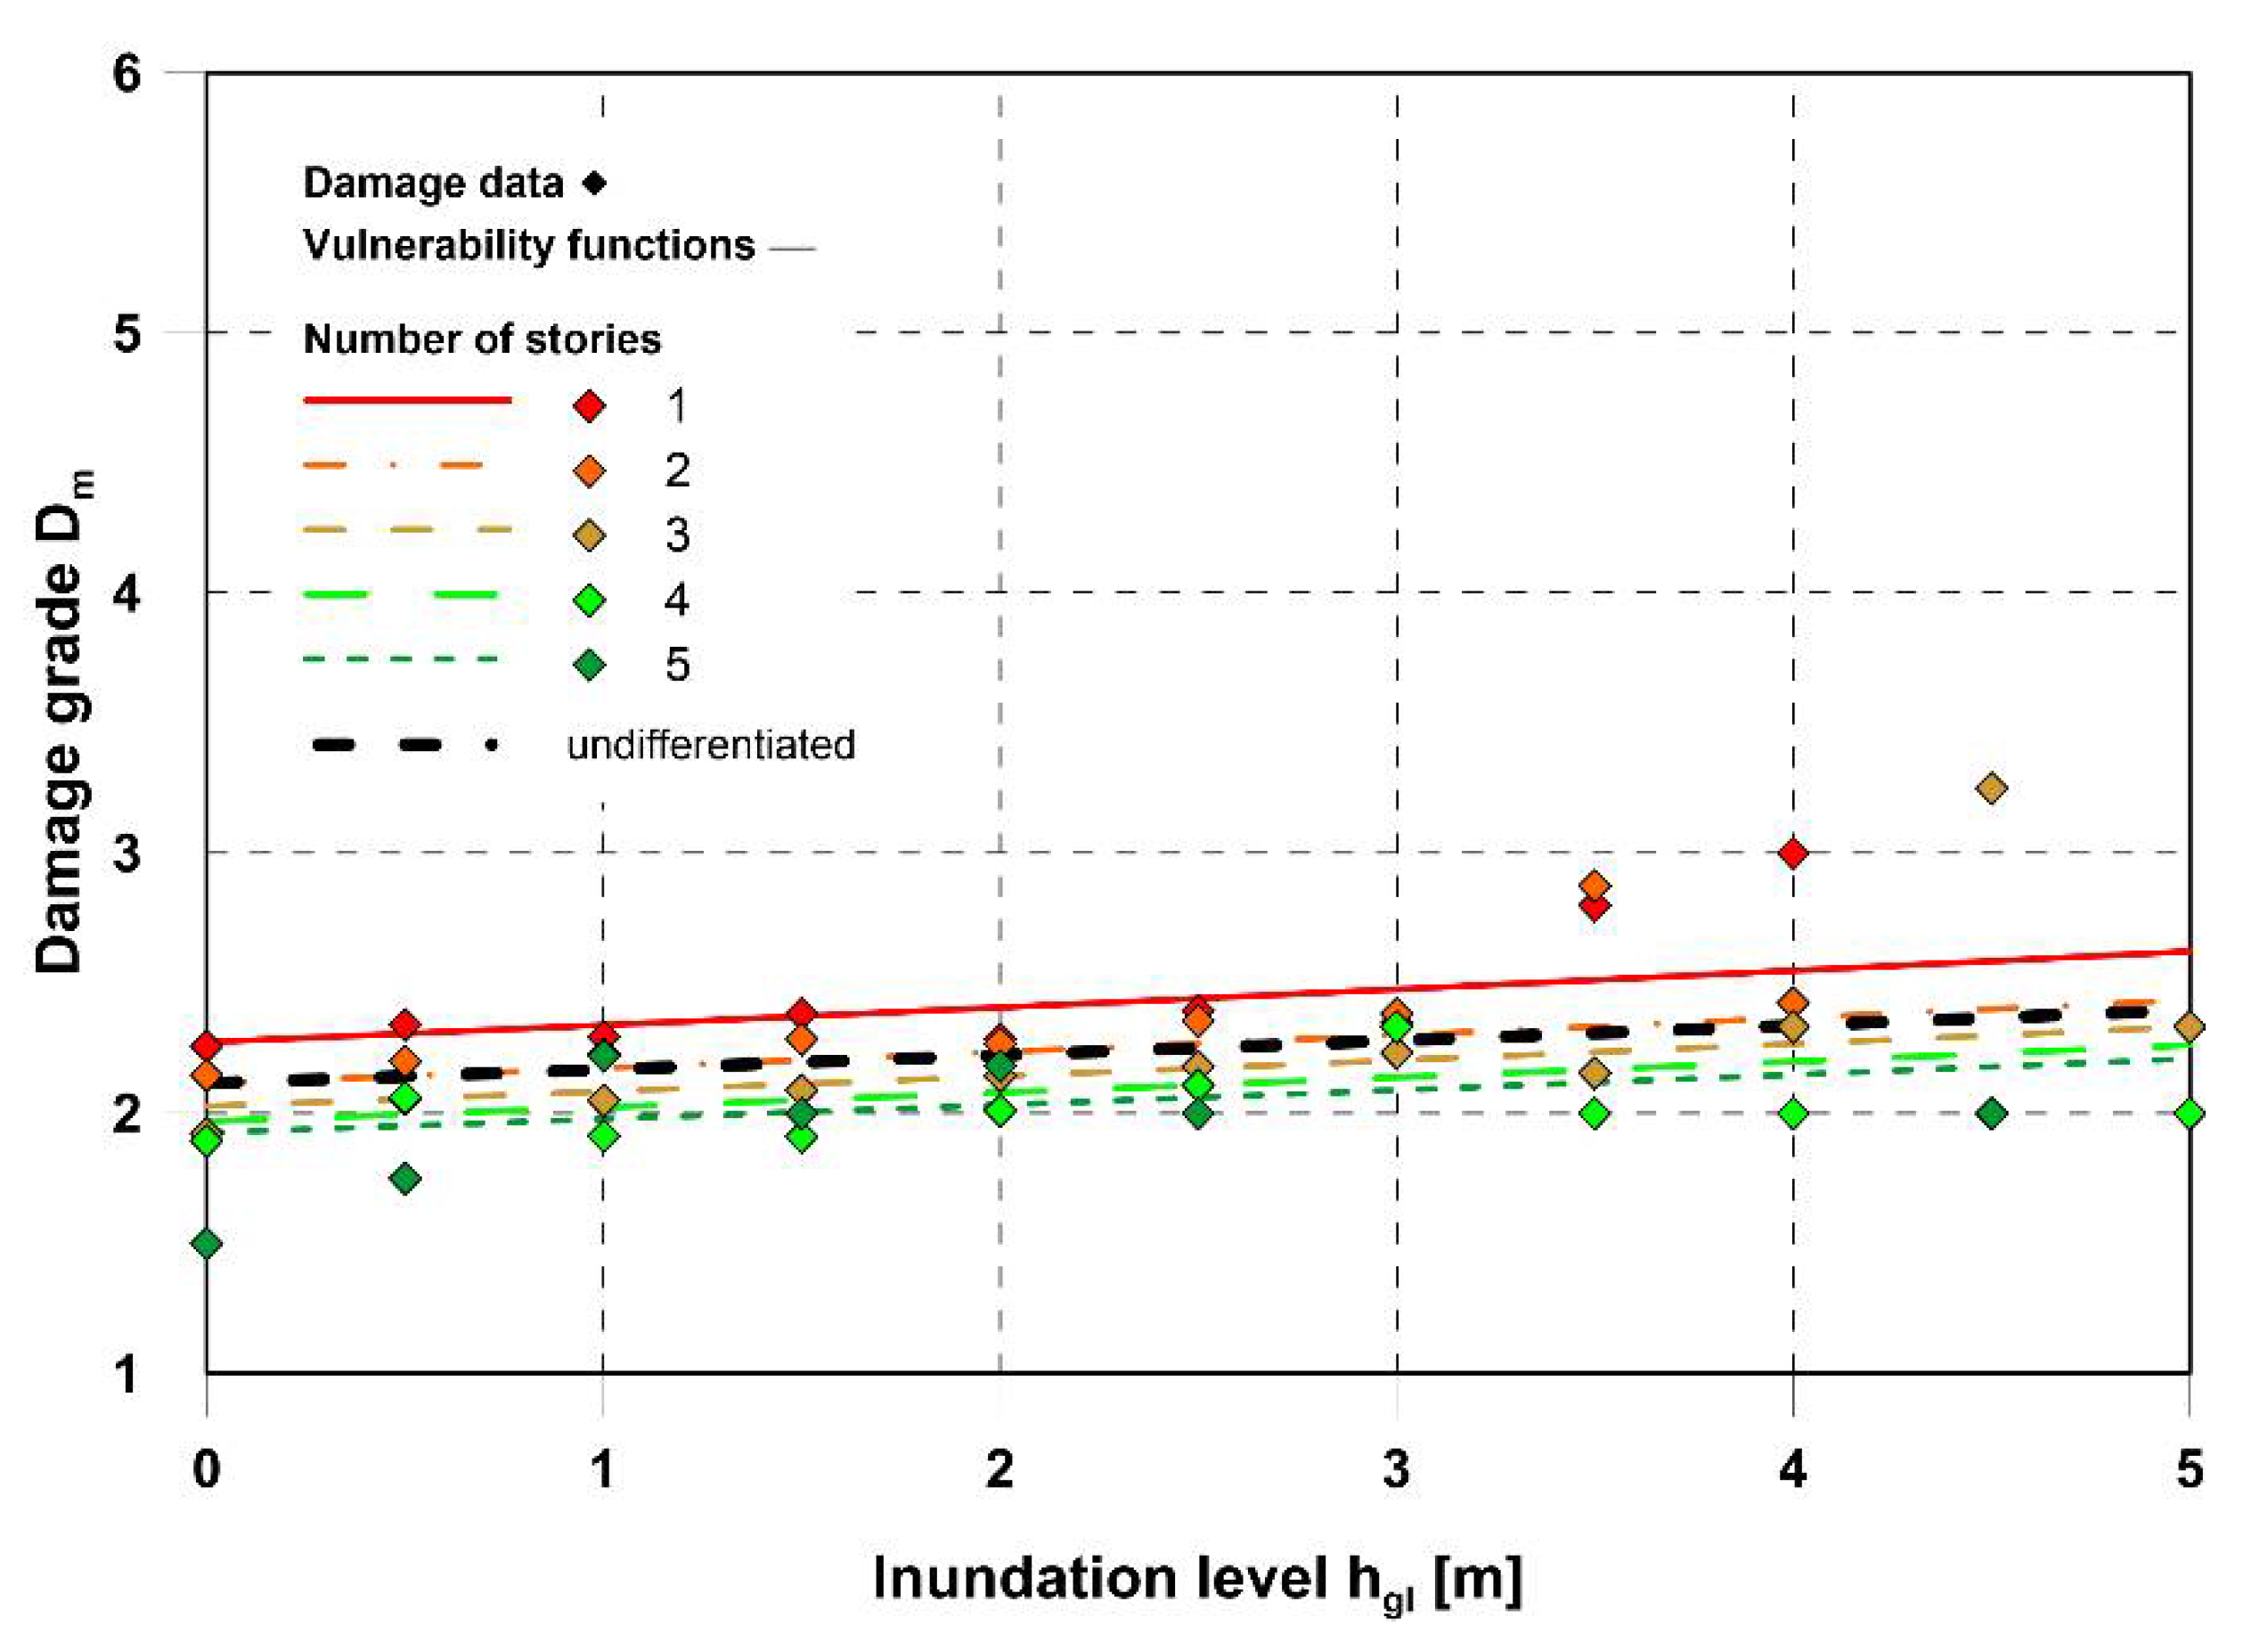
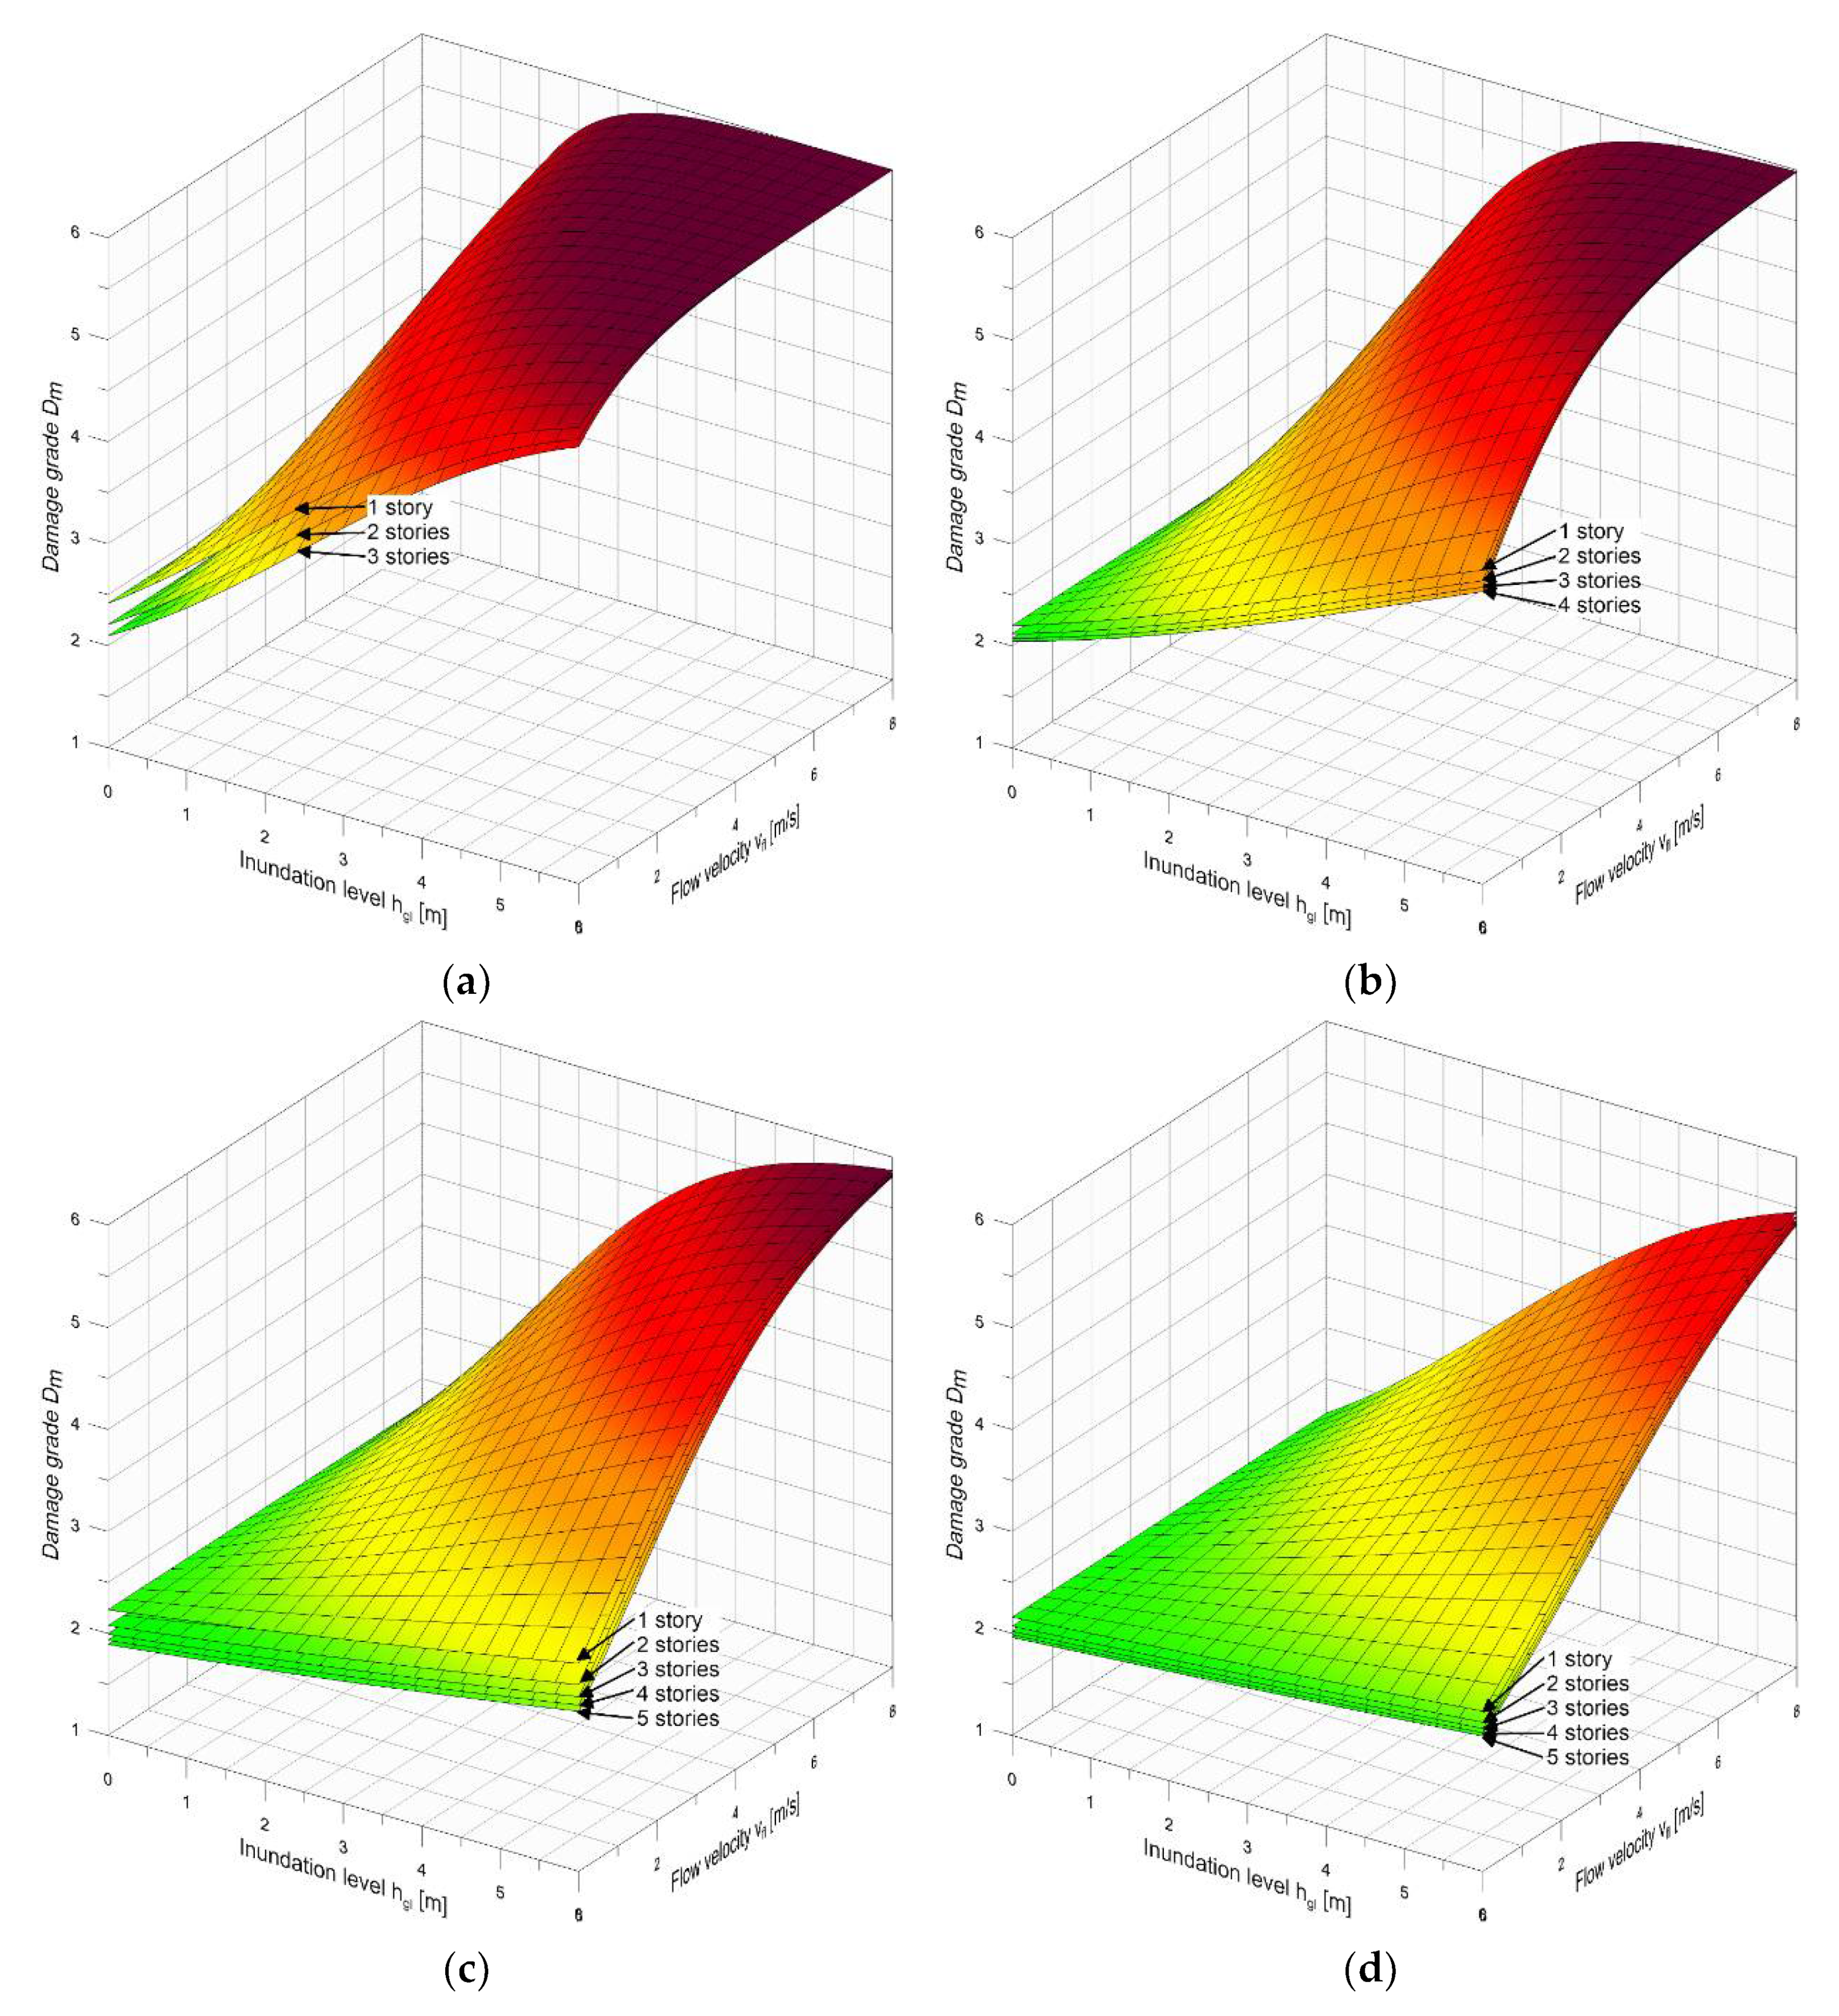
4.2. Consideration of Inundation Level, Flow Velocity and the Number of Storeys

Maiwald [37] demonstrated (with only a small (limited) dataset for masonry buildings) that with a similar inundation level above the ground level (hgl) the mean damage grade (Dm) tends to decrease with an increasing number of storeys (nst) due to the higher static requirements of multi-storey buildings.
In the INNOVARU project, the flow velocity had to be taken into account, in addition to the influence of the number of storeys, depending on the inundation level (cf. [11]).
In the MLIT database, no differentiation is made according to the number of floors. Therefore, the influence of the number of storeys on structural damage cannot be investigated in the combined dataset. In addition, the damage data of the 2002 flood, for which flow velocities are available, only allow for insufficient further differentiation according to the influence of the number of storeys. Therefore, a systematic transfer approach is necessary to obtain improved vulnerability functions that additionally consider the number of storeys.
The information supplement from the entire EDAC flood damage database allows for derivation of vulnerability functions according to the number of storeys and vulnerability classes depending on the inundation level above ground level. Figure 8 displays the trend in the clustered damage data. Due to the small amount of damage data in the clusters at higher inundation levels (hgl ≥ 3.5 m), some outliers are visible.
The evaluations show that buildings with fewer storeys are correlated with an increase in mean damage grade (Dm), which is considered and weighted via the natural logarithm in the corresponding term in the simplified vulnerability functions acc. to Equation (10).
Figure 8 shows that the generalized vulnerability function without differentiation according to the number of storeys is similar to the function for two-storey building. This is also true for the other vulnerability classes. For the sake of simplicity, in this study, it is assumed that the obtained coefficients for the vulnerability functions are valid for vfl = 0 and that the vulnerability functions presented in Section 4.1 are also valid for two-storey buildings.
In a second step, the determined mathematical relationships and the obtained coefficients were used to extend the vulnerability functions presented in Section 4.1, resulting in the coefficients listed in Table 6, which are applicable to Equations (11) to (15). Because the coefficients of these vulnerability functions were not created by a data regression but by merging the functions presented in Section 4.1 with the simplified functions, no coefficients of determination are included in Table 6.
The 3D surface diagrams for variant V2 for vulnerability classes HW-A to HW-D can be derived from the graphs shown in Figure 9. Variant 3 is shown in [11]. The functions are specified up to the number of storeys that were recorded in the damage data and in the investigation areas. For HW-C (typical for masonry constructions) and HW-D (typical for reinforced concrete buildings), number of storeys nst > 5 are also possible.
D m = 2.5 · tanh C 1 · h g l + C 2 · ln n s t + C 3 + 3.5
Variant V1: specific energy height (H):
D m = 2.5 · tanh C 1 · H + C 2 · ln n s t + C 3 + 3.5
Variant V2: inundation level (hgl) + flood intensity (hgl × vfl):
D m = 2.5 · tanh ( C 1 · h g l + C 2 · h g l · v f l + C 3 · ln ( n s t ) + C 4 ) + 3.5
Variant V3: inundation level (hgl) + momentum flux (hgl × vfl2):
D m = 2.5 · tanh ( C 1 · h g l + C 2 · h g l · v f l 2 + C 3 · ln ( n s t ) + C 4 ) + 3.5
Variant V4: momentum flux (hgl × vfl2):
D m = 2.5 · tanh [ C 1 · h g l · v f l 2 + C 2 · ln ( n s t ) + C 3 ] + 3.5
Variant V5: inundation level (hgl) + momentum flux (hgl × vfl2):
D m = 2.5 · tanh ( C 1 · h g l + C 2 · h g l · v f l 2 + C 3 · ln ( n s t ) + C 4 ) + 3.5
C1, C2, C3, C4– Regression parameters (coefficients).

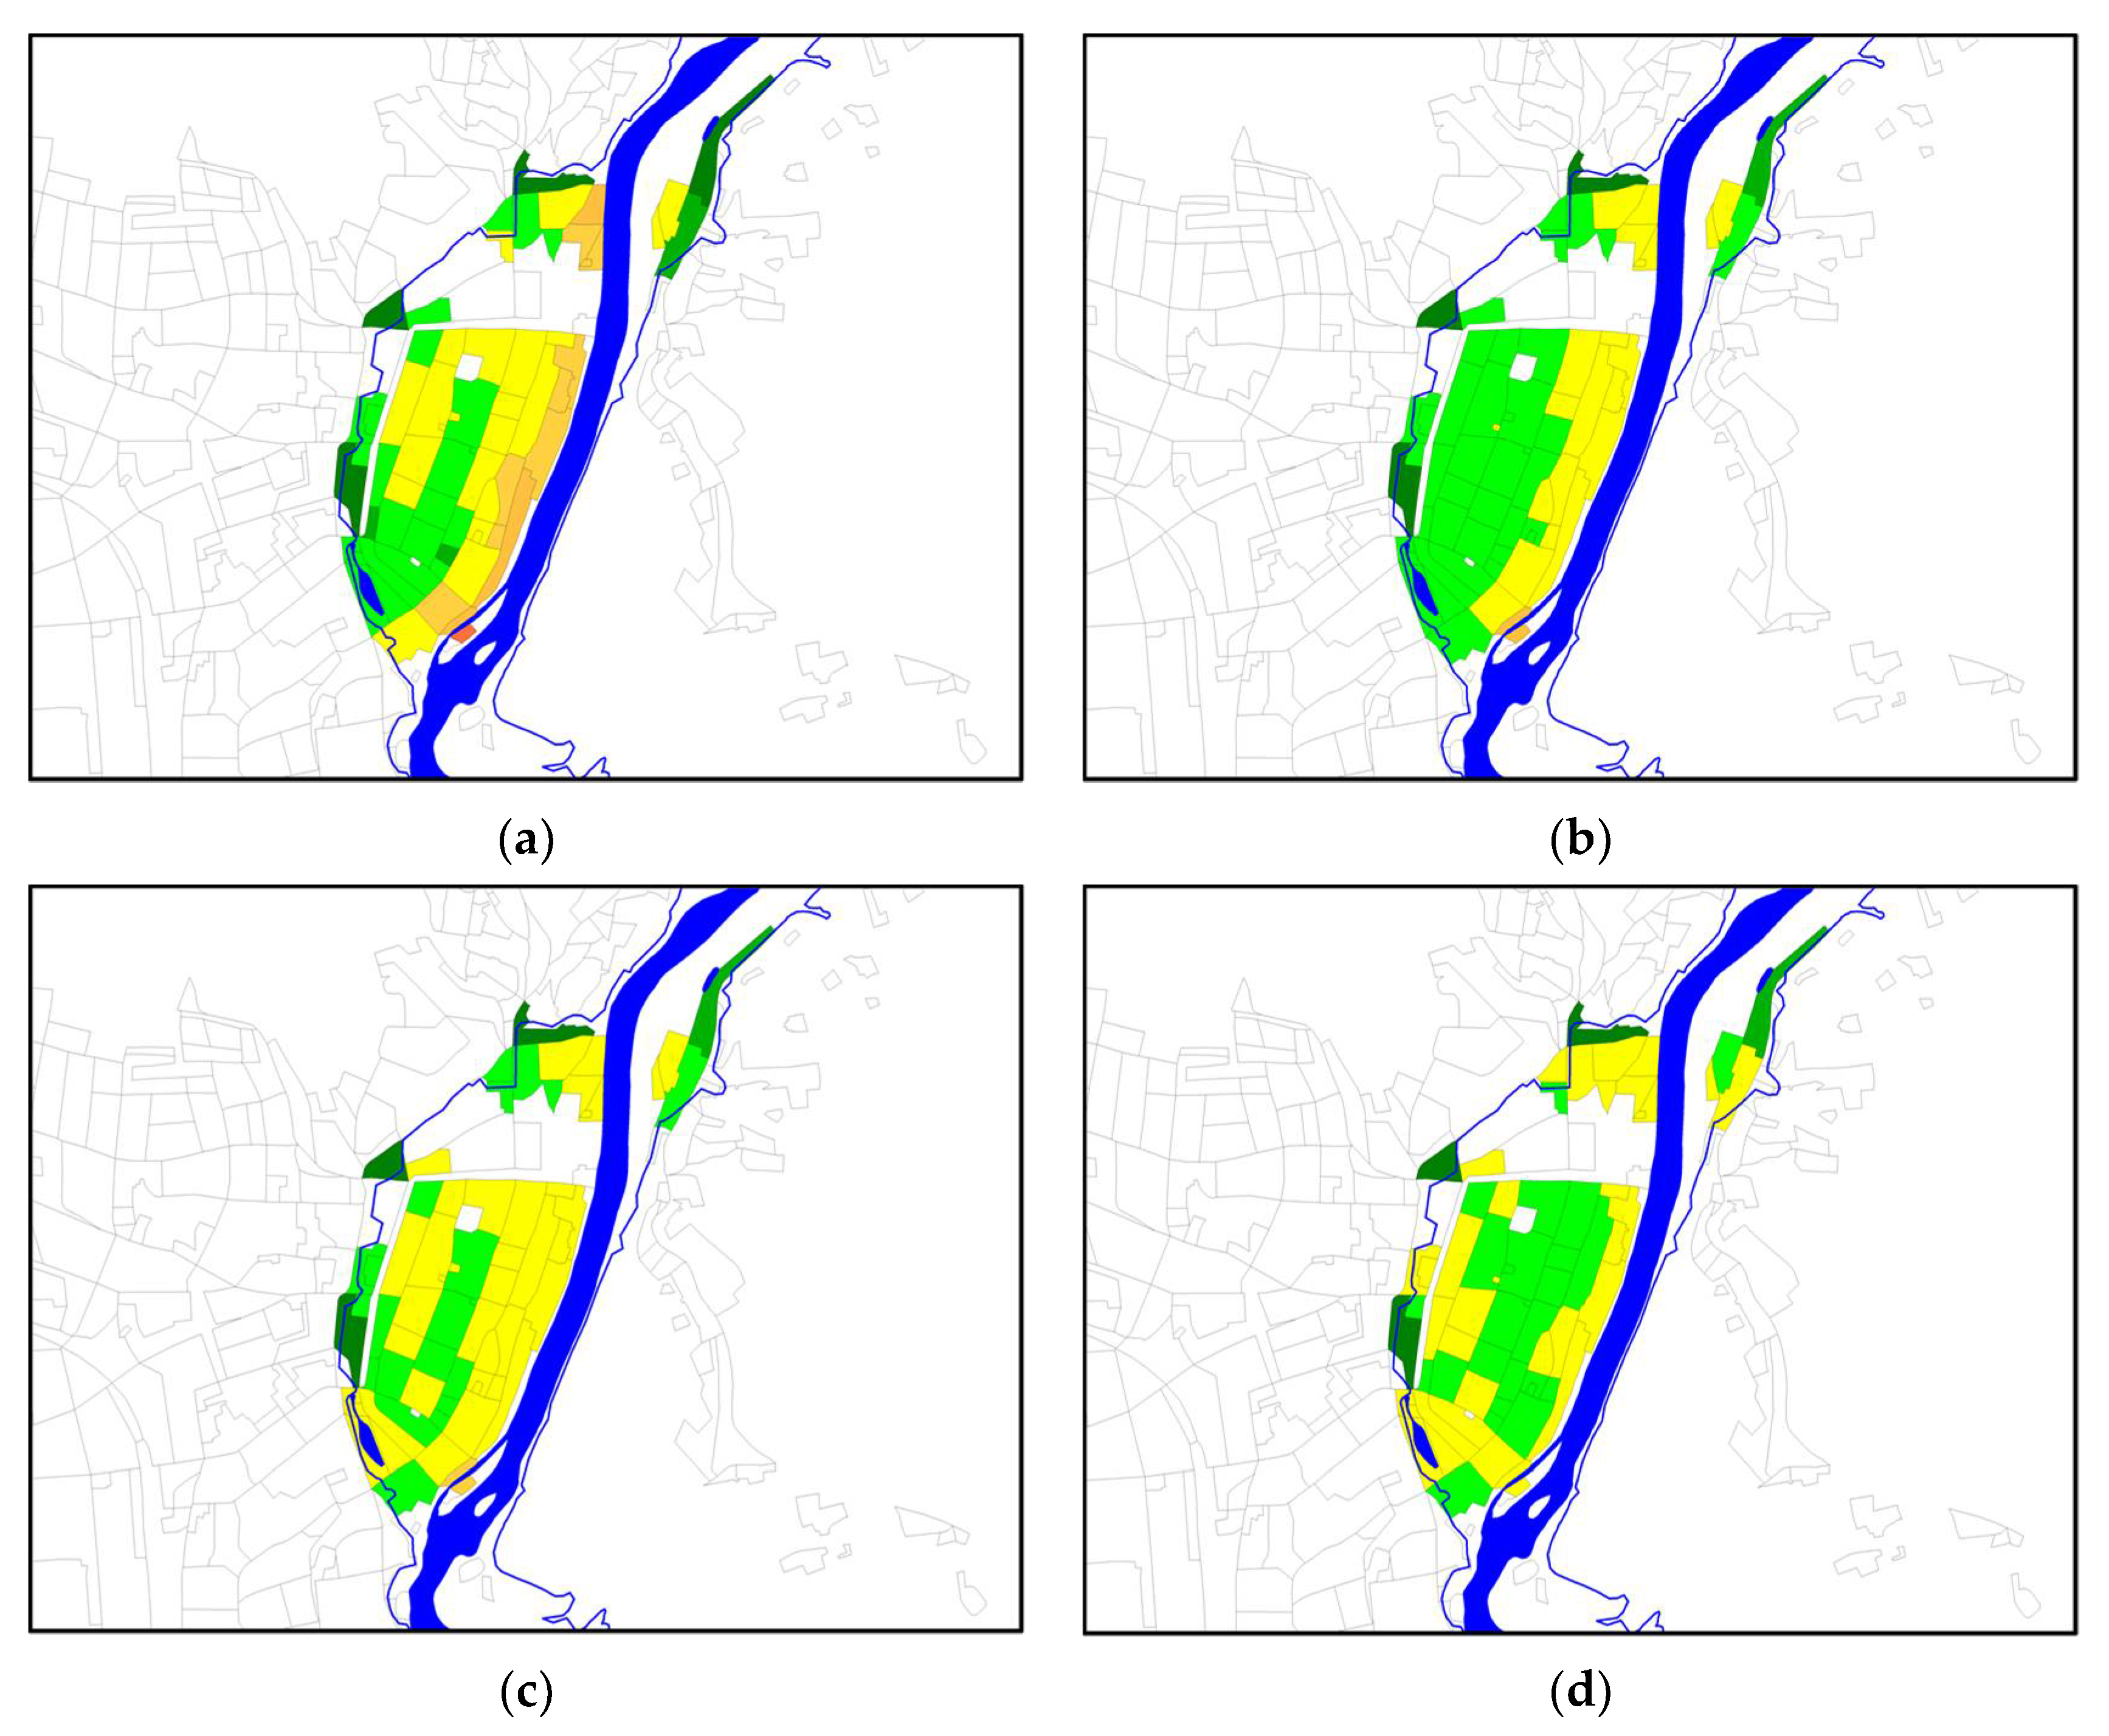
5. Validation of the Improved Model

The developed innovative procedure was validated using the observed damage of the 2002 flood in the six investigation areas in Saxony. The validation process takes place in two stages:
Level I: the model approaches according to Section 4.1 (Equations (5) to (9), coefficients according to Table 5) are taken into account, but the flow velocity is neglected (vfl = 0 m/s).
Level II: the model approaches according to Section 4.2 (Equations (11) to (15), coefficients according to Table 6) are taken into account. The flow velocity is applied according to hydraulic models (Section 2.3). The influence of the number of storeys on the vulnerability is considered.
For all variants of the newly derived vulnerability functions, the mean damage grades (Dm) for the 2002 flood (see Section 2.3) were calculated for the individual affected buildings in the investigation areas. Because a comparison with the observed damage only makes sense for a larger number of buildings, the calculation results are aggregated at the level of land-use units. Therefore, comparison of the calculated and observed mean damage grades (MDm) in the land-use areas (which are composed by the calculated mean damage grades (Dm) or the observed damage grades (Di) for the individual buildings) is based on the land-use areas according to the “Official topographic-cartographic information system” (Amtliches Topographisch-Kartographisches Informationssystem-ATKIS®) for Germany (cf. procedure in [10]).
The ATKIS® land-use areas suitable for the investigation areas of Döbeln, Eilenburg, Flöha and Grimma are available from previous research projects with state of the year 2009.
Nowadays, these ATKIS® land-use areas are much more coarsely or overlapping subdivided and therefore not suitable for aggregation of the calculation results at the land-use level. In contrast, the usable areas that are currently contained in the datasets of the “Official real estate cadaster information system-ALKIS®” (Amtliches Liegenschaftskataster_Informationssystem) are much more finely divided. Therefore, these are also considered unsuitable for validation purposes. Alternatively, the built-up areas were subdivided independently into area units that provide a sufficient number of buildings/damage cases for the Pirna and Freital investigation areas.
Figure 10 shows the calculated mean damage grades (MDm,calc) in comparison with the observed mean damage grades (MDm,obs) for the investigated variants for Grimma for Level II.
For residential buildings, the aggregated deviations can be derived between reinterpretation and observation in all of the investigation areas. To avoid the outbalancing of the deviations in the individual areas of use, the mean absolute error (MAE) and the root mean square error (RMSE) were calculated according to Equations (16) and (17), where N is the total number of land-use areas in the corresponding investigation area. These statistical benchmarks are well-known and widely used (e.g., [42])
Mean absolute error (MAE):
M A E = 1 N i = 1 N M D m , o b s , i M D m , c a l c , i
Root mean square error (RMSE):
R M S E = i = 1 N ( M D m , c a l c , i M D m , c a l c , i ) 2 N
Figure 11 displays the procedure for the numerical validation of the models.
The outcome of the error analysis s is displayed for Level I in Table 7 and for Level II in Table 8. In a first step, the comparison of MAE and RMSE of both model levels in Table 7 and Table 8 shows only minor differences for the individual study areas. However, the deviations across all test areas (see row “Total” in both Table 7 and Table 8) are slightly reduced for most variants by considering the flow velocity, as well as the number of storeys (Level II).
In the second step, the best-suited must be determined. With regard to the calculation effort, as well as provision of the required hydraulic data (inundation level and flow velocity) and microscale building data, the variants should be assessed as equivalent.
For Level II and with an MAE of 0.32–0.41, all variants have relatively low mean absolute deviation. Assuming the range of the damage grades from D1 to D6 as 100%, this corresponds to 6.3–8.2% relative deviation. Evaluation of the RMSE indicates a comparable trend, as can be determined in the previous investigations.
Variants V1 and V4 are subject to particularities in terms of quality that make them appear less suitable for practical use. At an inundation level of hgl = 0 m (e.g., with penetrating groundwater), variant V1 shows an increase in the mean damage grade (Dm) as the flow velocity increases (see Figure 7a). Because practically no increase in the flow velocity can occur at hgl = 0 m, no increase in Dm should be forecast here either. In contrast, variant V4 predicts a constant mean damage grade (Dm) with standing water (vfl = 0 m/s), even with an increase in the inundation level (see Figure 7d).
The lowest deviations for MAE and RMSE are associated with variant V2. This variant, which is currently regarded as somewhat more realistic than variants V3 or V5, is used as the basis for the loss calculations in an accompanying paper [12].
In the final report of the INNOVARU project [43], variants V2 and V3 are recommended for damage prognosis based on the current evaluation status.
Variant V2 shows the smallest deviations with respect to actually observed damage. In contrast, variant V3 is more physically justified by including the momentum flux (hgl × vfl2).
Figure 12, Figure 13, Figure 14 and Figure 15 show the corresponding distribution of the calculated mean damage grades (MDm,calc) for variant V2 at Levels I and II and the observed mean damage grades (MDm,obs) for the investigation areas of Döbeln, Eilenburg, Freital and Pirna. A slight increase in the calculated mean damage grades (MDm,calc) caused by the flow velocity at Level II is visible.
Apart from slight deviations in individual areas of use, the graphic representation also shows a realistic damage prognosis. The deviations can be traced back to the low density of damage data in some areas under consideration.
The small deviations of the forecasts compared to the real observed structural damage demonstrate the realism of the chosen approach on a detailed micro-/mesoscale level. This successful validation stands out from previous validations of other damage models, in which mostly aggregated losses for larger towns or river catchment areas were compared with observations or with the results of other models (see e.g., [44]).
With the developed approach, a realistic prognosis of the expected structural damages is also possible in flood areas in which the flow velocities can no longer be neglected.

6. Conclusions

Based on the concept of the EDAC flood damage model, new approaches for vulnerability functions to predict structural flood damages are presented in this paper. The specific building vulnerability, the inundation level and the flow velocity are taken into account in the refined damage model. Realistic reinterpretations of the real observed damage from the 2002 flood in Saxony are presented for different investigation areas with moderate flow velocities, which are typical for river floods.
The calculation variant with the best agreement between the predicted and the reported damage grades is achieved with variant V2. The calculation results for this variant are the basis for the loss estimations via the application of new synthetic damage functions that consider the concept of the damage grades in the accompanying paper [12].
The new damage model initially intended for use in the Free State of Saxony can also be used in other Federal States and is therefore ultimately suitable for general application in Germany. If the regionally predominant building types are classified in vulnerability classes, the described part of the model would also be applicable internationally.
In the future, climate change will not only cause changes on the impact side but also require adaptation of the prevailing building types. Possible changes in the vulnerability of the existing structures to natural hazards represent a challenge for damage prognoses. The concept of vulnerability classes in the EDAC damage model allows for a flexible response to such changes. Newly designed or adapted conventional building types would have to be classified according to experience with the corresponding vulnerability classes. The vulnerability functions presented in this paper would still be applicable, although requiring slight modifications due to an extended damage database.

7. Outlook

The derived new vulnerability functions, in principle, also enable damage prognosis for events with high flow velocities, which can be expected in associated with flash floods. The model would have to be validated again for such extreme hydraulic conditions. In this context, the damage caused in the Ahr Valley (Germany) in 2021 might serve as a reference event. Initial attempts at engineering analysis of damage cases from this event in [3] indicate that the impact of debris and foundation erosion are important intensifying factors with respect to structural damage.
Evaluations of the damage in the Ahr Valley also confirm the influence of exposure (location) of buildings, which was previously emphasized to explain the variety of failure mechanisms and unexpected damage patterns in [10,18]. The basic concept is presented in Table 9. All these effects would have to be examined and integrated into the damage model in the future. Interesting options are represented by random forest techniques, including consideration of other factors that are not directly related to the impact and loading conditions responsible for structural damage [42].
For the application of the developed prognosis model for the structural damage, a detailed building inspection is necessary, which is not always feasible due to cost and effort limitations. An effort to reduce procedures using improved geodata on a microscale level is described in [13]. In connection with another type of new damage functions, realistic loss statements can also be obtained. As noted in the outlook of a previous study [10], in, such cases, reasonable assumptions about the distribution of building types or vulnerability classes in the investigation areas must be derived and inserted into the scenarios.
However, the developed vulnerability functions only indicate expected values with the mean damage grades (Dm), and a large scatter of flood damage cannot be considered.
So-called fragility functions were presented in [35], which indicate the probability of exceeding a certain damage grade depending on the inundation level and flow velocity. In principle, this makes it possible to characterize the spread of structural damage and the associated losses. According to simulative damage prognosis using the Monte Carlo method, the scatter is quite small. In further investigations, the complete chain of uncertainty in the flood damage prognosis should be highlighted.
Concerning the need of further data harvesting, remote sensing data and damage interpretation solutions for the areal images might represent key tools for development. Initial studies indicate the success of such applications, in particular for the “delta consideration” of the situation before and after the event [45]. Accepting the multihazard exposure of built environment and the cascading effects of the majority of natural disasters, we recommend evaluation of floods in the sense of dynamic processes with time histories of action parameters and loading conditions [46].

Author Contributions

Conceptualization, H.M. and J.S.; methodology, H.M. and J.S.; software, C.K.; validation, H.M., J.S. and C.K.; formal analysis, H.M. and C.K.; investigation, H.M., C.K., T.L., T.W. and S.G.; resources, J.S.; data curation, C.K., T.L., T.W. and S.G.; writing—original draft preparation, H.M.; writing—review and editing, H.M. and J.S.; visualization, H.M. and C.K.; supervision, J.S.; project administration, J.S.; funding acquisition, J.S. All authors have read and agreed to the published version of the manuscript.

Funding

This research was funded by the German Federal Ministry of Education and Research (BMBF), grant number 13N14929-13N14931. We acknowledge support from the German Research Foundation (DFG) and Bauhaus-Universität Weimar within the program of Open Access Publishing.

Data Availability Statement

The damage data from the tsunami in Japan are available at: http://www.mlit.go.jp/toshi/toshi-hukkou-arkaibu.html (accessed on 5 May 2021). For legal and data protection reasons, the damage data from the 2002 flood can be provided by e-mail request in an aggregated form only and can be taken from the references mentioned in the paper.

Acknowledgments

The authors thank Ing. habil. Uwe Müller, the head of Department 4 of the Saxon State Office for the Environment, Agriculture and Geology (LfULG), for the valuable contributions within the project coordination of the INNOVARU project. We also thank Rainer Elze (LfULG) for creating the realistic hydraulic model of the flood of 2002 in the city of Freital, which extended the validation possibilities of the developed approaches.

Conflicts of Interest

The authors declare no conflict of interest.

References

  1. Maiwald, H.; Schwarz, J. Die Sturzflut von Braunsbach—Ingenieuranalyse der Gebäudeschäden. Bautechnik 2016, 93, 925–932. [Google Scholar] [CrossRef]
  2. Laudan, J.; Rözer, V.; Sieg, T.; Vogel, K.; Thieken, A.H. Damage assessment in Braunsbach 2016: Data collection and analysis for an improved understanding of damaging processes during flash floods. Nat. Hazards Earth Syst. Sci. 2017, 17, 2163–2179. [Google Scholar] [CrossRef]
  3. Maiwald, H.; Schwarz, J.; Abrahamczyk, L.; Kaufmann, C. Das Hochwasser 2021—Ingenieuranalyse der Bauwerksschäden. Bautechnik 2022, 99, submitted. [Google Scholar]
  4. Jongman, B.; Kreibich, H.; Apel, H.; Barredo, J.I.; Bates, P.D.; Feyen, L.; Gericke, A.; Neal, J.; Aerts, J.C.J.H.; Ward, P.J. Comparative flood damage model assessment: Towards a European approach. Nat. Hazards Earth Syst. Sci. 2012, 12, 3733–3752. [Google Scholar] [CrossRef]
  5. Black, R.D. Floodproofing Rural Residences; Report no EDA 77-088; US Department of Commerce, Economic Development Administration: Washington, DC, USA, 1975.
  6. Sangrey, D.A.; Murphy, P.J.; Nieber, J.L. Evaluating the Impact of Structurally Interrupted Flood Plain Flows; Technical Report No. 98; Cornell University Water Resources and Marine Sciences Center: Ithaca, NY, USA, 1975. [Google Scholar]
  7. Smith, D.I. Extreme floods and dam failure inundation implications for loss assessment. In Proceedings of the Seminar Natural and Technological Hazards: Implications for the Insurance Industry; University of New England: Armidale, Australia, 1991; pp. 149–165. [Google Scholar]
  8. Clausen, L.; Clark, P.B. The development of criteria for predicting dambreak flood damages using modelling of historical dam failures. In Proceedings of the International Conference on River Flood Hydraulics; John Wiley & Sons Ltd.: Hoboken, NJ, USA, 1991. [Google Scholar]
  9. Maiwald, H.; Schwarz, J. Ermittlung von Hochwasserschäden unter Berücksichtigung der Bauwerksverletzbarkeit, EDAC-Hochwasserschadensmodell; Scientific Technical Reports 01-11; Zentrum für die Ingenieuranalyse von Erdbebenschäden, Universitätsverlag, Bauhaus-Universität Weimar: Weimar, Germany, 2011. [Google Scholar]
  10. Maiwald, H.; Schwarz, J. Damage and Loss Prognosis Tools Correlating Flood Action and Building’s Resistance-type Parameters. Int. J. Saf. Secur. Eng. 2015, 5, 222–250. [Google Scholar] [CrossRef]
  11. Maiwald, H.; Kaufmann, C.; Langhammer, T.; Schwarz, J. A new model for consideration of flow velocity in flood damage and loss prognosis. In Proceedings of the FLOODrisk 2020, 4th European Conference on Flood Risk Management, Online, 22–24 June 2021. Paper PA_11_9. [Google Scholar] [CrossRef]
  12. Golz, S.; Maiwald, H.; Naumann, T.; Schwarz, J. Innovative Vulnerability and Risk Assessment of Urban Areas against Flood Events: Prognosis of losses with a new approach for synthetic damage functions. Water 2022, 14. in preparation. [Google Scholar]
  13. Koch, R.; Tritschler, F.; Golz, S.; Wehner, T.; Maiwald, H. Innovative Vulnerabilitäts- und Risikobewertung urbaner Räume gegenüber Überflutungsereignissen: Schadenpotenzialanalyse mit Geodatenbasierten Ansätzen. Hydr. Wasserbewirt. 2023. in preparation. [Google Scholar]
  14. SAB Information on the Amount of Losses in the Residential Area and on the Commercial Damage in Saxony; Saxonian Relief Bank: Saxony, Germany, 2012; Excel-file.
  15. Schwarz, J.; Maiwald, H. Ingenieurmäßige Beschreibung der Schadenserwartung von Gebäuden unter Hochwassereinwirkung auf der Grundlage von Verletzbarkeitsklassen; Abschlussbericht zum Projekt 246 143 75 im Auftrag der Landestalsperrenverwaltung des Freistaates Sachsen; Zentrum für die Ingenieuranalyse von Erdbebenschäden, Bauhaus-Universität Weimar: Weimar, Germany, 2009; Excel-file. [Google Scholar]
  16. Schwarz, J.; Maiwald, H.; Gerstberger, A. Quantifizierung der Schäden infolge Hochwassereinwirkung: Fallstudie Eilenburg. Bautechnik 2005, 82, 845–856. [Google Scholar] [CrossRef]
  17. Kreibich, H.; Piroth, K.; Seifert, I.; Maiwald, H.; Kunert, U.; Schwarz, J.; Merz, B.; Thieken, A.H. Is flow velocity a significant parameter in flood damage modelling? Nat. Hazards Earth Syst. Sci. 2009, 9, 1679–1692. [Google Scholar] [CrossRef]
  18. Maiwald, H.; Schwarz, J. Berücksichtigung der Fließgeschwindigkeit bei Hochwasser-Schadensmodellen. Bautechnik 2009, 86, 550–565. [Google Scholar] [CrossRef]
  19. Ministry of Land, Infrastructure and Transportation (MLIT). Survey of Tsunami Damage Condition. Available online: http://www.mlit.go.jp/toshi/toshi-hukkou-arkaibu.html (accessed on 5 May 2021).
  20. Suppasri, A.; Mas, E.; Charvet, I.; Gunasekera, R.; Imai, K.; Fukutani, Y.; Abe, Y.; Imamura, F. Building damage characteristics based on surveyed data and fragility curves of the 2011 Great East Japan Tsunami. Nat. Hazards 2013, 66, 319–341. [Google Scholar] [CrossRef]
  21. Suppasri, A.; Charvet, I.; Imai, K.; Imamura, F. Fragility curves based on data from the 2011 Tohoku-Oki Tsunami in Ishinomaki City, with discussion of parameters influencing building damage. Earthq. Spectr. 2015, 31, 841–868. [Google Scholar] [CrossRef]
  22. Grünthal, G.; Musson, R.; Schwarz, J.; Stucchi, M. European Macroseismic Scale 1998. In Cahiers du Centre Européen de Géodynamique et de Séismologie; European Center for Geodynamics and Seismology: Walferdange, Luxembourg, 1998; Volume 15. [Google Scholar]
  23. Schwarz, J.; Maiwald, H. Prognose der Bauwerksschädigung unter Hochwassereinwirkung. Bautechnik 2007, 84, 450–464. [Google Scholar] [CrossRef]
  24. Maiwald, H.; Schwarz, J. Unified damage description and risk assessment of buildings under extreme natural hazards. Eur. J. Mason. 2019, 23, 95–111. [Google Scholar] [CrossRef]
  25. Maiwald, H.; Schwarz, J. Vulnerability assessment of Multi Hazard exposed building types—Development of an EMS-98 based empirical-statistical methodology. In Proceedings of the 16th World Conference on Earthquake Engineering, Santiago, Chile, 9–13 January 2017. Paper No. 2134. [Google Scholar]
  26. Foytong, P.; Ruangrassamee, A.; Shoji, G.; Hiraki, Y.; Ezura, Y. Analysis of tsunami flow velocities during the March 2011 Tohoku, Japan, Tsunami. Earthq. Spectr. 2013, 29, 161–181. [Google Scholar] [CrossRef]
  27. Suppasri, A.; Imai, K.; Imamura, F.; Koshimura, S. Comparison of casualty and building damage between Sanriku Ria Coast and Sendai Plain Coast based on the 2011 Great East Japan Tsunami. In Proceedings of the International Sessions in Conference of Coastal Engineering, Santander, Spain, 2–6 July 2012; JSCE, 3. pp. 76–80. [Google Scholar]
  28. Maiwald, H.; Schwarz, J. Schadensmodelle für extreme Hochwasser—Teil 1: Modellbildung und Validierung am Hochwasser 2002. Bautechnik 2014, 91, 200–210. [Google Scholar] [CrossRef]
  29. Naumann, T.; Rubin, C. Ermittlung potenzieller Hochwasserschäden in Pirna nach dem gebäudetypologischen VERIS Elbe-Ansatz. In Tagungsband zum DWA-Seminar Hochwasserschadensinformationen: Neues und Bewährtes; Hennef: Hennef, Germany, 2008; pp. 86–101. [Google Scholar]
  30. Naumann, T.; Golz, S.; Nikolowski, J. Synthetic depth-damage functions—A detailed tool for analyzing flood resilience of building types. In Proceedings of the Final Conference of the COST action C22 Urban Flood Management in cooperation with UNESCO-IHP, Paris, France, 26–27 November 2009. [Google Scholar]
  31. Schwarz, J.; Maiwald, H.; Kaufmann, C.; Beinersdorf, S. Evaluation of the vulnerability of existing building stocks under single and Multi-Hazard impact. In Proceedings of the 16th European Conference on Earthquake Engineering (ECEE), Thessaloniki, Greece, 18–21 June 2018. Paper 11641. [Google Scholar]
  32. Schwarz, J.; Maiwald, H.; Kaufmann, C.; Langhammer, T.; Beinersdorf, S. Conceptual basics and tools to assess the multi hazard vulnerability of existing buildings. Eur. J. Mason. 2019, 23, 246–264. [Google Scholar] [CrossRef]
  33. Planungsgesellschaft Scholz und Lewis mbH. Ergebnisse der 2D-HN-Modellierung Döbeln für den Ist-Zustand 8/2002, Wassertiefen- und Geschwindigkeitsshapes, GRIDS und -TINS; Planungsgesellschaft Scholz und Lewis mbH, Landestalsperrenverwaltung Sachsen: Pirna, Germany, 2009. [Google Scholar]
  34. Maiwald, H.; Schwarz, J.; Abrahamczyk, L.; Lobos, D. Das Magnitude 8.8 Maule (Chile)-Erdbeben vom 27. Februar 2010—Ingenieuranalyse der Tsunamischäden. Bautechnik 2010, 87, 614–622. [Google Scholar] [CrossRef]
  35. Maiwald, H.; Schwarz, J. Simulative flood damage modelling taking into account inundation level and flow velocity: Uncertainties and strategies for further refinement. In Proceedings of the 8th International Conference on Flood and Urban Water Management, FRIAR 2022, Online, 6–8 July 2022. [Google Scholar]
  36. Strangefield, P.; Stopp, H. Floating houses: An adaptation strategy for flood preparedness in times of global change. In Proceedings of the Flood Recovery, Innovation and Reponse IV, Poznan, Poland, 18–20 June 2014. [Google Scholar] [CrossRef]
  37. Maiwald, H. Ingenieurmäßige Ermittlung von Hochwasserschadenspotentialen im Mikroskaligen Maßstab. Ph.D. Thesis, Bauhaus-Universität Weimar, Weimar, Germany, 2008. Schriftenreihe des Instituts für Konstruktiven Ingenieurbau 011. [Google Scholar]
  38. Bundesministerium für Verkehr, Bau- und Wohnungswesen. Normalherstellungskosten 2000 (NHK 2000). Available online: https://www.werttax.de/plaintext/downloads/normalherstellungskosten2000nhk2000.pd (accessed on 25 July 2022).
  39. Statistisches Bundesamt. Preisindizes für die Bauwirtschaft. Fachserie 17, Reihe 4. 2020. Available online: https://www.statistischebibliothek.de/mir/receive/DEHeft_mods_00133218 (accessed on 5 July 2022).
  40. Charvet, I.; Macabuag, J.; Rossetto, T. Estimating Tsunami-Induced Building Damage through Fragility Functions: Critical Review and Research Needs. Front. Built. Environ. 2017, 3, 36. [Google Scholar] [CrossRef]
  41. De Risi, R.; Goda, K.; Yasuda, T.; Mori, N. Is flow velocity important in tsunami empirical fragility modeling? Earth. Sci. Rev. 2017, 166, 64–82. [Google Scholar] [CrossRef]
  42. Farhadi, H.; Najafzadeh, M. Flood Risk Mapping by Remote Sensing Data and Random Forest Technique. Water 2021, 13, 3115. [Google Scholar] [CrossRef]
  43. Schwarz, J.; Maiwald, H.; Kaufmann, C.; Langhammer, T. Innovative Vulnerabilitäts- und Risikobewertung urbaner Räume gegenüber Überflutungsereignissen INNOVARU; Abschlussbericht Teil II: Projektergebnisse; Bauhaus-Universität Weimar: Weimar, Germany, 2021. [Google Scholar]
  44. Figueiredo, R.; Schröter, K.; Weiss-Motz, A.; Martina, M.L.V.; Kreibich, H. Multi-model ensembles for assessment of flood losses and associated uncertainty. Nat. Hazards Earth Syst. Sci. 2018, 18, 1297–1314. [Google Scholar] [CrossRef]
  45. Farhadi, H.; Esmaeily, A.; Najafzadeh, M. Flood monitoring by integration of Remote Sensing technique and Multi-Criteria Decision Making method. Comp. Geosci. 2022, 160, 105045. [Google Scholar] [CrossRef]
  46. Haddidian, N.M.; Schwarz, J. EMS-98 based damage grade assessment using remote sensing images for cascading events. In Proceedings of the 3rd European Conference on Earthquake Engineering & Seismology (ECEES), Bucharest, Romania, 4–9 September 2022. Paper 6231. [Google Scholar]
Figure 1. Investigation areas in the Free State of Saxony (cf. [11]).
Water 14 02793 g001
Figure 2. EDAC EQUIP survey tool for the documentation of building parameters (with background maps from Bing Maps®).
Water 14 02793 g002
Figure 3. Selection field for the building typology in the improved survey tool EQUIP.
Water 14 02793 g003
Figure 4. Inundation levels and flow velocities in the investigation areas: (a) Grimma; (b) Freital; (c) Pirna.
Water 14 02793 g004
Figure 5. Specific vulnerability functions of type Dm = f(hgl, vfl) considering the initial five-stage differentiation of damage grades according to previous studies [10,18].
Water 14 02793 g005
Figure 6. Clustered damage data: (a) vulnerability class HW-B; (b) vulnerability class HW-C [11].
Water 14 02793 g006
Figure 7. Vulnerability functions for flood vulnerability classes depending on inundation level (hgl) and flow velocity (vfl): (a) variant V1; (b) variant V2; (c) variant V3; (d) variant V4; (e) variant V5 (taken from [11]).
Water 14 02793 g007aWater 14 02793 g007b
Figure 8. Damage data and simplified vulnerability functions for HW-C considering the inundation level above ground level (hgl) and the number of storeys (nst) (taken from [11]).
Water 14 02793 g008
Figure 9. Vulnerability functions (variant V2) depending on inundation level (hgl), flow velocity (vfl) and number of storeys (nst): (a) HW-A; (b) HW-B; (c) HW-C; (d) HW-D (variant V3 is shown in [11]).
Water 14 02793 g009aWater 14 02793 g009b
Figure 10. Comparison of the calculated mean damage grades MDm,calc in the land-use areas (micro-scale damage calculation) and the observed damages (MDm,obs) in Grimma (Level 2): (a) variant V1; (b) variant V2; (c) variant V3; (d) variant V4; (e) variant V5; (f) observed damage.
Water 14 02793 g010aWater 14 02793 g010b
Figure 11. Flow chart of numerical validation.
Water 14 02793 g011
Figure 12. Comparison of the calculated mean damage grades (MDm,calc) in the land-use areas and the observed damage (MDm,obs) in the Döbeln investigation area: (a) calculated mean damage grades (MDm,calc), Level I; (b) calculated mean damage grades (MDm,calc), Level II; (c) observed mean damage grades (MDm,obs).
Water 14 02793 g012
Figure 13. Comparison of the calculated mean damage grades (MDm,calc) in the land-use areas and the observed damages (MDm,obs) in the Eilenburg investigation area: (a) calculated mean damage grades (MDm,calc), Level I; (b) calculated mean damage grades (MDm,calc), Level II; (c) observed mean damage grades (MDm,obs).
Water 14 02793 g013
Figure 14. Comparison of the calculated mean damage grades (MDm,calc) in the land-use areas and the observed damages (MDm,obs) in the Freital investigation area: (a) calculated mean damage grades (MDm,calc), Level I; (b) calculated mean damage grades (MDm,calc), Level II; (c) observed mean damage grades (MDm,obs).
Water 14 02793 g014
Figure 15. Comparison of the calculated mean damage grades (MDm,calc) in the land-use areas and the observed damage grades (MDm,obs) in the Pirna investigation area: (a) calculated mean damage grades (MDm,calc), Level I; (b) calculated mean damage grades (MDm,calc), Level II; (c) observed mean damage grades (MDm,obs).
Water 14 02793 g015
Table 1. Overview of the investigation areas (for interim state cf. [11]).
Investigation AreaBuildings
Inspected (Affected) 1
Damage Cases:
SAB 2 (EDAC) 3
Year(s) of
Survey
ResidentialTotal
Pirna1209 (938)1405 (1067)1148 (366)2008
Grimma773 (690)1280 (1186)616 (306)2009, 2017
Freital1048 (946)2096 (1842)865 (277)2019
Eilenburg1041 (1028)2184 (2149)961 (551)2003, 2004
Döbeln832 (788)1429 (1348)681 (276)2004
Flöha734 (721)1872 (1828)582 (154)2009
1 Acc. to flood scenarios (see Section 2.3). 2 Reported to Saxonian Relief Bank (SAB) [14]. 3 Included in EDAC flood damage database.
Table 2. Overview of the 2002 flood scenarios (for interim state cf. [11]).
Investigation Area2D Model
Approach
Grid Size
(m × m) 1
Inundation Level hgl (m) 2Flow Velocity vfl (m/s) 2
Pirnadetailedvariable0–4.10–5.3
Grimmadetailed5 × 5 (hgl)
1 × 1 (vfl)
0–5.00–2.7
Freitaldetailed2 × 20–3.50–4.5
Eilenburg mean roughness25 × 250–3.50–1.9
Döbelndetailedvariable0–4.70–2.4
Flöhamean roughness5 × 50–2.80–2.3
1 Output from hydraulic calculation. 2 At building location.
Table 3. Extended flood damage scale with examples of the 2002 flood in Saxony [24] and the flood of 2021 [3].
Damage GradeDamageDescriptionDrawingExample 1
StructuralNon-Structural
D1nonelightmoisture damage, dirt Water 14 02793 i001 Water 14 02793 i002
D2lightmoderateslight cracking of loadbearing walls
doors/windows pushed in
washing out of foundations
contamination
replacement of finshings necessary
Water 14 02793 i003 Water 14 02793 i004
D3moderateheavylarger cracking in loadbearing walls and slabs
settlements
collapse of non-loadbearing walls
replacement of non-loadbearing building elements necessary
Water 14 02793 i005 Water 14 02793 i006
D4heavyvery heavycollapse of loadbearing walls, slabs
replacement of loadbearing walls, slabs
Water 14 02793 i007 Water 14 02793 i008
D5very heavyvery heavycollapse of larger parts of building Water 14 02793 i009 Water 14 02793 i010
D6very heavyvery heavydislocation: building completely washed away, toppled or displaced from foundation Water 14 02793 i011 Water 14 02793 i012
1 Photos of D1 to D6 damage taken by EDAC (D1 to D5: flood in 2002; D6: flood in 2021, cf. [3]).
Table 4. Classification of building types in vulnerability classes and identification of ranges of scatter [31].
Building TypeVulnerability Class HW-
ABCDEF
Clay Water 14 02793 i013
Prefabricated timber frame Water 14 02793 i014
Timber frame with masonry or clay infill Water 14 02793 i015
Masonry Water 14 02793 i016
Reinforced concrete Water 14 02793 i017
Flood-resistant design Water 14 02793 i018
Flood-evasive design Water 14 02793 i013
Water 14 02793 i013 Most likely vulnerability class. Water 14 02793 i030 Probable range. Water 14 02793 i031 Range of less probable, exceptional cases.
Table 5. Coefficients of the vulnerability functions Dm = f(hgl,vfl).
VariantVCCoefficients Coefficient of Determination (R2)
C1C2C3
V1HW-A 10.351−0.730--
HW-B0.292−0.853-0.72
HW-C0.238−0.914-0.84
HW-D 20.189−0.920-0.76
V2HW-A 10.2550.066−0.572-
HW-B0.1350.053−0.6210.78
HW-C0.0620.042−0.6470.88
HW-D 20.0350.030−0.6500.84
V3HW-A 10.2300.017−0.496-
HW-B0.1430.011−0.5710.79
HW-C0.0900.007−0.6230.85
HW-D 20.0710.004−0.6500.79
V4HW-A 10.0170.105--
HW-B0.013−0.250-0.74
HW-C0.009−0.456-0.83
HW-D0.005−0.512-0.78
V5HW-A 1,20.5780.017−0.800-
HW-B 20.3810.011−0.8000.79
HW-C 20.2640.007−0.8000.86
HW-D 20.2270.004−0.8000.80
1 For HW-A, the coefficients were extrapolated from vulnerability classes HW-B, HW-C and HW-D. 2 Coefficients slightly modified.
Table 6. Derived coefficients of the vulnerability functions, Dm = f(hgl, vfl, nst).
VariantVCCoefficients
C1C2C3C4
V1HW-A0.351−0.155−0.622-
HW-B0.292−0.064−0.809-
HW-C0.238−0.127−0.829-
HW-D0.189−0.074−0.869-
V2HW-A0.2550.066−0.155−0.465
HW-B0.1350.053−0.064−0.577
HW-C0.0620.042−0.127−0.559
HW-D0.0350.030−0.074−0.599
V3HW-A0.2300.017−0.155−0.388
HW-B0.1430.011−0.064−0.527
HW-C0.0900.007−0.127−0.535
HW-D0.0710.004−0.074−0.599
V4HW-A0.017−0.1550.212-
HW-B0.013−0.064−0.206-
HW-C0.009−0.127−0.368-
HW-D0.005−0.074−0.460-
V5HW-A0.5780.017−0.155−0.693
HW-B0.3810.011−0.064−0.756
HW-C0.2640.007−0.127−0.712
HW-D0.2270.004−0.074−0.749
Table 7. Error analysis for Level I (excluding flow velocity).
Investigation AreaMAERMSE
V1V2V3V4V5V1V2V3V4V5
Döbeln0.380.340.410.440.410.480.480.510.540.51
Eilenburg0.480.410.490.510.500.750.680.700.680.71
Flöha0.230.260.340.440.330.320.340.400.500.40
Freital0.280.240.280.430.260.420.380.410.520.40
Grimma0.400.390.330.370.340.510.520.460.510.47
Pirna0.360.210.320.340.330.400.230.350.370.37
Total0.360.310.360.420.360.480.440.470.520.48
Table 8. Error analysis for Level II (including flow velocity).
Investigation AreaMAERMSE
V1V2V3V4V5V1V2V3V4V5
Döbeln0.350.340.390.420.390.460.470.490.520.49
Eilenburg0.490.430.490.520.500.650.600.620.620.63
Flöha0.250.300.340.450.340.310.360.400.500.40
Freital0.270.240.260.410.250.420.390.400.500.39
Grimma0.410.350.340.370.340.510.480.460.500.47
Pirna0.330.230.280.300.290.370.250.310.330.33
Total0.350.320.350.410.350.450.430.440.500.45
Table 9. Classification scheme with respect to the location of buildings and direction of inflow [10,18].
No.Type/
Location
DescriptionFlow
Direction
Scheme
1Stand-alone Direct Water 14 02793 i020
2aFront houseBeginning of a row of housesDirect/flow around Water 14 02793 i021
2bEnd houseEnd of a row of housesFlow around/circulation Water 14 02793 i022
2cFront/end houseBeginning/end of a row of housesOrthogonal/circulation Water 14 02793 i023
3aCentral houseIn the middle of a row of housesTangential Water 14 02793 i024
3bCentral houseIn the middle of a row of housesDirect/orthogonal Water 14 02793 i025
4Corner houseCross situationFlow around/circulation Water 14 02793 i026
Publisher’s Note: MDPI stays neutral with regard to jurisdictional claims in published maps and institutional affiliations.

