
Meteorological Effects of a Lake in A Permafrost Basin: Difference of Seasonal Freeze–Thaw Cycles in Hovsgol Lake and Darhad Basin, Northern Mongolia

Abstract
:1. Introduction
2. Methodology
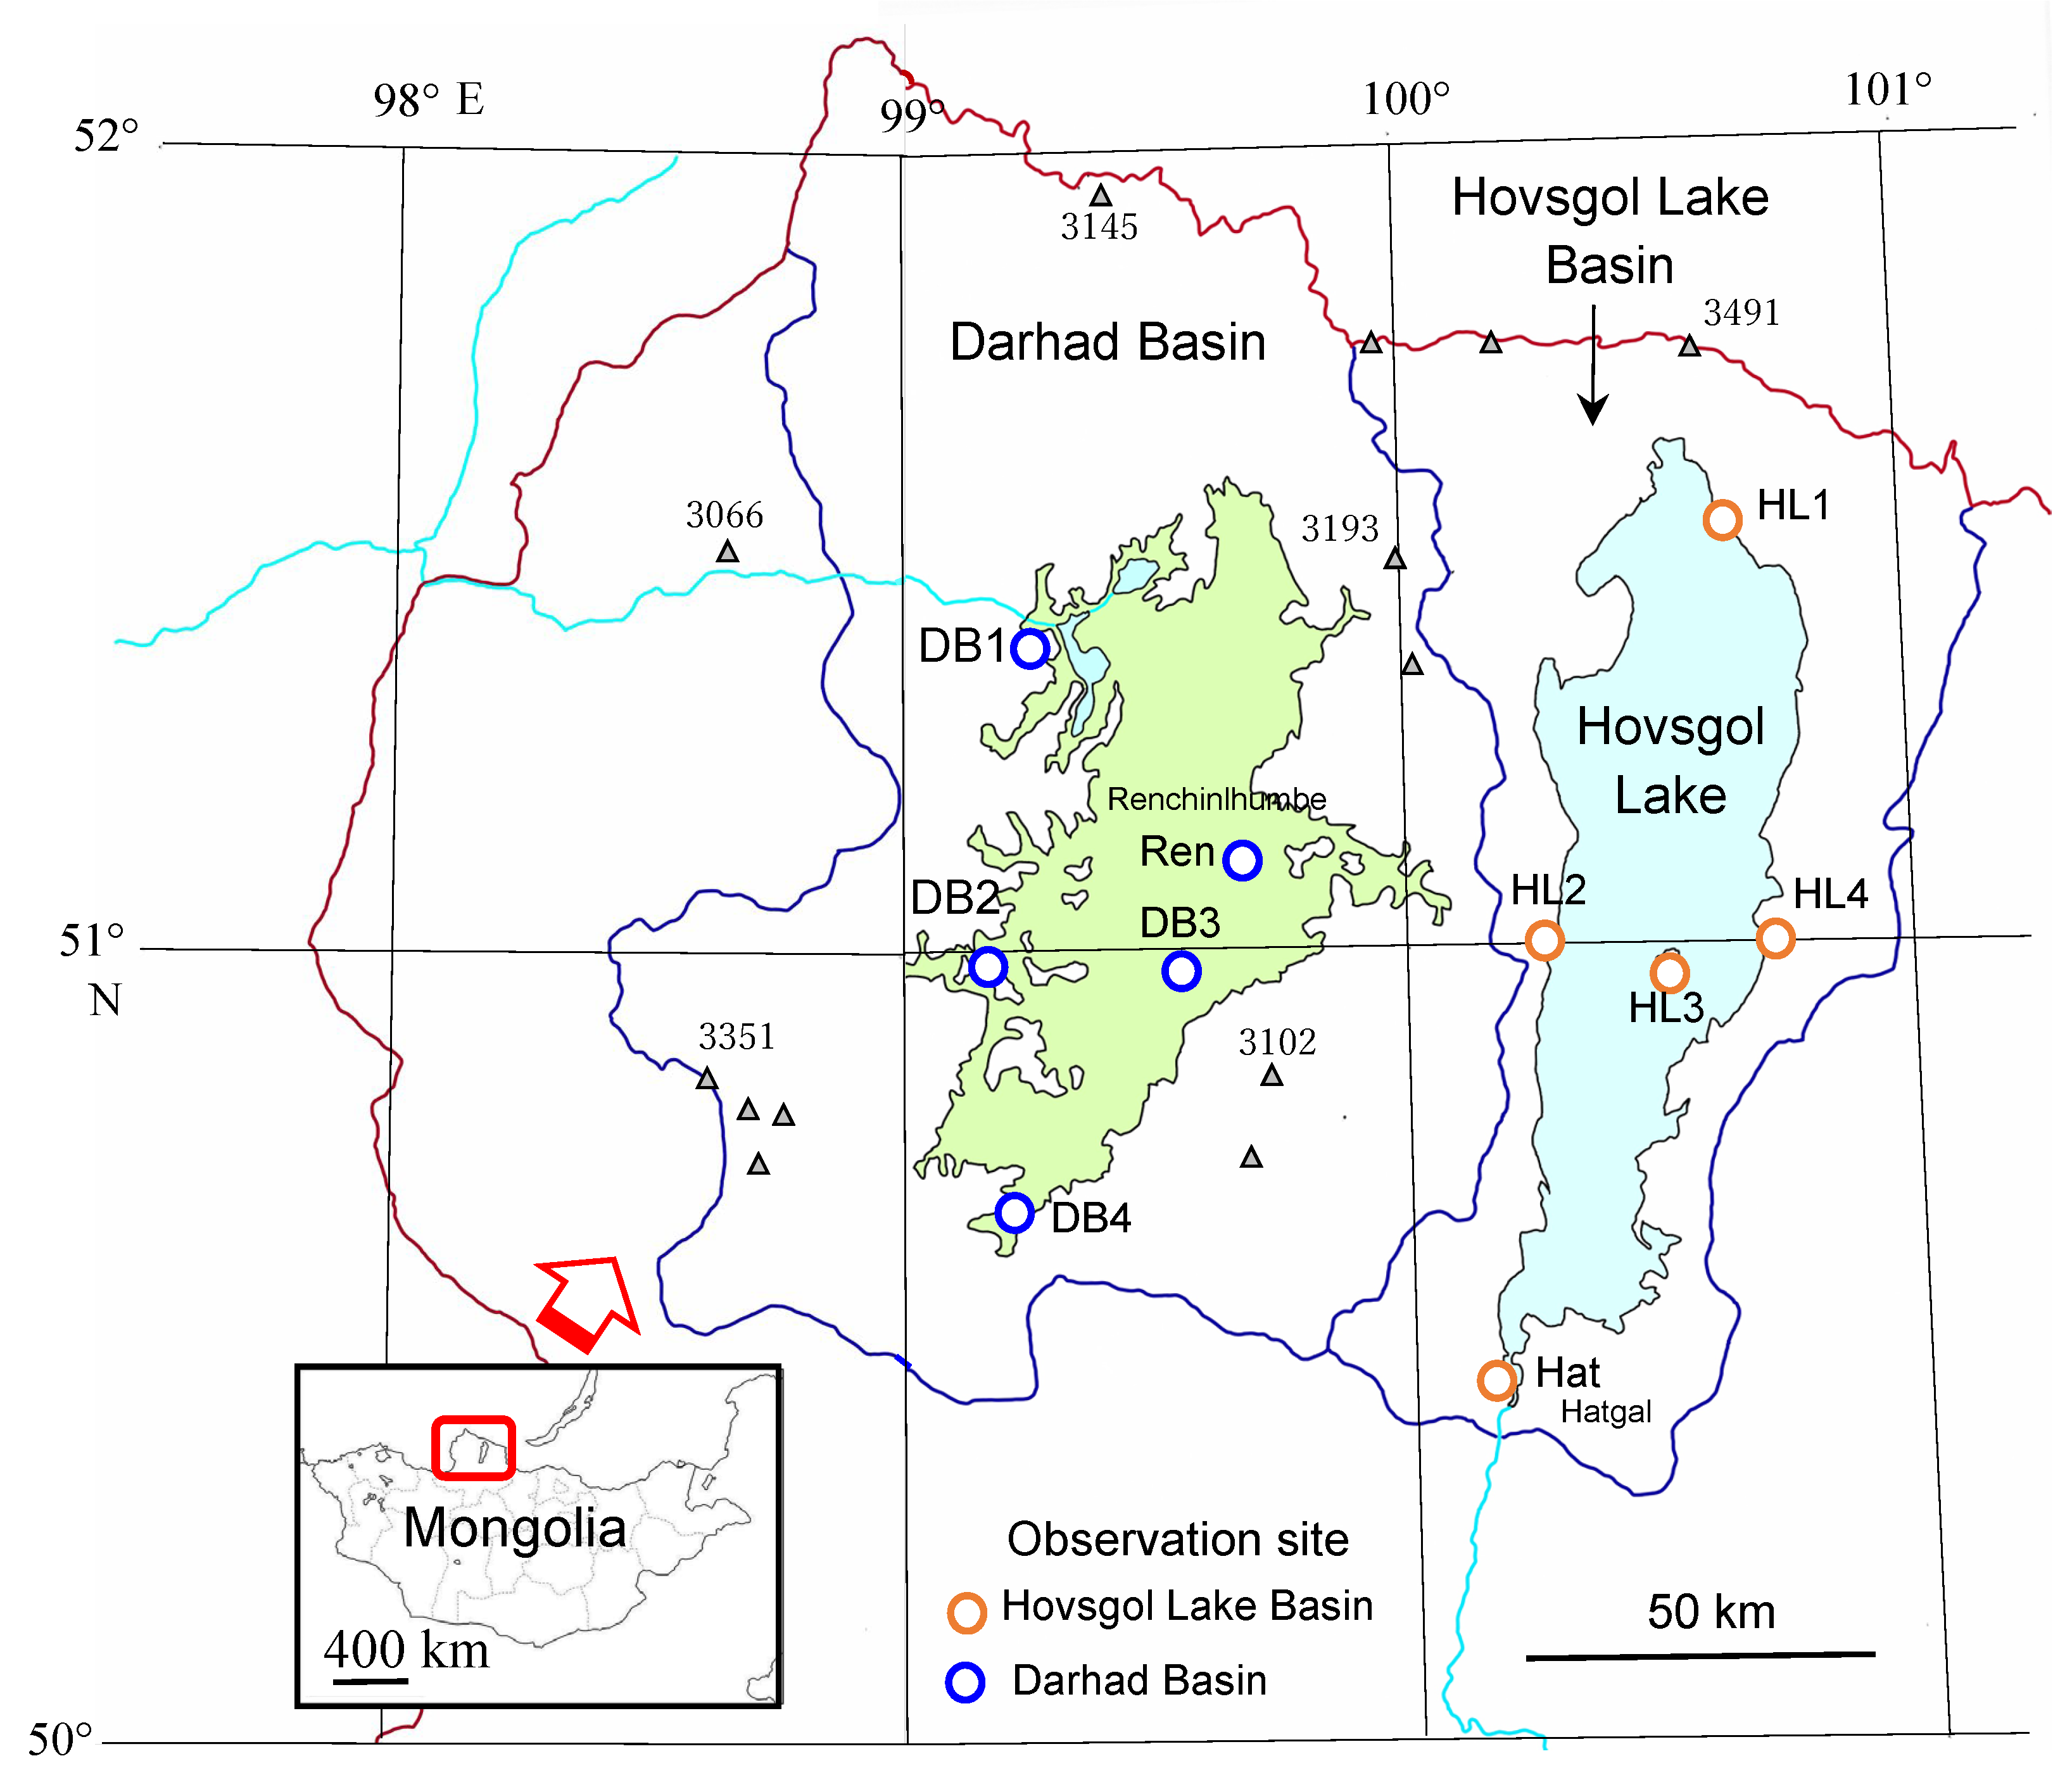
2.1. Study Area
2.2. Survey and Analysis
- (i)
- Latent heat of freezing of lake water or thawing of lake ice Ei (MJ-m−2); (Equation (5), where β (= ρi: density of ice 0.917 t-m−3) [36].
- (ii)
- Latent heat quantity Es (MJ-m−2) associated with freezing of active layer; (Equation (5), where β (= θ × ρw, θ: volumetric water content 0.30 (m3-m−3), ρw: density of water 0.9998 t-m−3) [36].
- (iii)
- Latent heat of melting of frozen soil Es (MJ-m−2); (Equation (5), β (= θ × ρi × ɤ, θ: volumetric water content 0.30 (m3-m−3), ρi: density of ice 0.917 t-m−3, ɤ: freezing (volumetric expansion rate of water at time of freezing = 1.09).
3. Results and Discussions
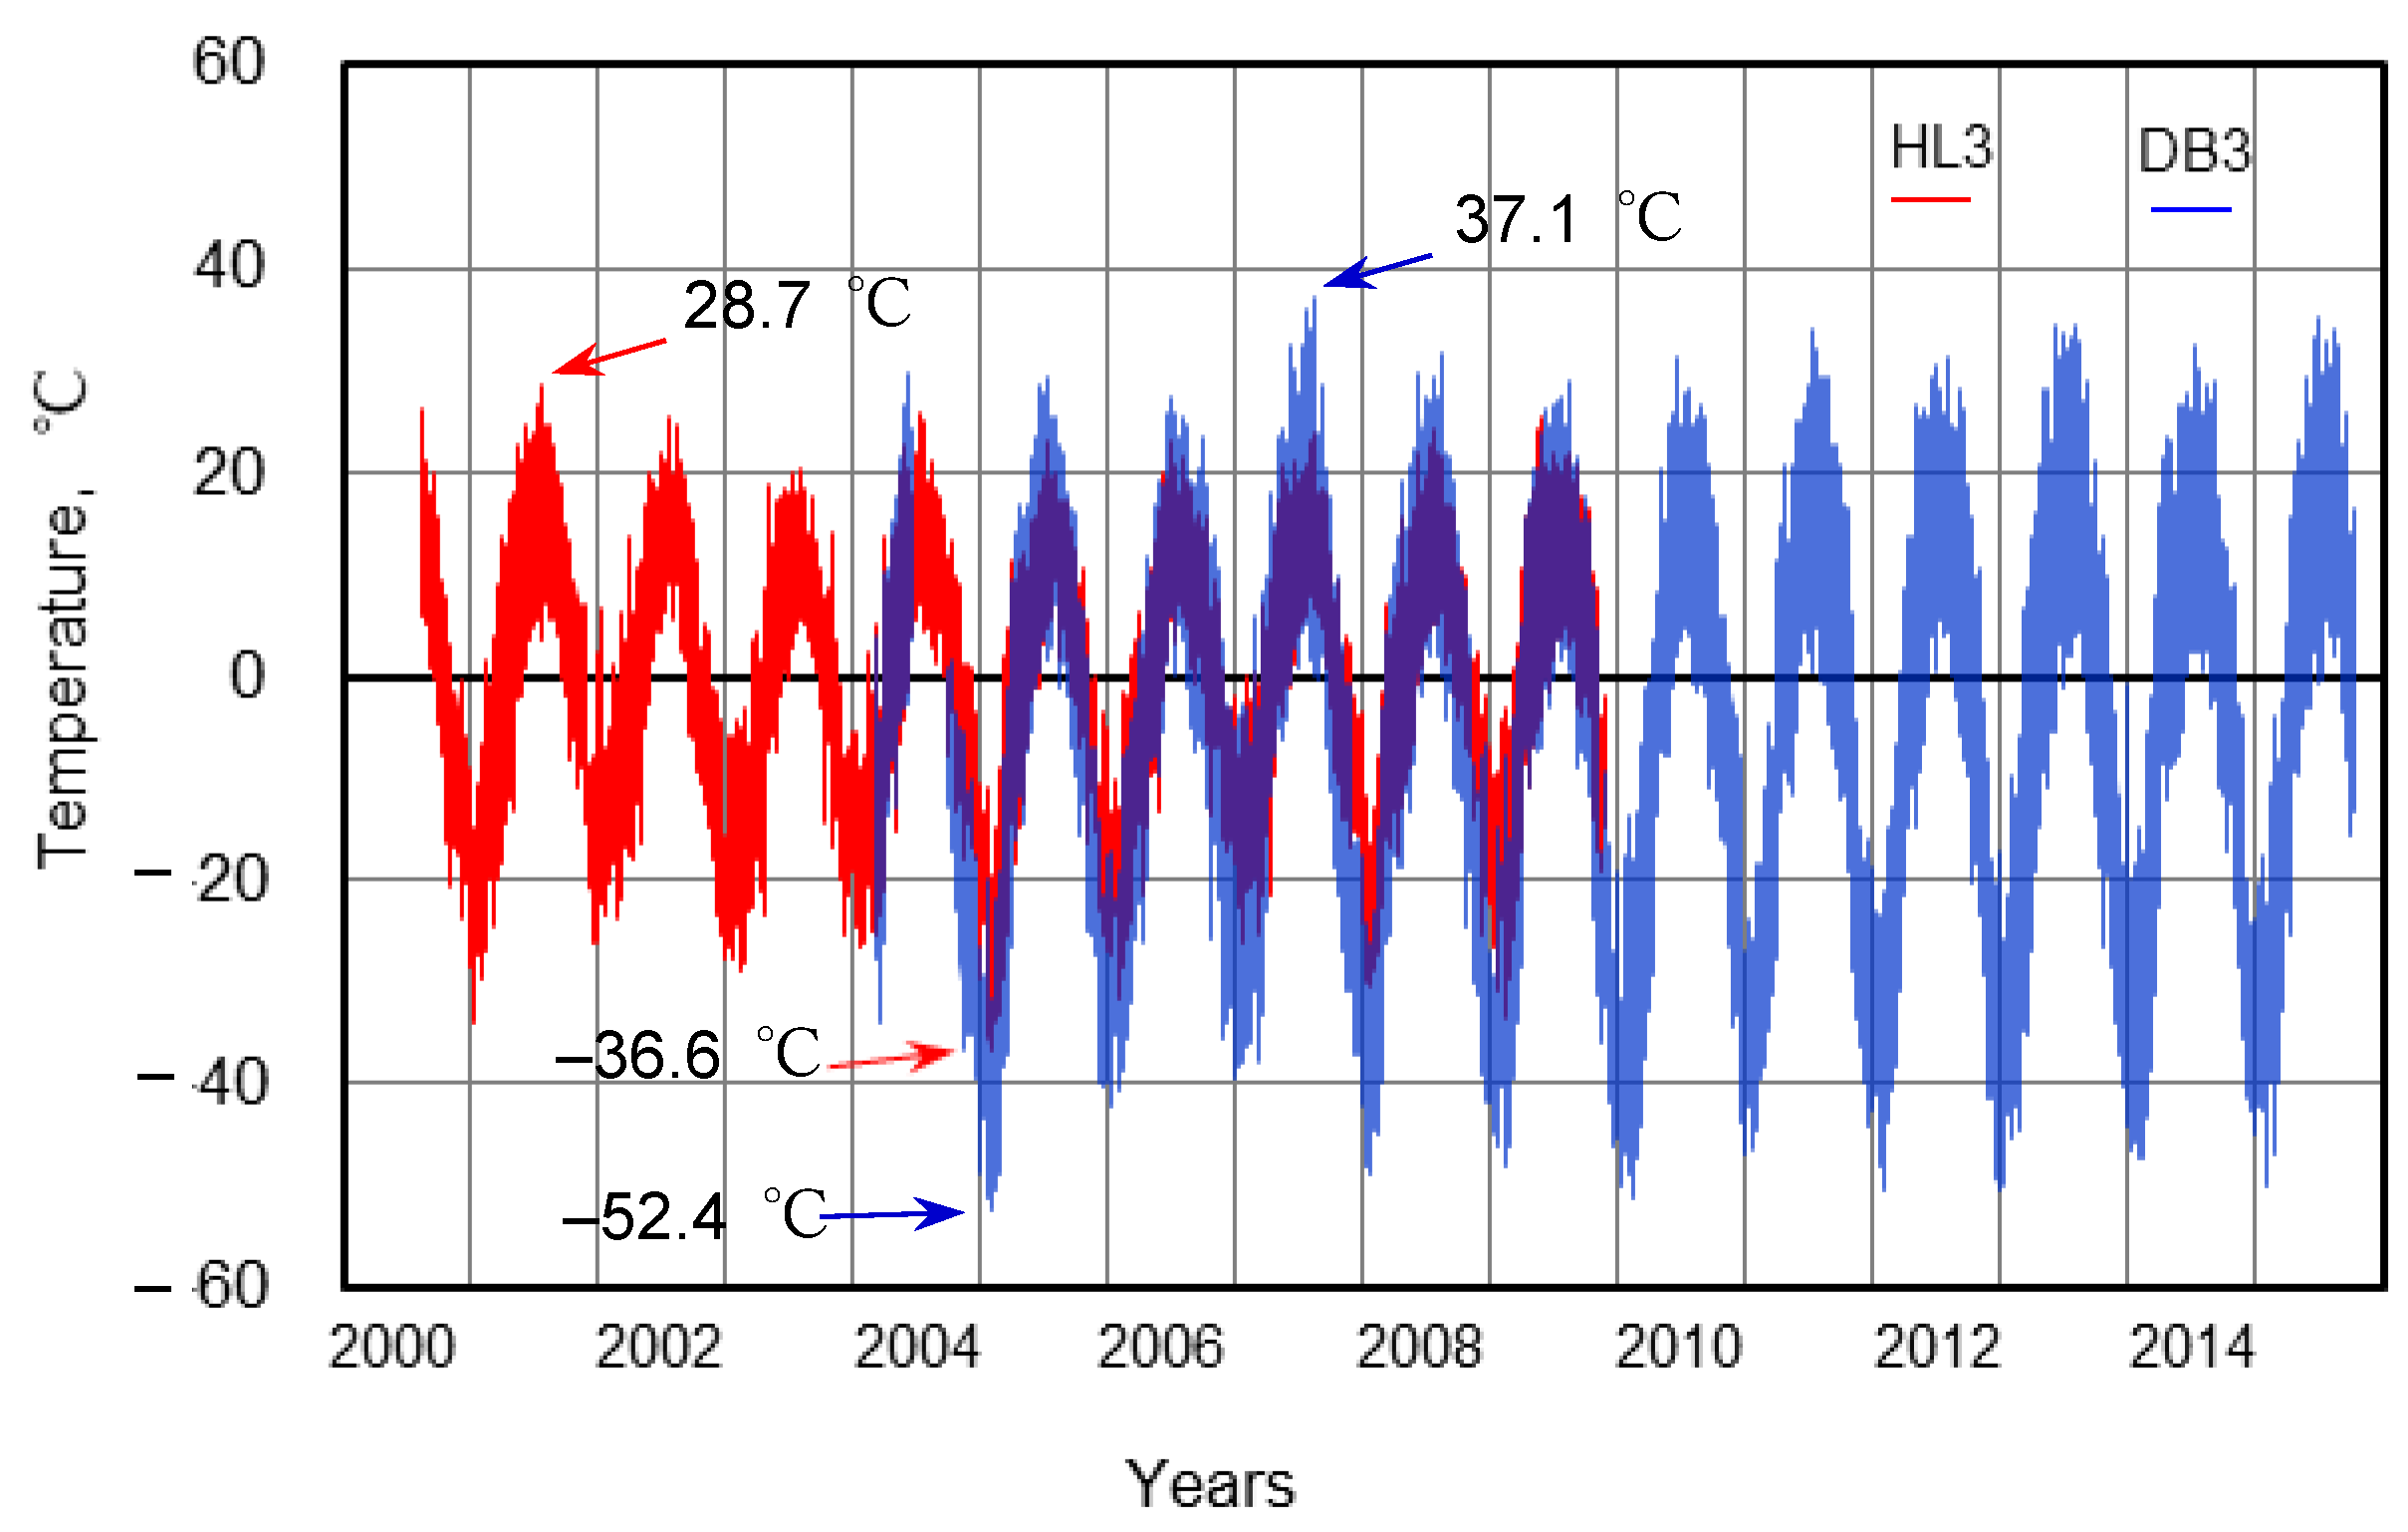
3.1. Temperature Difference between Hovsgol Lake Basin and Darhad Basin
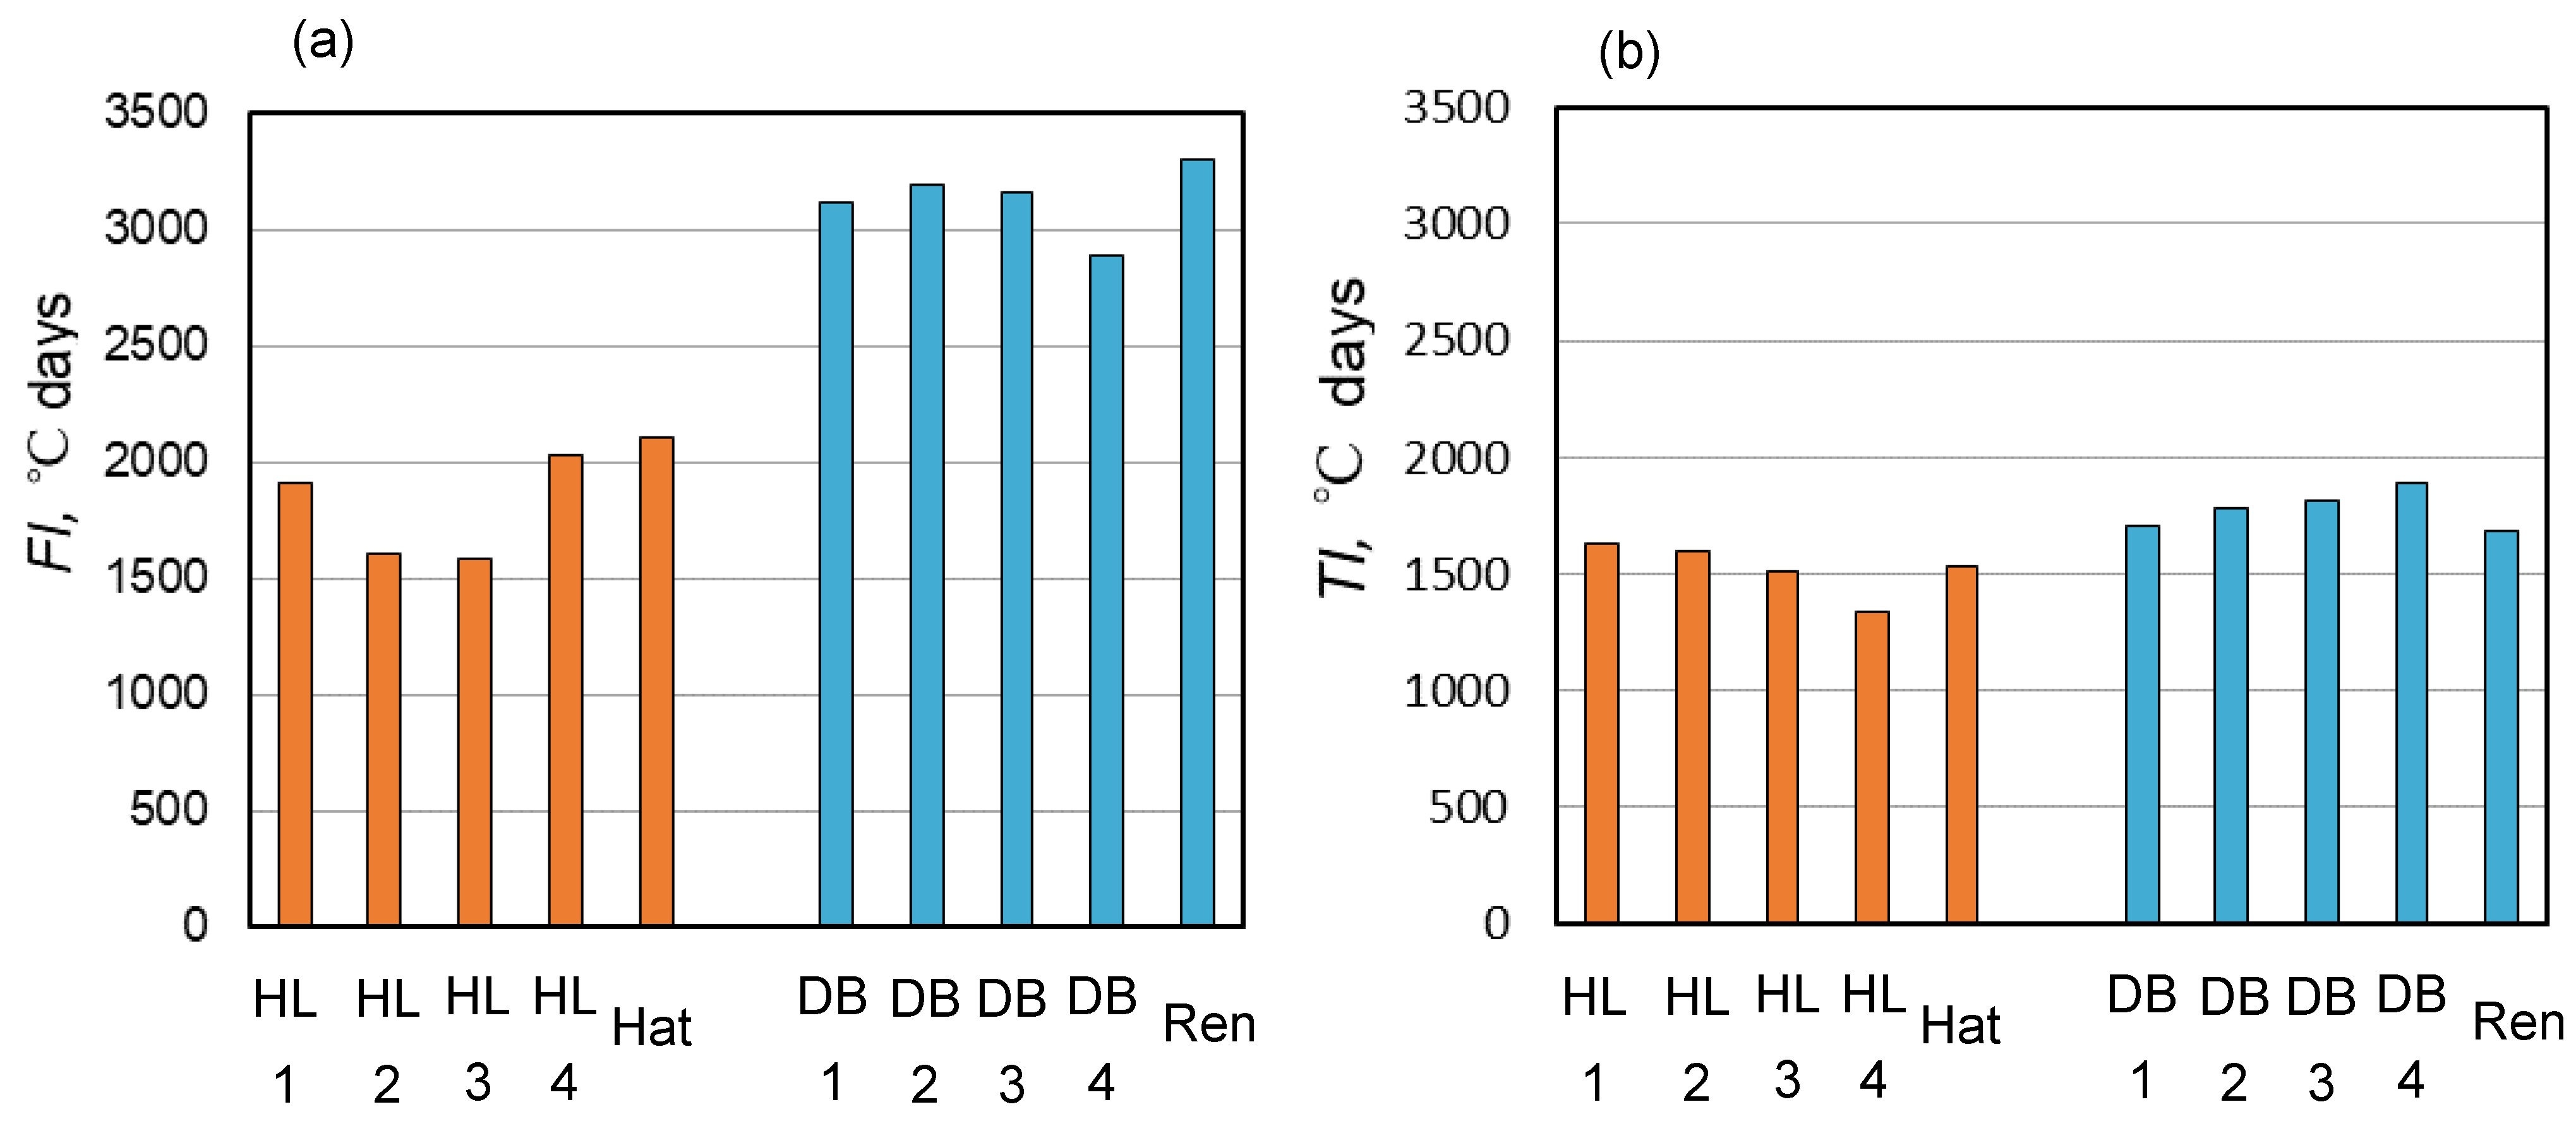
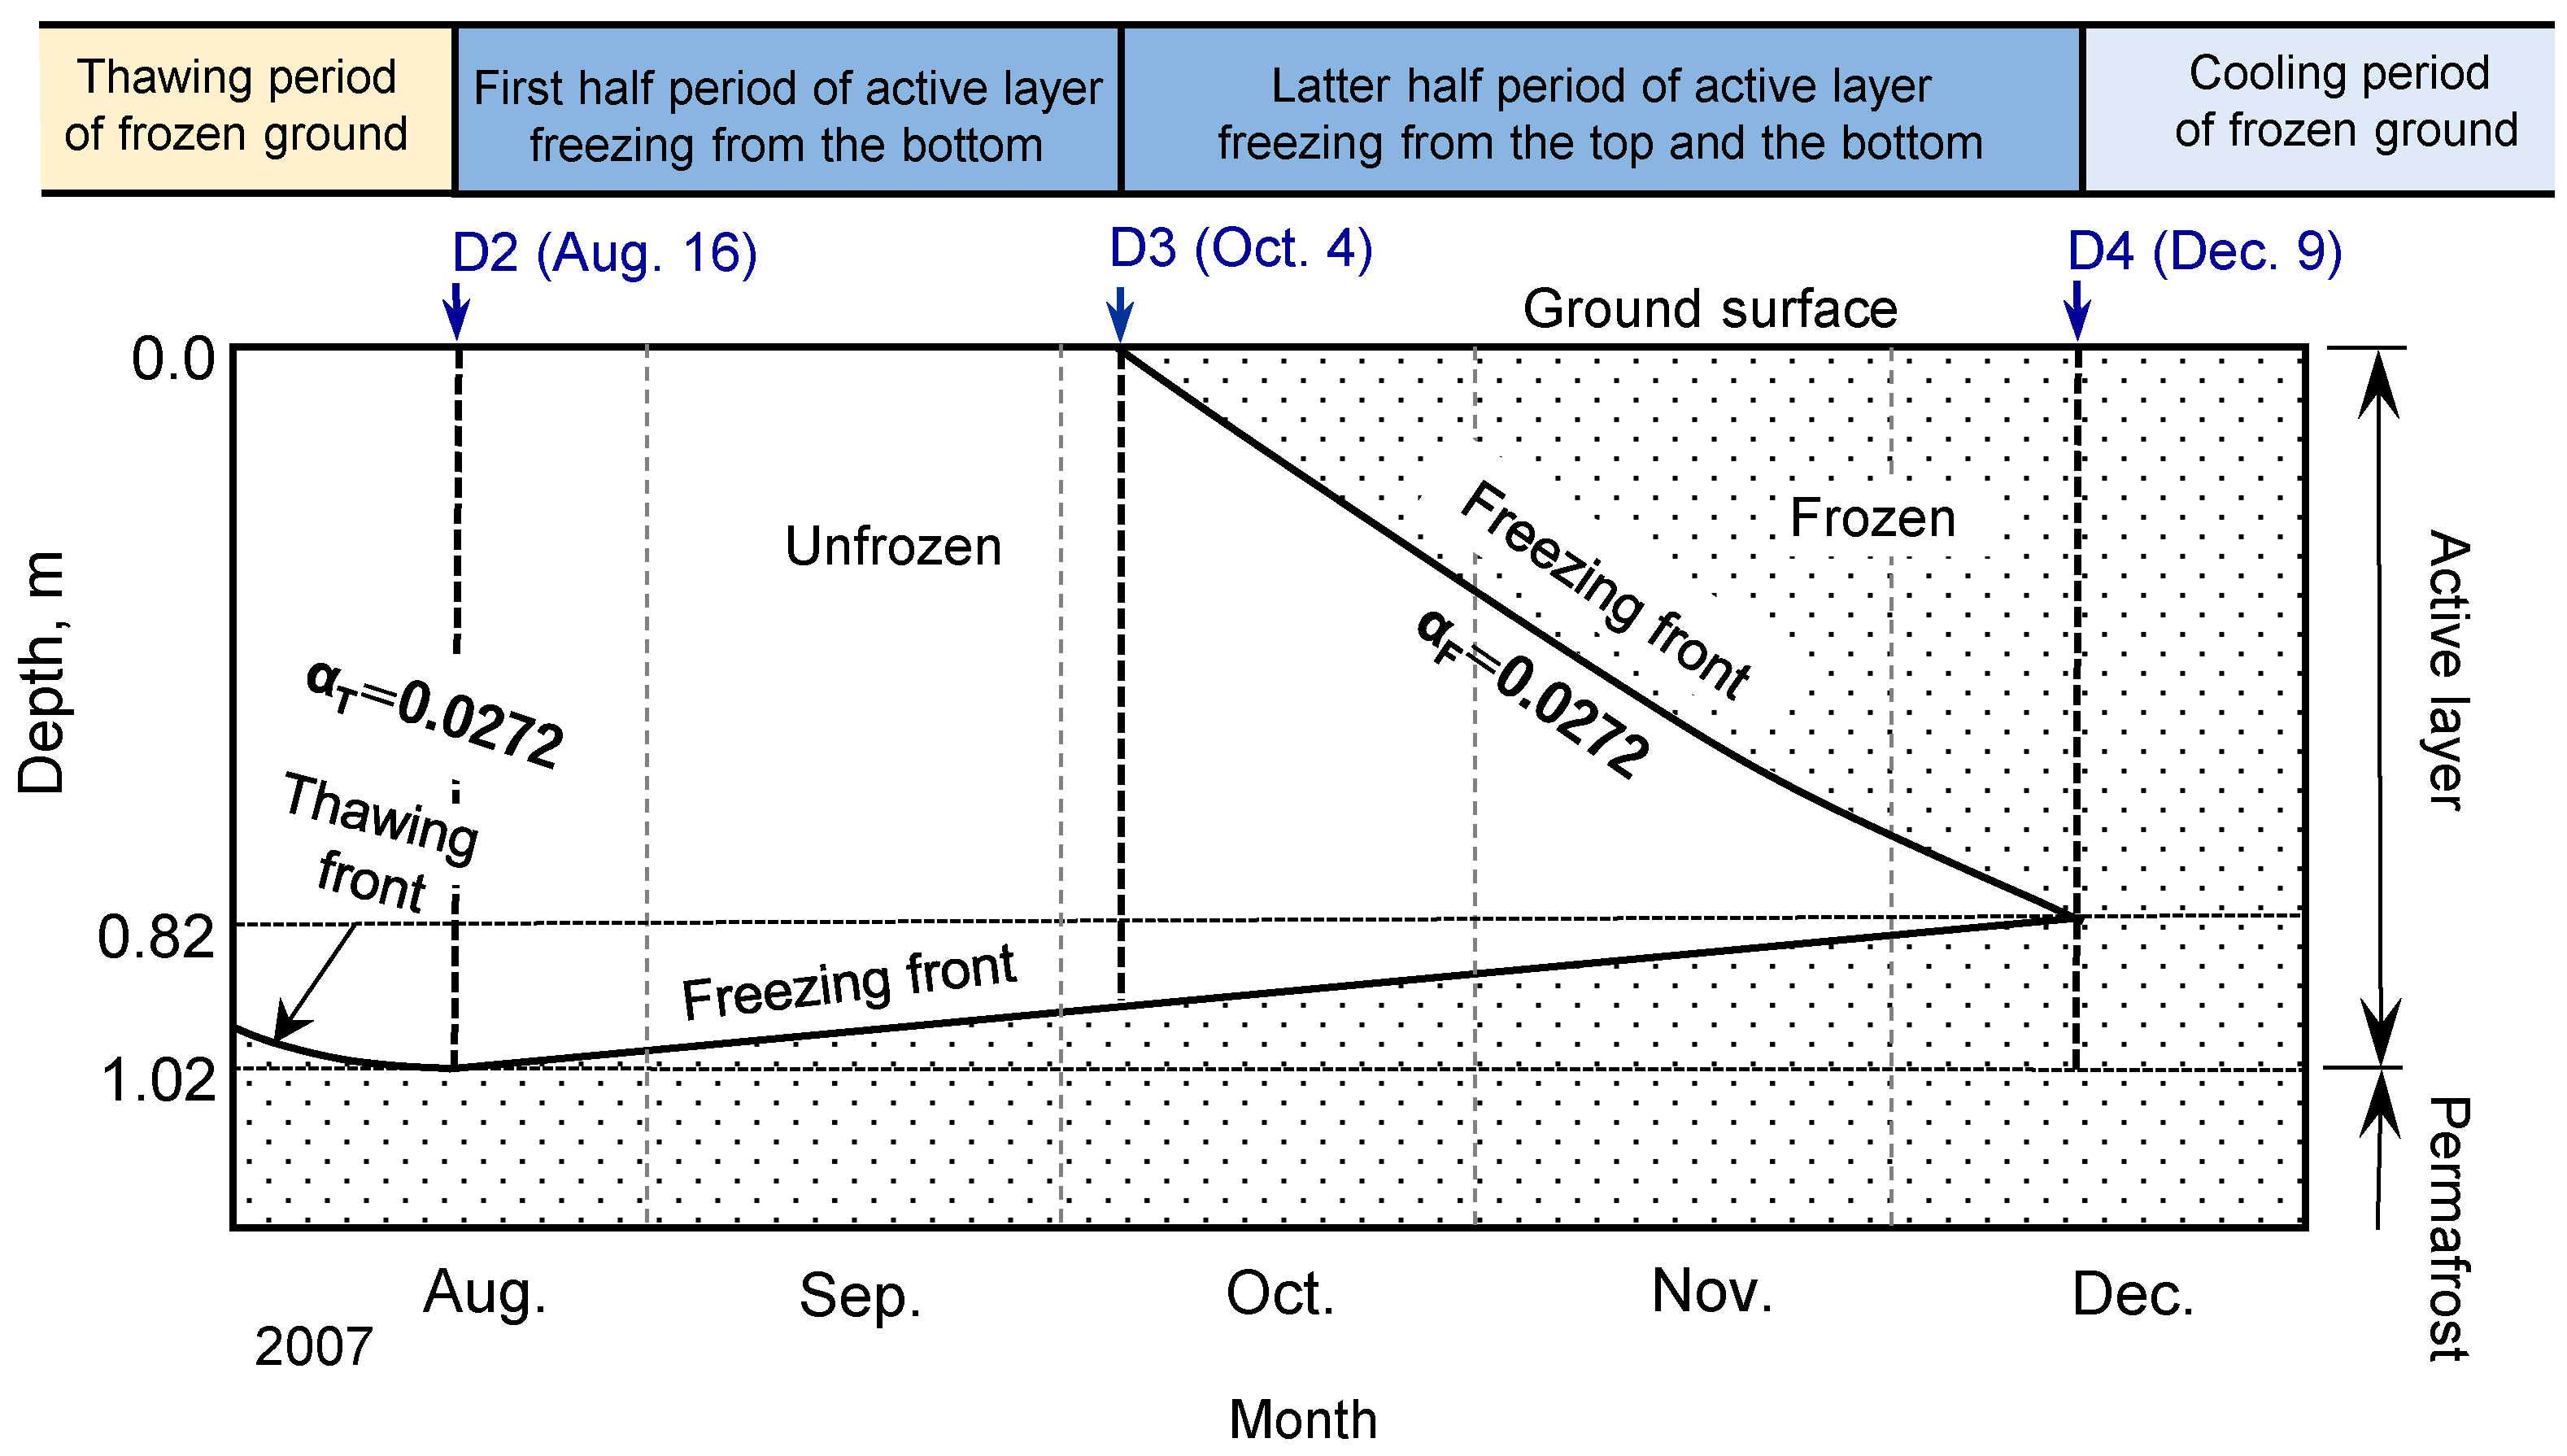
3.2. Freeze–Thaw Characteristics of Lake Water and Active Layer
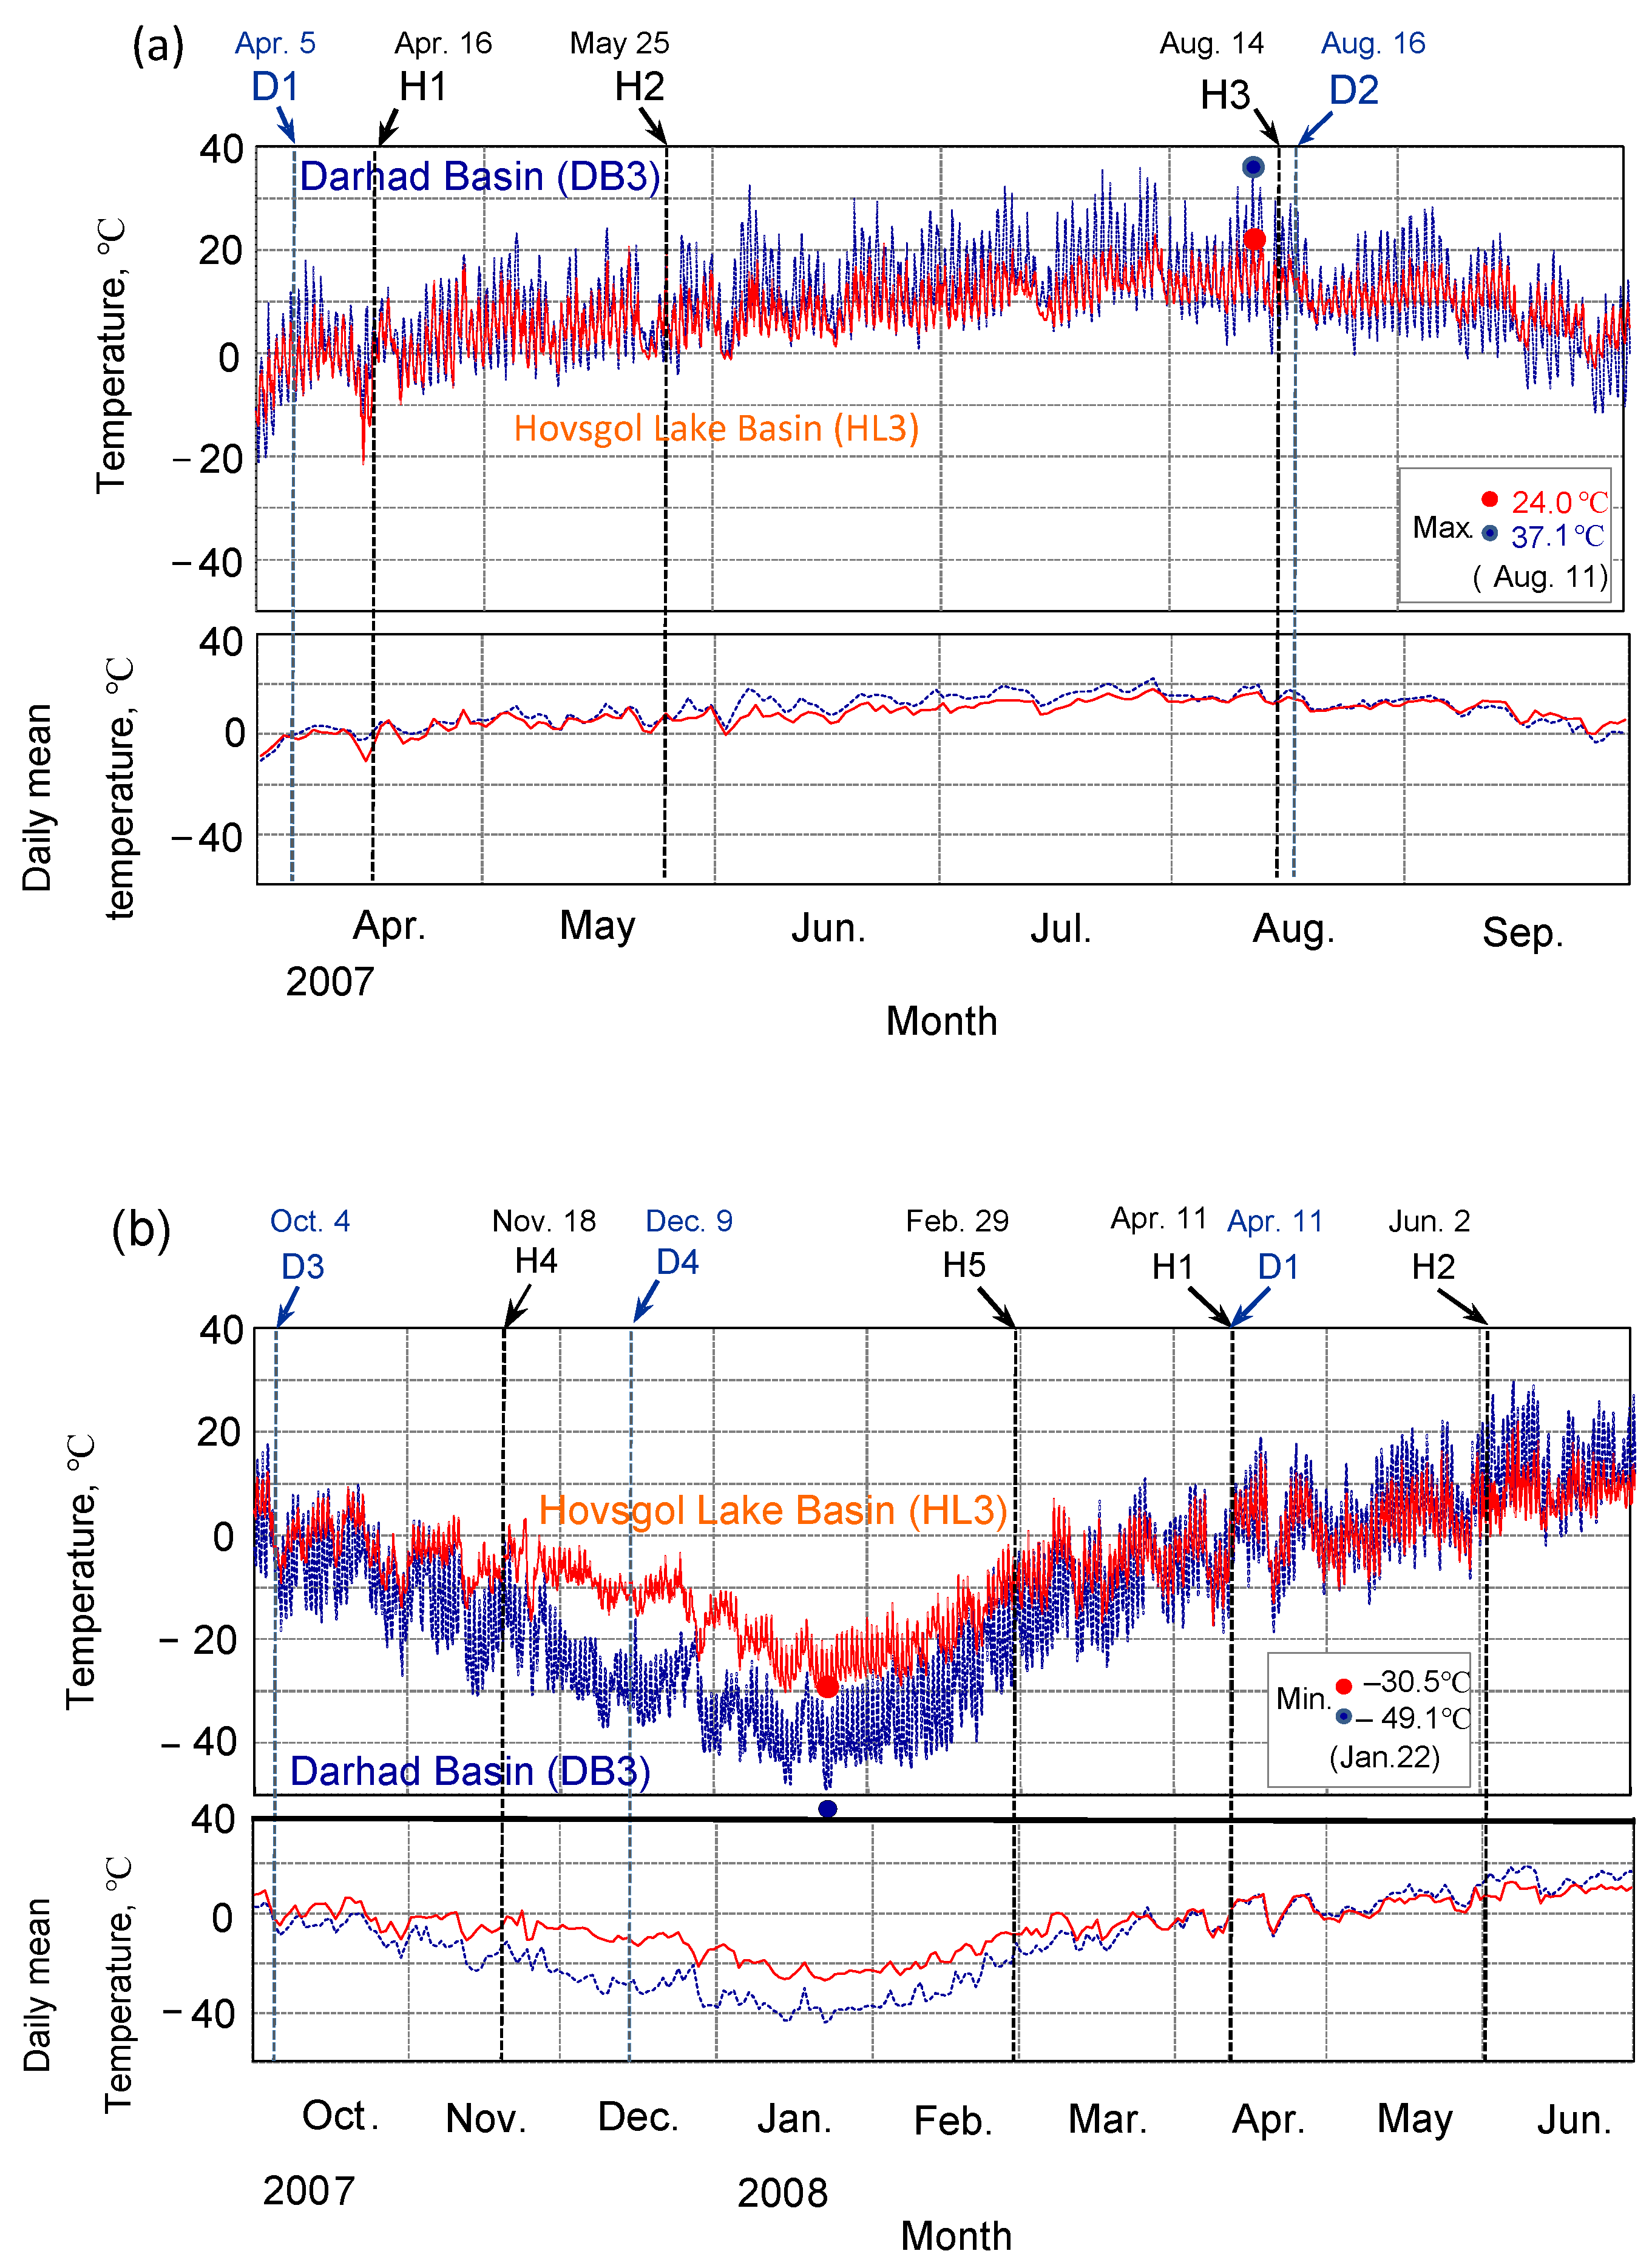
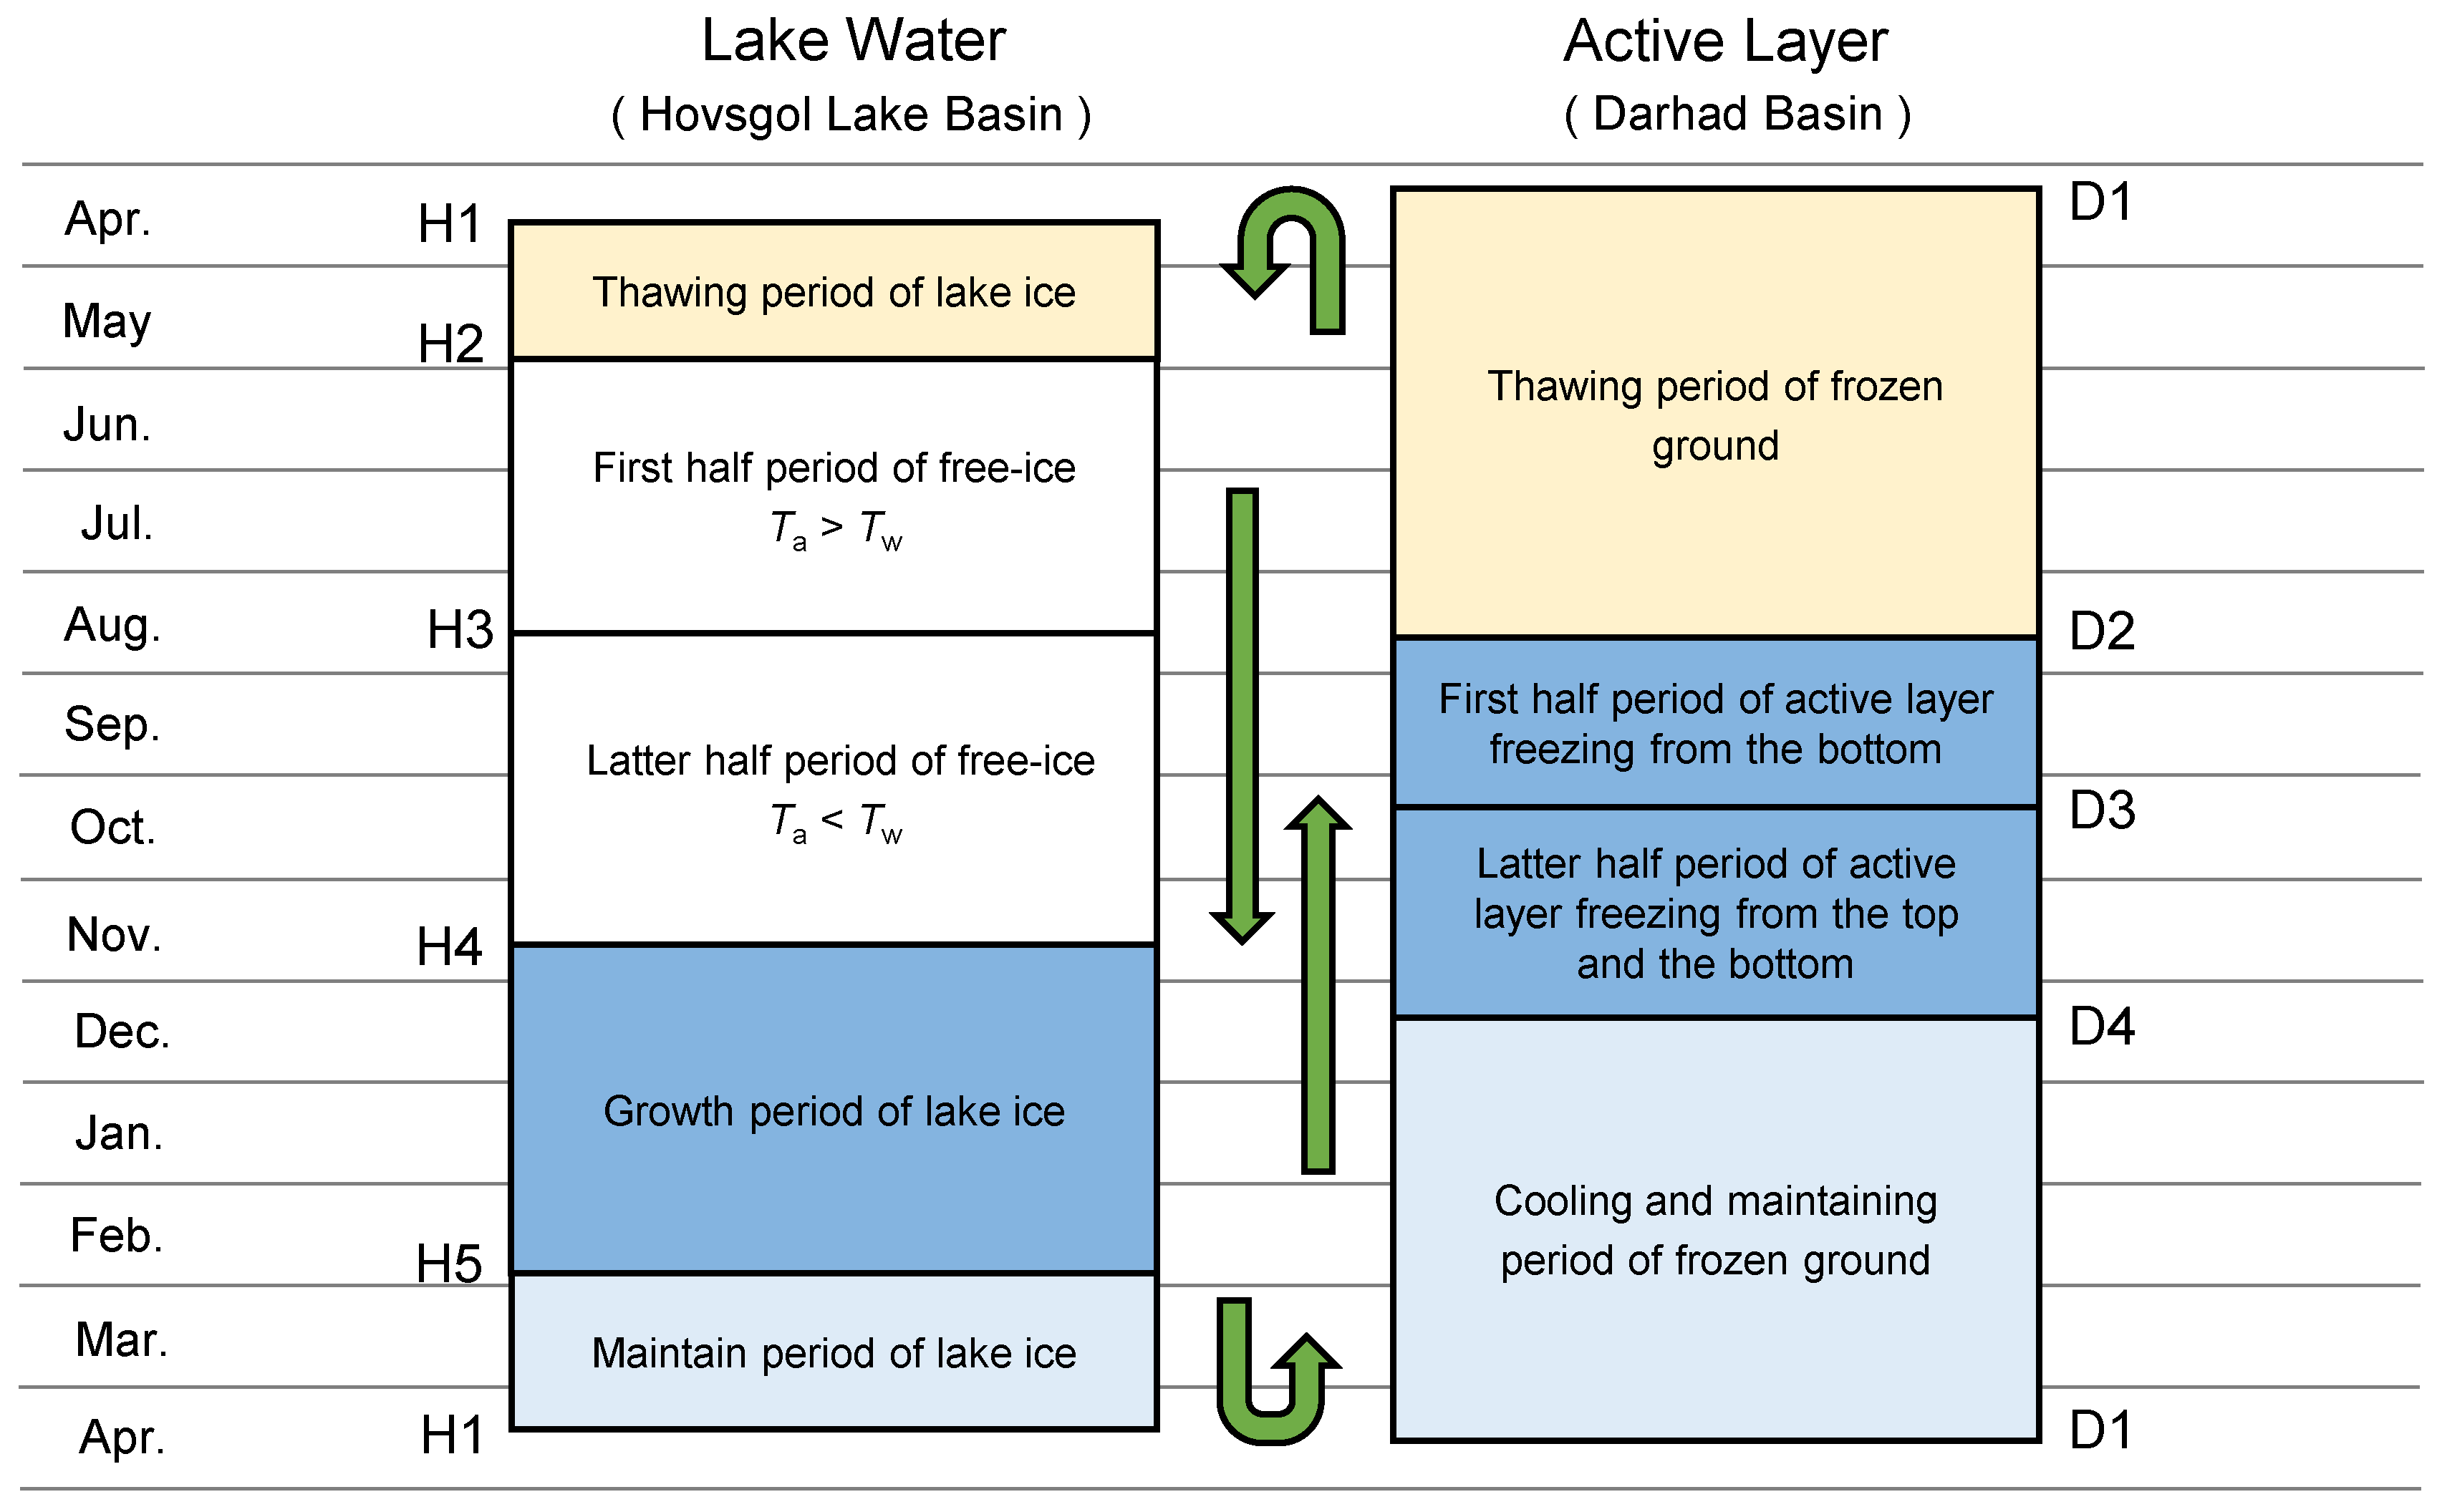
3.3. Timing of Freeze–Thaw Events
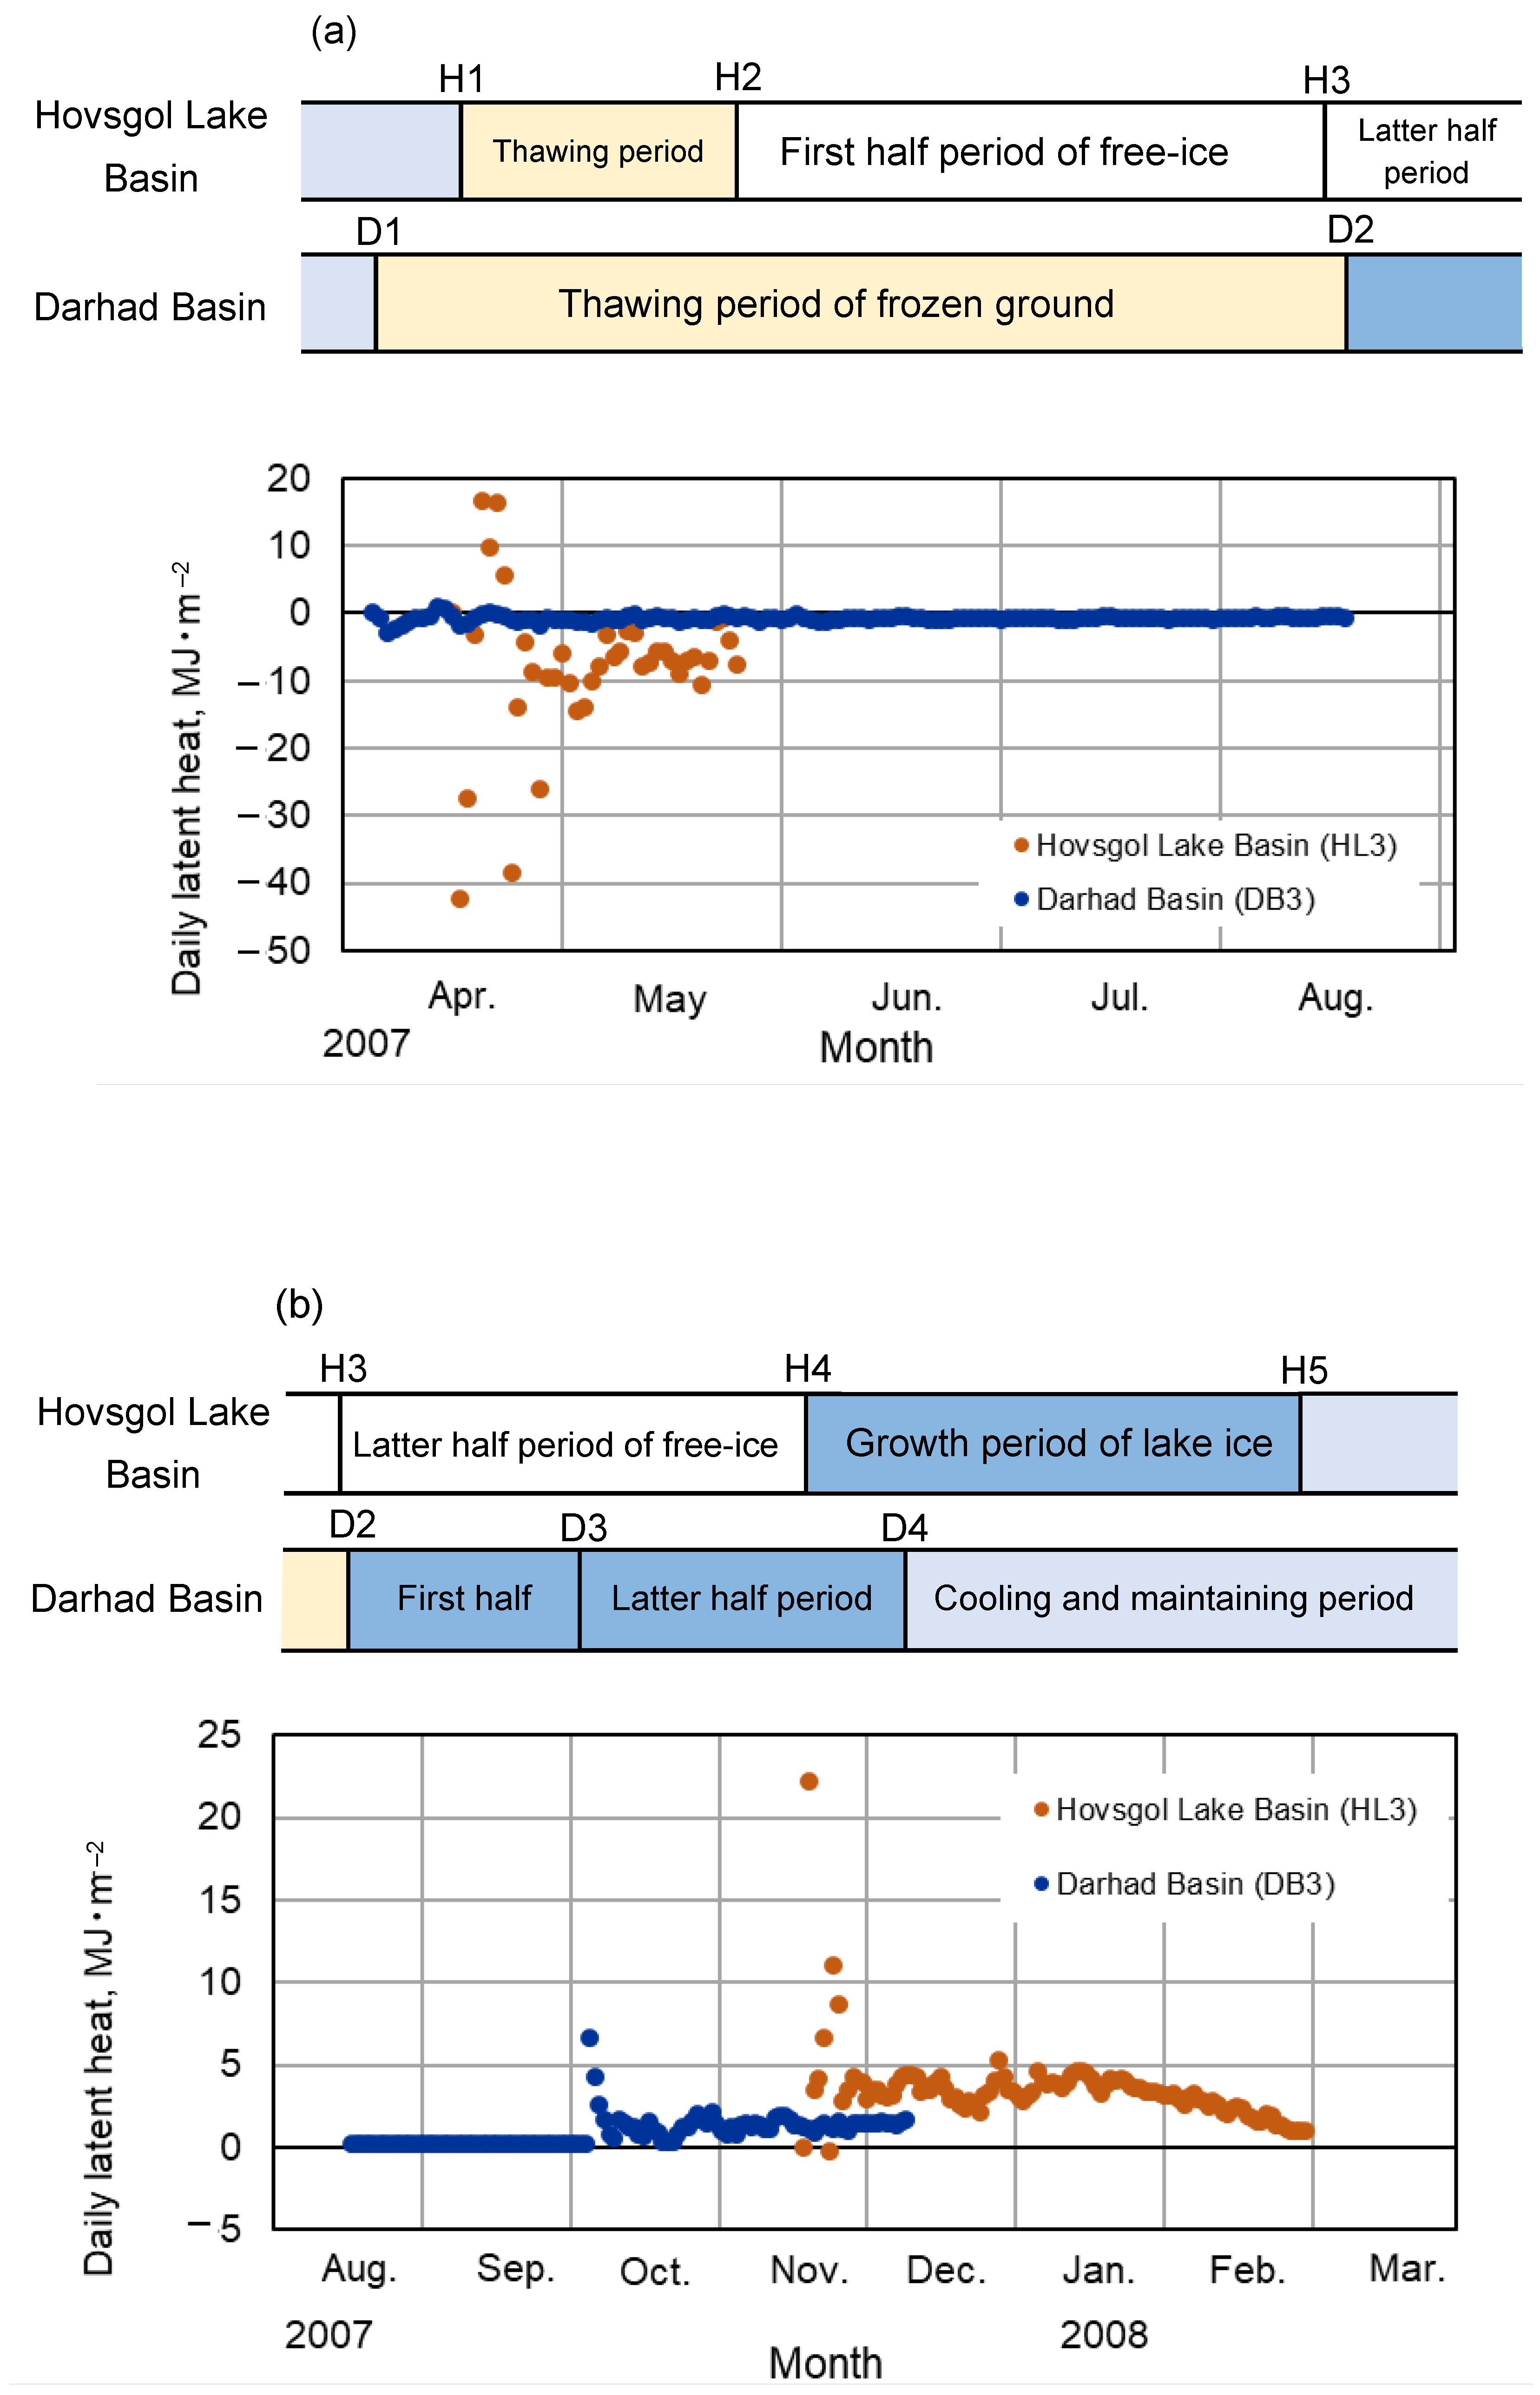
3.4. Differences in Latent Heat during Freezing and Thawing
3.5. Differential Freeze–Thaw Effects of Lake and Active Layer on the Meteorological Environment
4. Conclusions
Author Contributions
Funding
Institutional Review Board Statement
Informed Consent Statement
Data Availability Statement
Acknowledgments
Conflicts of Interest
References
- Batima, P.; Natsagdorj, L.; Gombluudev, P.; Erdenetsetseg, B. Observed Climate Change in Mongolia; AIACC: Ulaanbaatatr, Mongolia, 2005; Volume 25, p. 12. [Google Scholar]
- Chapman, W.; Walsh, J. Recent variations of sea ice and air temperature in high latitudes. Bull. Am. Meteorol. Soc. 1993, 74, 33–47. [Google Scholar] [CrossRef]
- Cohen, J.L.; Furtado, J.C.; Barlow, M.A.; Alexeev, V.A.; Cherry, J.E. Arctic warming, increasing snow cover and widespread boreal winter cooling. Env. Res. Lett. 2012, 7, 1–8. [Google Scholar] [CrossRef]
- Cohen, J.L.; Furtado, J.C.; Barlow, M.; Alexeev, V.A.; Cherry, J.E. Asymmetric seasonal temperature trends. Geophys. Res. Lett. 2012, 39, 1–7. [Google Scholar] [CrossRef]
- IPCC. Climate Change 2013: The Physical Science Basis: Contribution of Working Group I to the Fifth Assessment Report of the Intergovernmental Panel on Climate Change; Stocker, T.F., Qin, D., Plattner, G.K., Tignor, M., Allen, S.K., Boschung, J., Nauels, A., Xia, Y., Bex, V., Midgley, P.M., Eds.; Cambridge University Press: Cambridge, UK; New York, NY, USA, 2013; p. 1535. [Google Scholar]
- IPCC. Climate Change 2014: Synthesis Report: Contribution of Working Groups I, II and III to the Fifth Assessment Report of the Intergovernmental Panel on Climate Change; Core Writing Team, Pachauri, R.K., Meyer, L.A., Eds.; IPCC: Geneva, Switzerland, 2014; p. 151. [Google Scholar]
- IPCC. Climate Change 2021: The Physical Science Basis, Contribution of Working Group 1 to the Sixth Assessment Report of Intergovernment Panel on Climate Change; Cambridge University Press: Cambridge, UK; New York, NY, USA, 2021; pp. 3–32. [Google Scholar] [CrossRef]
- Noori, R.; Bateni, S.M.; Saari, M.; Almazroui, M.; Haghighi, A.T. Strong warming rates in the surface and bottom layers of a boreal lake: Results from approximately six decades of measurements (1964–2020). Earth Space Sci. 2022, 9, 14. [Google Scholar] [CrossRef]
- Noori, R.; Woolway, R.I.; Saari, M.; Merja, P.; Klove, B. Six Decades of Thermal Change in A Pristine Lake Situated North of the Arctic Circle; Earth and Space Science Open Archive: Published online, 2022; p. 21. [Google Scholar] [CrossRef]
- Chikita, K.A.; Oyagi, H.; Aiyama, T.; Okada, M.; Sakamoto, H.; Itaya, T. Thermal Regime of a Deep Temperate Lake and Its Response to Climate Change: Lake Kuttara, Japan. Hydrology 2018, 5, 17. [Google Scholar] [CrossRef]
- Elo, A.R.; Huttula, T.; Peltonen, A.; Virta, J. The effects of climate change on the temperature conditions of lakes. Boreal Environ. Res. 1998, 3, 137–150. [Google Scholar]
- Schindler, D.W.; Bayley, S.E.; Parker, B.R.; Beaty, K.G.; Cruikshank, D.R.; Fee, E.J.; Schindler, E.U.; Stainton, M.P. The effects of climatic warming on the properties of boreal lakes and streams at the Experimental Lakes Area, northwestern Ontario. Limnol. Oceanogr. 1996, 41, 1004–1017. [Google Scholar] [CrossRef]
- Sharkhuu, N. Recent Changes in the Permafrost of Mongolia. Proc. Eighth Int. Conf. Permafr. 2003, 2, 1029–1034. [Google Scholar]
- Vavrus, S.J.; Wynne, R.H.; Foley, J.A. Measuring the sensitivity of southern Wisconsin lake ice to climate variations and lake depth using a numerical model. Limnol. Oceanogr. 1996, 41, 822–831. [Google Scholar] [CrossRef]
- Yi, J.; Zhao, Y.; Shao, M.; Zhang, J.; Cui, L.; Si, B. Soil freezing and thawing processes affected by the different landscapes in the middle reaches of Heihe River Basin, Gansu, China. J. Hydrol. 2014, 519, 1328–1338. [Google Scholar] [CrossRef]
- Kira, T.; Kusaka, S. Forests of the world today. For. Environ. 2006, 6, 170–179. [Google Scholar]
- NOAA Satellite and Information Service. NCDC (National Climatic Data Center). Available online: https://www.ncdc.noaa.gov/cdo-web/ (accessed on 1 December 2021).
- Ishikawa, M.; Sharkhuu, N.; Zhang, Y.; Kadota, T.; Ohta, T. Ground Thermal and Moisture Conditions at the Southern Boundary of Discontinuous Permafrost, Mongolia. Permafrost and Periglacial Press (Jhon Wiley & Sons): Hoboken, NJ, USA, 2005; Volume 16, pp. 209–216. [Google Scholar] [CrossRef]
- Dorjgotov, D.; Orshih, N. (Eds.) Administration of Land Affairs, Geodesy and Cartography. In Geographic Atlas of Mongolia; Zurag Zuy Co. Ltd.: Ulaanbaatar, Mongolia, 2004; p. 61. [Google Scholar]
- James, T.M. Temperature sensitivity and recruitment dynamics of Siberian larch (Larix sibirica) and Siberian spruce (Picea obovate) in northern Mongolia’s boreal forest. For. Ecol. Manag. 2011, 262, 629–636. [Google Scholar] [CrossRef]
- Kew Science: Plant of the World Online. Available online: https://powo.science.kew.org. (accessed on 27 August 2022).
- Nandintsetseg, B.; Scott, J.; Goulden, C.E. Trends in extreme daily precipitation and temperature near Lake Hovsgol, Mongolia. Int. J. Climatol. 2007, 347, 341–347. [Google Scholar] [CrossRef]
- Goulden, C.E.; Sitnikova, T.; Gelhaus, J.; Boldgiv, B. The Geology, Biodiversity and Ecology of Lake Hovsgol (Mongolia); Backhuys Publishers Leiden, Backhuy Pub.: Liden, Netherlands, 2006; p. 525. ISBN 9057821621. [Google Scholar]
- Krivonogov, S.K.; Sheinkman, V.S.; Mistruykov, A. Stages in the development of the Darhad dammed lake (Northern Mongolia) during the Late Pleistocene and Holocene. Quat. Int. 2005, 136, 83–94. [Google Scholar] [CrossRef]
- Hayford, B.; Goulden, C.; Boldgiv, B. Spatial heterogeneity in macroinvertebrate density from Lake Hövsgöl, Mongolia. J. Species Res. 2013, 2, 159–166. [Google Scholar] [CrossRef]
- Gillespie, A.R.; Burke, R.M.; Komatsu, G.; Bayasgalan, A. Late Pleistocene glaciers in Darhad Basin, northern Mongolia. Quat. Res. 2008, 69, 169–187. [Google Scholar] [CrossRef]
- Brunello, A.J.; Molotov, V.C.; Dugherkhuu, B.; Goldman, C.; Khamaganova, E.; Strijhova, T.; Sigman, R. Lake Baikal: Lake Basin Management Initiative Experience and Lessons Learned Brief. In Proceedings of the Lake Basin Management Initiative Regional Workshop held at St. Michael’s College in Vermont, USA, Colchester, VT, USA, 18–21 June 2003; p. 26. [Google Scholar]
- Mongolian Meteorological Agency. Murun Weather Station; 2014. [Google Scholar]
- Wikipedia. Available online: https://en.Wikipedia.org/wiki/Lake_Khövsgöl (accessed on 16 August 2022).
- Sharkhuu, A.; Sharkhuu, N.; Etzelmüller, B.; Heggem, E.S.F.; Nelson, F.E.; Shiklomanov, N.I.; Goulden, C.E.; Brown, J. Permafrost monitoring in the Hovsgol mountain region, Mongolia. J. Geophys. Res. Earth Surf. 2007, 112, 1–11. [Google Scholar] [CrossRef]
- Stefan, J. Über die Theorie der Eisbildung, insbesondere über die Eisbildung im Polarmeere. (The theory of ice formation, especially regarding ice formation in the Polar Sea). Ann. Phys. Chem. 1891, 42, 269–286. [Google Scholar] [CrossRef]
- Smith, C.; Burn, C.; Tarnocai, C.; Sproule, B. Air and soil temperature relations along an ecological transect through the permafrost zones of northwestern Canada. In Proceedings of the Permafrost–7th International Conference, Yellowknife, Canada, 23–27 June 1998; Volume 55, pp. 1009–1015. [Google Scholar]
- Woo, M.-k.; Arain, M.A.; Mollinga, M.; Yi, S. A two-directional freeze and thaw algorithm for hydrologic and land surface modelling. Geophys. Res. Lett. 2004, 31, L12501. [Google Scholar] [CrossRef]
- Heggem, E.S.F.; Etzelmüller, B.; Anarmaa, S.; Sharkhuu, N.; Goulden, C.; Nandintsetseg, B. Spatial Distribution of Ground Surface Temperatures and Active Layer Depths in the Hovsgol Area, Northern Mongolia. Permafr. Periglac. Process 2006, 17, 357–369. [Google Scholar] [CrossRef]
- Nelson, F.E.; Outcalt, S.I. A computational method for prediction and regionalization of permafrost. Arct. Alp. Res. 1987, 19, 279–288. [Google Scholar] [CrossRef]
- National Astronomical Observatory. Rika Nenpyo (Chronological Scientific Tables); Marizen Co. Ltd.: Tokyo, Japan, 2021; p. 1174. ISBN 978-4-621-30560-7. [Google Scholar]
- Mackay, J.R. Active layer slope movement in a continuous permafrost environment, Garry Island, Northwest Territories, Canada. Can. J. Earth Sci. 1981, 18, 1666–1680. [Google Scholar] [CrossRef]
- Mackay, J.R. Downward water movement into frozen ground, western arctic coast, Canada. Can. J. Earth Sci. 1983, 20, 120–134. [Google Scholar] [CrossRef]
- Japan Society of Thermophysical Properties. Thermophysical Properties Handbook; Youkendo: Tokyo, Japan, 1990; p. 625. [Google Scholar]
- Gula, J.; Peltier, W.R. Dynamical downscaling over the Great Lakes Basin of North America using the WRF regional climate model: The impact of the Great Lakes System on regional greenhouse warming. J. Clim. 2012, 25, 7723–7742. [Google Scholar] [CrossRef]
- Notaro, M.; Holman, K.; Zarrin, A.; Fluck, E.; Vavrus, S.; Bennington, V. Influence of the Laurentian Great Lakes on regional climate. J. Clim. 2013, 26, 789–804. [Google Scholar] [CrossRef]
- Bartunkova, K.; Sokol, Z.; Pop, L. Simulations of the influence of lake area on local temperature with the COSMO NWP model. Atmos. Res. 2014, 147, 51–67. [Google Scholar] [CrossRef]
- Lang, J.; Ma, Y.; Li, Z.; Su, D. The impact of climate warming on lake surface heat exchange and ice phenology of different types of lakes on the Tibetan Plateau. Water 2021, 13, 634. [Google Scholar] [CrossRef]


| Parameter | Hovsgol Lake | Darhad Basin |
|---|---|---|
| Latitude | 50°30′N–51°35′N * (1) | 50°37′N–51°32′N |
| Area, km2 | 2750 * (2) | 2780 * (2) |
| Dimensions | ||
| N–S, km | 136 * (3) | 100 * (4) |
| E–W, km | 36.5 * (3) | 40 * (4) |
| Altitude, m a.s.l. | 1645 * (2) | 1540–1600 * (2) |
| Status | Lake * (2) | Dry Basin * (2) |
| Symbol | Meteorological Events | Date of Onset | |
|---|---|---|---|
| 2007 | 2008 | ||
| Hovsgol Lake Basin (HL3) | |||
| H1 | Thaw start of lake ice | 16 April | 11 April |
| H2 | Thaw end of lake ice | 25 May | 2 June |
| H3 | Air temperature decreases below lake water temperature * | 14 August | (14 August) |
| H4 | Freeze start of lake water | 18 November | (24 October) |
| H5 | Maximum thickness of lake water | (10 February) | 29 February |
| Darhad Basin (DB3) | |||
| D1 | Thaw start at the top of frozen ground | 5 April | 11 Aprilie |
| D2 | Maximum thickness of active layer (freeze start at the bottom of active layer) | 16 August | (14 August) |
| D3 | Freeze start at the top of active layer | 4 October | (30 September) |
| D4 | Freeze end of active layer | 9 December | (12 December) |
| Date or Value | Hovsgol Lake Basin | Darhad Basin |
|---|---|---|
| Thawing process | ||
| Thaw start date | 16 April 2007 | 5 April 2007 |
| Thaw end date | 25 May 2007 | 16 August 2007 |
| Adsorbed duration of thawing latent heat, months | 1.3 | 4.5 |
| Total latent heat amount, MJ m−2 | –305.9 | –102.4 |
| Freezing process | ||
| Freeze start date | 18 November 2007 | 16 August 2007 |
| Freeze end date | 29 February 2008 | 9 December 2007 |
| Released duration of freezing latent heat, months | 3.5 | 3.8 |
| Total latent heat amount, Mj m−2 | 361.0 | 102.4 |
Publisher’s Note: MDPI stays neutral with regard to jurisdictional claims in published maps and institutional affiliations. |
© 2022 by the authors. Licensee MDPI, Basel, Switzerland. This article is an open access article distributed under the terms and conditions of the Creative Commons Attribution (CC BY) license (https://creativecommons.org/licenses/by/4.0/).
Share and Cite
Takeda, K.; Sugita, A.; Kimura, M.; Caceres, M.L.L. Meteorological Effects of a Lake in A Permafrost Basin: Difference of Seasonal Freeze–Thaw Cycles in Hovsgol Lake and Darhad Basin, Northern Mongolia. Water 2022, 14, 2785. https://doi.org/10.3390/w14182785
Takeda K, Sugita A, Kimura M, Caceres MLL. Meteorological Effects of a Lake in A Permafrost Basin: Difference of Seasonal Freeze–Thaw Cycles in Hovsgol Lake and Darhad Basin, Northern Mongolia. Water. 2022; 14(18):2785. https://doi.org/10.3390/w14182785
Chicago/Turabian StyleTakeda, Kazuo, Akifumi Sugita, Masato Kimura, and Maximo Larry Lopez Caceres. 2022. "Meteorological Effects of a Lake in A Permafrost Basin: Difference of Seasonal Freeze–Thaw Cycles in Hovsgol Lake and Darhad Basin, Northern Mongolia" Water 14, no. 18: 2785. https://doi.org/10.3390/w14182785