
Attribution Analysis of Runoff in the Upper Reaches of Jinsha River, China
1
Bureau of Hydrology, Changjiang Water Resources Commission, Wuhan 430010, China
2
State Key Laboratory of Water Resources and Hydropower Engineering Science, Wuhan University, Wuhan 430072, China
3
Hubei Key Laboratory of Intelligent Yangtze and Hydroelectric Science, China Yangtze Power Co., Ltd., Yichang 443000, China
*
Author to whom correspondence should be addressed.
Water 2022, 14(17), 2768; https://doi.org/10.3390/w14172768
Submission received: 19 July 2022
/
Revised: 6 August 2022
/
Accepted: 18 August 2022
/
Published: 5 September 2022
(This article belongs to the Special Issue Hydrological Response to Climate Change)
Abstract
:The upper Jinsha River is an important ecological reserve and hydropower energy base in China. This paper uses relative importance analysis to analyze the causes of runoff changes from the perspectives of early runoff, rainfall, snowfall, evaporation and soil water content. The results show that the factors influencing runoff in the upper Jinsha River are complex and have significant spatial and temporal heterogeneity. From November to March, the main factor is the runoff in the preceding month, the contribution of which can be more than 85%; from April to May, the runoff is significantly affected by snow, and its contribution in May is more than 65%. The snow affecting the runoff is mainly located near Gangtuo station and Batang station, and its influence has a time lag of about one month, In June, the influence factors of the runoff are quite complicated, and the contribution of the early runoff, rainfall, snow, evaporation and soil water content is relatively close; from July to September, the runoff is mainly influenced by the rainfall above Batang station, its average contribution being more than 50% and higher than 80% in August. Runoff in July and August is mainly affected by the rainfall in the same period, and in September is mainly affected by the rainfall in the preceding month. In October, the main influence factors are runoff and rainfall of the preceding month, and their contributions are more than 70%.
1. Introduction
The Jinsha River is the largest hydropower base in China, with 112.4 million kilowatts of hydropower resources, accounting for about 16.7% of the national’s total, and 88.91 million kilowatts of exploitable hydropower resources. It occupies a very important position in China and plays a decisive role in China’s “sending power from west to east” strategy [1]. A total of 27 levels of hydropower plants are planned to be built along the Jinsha River, and 12 levels of hydropower plants have currently been stored, including four large hydropower plants in the lower reaches of Jinsha River: Wudongde, Baihetan, Xiluodu and Xiangjiaba [2]. In order to fully exploit the role of hydroelectric projects and use water resources efficiently, it is necessary to deeply understand the characteristics of runoff changes and response mechanisms in the Jinsha River basin.
Jinsha River is the source area of the Yangtze River, originating from the Tanggula Mountains in Qinghai, China, and belongs to the highland sub-cold humid zone. Due to the unique topography and climate, its hydrological process is affected by snowmelt, precipitation, evaporation, temperature and other factors at the same time, which makes the runoff formation process complex, with significant spatial and temporal heterogeneity, and sensitive to climate change [3,4,5,6,7]. The study shows that precipitation and evaporation are important factors for runoff changes in the upper Jinsha River [8,9,10], while the increase of meltwater due to the temperature rise is also an important reason for runoff changes, and the degradation of permafrost will change the surface flow production and infiltration processes, increasing the uncertainty of runoff changes [11,12,13,14]. In addition, because there are many hydraulic projects in the middle and lower reaches of the Jinsha River, the artificial disturbance is significant; conversely, there are few hydraulic projects in the upper reaches, and its runoff can be approximated as natural conditions. In general, the hydrological response mechanism under climate change has become a current hot issue, especially in climate-sensitive high-altitude and severe cold regions like the upper Jinsha River.
However, the current studies are more focused on the phenomenological analysis of runoff changes and the response of runoff to climate change and human activities [15,16,17,18,19,20,21]. The research on the contribution of climate factors to runoff at different times in the upper Jinsha River is still scarce, and there are many key scientific questions that need to be solved. The commonly used methods for studying the contribution of factors are hydrological models and statistical methods. Hydrological models are often used to study the contribution of human activities and climate change to runoff, and due to the influence of observation data, climate, topography, permafrost, and other factors, it is more difficult to run hydrological models in cold regions [16,17,18,19,20,21]. The commonly used statistical methods include the correlation coefficient, ANOVA, standardized regression coefficient, etc. The correlation coefficient can be used to qualitatively analyze the influence of factors on variables, but its error is relatively large and cannot be quantitatively analyzed. ANOVA, also known as F-test, is often used to test whether there is a difference between multiple overall means, i.e., to test whether the factors have an effect on the indicators. Although it can test whether the effect of the factors is significant through statistics, it is also unable to quantitatively analyze the contribution of the factors to the indicators [22]. The standardized regression coefficient method uses multiple independent variables and dependent variables to establish a multiple regression model, and the regression coefficients of each factor are obtained by standardizing the independent and dependent variables simultaneously. This method allows a qualitative comparison of the effects of each factor, but it does not take into account the correlation problem among the factors, and therefore cannot quantitatively analyze the contribution of each factor to the runoff. Based on this, this paper introduces the method of relative importance analysis [23,24], which aims to determine the contribution of different explanatory variables to the coefficient of determination in the regression model; in fact, the contribution to the coefficient of determination also reflects the contribution of different explanatory variables to the variance of the explained variable [25,26,27,28,29,30].
Therefore, this paper first analyzes the seasonal and interannual variation rules of water resources in the upper Jinsha River basin, and then establishes regression models using rainfall, snow depth, pre-flow, potential evaporation, soil water content and runoff in the upper Jinsha River, analyzing the contribution rates of different climate factors to runoff at different periods by using the method of relative importance analysis. Finally, the role of key factor analysis in water resources management is discussed.
2. Data and Methods
2.1. Reanalysis Data
Snow data: daily Chinese snow depth data from 1 January 1979 to 31 December 2019, with a spatial resolution of 25 km × 25 km, were used and processed as monthly data. The raw data used to invert the snow depth dataset were obtained from the Scanning Multichannel Microwave Radiometer (1979–1987), Special Sensor Microwave/Image (1987–2007) and Special Sensor Microwave Imager/Sounder (2008–2020) daily passive microwave bright temperature data (Equal Area SSMI Earth Grid) processed by the National Snow Ice Data Center (NSIDC). Since the three sensors are mounted on different platforms, there is some systematic inconsistency in the raw data. The temporal consistency of the bright temperature data is improved by cross-calibrating the bright temperature from three sensors, and then the snow depth inversion is performed using an algorithm modified for the Chinese region [31].
Evaporation and soil water content data: evaporation and soil moisture content data are provided by National Center of Environmental Prediction (NCEP), which uses a state-of-the-art analysis/forecasting system for data assimilation, using past data from 1948 to the present. Potential evaporation data and volumetric soil moisture data from the dataset are used to represent actual evaporation and soil moisture content changes, respectively, using a monthly-scale data set from January 1979–December 2019 with Gaussian grid (192 × 94) resolution.
2.2. Rainfall and Runoff Data
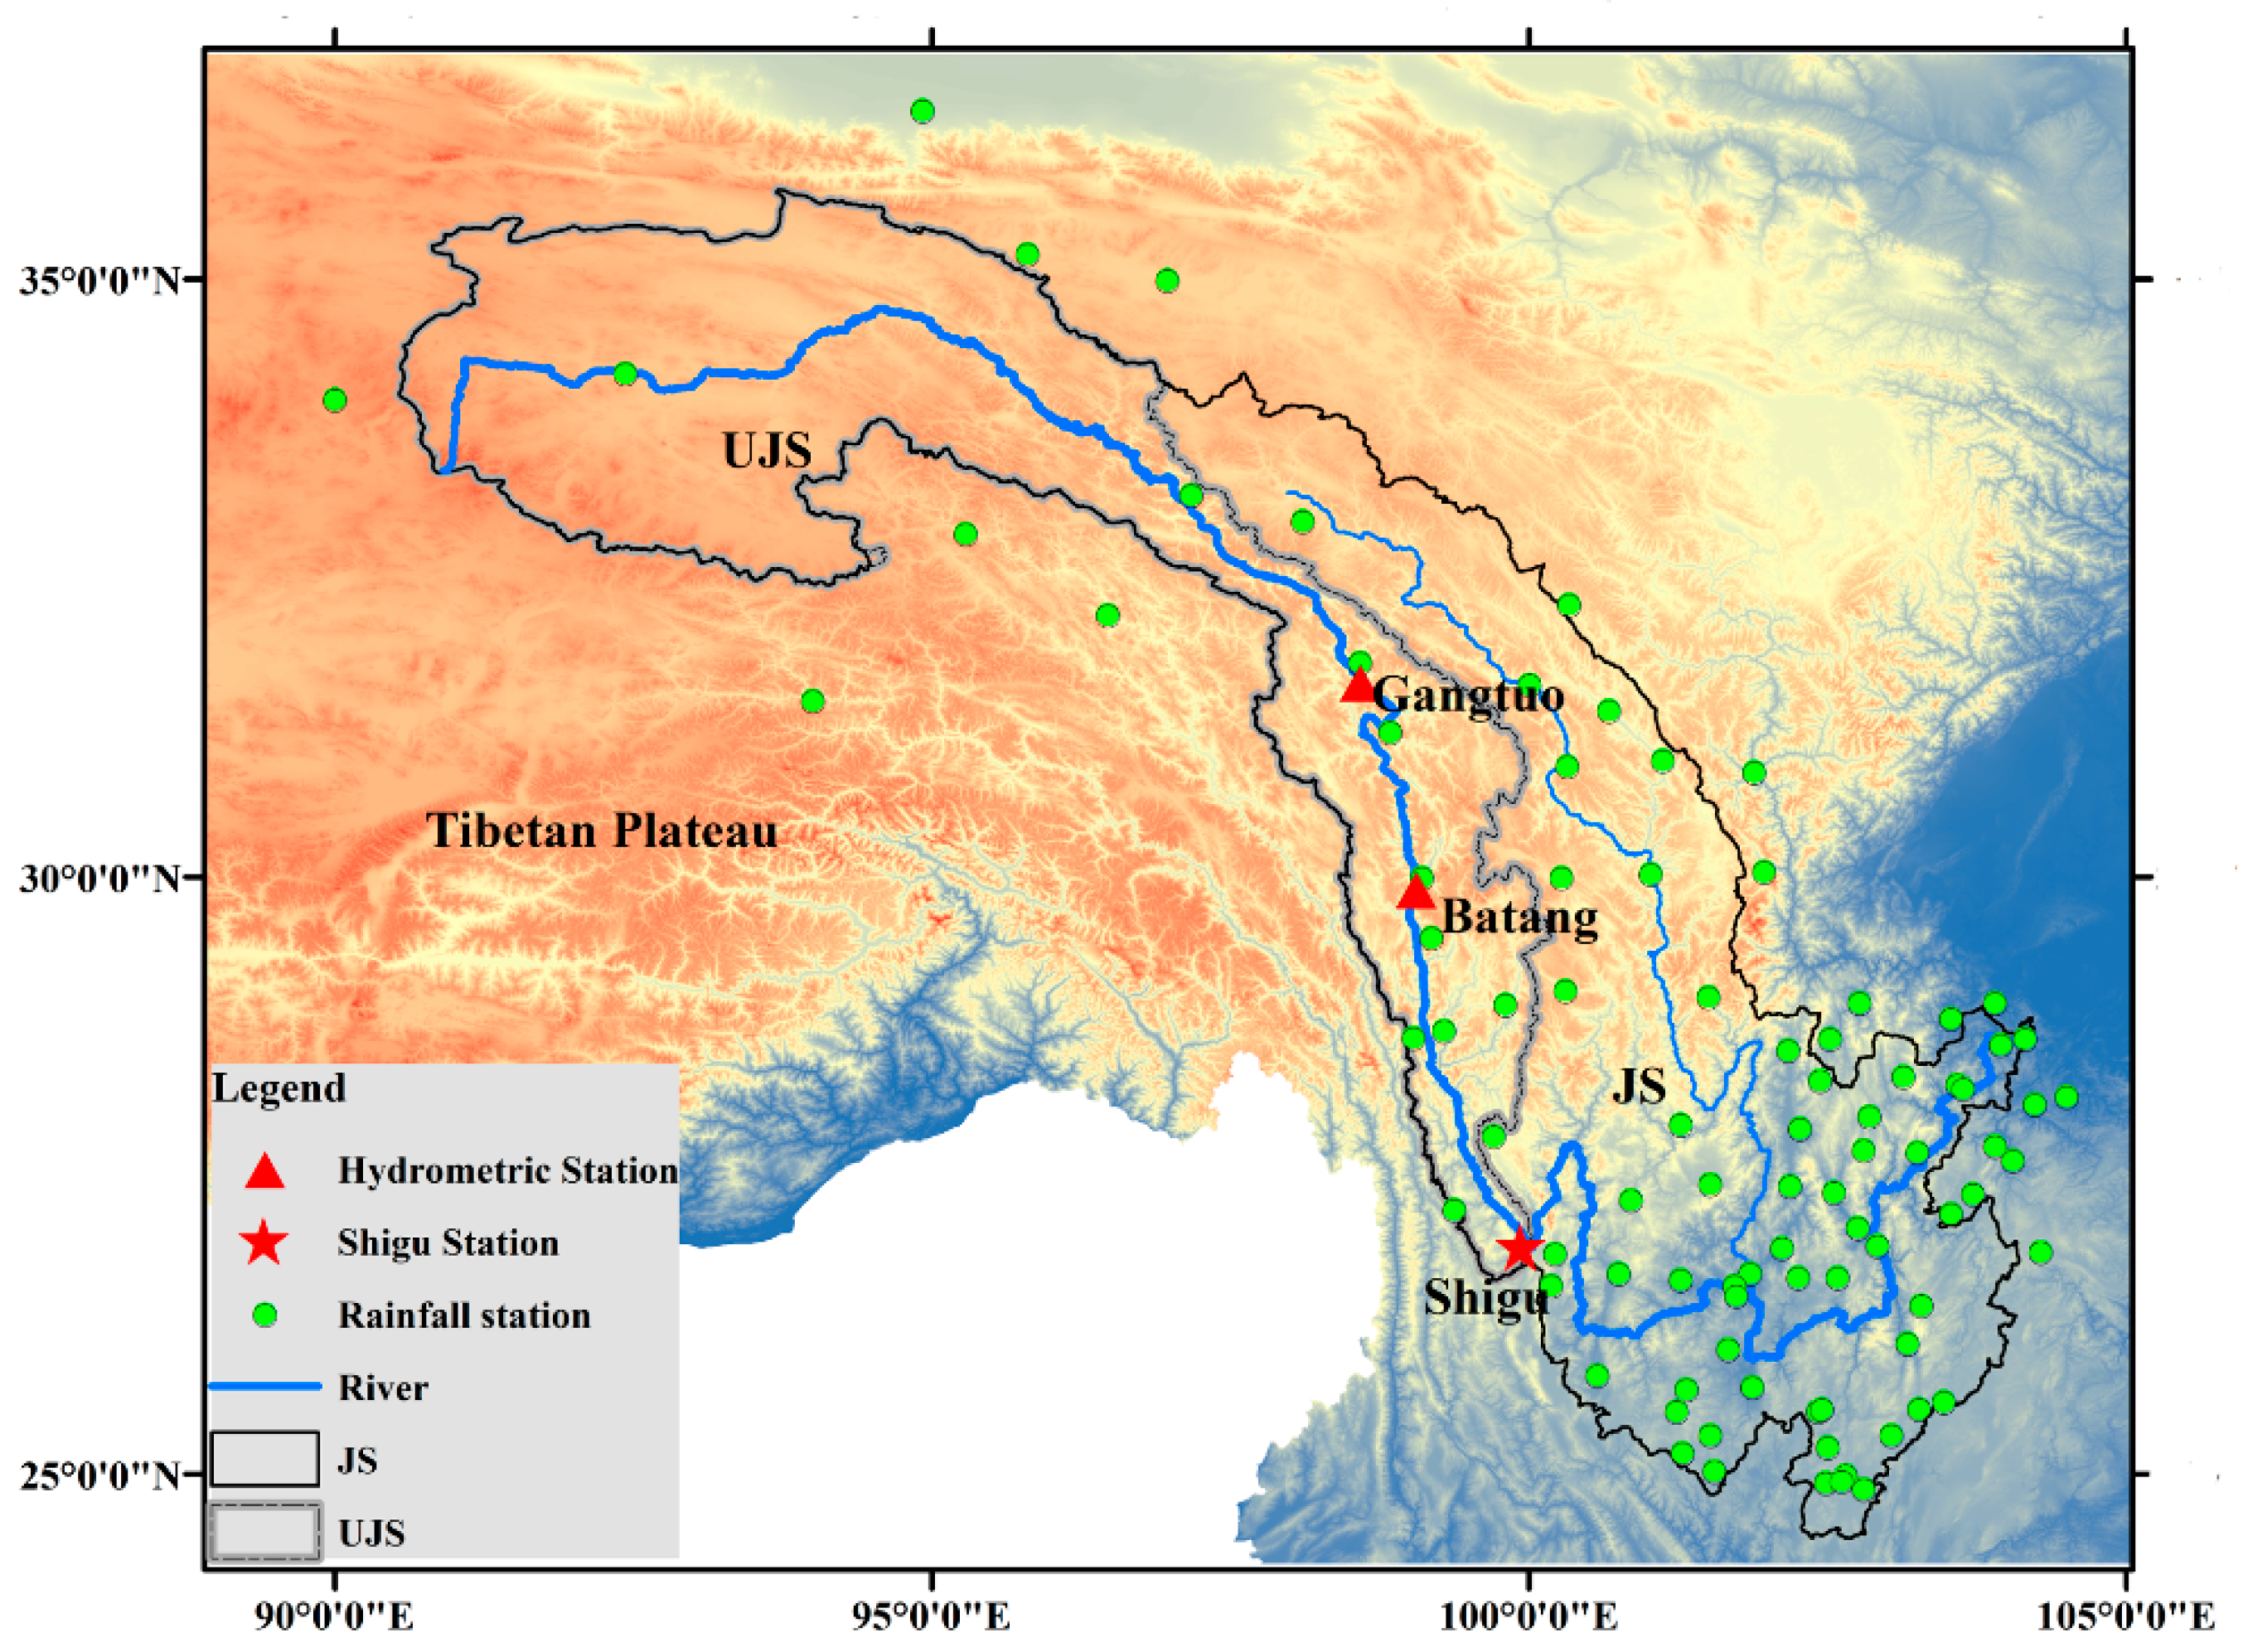
Rainfall data: the rainfall data used in this study are the daily rainfall station data of the Yangtze River basin from 1 January 1979 to 31 December 2019, produced by the Bureau of Hydrology, Changjiang Water Resources Commission and the Hubei Provincial Meteorological Bureau (the distribution of stations is shown in Figure 1), and all stations have passed the systematic quality control and homogeneity test to ensure the continuity and integrity of the data.
Runoff data: the runoff data are obtained from the actual measured runoff data of Shigu station from 1979 to 2019 by the Bureau of Hydrology, Changjiang Water Resources Commission. These are rectified data with good data quality and completeness. Shigu station is the upstream outlet station of Jinsha River, and since there was no large water conservancy project constructed in the upstream of Jinsha River before 2018, the runoff of Shigu station can be approximated as natural flow.
2.3. Relative Importance Analysis
Relative importance analysis (RI), also known as dominance analysis, is an analytical method widely used in finance, social sciences and other disciplines. Its basic idea is to compare the relative importance of different factors on the degree of explanation of the dependent variable after constructing a multiple regression model using multiple factors and the dependent variable [25,26,27,28,29,30]. This method separates the contributed by each of the multiple factors through calculating the variance of each factor on the dependent variable. It takes into account the correlation problem between the factors and calculates the relative effect size of each factor on the dependent variable after excluding the influence of other factors.
The linear regression model is assumed to be:
where y is the dependent variable, x is the different factors, is the error term, and m is the number of factors.
Then the R-squared of the regression model can be expressed as:
where TSS is the sum of squared deviations, which can be decomposed into the regression sum of squares (RSS) and the error sum of squares (ESS).
Since is an important goodness-of-fit statistic, the relative importance of different factors on the dependent variable can be determined by decomposing the degree of contribution of different factors to . According to Fields (2003), the contribution of a factor should be equal to its marginal effect on , and the marginal effect of on can be expressed as :
where S is other factors without . Since the coefficient of the regression usually changes after removing a factor, the coefficient of the regression without is denoted by *.
As can be seen, the equation is actually the of the complete regression, minus the of the regression without the . Since multiple subsets can be formed when the variable is removed, the marginal effect of the for each subset will be different. Therefore, to solve this problem, the final determination of the importance of the factor is the average of the results obtained for M! kinds of different subsets [26,27].
A ternary regression model is used as an example:
The of the model can be expressed as , denoted as , which represents the total of , and in the model. The contribution of to the model can be expressed using four subsets. The first approach is to solve the contribution of to y in the subset model: , i.e., . The second approach is to solve the contribution in the subset model: , i.e., . The third approach is to solve the contribution in the subset model: , i.e., . The fourth approach is to solve the contribution in the subset model: , i.e., . Clearly, the when , and are uncorrelated, but in practice the correlation coefficients of , and are usually not zero, which causes the contributions of different subsets to differ. Therefore, their average values are used to express the contribution of to , i.e.:
In the above example, the regression model contains only three factors, , and , so the calculation is relatively simple. When the model contains k factors, the original model corresponds to subsets, and it is necessary to calculate the relative contributions of the factors in all subsets separately, and then find their averages as the contribution of the factor.
To facilitate the analysis, this paper uses Tonidandel and LeBreton’s (2011) [28] method to standardize the RI values (SRI) of each factor. In the above ternary regression model, for example, after calculating , and , the standardized contributions are calculated using , and ; this means that the sum of the standardized contributions of the three factors is 1, thus making the relative importance of each factor easily to compare.
3. Results
3.1. Analysis of Water Resources Characteristics of the Upper Jinsha River
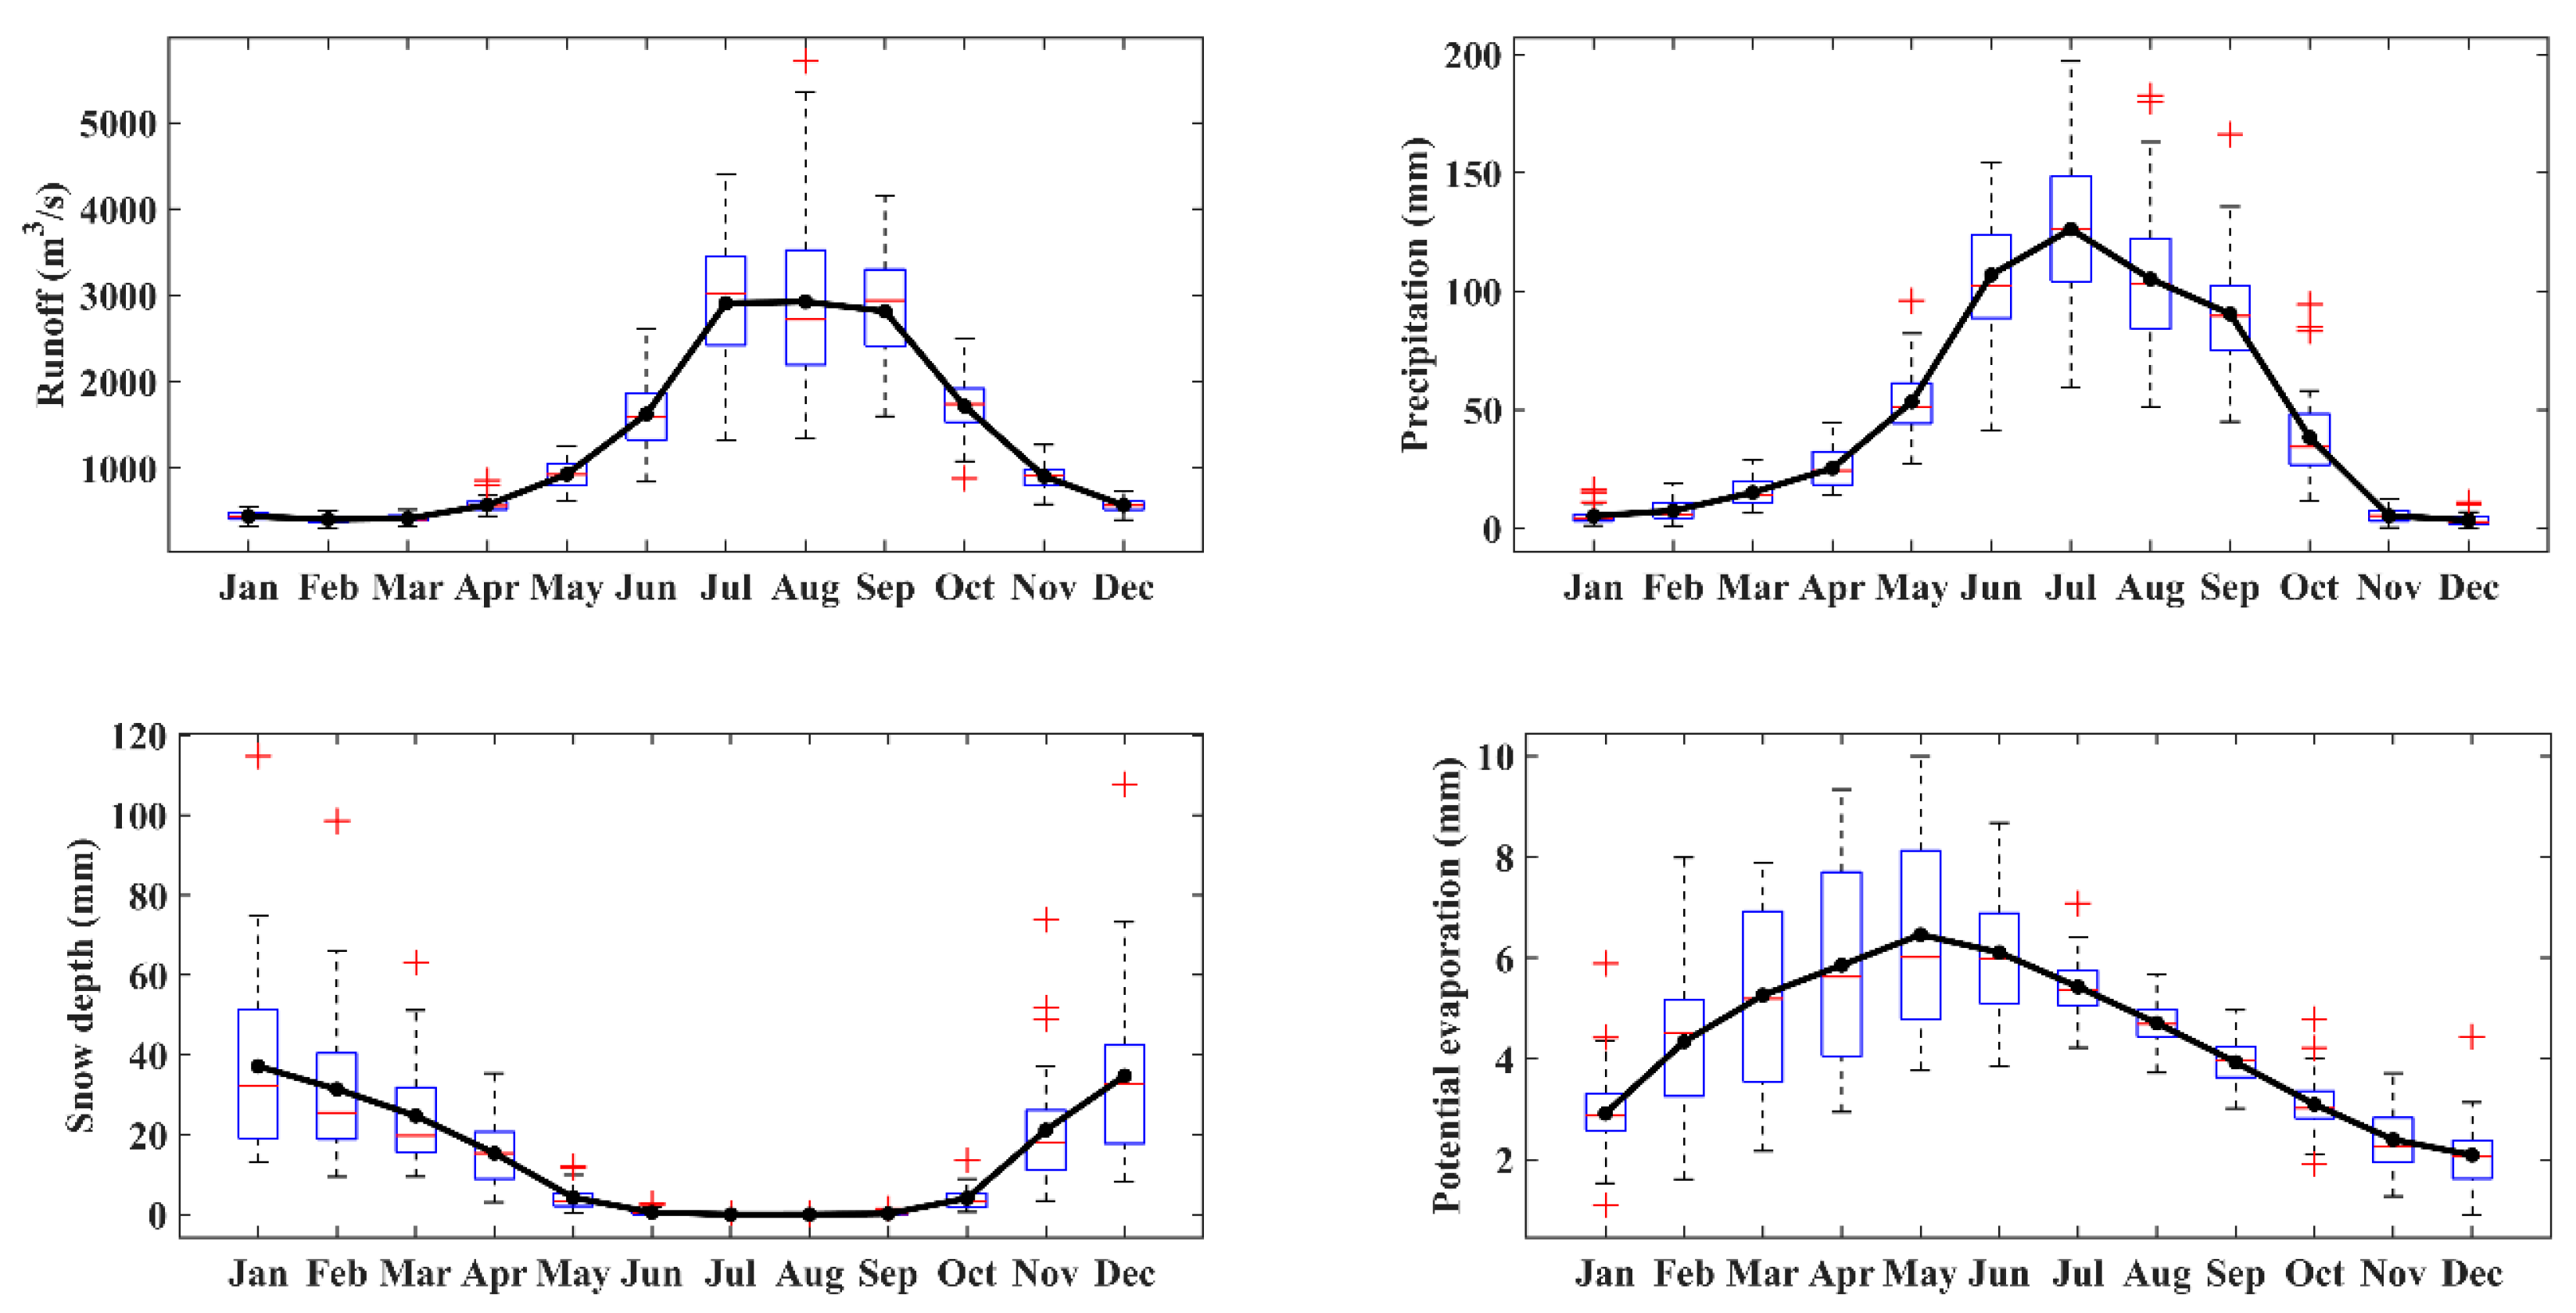
The upper Jinsha River is located in the eastern part of the Tibetan Plateau, and the direct influencing factors of its runoff are rainfall, snowmelt and evaporation. Therefore, Figure 2 shows the seasonal variation of flow at Shigu Station, surface rainfall, snow depth and potential evaporation in the upper reaches of Jinsha River. It can be seen that the flow at Shigu station is largest in July, August and September, mostly between 2000–4000 m3/s, and the interannual fluctuation is also the largest. In June and October, the flow is significantly reduced, mostly being between 1000 and 2000 m3/s, and its interannual fluctuation is also significantly reduced. From November to May, the flow is significantly smaller, basically below 1000 m3/s, with stable interannual variation. From the rainfall distribution, June to September is the period of high value in the upper Jinsha River. The average rainfall value and fluctuation range are highest in July, followed by May and October, and the rainfall from November to April is the lowst. It is found that there is an obvious mismatch between rainfall and runoff in the upper reaches of the Jinsha River. For example, the average value of rainfall in June is higher than that in August and September, but the average value of flow at Shigu station is only half of that in August and September, which is mainly due to the little precipitation and low soil water content in the upper Jinsha River before June, so that a large amount of rainfall in June is absorbed by the soil. From the snow depth characteristics, it may be determined that the snow in the upper Jinsha River is the deepest in winter (December to February), with an average of 30~40 mm, and it basically melts during June to September, among which March to May is the period of rapid snow melting, and October to December is the snow frozen period. From the potential evaporation characteristics, the peak of potential evaporation in the upper Jinsha River occurs in May, about 6 mm on average, and the potential evaporation before and after May shows a significant decreasing trend. Based on the results of the above analysis, the flood season in the Jinsha River basin is divided into June–October and the dry season is November–May, and the flood and dry periods in the following text are consistent if not stated separately.
From the perspective of interannual variation (Figure 3), during the flood season, the accumulated precipitation of the upper Jinsha River basically ranges from 400 to 600 mm and the average flow of Shigu station basically ranges from 1500 to 3000 m3/s. There is an obvious consistency between the annual fluctuations in these factors (correlation coefficient reaches 0.63, passing the 99% significance test), but the annual change trend is not obvious. The snow depth in the upper Jinsha River is basically below 3 mm, and the annual change trend is not significant, but its annual fluctuation is obvious. The potential evaporation in the upper Jinsha River basically fluctuates between 17 and 30 mm, and its annual fluctuation is relatively weak, but the annual variation has a significant weakening trend (−1.7 mm/10a). During the dry season, rainfall in the upper Jinsha River mostly ranges from 80 to 140 mm, with a significant increasing annual change trend (6.6 mm/10a), while the flow mostly ranges from 500 to 800 m3/s, with a weak trend of annual change, and the consistency change between rainfall and flow is significantly weakened (correlation coefficient is 0.21). The snow depth is mostly in the range of 15–50 mm, which fluctuates significantly before 2000, and decreases significantly and changes more steadily after 2000. The potential evaporation of the basin is mostly in the range of 15~40 mm, and there is a sudden change point around 2000, and the evaporation is large before 2000 and decreases significantly after 2000.
3.2. Runoff Correlation Analysis
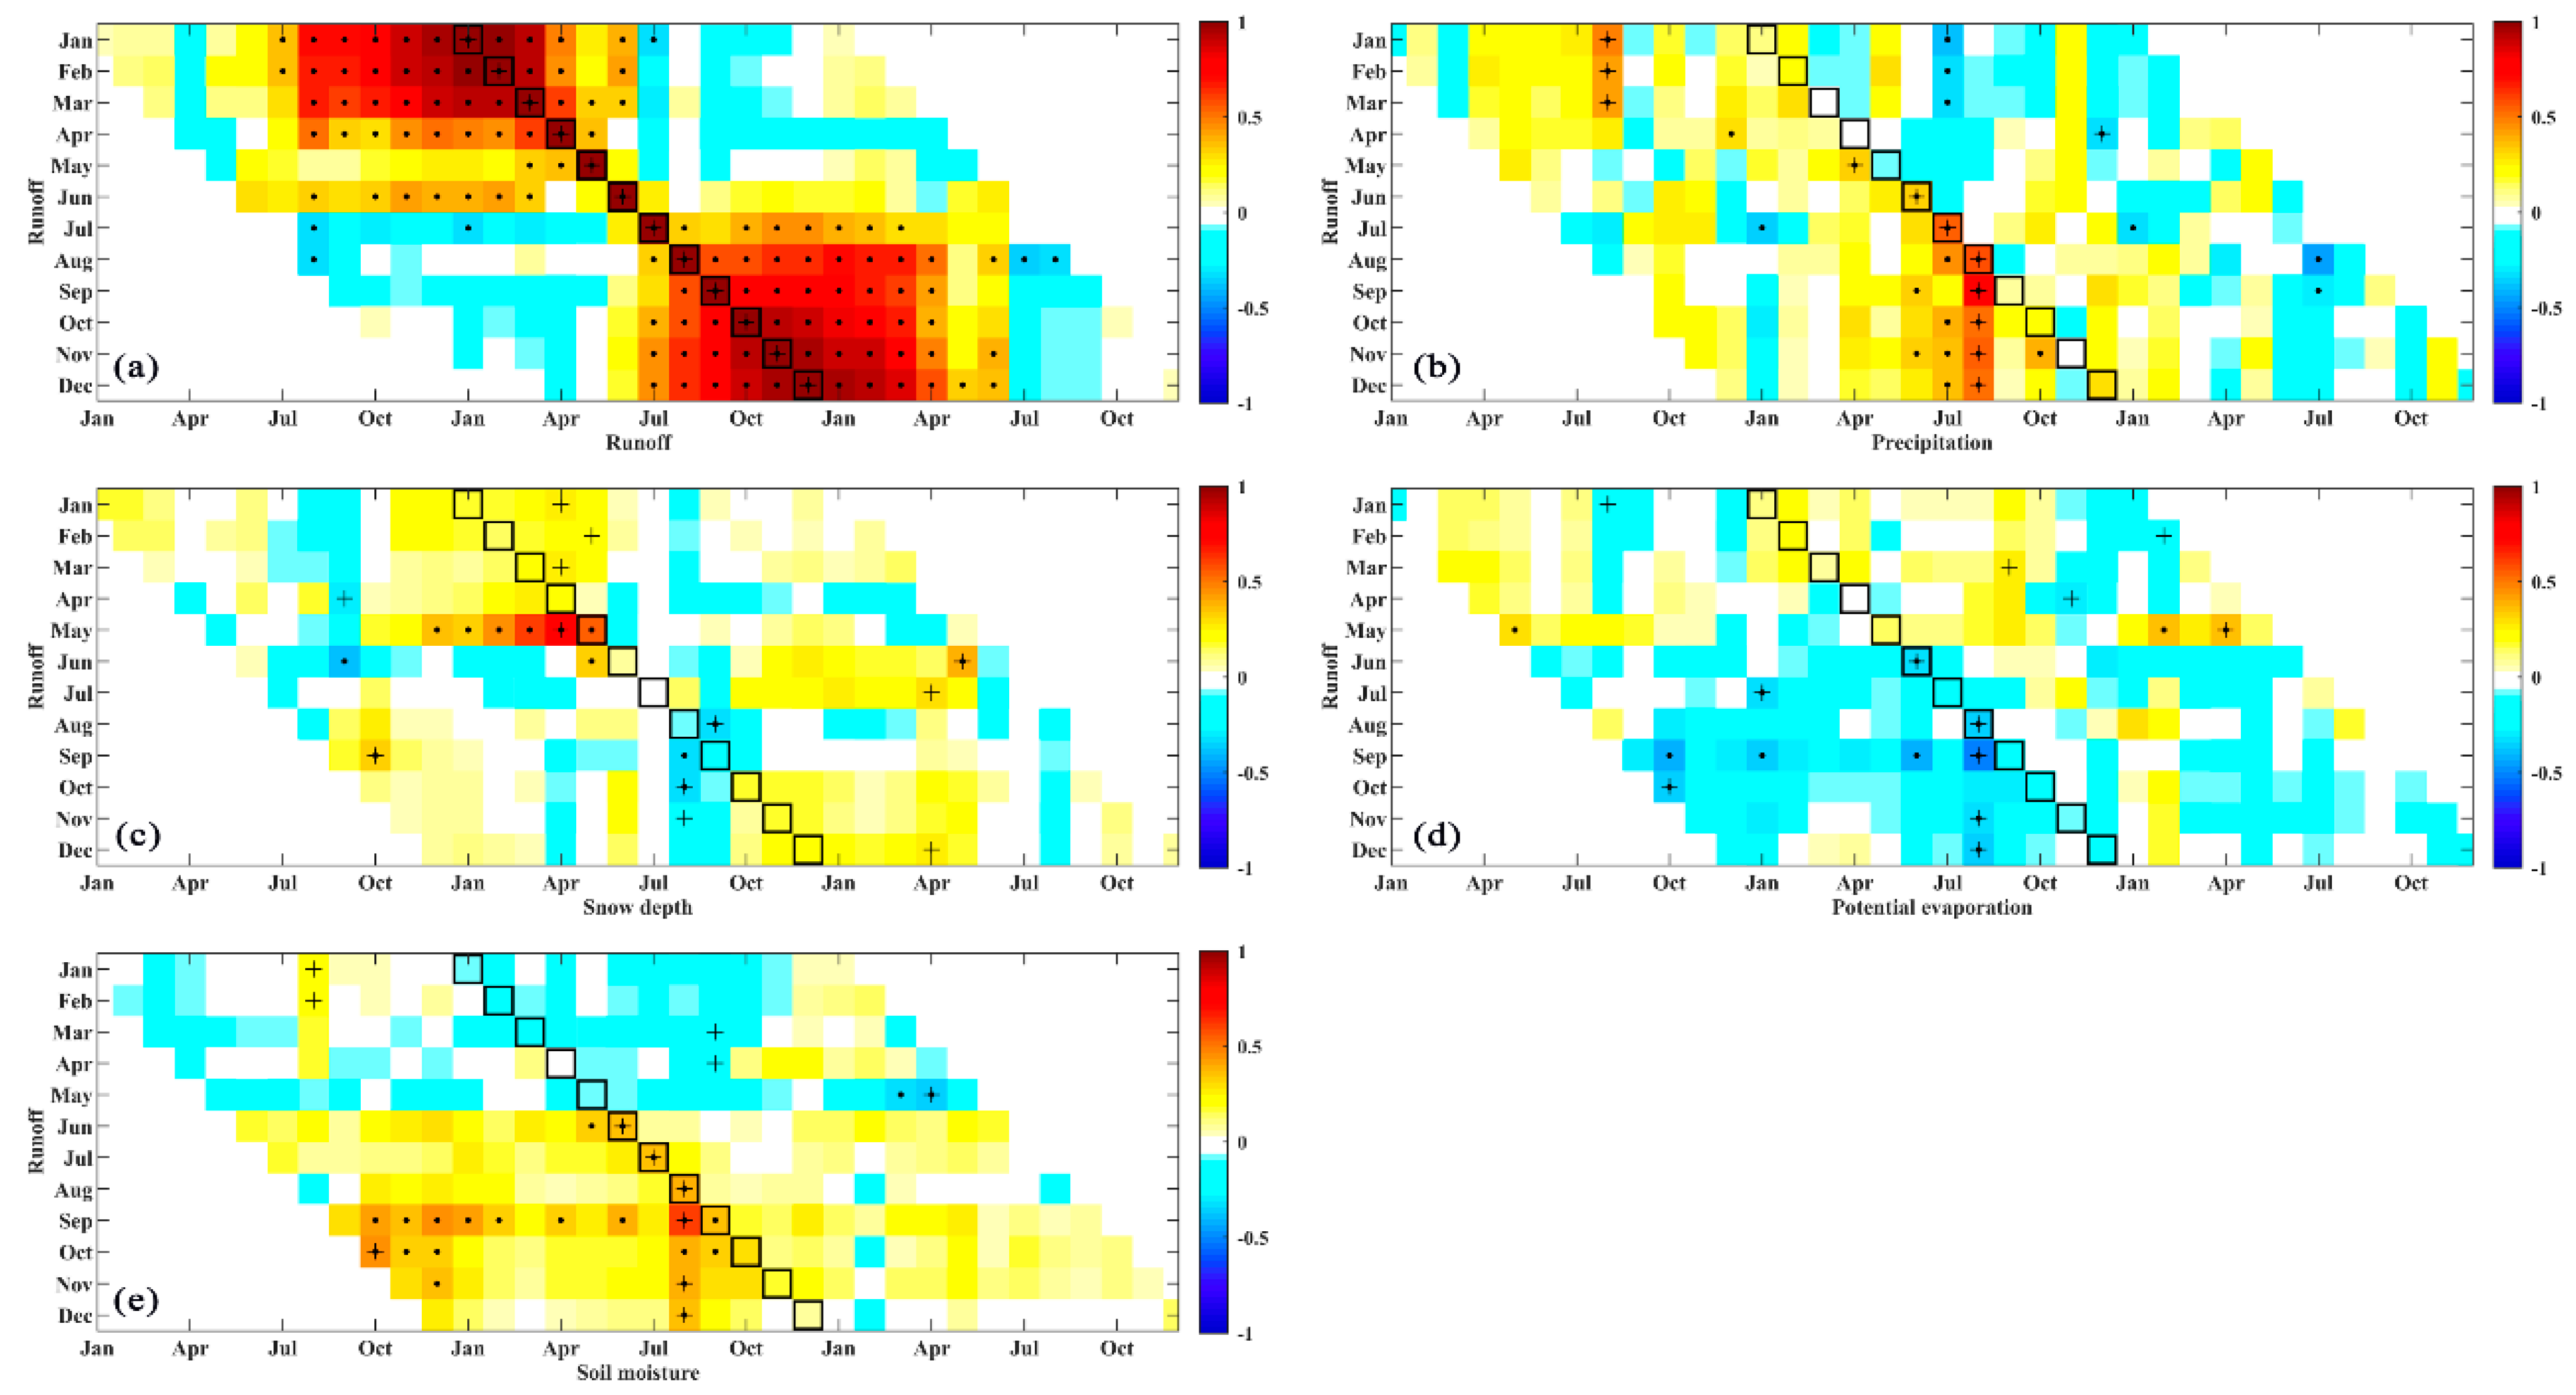
Correlation analysis is an effective method to study the influencing factors of runoff changes. Figure 4 reflects the lead–lag correlation between runoff at Shigu station and the direct influencing factors of runoff, such as previous runoff, precipitation, snow, evaporation, and soil water content, from 1979 to 2019. In the figure, the area on the left side of the box indicates the lead correlation between previous factors and runoff, the box indicates the contemporaneous correlation, and the area on the right side of the box indicates the lag correlation.
The runoff autocorrelation analysis shows (Figure 4a) that from August to April, there is a high positive correlation between the runoff of each month at Shigu station, with the correlation coefficient above 0.6, and that the correlation is more significant from October to March. In terms of the forward correlation, the flow of Shigu station from September to April has the strongest correlation with the runoff of the previous month, while the runoff from May to August has a significantly lower correlation with early runoff. This indicates that the runoff of the last month is an important factor affecting the runoff of Shigu from September to April, while this influence is significantly weakened from June to August.
The lead-lag correlation analysis of precipitation and runoff shows (Figure 4b) that the precipitation from June to August is significantly positively correlated with the runoff at Shigu station in the same period, while the correlation is weak from September to May, indicating that the precipitation from June to August has an important influence on the runoff in the same period, and that the influence is smaller in the remaining months. The correlation between snow depth and runoff shows (Figure 4c) that April snow has a strong positive correlation with May runoff, while April is the most significant month for snowmelt in the upper Jinsha River (Figure 2). This indicates that snowmelt is an important factor affecting runoff during the snowmelt period, and that there is a lag of about one month in the effect of snowmelt on runoff. The potential evaporation in the upper Jinsha River is not significantly correlated with the runoff in the same month during the dry period (Figure 4d), while in June and August they have a significant negative correlation. Similar to evaporation, the correlation between runoff and soil water content in the same month is weaker during the dry period (Figure 4e), while there is a significant positive correlation from June to August.
It is noteworthy that August precipitation, soil water content and evaporation are well correlated with the September–December runoff. This is because on the one hand there is a significant positive correlation between August precipitation and September runoff, while there is a high positive correlation between the runoff of each month from September to April. On the other hand, potential evaporation and soil water content are closely related to precipitation, and August precipitation significantly affects evaporation and soil water content in the same period.
The results in Figure 4 show that runoff in the last month, precipitation in the last and the same month, snow in the last and the same month, evaporation in the same month, and soil water content in the same month have the most obvious influence on the runoff at Shigu station, so the correlation coefficients between the runoff of each month at Shigu station and these factors are calculated in Table 1. For the convenience of analysis, the runoff in the last month is called RUL, the precipitation in the last month is called PRL, the precipitation in the same month is called PRS, the snow depth in the last month is called SNL, the snow depth in the same month is called SNS, the evaporation in the same month is called EVS, and the soil water content in the same month is called SOS in the latter part of the paper. As can be seen from the table, the correlation coefficients between runoff and RUL are above 0.9 from November to March, with a very high consistency of change, while the correlation coefficients in September, October and April are between 0.57 and 0.72, and the correlation coefficients in May to August are significantly smaller. For precipitation, the correlation coefficients between July and August rainfall and runoff in the same month are 0.54 and 0.57, respectively, while the correlation coefficient between August rainfall and September runoff is as high as 0.80, indicating that August rainfall has a lag in producing flow, and that it has an important influence on September runoff. For snow, the correlation coefficient between the May runoff and April snow is as high as 0.74, which indicates the important influence of snowmelt on runoff in May. The high correlation coefficients of evaporation and soil water content were mainly in June-August, further verifying the view of Figure 4.
3.3. Analysis of the Causes of Runoff
3.3.1. Monthly Contribution Analysis
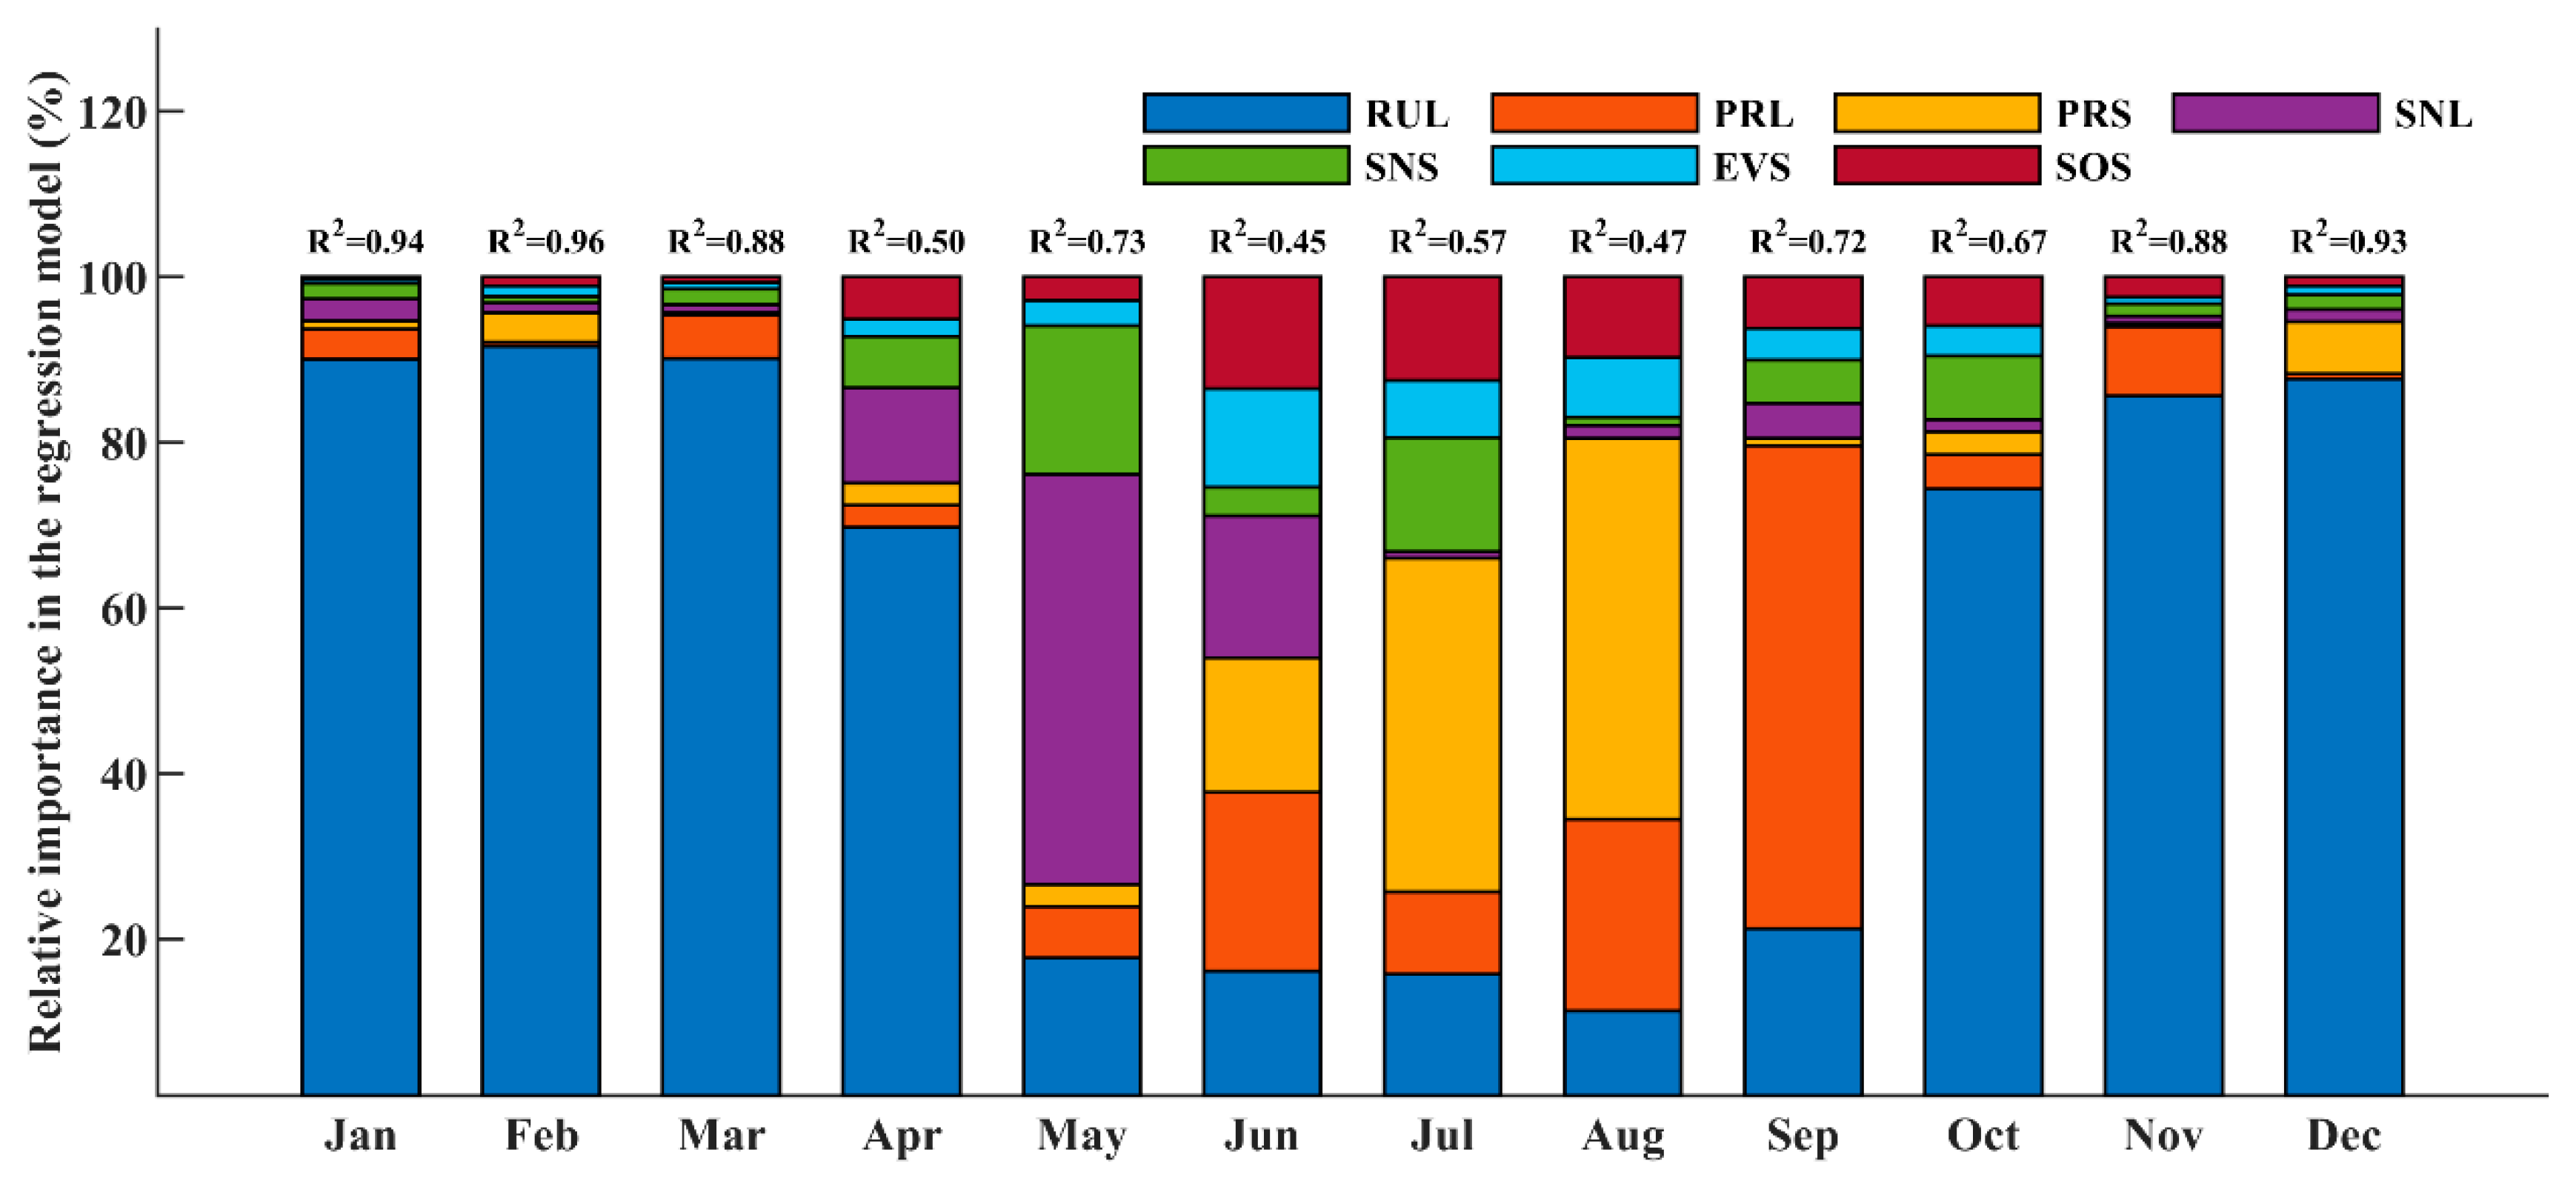
The regression equation was established using the factors in Table 1 and runoff, and the relative importance analysis was used to study the contribution of each factor to runoff (Figure 5). As we can see, the R-square of the model from November to March is around 0.9, which indicates that the model can simulate the runoff quite well in the dry season. From April to October, the R-square is all above 0.5 except for 0.45 in June and 0.47 in August, which indicates that the model can also simulate runoff relatively well in the flood period. Therefore, it is reasonable and reliable to analyze the contribution of different factors to runoff based on this model.
As can be seen from Figure 5 and Table 2, the most important factor affecting runoff from November to March of the following year is the RUL, whose contribution is basically above 90%; in October and April, the RUL also plays a major role, with a contribution of about 70–80%; May is the rapid snowmelt period in the upper Jinsha River, and the SNL has the greatest influence on runoff at this period, with a contribution of about 50%, and the influence of the SNS and the RUL is about 18%, while the rest of the factors have a weak influence. In June, the factors affecting the runoff are very complex, and the contribution of the RUL, PRS, SNL, EVS and SOS to the runoff is relatively close, all in the range of 15% to 20%; in July, PRS has the most significant impact on the runoff, with a contribution of about 40%, while the RUL, SNS and SOS each contribute about 15%. In August, precipitation has the most significant impact on runoff, in which the contribution of PRS reaching about 46% and PRL reaching about 23%; in September, PRS has the most significant impact on runoff, with the contribution of about 58%, followed by the RUL, and the remaining factors have a weak impact.
Overall, the most significant factor affecting the runoff is the RUL in November–March, the SNS in May, the PRS in July and August, and the PRL in September. In fact, during the dry period, the Jinsha River receives little rainfall, and the snow is in a frozen state, so the runoff in each month is more likely to remain stable, which increases the contribution of the RUL.
3.3.2. Analysis of Key Areas
The effects of spatially averaged factors on runoff were analyzed in the previous section, but considering the variability of factors in spatial distribution, the averaged factors may smooth the signals of factors in key areas. As such, this section focuses on analyzing the variability of the effects of each factor on runoff under a different spatial distribution. Since the results in Figure 6 show that potential evaporation and soil water content contribute relatively little to runoff at Shigu station in all months, this section mainly analyzes the influence of spatial distribution of rainfall and snow depth on runoff.
- RUL influence period
The analysis in Section 3.3.1 shows that from November to March, the contribution of the RUL to the runoff is more than 90%, while the influence of other factors is weak and can be ignored, and the overall variance explanation rate of the model is more than 90%. In April and October, the main factor affecting the runoff is also the RUL. The R2 of the model in October is 0.67, indicating that the RUL does have an important impact, but the R2 of the model in April is 0.5, and its influence factor needs further analysis.
- 2.
- Snowmelt influence period
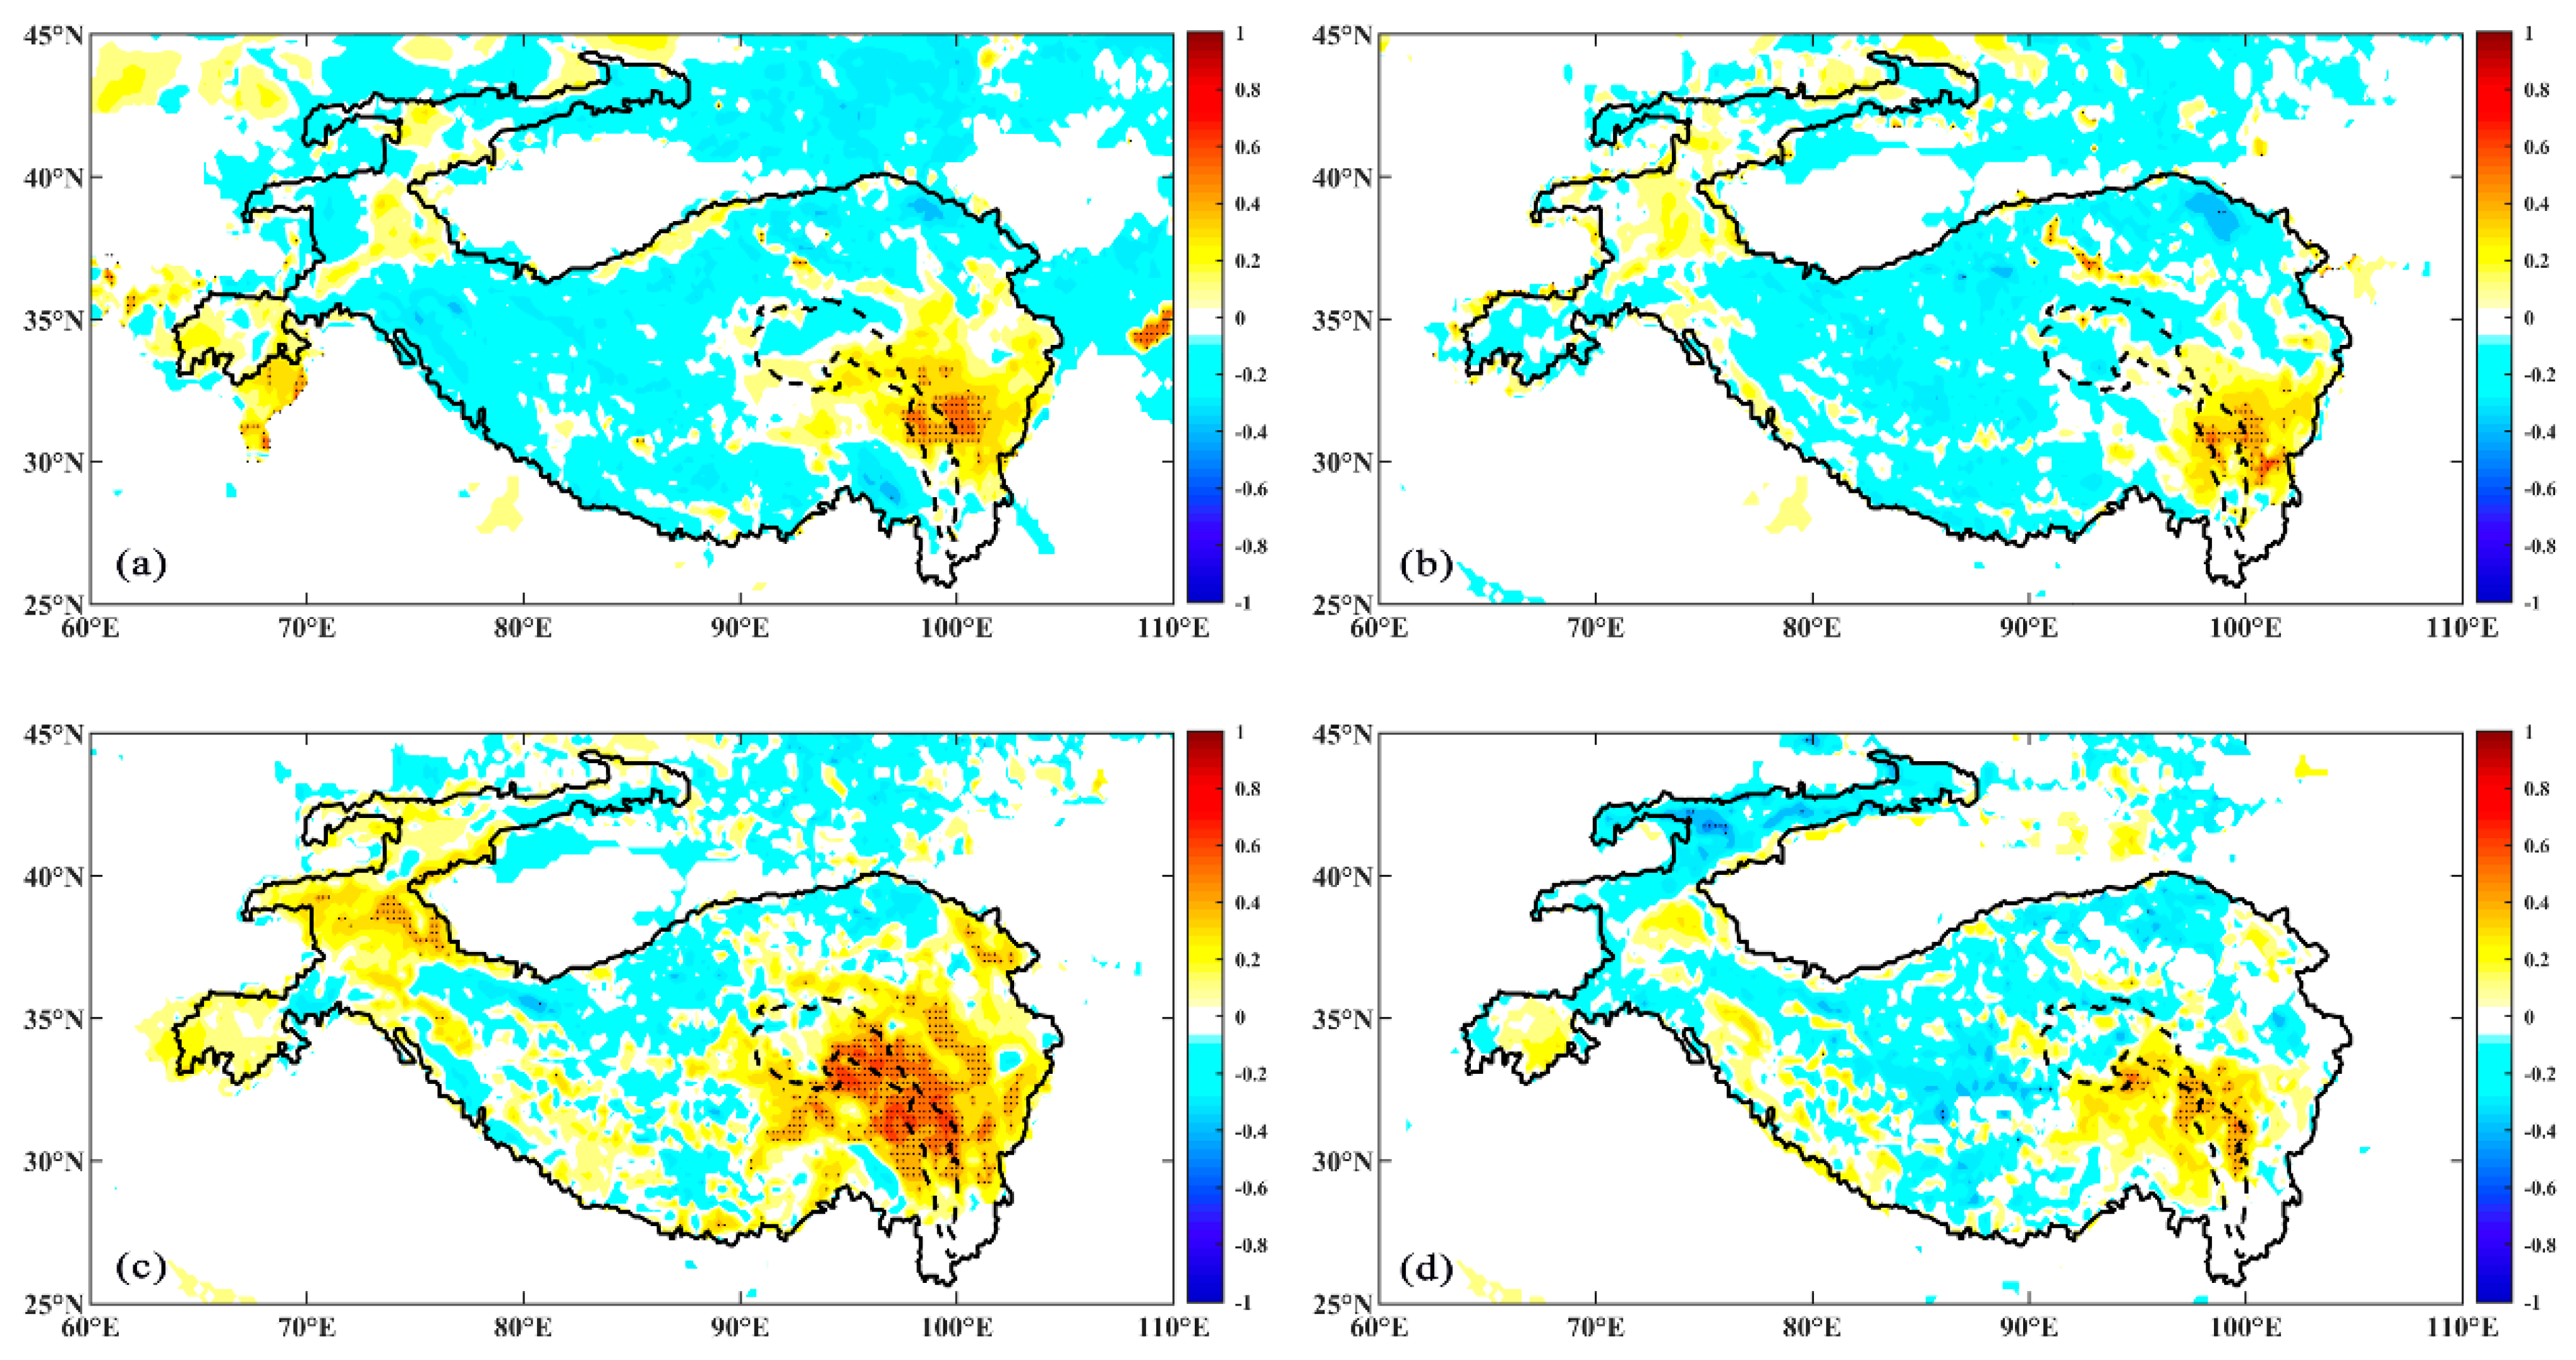
The correlation and contribution analysis results show that the plateau snow has a significant influence on the runoff of Shigu station in April and May, and the influence of April snow on May runoff especially occupies a dominant role. Figure 6 gives the spatial correlation distribution between the Shigu flow from April to May and the SNL and SNS, respectively. It can be seen that the snow in the northern part of the Batang station in March has a significant positive correlation with the Shigu flow in April, while the positive correlation between the snow near Batang station in April and the Shigu flow in April is significantly weakened. Similarly, the large-scale snow depth from Gangtuo station to Batang station in the upper reaches of Jinsha River in April is significantly positively correlated with the Shigu flow in May, while the correlation between snow in May and runoff in May is significantly weakened. In summary, the snow affecting the runoff of Shigu station is mainly located near Gangtou and Batang, and the impact of snow in the river source area is rather small. It also further verifies that because snowmelt is a slow physical process, there is a lag effect of about 1 month for the effect of snow on Shigu flow during the snowmelt period.
- 3.
- Pre-flood period in June
The correlation and contribution analysis shows that the factors affecting the runoff of Shigu station in June are very complex, and the the PRL PRS, SNL, RUL, EVS, and SOS all have significant effects on runoff. From Figure 7, it can be seen that the snow depth in May above Batang station has a weak positive correlation with the runoff of Shigu station in June, that the correlation between snow in June and June runoff is significantly weakened, and that there are both positive and negative correlation coefficients in the region. Rainfall in all regions of the upper Jinsha River in May and June has a positive correlation with runoff in June, but the correlation in most regions does not pass the significance test. In June, evaporation in the upper Jinsha River showed a consistent negative correlation with runoff of the Shigu station, while soil water content showed a consistent positive correlation (figure omitted). In general, for June runoff, PRL, SNL, PRS, EVS, and SOS all showed a consistent spatial distribution of correlations, but the correlations of various factors were close, which also proved the complexity of the causes of June runoff in the upper Jinsha River.
- 4.
- Main flood season
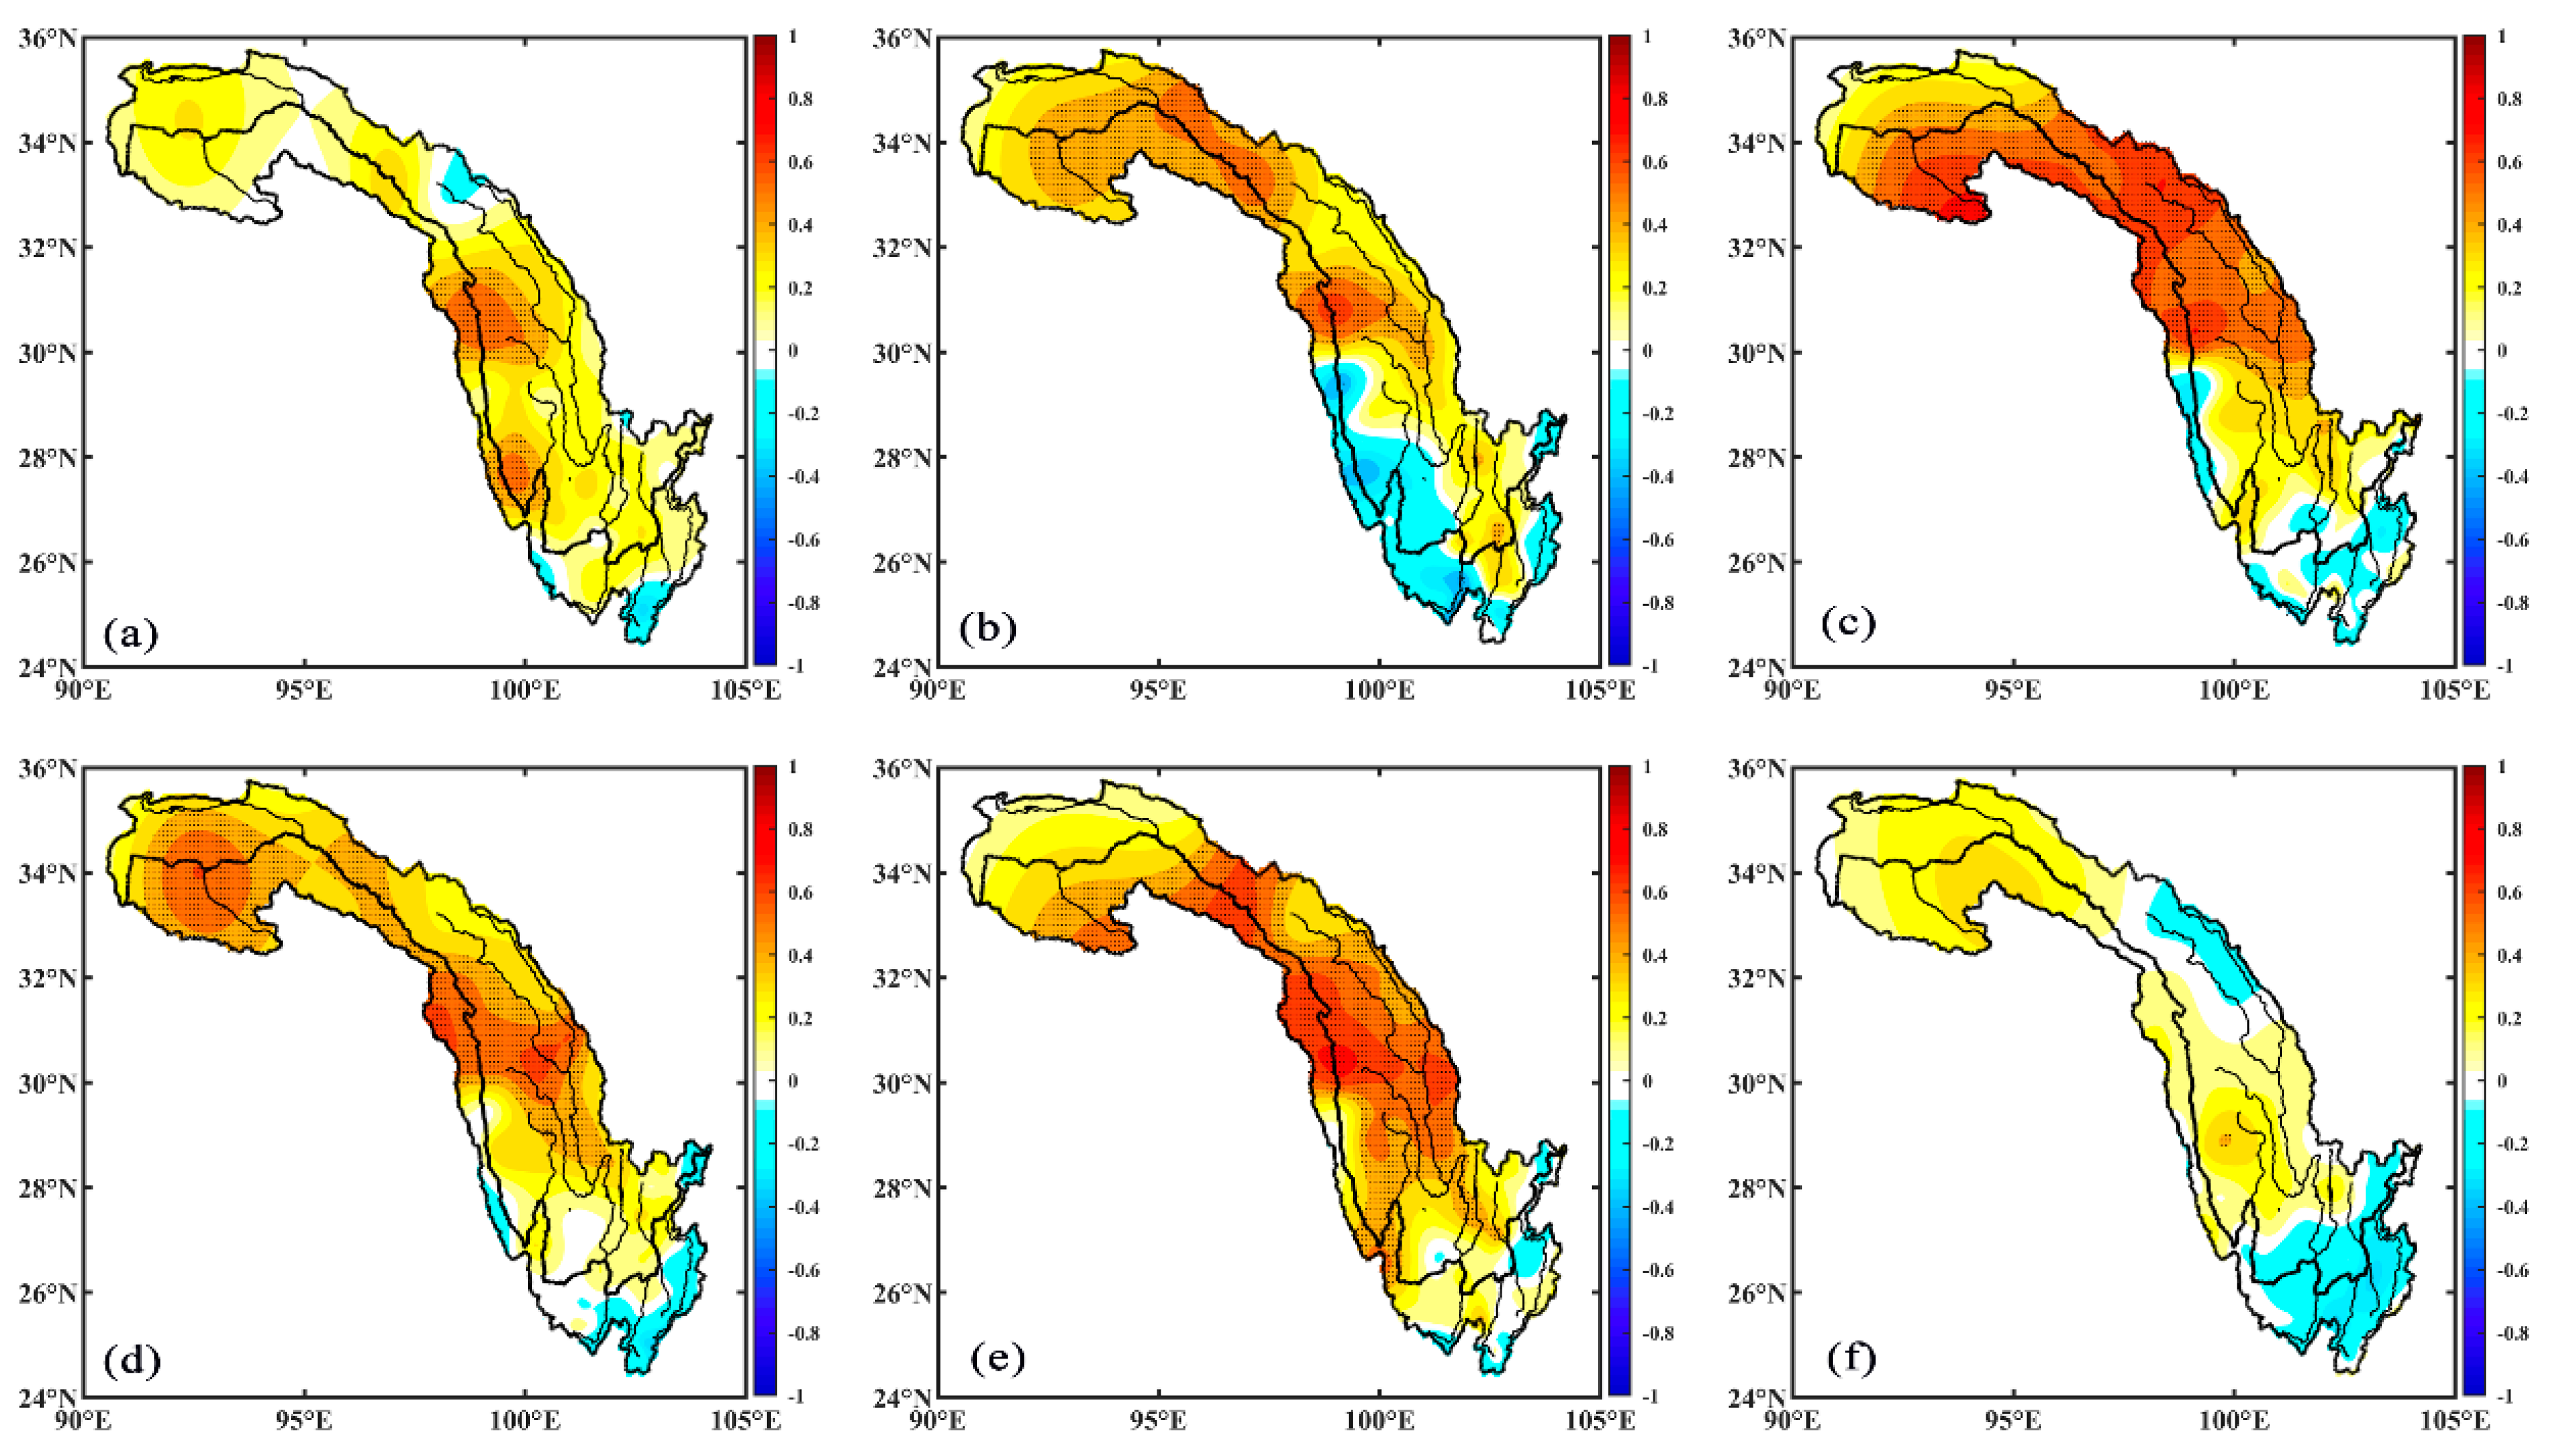
July–September is the main flood season in the upper reaches of Jinsha River, and the runoff of Shigu station reaches its peak during this period. From Figure 6, it can be seen that PRL and PRS are two factors contributing most to the runoff in July–September. Therefore, Figure 8 gives the spatial distribution of correlation coefficients between the PRL and PRS and the runoff of Shigu station in July–September. As can be seen, for the July runoff, the PRL has a significant positive correlation with the runoff in the area near Batang station and the northern part of Shigu station, while the PRS has a significant positive correlation with the runoff in a wide area above Batang, and the correlation coefficients are significantly higher. For the August runoff, the PRL is not significantly negatively correlated with runoff in the area below Batang station, while it is significantly positively correlated in the area above Batang station, and the PRS has a significant positive correlation with the runoff in a large area above Shigu station. In September, there is a significant positive correlation between PRL and runoff in the wide area above Batang station, while the correlation between runoff and PRS is significantly weakened, and no significant correlation area appears in the basin. The above analysis shows that rainfall has an important influence on July–September runoff, where July runoff is closely affected by PRL and PRS, August runoff is more affected by PRS, and September runoff is mainly affected by PRL, which is also basically consistent with the contribution results in Figure 6, further verifying our conclusion. In addition, the spatial correlation analysis also shows that the runoff of Shigu station during the main flood season is mainly affected by the rainfall in the area above Batang station, while the influence of rainfall near Shigu station is relatively weak, sometimes even showing a negative correlation, which needs to be further studied in future work.
3.3.3. Contribution of Key Areas
The analysis in Section 3.3.2 shows that there is spatial heterogeneity in the effects of different factors on the runoff of Shigu station, which leads to the effects of factors in different spaces being offset when regional averages are used for the calculation. Therefore, in this section, based on the correlation results, the high correlation area of each month in the upper Jinsha River is selected as the key area of the factor, and the relative importance of rainfall and snow depth in the key area on the runoff of Shigu station is analyzed. The key area here refers to the stations or grids in the upper reaches of the Jinsha River where the absolute values of correlation coefficients between rainfall and snowfall and runoff are above 0.4 (confidence level is above 0.01). If most of the grids have positive correlation coefficients, those with correlation coefficients above 0.4 are averaged, and if they are negative, those with correlation coefficients below −0.4 will be averaged, and the averaged series is the series of key area factors. Since the RUL plays a dominant role during the dry period, the contribution of other factors can be ignored, so the contribution of key area factors from April to October is mainly analyzed here, and the results are shown in Figure 9.
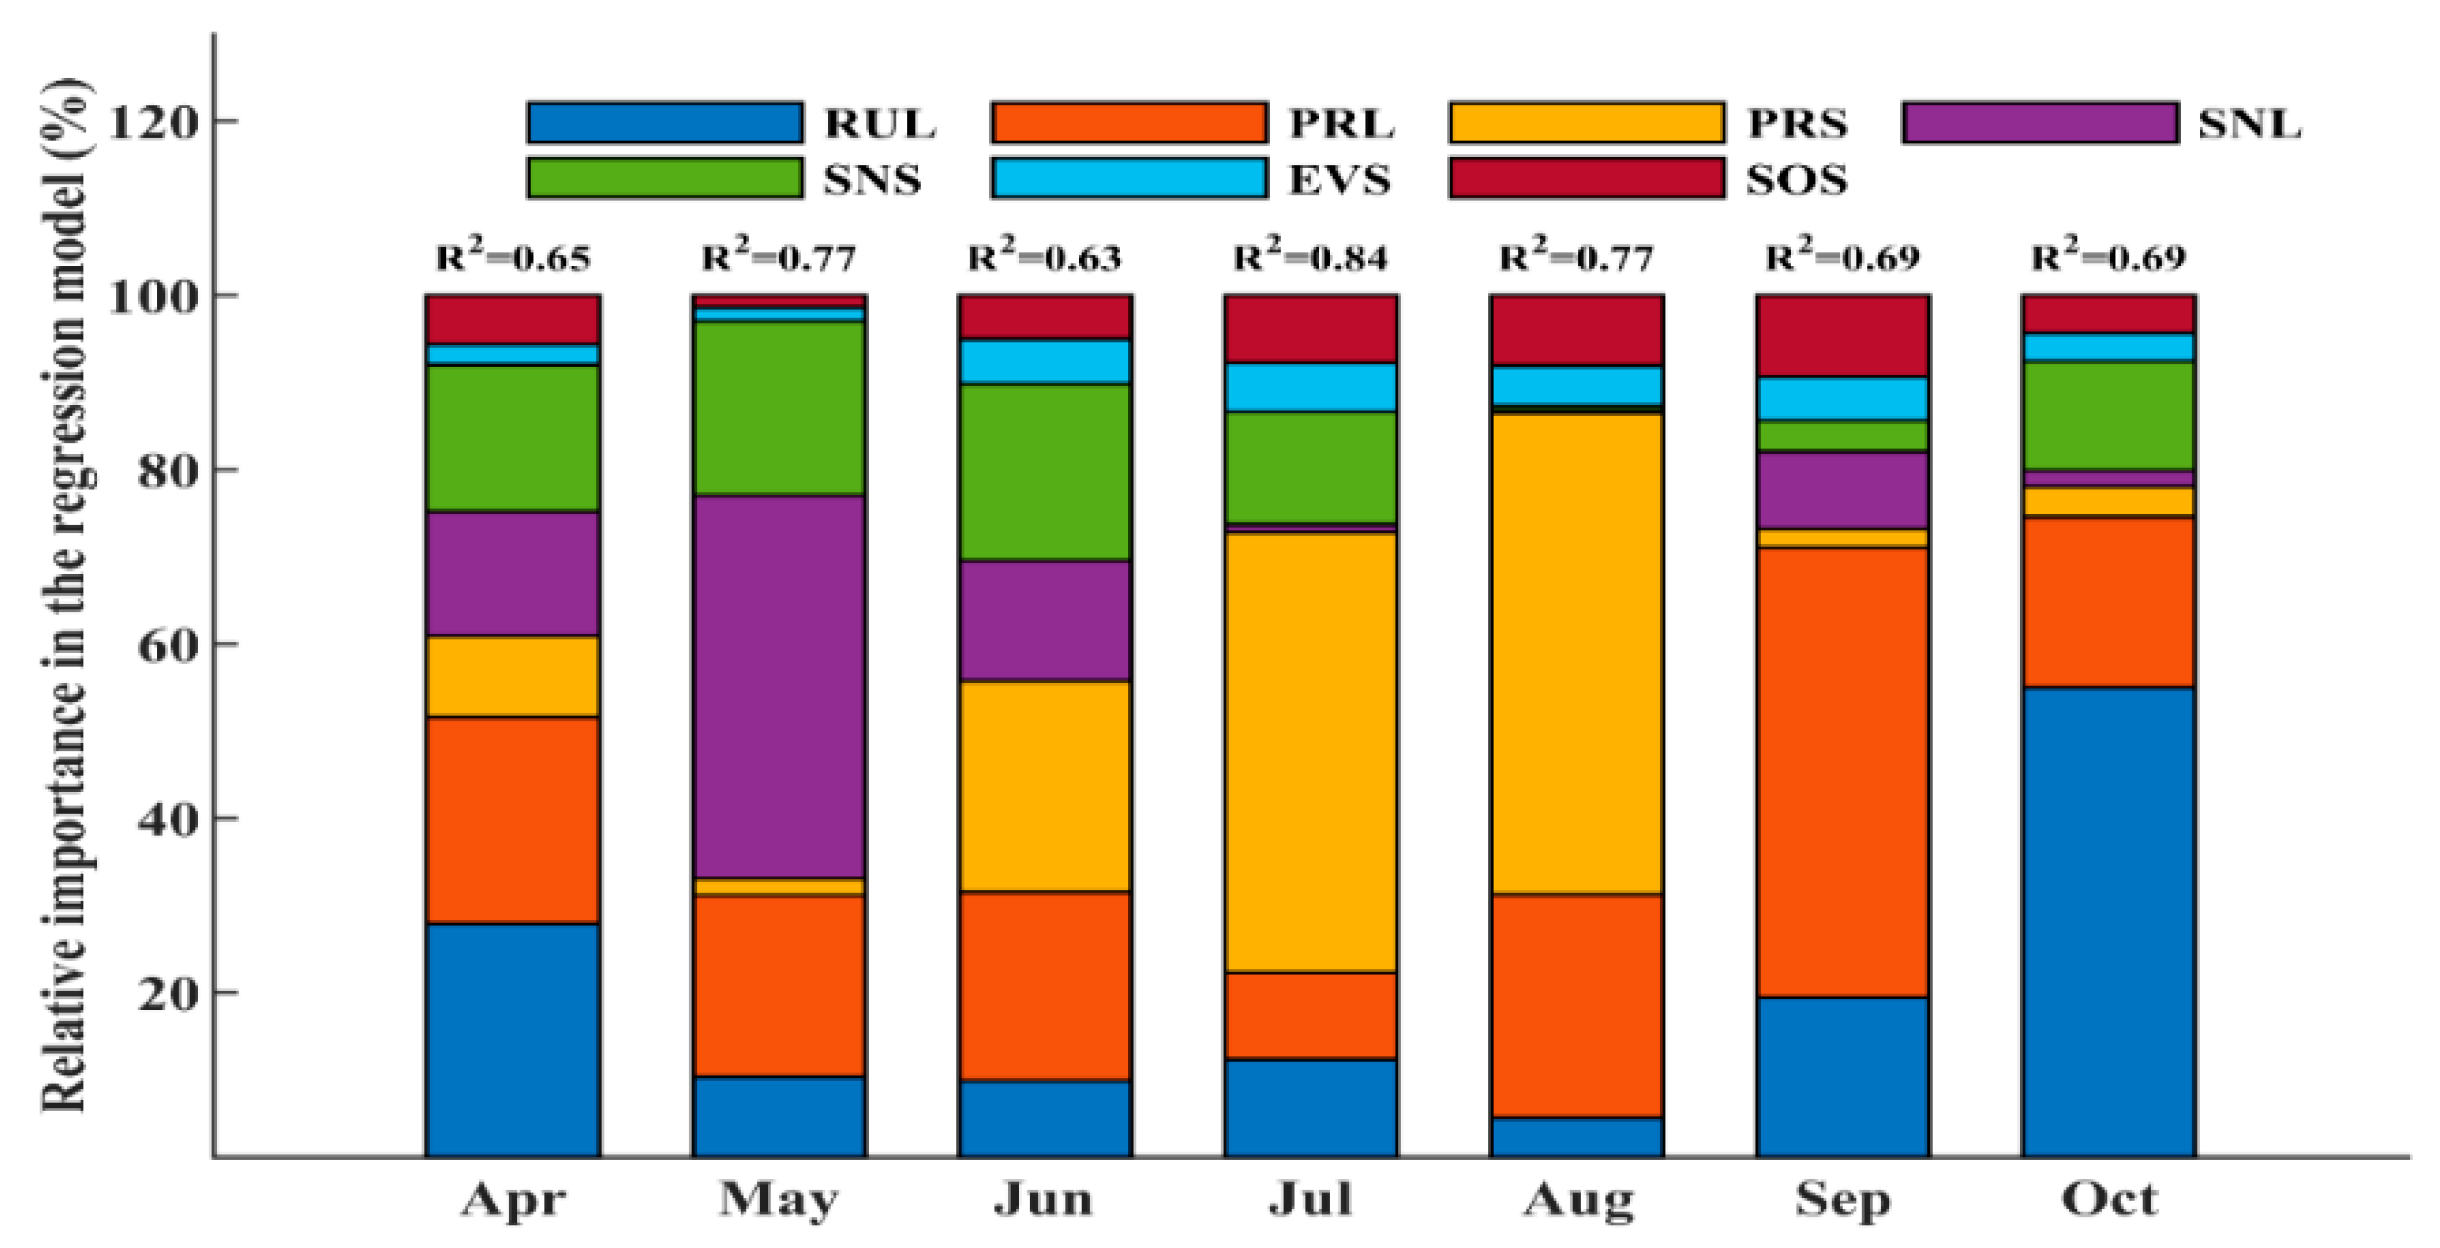
Comparing Figure 5 and Figure 9, it can be seen that after the selection of the key areas, the R-square of the model in the flood period of Shigu station has improved significantly, especially for the snowmelt period in April and June–August. The R-square improved from 0.5 to 0.65 in April, from 0.45 to 0.63 in June, from 0.57 to 0.84 in July, and from 0.47 to 0.77 in August, while there was no significant change in the R-square of the model in May, October, and September. This indicates that after the selection of key areas, the influence of precipitation and snow on runoff can be better characterized, which verifies the important role of the spatial distribution of factors on runoff formation.
In terms of the contribution of different factors, the contribution of SNL, SNS, and PRS on April runoff increases significantly after the key areas are selected, while the contribution of RUL decreases significantly. This indicates that the influencing factors of April runoff are also complex, but are more reflected in the key area. From May to October, the contribution ranking of the key area factors is basically consistent with the results in Figure 5; however, compared with Figure 6, the contribution of RUL decreases and the contribution of rain and snow increases, which also reflects the advantage of key area factors over the regional average.
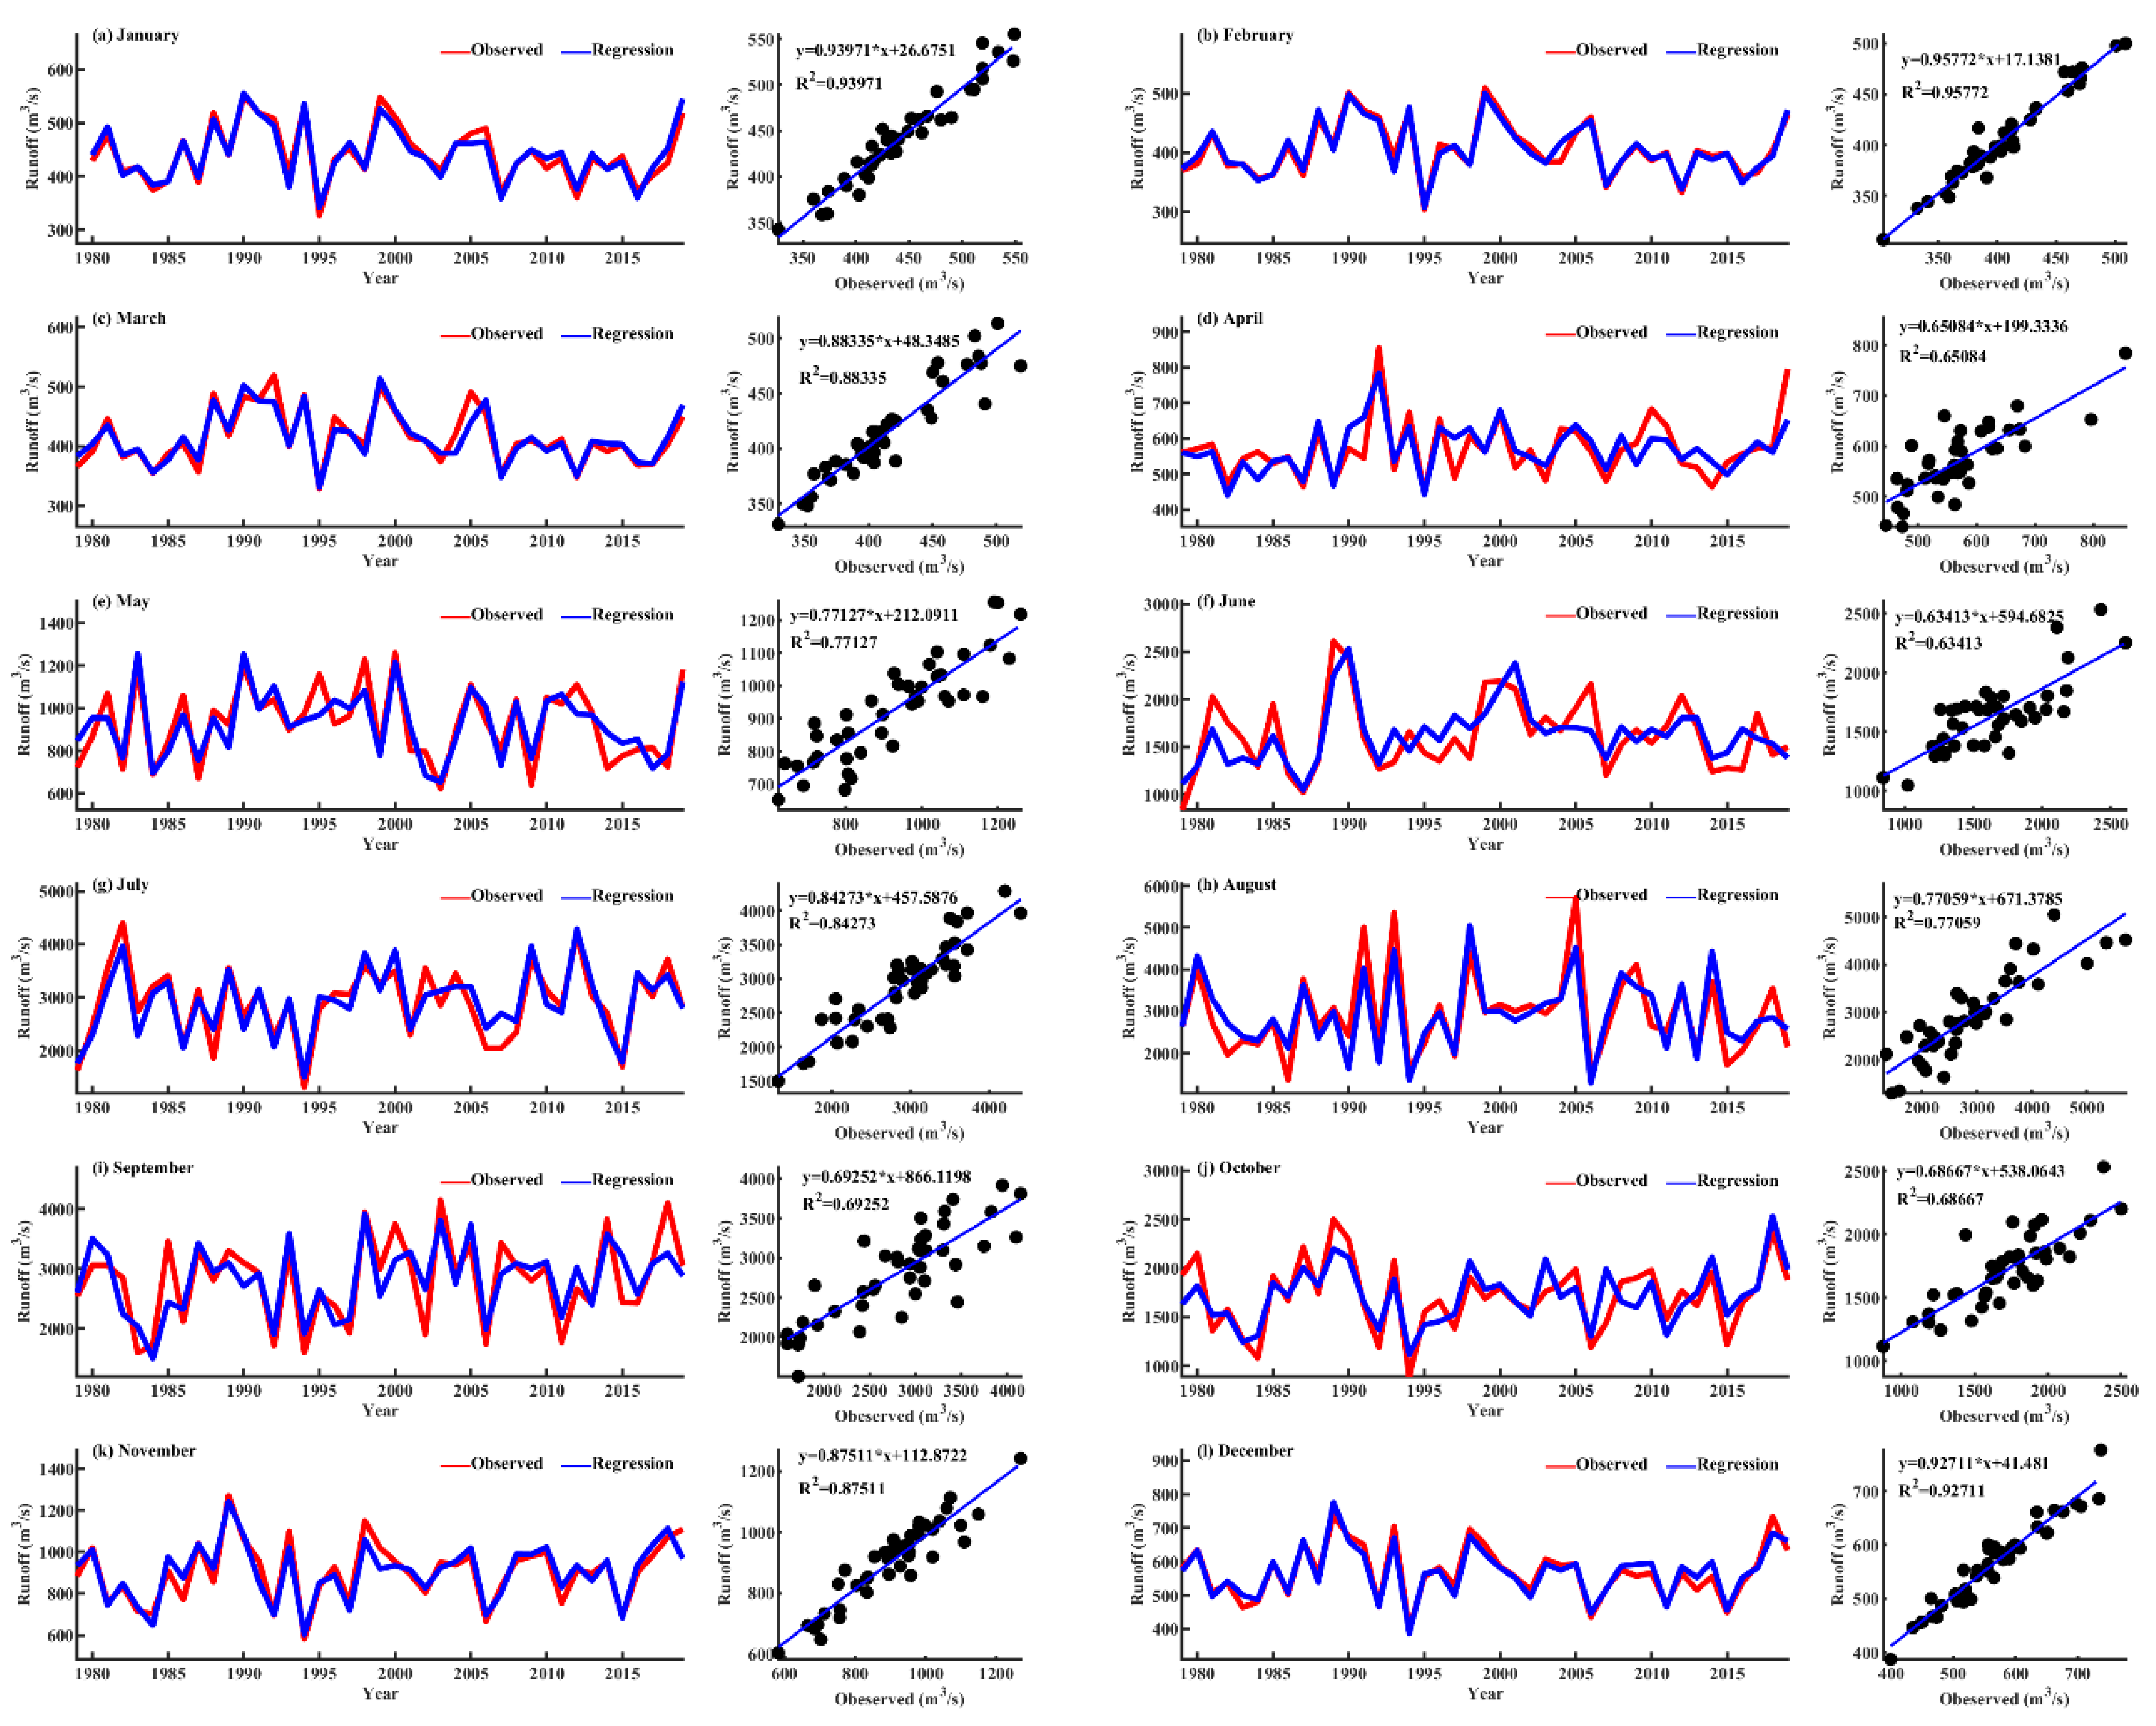
To further test the simulation effect of key zone factors on runoff, Figure 10 examines the simulation results of the multi-factor regression model for runoff in different months at Shigu station, from which the key area factors are selected for the April–October model. It can be found that the simulation results of November–March in the dry period are in very good agreement with the observation results, and both the interannual fluctuations of runoff and the extreme changes of peaks and valleys can be well simulated. For the April–October runoff, although the simulation accuracy of the regression model is reduced, it can still simulate the fluctuation of the runoff well, especially for some flow extremes, which further verifies the reasonableness of the model and shows that the factor contribution calculated by using the model can show the influence of climate factors on the runoff at Shigu station. The results in Figure 10 show that the regression model we constructed can simulate the changes of runoff at Shigu station well. Since the contribution of the early factors in the model was a large proportion of the total factors, if we can obtain this early information in time, we can bring them into the regression model for forecasting.
4. Conclusions and Discussion
In the context of global climate change, the spatial and temporal allocation of water resources and water cycle mechanisms are changing, which brings new challenges to the development and utilization of hydraulic resources. Therefore, it is important to study the evolution rules and causes of change to water resources under climate change for the sustainable utilization of water resources. Since the Jinsha River basin is an important ecological protection base and hydropower energy base in China, there is an urgent need to study its runoff variability under climate change and analyze the response mechanism of runoff to climate factors at different times, so as to improve the understanding of the variability and causes of runoff in the Jinsha River and support the comprehensive and efficient utilization of water resources. In addition, the understanding of runoff causes is also the basis for long-term runoff forecasts (long-term runoff forecast in this paper refers to runoff forecast from ten-day scale to year scale). Long-term runoff forecast has been facing the problems of low accuracy and reliability, especially as global climate change has changed the precipitation and snowmelt process in the cold region of western China, which has caused far-reaching effects on the runoff mechanism process in the basin, further increasing the uncertainty of long-term runoff forecast in Jinsha River. Moreover, most traditional long-term runoff forecasting models use statistical methods, which lack interpretability, while the machine learning methods developed rapidly in recent years are completely black-box models with even weaker interpretability. This can reduce users’ trust in long-term runoff forecasts. According to current Chinese water resources management regulations, hydropower companies and reservoirs are required to submit annual power generation and water allocation plans to the government. Although the government recommends that long-term runoff forecasts need to be taken into account when making plans, users have less confidence in long-term runoff forecasts in practical business applications. Especially when the mechanistic reasons for the forecast cannot be explained, users often discard the long-term runoff forecast and make their plans on multi-year average runoff conditions. Therefore, when making long-term runoff forecasts, it is important to have a deep understanding of the factors and mechanisms that influence the long-term scale of watershed runoff, which on the one hand can help increase the experience of long-term forecasting, and on the other hand can improve the user’s acceptance of the forecast.
This paper analyzes the change regularities of water resources in the upper reaches of the Jinsha River, and studies the causes of runoff changes at Shigu station from the perspectives of early runoff, precipitation, snow, evaporation, and soil water content. The results show that runoff variation in the upper Jinsha River is a complex phenomenon under the influence of multiple factors, and that the influence of factors on runoff varies significantly in different months and spatial distribution. Generally speaking, from November to March, the main factor affecting the runoff of the upper Jinsha River is the runoff of the preceding month, whose contribution can reach more than 85%, and the influence of rainfall and snow is weak in this period. April–May is the snowmelt period of the upper Jinsha River, and the influence of snow on runoff increases significantly in this period—especially in May, when the contribution of snow can reach more than 65%— and the influence of snow on runoff has a time lag effect of about one month. It is worth noting that the snow affecting the runoff is mainly distributed in the area comprised of Gangtuo station to Batang station. In June, the factors affecting the runoff are complex; early runoff, precipitation and snow all have a significant influence on the runoff, and their contributions are basically equal. From July to September, rainfall plays a major role in the runoff change, and the contribution of rainfall in each month is above 50%, especially the contribution of August rainfall which reaches more than 80%. July and August runoff is mainly influenced by the rainfall in the same month, whereas September runoff is mainly influenced by the rainfall in the last month. The runoff in October is mainly influenced by the runoff and the rainfall in the last month, and the sum of their contributions can reach more than 70%.
It should be noted that the conclusion of this paper is based on the analysis of specific data in the upper Jinsha River, but the conclusion can also be supported for other similar basins. For example, when conducting studies on the causes of runoff in other high altitude and severe cold region, although the contribution of each factor and the time of influence may vary, the impact of snowmelt runoff during the snowmelt period and the impact of pre-flow during the dry season need to be paid attention to, which is also applicable in other high altitude and severe cold basins. At the same time, the research in this paper also provides a general technical method. Namely, when working on water resources management, it is necessary to first analyze the key influencing factors of runoff at different times in order to provide basic theoretical support for water resources forecast and management. In addition, it should be noted that this paper mainly adopts a statistical approach to calculate the contribution of different climatic factors to runoff. Due to the scarcity of stations in highland areas, the observation data are not representative enough. Specifically, evapotranspiration and soil moisture can only be analyzed by reanalysis data, leading to inevitable bias in conclusions. In the next stage of research, we plan to use the hydrological model to further verify the contribution of key influencing factors to runoff in different periods. Further, we will use the key influencing factors to construct a long-term runoff forecast model, which will be compared with traditional statistical forecast models and machine learning models. Eventually, we will provide further support for water resources management in the basin.
Author Contributions
Conceptualization, L.W.; methodology, H.Q. and L.W.; validation, L.W., H.C. and B.F.; formal analysis, L.W.; investigation, Y.L.; resources, H.C.; data curation, L.W. and H.Z.; writing-original draft preparation, L.W.; writing-review and editing, L.W. and H.C. and Y.L.; visualization, L.W.; supervision, B.F.; project administration, Y.L.; funding acquisition, B.F. All authors have read and agreed to the published version of the manuscript.
Funding
This research was funded by The National Key Research and Development Program of China, grant number 2021YFC3200301. And also funded by Hubei Key Laboratory of Intelligent Yangtze and Hydroelectric Science, grant number ZH2102000103.
Institutional Review Board Statement
Not applicable.
Informed Consent Statement
Not applicable.
Data Availability Statement
Not applicable.
Acknowledgments
The snow depth data are provided by National Tibetan Plateau Data Center (http://data.tpdc.ac.cn, 6 August 2022). The authors appreciate the comments and encouragement given by the reviewers, editor, and associate editor.
Conflicts of Interest
The authors declare no conflict of interest.
References
- Yang, S.Q. Prospect of Jinsha River—A huge hydropower base in China. China Power Enterp. Manag. 2003, 9, 32–34. (In Chinese) [Google Scholar]
- Cui, L.; Gu, H.B.; Gao, F. Analysis and suggestions on hydropower development utilizing the natural river sections of Jinsha River. Water Power 2022, 48, 1–4. (In Chinese) [Google Scholar] [CrossRef]
- Jiang, Y.C.; Liu, J.; Shang, Y. Research on the influence of climate change on the different runoff components in the permafrost area: A case study of the source area of the Yangtze River. China Rural. Water Hydropower 2021, 3, 63–68. (In Chinese) [Google Scholar]
- Mao, T.X.; Wang, G.X.; Zhang, T. Impacts of climatic change on hydrological regime in the Three-River Headwaters Region, China, 1960–2009. Water Resour. Manag. 2016, 30, 115–131. (In Chinese) [Google Scholar] [CrossRef]
- Liu, G.S.; Wang, G.X.; Zhang, W. Research on climate and runoff variation characteristics in the Three-river headwater region. Resour. Environ. Yangtze Basin 2012, 21, 302–309. (In Chinese) [Google Scholar] [CrossRef]
- Zhang, S.F.; Hua, D.; Meng, X.J.; Zhang, Y.Y. Climate change and its driving effect on the runoff in the “Three-River Headwaters” region. J. Geogr. Sci. 2011, 21, 963–978. [Google Scholar] [CrossRef]
- Li, Y.; Li, Q.J.; Liu, X.S.; Duan, S.; Cai, Y. Analysis of runoff variation in source region of Yangtze River. J. China Hydrol. 2017, 37, 92–95. (In Chinese) [Google Scholar]
- Du, J.N.; Cai, Y.Q.; Li, Y.; Li, Q.; Liu, X. Attribution analysis of runoff in the source region of the Yangtze River. J. China Hydrol. 2021, 41, 73–78. (In Chinese) [Google Scholar] [CrossRef]
- Li, Q.J. Investigation of runoff evolution at the headwaters of Yangtze River and its driving forces. J. Yangtze River Sci. Res. Inst. 2018, 35, 1–5. (In Chinese) [Google Scholar]
- Wang, L.J.; Yan, H.Y. Analysis of impacting factor on change of annual runoff distribution in head-water area of the Yangtze River. J. Water Resour. Water Eng. 2011, 22, 174–176. [Google Scholar]
- Evans, S.G.; Ge, S.; Liang, S. Analysis of groundwater flow in mountainous, headwater catchments with permafrost. Water Resour. Res. 2015, 51, 9564–9576. [Google Scholar] [CrossRef]
- Li, L.; Shen, H.; Dai, S.; Li, H.; Xiao, J. Response of water resources to climate change and its future trend in the source region of the Yangtze River. J. Geogr. Sci. 2013, 23, 208–218. [Google Scholar] [CrossRef]
- Qi, D.M.; Li, Y.Q.; Chen, Y.R.; Zhao, X.; Zhou, C. Changing characteristics and cause analysis of the runoff in the source regions of the Yangtze River under the background of climate change. J. Glaciol. Geocryol. 2015, 37, 1075–1086. [Google Scholar]
- Jiang, C.; Li, D.; Gao, Y.; Liu, X.; Liu, W.; Zhang, L. Spatiotemporal variability of streamflow and attribution in the Three-Rivers Headwater Region, northwest China. J. Water Clim. Chang. 2016, 7, 637–649. [Google Scholar] [CrossRef]
- Ji, G.X.; Song, H.Y.; Wei, H.; Wu, L. Attribution analysis of climate and anthropic factors on runoff and vegetation changes in the source area of the Yangtze River from 1982 to 2016. Land 2021, 10, 612. [Google Scholar] [CrossRef]
- Deng, H.; Chen, Y. Influences of recent climate change and human activities on water storage variations in Central Asia. J. Hydrol. 2017, 544, 46–57. [Google Scholar] [CrossRef]
- Ahmed, N.; Wang, G.; Lü, H.; Booij, M.J.; Marhaento, H.; Prodhan, F.A.; Ali, S.; Imran, M.A. Attribution of changes in streamflow to climate change and land cover change in Yangtze River source region, China. Water 2022, 14, 259. [Google Scholar] [CrossRef]
- Wang, G.; Zhang, J.; He, R.; Liu, C.; Ma, T.; Bao, Z.; Liu, Y. Runoff sensitivity to climate change for hydro-climatically different catchments in China. Stoch. Environ. Res. Risk Assess. 2017, 31, 1011–1021. [Google Scholar] [CrossRef]
- Crossman, J.; Futter, M.; Oni, S.; Whitehead, P.; Jin, L.; Butterfield, D.; Baulch, H.; Dillon, P. Impacts of climate change on hydrology and water quality: Future proofing management strategies in the Lake Simcoe watershed, Canada. J. Great Lakes Res. 2013, 39, 19–32. [Google Scholar] [CrossRef]
- Ning, T.; Li, Z.; Liu, W. Separating the impacts of climate change and land surface alteration on runoff reduction in the Jing River catchment of China. Catena 2016, 147, 80–86. [Google Scholar] [CrossRef]
- Zhou, Y.; Lai, C.; Wang, Z.; Chen, X.; Zeng, Z.; Chen, J.; Bai, X. Quantitative evaluation of the impact of climate change and human activity on runoff change in the Dongjiang River Basin, China. Water 2018, 10, 571. [Google Scholar] [CrossRef]
- Pocock, S.J.; Stone, G.W. The Nature of the p Value. New Engl. J. Med. 2016, 375, 2205. [Google Scholar] [CrossRef] [PubMed]
- Fields, G.S. Accounting for Income in Equality and Its Change: A New Method, with Application to the Distribution of Earnings in the United States. In Worker Well-Being and Public Policy; Emerald Group Publishing Limited: Bingley, UK, 2003. [Google Scholar] [CrossRef]
- Israeli, O. A Shapley-based decomposition of the R-square of a linear regression. J. Econ. Inequal. 2007, 5, 199–212. [Google Scholar] [CrossRef]
- Shorrocks, A.F. Decomposition procedures for distributional analysis: A unified framework based on the Shapley value. J. Econ. Inequal. 2013, 11, 99–126. [Google Scholar] [CrossRef]
- Ye, D.; Ng, Y.K.; Lian, Y. Culture and Happiness. Soc. Indic. Res. 2015, 123, 519–547. [Google Scholar] [CrossRef] [Green Version]
- Budescu, D.V. Dominance analysis: A new approach to the problem of relative importance of predictors in multiple regression. Psychol. Bull. 1993, 114, 542. [Google Scholar] [CrossRef]
- Azen, R.; Budescu, D.V. The dominance analysis approach for comparing predictors in multiple regression. Psychol. Methods 2003, 8, 129. [Google Scholar] [CrossRef]
- Tonidandel, S.; LeBreton, J.M. Relative importance analysis: A useful supplement to regression analysis. J. Bus. Psychol. 2011, 26, 1–9. [Google Scholar] [CrossRef]
- Sirami, C.; Gross, N.; Baillod, A.B.; Bertrand, C.; Carrié, R.; Hass, A.; Henckel, L.; Miguet, P.; Vuillot, C.; Alignier, A.; et al. Increasing crop heterogeneity enhances multitrophic diversity across agricultural regions. Proc. Natl. Acad. Sci. USA 2019, 116, 16442–16447. [Google Scholar] [CrossRef]
- Dai, L.Y.; Che, T.; Ding, Y.J.; Hao, X.H. Evaluation of snow cover and snow depth on the Qinghai–Tibetan Plateau derived from passive microwave remote sensing. Cryosphere 2017, 11, 1933–1948. [Google Scholar] [CrossRef] [Green Version]
Figure 1.
Distribution of rainfall stations in the Jinsha River Basin (JS means the Jinsha River Basin, UJS means the upper reaches of Jinsha River Basin).
Figure 1.
Distribution of rainfall stations in the Jinsha River Basin (JS means the Jinsha River Basin, UJS means the upper reaches of Jinsha River Basin).

Figure 2.
Seasonal variation characteristics of water resources in the upper reaches of Jinsha River. (The thick black solid line indicates the multi-year average. The blue box in the boxplot indicates the upper and lower quartile interval, the short red line indicates the median, the short black line indicates the outlier cutoffs and the red plus sign indicates the outlier).

Figure 3.
Interannual characteristics of water resources in the upper reaches of Jinsha River.

Figure 4.
Lead and lag correlation between runoff at Shigu station and impact factors in the upper Jinsha River ((a): runoff autocorrelation; (b): correlation of runoff and precipitation; (c): correlation of runoff and snow depth; (d): correlation of runoff and potential evaporation; (e): correlation of runoff and soil moisture. box represents contemporaneous correlation, + represents the month with maximum correlation, · represents 0.01 confidence level).

Figure 5.
Relative importance analysis of runoff impact factors at Shigu station.

Figure 6.
Spatial correlation distribution of flow at Shigu Station and plateau snow during snowmelt season ((a) SNL and April runoff; (b) SNS and April runoff; (c) SNL and May runoff; (d) SNS and May runoff. Shading area means confidence level is above 0.01).
Figure 6.
Spatial correlation distribution of flow at Shigu Station and plateau snow during snowmelt season ((a) SNL and April runoff; (b) SNS and April runoff; (c) SNL and May runoff; (d) SNS and May runoff. Shading area means confidence level is above 0.01).

Figure 7.
Spatial correlation distribution of water resources elements and June runoff in the upper Jinsha River ((a) snow in the previous month; (b) rainfall in the previous month; (c) snow in the same period; (d) rainfall in the same period. Shading area means confidence level is above 0.01).
Figure 7.
Spatial correlation distribution of water resources elements and June runoff in the upper Jinsha River ((a) snow in the previous month; (b) rainfall in the previous month; (c) snow in the same period; (d) rainfall in the same period. Shading area means confidence level is above 0.01).

Figure 8.
The spatial distribution of correlation coefficients between rainfall and runoff during the main flood season ((a) PRL and July runoff; (b) PRL and August runoff; (c) PRL and September runoff; (d) PRS and July runoff; (e) PRS and August runoff; (f) PRS and September runoff. The confidence level of shade is above 0.01).

Figure 9.
Relative importance analysis of the influence factors in the key area of runoff at Shigu station.
Figure 9.
Relative importance analysis of the influence factors in the key area of runoff at Shigu station.

Figure 10.
Simulation of multi-factor regression model for different months at Shigu station (April–October is the key area factor).
Figure 10.
Simulation of multi-factor regression model for different months at Shigu station (April–October is the key area factor).


Table 1.
Correlation coefficients of runoff and impact factors in different months.
| RUL | PRL | PRS | SNL | SNS | EVS | SOS | |
|---|---|---|---|---|---|---|---|
| Jan | 0.97 ** | 0.15 | 0.10 | 0.20 | 0.18 | 0.10 | −0.07 |
| Feb | 0.97 ** | 0.05 | 0.22 | 0.17 | 0.14 | 0.22 | −0.18 |
| Mar | 0.93 ** | 0.28 | 0.0003 | 0.13 | 0.20 | 0.09 | −0.10 |
| Apr | 0.62 ** | 0.08 | −0.04 | 0.27 | 0.24 | 0.02 | 0.003 |
| May | 0.36 * | 0.32 * | −0.07 | 0.74 ** | 0.56 ** | 0.14 | −0.08 |
| Jun | 0.24 | 0.25 | 0.31 * | 0.32 * | 0.08 | −0.34 * | 0.37 * |
| Jul | 0.26 | 0.29 | 0.54 ** | 0.03 | 0 | −0.24 | 0.36 * |
| Aug | 0.31 * | 0.46 ** | 0.57 ** | 0 | −0.06 | −0.35 * | 0.40 ** |
| Sep | 0.57 ** | 0.80 ** | 0.08 | −0.31 * | −0.28 | −0.28 | 0.36 * |
| Oct | 0.72 ** | 0.20 | 0.22 | −0.07 | 0.16 | −0.23 | 0.29 |
| Nov | 0.92 ** | 0.38 * | 0.01 | 0.08 | 0.17 | −0.07 | 0.17 |
| Dec | 0.94 ** | −0.07 | 0.30 | 0.19 | 0.21 | −0.14 | 0.07 |
The confidence level of ** is above 0.01 and * is above 0.05.
Table 2.
Conditional dominance statistics SRI (%).
| RUL | PRL | PRS | SNL | SNS | EVS | SOS | |
|---|---|---|---|---|---|---|---|
| Jan | 90 | 3.7 | 1.1 | 2.6 | 1.8 | 0.5 | 0.3 |
| Feb | 91.6 | 0.4 | 3.6 | 1.1 | 0.8 | 1.3 | 1.1 |
| Mar | 90.1 | 5.2 | 0.3 | 1 | 1.9 | 0.7 | 0.7 |
| Apr | 69.8 | 2.6 | 2.7 | 11.5 | 6.2 | 2.1 | 5.1 |
| May | 17.7 | 6.2 | 2.7 | 49.6 | 17.9 | 3.1 | 2.8 |
| Jun | 16.1 | 21.7 | 16.2 | 17.1 | 3.5 | 11.9 | 13.5 |
| Jul | 15.7 | 9.9 | 40.3 | 0.8 | 13.8 | 6.9 | 12.5 |
| Aug | 11.3 | 23.1 | 46 | 1.6 | 1 | 7.2 | 9.7 |
| Sep | 21.3 | 58.3 | 1 | 4.2 | 5.2 | 3.8 | 6.3 |
| Oct | 74.4 | 4.1 | 2.8 | 1.4 | 7.7 | 3.7 | 5.9 |
| Nov | 85.6 | 8.3 | 0.4 | 0.9 | 1.5 | 0.7 | 2.5 |
| Dec | 87.7 | 0.6 | 6.3 | 1.5 | 1.8 | 1 | 1.1 |
Publisher’s Note: MDPI stays neutral with regard to jurisdictional claims in published maps and institutional affiliations. |
© 2022 by the authors. Licensee MDPI, Basel, Switzerland. This article is an open access article distributed under the terms and conditions of the Creative Commons Attribution (CC BY) license (https://creativecommons.org/licenses/by/4.0/).
Share and Cite
MDPI and ACS Style
Wang, L.; Cao, H.; Li, Y.; Feng, B.; Qiu, H.; Zhang, H. Attribution Analysis of Runoff in the Upper Reaches of Jinsha River, China. Water 2022, 14, 2768. https://doi.org/10.3390/w14172768
AMA Style
Wang L, Cao H, Li Y, Feng B, Qiu H, Zhang H. Attribution Analysis of Runoff in the Upper Reaches of Jinsha River, China. Water. 2022; 14(17):2768. https://doi.org/10.3390/w14172768
Chicago/Turabian StyleWang, Le, Hui Cao, Yurong Li, Baofei Feng, Hui Qiu, and Hairong Zhang. 2022. "Attribution Analysis of Runoff in the Upper Reaches of Jinsha River, China" Water 14, no. 17: 2768. https://doi.org/10.3390/w14172768
Note that from the first issue of 2016, this journal uses article numbers instead of page numbers. See further details here.