

A Study on the Optimal Deep Learning Model for Dam Inflow Prediction

1
Advanced Structures and Seismic Safety Research Division, Korea Atomic Energy Research Institute, Daejeon 34057, Korea
2
National Drought Information-Analysis Center, Korea Water Resources Corporation, Daejeon 34350, Korea
3
Department of Civil Engineering, Kyungpook National University, Daegu 41566, Korea
*
Author to whom correspondence should be addressed.
Water 2022, 14(17), 2766; https://doi.org/10.3390/w14172766
Submission received: 18 July 2022
/
Revised: 31 August 2022
/
Accepted: 1 September 2022
/
Published: 5 September 2022
(This article belongs to the Special Issue Artificial Intelligence Techniques in Hydrology and Water Resources Management)
Abstract
:In the midst of climate change, the need for accurate predictions of dam inflow to reduce flood damage along with stable water supply from water resources is increasing. In this study, the process and method of selecting the optimal deep learning model using hydrologic data over the past 20 years to predict dam inflow were shown. The study area is Andong Dam and Imha Dam located upstream of the Nakdong River in South Korea. In order to select the optimal model for predicting the inflow of two dams, sixteen scenarios (2 × 2 × 4) are generated considering two dams, two climatic conditions, and four deep learning models. During the drought period, the RNN for Andong Dam and the LSTM for Imha Dam were selected as the optimal models for each dam, and the difference between observations was the smallest at 4% and 2%, respectively. In typhoon conditions, the GRU for Andong Dam and the RNN for Imha Dam were selected as optimal models. In the case of Typhoon Maemi, the GRU and the RNN showed a difference of 2% and 6% from the observed maximum inflow, respectively. The optimal recurrent neural network-based models selected in this study showed a closer prediction to the observed inflow than the SFM, which is currently used to predict the inflow of both dams. For the two dams, different optimal models were selected according to watershed characteristics and rainfall under drought and typhoon conditions. In addition, most of the deep learning models were more accurate than the SFM under various typhoon conditions, but the SFM showed better results under certain conditions. Therefore, for efficient dam operation and management, it is necessary to make a rational decision by comparing the inflow predictions of the SFM and deep learning models.
1. Introduction
Due to extreme climatic change, accurate analysis of water resources is increasingly demanded for stable water supply and flood damage mitigation. Among various research subjects, the amount of the dam inflow is an important element in establishing plans for coping with drought, flooding, and operating the dam. The major factors affecting the amount of the inflow are climatic factors, including rainfall, which is the most influential, temperature, and wind speed, as well as topographical factors such as the basin area and the height of the slope [1]. However, recently, local rainfalls, which are difficult to predict, have frequently occurred nationwide. In particular, in Andong and Imha Dams in 2015, the inflow decreased to one-third the level of the average inflow over the past 20 years; and in 2017 and 2018, the discharge rates were adjusted due to entering the drought “attention stage.” In addition, in 2020, due to the prolonged rainy season, the inflow increased to more than 40%, and therefore, floodgate discharge was performed at Andong Dam for the first time in 17 years. As such, it is an important issue to predict more accurately and quickly the inflow for two dams, which frequently change in drought and flood conditions every year. The reason for this study is that Andong Dam and Imha Dam are important dams that account for 50% of the water supply in the Nakdong River watershed, but there are few studies that predict the dam inflow using a deep learning model. In addition, although the geographical locations of the two dams are adjacent, dam inflow tends to be different depending on the watershed and precipitation characteristics. In particular, during the typhoon Maisak and Haishen in 2020, an instantaneous inflow greater than the designed flood was observed at Imha Dam. Therefore, it is necessary to accurately predict the inflow using deep learning for the two dams in consideration of climate change. In the past, the amount of inflow was calculated using conceptual and physical models; however, recently, artificial intelligence technology has been used in more and more cases to analyze the amount of inflow. Kim et al. [2] took Chungju Dam and Soyanggang Dam as subjects and used the artificial neural network (ANN) model in predicting the inflow of the dams by applying the meteorological data in their basin areas, and the basin precipitation was calculated using the Thiessen network. This study showed that the model using all rainfall stations in the Thiessen network performed better than using only in-watershed or out-watershed stations. Kim et al. [3] analyzed the average precipitation and the inflow data of Chungju Dam in the Han River basin by applying an ANN model including a back propagation algorithm. This study showed that there was a significant improvement in the model accuracy including the correlation coefficient (CC) when data preprocessing was performed. Mok et al. [4] applied the Long Short-Term Memory (LSTM) and the ANN model to predict the inflow per hour of Yongdam Dam. In this study, the LSTM hyperparameters (sequence, hidden dimension, learning rate, and iteration) were optimized and the model accuracy was improved by applying dam inflow and rainfall as input variables. Lee et al. [5] performed a quantitative evaluation by adjusting and simulating input variables for the Taehwa River basin using recurrent neural network (RNN), time delay neural network (TDNN), and nonlinear autoregressive exogenous (NARX) models. This study improved the Nash–Sutcliffe efficiency (NSE) from 0.530 to 0.988 by adjusting the time delay parameter of the model. Chang et al. [6] introduced recent advances in machine learning in flood prediction and management, and presented an academic approach to flood risk-related modeling. Chang et al. [7] explored the effectiveness of multiple rainfall sources for assimilation-based multi-sensor precipitation estimates and performed multi-step-ahead rainfall forecasts based on the assimilated precipitation. Chakravarti et al. [8] demonstrated that the ANN model could be a promising tool to provide insights from learned relationships as well as accurate modeling of complex processes through a comparison of the runoff generated by rainfall simulator in the laboratory and the predicted runoff of the ANN model. Kao et al. [9] proposed a Long Short-Term Memory based Encoder-Decoder (LSTM-ED) for multi-step-ahead flood prediction for the first time. Shen et al. [10] suggested that hydrology scientists consider research using DL-based data mining to complement traditional approaches. Tokar et al. [11] compared and analyzed the conceptual models and the ANN models, which differed for each basin. After comparing the Watbal model for the Fraser River, the Sacramento Soil Moisture Accounting (SAC-SMA) model for the Raccoon River, and the Simple Conceptual Rainfall–Runoff (SCRR) model for the Little Patuxent River, Colorado, USA, with the ANN model, it was shown as a result that the ANN model together with the existing conceptual model could be utilized for rainfall-discharge prediction. Chen et al. [12] compared and analyzed the hourly precipitation and discharge data for each hour following the hit of 27 typhoons from 2005 and 2009 at the Linbien River Basin, Taiwan, by applying the conventional regression model and the ANN model along with the concept of backpropagation. In statistical evaluation, the ANN model showed better results than the conventional regression analysis model. Coulibaly et al. [13] predicted the inflow of multi-purpose dams by applying rainfall, snowfall, inflow, and temperature as input variables of four models: Multilayer Perceptron (MLP), Input Delayed Neural Network (IDNN), RNN, and Time Delay Current Neural Network (TDRNN).
In this study, a deep learning model was used to predict the inflow of Andong and Imha Dams in the Nakdong River watershed in Korea. To build an optimal prediction model based on inflow and rainfall data over the past 20 years, accuracy and reliability were evaluated by generating various scenarios according to input variables. In addition, the RNN models were applied considering that the dam inflow is time series data and the learning efficiency of the existing ANN model decreases as the number and period of data increase. The prediction model derived from this study is expected to contribute to stable dam operation management and coping with the disaster.
2. Study Methods
2.1. ANN and RNNs
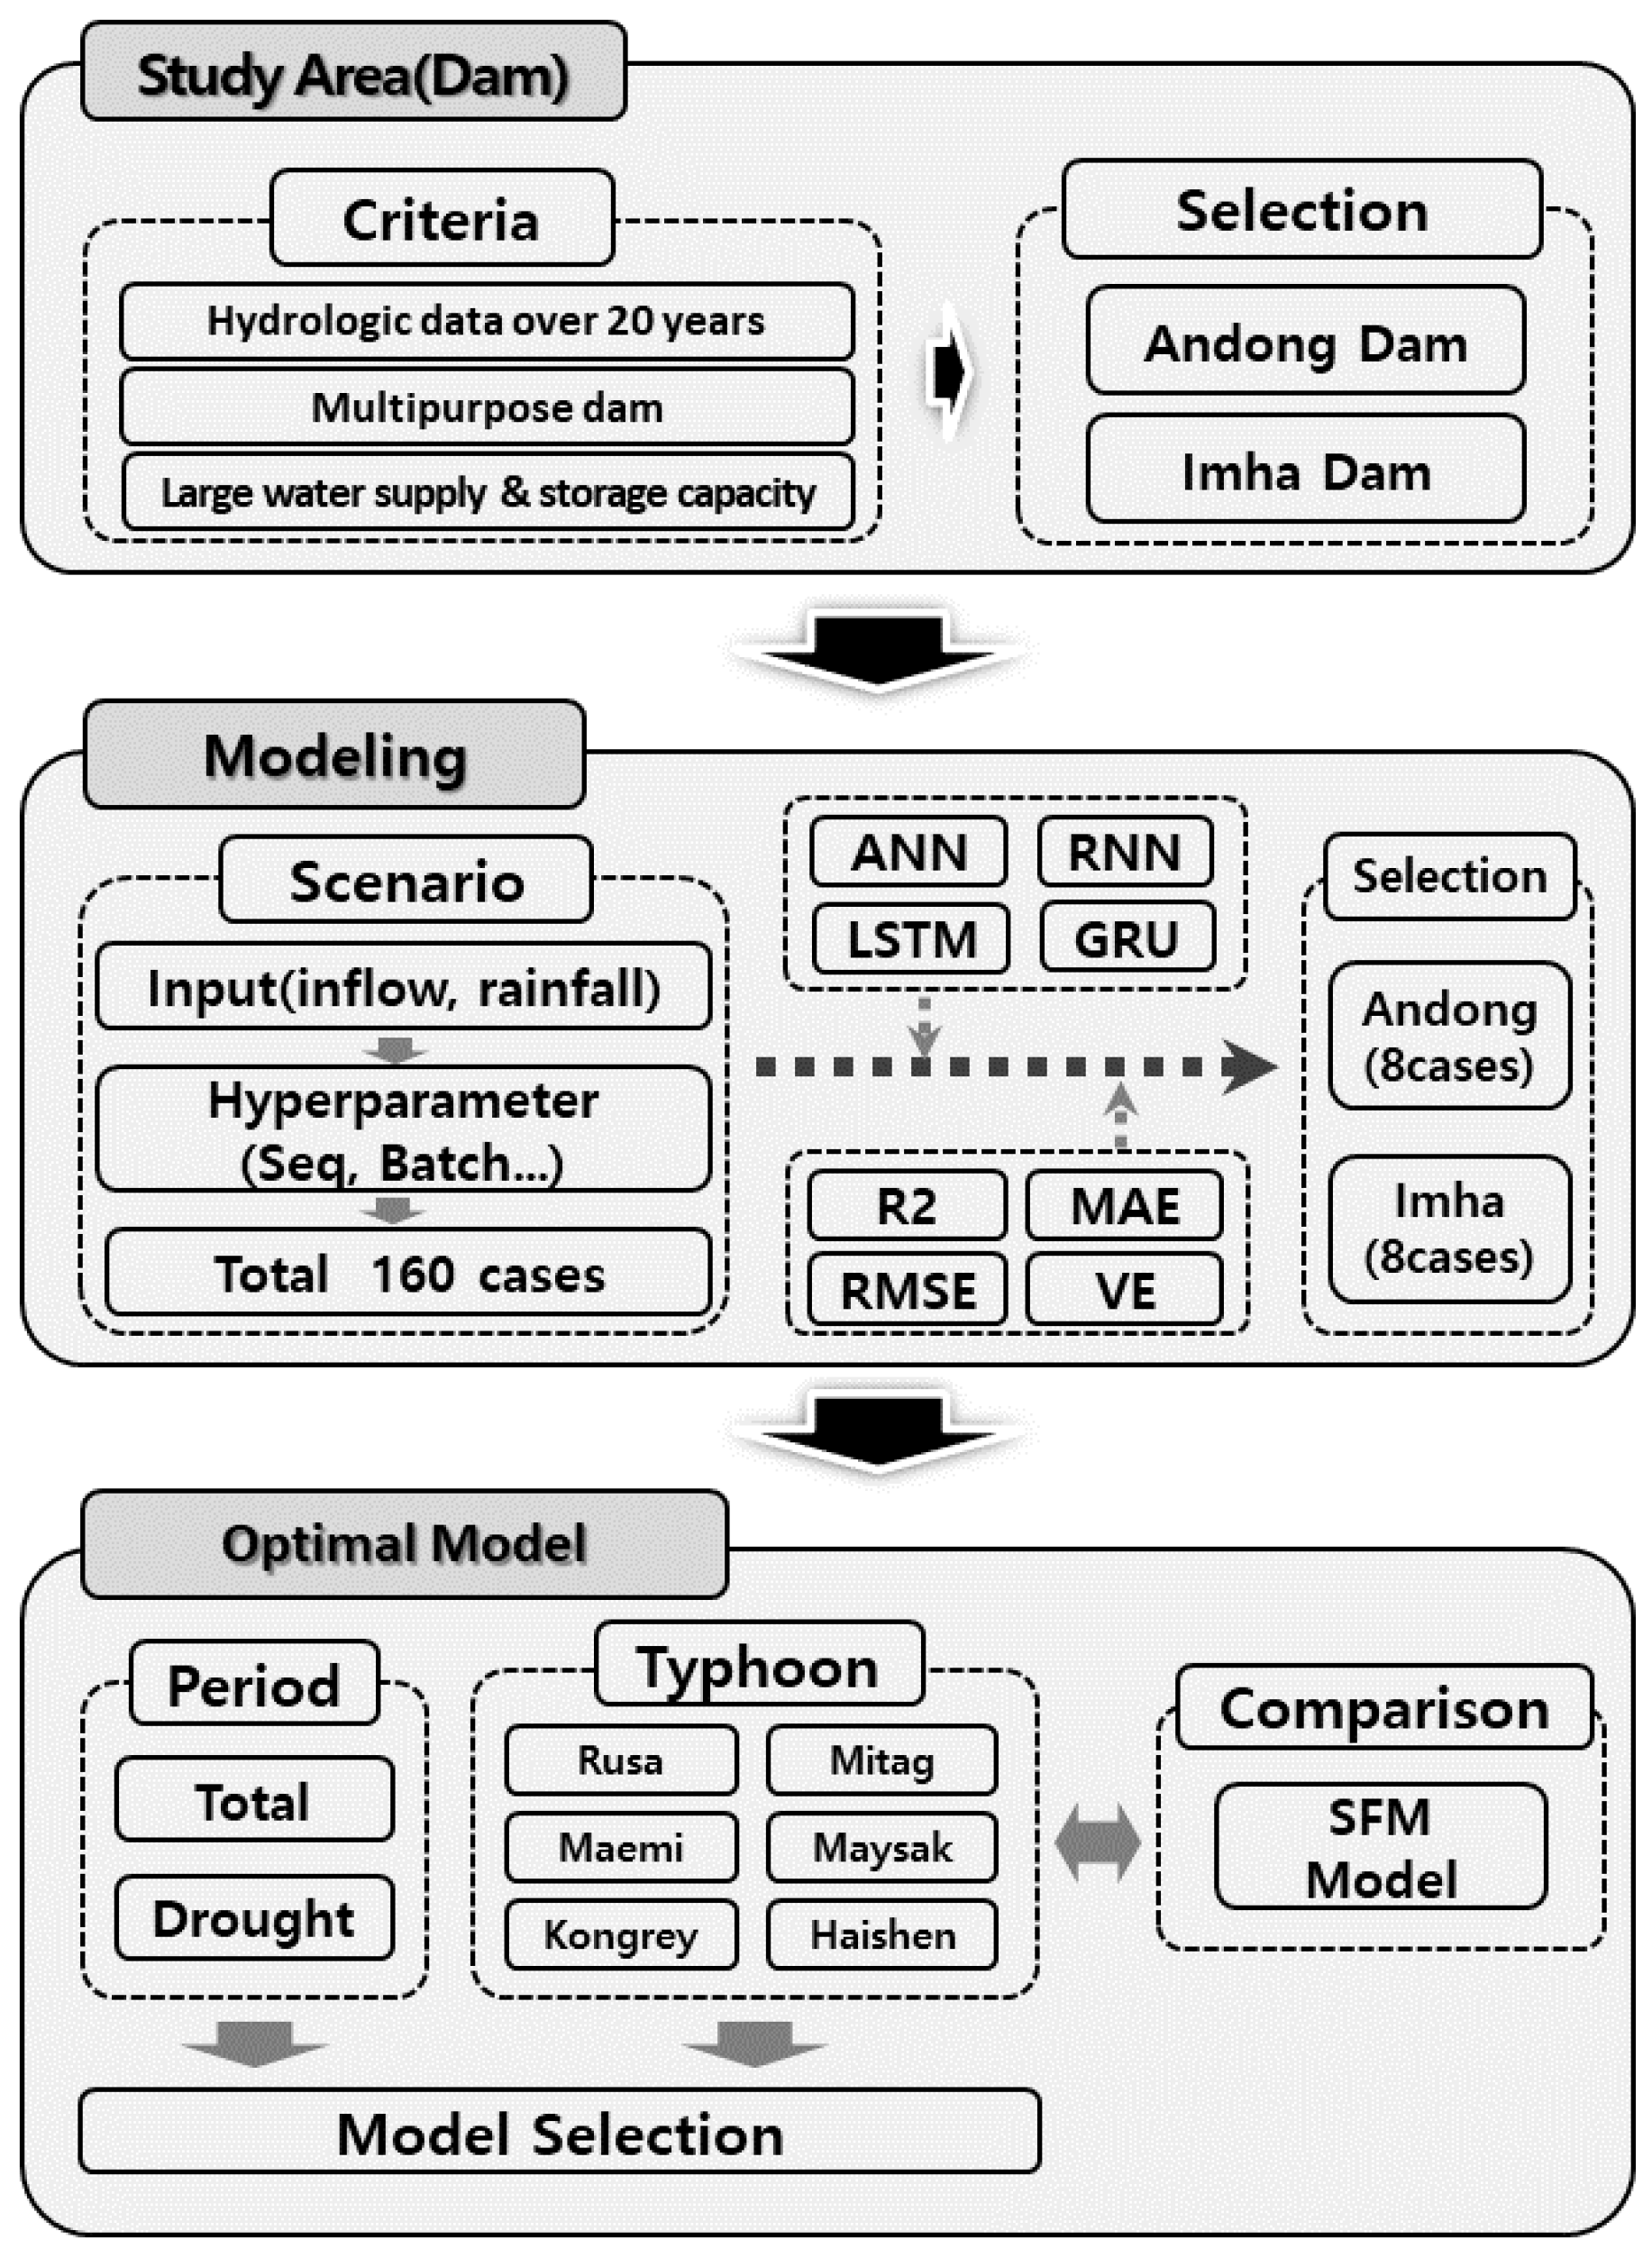
In this study, the ANN model and the RNN model were compared and analyzed to derive an optimal model for predicting dam inflow. The flow chart of this study is shown in Figure 1. Deep learning is one of the algorithms of machine learning and is a more deeply constructed algorithm than conventional neural network structures. Non-linear characteristics between input variables can be estimated and have superior effects over traditional machine learning algorithms. Machine learning is a process in which humans feed the computers a lot of information, and then the computers predict information, while deep learning has the characteristics of the computers learning and predicting it without human’s teaching specifically. The typical activation functions used in the hidden layers of deep learning are mainly Sigmoid, tanh (hyperbolic tangent), and Rectified Linear Unit (ReLU). The sigmoid function is a logistic regression function with values between “0” and “1,” which is utilized for simple classification problems. The tanh function has a value between “−1” and “1,” and as it moves away from the center value, the slope is lost during the backpropagation. For solving this slope loss problem is the ReLU function, and all values below “0” are treated as “0” to stop the learning progress [14].
The RNN is a specialized model in the field of ordered data processing. In particular, time series data are mainly utilized, and the previous output data are cycled back into the input. The following is a comparison of the hidden layer calculation Equation (1) of Convolution Neural Network (CNN), which processes grid data like an image, and the hidden layer calculation Equation (2) of the RNN.
The RNN has the characteristics of weighing each data individually to determine its importance and memorize it while turning to the next data, but there appears a gradual loss of information of distant past data in the hidden layer; therefore, a method supplemented with a separate memory cell prepared is LSTM [15]. The LSTM is one of the RNN models and is composed of a Forget gate, an Input gate and an Output gate. In order to solve the problem of gradient loss that occurs as the time difference increases in the RNN model, the LSTM model introduces a cell. Information is stored in this cell, and it plays a role in preventing the stored information from being lost in the process of analysis. The gate serves as a filter that allows unnecessary information to be forgotten or necessary information to be stored and passed through the cell. This is represented by Equations (3)–(6). In the forget gate, how much past data will be forgotten is determined, and the input gate plays a role in estimating important values among the incoming data. Output gates are used to keep information from past data and predict them simultaneously.
where is the activation function, is the input weight, is the cyclic weight, is the previous stage output, is the new output value, is the current input vector, and is the bias.
In addition, the Gated Recurrent Unit (GRU) is a method with the structure improved for processing faster than LSTM [16]. GRUs are configured as Reset gate and Update gate for the advantage of lower learning weights; therefore, faster processing speed with similar performance compared to LSTM is observed. Reset gate determines the ratio of past data to remove, and Update gate determines the discarding past data, such as forget gate of LSTM, and selects only one of t − 1 and t memory data.
2.2. The Storage Function Model (SFM)
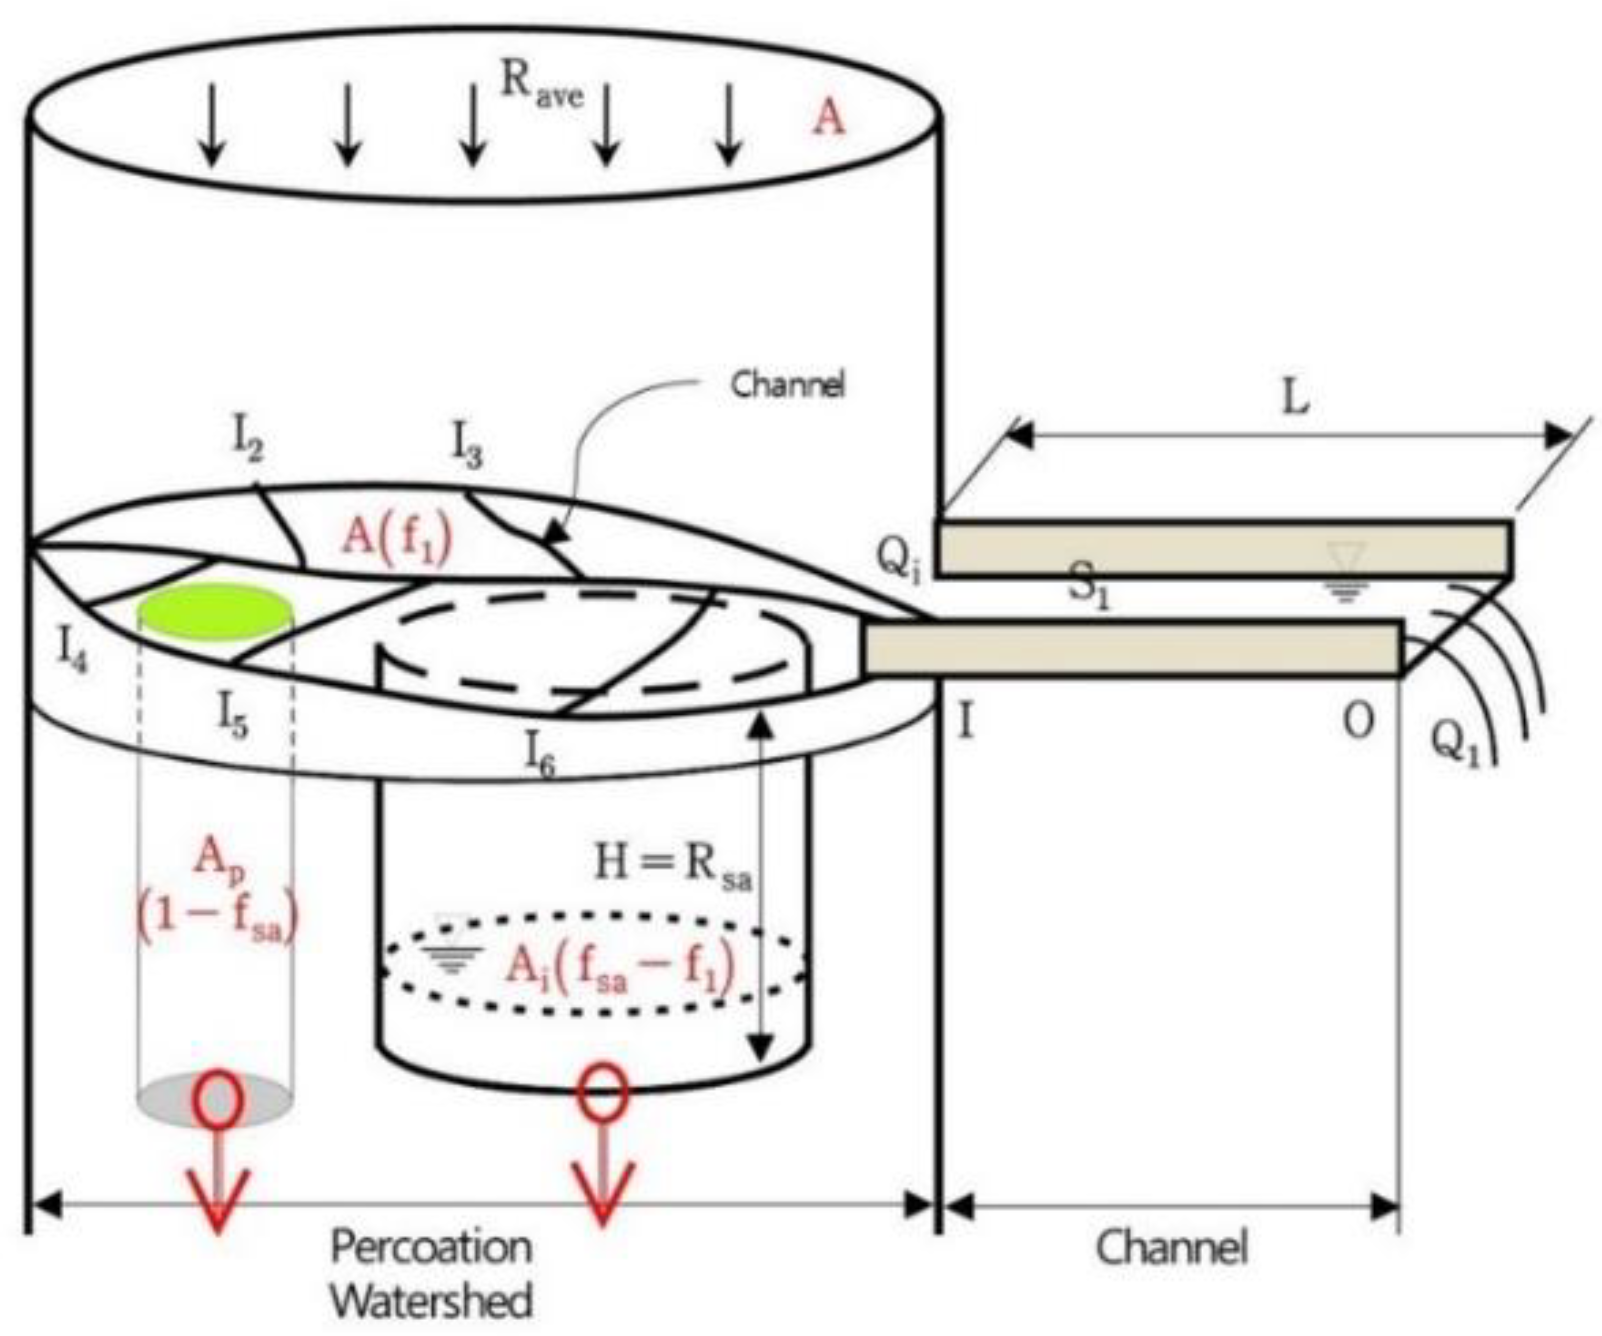
The SFM is one of the rainfall–runoff models, and calculates the runoff from the watershed using the reservoir storage and rainfall as main input variables. In this case, impervious area, infiltration, and groundwater are considered. The model makes the basic assumption that stream channels () have a downward slope and that the watershed receives the same amount of precipitation ( as shown in Figure 2. The runoff from the watershed is calculated by Equation (7) [17].
where is the primary runoff rate (dimensionless), A is the watershed area (km2), . is the unit runoff height of runoff area (mm/day), is the unit runoff height of infiltration area (mm/day), is the unit runoff in seepage areas directly infiltrating groundwater, and is the base runoff (m3/s).
Korea Water Resources Corporation (K-water) operates dams through inflow prediction using the SFM, and the parameters of the SFM corresponding to each dam are optimized in consideration of the characteristics of the dam basin [17].
2.3. Study Area
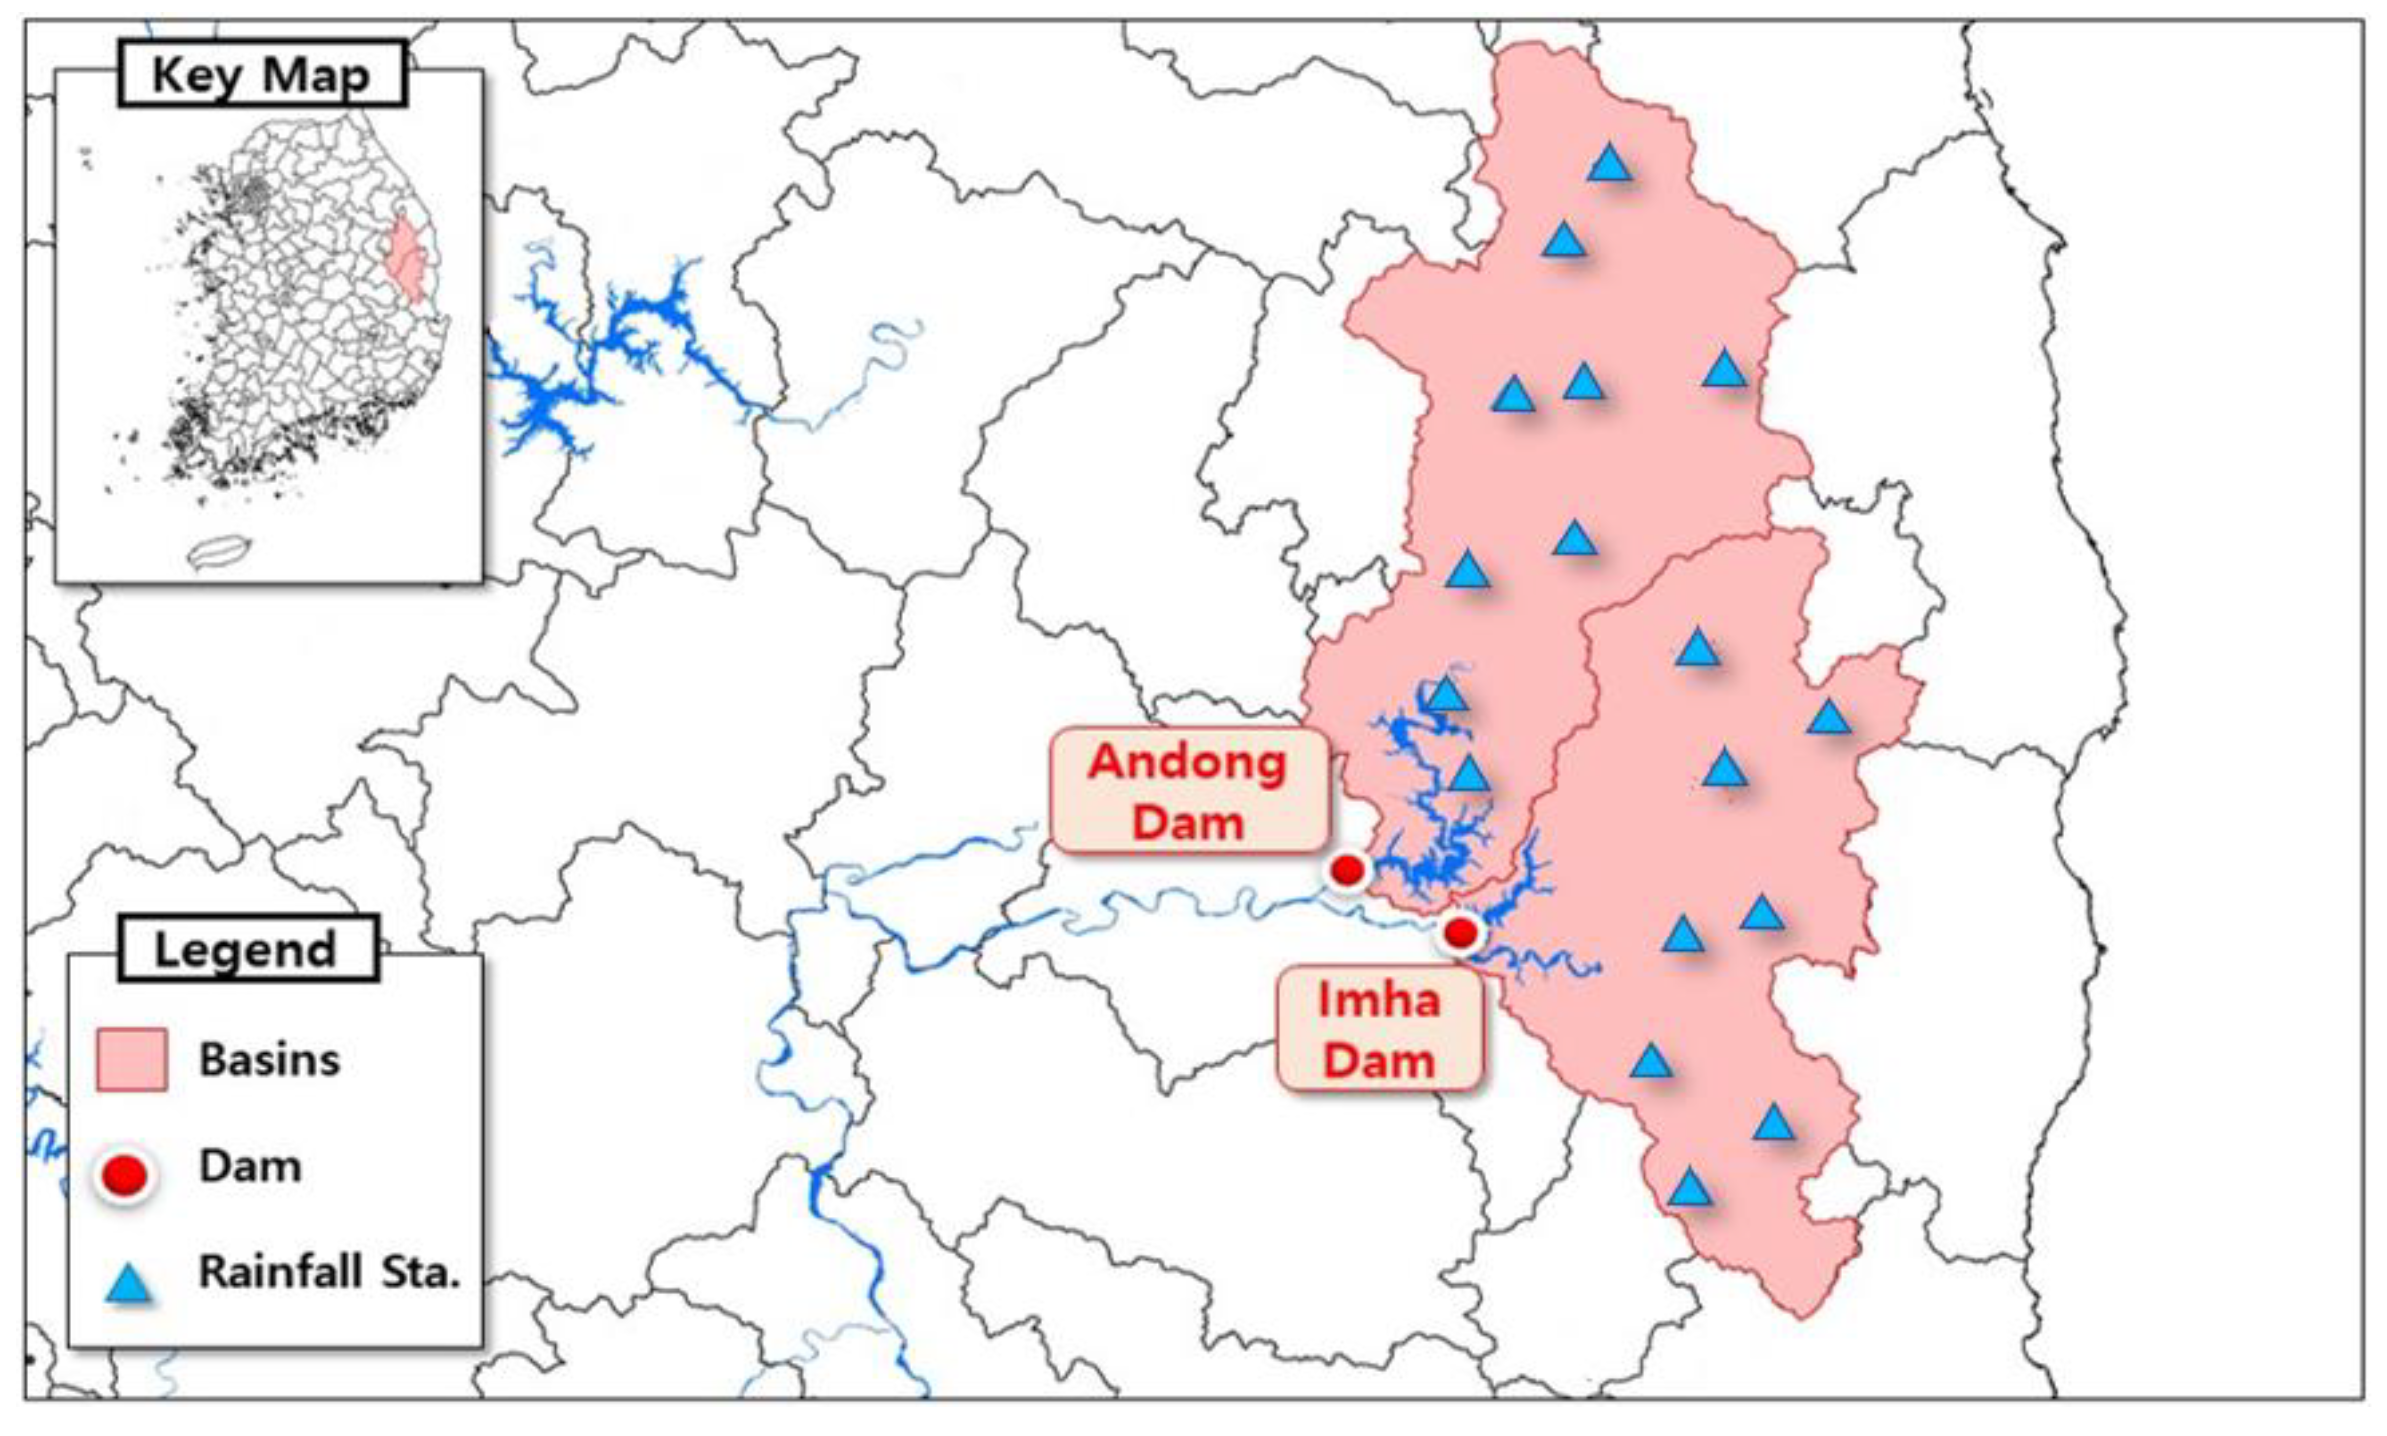
Sufficient learning materials are required to calculate the inflow of dams using deep learning. In this study, Andong Dam and Imha Dam of Nakdong River were selected as the study areas among multi-purpose dams in Korea that have collected hydrological data for more than 20 years and secured the largest amount of water supply and storage capacity in the water system. The locations of Andong Dam and Imha Dam are shown in Figure 3.
Andong Dam was completed in 1976, with a basin area of 1584 km2 and a total water storage capacity of 1248 × 106 m3. It was built to reduce flood damage by utilizing 110 × 106 m3 of flood control capacity and facilities. It is responsible for supplying 926 × 106 m3 of water annually, including Nakdong River’s living water, industrial water, and river maintenance flow. Imha dam was completed in 1993 and has a basin area of 1361 km2 and a total storage capacity of 595 × 106 m3. It is 73.0 m-high, with a 515.0 m-long central cutoff-wall type rockfill dam built to prevent flood damage in the mid- and downstream of the Nakdong River and to supply water to the Nakdong River and the southeast coast areas. It supplies 615.3 × 10⁶ m3 of water annually, including living water, industrial water, and river maintenance flow (Table 1).
2.4. Database Buliding
In this study, the time series period required to compare and analyze four models, ANN, RNN, LSTM, and GRU models, was set from 2001 to 2020, and we intend to build an inflow prediction model by utilizing the inflow and precipitation data of Andong and Imha Dams in the subject period. The equations for daily and hourly inflow are as shown in Equations (8) and (9). Rainfall data collected from nine rainfall observatories in Andong Dam basin and eight rainfall observatories in Imha Dam basin were used.
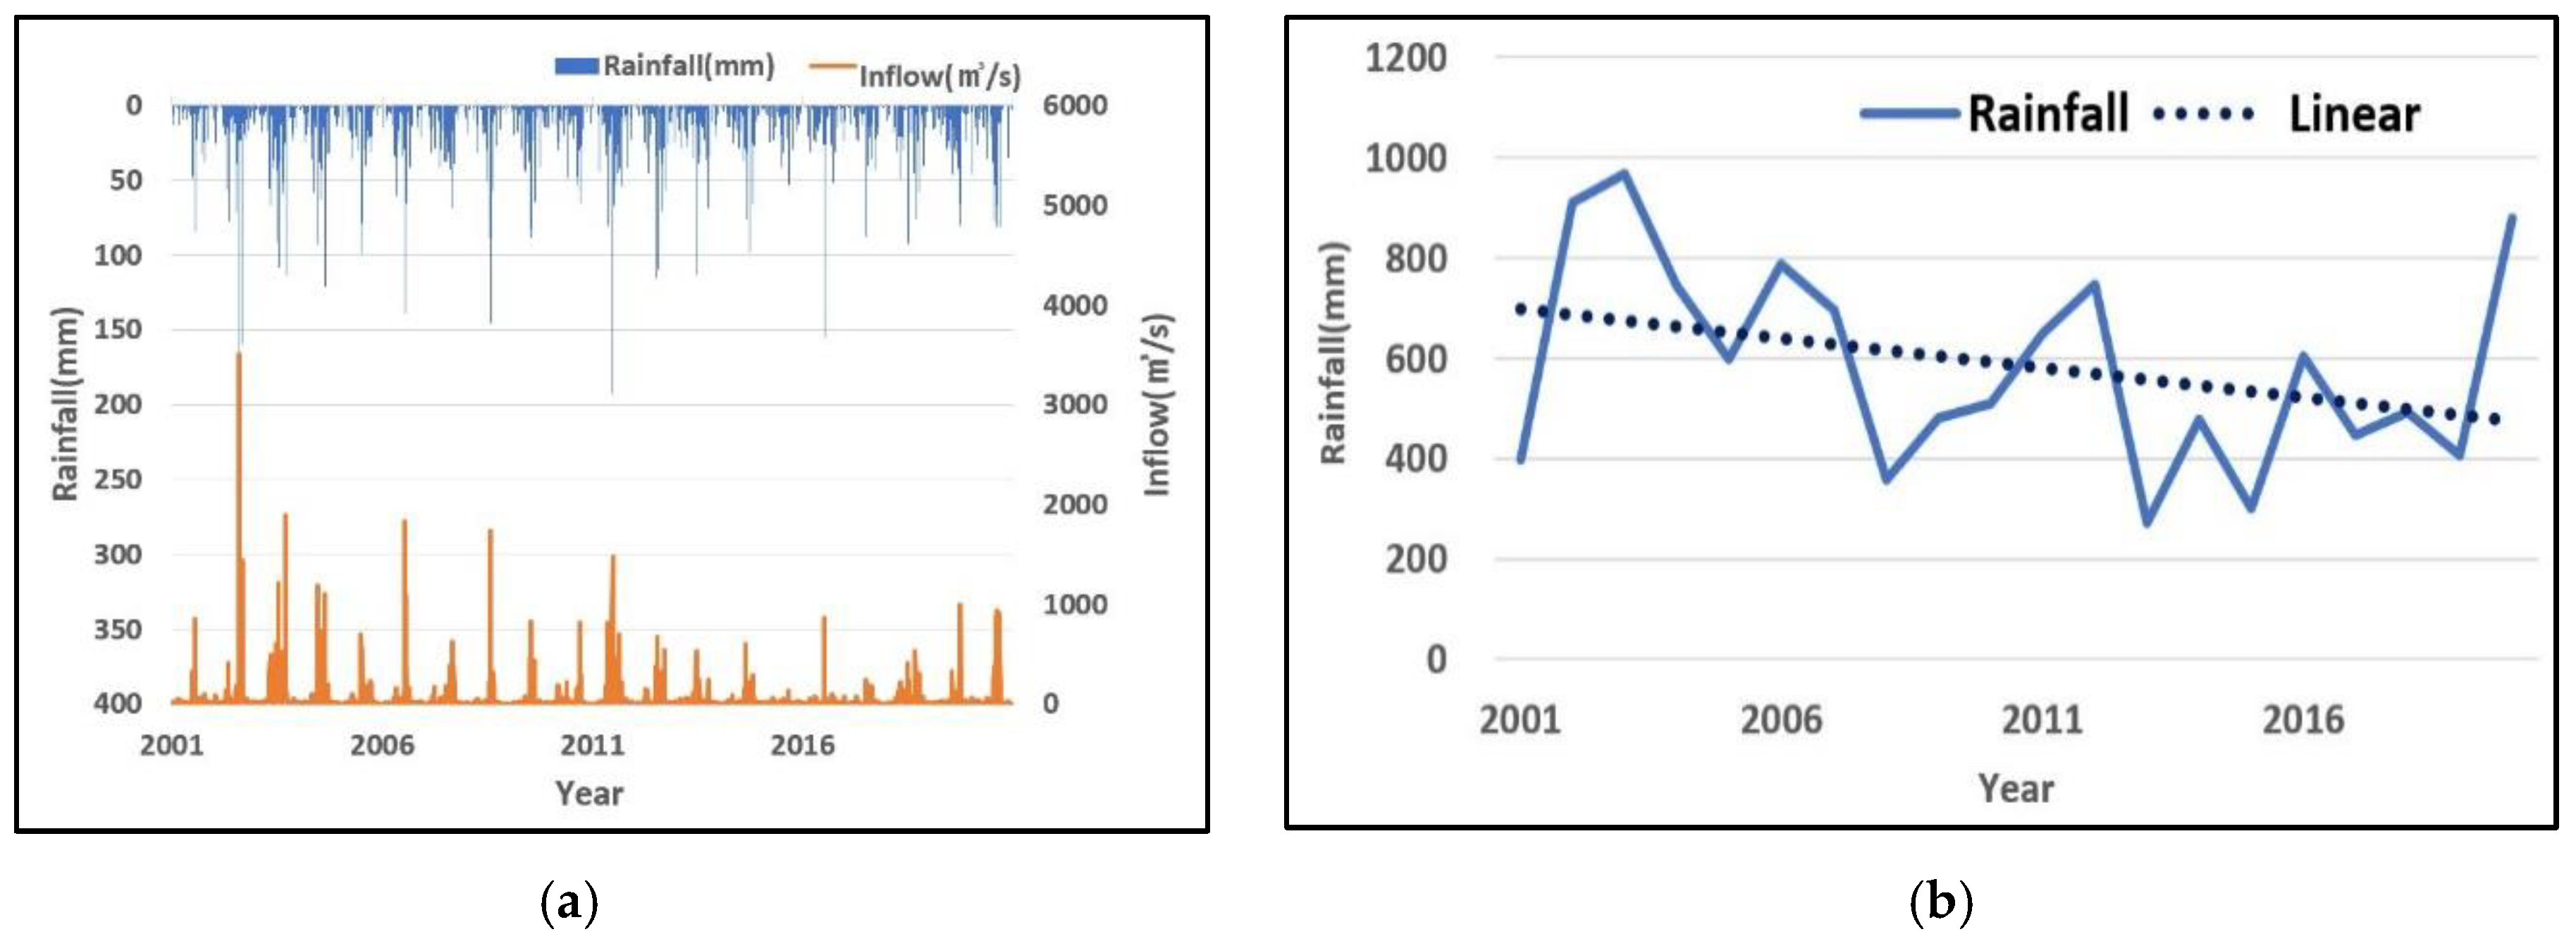
Considering the inflow of Andong and Imha Dams from 2001 to 2020, the annual inflow of Andong Dam in 2003 and 2015 was almost six times different. The inflows of Andong and Imha Dams during the flood period accounts for approximately 2/3 of the average annual inflows, and the precipitation and inflow during specific periods, such as the normal season or the drought and flood periods, are different. Therefore, it is necessary to analyze after dividing the seasons into the normal season or the drought and flood periods when selecting the optimal model later. Figure 4 shows the rainfall and inflow of Andong Dam watershed for 20 years.
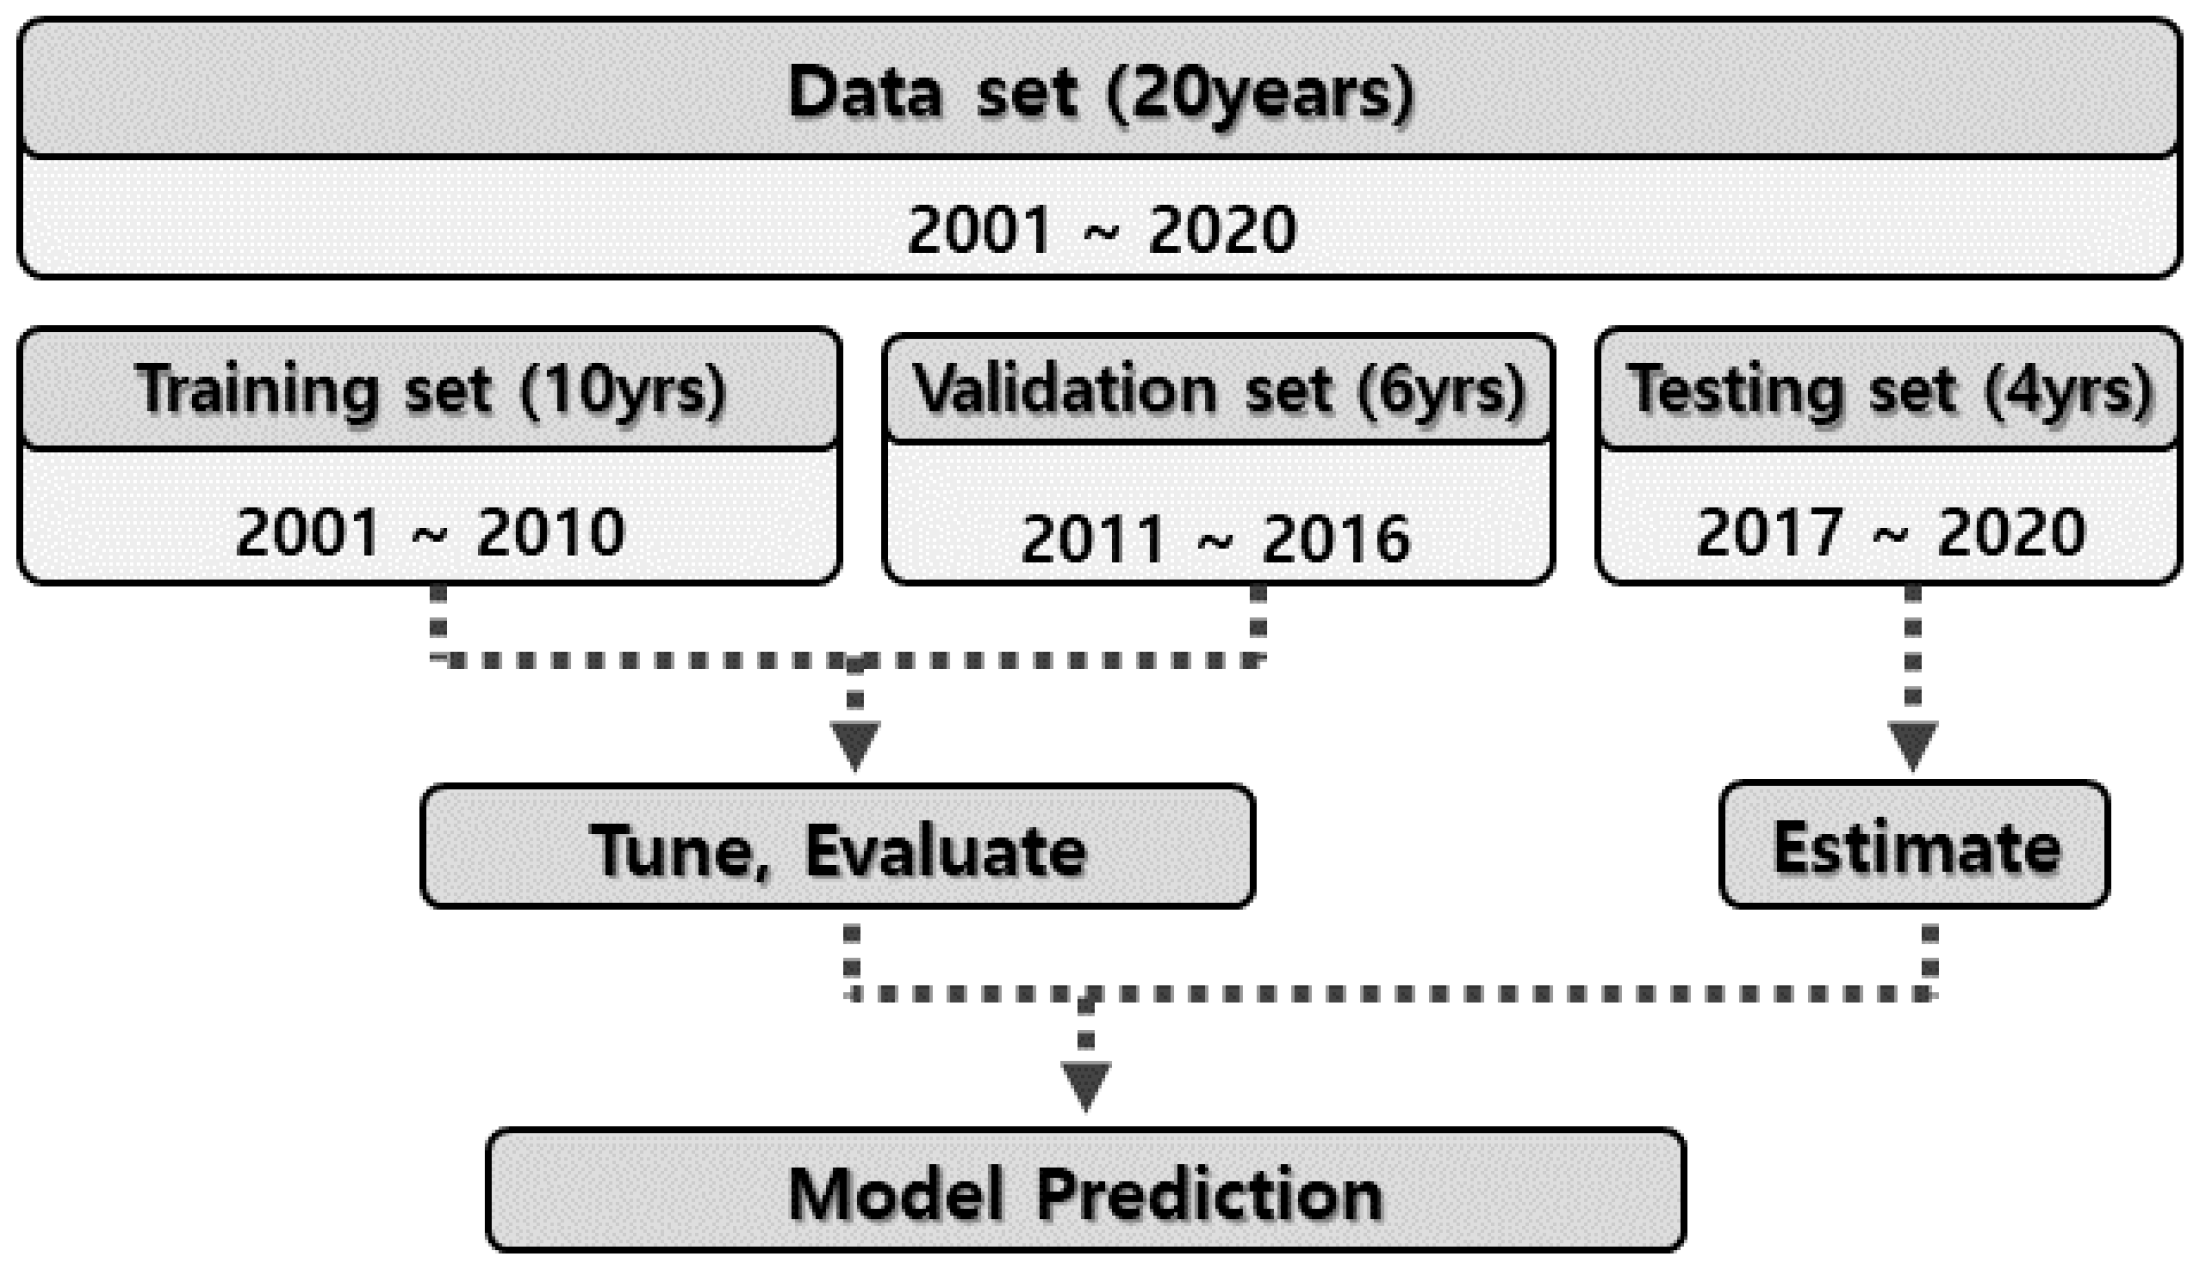
There were four releases through Andong–Imha connection tunnel from 2019 to 2020. The corresponding discharge was calculated as the inflow of Andong Dam and, therefore, excluded from data preprocessing. Since the range of inflow and precipitation data is wide, data normalization was used to convert it to a value between 0 and 1 by Min–Max Scaling. In addition, the data for 20 years are divided into a training set, a validation set, and a testing set in a 5:3:2 ratio as shown in Figure 5.
2.5. Input and Output Predictors
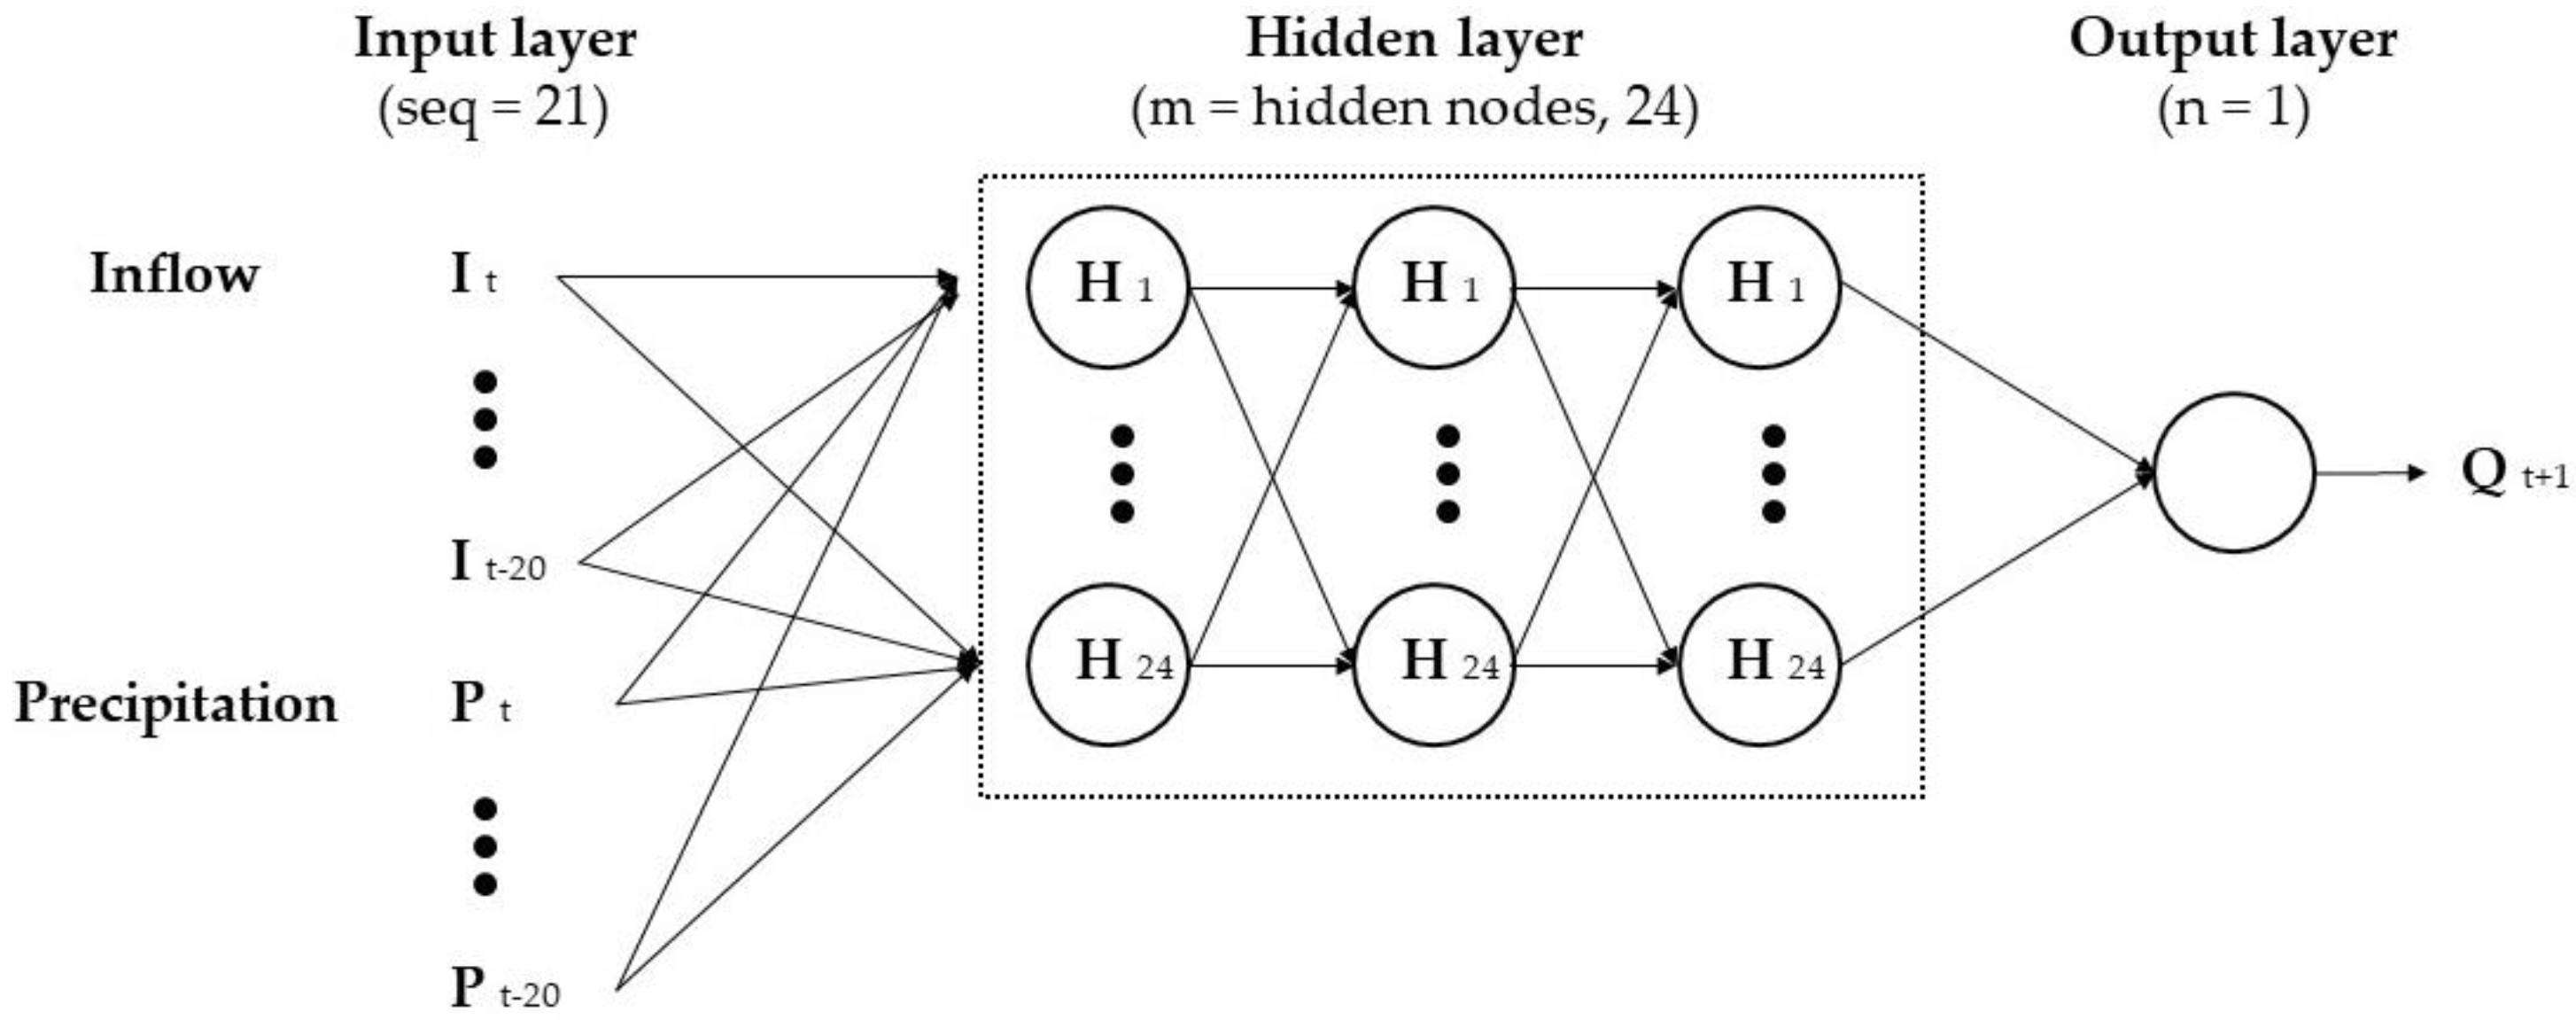
In this study, precipitation and dam inflow from previous times were used as input data to predict the inflow of the dam. The number of previous times precipitation and inflow are considered for dam inflow prediction is related to the sequence hyperparameter to be described later. For example, if the sequence is 21, 21 precipitations ( ··· ) and 21 dam inflows ( ··· ) are simultaneously considered. and are precipitation and dam inflow at the current time, respectively, is the dam inflow at the next time step to be predicted, and and are the precipitation and dam inflow at the previous time steps to be considered for predicting the dam inflow, respectively. Figure 6 shows a schematic diagram of the input and output data of the model with sequence 21.
2.6. Optional Hyperparameter
In this study, two hyperparameters (Sequence and Batch size) were optimized by applying a grid search at regular intervals as shown in Table 2. The hyperparameters were optimized by applying a grid search at regular intervals shown in Table 2. The trial-and-error method was additionally applied to compensate for the shortcomings of grid search, which can be difficult to find optimal hyperparameters with regular interval application. The trial-and-error method found optimal variables for sequence length and batch size within the range of 1–100 and compared them with the results of grid search. In particular, the reason why the sequence length(hour) was selected as 12 is that for flood control at the multi-purposed dam, outflow discharge is approved by the government one day before the opening of the gate and notified to downstream residents in advance. Among the high-accuracy models, when overfitting occurs compared to the validation data and test data, the dropout method was used to supplement the analysis results. The remaining hyperparameters without grid search were optimized with trial and error. The application ranges of each parameter are shown in Table 2, and Learning rate 0.001, Dropout 0.2, and Hidden layer 3 were applied as optimal values in this study.
The name of the scenario is the first letter of ‘dam name–day/time–application model–scenario order or optimization′. As an example, the scenario is named “ADA-S1”, which means “Andong–Day–ANN–Scenario No.1”, and “ADA-Opt”, which means “Andong–Day–ANN–Optimize”.
To evaluate the statistical error and accuracy of the model according to the hyper-parameter for each model scenario, the coefficient of determination (R2), mean absolute error (MAE), root mean square error (RMSE), and volume error (VE) presented by Hu et al. [18] were used as performance indicators. Table 3 representatively shows the ANN model results for Andong Dam among 8 cases (2 dams × 4 deep learning models) that analyzed the best performance according to each scenario. Among the various scenarios, ADA-S9 for daily data and AHA-S4 for hourly data were selected.
Table 4 shows the optimal scenario selection and the corresponding R2 by comparing the observations and simulations for each model. The ANN model of the daily data at Andong Dam had a correlation R2 validation indicator of 0.91, which was closest to the observation compared to other models. However, in the peak inflow, the GRU model showed the closest results to the observations. In the peak inflow of the daily data of Imha Dam, LSTM model showed 925.2 m3/s, least different from the actual inflow. As for the scenario result applying the time data of Andong Dam, the correlation of the ANN model was 0.94, similar to the daily data usage, which was the closest to the observation. Unlike Andong Dam, in Imha Dam, the RNN model showed less difference between actual peak inflow and predicted peak inflow than the ANN model. In particular, it was the smallest in the LSTM model at 34.5 m3/s.
2.7. Performance Evaluation of Optional Scenarios
For the evaluation for the performance evaluation of the scenarios, the RMSE-observed standard deviation ratio (RSR) and the Nash–Sutcliffe efficiency (NSE) were applied among various criteria. The equations for each criterion are shown in the following Equations (10) and (11). With the calculated RSR and NSE, the model performance can be judged based on the general performance rating (Table 5) [19].
where is the observed value, is the mean value, is the predicted value, and is the numbers of data.
Table 6 shows the RSR and the NSE calculated for the validation and test data of the selected scenarios (Table 4), and the performance ratings evaluated with these values. As a result of having validated the selected scenarios, the RSR value of Andong Dam daily data was low and similar compared to the Imha Dam results, and the evaluation result was “Very Good” in the ANN model and “Good” in the RNN model. In the hourly data, the ANN model showed the lowest result of 0.34, and was evaluated as “Very Good” in all models. Similar to Andong Dam, Imha Dam was evaluated as “Good” in the RNN model except the ANN model. In the hourly data, the evaluation was “Very Good” in all models and the NSE value was above 0.90, deriving reliable results.
3. Selection of Optimal Models
3.1. Drought Period
In order to select the optimal model according to the period for Andong Dam and Imha Dam, first, the inflow by quantile for the total test period (2017–2020) was compared.
Then, the analysis results for each quantile of the inflow during the normal and dry season are derived, and the daily inflow from Andong and Imha Dams are used to select the inflow prediction model with the highest reliability during the drought period. In addition, the periods of 28 June–20 August 2017, and 13 February–29 March 2018 in the study area was in the ‘caution’ stage of drought crisis warning under the “Fundamental Act on Disaster and Safety”. Therefore, this period data was used for drought period analysis.
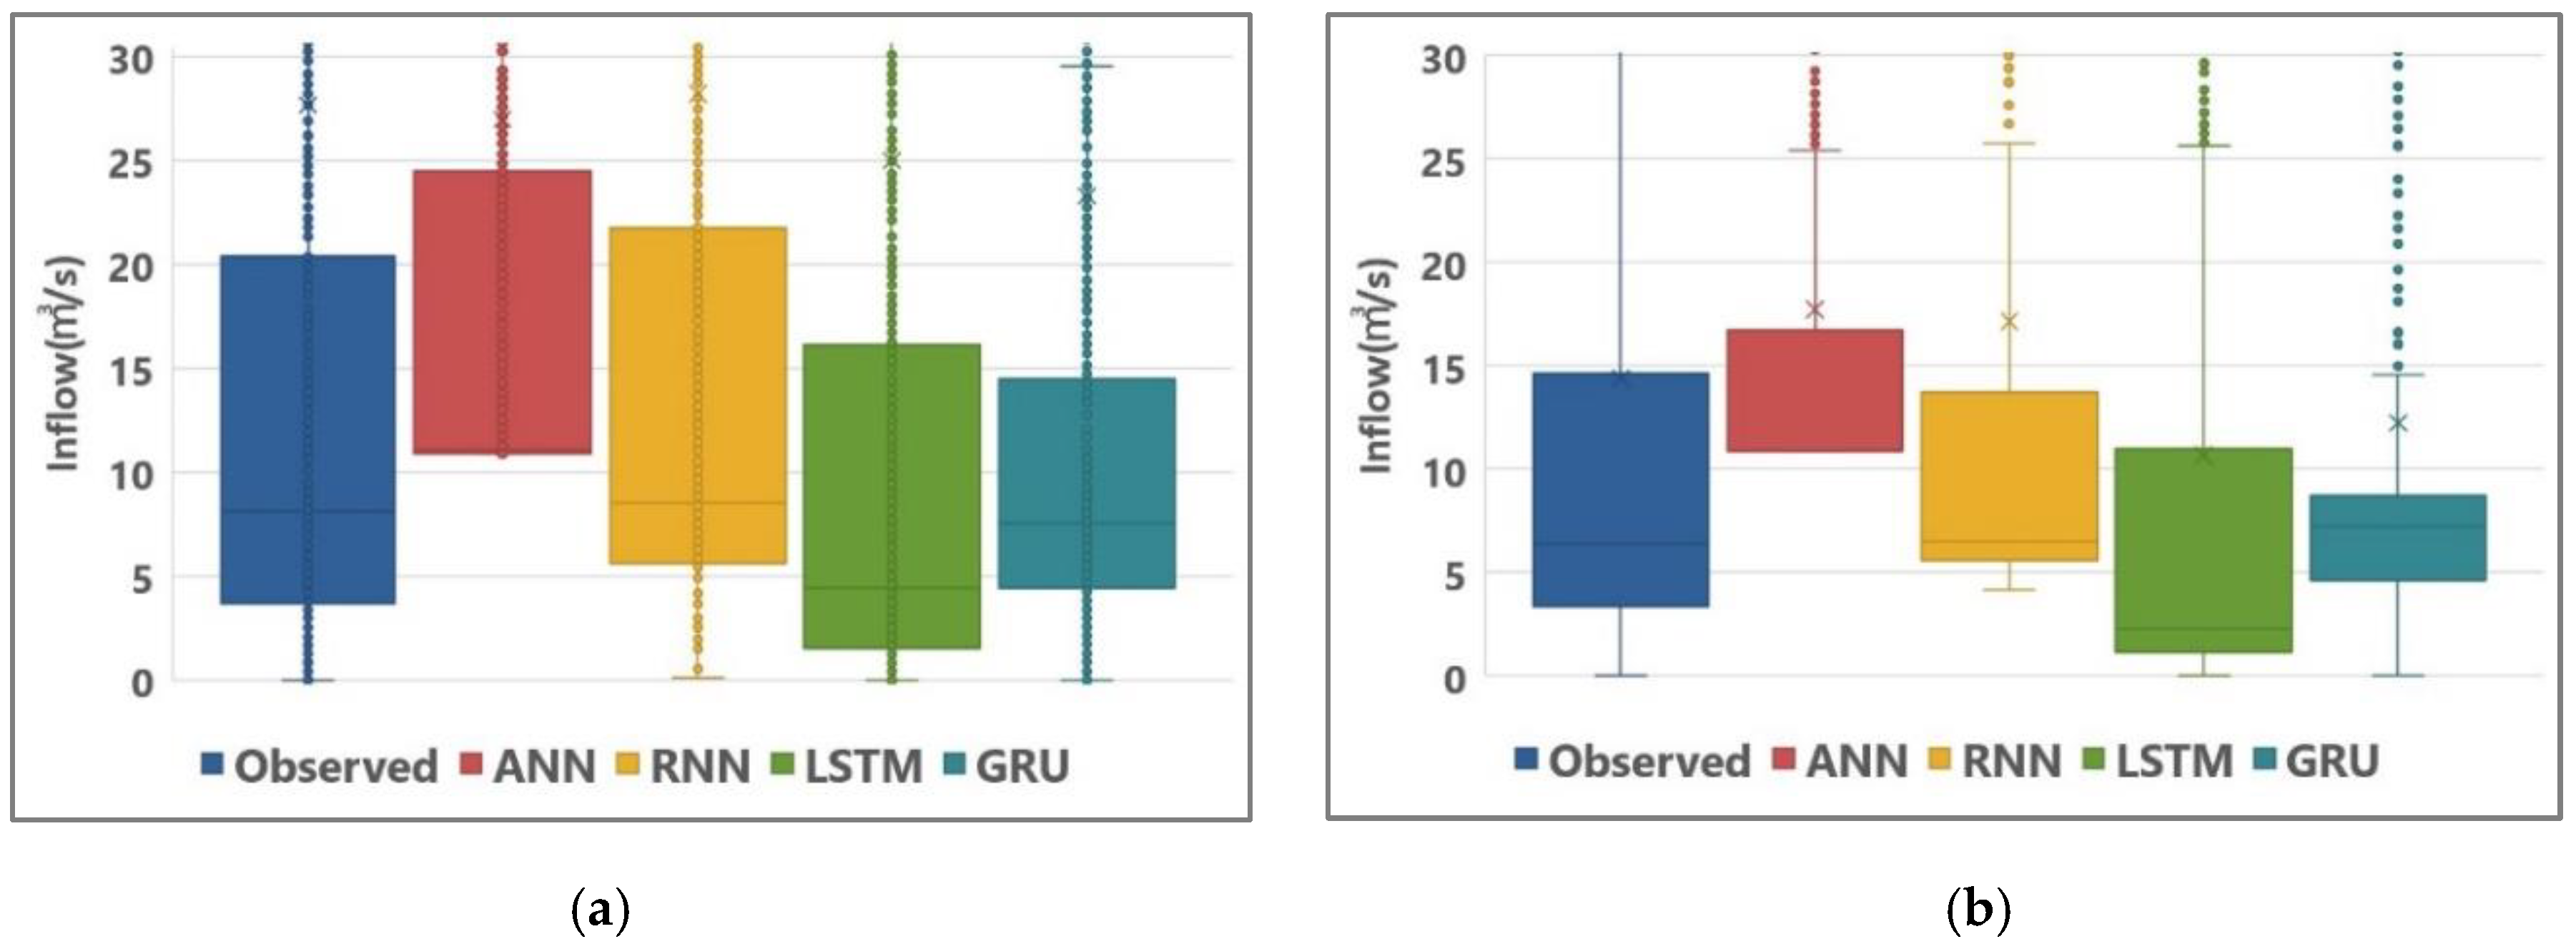
Table 7 shows the inflows of the 1st (25%), 2nd (50%), and 3rd (75%) quartiles and peak inflows of ADA-S9, ADR-Opt, ADL-S1, and ADG-S1, which are the optimal scenarios for Andong Dam (Table 4). Over the total period (2017–2020), the RNN model showed that the 1st, 2nd, and 3rd quartile values were close to the observations, especially within the maximum difference of up to 2 m3/s. In the drought period (2017–2018), the RNN predicted the 2nd and 3rd quartile inflows and maximum inflows closest to the observations, excluding the 1st quartile values. The difference in the maximum inflow between RNN predictions and observations was 6.25 m3/s, the smallest difference compared to other RNN models. Figure 7 shows a comparison of the predicted inflow ranges for each model versus the observed ranges for the total and drought periods.
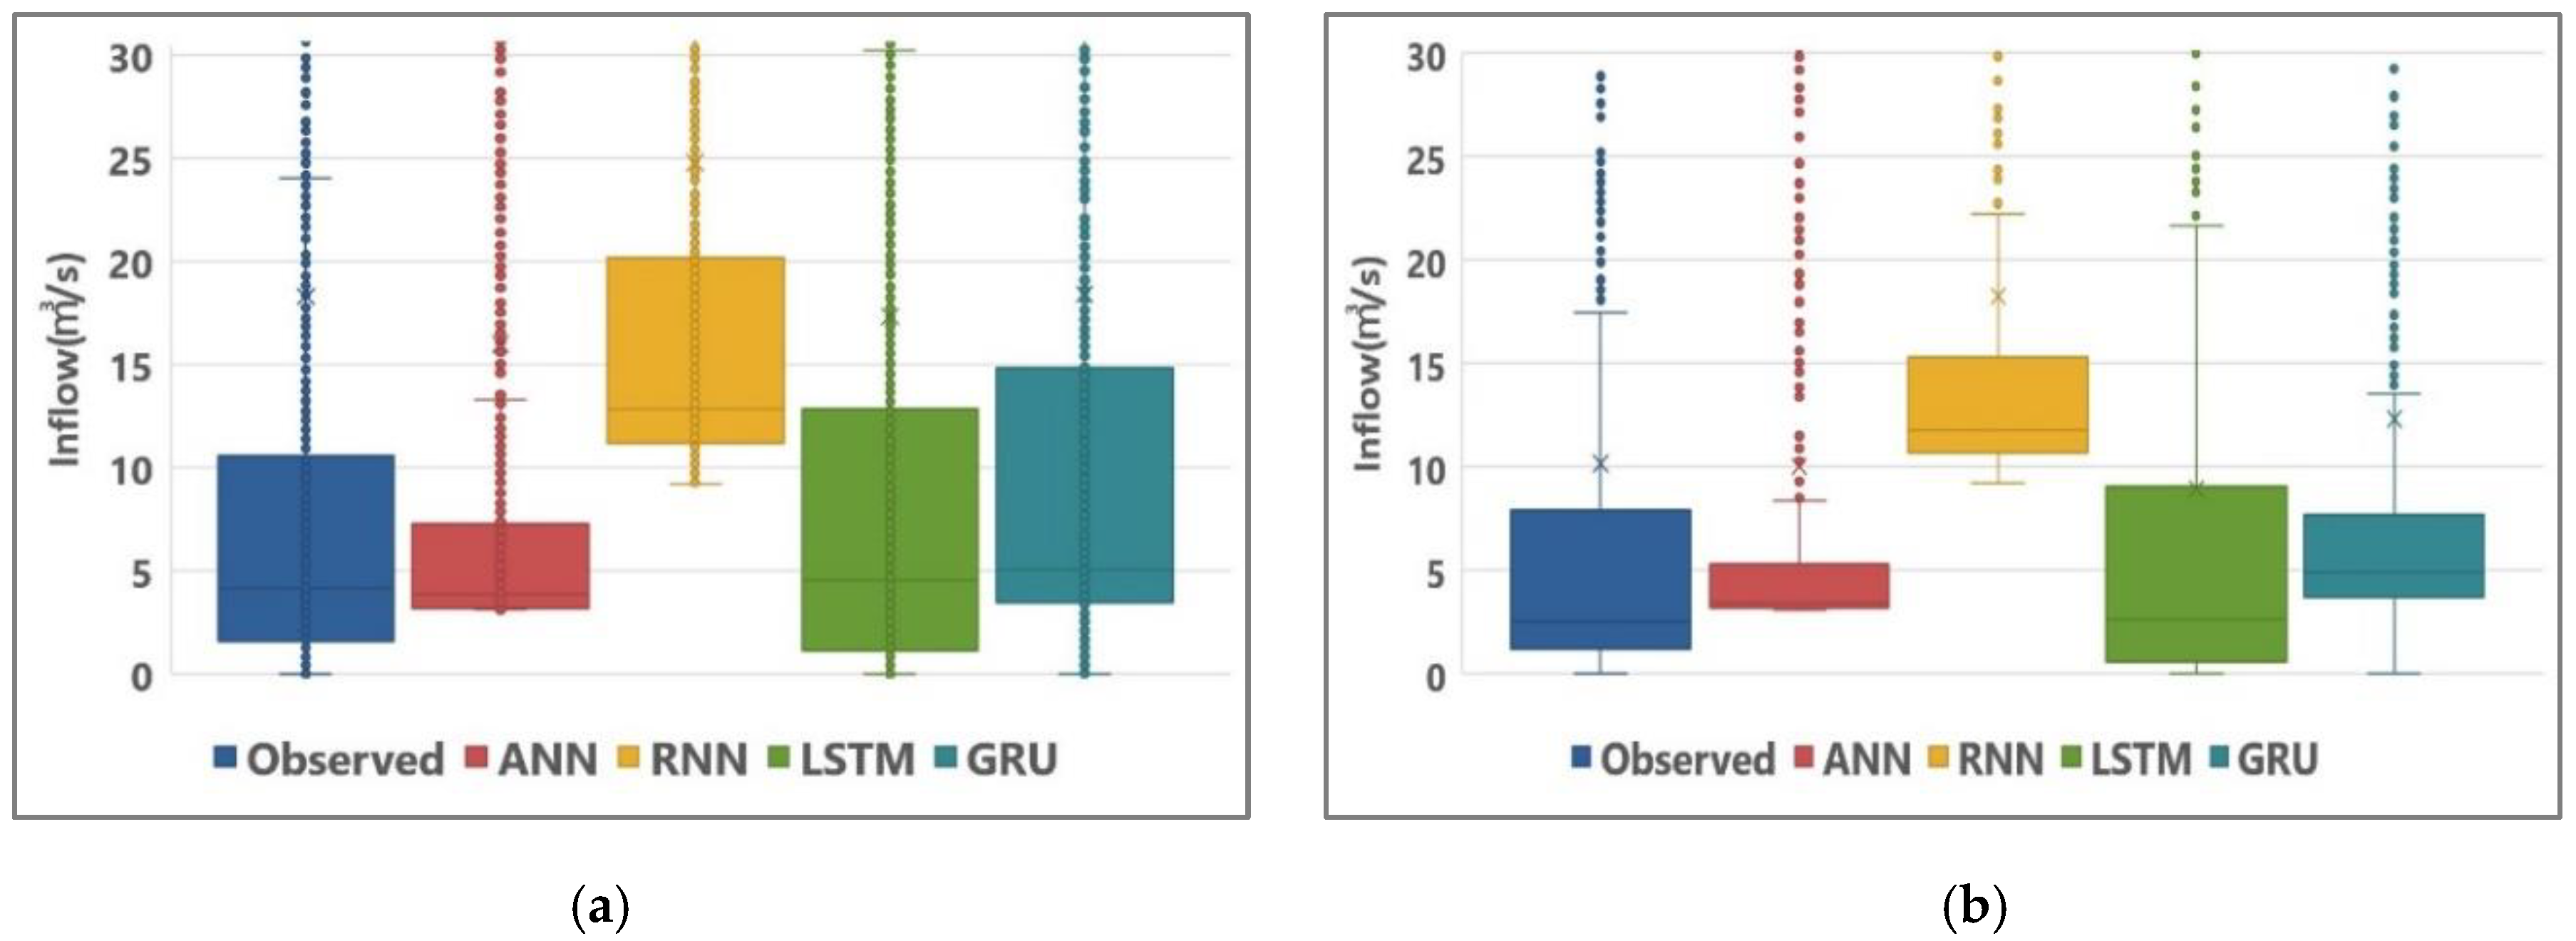
In the case of Imha Dam, the inflows of the 1st, 2nd and 3rd quartiles and peak inflows were calculated by applying the optimal scenarios (IDA-S9, IDR-S4, IDL-Opt, IDG-S5). Figure 8 shows a comparison of the predicted inflow ranges and the observed ranges of each model for the total and drought periods at Imha Dam. As shown in Table 8 and Figure 8, the prediction of the RNN shows the largest difference from the quartile value of the measured inflow compared to other models. On the other hand, inflow predictions of LSTM have the smallest differences from observations in the 1st and 3rd quartiles during the total period and in the 1st and 2nd quartiles and the maximum during the drought period. In the prediction of the maximum inflow, the difference between observation and prediction was 45.14 m3/s, which showed a difference of approximately 10%. The GRU prediction showed the most accurate result with a difference of 0.27 m3/s from the observation in the 3rd quartile of the drought period. As shown in Table 8, in Imha Dam, LSTM was selected as the optimal model for inflow prediction during the total and drought periods.
As a result of predicting the dam inflow during the drought period, the RNN model for Andong Dam and the LSTM model for Imha Dam were closest to the observed inflow. The reason that the RNN model yielded better results than the LSTM model at Andong Dam lies in the activation function. The existing RNN model uses the tanh function among the activation functions to cause the gradient loss problem. However, in this study, the ReLu function was used to reduce gradient loss during backpropagation learning. The reason that the LSTM model was selected as the optimal model in Imha Dam is that the loss was less than that of the RNN model due to the cells of the LSTM with memory function. In addition, although the watersheds of the two dams are close, the optimal model is different because various factors such as land conditions, river slope, and rainfall characteristics worked. Therefore, it can be seen that the analysis process to find an appropriate model is important by referring to these points.
3.2. Typhoons
It is important not only to analyze the normal or drought period using daily data to predict the inflow to the dam, but also to analyze it using hourly data for flood control. In particular, in the case of Imha Dam, the inflow of dams in flood season (21 June–20 September) was 157.9 × 10⁶ m3 in 2019, while it was 743.6 × 10⁶ m3 in 2020.In other words, the inflow amount was 4.7 times different even in the same period. Accordingly, by applying the six major typhoon cases to each model, the maximum observed inflow and the prediction of models are compared, and the most accurate model is selected by calculating R2. Table 9 shows the six major typhoons applied in this study. In particular, after the rainy season in 2020, typhoons occurred consecutively, and approximately 270 mm of rainfall fell in the basins of Andong and Imha Dam, and a maximum of 23.4 mm of rainfall per hour was recorded in the basin of Imha Dam. Among the six typhoon cases, Typhoon Maysak and Haishen in 2020 occurred consecutively and, therefore, are considered to be one case.
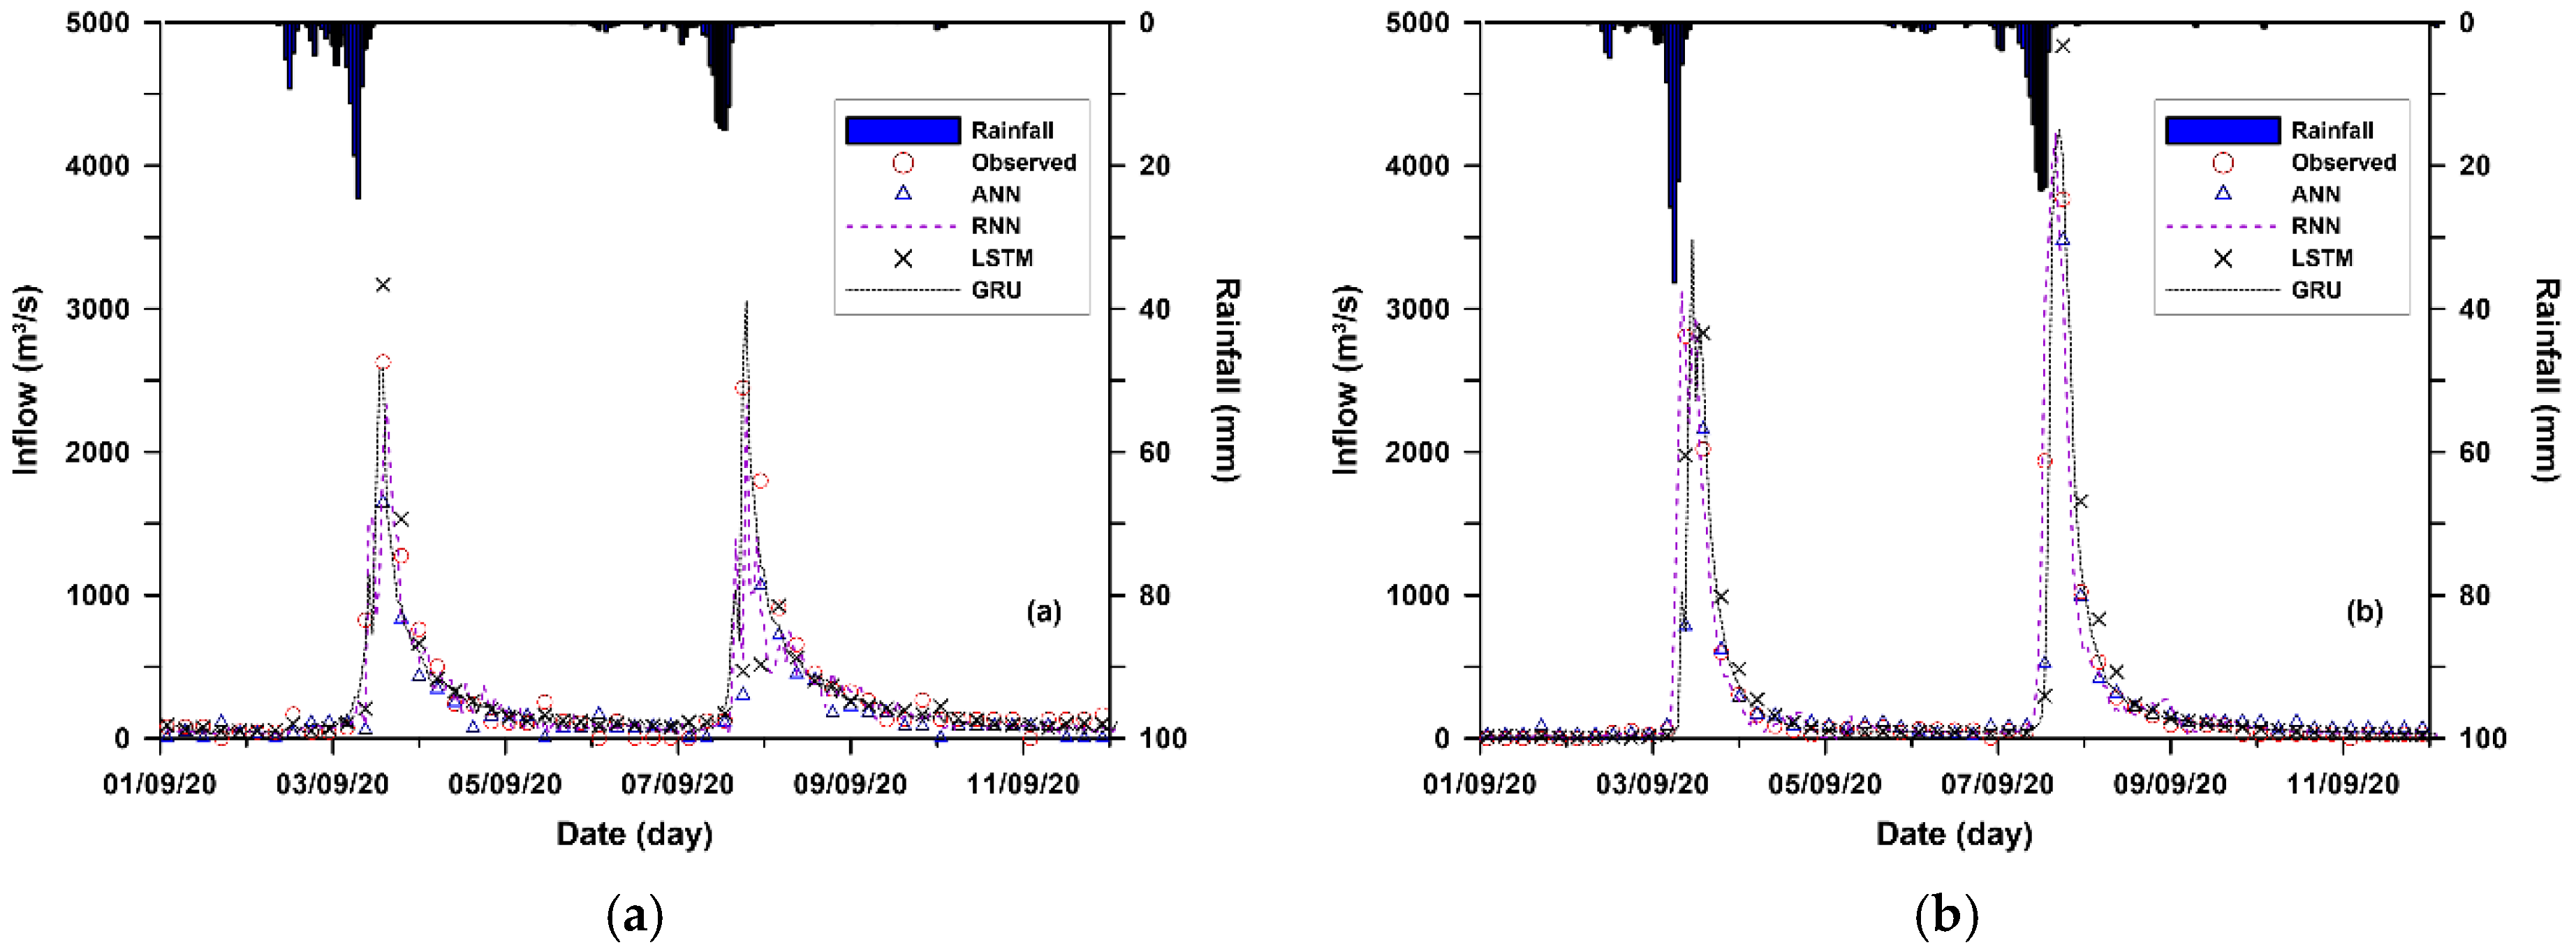
Table 10 and Table 11 show the peak inflow predicted by each deep learning model using hourly inflow data for Andong Dam and Imha Dam, respectively. In Andong Dam, the GRU predictions had the smallest differences from the peak inflows observed from Typhoons Maemi, Kongrei, and Maysak and Haishen (Table 10). On the other hand, in Imha Dam, the RNN prediction showed the smallest difference from the peak inflow observed in Typhoon Rusa, Kongrei and Mitag (Table 11). Figure 9a,b show the comparison of the observations and predicted inflow by four models for Typhoons Maysak and Haisen in Andong Dam and Imha Dam, respectively. The GRU for Andong Dam and the RNN for Imha Dam were selected as the optimal model based on the maximum inflow prediction and R2 value under typhoon conditions. However, as the maximum inflow prediction and R2 values differ greatly depending on the characteristics of each typhoon, such as rainfall strength and preceding rainfall, as shown in Table 10 and Table 11, it is considered desirable to compare various models and analyze for future flood simulation.
K-water, which operates Andong Dam and Imha Dam, is currently using the SFM to predict the inflow of the two dams. Therefore, the inflow of the SFM and the predicted inflow of the GRU (Andong Dam) and the RNN (Imha Dam) were compared through analysis according to typhoon conditions. The SFM was calibrated so that the predicted inflow was closest to the observed maximum inflow while adjusting the parameters. In some cases, the R2 has increased while the maximum predicted inflow has decreases. However, in practical dam operation, the maximum inflow and arrival time are more important factors. Therefore, the calibration was performed to better match the maximum inflow than the R2 between the prediction and the observation.
In Andong Dam, the difference between the predictions and the observations of the maximum inflow for Typhoons Kongrei and Mitag was larger in the SFM than in the GRU. In the case of Imha Dam, the inflow of the SFM was predicted to be lower than the observed value as well as the RNN inflow in all Typhoon conditions (Table 12). These results show that the RNN selected in this study is a reliable model when compared with the results of the SFM currently being used for dam inflow prediction. Overall, the predictions of the deep learning models were closer to the observed maximum inflow than that of the SFM. On the other hand, during Typhoon Maysak and Haishen at Andong Dam, the predictions of the SFM were better in agreement with the observed inflow than those of deep learning models. Therefore, it is necessary to derive more reasonable results through comparison of the predicted values of the SFM and deep learning models when making decisions related to dam operation.
4. Discussion
This study showed the process of predicting and analyzing dam inflow using deep learning models. The reason for conducting this study is that it is important to predict the inflow with high accuracy for dam operation in disaster situations such as drought and flood. Most of the prediction results showed that the RNN models had higher accuracy than the ANN model. The reason for these results is that precipitation and inflow are time-series data, and the RNN models circulate the previous results as input variables so that learning is performed continuously without compromising the learning ability relatively. In typhoon and drought conditions, recurrent neural network models (RNN, LSTM, GRU) were selected as optimal models. In comparison with the SFM and the deep learning models, the prediction of most deep learning models was found to be closer to the observed maximum inflow than that of the SFM, but the SFM also showed better results under certain conditions.
These results suggest that even if dam basins are adjacent, different deep learning models may be selected as the optimal model for each dam by various factors including land condition and rainfall characteristics. Therefore, further studies including various factors such as land condition, evaporation, temperature, and wind speed that have not been considered in this study are needed to predict more accurate dam inflow using deep learning model.
5. Conclusions
In this study, for efficient water resource management of Andong Dam and Imha Dam, the optimal model was selected through comparison and validation of deep learning models in predicting the inflow to the two dams. Considering that dam inflow prediction is a time series analysis, RNN models were mainly applied. Four deep learning techniques—ANN, RNN, LSTM, and GRU—were utilized based on dam hydrology data for the past 20 years to predict the inflow of the dams, and optimal input variables were derived through various indicators. In addition,
- (1)
- To evaluate the detailed prediction capability of the deep learning model with each scenario, the data were analyzed according to quartile values after differentiating the entire period and the drought period. To select a deep learning model most suitable to the drought and normal season based on the scenario, predictions and observations for the inflows of the 1st, 2nd and 3rd quartiles and peak inflow were compared using the daily time series data. In Andong Dam, the RNN model produced the closest quartile values to the observed inflow in the total period (2017–2020) and it also derived the closest to the measurements in the normal and drought period. In Imha Dam, the LSTM model showed the closest to the observations in the normal season. During the drought period, the LSTM prediction showed the smallest difference from the observations in the 1st and 2nd quartiles, whereas the GRU prediction showed the smallest difference in the 3rd quartile.
- (2)
- A comparative analysis of six cases of past typhoons showed different predictions depending on the deep learning models. In Andong Dam, the GRU model showed higher accuracy compared to other models in the inflow prediction. In Imha Dam, unlike Andong Dam, the predicted inflow of the RNN showed the highest correlation and the most agreement with the observations. In Typhoon Mitag, R2 has a high correlation of 0.97 and a difference of 1% between the observations and predictions which is the closest to the measured value compared to other models. As a result of analyzing the selected model, since the dam inflow and precipitation were characterized as time series data, the RNN derived predicted inflow with relatively high reliability.
- (3)
- Compared with the SFM currently used to predict the inflow into the dam, the selected deep learning models derived results that were closer to the observed inflow in the maximum inflow prediction. In predicting future typhoon inflows, using a conceptual or physical model and a deep learning model together will help in efficient decision making.
The appropriate deep learning model varies depending on weather conditions such as drought, typhoon, and torrential rain; therefore, it is important to compare various deep learning models to cope with uncertain future climate change and to manage the operation of reservoirs efficiently and safely. In addition, as the SFM rather than the deep learning model shows better prediction results under certain typhoons, the analytical ability of hands-on workers to utilize deep learning models, as well as existing SFMs is important, as shown in the previous analysis. This study, which analyzed inflow predictions using hydrological data and deep learning models, is expected to contribute to stable dam operation management and disaster response when used as basic data for inflow prediction models of various multi-purpose dams including Andong and Imha Dams.
Author Contributions
Conceptualization and methodology, B.-J.K. and B.-H.K.; validation, Y.-T.L.; writing—original draft preparation, B.-J.K.; writing—review and editing, Y.-T.L. and B.-H.K. All authors have read and agreed to the published version of the manuscript.
Funding
This research was supported by Kyungpook National University Research Fund, 2019.
Institutional Review Board Statement
Not applicable.
Informed Consent Statement
Not applicable.
Data Availability Statement
Data are available on request.
Acknowledgments
The authors thank Kyungpook National University for providing the research fund, 2019.
Conflicts of Interest
The authors declare no conflict of interest.
References
- Yoon, T.H. Applied Hydrology; Cheongmungag: Seoul, Korea, 2011. [Google Scholar]
- Kim, S.H.; Kim, K.U.; Hwang, S.H.; Park, J.H.; Lee, J.N.; Kang, M.S. Influence of Rainfall observation Network on Daily Dam Inflow using Artificial Neural Networks. J. Korean Soc. Agric. Eng. 2019, 61, 63–74. [Google Scholar]
- Kim, M.E.; Shon, T.S.; Joo, J.S.; Jang, Y.S.; Shin, H.S. Forecasting of Short-term Runoff with Artificial Neural Network with Pre-processing Techniques. In Preceedings of the Joint Fall Conference & Water Korea, Daegeon, Korea, 2–3 November 2011. [Google Scholar]
- Mok, J.Y.; Choi, J.H.; Moon, Y.I. Prediction of Multipose Dam Inflow using Deep Learning. J. Korea Water Resour. Assoc. 2020, 53, 97–105. [Google Scholar]
- Lee, J.Y.; Kim, H.I.; Han, K.Y. Linkage of Hydrological Model and Machine Learning for Real-time Prediction of River Flood. J. Korean Soc. Civ. Eng. 2020, 40, 303–314. [Google Scholar]
- Chang, F.J.; Hsu, K.; Chang, L.C. Flood Forecasting Using Machine Learning Methods; MDPI: Basel, Switzerland, 2019; ISBN 978-3-03897-549-6. [Google Scholar]
- Chang, F.J.; Chiang, Y.M.; Tsai, M.J.; Shieh, M.C.; Hsu, K.L.; Sorooshian, S. Watershed rainfall forecasting using neuro-fuzzy networks with the assimilation of multi-sensor information. J. Hydrol. 2014, 508, 374–384. [Google Scholar] [CrossRef]
- Chakravarti, A.; Joshi, N.; Panjiar, H. Rainfall Runoff Analysis Using the Artificial Neural Network. Indian J. Sci. Technol. 2015, 8, 1–7. [Google Scholar] [CrossRef]
- Kao, I.F.; Zhou, Y.; Chang, L.C.; Chang, F.J. Exploring a Long Short-Term Memory based Encoder-Decoder framework for multi-step-ahead flood forecasting. J. Hydrol. 2020, 583, 124631. [Google Scholar] [CrossRef]
- Shen, C.; Laloy, E.; Elshorbagy, A.; Albert, A.; Bales, J.; Chang, F.J.; Ganguly, S.; Hsu, K.L.; Kifer, D.; Fang, Z.; et al. HESS Opinions: Incubating deep-learning-powered hydrologic science advances as a community. Hydrol. Earth Syst. Sci. 2018, 22, 5639–5656. [Google Scholar]
- Tokar, A.S.; Markus, M. Precipitation-runoff modeling using artificial neural networks and conceptual models. J. Hydrol. Eng. 2000, 5, 156–161. [Google Scholar] [CrossRef]
- Chen, S.M.; Wang, Y.M.; Tsou, I. Using artificial neural network approach for modelling rainfall–runoff due to typhoon. J. Earth Syst. Sci. 2013, 122, 399–405. [Google Scholar] [CrossRef]
- Coulibaly, P.; Anctil, F.; Bobee, B. Multivariate reservoir inflow forecasting using temporal neural networks. J. Hydrol. Eng. 2001, 6, 367–376. [Google Scholar]
- Chollet, F. Deep Learning with Python; Simon and Schuster: New York, NY, USA, 2021; ISBN 1638350094. [Google Scholar]
- Hochreiter, S.; Schmidhuber, J. Long short-term memory. Neural Comput. 1997, 9, 1735–1780. [Google Scholar] [PubMed]
- Chung, J.; Gulcehre, C.; Cho, K.; Bengio, Y. Empirical Evaluation of Gated Recurrent Neural Networks on Sequence Modeling. arXiv 2014, arXiv:1412.3555. [Google Scholar]
- Korea Water Resources Corporation (K-water). Hydrometeorology and Watershed Management; K-water: Daejeon, Korea, 2016. [Google Scholar]
- Hu, C.; Wu, Q.; Li, H.; Jian, S.; Li, N.; Lou, Z. Deep Learning with a Long Short-Term Memory Networks Approach for Rainfall-Runoff Simulation. Water 2018, 10, 1543. [Google Scholar] [CrossRef] [Green Version]
- Moriasi, D.N.; Arnold, J.G.; Van Liew, M.W.; Bingner, R.L.; Harmel, R.D.; Veith, T.L. Model evaluation guidelines for systematic quantification of accuracy in watershed simulations. Trans. ASABE 2007, 50, 885–900. [Google Scholar]
Figure 1.
Flow chart of this study.

Figure 2.
Schematic diagram of the storage function model [17].
Figure 2.
Schematic diagram of the storage function model [17].

Figure 3.
Location and Watershed of Andong and Imha Dams.

Figure 4.
Inflow and rainfall at Andong Dam. (a) Inflow and rainfall for 2001–2020. (b) Rainfall for the flood period (21 June–20 September).
Figure 4.
Inflow and rainfall at Andong Dam. (a) Inflow and rainfall for 2001–2020. (b) Rainfall for the flood period (21 June–20 September).

Figure 5.
Data analysis flow chart.

Figure 6.
Schematic diagram of the input and output.

Figure 7.
Comparison of predictions and observations for inflow ranges to Andong Dam. (a) Total period. (b) Drought period.
Figure 7.
Comparison of predictions and observations for inflow ranges to Andong Dam. (a) Total period. (b) Drought period.

Figure 8.
Comparison of predictions and observations for inflow ranges to Imha Dam. (a) Total period. (b) Drought period.
Figure 8.
Comparison of predictions and observations for inflow ranges to Imha Dam. (a) Total period. (b) Drought period.

Figure 9.
Comparison of observations and predictions for Typhoon Maisak and Haishen. (a) Andong Dam. (b) Imha Dam.
Figure 9.
Comparison of observations and predictions for Typhoon Maisak and Haishen. (a) Andong Dam. (b) Imha Dam.


Table 1.
General status of Andong and Imha Dams.
| Category | Andong | Imha |
|---|---|---|
| Storage(106 m3) | 1248 | 595 |
| Flood control capacity(106 m3) | 110 | 80 |
| Water supply (106 m3/y) | 926.0 | 615.3 |
| Flood volume (m3/s) | 6480 | 4500 |
| Discharge (m3/s) | 4600 | 2500 |
Table 2.
Application range for hyperparameter optimization.
| Optimization | Grid Search | T and E | |
|---|---|---|---|
| Sequence | day | 7, 14, 21 | 1~100 |
| hour | 12, 24, 48 | ||
| Batch size | day | 7, 14, 21, 28, 35 | 1~100 |
| hour | 12, 24, 36, 48, 60, 72 | ||
| Epoch | - | 100~500 (Early stop) | |
| Learning rate | - | 0.01~0.0001 | |
| Dropout | - | 0.1~0.25 | |
| Hidden layer | - | 2~5 | |
Table 3.
Statistical performance by scenario for the ANN at Andong Dam.
| Scenario | Input | Statistical Indices | Selection | |||||
|---|---|---|---|---|---|---|---|---|
| Sequence | Batch | R2 | MAE | RMSE | VE | |||
| Day | ADA-S1 | 7 | 7 | 0.89 | 12.01 | 25.17 | 0.29 | |
| … | ||||||||
| ADA-S4 | 14 | 14 | 0.83 | 9.56 | 20.10 | 0.13 | ||
| … | ||||||||
| ADA-S7 | 21 | 21 | 0.81 | 9.83 | 22.37 | 0.31 | ||
| ADA-S8 | 21 | 28 | 0.86 | 9.54 | 28.62 | 0.33 | ||
| ADA-S9 | 21 | 35 | 0.91 | 9.40 | 19.18 | 0.03 | ○ | |
| ADA-Opt | 20 | 20 | 0.82 | 11.36 | 24.40 | 0.28 | ||
| Hour | AHA-S1 | 12 | 12 | 0.80 | 20.70 | 42.42 | 0.17 | |
| … | ||||||||
| AHA-S4 | 24 | 24 | 0.94 | 12.26 | 22.94 | 0.12 | ○ | |
| AHA-S5 | 24 | 36 | 0.89 | 11.34 | 30.50 | 0.20 | ||
| AHA-S6 | 24 | 48 | 0.88 | 11.82 | 32.52 | 0.29 | ||
| AHA-S7 | 48 | 48 | 0.91 | 12.59 | 27.72 | 0.27 | ||
| … | ||||||||
| AHA-Opt | 10 | 10 | 0.91 | 11.77 | 29.45 | 0.13 | ||
○: Selected optimal scenario.
Table 4.
Optimal scenario selection.
| Dam/Time | Observed (m3/s) | Simulated (m3/s), R2 | ||||
|---|---|---|---|---|---|---|
| ANN | RNN | LSTM | GRU | |||
| Andong | Day | 998.5 | ADA-S9 | ADR-Opt | ADL-S1 | ADG-S1 |
| 696.8 | 725.7 | 921.6 | 956.1 | |||
| 0.91 | 0.82 | 0.81 | 0.79 | |||
| Hour | 2629.1 | AHA-S4 | AHR-S8 | AHL-S9 | AHG-S6 | |
| 1835.3 | 2327.7 | 3458.1 | 3053.5 | |||
| 0.94 | 0.86 | 0.87 | 0.87 | |||
| Imha | Day | 935.1 | IDA-S9 | IDR-S4 | IDL-Opt | IDG-S5 |
| 653.0 | 915.17 | 925.2 | 988.1 | |||
| 0.92 | 0.82 | 0.79 | 0.87 | |||
| Hour | 4890.1 | IHA-S4 | IHR-S9 | IHL-S6 | IHG-S7 | |
| 3909.0 | 4226.0 | 4855.6 | 4248.5 | |||
| 0.92 | 0.95 | 0.95 | 0.95 | |||
Table 5.
General performance ratings [19].
Table 5.
General performance ratings [19].
| Performance Rating | RSR | NSE |
|---|---|---|
| Very Good | 0.00 ≤ RSR ≤ 0.50 | 0.75 < NSE ≤ 1.00 |
| Good | 0.50 < RSR ≤ 0.60 | 0.65 < NSE ≤ 0.75 |
| Satisfactory | 0.60 < RSR ≤ 0.70 | 0.50 < NSE ≤ 0.65 |
| Unsatisfactory | RSR > 0.70 | NSE ≤ 0.50 |
Table 6.
Performance rating evaluation for selected scenarios.
| Case | RSR/NSE | |||||
|---|---|---|---|---|---|---|
| ANN | RNN | LSTM | GRU | |||
| Andong | Day | Validation | 0.31/0.91 | 0.55/0.70 | 0.56/0.72 | 0.54/0.68 |
| Test | 0.31/0.90 | 0.53/0.68 | 0.56/0.75 | 0.56/0.66 | ||
| Evaluation | Very Good | Good | Good | Good | ||
| Hour | Validation | 0.33/0.99 | 0.38/0.99 | 0.38/0.99 | 0.37/0.99 | |
| Test | 0.34/0.89 | 0.48/0.96 | 0.48/0.95 | 0.46/0.96 | ||
| Evaluation | Very Good | Very Good | Very Good | Very Good | ||
| Imha | Day | Validation | 0.36/0.87 | 0.54/0.68 | 0.52/0.70 | 0.59/0.73 |
| Test | 0.36/0.87 | 0.54/0.66 | 0.53/0.70 | 0.58/0.70 | ||
| Evaluation | Very Good | Good | Good | Good | ||
| Hour | Validation | 0.28/0.99 | 0.22/0.99 | 0.20/0.99 | 0.20/0.99 | |
| Test | 0.29/0.91 | 0.24/0.95 | 0.25/0.96 | 0.24/0.96 | ||
| Evaluation | Very Good | Very Good | Very Good | Very Good | ||
Table 7.
Inflow prediction by period at Andong Dam.
| Andong | Observed (m3/s) | Simulated (m3/s) | ||||
|---|---|---|---|---|---|---|
| ANN | RNN | LSTM | GRU | |||
| Total period (2017–2020) | 25% | 3.70 | 10.88 | 5.61 | 1.56 | 4.43 |
| 50% | 8.12 | 11.09 | 8.50 | 4.43 | 7.54 | |
| 75% | 20.41 | 24.44 | 21.75 | 16.09 | 14.49 | |
| Drought period (2017–2018) | 25% | 3.38 | 10.88 | 5.61 | 1.15 | 4.65 |
| 50% | 6.38 | 10.88 | 6.52 | 2.28 | 7.26 | |
| 75% | 14.62 | 16.65 | 13.65 | 10.94 | 8.67 | |
| Max | 299.03 | 214.77 | 305.28 | 241.11 | 258.09 | |
Table 8.
Inflow prediction by period at Imha Dam.
| Imha | Observed (m3/s) | Simulated (m3/s) | ||||
|---|---|---|---|---|---|---|
| ANN | RNN | LSTM | GRU | |||
| Total period (2017–2020) | 25% | 1.58 | 3.20 | 11.18 | 1.16 | 3.49 |
| 50% | 4.12 | 3.87 | 12.82 | 4.57 | 5.08 | |
| 75% | 10.55 | 7.27 | 20.15 | 12.82 | 14.79 | |
| Drought period (2017–2018) | 25% | 1.19 | 3.18 | 10.72 | 0.60 | 3.70 |
| 50% | 2.52 | 3.40 | 11.80 | 2.61 | 4.91 | |
| 75% | 7.88 | 5.27 | 15.26 | 9.00 | 7.61 | |
| Max | 470.37 | 652.99 | 415.17 | 425.23 | 388.09 | |
Table 9.
Typhoon cases.
| Typhoon | Period | Andong (mm) | Imha (mm) | ||
|---|---|---|---|---|---|
| Rainfall | Hour (Max) | Rainfall | Hour (Max) | ||
| Rusa | 23 August–1 September 2002 | 165.4 | 21.9 | 182.9 | 29.3 |
| Maemi | 6–14 September 2003 | 251.7 | 31.5 | 220.8 | 26.9 |
| Kongrey | 29 September–7 October 2018 | 94.3 | 5.1 | 128.3 | 10.4 |
| Mitag | 28 September–3 October 2019 | 133.1 | 12.5 | 166.6 | 19.9 |
| Maysak and Haishen | 28 August–7 September 2020 | 268.1 | 15.0 | 270.0 | 23.4 |
Table 10.
Predicted inflow to Andong Dam by typhoon cases.
| Typhoon | Observed (m3/s) | Simulated (m3/s) | ||||
|---|---|---|---|---|---|---|
| ANN | RNN | LSTM | GRU | |||
| Rusa | Max | 3678 | 2570 | 3623 | 4016 | 4025 |
| R2 | - | 0.94 | 0.95 | 0.94 | 0.96 | |
| Maemi | Max | 4522 | 3161 | 4267 | 4339 | 4597 |
| R2 | - | 0.95 | 0.94 | 0.96 | 0.96 | |
| Kongrey | Max | 793 | 549 | 644 | 683 | 699 |
| R2 | - | 0.62 | 0.77 | 0.81 | 0.76 | |
| Mitag | Max | 1845 | 1286 | 1866 | 2117 | 1773 |
| R2 | - | 0.91 | 0.95 | 0.94 | 0.95 | |
| Maysak andHaishen | Max | 2629 | 1835 | 2328 | 3458 | 3053 |
| R2 | - | 0.80 | 0.72 | 0.73 | 0.90 | |
Table 11.
Predicted inflow to Imha Dam by typhoon cases.
| Case | Observed (m3/s) | Simulated (m3/s) | ||||
|---|---|---|---|---|---|---|
| ANN | RNN | LSTM | GRU | |||
| Rusa | Max | 7113 | 5677 | 7102 | 7014 | 6709 |
| R2 | - | 0.94 | 0.96 | 0.95 | 0.94 | |
| Maemi | Max | 6665 | 5312 | 6221 | 6848 | 6938 |
| R2 | - | 0.95 | 0.95 | 0.94 | 0.92 | |
| Kongrey | Max | 2584 | 2086 | 2458 | 2174 | 2222 |
| R2 | - | 0.90 | 0.97 | 0.88 | 0.87 | |
| Mitag | Max | 3534 | 2856 | 3488 | 3647 | 2793 |
| R2 | - | 0.96 | 0.97 | 0.94 | 0.95 | |
| Maysak and Haishen | Max | 4890 | 3909 | 4226 | 4856 | 4248 |
| R2 | - | 0.91 | 0.91 | 0.89 | 0.90 | |
Table 12.
Predicted inflow by optimal deep learning model and the SFM in typhoon conditions.
| Case | Andong | Imha | |||||
|---|---|---|---|---|---|---|---|
| Observed (m3/s) | Simulated (m3/s) | Observed (m3/s) | Simulated (m3/s) | ||||
| GRU | SFM | RNN | SFM | ||||
| Rusa | Max | 3628 | 4025 | 3799 | 7113 | 7102 | 6098 |
| R2 | - | 0.96 | 0.96 | - | 0.96 | 0.98 | |
| Maemi | Max | 4522 | 4597 | 4267 | 6665 | 6221 | 5767 |
| R2 | - | 0.96 | 0.92 | - | 0.95 | 0.96 | |
| Kongrey | Max | 793 | 699 | 668 | 2584 | 2458 | 2241 |
| R2 | - | 0.76 | 0.80 | - | 0.97 | 0.96 | |
| Mitag | Max | 1845 | 1773 | 1982 | 3534 | 3488 | 3207 |
| R2 | - | 0.95 | 0.95 | - | 0.97 | 0.98 | |
| Maysak and Haishen | Max | 2629 | 3053 | 2486 | 4890 | 4226 | 4011 |
| R2 | - | 0.90 | 0.89 | - | 0.91 | 0.93 | |
Publisher’s Note: MDPI stays neutral with regard to jurisdictional claims in published maps and institutional affiliations. |
© 2022 by the authors. Licensee MDPI, Basel, Switzerland. This article is an open access article distributed under the terms and conditions of the Creative Commons Attribution (CC BY) license (https://creativecommons.org/licenses/by/4.0/).
Share and Cite
MDPI and ACS Style
Kim, B.-J.; Lee, Y.-T.; Kim, B.-H. A Study on the Optimal Deep Learning Model for Dam Inflow Prediction. Water 2022, 14, 2766. https://doi.org/10.3390/w14172766
AMA Style
Kim B-J, Lee Y-T, Kim B-H. A Study on the Optimal Deep Learning Model for Dam Inflow Prediction. Water. 2022; 14(17):2766. https://doi.org/10.3390/w14172766
Chicago/Turabian StyleKim, Beom-Jin, You-Tae Lee, and Byung-Hyun Kim. 2022. "A Study on the Optimal Deep Learning Model for Dam Inflow Prediction" Water 14, no. 17: 2766. https://doi.org/10.3390/w14172766
Note that from the first issue of 2016, this journal uses article numbers instead of page numbers. See further details here.