Article

Land-Use Pattern as a Key Factor Determining the Water Quality, Fish Guilds, and Ecological Health in Lotic Ecosystems of the Asian Monsoon Region

Department of Bioscience and Biotechnology, Chungnam National University, Daejeon 34134, Korea
*
Author to whom correspondence should be addressed.
Water 2022, 14(17), 2765; https://doi.org/10.3390/w14172765
Submission received: 23 June 2022 / Revised: 9 August 2022 / Accepted: 31 August 2022 / Published: 5 September 2022

Abstract

:
Land-use patterns influence water quality in lotic ecosystems worldwide; consequently, deteriorating water quality affects fish communities and composition and the ecological health of water bodies. This study aimed to evaluate how land use, stream order, and elevation regulate water quality and ecological health in 64 streams based on the following four land cover types: namely, forest, agriculture, urban upstream, and urban downstream regions. Spatial analysis revealed that urban downstream areas had higher nutrient concentrations [total phosphorus (TP) as follows: 117 µg/L; total nitrogen (TN): 5.57 mg/L] and organic pollutants [chemical oxygen demand (COD): 7.71] than other regions. Empirical analysis indicated that TP (R2 = 0.46) had a high relation with chlorophyll-a (Chl-a) compared to TN (R2 = 0.23) and TN:TP (R2 = 0.20). Elevation, stream order, and monsoon season significantly impact nutrients, organic matter, suspended particles, ionic content, and algal chlorophyll concentrations. The index of biotic integrity (IBI) was significantly positively correlated with elevation (R2 = 0.387), indicating that forest streams (high elevation) had better water quality and ecological health than lower-elevation streams. The proportion of insectivore species shows a significant negative relationship with biological oxygen demand (BOD) (R2 = 0.123) and TP (R2 = 0.155). The multi-metric index of biotic integrity (IBI) model suggested that the ecological health of forest streams was in fair condition. In contrast, agricultural streams were in poor condition, and urban upstream and downstream were in very poor conditions. The outcomes of this study indicated that land-use patterns and elevation largely regulate the water quality and ecological health of the streams.

1. Introduction

Continuous land-use changes have led to water quality degradation worldwide in lotic and lentic water bodies. Land-use changes typically lead to water pollution, negatively affecting physical habitats and ecological biodiversity and impacting rivers’ and streams’ functions and ecological integrity [1,2,3,4]. Therefore, understanding the links between land use, water quality, and ecological integrity is essential for managing healthy ecosystems [5,6,7,8]. Previous research has reported that land use influences water quality, fish composition, and the ecological health of streams and rivers [9,10,11]. Agricultural land use causes substantial deterioration of water quality, habitat, and biodiversity of ecosystems [12,13]. The changing of structure fish communities is related to increases in nutrient and sediment supply [14] from agriculture runoff and shows fewer fish species [15,16]. Stream or river catchment areas characterized by increasing urbanization experience significant changes in nutrient levels, electrical conductivity, and fish species assemblages [17,18,19,20,21]. Wastewater treatment plants control nutrients and organic levels in downstream urban regions [22] and influence fish habitat and spawning rates [23,24]. Furthermore, elevation, stream order, and monsoon season significantly impact water quality and fish composition in Asian lotic ecosystems [25,26,27].
Land use pattern governs anthropogenic activities in the catchment areas and interacts with lotic systems on a regional scale. Therefore, spatial analysis of water quality and fish composition based on land use types may provide a profound understanding of the current conditions of lotic ecosystems [27,28,29,30,31]. Even though ecological health assessments of lotic ecosystems based on water quality and fish communities are common around the world, regional assessments of how land use affects the ecological integrity of aquatic systems are rare.
South Korea is a highly industrialized and urbanized country with distinct climatic and geographic features. Consequently, there is significant worry regarding the ecological integrity of the nation’s lotic ecosystems, notably the interplay between land cover, water quality, and fish communities. Various metrics have been developed to evaluate the biological integrity of lotic systems; IBI is the most favored and used worldwide [32,33,34,35,36]. IBI models can identify the effects of environmental stressors by studying fish trophic and tolerance guilds [37,38,39,40,41,42,43]. Additionally, it can determine biological health issues related to physical habitats, toxic compounds, and biological agents [37,39,44].
Therefore, the objectives of this study were to determine how land-use type, elevation, and stream order influence water quality and fish community composition in streams or rivers. Biological integrity was evaluated using the IBI model. We also assessed the interactions among water quality variables with fish trophic and tolerance guilds and IBI values.

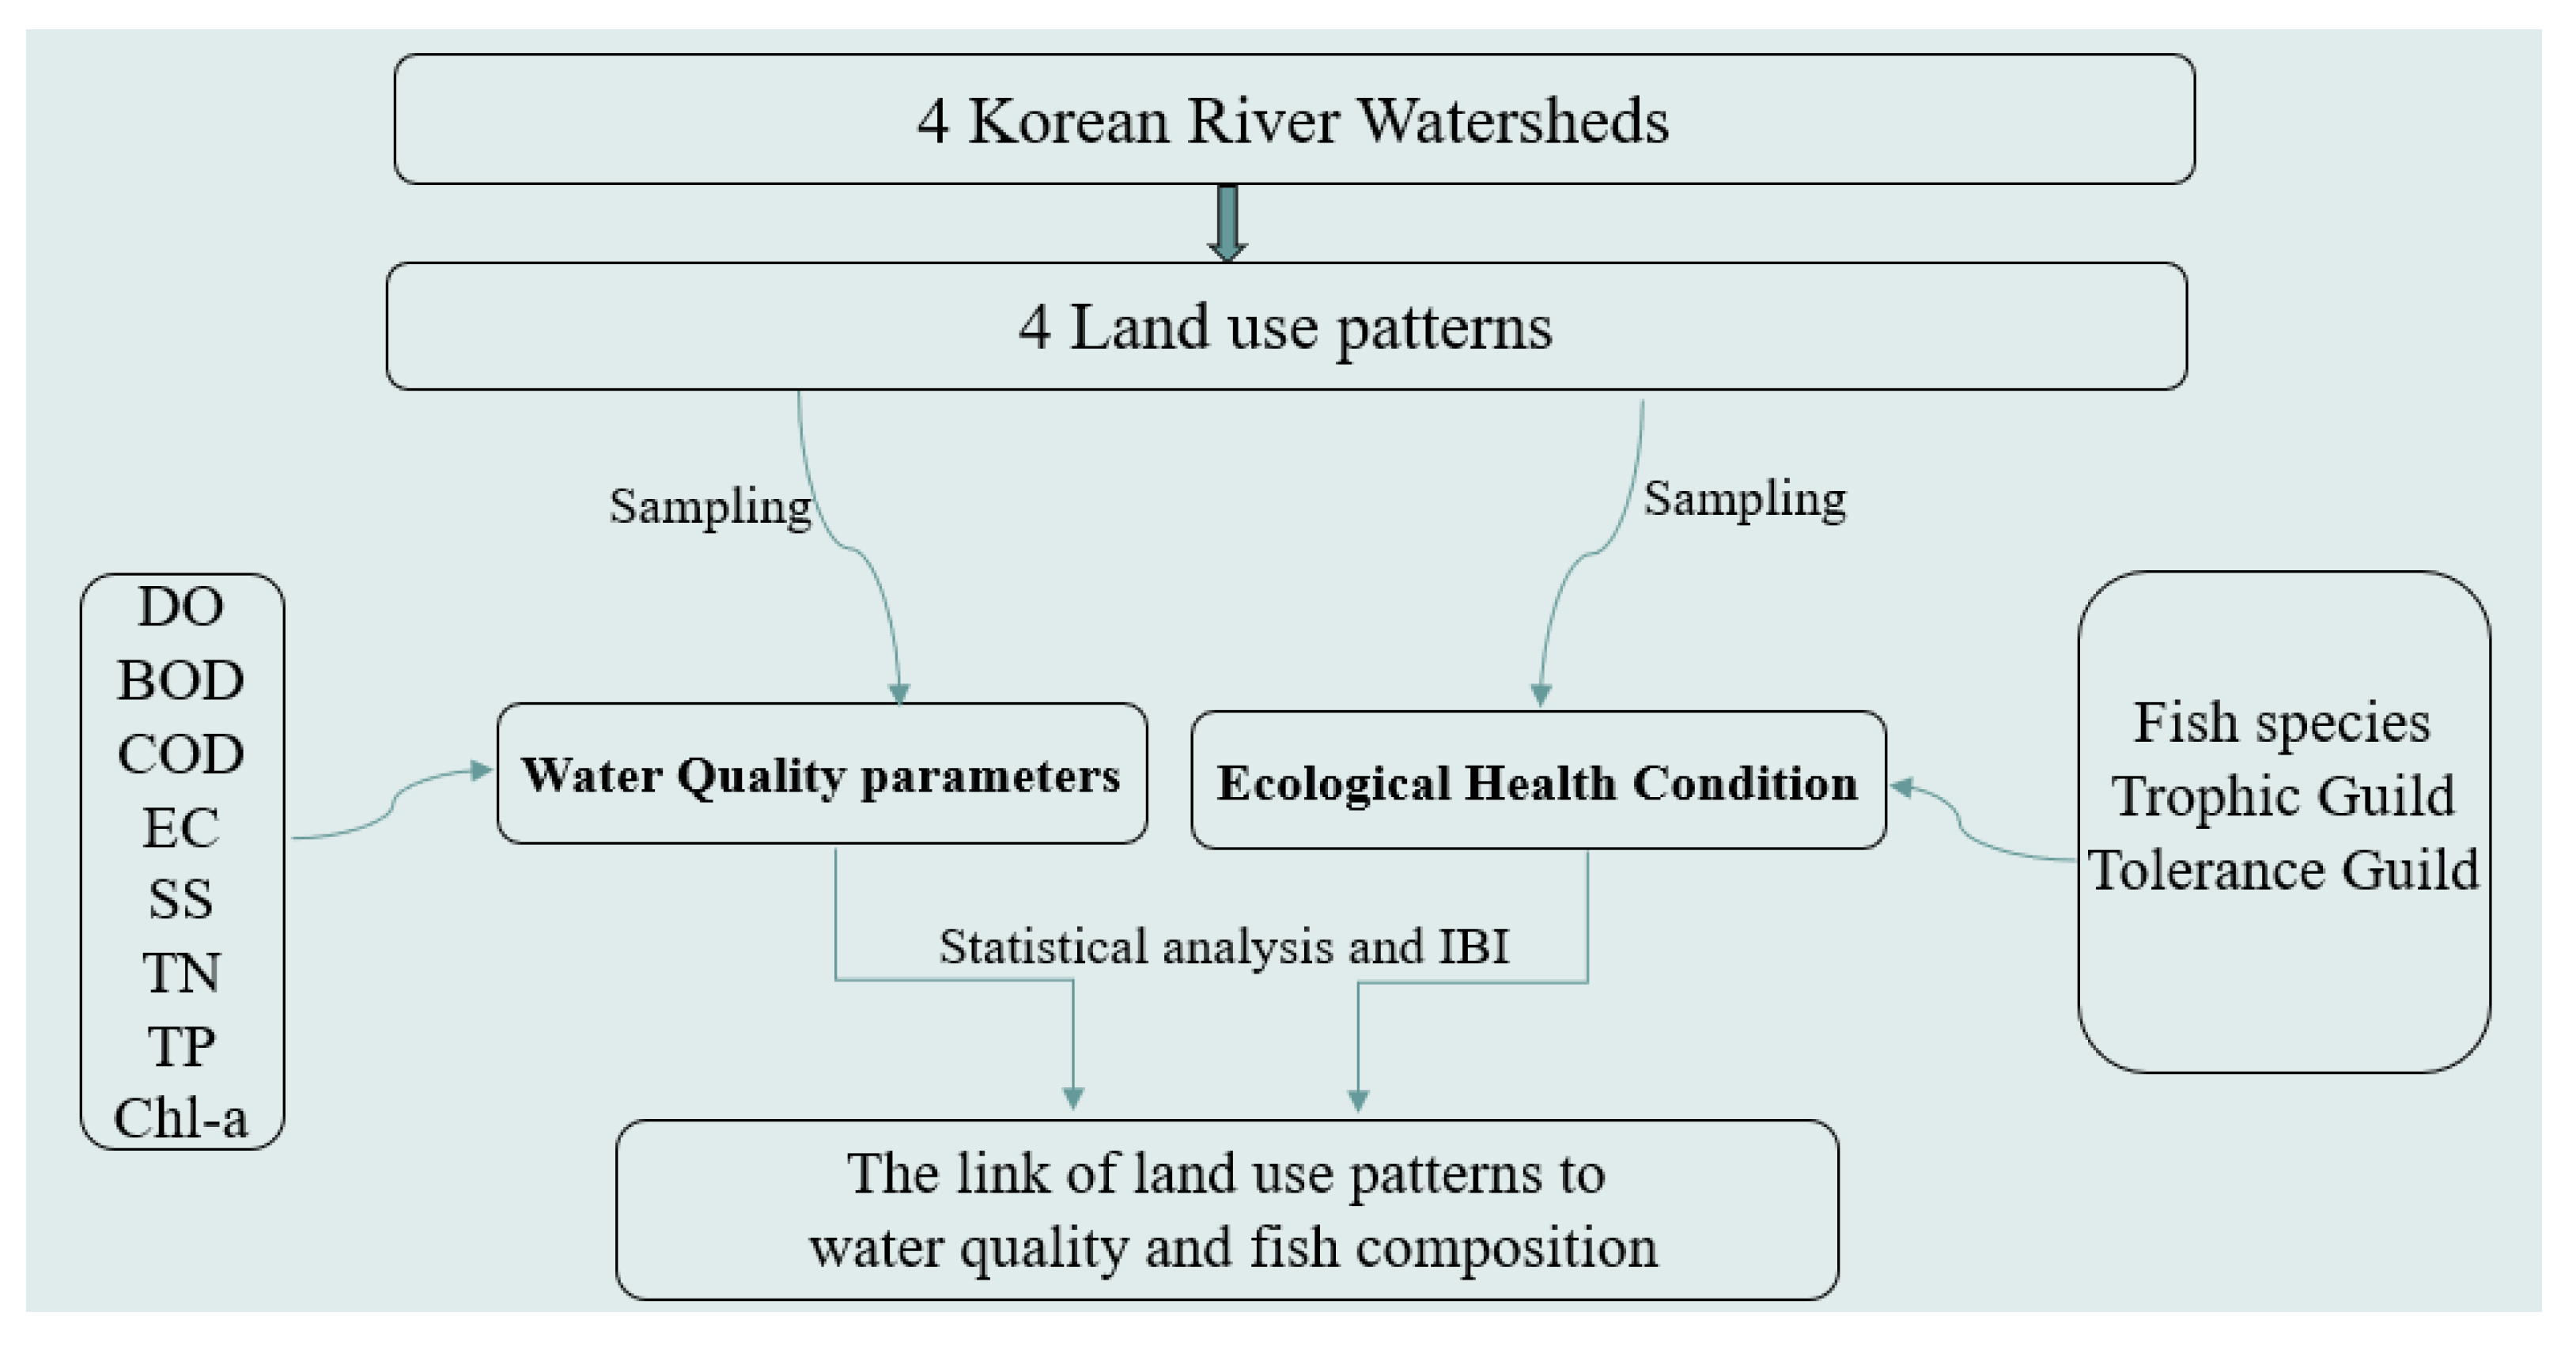
2. Materials and Methods
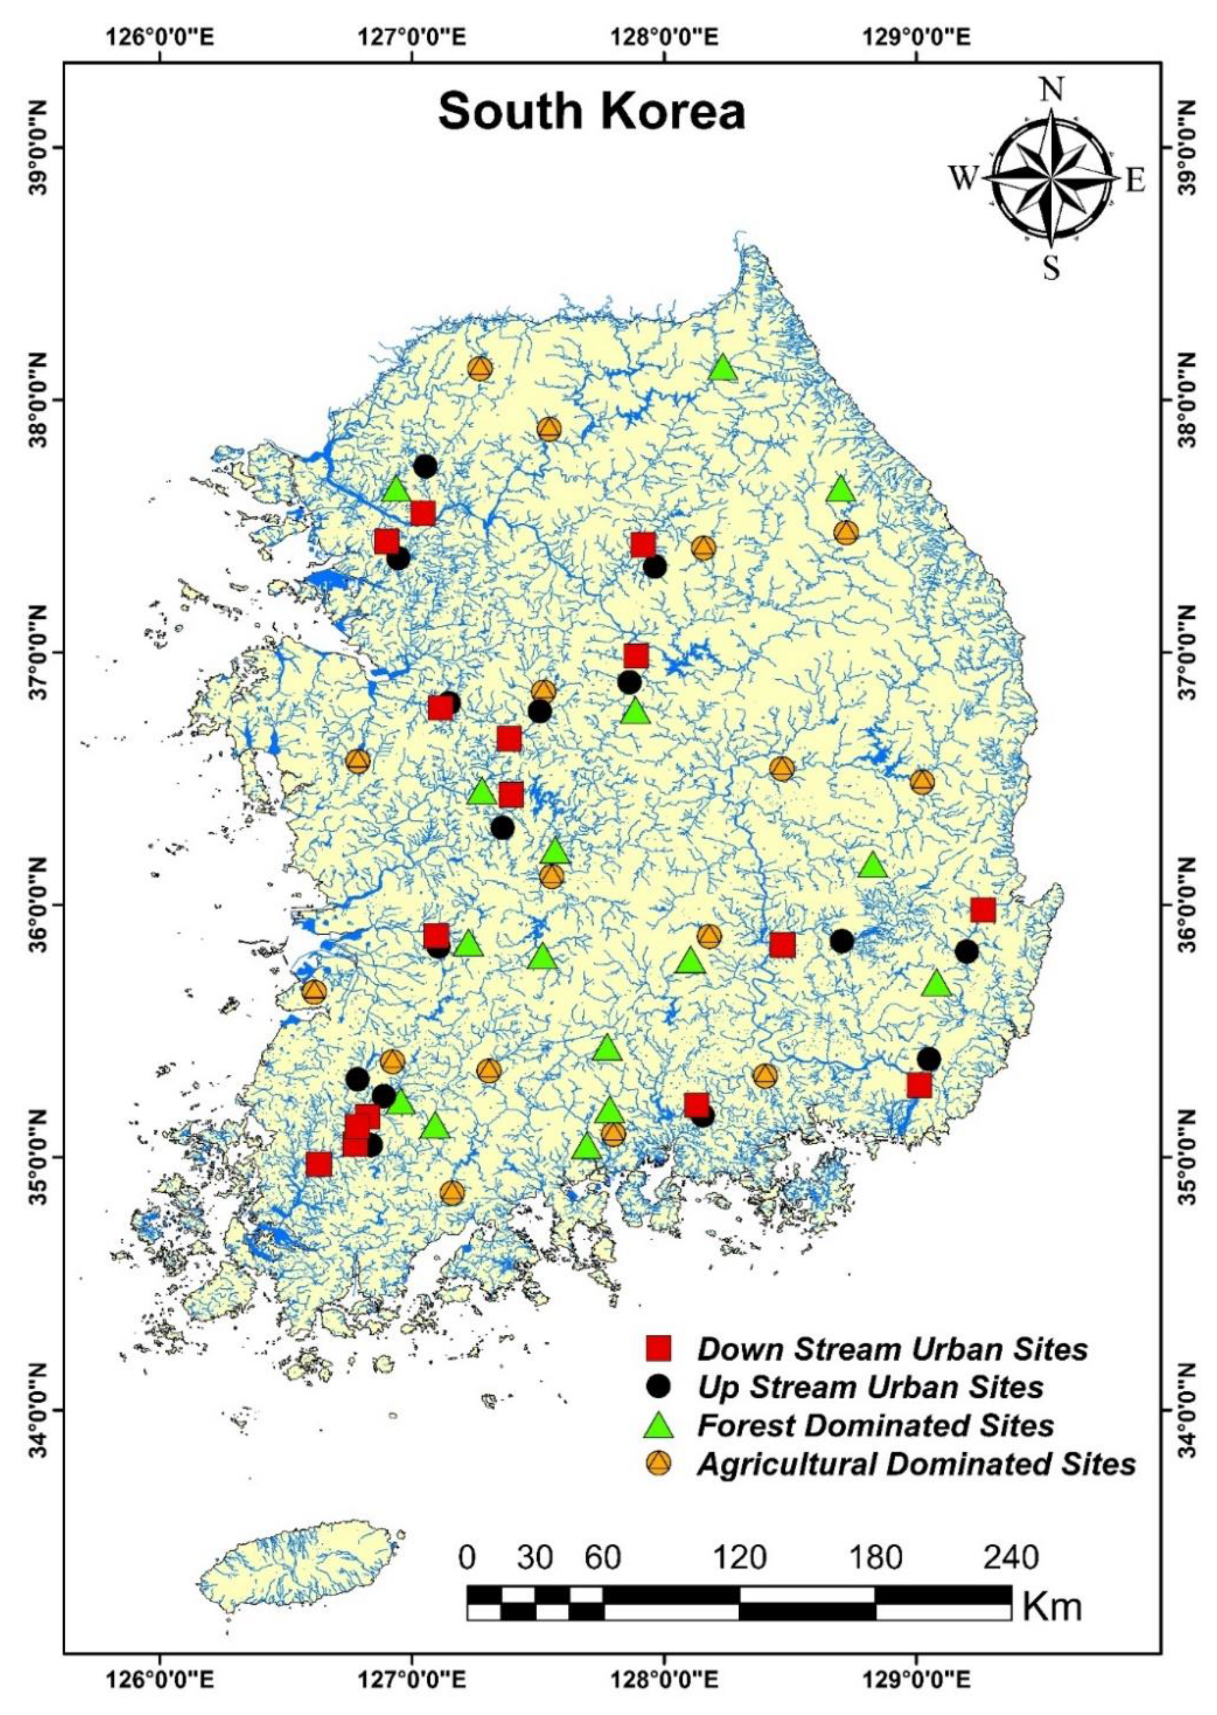
2.1. Study Area

South Korea is located in a temperate region of the Asian continent and has a monsoon climate and abundant water bodies, including rivers, streams, lakes, and reservoirs. This study was conducted using 64 sampling sites (streams) selected among the following four major river watersheds (16 streams per watershed) in South Korea: the Han River, Nakdong River, Geum River, and Yeongsan River watersheds (Figure 1, Table S1). The streams were selected to provide an equal representation of the following four land-use types: agricultural, forest, urban upstream, and urban downstream areas (n = 16 per land-use type). In addition, fish community composition and water quality parameters were investigated from January 2016 to December 2020.
The primary land use at the sampling sites was estimated using a land cover classification method developed and updated yearly by the Korean Ministry of Environment. Land cover is calculated for a buffer area of 2 km from each fish or water quality sampling site. Forest streams are mainly surrounded by mountains, hills, and protected areas that are less disturbed by human activity. Agriculture areas consist mainly of farmlands and livestock areas with small populations. Upstream and downstream urban areas include industrial, residential, and commercial areas. The land use patterns and elevation data of study sites are presented in the Supplementary File (Table S2).

2.2. Water Quality Parameters

Water quality data of 64 sampling sites during the study period (2016–2020) were obtained from the National Institute of Environmental Research Institute (NIER, http://water.nier.go.kr/web (accessed on 1 January 2022)). The data included the following 10 parameters: pH; water temperature (WT); dissolved oxygen (DO); biological oxygen demand (BOD); chemical oxygen demand (COD); TN, TP, chlorophyll-a (Chl-a); electrical conductivity (EC); total suspended solids content (TSS). TP was analyzed using the ascorbic acid method, followed by persulfate oxidation [45,46], which was standardized by the National Institute of Environmental Research Institute. TSS was determined using pre-weighted filters (GF/C; Whatman, Maidstone, UK), and Chl-a concentrations were measured using a spectrophotometer (DU-65; Beckman, CA, USA) following extraction in hot ethanol [47], which is also standardized by the National Institute of Environmental Research Institute.

2.3. Fish Sampling

Fish sampling was conducted from 2016 to 2020, before (April–May) and after (September–October) the monsoon period, when water levels were lower. Fish sampling was performed based on the Ohio Environmental Protection Agency method [48] that was modified for regional purposes by An et al. [49] and the National Institute of Environmental Research Institute. At each site, fish sampling lasted approximately 60 min, based on catch per unit effort and a sampling distance of 200 m [50]. Fish sampling was conducted using fyke, gill, trammel, cast, and kick nets. Fyke, gill, and trammel nets were installed along the shoreline using a boat. Cast nets (mesh size, 5 mm × 5 mm) and kick nets (mesh size, 4 mm × 4 mm) were used for sampling at the shore.

2.4. Statistical Analyses

Water quality parameters were log10-transformed before regression analysis to improve the normality. Regression analyses were performed using the Sigma Plot software (ver. 14, San Jose, CA, USA) to determine the causal relationship among water quality parameters, elevation, fish guilds, and IBI [51]. A multivariate analytical technique—principal component analysis (PCA)—was applied to examine the relationships between water chemistry and land-use type using the PAST software (ver 3.18, Natural History Museum, University of Oslo: Oslo, Norway [52]. Pearson correlation analysis was also performed using the “corplot” function in the psych package in R (R Development Core Team, 2013) to evaluate links between selected water quality parameters, IBI, and elevation. A methodological flow chart for this study has been presented in Figure 2.

2.5. Fish-Based IBI Model to Evaluate Stream Biological Health

A fish-based regional IBI model was used to identify the biological health of the study area. The IBI model has eight measurable metrics divided into the following three main categories: species richness and composition, fish trophic and tolerance guild compositions, and fish abundance. The metrics are the following: total number of native fish species (M1), number of benthic riffle species (M2), number of sensitive species (M3), proportion of individuals of pollution-tolerant species (M4), proportion of individuals of omnivorous species (M5), proportion of individuals of native insectivore species (M6), total number of native individuals (M7), proportion of individuals with anomalies (M8) [36]. Each metric was assigned scoring criteria of 5 (high), 3 (medium), or 1 (low) [53]. The final score was obtained after the summing of each metric’s values and categorized the biological health into the following five categories: excellent (36–40), good (28–34), fair (20–26), poor (14–18), and very poor (8–13).

3. Results

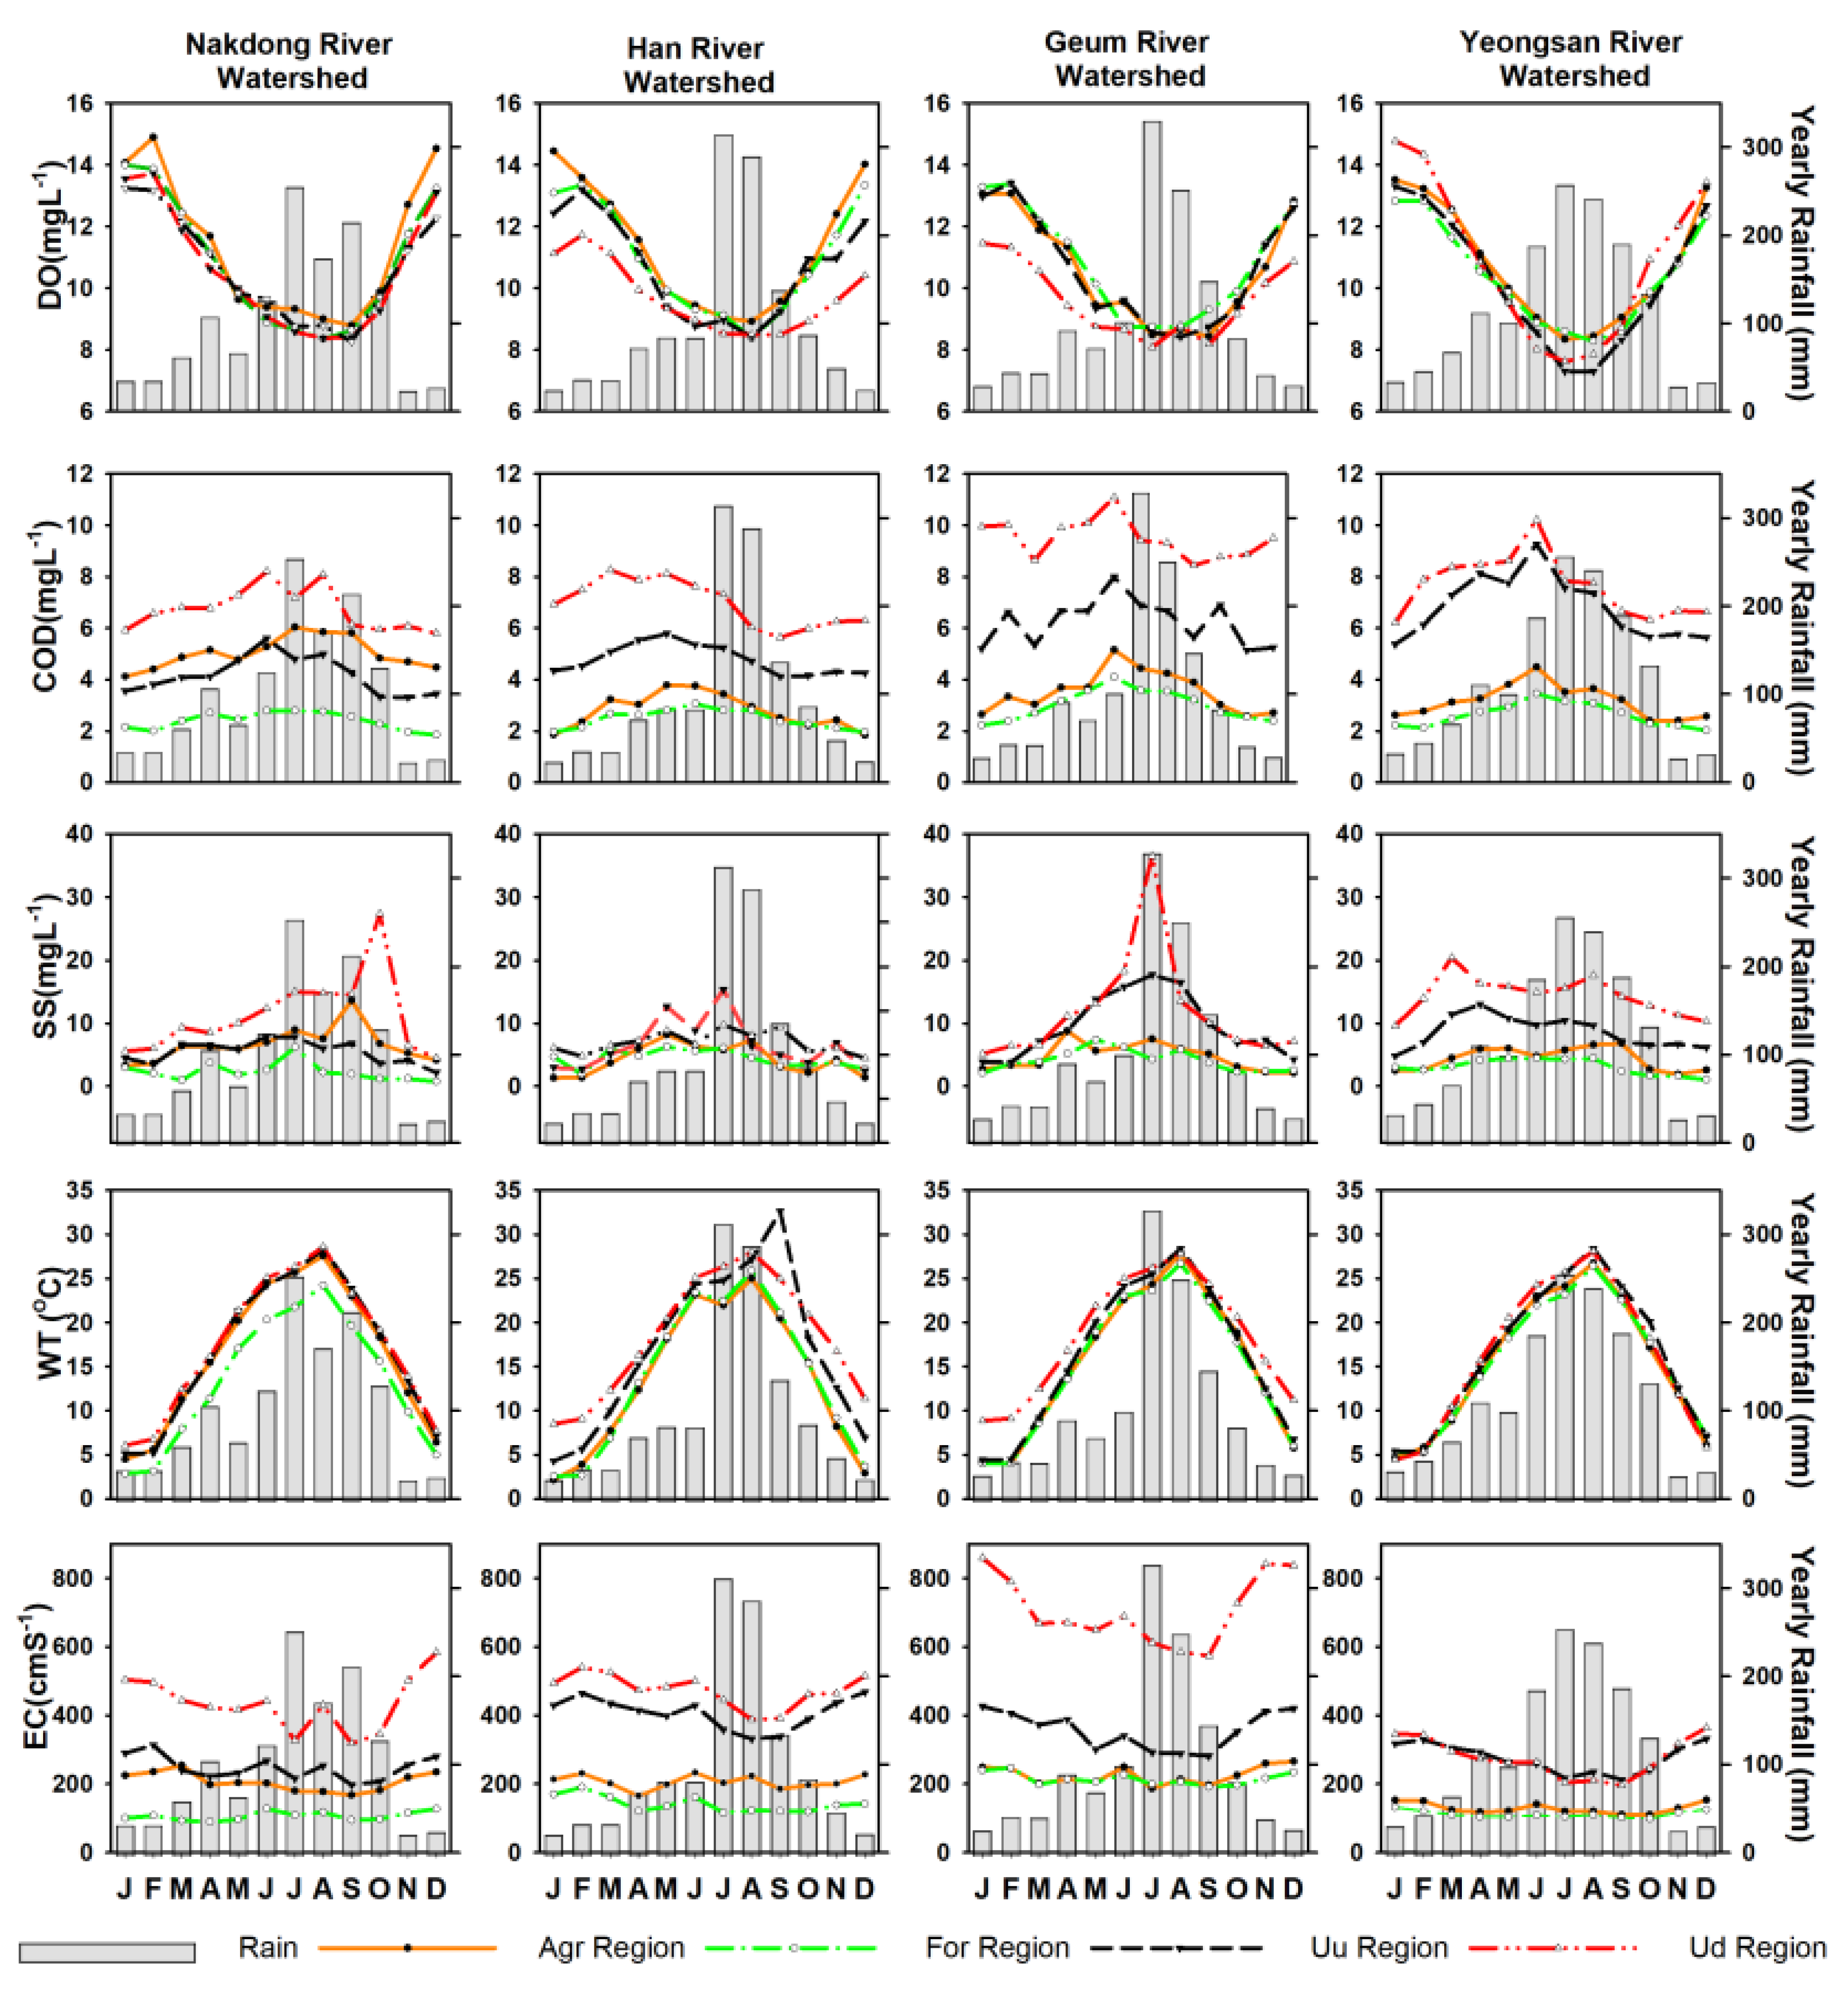
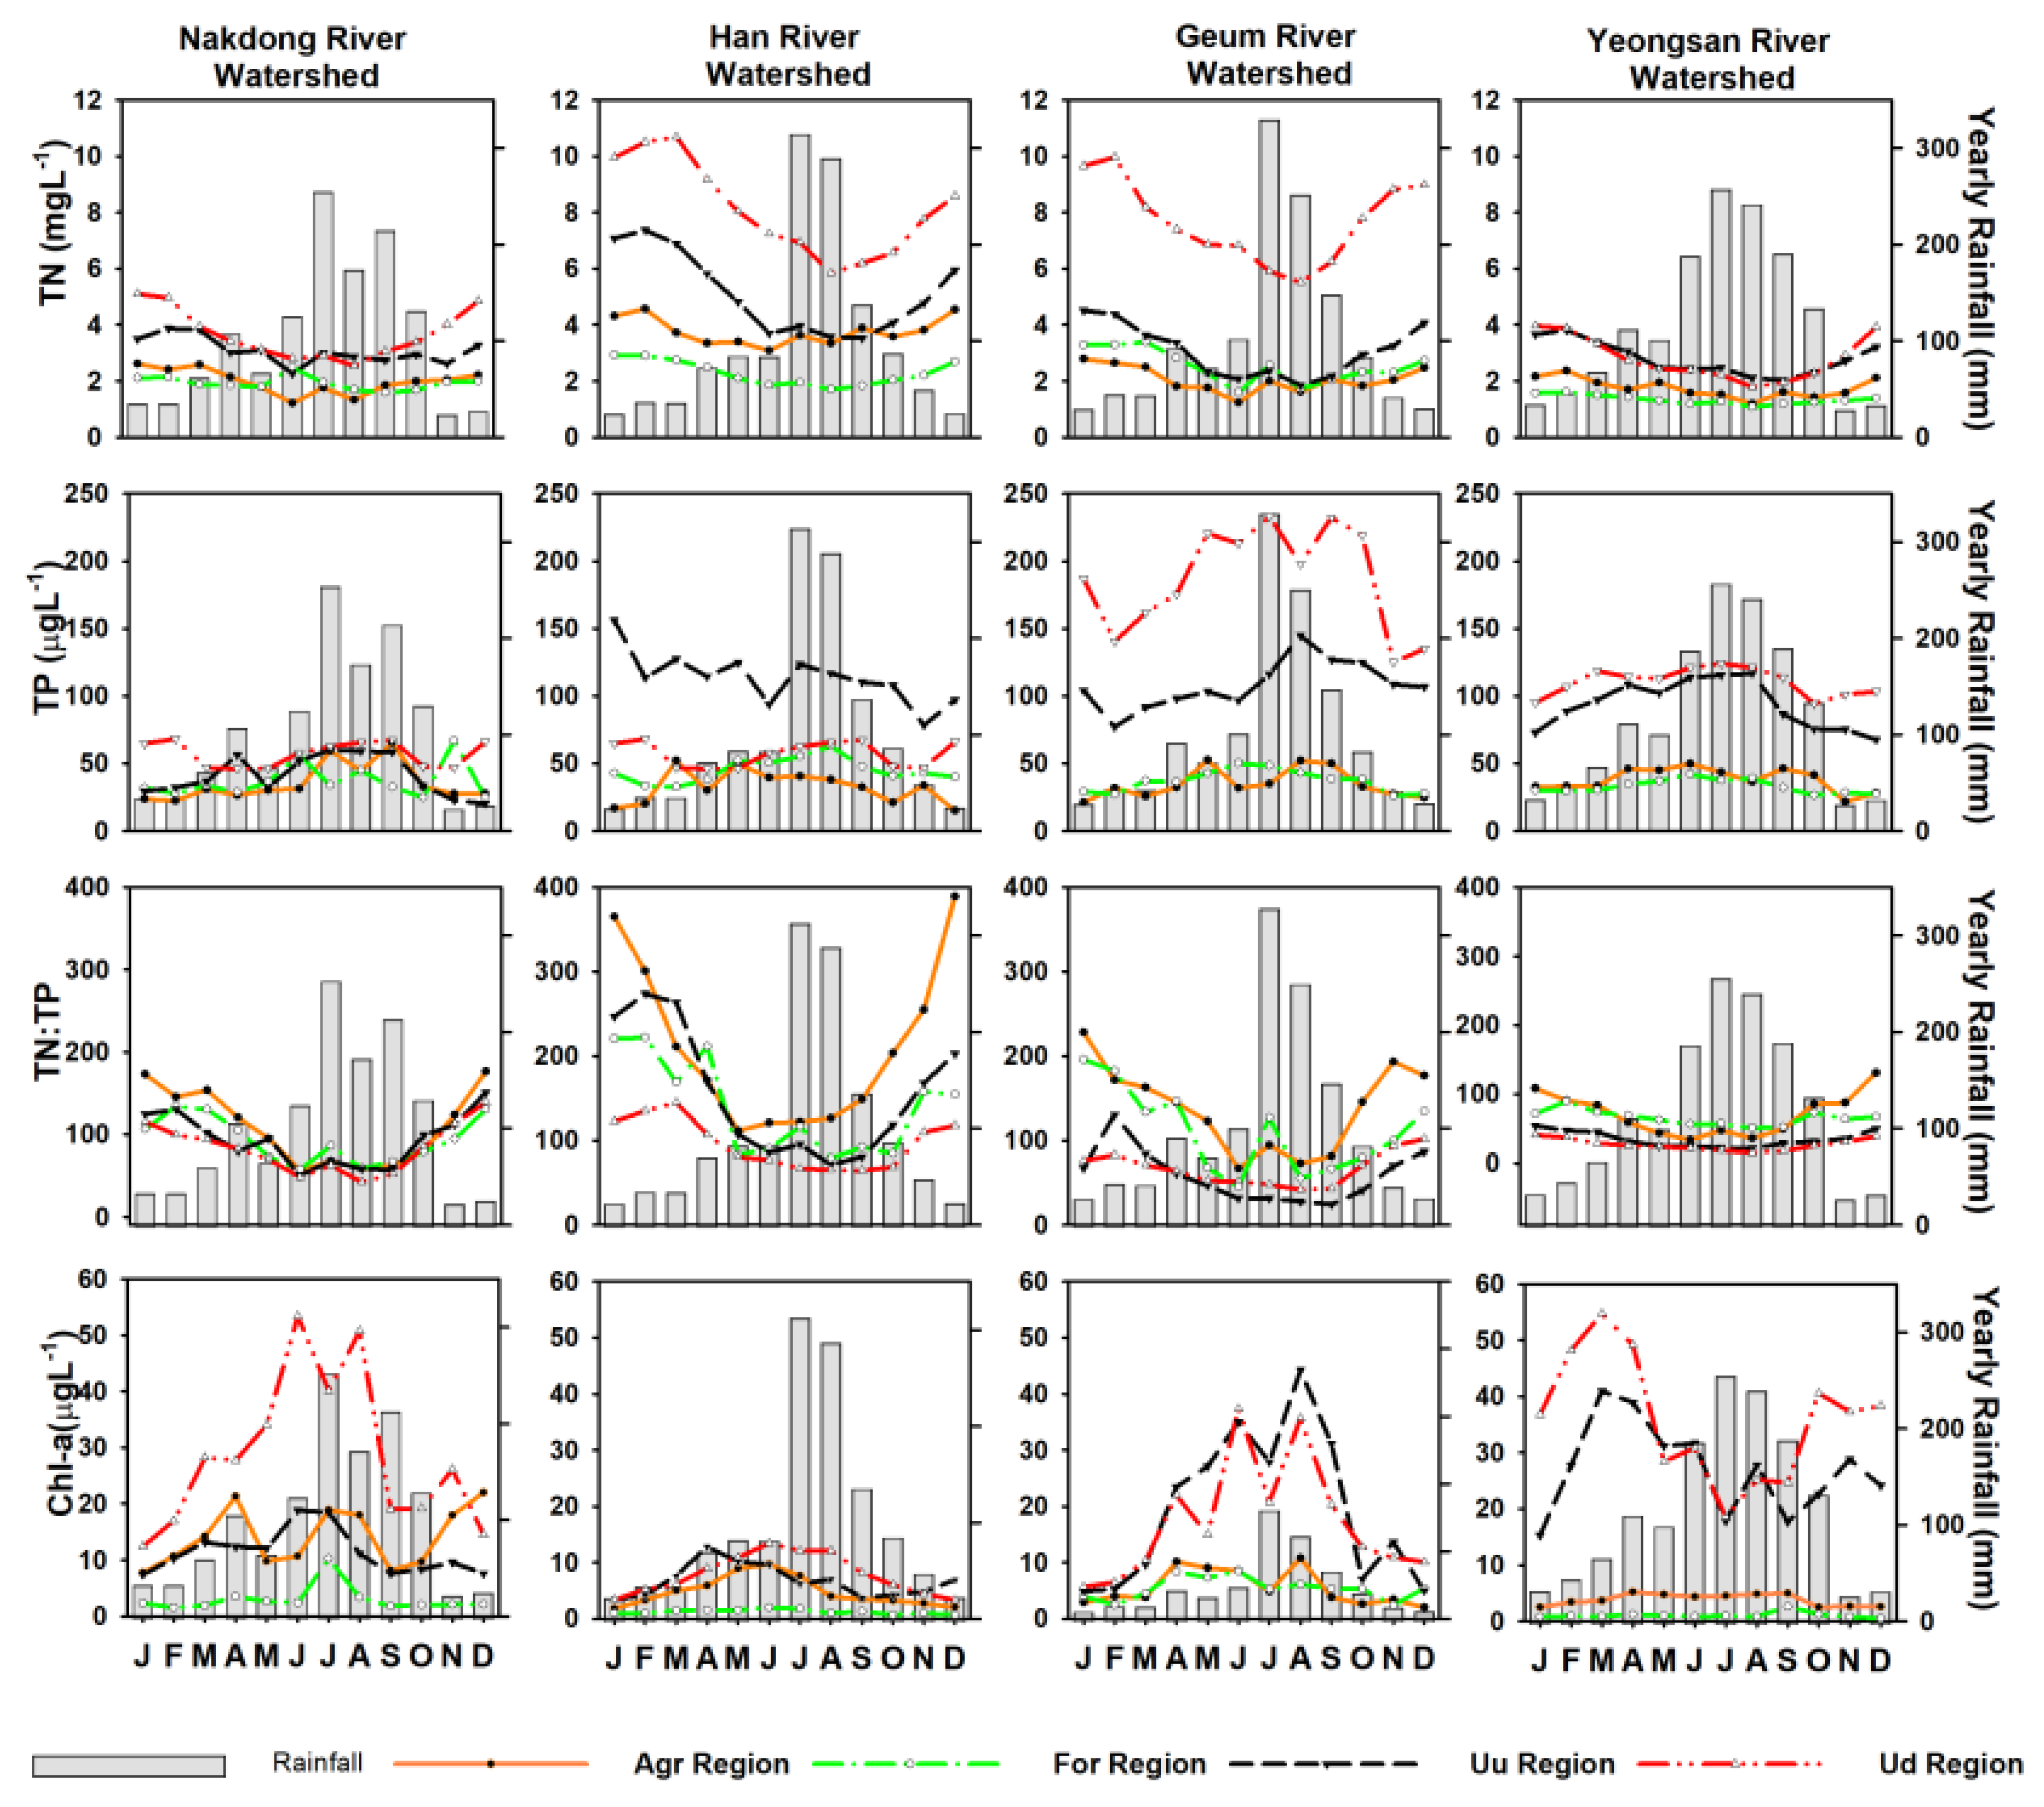
3.1. Seasonal and Spatial Variability in Physicochemical Water Quality

Water chemistry parameters showed seasonal and spatial fluctuations that differed among the four land-use types, influenced by yearly monsoon runoff during the study period (2016–2020) (Figure 3 and Figure 4; Table 1). The average rainfall of each basin was analyzed to determine its effect on water quality parameter fluctuation for each land-use type. Precipitation patterns showed the same trends throughout South Korea. In all watersheds, DO values were lower in urban streams than in any other land-use category (Figure 3). The COD and TSS values had higher ranges during the monsoon season among all land-use types but were higher in urban up- and downstream areas (mean COD: 5.51 and 7.71 mg/L and TSS: 7.594 and 11.108 mg/L, respectively) than in agricultural areas and forests (mean COD: 2.62 and 3.63 mg/L and TSS: 4.14 and 4.49 mg/L, respectively), particularly in the Geum and Nakdong River watersheds. Mean EC values were also higher in urban downstream areas (427.7 cm/S) due to their closer proximity to the ocean than other land-use areas (urban upstream: 321.4 cm/S; agriculture: 152.3 cm/S; forests: 143.1 cm/S).
TN and TP concentrations were highest in urban downstream areas (Figure 4), with means of 5.57 and 117 µg/L, respectively. The present results are consistent with a previous study [22] that reported lower downstream water quality related to wastewater treatment plants. The lowest mean TN and TP concentrations were found in forests, at 2.02 and 34.9 µg/L, respectively. The primary productivity indicator Chl-a showed a wide range of variations, from low levels in forest streams (mean: 2.51 µg/L) in the Han River watershed to high levels in urban downstream regions (mean: 22.4 µg/L), particularly in the Nakdong and Yeongsan River watersheds. These results show clear differences in water quality among land-use types. Thus, water quality was poorer in urban streams than in forest streams, as reported in a previous study [54], and somewhat average in agricultural areas.

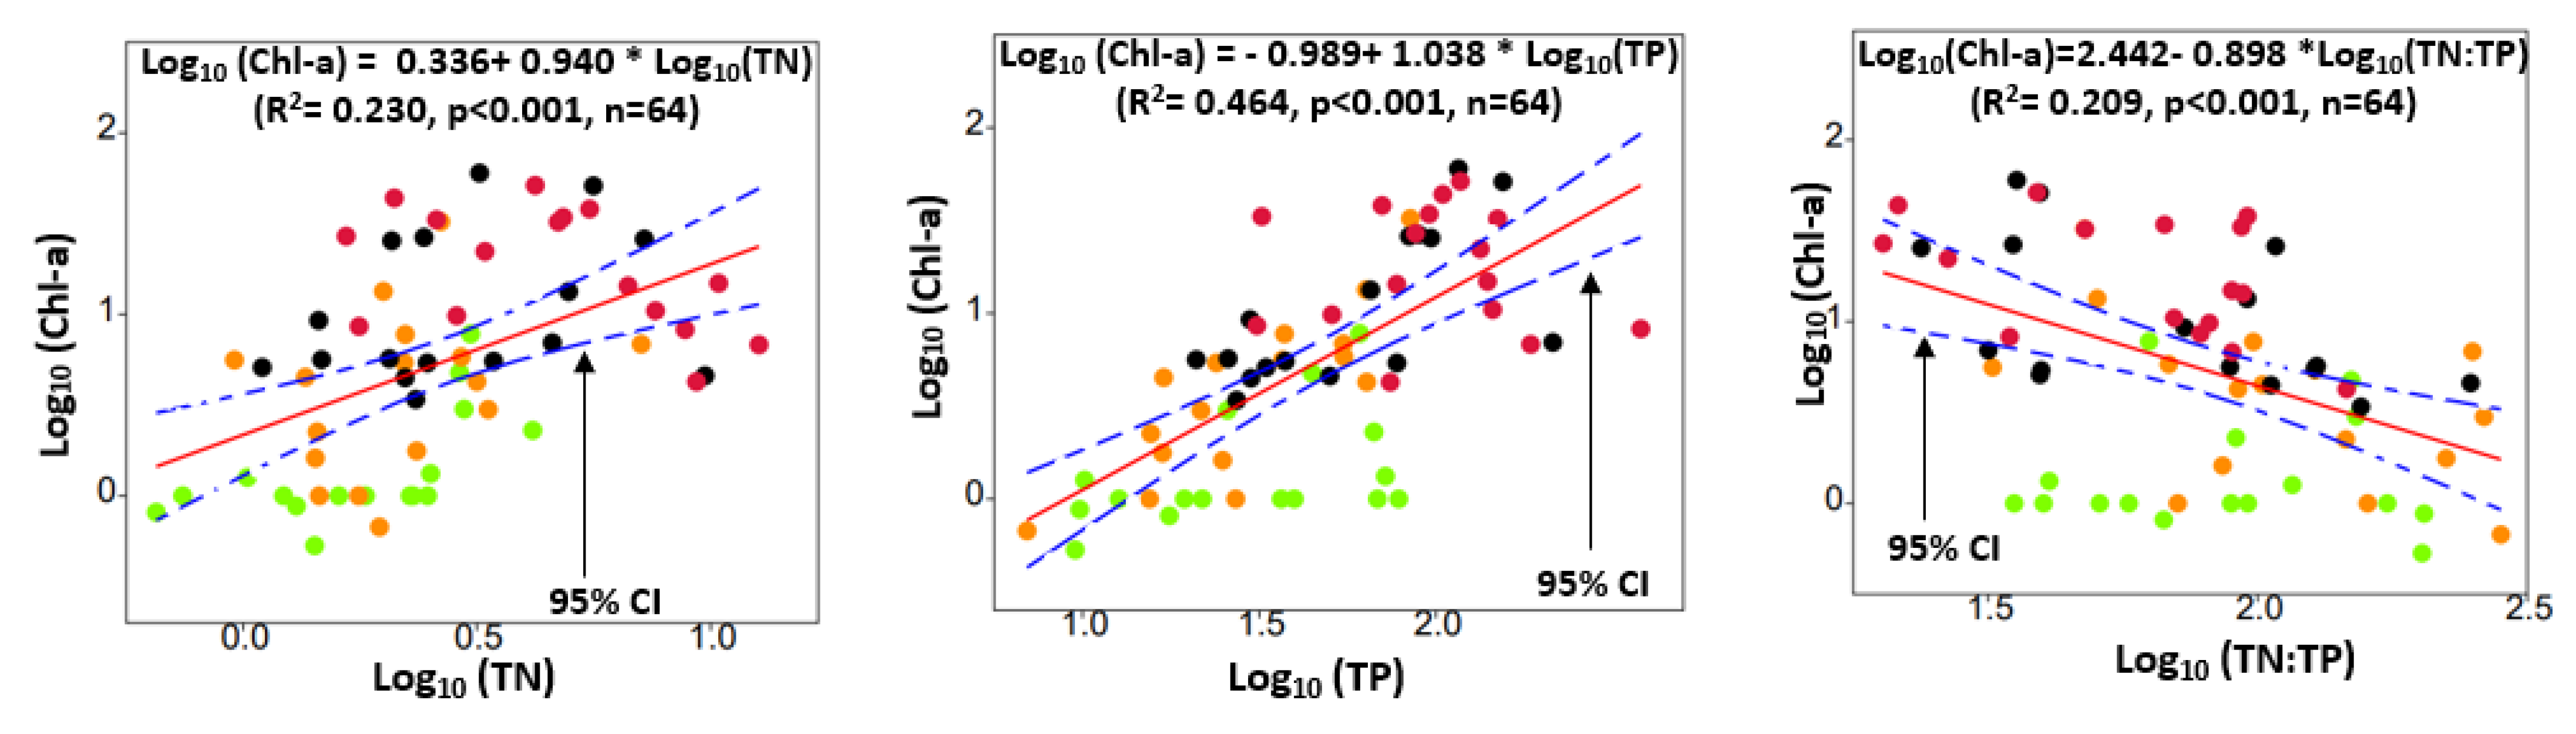
3.2. Relationships between Chl-a and Nutrient Levels

Regression analyses showed diverse relationships among log-transformed Chl-a and nutrient parameters (Figure 4) based on land-use type. Chl-a had a stronger positive relationship with TP (R2 = 0.46; Figure 5) in urban up- and downstream areas than in forests and agricultural areas. On the other hand, TN showed a higher positive association with Chl-a (R2 = 0.23) in urban up- and downstream areas than in forests and agricultural areas. By contrast, Chl-a and TN:TP had a negative relationship (R2 = −0.209), indicating that stream primary productivity depends more on TP than on TN.

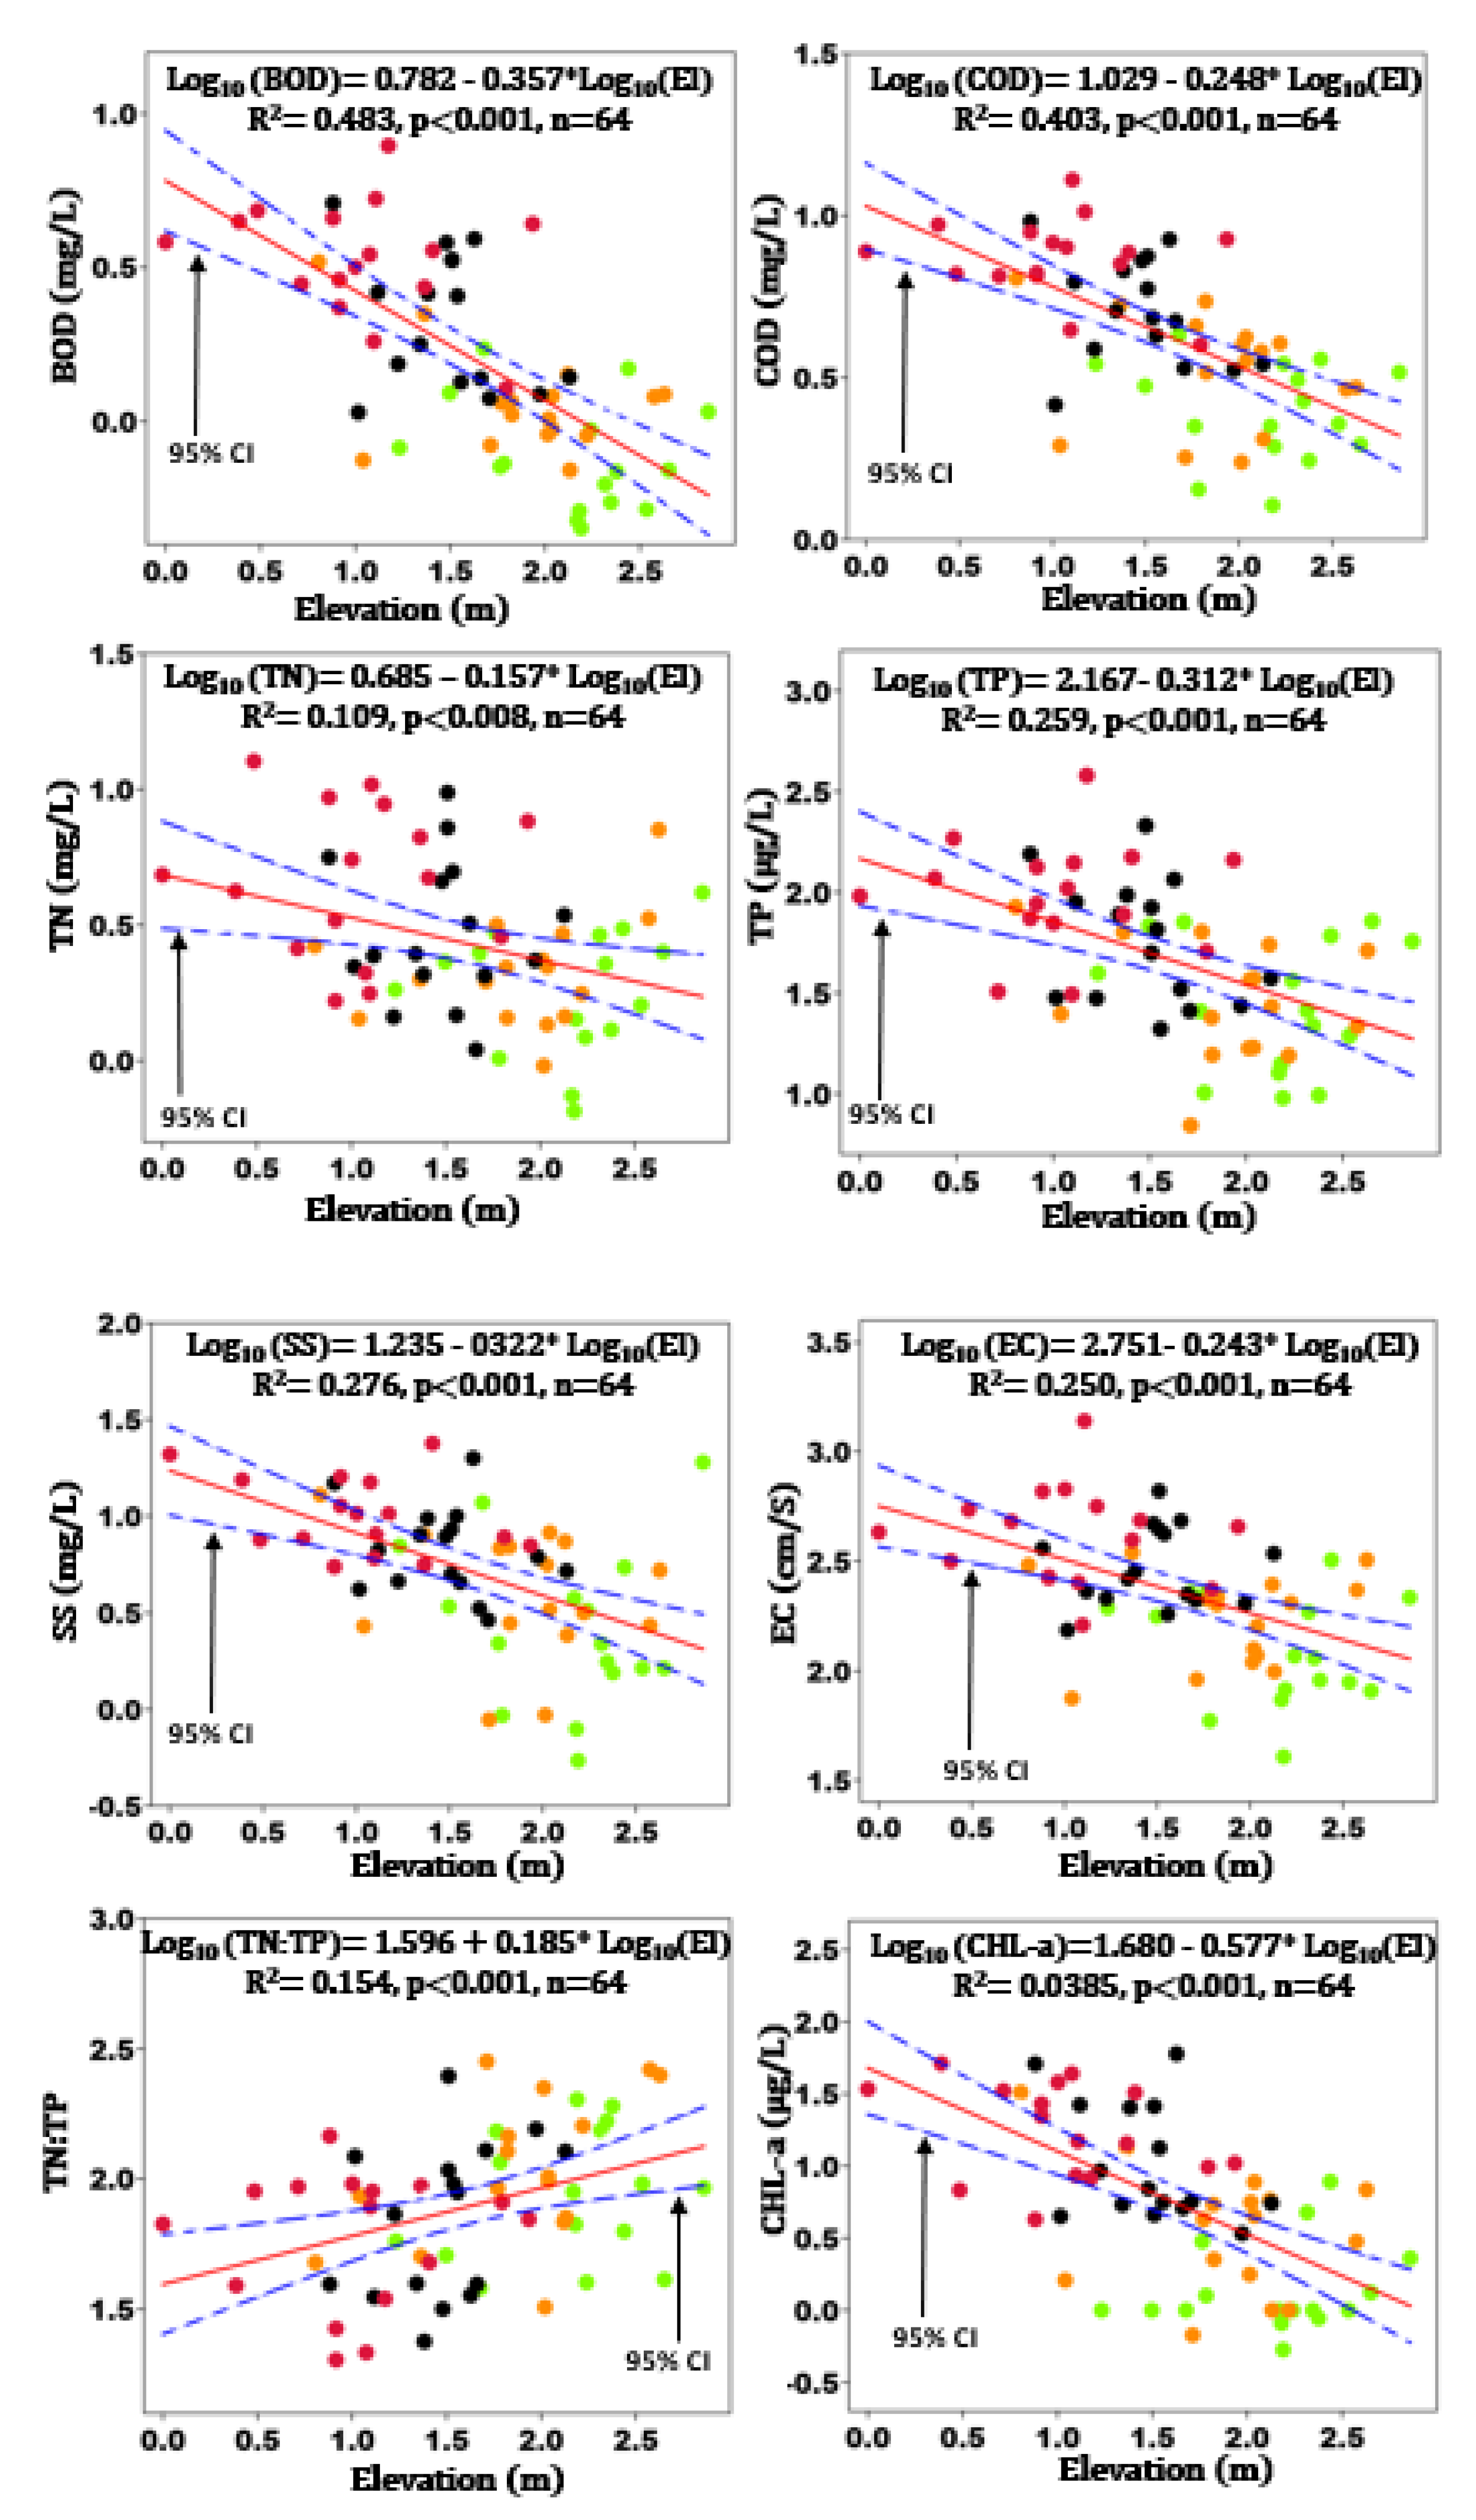
3.3. Influence of Elevation on Water Quality Varaibales

Elevation was strongly linked to water quality (Figure 6). BOD had the most strongly negative relationship with elevation (R2 = 0.483), followed by COD (R2 = 0.40), EC (R2 = 0.25), TSS (R2 = 0.27), TP (R2 = 0.25), and TN (R2 = 0.10). The results showed that water quality parameters decreased as elevation increased.

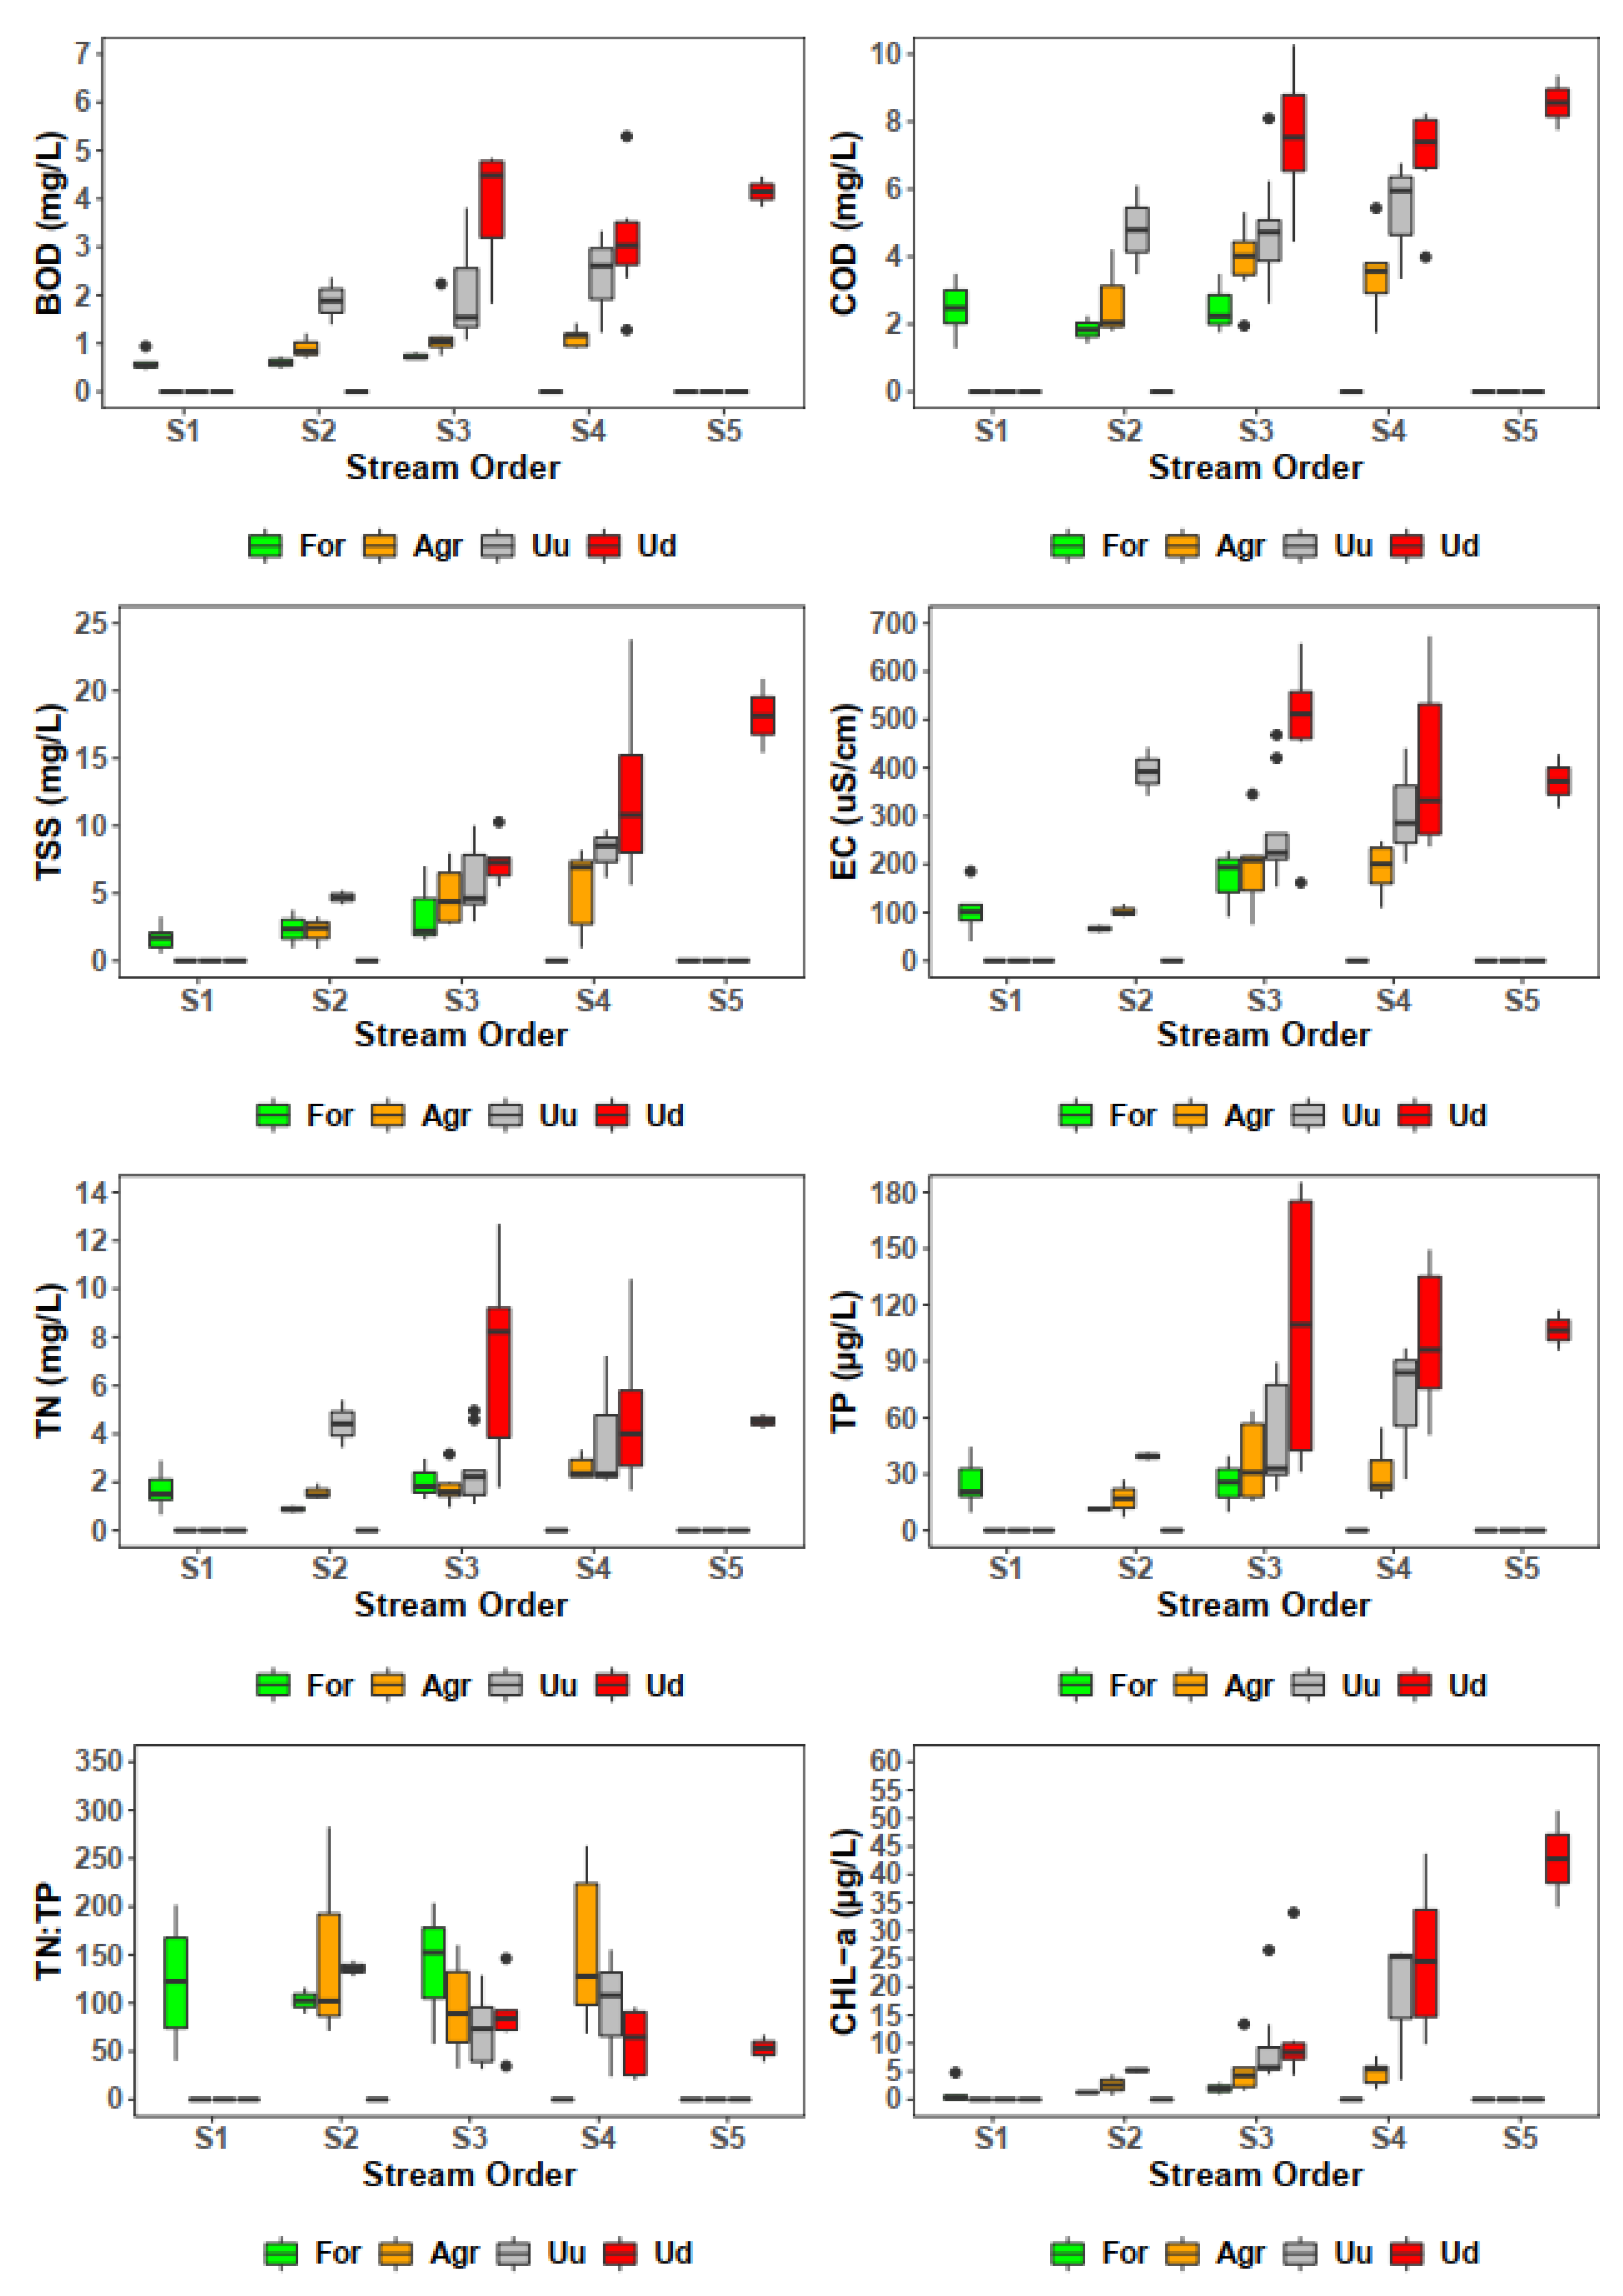
3.4. Relationships between Water Chemistry Parameters and Stream Order

Stream order significantly influences the water quality [38] (Figure 7). The results showed that stream orders vary according to land-use types, such as forests, 1–3; agriculture areas, 2–4; urban upstream areas, 2–4; urban downstream areas, 3–5. BOD, COD, TSS, EC, TN, TP, and Chl-a values were lower in forest streams for all stream orders. In agricultural streams, all water parameters showed increasing trends as stream order increased from 2 to 4. COD and TSS values were highest in fifth-order streams, which are found only in urban downstream areas. In urban downstream areas, TN, TP, and EC values were higher in third-order streams, and Chl-a was highest in fourth- to fifth-order streams. These results indicate that stream order influences water quality, particularly at lower stream orders, regardless of land-use type.

3.5. Relations of Fish Tolerance and Trophic Guilds to Water Chemistry

Regression analysis determined the relationships between fish tolerance (sensitive, intermediate, and tolerant) and fish trophic (insectivores, omnivores, and carnivores) guilds with water quality parameters (Figures S1 and S2; Supplementary File). The results showed no significant relationships between fish tolerance guilds and water quality parameters; however, among the non-significant relationships, sensitive fish species showed negative relationships with water quality variables as follows: BOD, R2 = 0.0732; TSS, R2 = 0.0459; EC, R2 = 0.0681; TN, R2 = 0.071; TP, R2 = 0.076 as shown in the Supplementary File (Figure S1). Intermediate species showed a positive relationship with TSS (R2 = 0.0109) and weak negative relationships with BOD (R2 = 0.0165), EC (R2 = 0.0037), TN (R2 = 0.0021), and TP (R2 = 0.0069), while the tolerant species showed a positive correlation with EC (R2 = 0.0161), BOD (R2 = 0.0065), and TN (R2 = 0.0021).
Regression analysis between trophic guilds and water quality parameters indicated that insectivore species showed a declining trend with increases in TP (R2 = 0.155) and BOD (R2 = 0.123), EC (R2 = 0.0843), TN (R2 = 0.0746), and TSS (R2 = 0.0048) (Figure S2; Supplementary File). Omnivorous species showed increasing trend with EC (R2 = 0.0452) and TN (R2 = 0.0227), while carnivorous species showed a decreasing trend with TN (R2 = 0.0515) and EC (R2 = 0.0051). Overall, the relationships between carnivore and omnivore species with water quality variables were insignificant, while they were significant for insectivore species.

3.6. Relationships between Fish Composition and Stream Order

Relative abundance (RA) of fish trophic and tolerance guilds showed significant differences among stream orders and land-use types, as seen in the Supplementary File (Figure S3). The RA of insectivores and omnivores was high in first-order streams (forests) (100%). The highest RA for carnivores was 56% in third-order streams in urban upstream areas, and the lowest was 0% in first-order forests. Among herbivore species, RA was highest in first-order streams (11%) and lowest in fifth-order streams (0%).
The RA of sensitive species was shown to be higher in first-order forest streams (100%) and lower in third, fourth, and fifth-order streams in urban downstream areas. The highest RA for intermediate fish species was 100% in the first-order forest stream, followed by 51% in the third-order urban upstream areas. In contrast, tolerant fish species had an RA of 100% in a fifth-order stream and 99% in a third-order stream of downstream urban areas.

3.7. IBI, Elevation, Stream Order, and Fish Guilds

The IBI model was used to assess land-use types’ ecological health among the sampling sites (Table 2). Forests and agricultural areas had average IBI values of 20 and 18, respectively, indicating fair and poor stream health. In contrast, upstream and downstream urban regions had average IBI values of 12 and 10, respectively, indicating very poor stream health. The relationship between IBI and elevation was significantly positive (R2 = 0.387), indicating that stream health increased with elevation. IBI was significantly positively related to insectivore abundance (R2 = 0.393) and negatively related to carnivore abundance (R2 = 0.154), as seen in the Supplementary File (Figure S4). There was no significant relationship between IBI and either omnivore or herbivore species abundance.
IBI scores were also significantly positively related to sensitive species abundance (R2 = 0.798) and strongly negatively related to tolerant species abundance (R2 = 0.721), which is consistent with a previous report that tolerant species prefer polluted water [8]. We detected no significant relationship between IBI and intermediate species abundance.
IBI scores were negatively correlated with stream order (R2 = 0.30, p < 0.001; Figure S5; Supplementary File), such that poor stream health was associated with higher stream order (i.e., streams within urban areas). Riffle benthic species (M2) were less abundant at higher stream orders (R2 = 0.098, p < 0.001). Native species (M1) and native insectivore species abundance (M6) were strongly negatively correlated with stream order (R2 = 0.11, p < 0.001 and R2 = 0.19, p < 0.001, respectively). Exotic species abundance was strongly positively correlated with stream order (R2 = 0.219, p < 0.001). The species number increased with stream order, while lower species richness was found at high elevation. (Figure S6; Supplementary File).

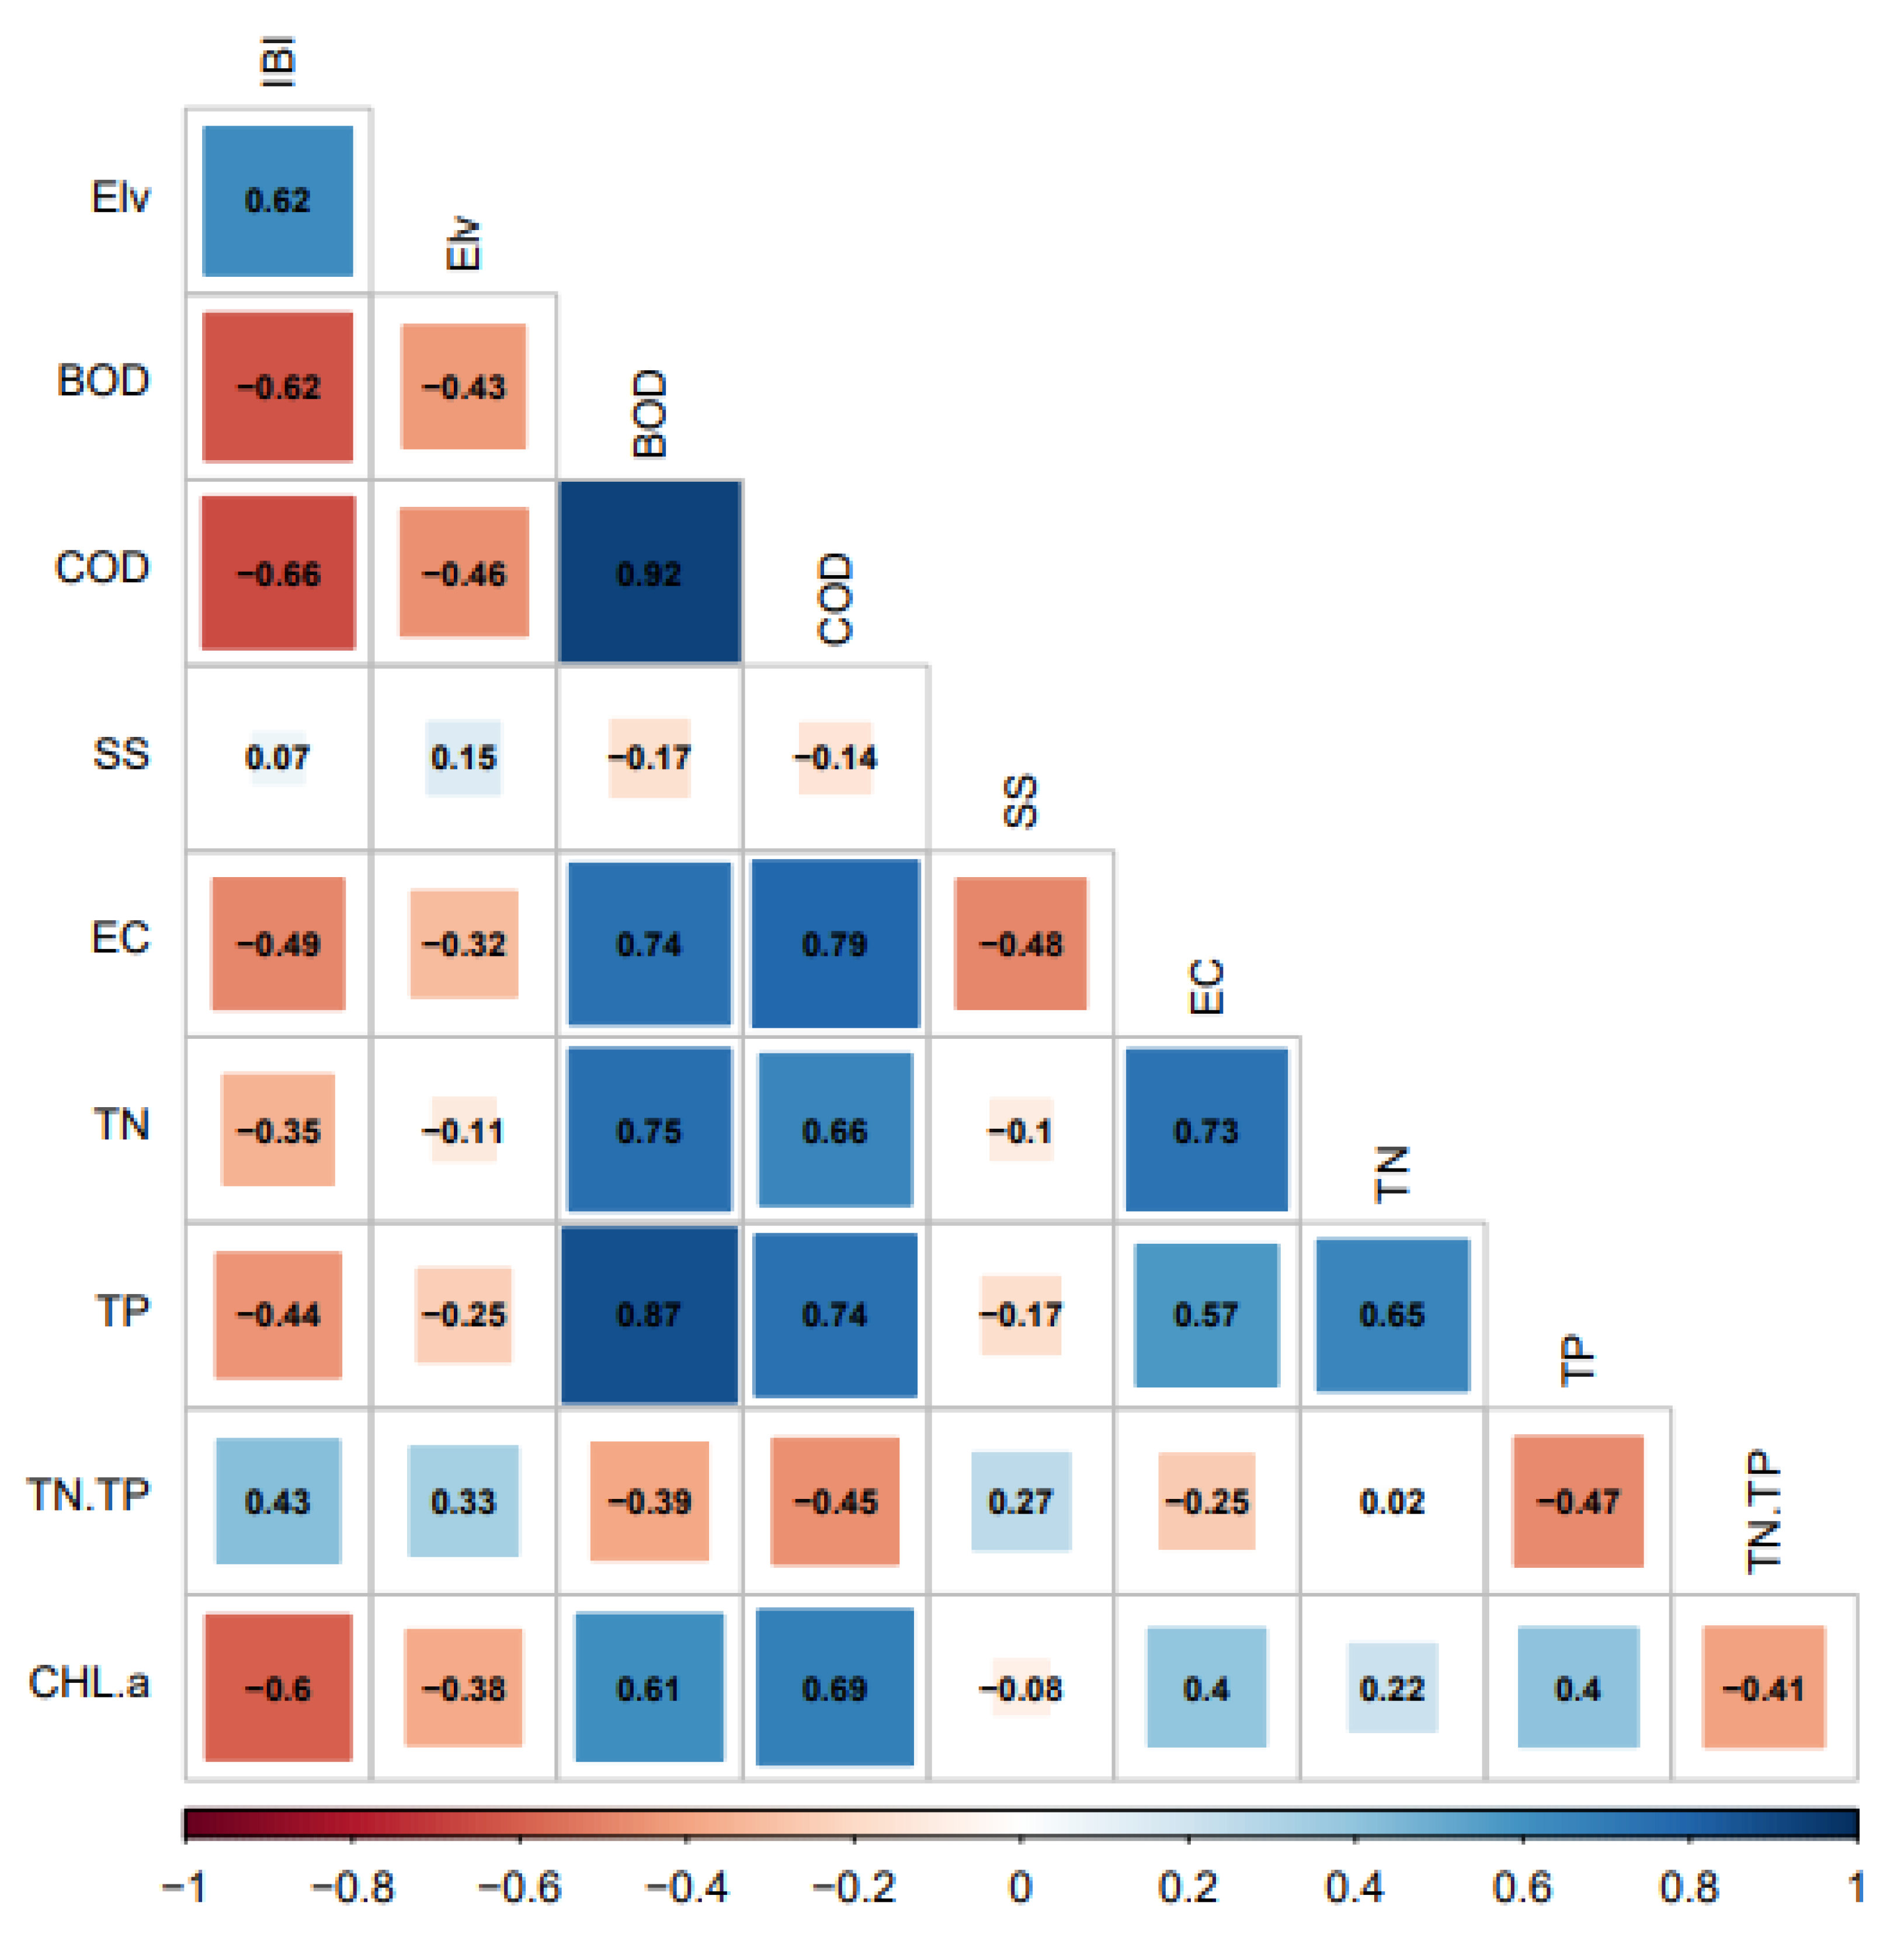
3.8. Pearson Correlation Analysis

A Pearson correlation analysis was used to determine the association among water quality parameters, IBI, and elevation (Figure 8). The results showed that elevation was positively related to IBI (R = 0.62) and negatively related to BOD (R = −0.43), COD (R = −0.46), EC (R = −0.32), TN (R = −0.11), TP (R = −0.25), and Chl-a (R = −0.6). IBI showed a negative relationship with the water quality parameters (BOD; R = −0.62, COD; R = −0.66, EC; R = −0.49, TN; R = −0.35, TP; R = −0.44, CHL-a; R = −0.60). Nutrients flow with organic matter.

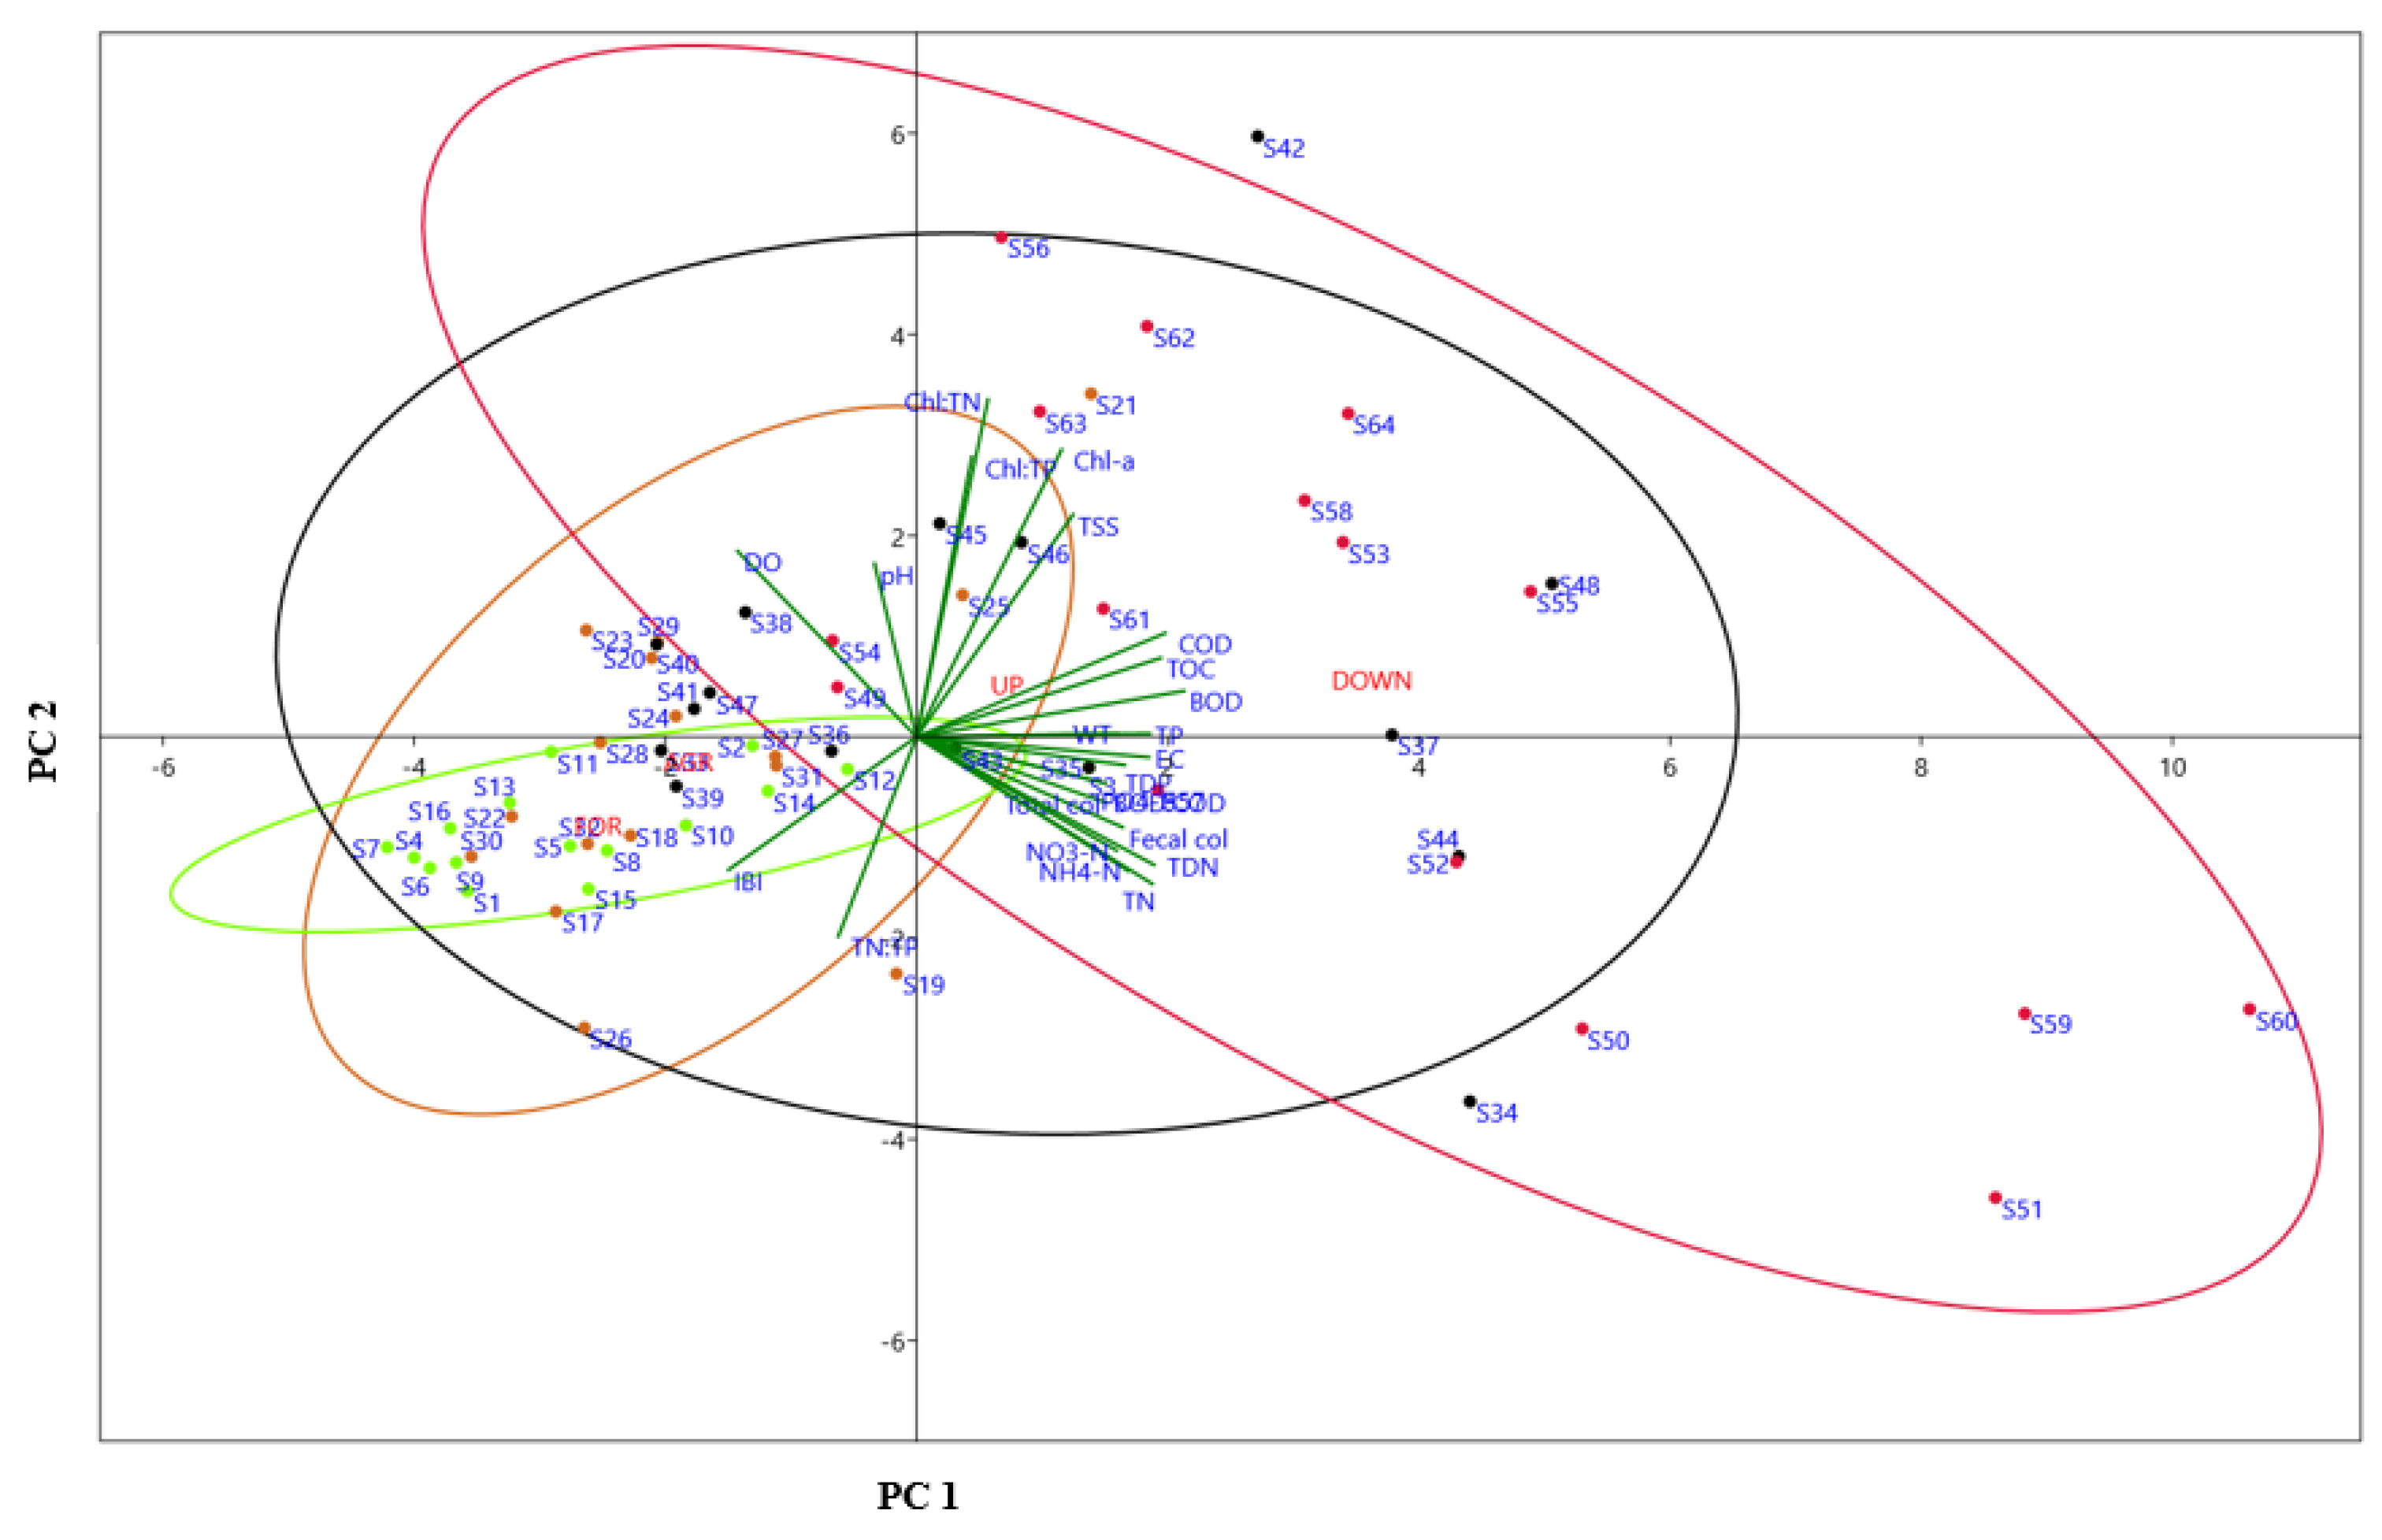
3.9. Insights from Principal Component Analysis

A PCA was performed to assess the influence of land-use type on stream water quality and ecological health (Figure 9). Principal components 1 and 2 together accounted for 65.15% of the variance in water quality variables. Forest streams were more positively associated with DO, pH, and high IBI scores than those in agricultural regions. IBI and DO were negatively correlated with streams in urban regions (streams 33–64); only eight of these streams were found on the negative side of the PC 2 axis. All other water quality parameters (e.g., COD, BOD, TOC, EC, TSS, TP, TN, and Chl-a) were significantly positively correlated with urban streams, indicating that water quality was poor in urban regions. Ecological health and water quality were better in forest streams and moderated in agricultural areas.

4. Discussion

In this study, we examined the effects of land-use type, stream order, and elevation on stream water quality and the fish community. The land-use types included forest, agriculture, urban upstream, and urban downstream areas. Stream ecological health was diagnosed using the IBI model. Water quality was measured in terms of DO, BOD, COD, TSS, TN, TP, EC, and Chl-a levels.

4.1. Impact of Land Use Patterns on Water Quality, Fish Composition, and Ecological Health

Human activities are the most critical factor responsible for global changes in land use patterns; they affect aquatic ecosystems and affiliated watersheds [2,3]. Land use patterns are a core part of the landscape that alters streams or rivers’ hydrological and physicochemical features [3,18]. Earlier studies concluded that lotic systems are primarily affected by the vicinity of land use patterns [2,11]. It regulates the transport of nutrients, organic matter, pollutants, and sediments into rivers or streams [2,54,55,56,57]. The present study revealed a significant relationship between land use patterns and stream water quality.
Water quality in forest streams was better than that in agricultural and urban streams. BOD, COD, TN, TP, and Chl-a levels were high in urban downstream areas, clearly indicating the effects of human disturbance and point source pollution. EC was higher in urban streams, particularly in the Geum River watershed, which is characterized by road salts and substantial runoff from wastewater treatment plants [25]. Forest streams had very low nutrient and sestonic Chl-a levels compared with the other land-use types. Nutrient levels in agricultural streams were mainly influenced by fertilizer application in farms and plantations along the streams. Among urban streams, TN levels were higher in the Han and Geum River watersheds in downstream urban regions due to high population density and runoff from wastewater treatment plants [24,58]. Allan et al. [2] reported that the increased nutrients and organic matter in the lotic system directly resulted from the expansion of urban and agricultural areas. In contrast, these levels decreased due to an increase in forest cover. Therefore, significant predictors of nutrients and organic matter at the watershed scale include the proportion of agricultural and urban land use patterns [3,4].
Fish species richness and abundance are widely used to determine the stream’s ecological health [8,21,32]. In this study, IBI scores showed that agricultural and urban areas had very poor ecological health compared to forest streams. Sensitive and insectivorous fish species are only found in forest areas with good water quality [59]. Tolerant species dominated the fish community in agricultural and urban streams. According to Allan [2], a rise in agricultural and urban land cover will have a negative impact on river ecosystems and biodiversity. Roth et al. [26] observed that agricultural and urban land were the main predictors of the predominant fish community structures in rivers, which negatively correlated with IBI outcomes. Thus, a degraded fish community increased in agricultural and urban land cover. The present study’s findings were consistent with those of Allan [2] and Roth et al. [26]. Numerous studies have demonstrated that urban land cover has been severely degraded and has poor ecological integrity [3]. In the present study, forest cover ecological integrity was in fair conditions. Previous research [2,3,25,26] has demonstrated that biological health improves as forest cover rises in a basin. Regression and principal component analysis results also suggested that chemical pollution and agricultural and urban land cover are responsible for the increased RA of omnivores and tolerant species, indicating a lack of ecological integrity in agricultural and urban stream areas. In contrast, forest cover is less susceptible to chemical deterioration and might support a greater diversity of sensitive species, showing vigorous ecological integrity.

4.2. Stream Order and Elevation Impact on Water Quality, Fish Composition, and Ecological Health

Stream order is an essential determinant for water quality and fish abundance in a watershed [60]. Our analysis results suggested that stream order influenced water quality and fish species richness and composition regardless of land-use type. Water quality was much poorer in higher-order streams than in lower-order streams. First- and second-order streams had very low organic, nutrient, and Chl-a levels, whereas third-order streams in urban regions had higher levels of organic matter and nutrients. Fourth- and fifth-order streams are influenced by intense anthropogenic activities, resulting in eutrophication and hypoxia in downstream ecosystems [61,62]. The present results suggest that the ecological integrity of the lotic systems decreased with increasing stream order and indicated a smaller number of native, riffle benthic, and native insectivore species. The present results are in line with some previous studies [25,27,31].
The elevation is a strong predictor of water quality in lotic systems. The findings showed that TP, TN, BOD, COD, TSS, EC, and Chl-a increased with declining elevation. These outcomes were persistent with the assertion that streams and rivers at low elevations contain higher levels of nutrients, organic matter, suspended solids, and algal biomass [8,9,25,33,44]. Moreover, elevation indirectly determines the intensity and character of land use [2,3,44]. Industrialization, urbanization, and farming are mainly witnessed in low elevation areas, whereas forests dominate in higher elevation zones. Therefore, as elevation climbed, the ecological integrity of the lotic systems increased. The current findings are consistent with prior research [25,27,36].

5. Conclusions

The results of this study supported the findings of previous studies conducted in other countries, including those with monsoon climates, that land-use type substantially influences stream water quality and ecological health. The concentrations of organic matter, suspended sediment, and nutrients were lower in forest streams than in agricultural and urban-dominated streams. Tolerant and carnivore species dominated the fish community in urban streams, whereas sensitive and insectivore species dominated the fish community in forest streams. Thus, streams in urban regions had poorer ecological health than forest streams. The results concluded that stream order and elevation regulate the water quality, fish community, and ecological health. These findings suggest that several measures should be taken to protect the stream’s water quality and ecological integrity, including reducing the amount of industrial and domestic waste that is discharged into the stream from urban areas, implementing cutting-edge wastewater treatment technologies, restricting fertilizer use, and developing new management strategies for agricultural- and urban-dominated streams.

Supplementary Materials

The following supporting information can be downloaded at: https://www.mdpi.com/article/10.3390/w14172765/s1. Figure S1. Response of fish tolerance guilds to biological oxygen demand (BOD, mg/L), suspended solids (SS, mg/L), electric conductivity (EC, µS/cm), total nitrogen (TN, mg/L), and total phosphorus (TP, µg/L) in each of the foul land-use patterns (green: forest region, orange: agriculture region, black: urban upstream region, red: urban downstream region), Figure S2. Response of fish trophic guilds to biological oxygen demand (BOD, mg/L), suspended solids (SS, mg/L), electric conductivity (EC, cm/S), total nitrogen (TN, mg/L) and phosphorus (TP, µg/L) in each of the foul land-use patterns (green: forest region, orange: agriculture region, black: urban upstream region, red: urban downstream region), Figure S3. Relations of fish guilds with stream order, Figure S4. Influence of trophic and tolerance guilds and elevation to IBI, Figure S5. Relations of IBI and relative abundances (%RA) of native species, riffle benthic species, native insectivore individuals and exotic individuals based on the stream orders, Figure S6. Relationship of fish species number with stream order and elevation, Table S1. Stream sites divided into four land-use patterns and their longitude and latitudes depending on the water and fish data collection sites (Land use patterns; F—forest region, A—agriculture region, Uu—urban upstream region, and Ud—urban downstream region), Table S2. Stream sites divided into four land-use patterns and their longitude and latitudes depending on the water and fish data collection sites (Land use patterns; F—forest region, A—agriculture region, Uu—urban upstream region, and Ud—urban downstream region).

Author Contributions

Conceptualization, B.G.K., M.M. and K.-G.A.; methodology, B.G.K.; software, B.G.K. and M.M.; validation, B.G.K., M.M. and S.-J.L.; formal analysis, B.G.K.; investigation, B.G.K.; resources, B.G.K.; data curation, B.G.K.; writing—original draft preparation, B.G.K.; writing—review and editing, B.K., M.M. and K.-G.A.; visualization, B.G.K. and M.M.; supervision, K.-G.A.; S.-J.L.; project administration, K.-G.A.; funding acquisition, K.-G.A. All authors have read and agreed to the published version of the manuscript.

Funding

This work was supported by ‘Korea Environment Industry & Technology Institute (KEITI)’ through the “Exotic Invasive Fish Species Management Project”, funded by the Ministry of Environment, Korea (2018002270003, RE201807019).

Institutional Review Board Statement

Not applicable.

Informed Consent Statement

Not applicable.

Data Availability Statement

The data may be available to the corresponding author upon request, subject to approval.

Acknowledgments

This paper acknowledges the Korea Environment Industry and Technology Institute (KEITI) for their funding and also acknowledges Daejeon Green Environment Center (Yr. 2016) for partial data support.

Conflicts of Interest

The authors declare no conflict of interest.

References

  1. Newson, M.D. Hydrology and the River Environment; Oxford University Press: Oxford, UK, 1994; pp. 199–215. [Google Scholar]
  2. Allan, J.D. Landscapes and riverscapes: The influence of land-Use on stream ecosystems. Annu. Rev. Ecol. Evol. Syst. 2004, 35, 257–284. [Google Scholar] [CrossRef]
  3. Wang, L.; Lyons, J.; Kanehl, P. Impacts of urbanization on stream habitat and fish across multiple spatial scales. Environ. Manag. 2001, 28, 255–266. [Google Scholar] [CrossRef]
  4. Meyer, W.B.; Turner, B.L. Changes in Land Use and Land Cover: A Global Perspective; Cambridge University Press: New York, NY, USA, 1994; p. 537. [Google Scholar]
  5. Tran, C.P.; Bode, R.W.; Smith, A.J.; Kleppel, G.S. Land-Use proximity as a basis for assessing stream water quality in New York State (USA). Ecol. Indic. 2010, 10, 727–733. [Google Scholar] [CrossRef]
  6. Norris, R.H.; Thomas, M.C. What is river health? Freshw. Biol. 1991, 41, 197–209. [Google Scholar] [CrossRef]
  7. Quinn, J.M. Effects of pastora; development. In New Zealand Stream Invertebrates: Ecology and Implications for Management; Collier, K.J., Winterbourn, M.J., Eds.; Caxton: Christchurch, New Zealand, 2000. [Google Scholar]
  8. Lee, J.H.; An, K.G. Integrative restoration assessment of an urban stream using multiple modeling approaches with physical, chemical, and biological integrity indicators. Ecol. Eng. 2014, 62, 153–167. [Google Scholar] [CrossRef]
  9. Johnson, L.; Richards, C.; Host, G.; Arthur, J. Landscape influences on water chemistry in Midwestern stream ecosystems. Freshw. Biol. 1997, 37, 193–208. [Google Scholar] [CrossRef]
  10. Brown, L.R. Assemblages of fishes and their associations with environmental variables, lower San Joaquin River drainage, California. Environ. Biol. Fishes 2000, 57, 251–269. [Google Scholar] [CrossRef]
  11. Mamun, M.; An, K.G. Stream health assessment using chemical and biological multi-metric models and their relationships with fish trophic and tolerance indicators. Ecol. Indic. 2020, 111, 106055. [Google Scholar] [CrossRef]
  12. Sponseller, R.A.; Benfield, E.F.; Valett, H.M. Relationships between land use, spatial scale and stream macroinvertebrate communities. Freshw. Biol. 2001, 46, 1409–1424. [Google Scholar] [CrossRef]
  13. Pedersen, M.L. Effects of channelisation, riparian structure and catchment area on physical habitats in small lowland streams. Fundam. Appl. Limnol. 2009, 174, 89–99. [Google Scholar] [CrossRef]
  14. Meador, M.R.; Goldstein, R.M. Assessing Water Quality at Large Geographic Scales: Relations Among Land Use, Water Physicochemistry, Riparian Condition, and Fish Community Structure. Environ. Manag. 2003, 31, 504–517. [Google Scholar] [CrossRef] [PubMed]
  15. Genito, D.; Gburek, W.J.; Sharpley, A.N. Response of stream macroinvertebrates to agricultural land cover in a small watershed. J. Freshw. Ecol. 2002, 17, 109–119. [Google Scholar] [CrossRef]
  16. Wang, L.; Lyons, J.; Kanehl, P.; Gatti, R. Influences of watershed land use on habitat quality and biotic integrity in Wisconsin streams. Fisheries 1997, 22, 6–12. [Google Scholar] [CrossRef]
  17. Lenat, D.R.; Crawford, J.K. Effects of Landuse on water-Quality and aquatic biota of three North Carolina Piedmont streams. Hydrobiologia 1994, 294, 185–199. [Google Scholar] [CrossRef]
  18. Wang, L.; Lyons, J.; Kanehi, P.; Bannerman, R.; Emmons, E. Watershed urbanization and changes in fish communities in southeastern Wisconsin streams. J. Am. Water Resour. Assoc. 2000, 36, 1173–1189. [Google Scholar] [CrossRef]
  19. Morley, S.A.; Karr, J.R. Assessing and restoring and health of urban streams in the Puget Sound Basin. Conserv. Biol. 2002, 16, 1498–1509. [Google Scholar] [CrossRef]
  20. Miserendino, M.L.; Casaux, R.; Archangelsky, M.; di Prinzio, C.Y.; Brand, C.; Kutschker, A.M. Assessing land-Use effects on water quality, in-Stream habitat, riparian ecosystems and biodiversity in Patagonian northwest streams. Sci. Total Environ. 2010, 409, 612–624. [Google Scholar] [CrossRef]
  21. Atique, U.; An, K.-G. Stream Health Evaluation Using a Combined Approach of Multi-Metric Chemical Pollution and Biological Integrity Models. Water 2018, 10, 661. [Google Scholar] [CrossRef]
  22. Jang, G.-S.; An, K.-G. Physicochemical water quality characteristics in relation to land use pattern and point sources in the basin of the Dongjin River and the ecological health assessments using a fish multi-Metric model. J. Ecol. Environ. 2016, 40, 6. [Google Scholar] [CrossRef]
  23. Trochine, C.; Guerrieri, M.; Liboriussen, L.; Willems, P.; Lauridsen, T.L.; Søndergaard, M.; Jeppesen, E. Factors controlling the stable isotope composition and C: N ratio of seston and periphyton in shallow lake mesocosms with contrasting nutrient loadings and temperatures. Freshw. Biol. 2017, 62, 1596–1613. [Google Scholar] [CrossRef]
  24. Lee, C.-S. Influence of the Point Source Inflow on the Water Quality Variation in the Downstream of Hyeongsan River. Korean Environ. Sci. Soc. 2008, 17, 1075–1080. [Google Scholar]
  25. Mamun, M.; An, K.G. Ecological Health Assessments of 72 Streams and Rivers in Relation to Water Chemistry and Land-Use Patterns in South Korea. Turk. J. Fish. Aquat. Sci. 2017, 18, 871–880. [Google Scholar] [CrossRef]
  26. Roth, N.E.; Allan, J.D.; Erickson, D.L. Landscape influences on stream biotic integrity assessed at multiple spatial scales. Landsc. Ecol. 1996, 11, 141–156. [Google Scholar] [CrossRef]
  27. HaRa, J.; Mamun, M.; An, K.-G. Ecological River Health Assessments Using Chemical Parameter Model and the Index of Biological Integrity Model. Water 2019, 11, 1729. [Google Scholar] [CrossRef]
  28. Goldstein, R.M.; Carlisle, D.M.; Meador, M.R.; Short, T.M. Can basin land-Use effects on physical characteristics of streams be determined at a broad geographic scale? Environ. Monit. Assess. 2007, 130, 495–510. [Google Scholar] [CrossRef]
  29. Woodcock, T.; Mihuc, T.; Romanowicz, E.; Allen, E. Land-Use effects on catchment—And Patch–Scale habitat and macroinvertebrates response in the Adirondack Uplands. Am. Fish. Soc. Symp. 2006, 48, 395–411. [Google Scholar]
  30. Dauer, D.M.; Weisberg, S.; Ranasinghe, J.A. Relationships Between Benthic Community Condition, Water Quality, Nutrient Loads, and Land Use Patterns in Chesapeake Bay. Estuaries 2000, 23, 80–96. [Google Scholar] [CrossRef]
  31. Atique, U.; An, K.-G. Landscape heterogeneity impacts water chemistry, nutrient regime, organic matter and chlorophyll dynamics in agricultural reservoirs. Ecol. Indic. 2020, 110, 105813. [Google Scholar] [CrossRef]
  32. Karr, J.R. Biological integrity-A long neglected aspect of water-Resource management. Ecol. Appl. 1991, 1, 66–84. [Google Scholar] [CrossRef]
  33. An, K.-G.; Park, S.S.; Shin, J.-Y. An evaluation of a river health using the Index of Biological Integrity along with relations to chemical and habitat conditions. Environ. Int. 2002, 28, 411–420. [Google Scholar] [CrossRef]
  34. Joy, M.K.; Death, R.G. Predictive modelling of freshwater fish as a biomonitoring tool in New Zealand. Freshw. Biol. 2002, 47, 2261–2275. [Google Scholar] [CrossRef]
  35. Joy, M.K.; Death, R.G. Application of the Index of Biotic Integrity Methodology to New Zealand Freshwater Fish Communities. Environ. Manag. 2004, 34, 415–428. [Google Scholar] [CrossRef] [PubMed]
  36. An, K.G.; Lee, J.Y.; Bae, D.Y.; Kim, J.H.; Hwang, S.J.; Won, D.H. Ecological assessments of aquatic environments using a multi-Metric model in major nationwide stream watersheds. J. Korean Water Qual. 2006, 22, 796–804. [Google Scholar]
  37. Karr, J.R. Assessment of biotic integrity using fish communities. Fisheries 1981, 6, 21–27. [Google Scholar] [CrossRef]
  38. Penczak, T.; Mann, R.H.K. The Impact of stream order on fish populations in the Pilica drainage basin, Poland. Pol. Arch. Hydrobiol. 1990, 37, 243–261. [Google Scholar]
  39. Lee, S.-H.; Lee, H.-G.; Park, S.-J.; Lee, S.-H.; Choi, J.-K. Distribution Characteristics of Fish Community to Stream Order in Namhan River Watershed. Korean J. Ecol. Environ. 2014, 47, 100–115. [Google Scholar]
  40. Beecher, H.A.; Dott, E.R.; Fernau, R.F. Fish species richness and stream order in Washington State streams. Environ. Biol. Fishes 1988, 22, 193–209. [Google Scholar] [CrossRef]
  41. Horton, R.E. Erosional development of streams and their drainage basin. Bull. Geol. Soc. Amer. 1945, 56, 275–370. [Google Scholar] [CrossRef]
  42. Strahler, A.N. Quantitative analysis of watershed geomography. Trans. Amer. Geophys. Union 1957, 38, 913–920. [Google Scholar] [CrossRef]
  43. Platts, W.S. Geomorphic and aquatic conditions influencing salmonids and stream classification with application to ecosystem classification. In Surface Environment and Mining Program; Supt. of Docs. no. A13.2:Sa3/3; U.S. Forest Service: Washington, DC, USA, 1974. [Google Scholar]
  44. Barilla, T.Y.; Williams, R.D.; Strauffer, J.R., Jr. The Influence of Stream Order and Selected Stream Bed Parameters on Fish Diversity in Raystown Branch, Susquehanna River Drainage, Pennsylvania. J. Appl. Ecol. 1981, 18, 125–131. [Google Scholar] [CrossRef]
  45. Eaton, A.D.; Franson, M.A.H. Standard Methods for the Examination of Water and Wastewater; American Public Health Association: Washington, DC, USA, 2005. [Google Scholar]
  46. Ohio Environmental Protection Agency. Biological Criteria for the Protection of Aquatic Life: Volume III. In Standardized Biological Field Sampling and Laboratory Method for Assessing Fish and Macroinvertebrate Communities; Division of Surface Water, Ecological Assessment Section: Columbus, OH, USA, 1989; p. 66. [Google Scholar]
  47. Marker, A.F.H.; Crowther, C.A.; Gunn, R.J.M. Methanol and acetone as solvents for estimating chlorophyll a and phaeopigments by spectrophotometry. Arch. Hydrobiol. Beih. Ergeb. Limnol. 1980, 14, 52–59. [Google Scholar]
  48. EPA. Fish Field and Laboratory Method for Evaluating the Biological Integrity of Surface Waters; EPA, 600-R-92-111; Environmental Monitoring Systems Laboratory—Cincinnati Office of Modeling, Monitoring Systems, and Quality Assurance Office of Research Development, U.S. EPA: Cincinnati, OH, USA, 1993; p. 348. [Google Scholar]
  49. An, K.G.; Jung, S.J.; Choi, S.S. An Evaluation on Health Conditions of Pyong-Chang River using the Index of Biological Integrity (IBI) and Qualitative Habitat Evaluation Index (QHEI). Korean J. Limnol. 2001, 34, 153–165. [Google Scholar]
  50. Barbour, M.T.; Gerristen, J.; Snyder, B.D.; Stribling, J.B. Rapid Bioassessment Protocols for Use in Streams and Wadeable Rivers: Periphyton, Benthic Macroinvertebrates and Fish, 2nd ed.; EPA 841-B-99-002; Environmental Protection Agency, Office of Water: Washington, DC, USA, 1999. [Google Scholar]
  51. Sigma Plot, Version 14.0; Systat Software, Inc.: San Jose, CA, USA, 2020.
  52. Hammer, Ø. The Past of the Future, PAST; Version 3.18; Natural History Museum, University of Oslo: Oslo, Norway, 2017. [Google Scholar]
  53. Simon, T.P.; Evans, N.T. Environmental quality assessment using stream fishes. In Methods in Stream Ecology: Volume 1: Ecosystem Structure; Hauer, F.R., Lamberti, G., Eds.; Academic Press: Cambridge, MA, USA, 2017; pp. 319–334. [Google Scholar]
  54. Miserendino, M.L.; Brand, C.; di Prinzio, C.Y. Assessing urban impacts on water quality, benthic communities and fish in streams of the Andes Mountains, Pantagonia (Argentina). Water Air Soil Pollut. 2008, 194, 91–110. [Google Scholar] [CrossRef]
  55. Mamun, M.; Choi, J.-W.; Lee, S.-J.; An, K.-G. Preliminary study of spatial distribution patterns of largemouth bass and its relation to water chemistry along with a prediction of the species using maxent model. Int. J. Environ. Sci. 2017, 2, 23–30. [Google Scholar]
  56. Liu, A.; Egodawatta, P.; Guan, Y.; Goonertillek, A. Influence of rainfall and catchment characteristics on urban stormwater quality. Sci. Total Environ. 2013, 444, 255–262. [Google Scholar] [CrossRef]
  57. Wan, R.; Cai, S.; Li, H.; Yang, G.; Li, Z.; Nie, X. Inferring land use and land cover impact on stream water quality using Bayesian hierachial modeling apporach in the Xitiaoxi River Watershed, China. J. Environ. Manag. 2014, 133, 1–11. [Google Scholar] [CrossRef]
  58. Paul, M.J.; Meyer, J.L. Streams in Urban Landscapes. Annu. Rev. Ecol. Evol. 2001, 32, 333–365. [Google Scholar] [CrossRef]
  59. Choi, J.-W.; Kumar, H.K.; Han, J.-H.; An, K.-G. The Development of a Regional Multi-Metric Fish Model Based on Biological Integrity in Lotic Ecosystems and Some Factors Influencing the Stream Health. Water Air Soil Pollut. 2011, 217, 3–24. [Google Scholar] [CrossRef]
  60. Kuehne, R.A. A classification of streams illustrated by fish distribution in an eastern Kentucky creek. Ecology 1962, 43, 608–614. [Google Scholar] [CrossRef]
  61. Dodds, W.K.; Oakes, R.M. Headwater Influences on Downstream Water quality. Environ. Manag. 2008, 41, 367–377. [Google Scholar] [CrossRef]
  62. Vannote, R.L.; Minshall, G.W.; Cummins, K.W.; Sedell, J.R.; Cushing, C.E. The river continuum concept. Can. J. Fish. Aquat. Sci. 1980, 37, 130–138. [Google Scholar] [CrossRef]
Figure 1. Map showing the distribution of the study sites (streams), divided into four land use patterns from the four river watersheds in South Korea.
Water 14 02765 g001
Figure 2. Methodological flow chart for this study.
Water 14 02765 g002
Figure 3. Seasonal patterns of dissolved oxygen (DO), chemical oxygen demand (COD), suspended solids (SS), water temperature (WT), and electric conductivity EC with monthly rainfall (mm) for 2016–2020 in 64 stream sites. (Each of the four land use patterns is divided into the four river watersheds.
Water 14 02765 g003
Figure 4. Seasonal patterns of total nitrogen (TN), total phosphorus (TP), Chlorophyll-a (Chl-a), and TN:TP ratios with monthly rainfall (mm) for 2016–2020 in 64 stream sites in each of the four land-use patterns divided into the four river watersheds.
Water 14 02765 g004
Figure 5. Linear regression analysis of the primary productivity indicator Chl-a with relation to water nutrient parameter (TN, TP) and their ambient ratios (TN:TP) in each of the four land-use patterns (green: forest region, orange: agriculture region, black: urban upstream region, red: urban downstream region).
Water 14 02765 g005
Figure 6. Regression analysis of the organic matters (BOD, COD), suspended solids (SS), electric conductivity (EC), nutrient (TN, TP), TN:TP, and Chl-a with elevation (m) in each land-use pattern (green: forest region, orange: agriculture region, black: urban upstream region, red: urban downstream region).
Water 14 02765 g006
Figure 7. Variations of organic matters (BOD, COD), suspended solids (SS) and electric conductivity (EC), nutrients (TN, TP), TN:TP, and Chl-a based on land-use patterns and stream order (green: forest region, orange: agriculture region, grey: urban upstream region, red: urban downstream region, S1–S5: stream order 1–5).
Water 14 02765 g007
Figure 8. Correlation analyses among index of biotic integrity (IBI), water chemistry variables, and elevation (m) in 64 streams from four different land-use patterns (ranging from −1 to 1). The water chemistry parameters include biological oxygen demand (BOD), chemical oxygen demand (COD), total suspended solids (SS), electric conductivity (EC), total nitrogen (TN), total phosphate (TP), and chlorophyll-a (CHL-a).
Water 14 02765 g008
Figure 9. Principal component analysis among water quality parameters and IBI based on four land-use pattern streams (green: forest region, orange: agriculture region, black: urban upstream region, red: urban downstream region).
Water 14 02765 g009
Table 1. Summary statistics of selected water chemistry variables in the forest, agriculture, urban upstream, and urban downstream regions during the study period (2016–2020).
Land-Use PatternSummary AttributespHWT
(°C)
DO (mg L−1)BOD
(mg L−1)
COD
(mg L−1)
TSS
(mg L−1)
EC
(µScm−1)
TN
(mg L−1)
TP
(µg L−1)
TN:TPCHL-a
(µg L−1)
Forest regionMean ± SD Min–Max7.7 ± 0.5
5.7–9.7
14.4 ± 8.0
0.1–32
10.8 ± 2.1
4.6–17.7
0.83 ± 0.6
0–7.0
2.62 ± 1.16
0.5–9.2
4.14 ± 14.65
0–293.3
143.1 ± 86.8
22.0–54.0
2.02 ± 1.23
0.21–7.71
34.9 ± 30.1
0–203
100 ± 103
0–884
2.5 ± 5.4
0–85.9
Agriculture
region
Mean ± SD Min–Max7.8 ± 0.7
1.9–11.2
15.1 ± 34.7
0–34.7
11 ± 2.5
3.4–22.2
1.3 ± 1.0
0.1–8.8
3.6 ± 1.9
0–13.1
4.9 ± 7.4
0–93
191.7 ± 10
4.44–10
2.39 ± 1.66
0.23–11.28
35.1 ± 43.8
0–439
131 ± 142
0–1242
6.7 ± 13.1
0–152.5
Urban upstream regionMean ± SD Min–Max7.7 ± 0.6
0.8–10.6
16.3 ± 8.3
0.8–33.1
10.6 ± 2.5
3.3–21.3
2.4 ± 1.8
0.2–17.1
5.5 ± 2.7
1.4–19.5
7.6 ± 9.9
0–152.3
312.4 ± 161.4
41–1170
3.52 ± 2.83
0.24–21.05
72.1 ± 71.7
1–714
87 ± 105
2–1130
16.2 ± 27.1
0.2–262
Urban-downstream regionMean ± SD Min–Max7.7 ± 0.5
5.4–10
17.4 ± 7.6
2.3–32.2
10.2 ± 2.4
3.9–19.8
3.7 ± 2.6
0.3–27
7.7 ± 2.9
2.1–20.4
11.1 ± 21.7
0.4–490.4
472.7 ± 322.7
5–1454
5.57 ± 3.82
0.56–20.59
117 ± 125
5–1454
69 ± 54
3–356
22.4 ± 26.1
0–224.6
Table 2. Biological health assessment using the IBI model based on the four land-use patterns, including forest, agriculture, urban up, and downstream sites.
CategoryModel Metric Components (M) Scoring Criteria Mean IBI ScoresLand-Use Pattern
531ForestAgricultureUrban UpstreamUrban Downstream
Species Richness
and Composition
M1: Total Number of Native Fish Species>67%33–67%<33%38% (3)48% (3)37% (3)37% (3)
M2: Number of Riffle Benthic Species>67%33–67%<33%53% (3)43% (3)39% (3)29% (1)
M3: Number of Sensitive Species>67%33–67%<33%41% (3)36% (3)26% (1)20% (1)
M4: Proportion of Individuals as Tolerant Species<5%5–20%>20%28% (1)50% (1)66% (1)81% (1)
Trophic
Composition
M5: Proportion of Individual as Omnivore Species<20%20–45%>45%31% (3)50% (1)50% (1)66% (1)
M6: Proportion of Individuals as Native Insectivore Species>45%20–45%<20%31% (3)24% (3)17% (1)1% (1)
Fish Abundance
of Native and Exotics
M7: Total Number of Native Individuals>67%33–67%<33%45% (3)36% (3)23% (1)26% (1)
M8: Proportion of Individuals with anomalies00–1%>1%>1% (1)>1% (1)>1% (1)1% (1)
Biological Health
Criteria
Final scores 20181210
Biological Health
Criteria
FairPoorVery PoorVery Poor
Publisher’s Note: MDPI stays neutral with regard to jurisdictional claims in published maps and institutional affiliations.

