
Determining Soil Available Water Capacity and Reasonable Irrigation Volume in Dryland Pasture

1
Department of Geological Engineering, Chang’an University, Xi’an 710054, China
2
Water Cycle and Geological Environment Observation and Research Station for the Chinese Loess Plateau, Ministry of Education, Qingyang 745300, China
*
Author to whom correspondence should be addressed.
Water 2022, 14(17), 2760; https://doi.org/10.3390/w14172760
Submission received: 9 July 2022
/
Revised: 24 August 2022
/
Accepted: 1 September 2022
/
Published: 5 September 2022
Abstract
:Among the methods used to describe soil-available water in terms of yield, field water capacity and permanent wilting coefficient were considered as the upper and lower boundaries, respectively, for normal plant growth. This study investigated the soil properties and groundwater resources of the Hailiutu pasture in Inner Mongolia, China. Soil water characteristics and hydraulic conductivity function curves of the pasture soil were measured based on filter paper method. Experimental results showed that air-entry and residual value were determined to be 34.6% and 13.1%, corresponding to the field water capacity and permanent wilting coefficient, respectively, and the available water capacity was 218.0 mm. The downward velocity of the soil wetting front in the silt is 3.0 mm/h. Site investigation revealed that the pasture was a natural capillary barrier, and its critical suction could optimize the upper boundary of irrigation. Considering the limited underground water resources, shallow water level, and the transpiration of Caragana Korshinskii in the pasture, an available drip irrigation method was designed. The spacing between drip irrigation pipes is 60 cm, the spacing between drip holes is 60 cm, the drip irrigation volume per hole is 475.2~838.8 mL/d, the drip irrigation time is 110~200 min at each night. Each hectare pasture exhausts 13.5~22.5 m3 water each day. Field tests showed that the proposed method is feasible and can be used for irrigation in dryland pastures.
1. Introduction
The arid desert regions of Northwest China are characterized by low precipitation, high evaporation, and low soil water content. Therefore, the water needed by plant roots cannot be replenished in time under natural climatic conditions. Water resources, both surface water and groundwater, are insufficient to satisfy the irrigation requirements of pasture and agricultural lands [1,2,3]. It is a key issue to be explored for the sustainable development of agriculture and animal husbandry in areas with limited water resources.
Soil particles suction water, and the suction increases exponentially with decreasing soil water content. During plant growth, the roots system absorbs water from the soil. However, not all soil water can be absorbed and utilized by plants. The water that can be absorbed depends on the available water in the soil and is called the soil-available water capacity (SAWC). The SAWC lies between the permanent wilting point (PWP) and field water capacity (FC) [4,5]. The FC is the maximum water content of the soil after free drainage or gravity drainage and is referred to as the water content when the capillary water reaches the maximum [6,7,8,9]. The PWP refers to the water content when a plant is permanently wilted [10]. The water-excessing FC rapidly decreases under gravity force, whereas the water lowering PWP is firmly adsorbed on the surface of soil particles and cannot be absorbed by plants [11]. For normal plant growth, FC and PWP are the upper and lower boundaries, respectively. The ability of the vegetation to absorb water from the soil is storage capacity (SC). The SC of a soil layer can be determined by integrating its unit volumetric SC over the thickness [9].
There are direct and indirect methods for determining the PWP of the soil. The direct method involves cultivating plants in the laboratory. Gradually, irrigation is stopped to ensure that the plants begin to wither permanently because of a lack of water. The soil water content obtained using this method is the PWP [12]. This method is time-consuming, and the accuracy is not easy to control. In the indirect method, the PWP is calculated as 1.34–1.50 times the maximum hygroscopicity of soil, but the accuracy of the converted data is poor [9]. To determine the FC, after saturating the soil samples, the water is allowed to be drained under gravity. The framed flood irrigation method is used for the field observations. The field is enclosed or ridged, and the soil is irrigated to saturation. The soil surface is covered to avoid evaporation. Thereafter, the water is allowed to be drained until the gravity water in the soil completely removed, and the remaining water reaches a basic balance. The water content at this time is the FC, which can be measured by oven drying the soil samples. This method is suitable for soils with coarse textures [13]. For soils with high cohesion, the test requires a long time and incur high cost [13,14,15]. In laboratory measurements, the Wilkes method is applied using undisturbed soil samples. After soaking and saturation, the soil is placed on a prepared air-dried soil sample, and the gravity water in the soil sample is discharged under the action of the air-dried soil suction. This method involves the selection of the water absorption time, that is when the gravity water is completely discharged [16,17].
To overcome the shortcomings of the present test methods, researchers have tried to identify new methods based on the soil water energy aspect [13,15,18]. According to this aspect, the absorption action can absorb hygroscopic, membrane, capillary suspended, and capillary rising waters, but it cannot hold gravitational water [18,19]. The soil water characteristic curve (SWCC) reflects the relationship between the soil water energy state and soil water content. Hydraulic conductivity function (HCF) is an important parameter that reflects water transport in unsaturated soils. There are two evident inflection points in the SWCC: the suction at the inflection points of low suction, called the air-entry value, and the suction at the inflection point of high suction, called the residual value. The air-entry and residual values divide the SWCC into three zones: the boundary effect, transition, and residual zones [20]. In the boundary effect zone, the movement of water is driven by gravity; all soil pores are filled by continuous water, and only a few closed bubbles are wrapped in the water. Free water is temporarily stored in the large pores of the soil when atmospheric rainfall or irrigation intensity exceeds the water-holding capacity of the soil. Although it can be absorbed and utilized by plants, it rapidly leaks below the root layer of plants under gravity, and the utilization rate is low. In the transition zone, owing to the decreasing water content and increasing air content, a solid–liquid–gas interface is formed. Capillary water forms a liquid bridge between the soil particles, and the movement of water is driven by both the capillary force and gravity. In the residual zone, water is adsorbed on the surface of the soil particles and cannot flow freely. Therefore, the water flows in a vapor state driven by thermal energy and cannot be utilized by plants. Thus, capillary water is the most valuable source of water for plant growth. The water in the transition zone of the SWCC can be considered as the soil-available water range. The water content of the air-entry value in the SWCC corresponds to the FC, and the water content of the residual value corresponds to the PWP.
The aim of the study: (1) establish experimental equipment and methods; (2) quantitatively determine SAWC, FC and PWP; (3) calculate the drip irrigation volume and time; (4) design an available and reasonable drip irrigation method. Our study can optimize FC and PWP of the definition and existing measurement methods. Furthermore, our irrigation methods proposed provide a certain reference for the local irrigation system. At the same time, it can be applied to other dryland pastures with similar geological backgrounds and climate.
2. Study Area
The Hailiutu pasture in Inner Mongolia served as the study region. The pasture belongs to the sheep breeding base of Bayannur City, Inner Mongolia. The base provided the irrigation water and managed the technical problems. Thus, in 2017, we explored the groundwater source of the pasture and collected meteorological data throughout the year.
The pasture is located 18 km south of the capital of Mid-Urat Banner, Inner Mongolia (41°24′52″ N and 108°34′ 59″ E, Figure 1). It is located in an intermountain basin in the south of Yinshan and connects to the main ridge of the Yinshan Mountain to the north. Yinshan Mountains is adjacent to the Yellow River Flood Plain. The terrain of the pasture dips gently from northwest to southeast, with an average elevation of approximately 1020 m. The pasture is 3 km long from north to south and 2.2 km wide from east to west, covering an area of approximately 666.7 hectare, and it sits on the inter-river massif between the Hailiutu River and Hellerdgauler. The two rivers intersect to the southeast of the pasture and then flow to the Delingshan Reservoir in the far south region. As the reservoir is located downstream, it cannot provide irrigation water to the pasture. In the rivers’ upstream coast, irrigation is conducted utilizing most of the surface water, leading to the rivers flowing in autumn and winter and drying up in spring and summer. We investigated the groundwater in the pasture and found that the usable groundwater was limited. Therefore, to solve the shortage of irrigation water in the pasture, the water needs to be used efficiently and optimally.
This area is part of the intermountain Tertiary Tectonic Basin. The bedrock is composed of Cenozoic volcanic basalt and Proterozoic quartz schist. The bedrock is unconformably covered by the Tertiary purple mudstone, which constitutes a waterproof floor for shallow phreatic water. The alluvial sand and gravel layers constitute the aquifer, and the ground surface is covered with 0.5–1.0 m of aeolian and alluvial silt which is a vegetation nutrient layer. In the peripheral highlands, tertiary mudstones were found beneath the aquifer. The deepest point of the mudstone was approximately 12.0 m, and the groundwater depth was approximately 5.0 m. The groundwater thickness beneath the pasture was 4.0–9.7 m. The groundwater is laterally recharged by the Hailiutu River which flows on the west, southward to the Yellow River Flood Plain.
The pasture is a semi-desert area. The natural vegetation was sparse and low, with a coverage rate of approximately 20%. The plants were primarily perennial shrubs and clump grasses without any trees. The main families were Fabaceae Lindl., Poaceae Barnhart, Liliaceae Juss., Asteraceae Bercht. & J. Presl, and Lamiaceae Martinov, and the genera were Chrysolophus, Allium L., Agropyron Gaertn., Artemisia L., and Cleistogenes Keng. Sheep prefer to eat Caragana korshinskii and Allium mongolicum Regel, whose habitats are wind-eroded, fixed, and semi-fixed sandy lands. As the dominant species in the plant community, C. korshinskii was evenly distributed because of its unique autotoxicity in dry areas. The root of C. korshinskii was developed to a depth of more than 5 m. The height of the plant was 60 cm and the average crown width was 31 cm. Except for the perennial C. korshinskii, the root depth of the rest of the vegetation was 2 m, and the capillary rise of the aquifer was less than 1 m. The plant roots cannot directly absorb groundwater. In addition, the local rainfall was low, and the evaporation was high.
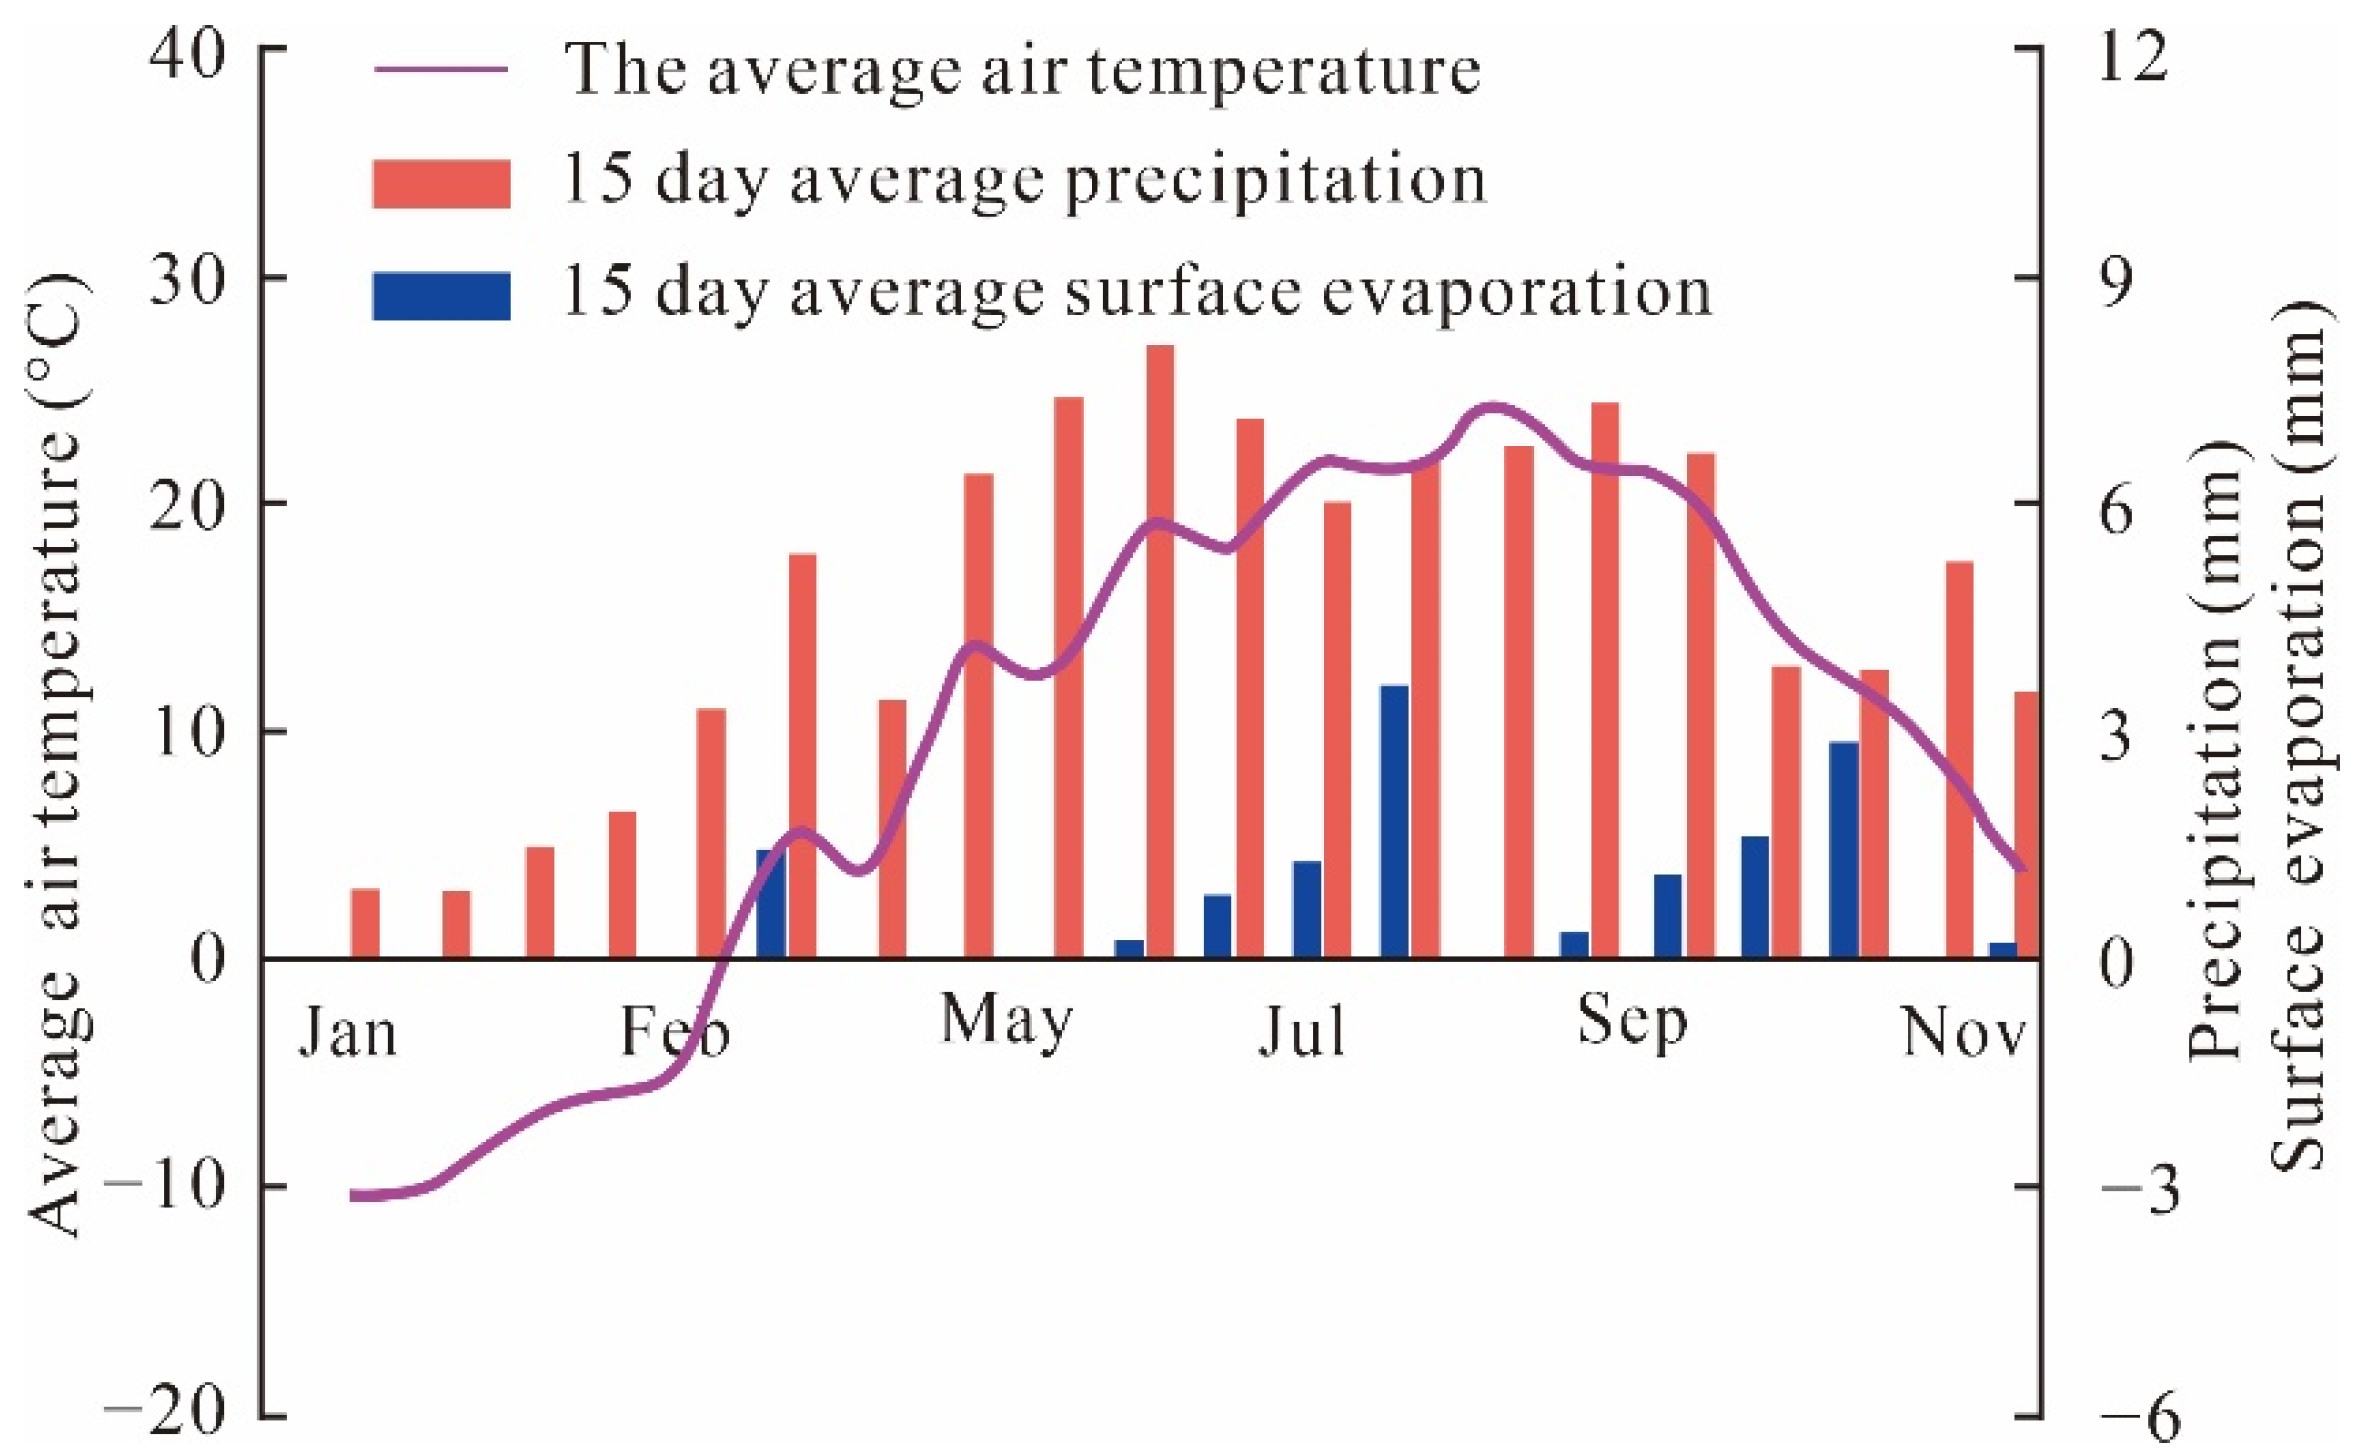
Figure 1 shows the 15-day average data of precipitation, evaporation, and air temperature recorded in Mid-Urat Banner from January to November 2017. From January to mid-March, the temperature was below 0 °C, and from mid-March to August, the temperature increased. The temperature peaked at 26.2 °C in late July. From August to November, the temperature dropped from 26.2 °C to 1.2 °C. Precipitation primarily occurred from April to September during the year. The daily precipitation was 2–10 mm. Evaporation primarily occurred from March to October, accounting for 94% more of the total annual evaporation, and has a good correlation with temperature. Evaporation was much higher than precipitation.
3. Materials and Methods
3.1. Laboratory Tests
A soil column apparatus was designed based on the instantaneous profile method combined with the filter paper method to determine the SWCC and HCF. The apparatus consisted of a Marotte bottle for water supply and a soil column that was overlapped by several soil samples, cut mental rings, and filter papers sandwiched between two samples (Figure 2). All specimens were collected from the same site to guarantee that they are identical. The specimens were dried in 105 °C for 8 h, while Whatman No. 42 filter papers were dried over 16 h. Then, the specimens were placed in a desiccant jar to cool to room temperature (20 °C). These dried specimens and filter papers were subsequently weighed and stacked up to a column. The specimens and filter papers were weighed every 4 h. At each time point, they were taken off from the column and individually weighed. An electric balance with an accuracy of 0.01 g was used to weigh specimens, and an XSE analytical balance with an accuracy of 0.0001 g (Mettler-Toledo Co., Ltd., Greifensee, Switzerland) was used to weigh the filter papers. The weighing process was conducted by two persons: one weighed the individual specimen, and the other simultaneously weighed the filter paper under each specimen. After all specimens and filter papers were weighed, the specimens and filter papers were returned in the initial order as a column, immediately enclosed in the plexiglass cylinder and put into a thermostat at 20 °C. The environmental temperature was maintained at exactly 20 °C. The saturated permeability was separately measured by a TST-55 permeameter. With the water infiltrating downward, the water contents of the soil specimen and sandwiched filter paper along the column vary with time. They can be obtained by weighing the specimens and filter papers at regular time intervals [21]. Then, the matric suction of the soil is calculated with the calibration equations (Equation (1)).
Whatman No. 42 is a commonly used filter paper that ASTM provides for the calibration curve. Its calibration functions are provided in ASTM D5298-10, Standard Test Method for Measurement of Soil Potential (Suction) Using Filter Paper [22]:
where h is the soil matric suction, and wfp is the measured gravimetric water content of filter paper.
Therefore, the water content and matric suction variations with depth, which are respectively named the water content profiles and suction profiles at different measuring times, are derived. The SWCC is obtained by plotting the mean volumetric water contents of each pair of contacted specimens against the matric suction. Experimental techniques for the direct measurement of SWCC provide a series of discrete data points, which reflect the relationship between soil suction and water content. The measured data are fitted using the van Genuchten function [19].
3.2. Determination Soil-Available Water Capacity Based on the Soil Water Energy
3.2.1. Soil–Water Characteristic Curve to Soil-Available Water Capacity
Draw tangent lines at the SWCC to determine the air-entry value and residual value. The air-entry value corresponds to the field water capacity, while the residual value corresponds to PWP. The effective water range of a soil layer can be determined by integrating its volumetric water content () over its thickness () [23]. The effective water capacity can be calculated according to Equation (2).
where SC is soil-available water capacity (m), FC is field water capacity, PWP is permanent wilting coefficient, is the thickness of the silt layer (m), is the critical matric suction (kPa), and is volumetric water content at matric suction kPa. is the residual water content, is the saturated water content. , , and are fitting parameters. approximates the inverse of the air-entry value. is related to the pore size distribution of the soil. is related to the overall symmetry of the characteristic curve, .
3.2.2. Capillary Barrier to Soil-Available Water Capacity
In the stratigraphic structure of the First Terrace of the river and the proluvial fan, the soil profile is not uniform from top to bottom. During the deposition of the alluvial and proluvial strata, the dual structure of lower coarse-grained and upper fine-grained strata is often formed. The lower coarse-grained strata form a natural capillary barrier that can prevent the downward migration of unsaturated water [24]. Under unsaturated conditions, the suction of the upper fine-grained soil is greater than that of the coarse-grained soil, and it can even overcome the influence of gravity to prevent the flow of water from the fine-grained soil layer to the coarse-grained soil layer.
3.3. Field Tests
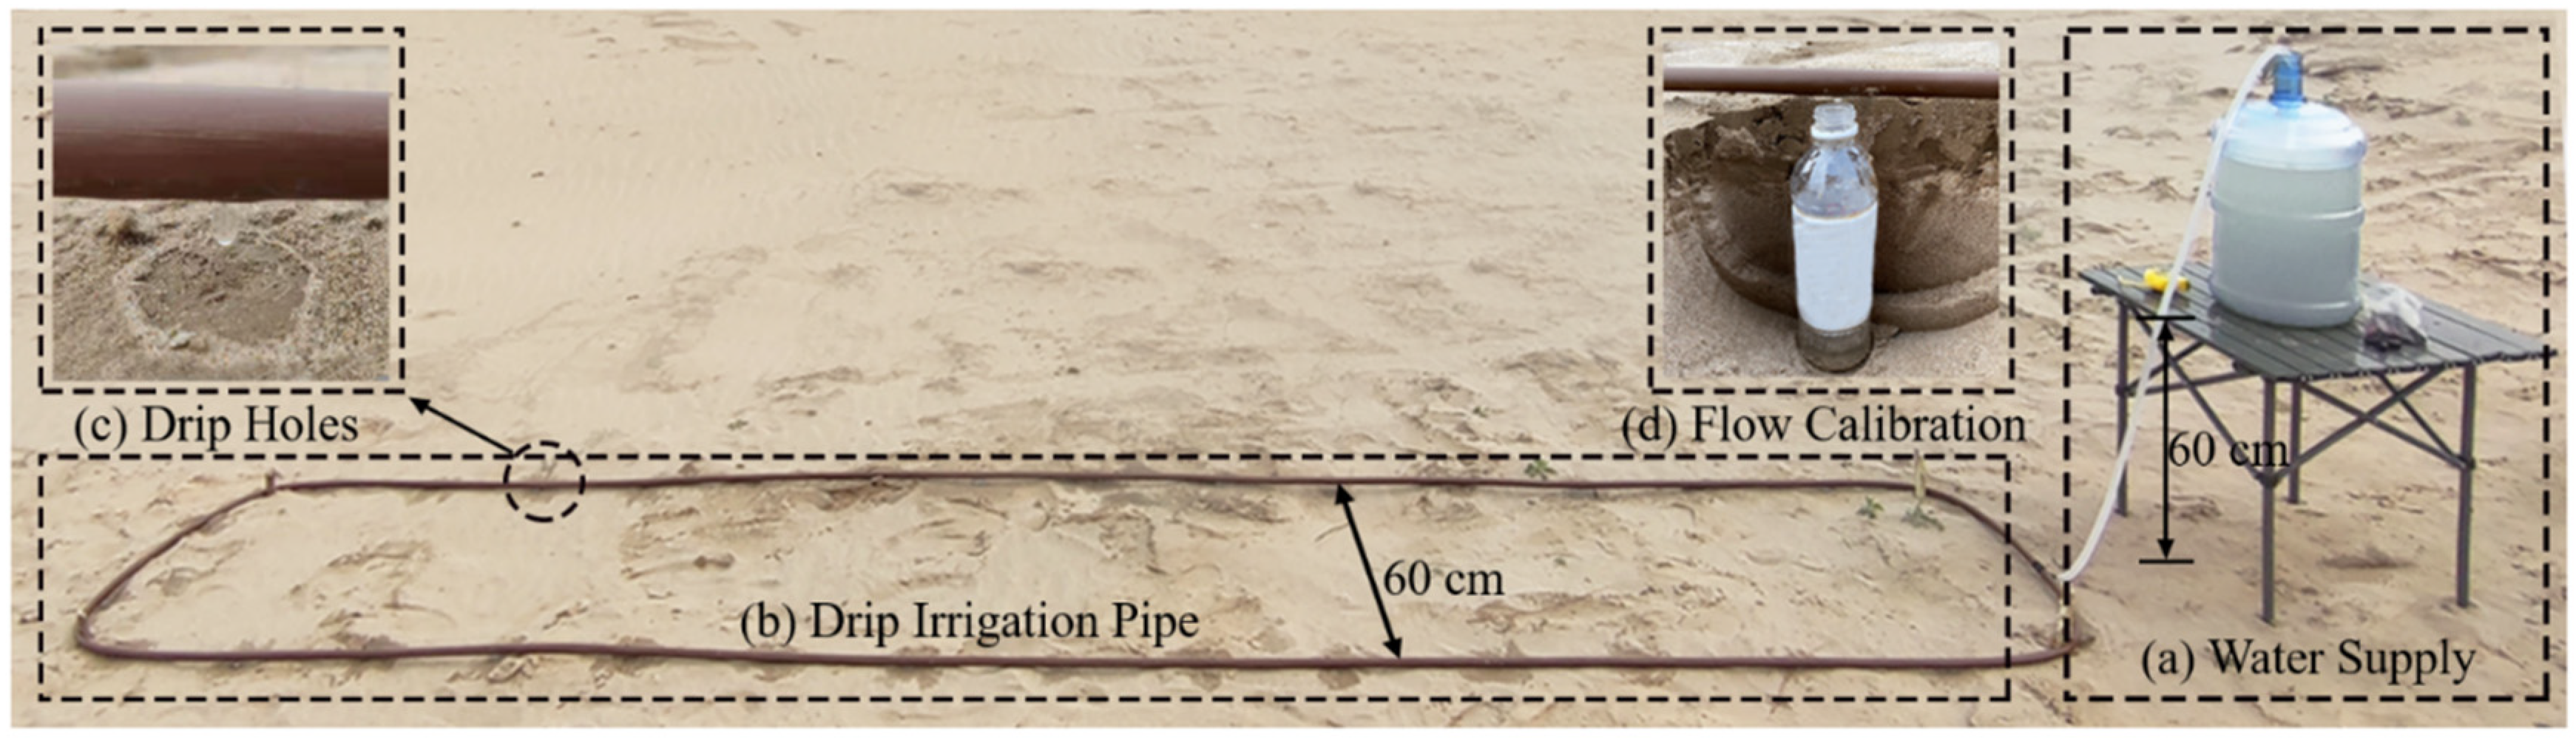
To determine the reasonable amount of irrigation, we conducted a drip irrigation experiment at the study site (Figure 3). A water tank was used to supply water using a syphon connected to a conventional drip pipe. To measure the soil water content, we drilled small holes and sampled with a hand shovel at specific time intervals.
To obtain the seasonal variation in the transpiration of C. Korshinskii, we conducted transpiration rate experiment at the study area. The plant transpiration can be calculated with the average transpiration rate per month in the growing season in daily time. The time is 14 h each day.
The monthly transpiration is
where is the monthly transpiration water consumption of plants (mg/m2); is the average monthly transpiration rate of plants (mgh−1g−1); W is the fresh biomass of plants per unit area in each month (g/m2); t is the time (h).
4. Results
4.1. Determining Soil-Available Water Capacity
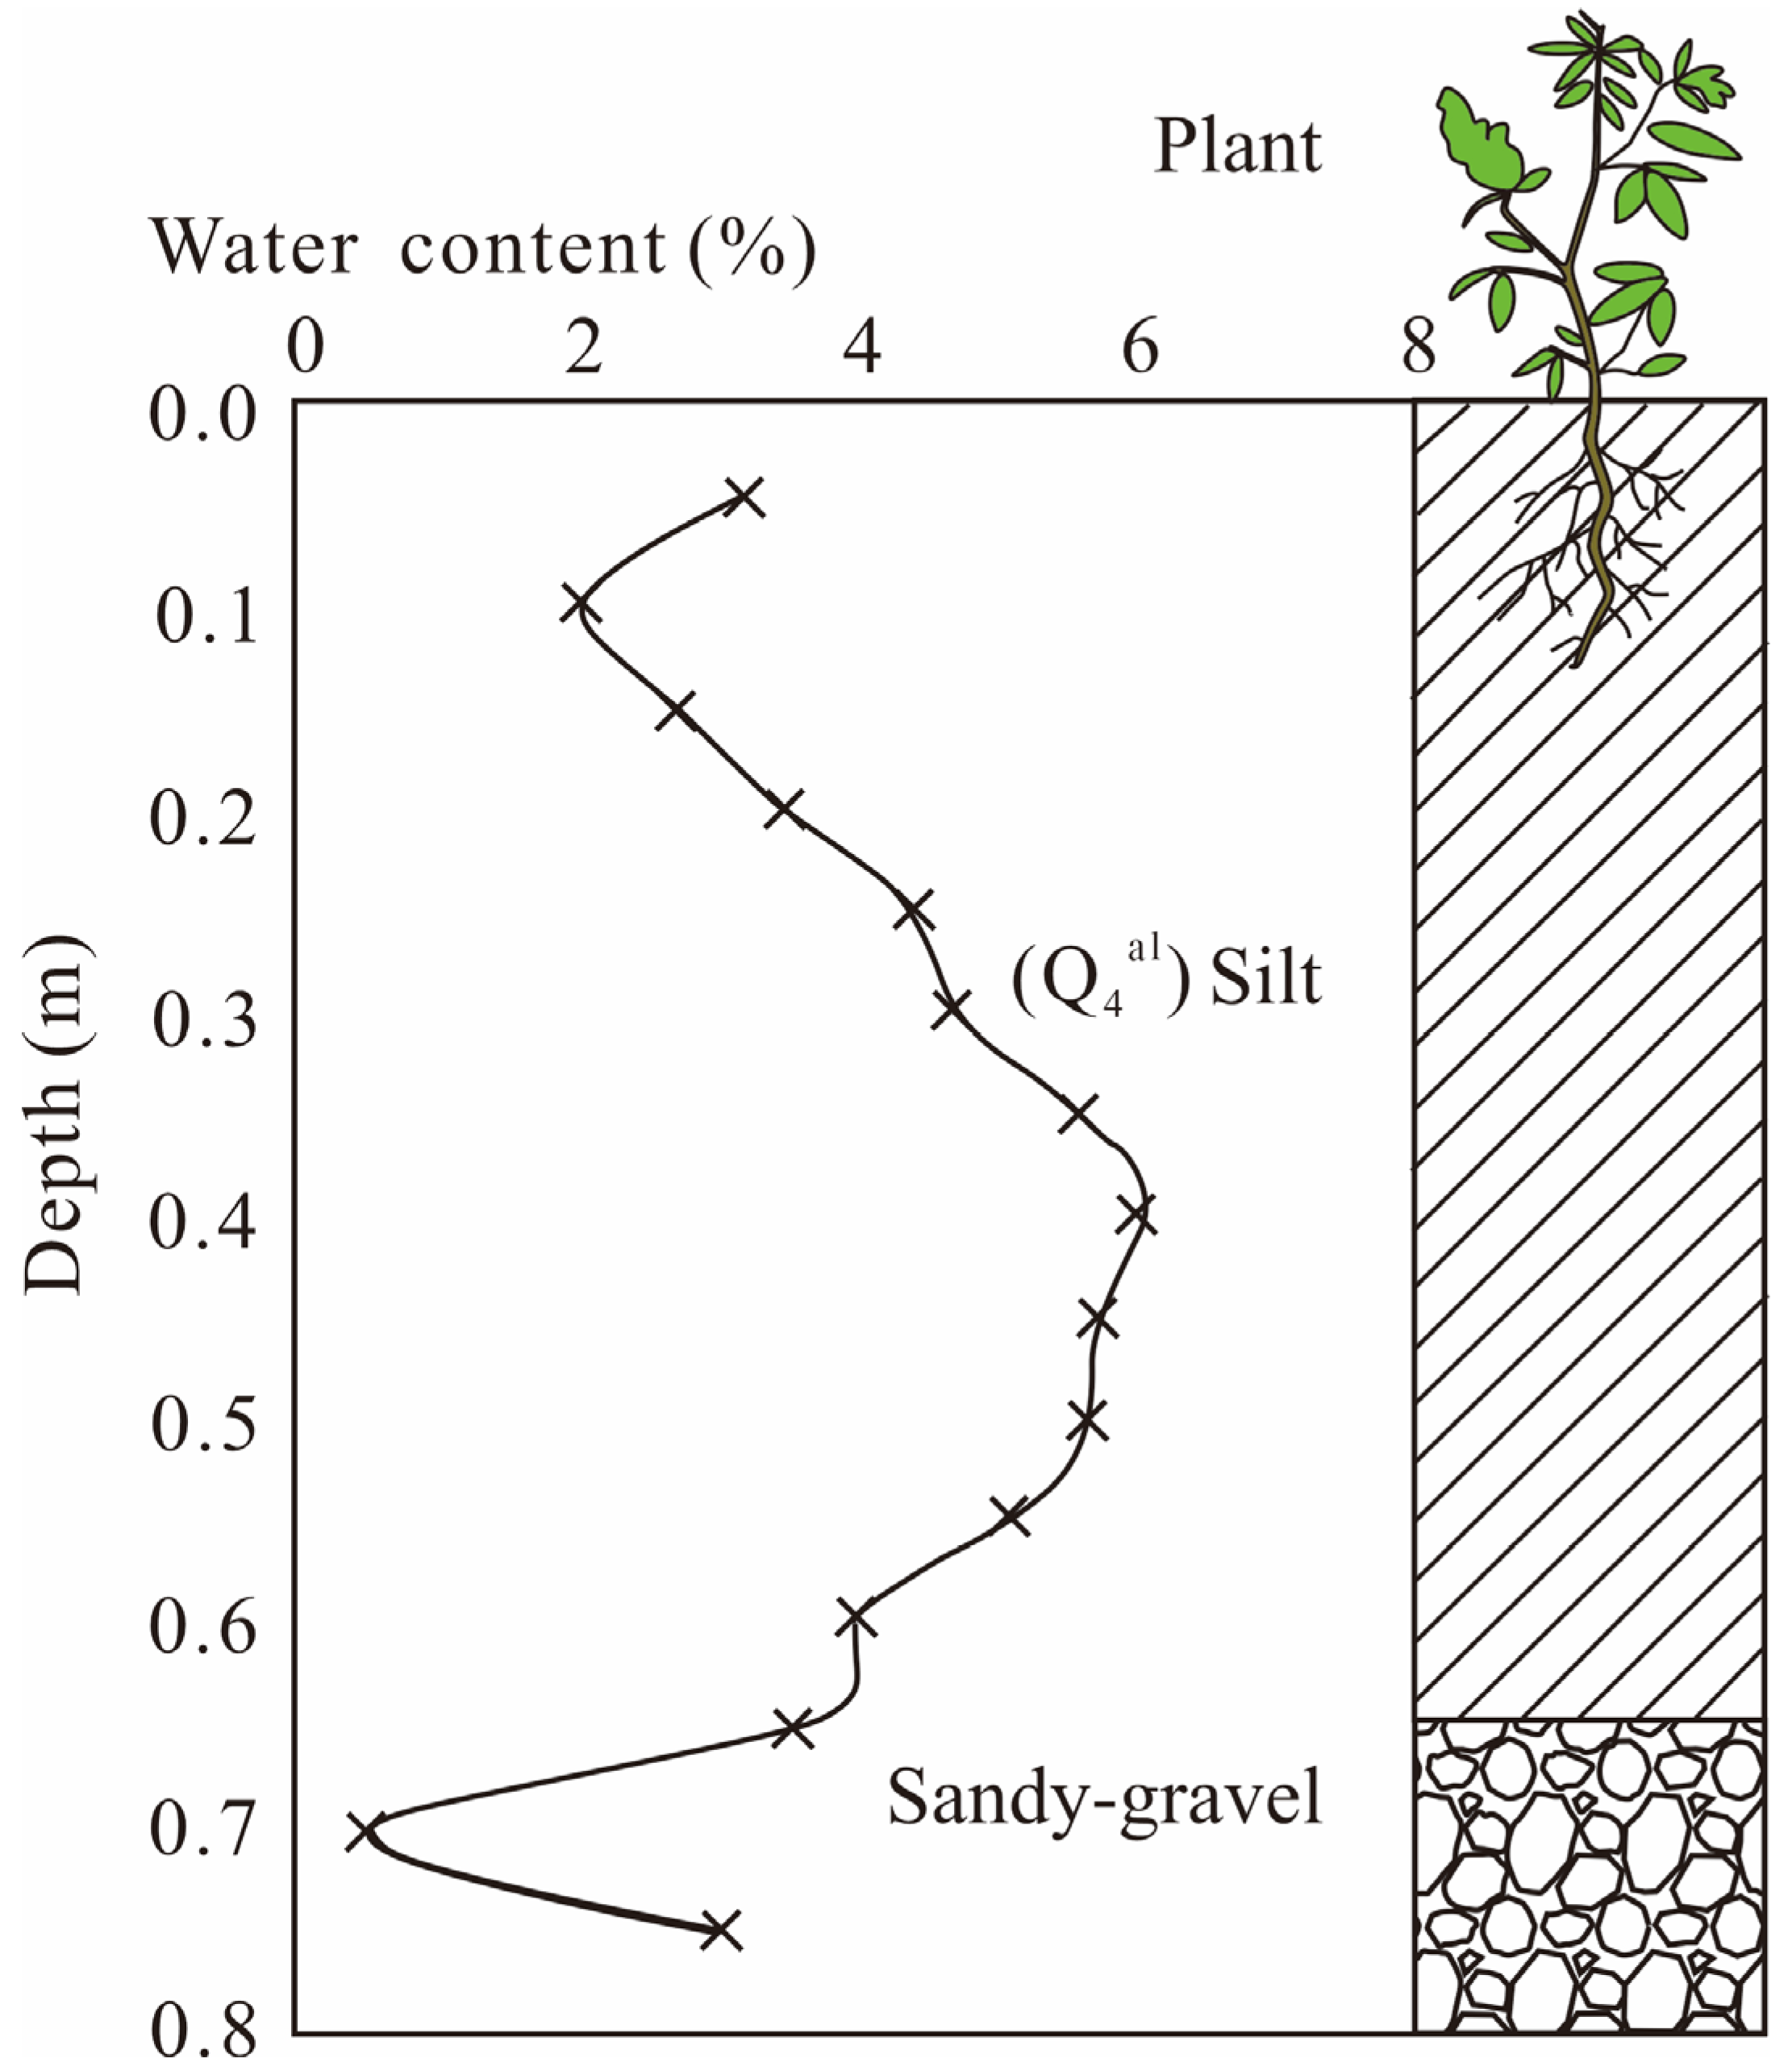
Figure 4 shows the vertical profile of the natural water content measured on site. After digging a shaft, we took samples of length 0.05 m. The soil was very dry overall. The natural soil moisture content at a depth of 0–0.8 m was between 2.0–6.0%. The maximum moisture content was obtained at a depth of 0.4–0.5 m. The water content decreased toward the surface. The decrease in water content below 0.5 m is related to the stratigraphic structure. The shaft revealed that the upper layer of 0.65 m thickness consisted of fine silt and the lower layer was coarse sandy gravel. Lower coarse-grained formations form a capillary barrier that prevents the downward migration of unsaturated water [21]. Under unsaturated conditions, the suction of the upper fine-grained soil is higher than that of the coarse-grained soil. Therefore, it overcomes gravity and prevents the flow of water from the fine-grained soil layer to the coarse-grained soil layer.
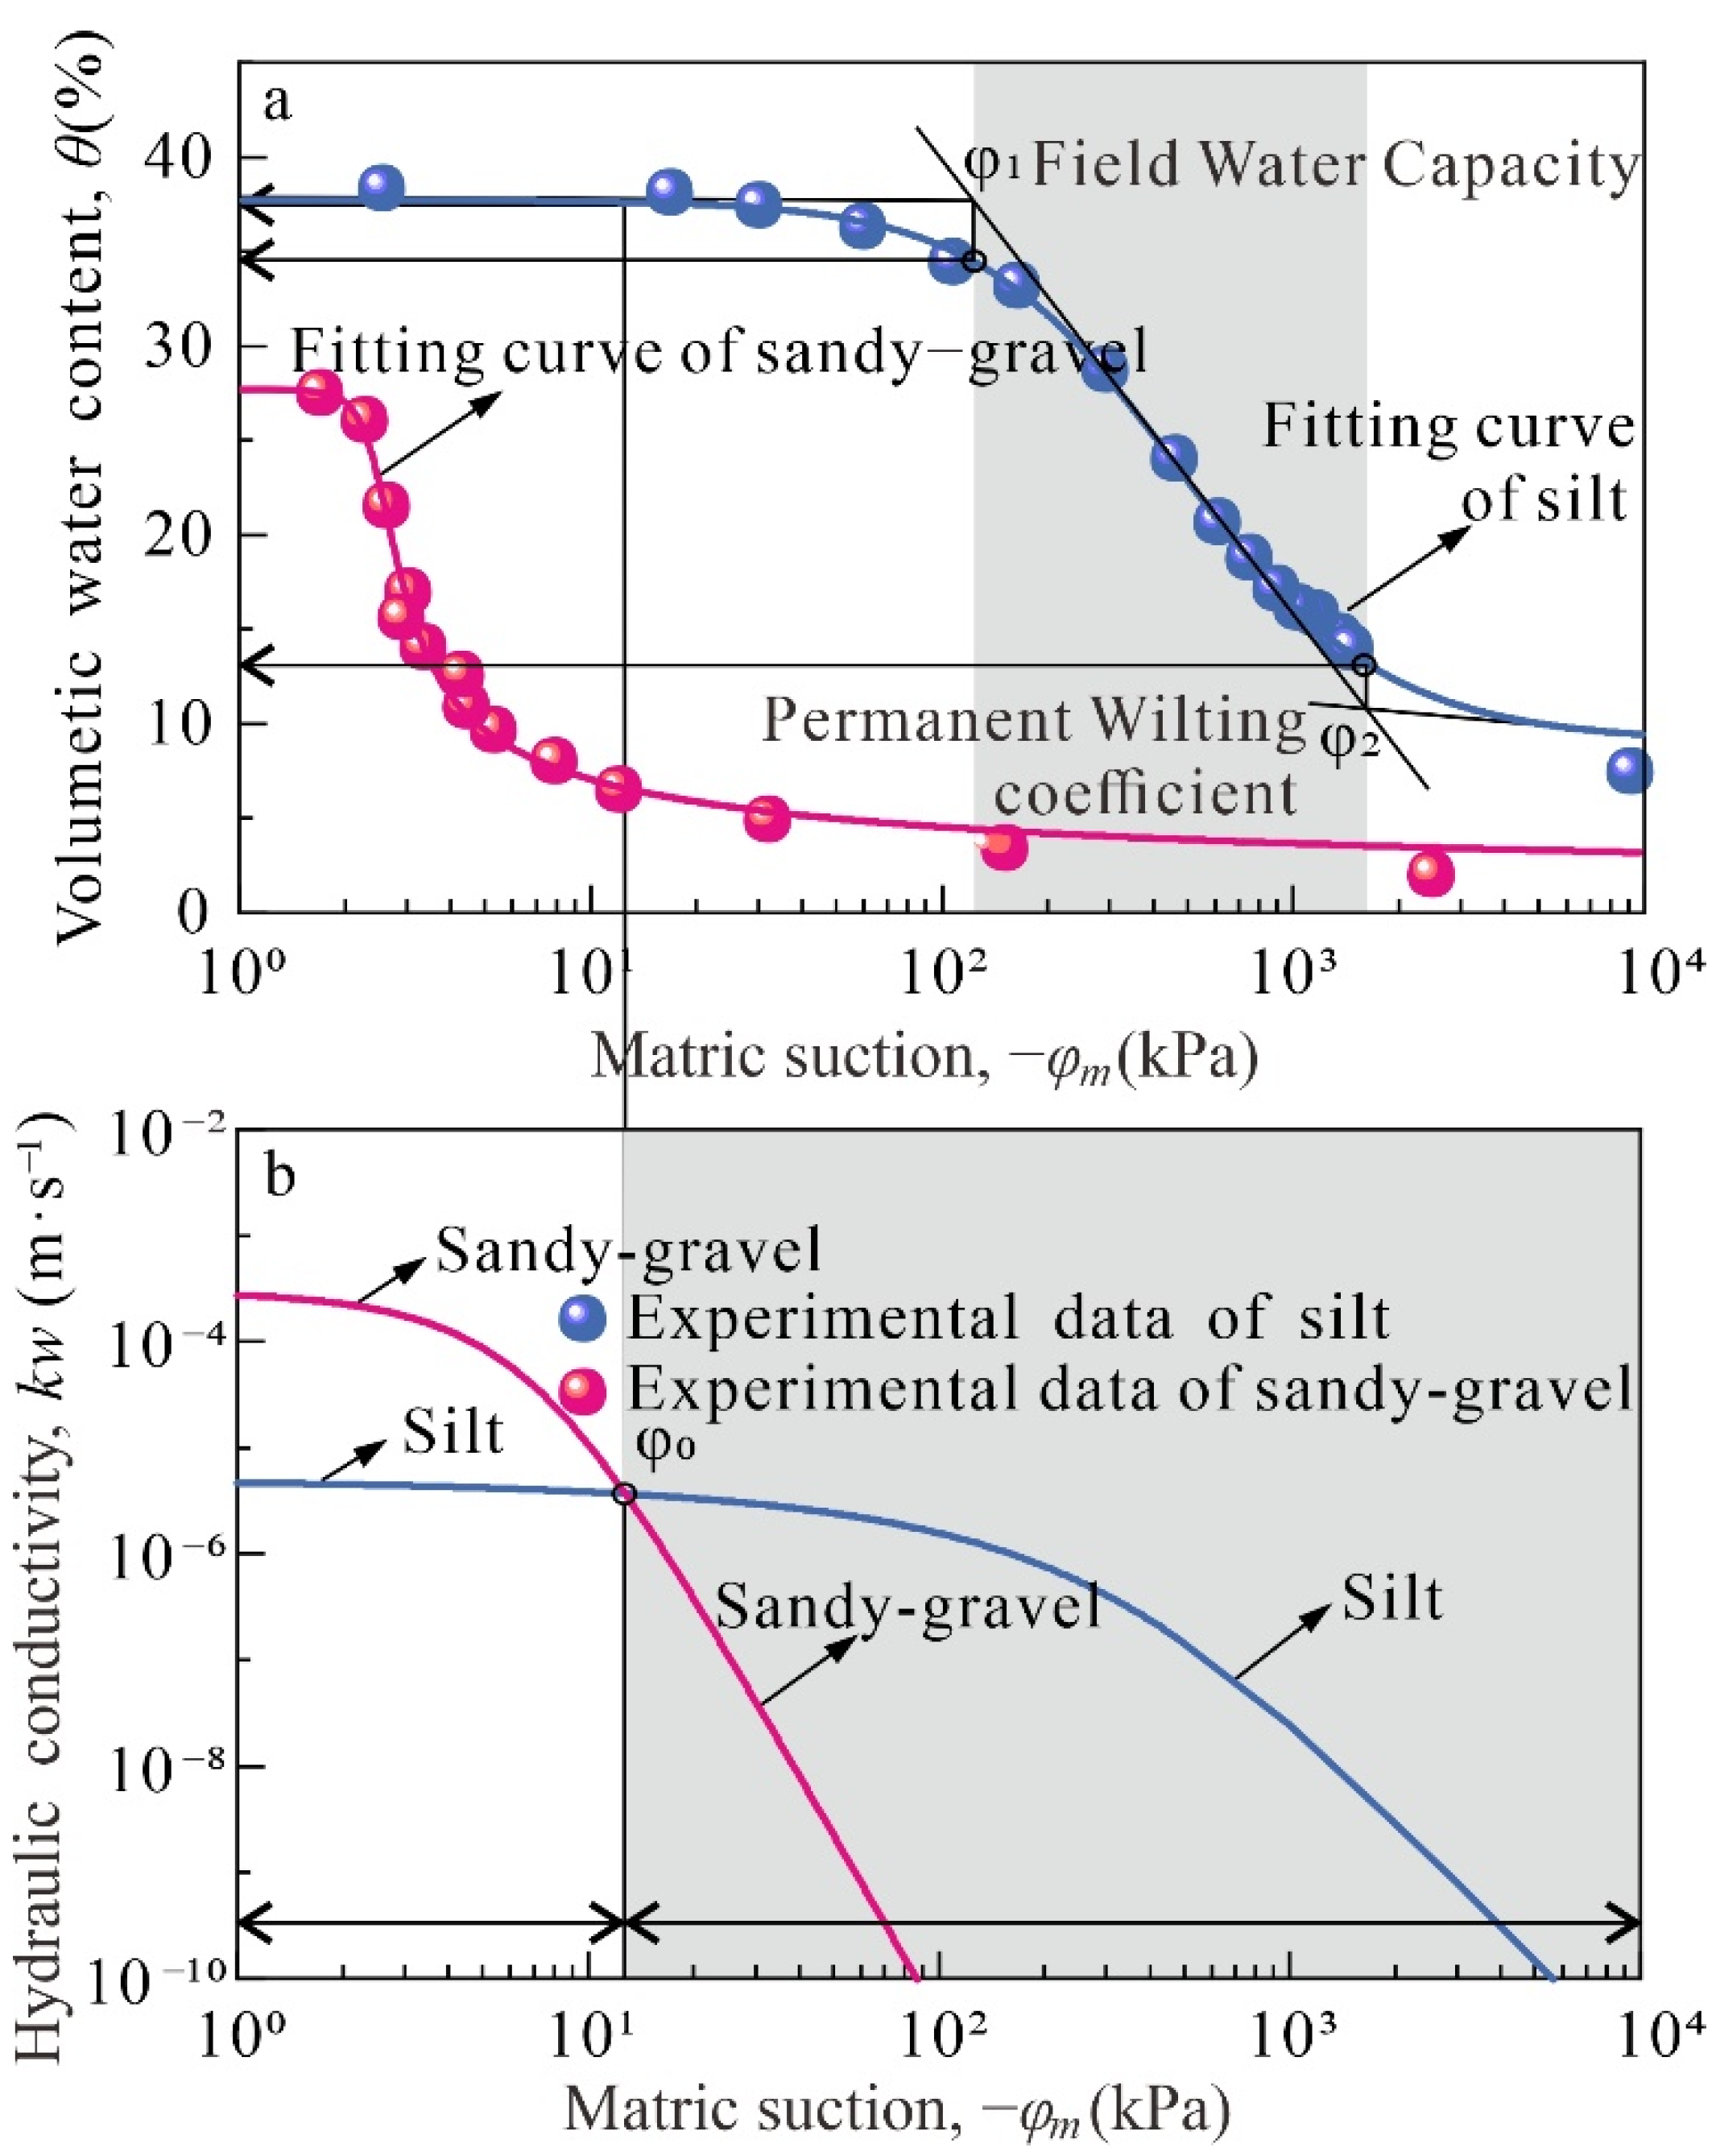
The measured SWCC and HCF values of the two soil samples are shown in Figure 5a,b, respectively. Tangent lines were drawn to the SWCC to determine the air-entry and residual values (Figure 5a). The air-entry value of the silt was 123.8 kPa corresponding to the FC of 34.6%, and the residual value was 1699.3 kP corresponding to the PWP of 13.1%. The effective water range of the silt was 13.1~34.6%. The effective water capacity can be calculated as 218.0 mm. The parameters of SWCC and HCF of the silt and sandy-gravel in the pasture is shown in Table 1. The silt values of fitting parameters are α = 0.002, n = 1.550, m = 8.500. The sandy-gravel value of fitting parameters is α = 2.324, n = 11.586, and the fitting correlation coefficient is R2silt = 0.9974, R2sandy-gravel = 0.9856; the fitting curve is plotted in Figure 5. The silt layer is the soil on which the plants live. The meteorological conditions of strong evaporation and less rainfall make the water in the soil hard to replenish the plants. To satisfy the plants growing, the profile suction value should be greater than the air entry value and less than its residual value of the silt.
It can be seen from Figure 5a that under the same suction, the moisture content of silt is higher than that of sandy-gravel, which means that the water-holding capacity of silt is better than that of sandy-gravel.
From Figure 5b, it can be seen that in the saturated state, the hydraulic conductivity of sandy-gravel is one order larger than that of silt. Kw is hydraulic conductivity estimated at the matric suction (kPa) or water content. Unsaturated hydraulic conductivity is a function of matrix suction or water content. Ks is saturated hydraulic conductivity (kPa), which measured a constant by variable head permeability test. The HCFs of silt and sandy-gravel intersect at a point and we named the matric suction at this point as the critical suction (12.4 kPa). When the suction at the silt and the sandy-gravel is higher than the critical suction, the hydraulic conductivity of silt is higher than that of sandy-gravel. When the suction is less than the critical suction, the hydraulic conductivity of sandy-gravel is higher than that of silt. In order to efficiently utilize the irrigation water and to prevent the water in the silt from leaking into the sandy-gravel, it is necessary to control the suction at the interface always higher than the critical suction value (), corresponding to control the water content of the silt lower than 37.8%. The sandy-gravel layer plays a natural capillary barrier to prevent water lost. To this end, the upper limit of the optimal soil water content of the silt layer can be control to 34.6%, and the lower limit to 13.1%. In the soil column experiment with filter papers and metal rings, the wetting front reached the boundary between silt and sandy-gravel needed 180 h. Therefore, while determining the range of soil-available water, not only the permeability characteristics of the fine soil layer but also the influence of the coarse layer should be considered. The suction at the intersection of the two soil layers is an important parameter that can be determined by the water content corresponding to the HCF.
4.2. Recommendations for Irrigation Pattern
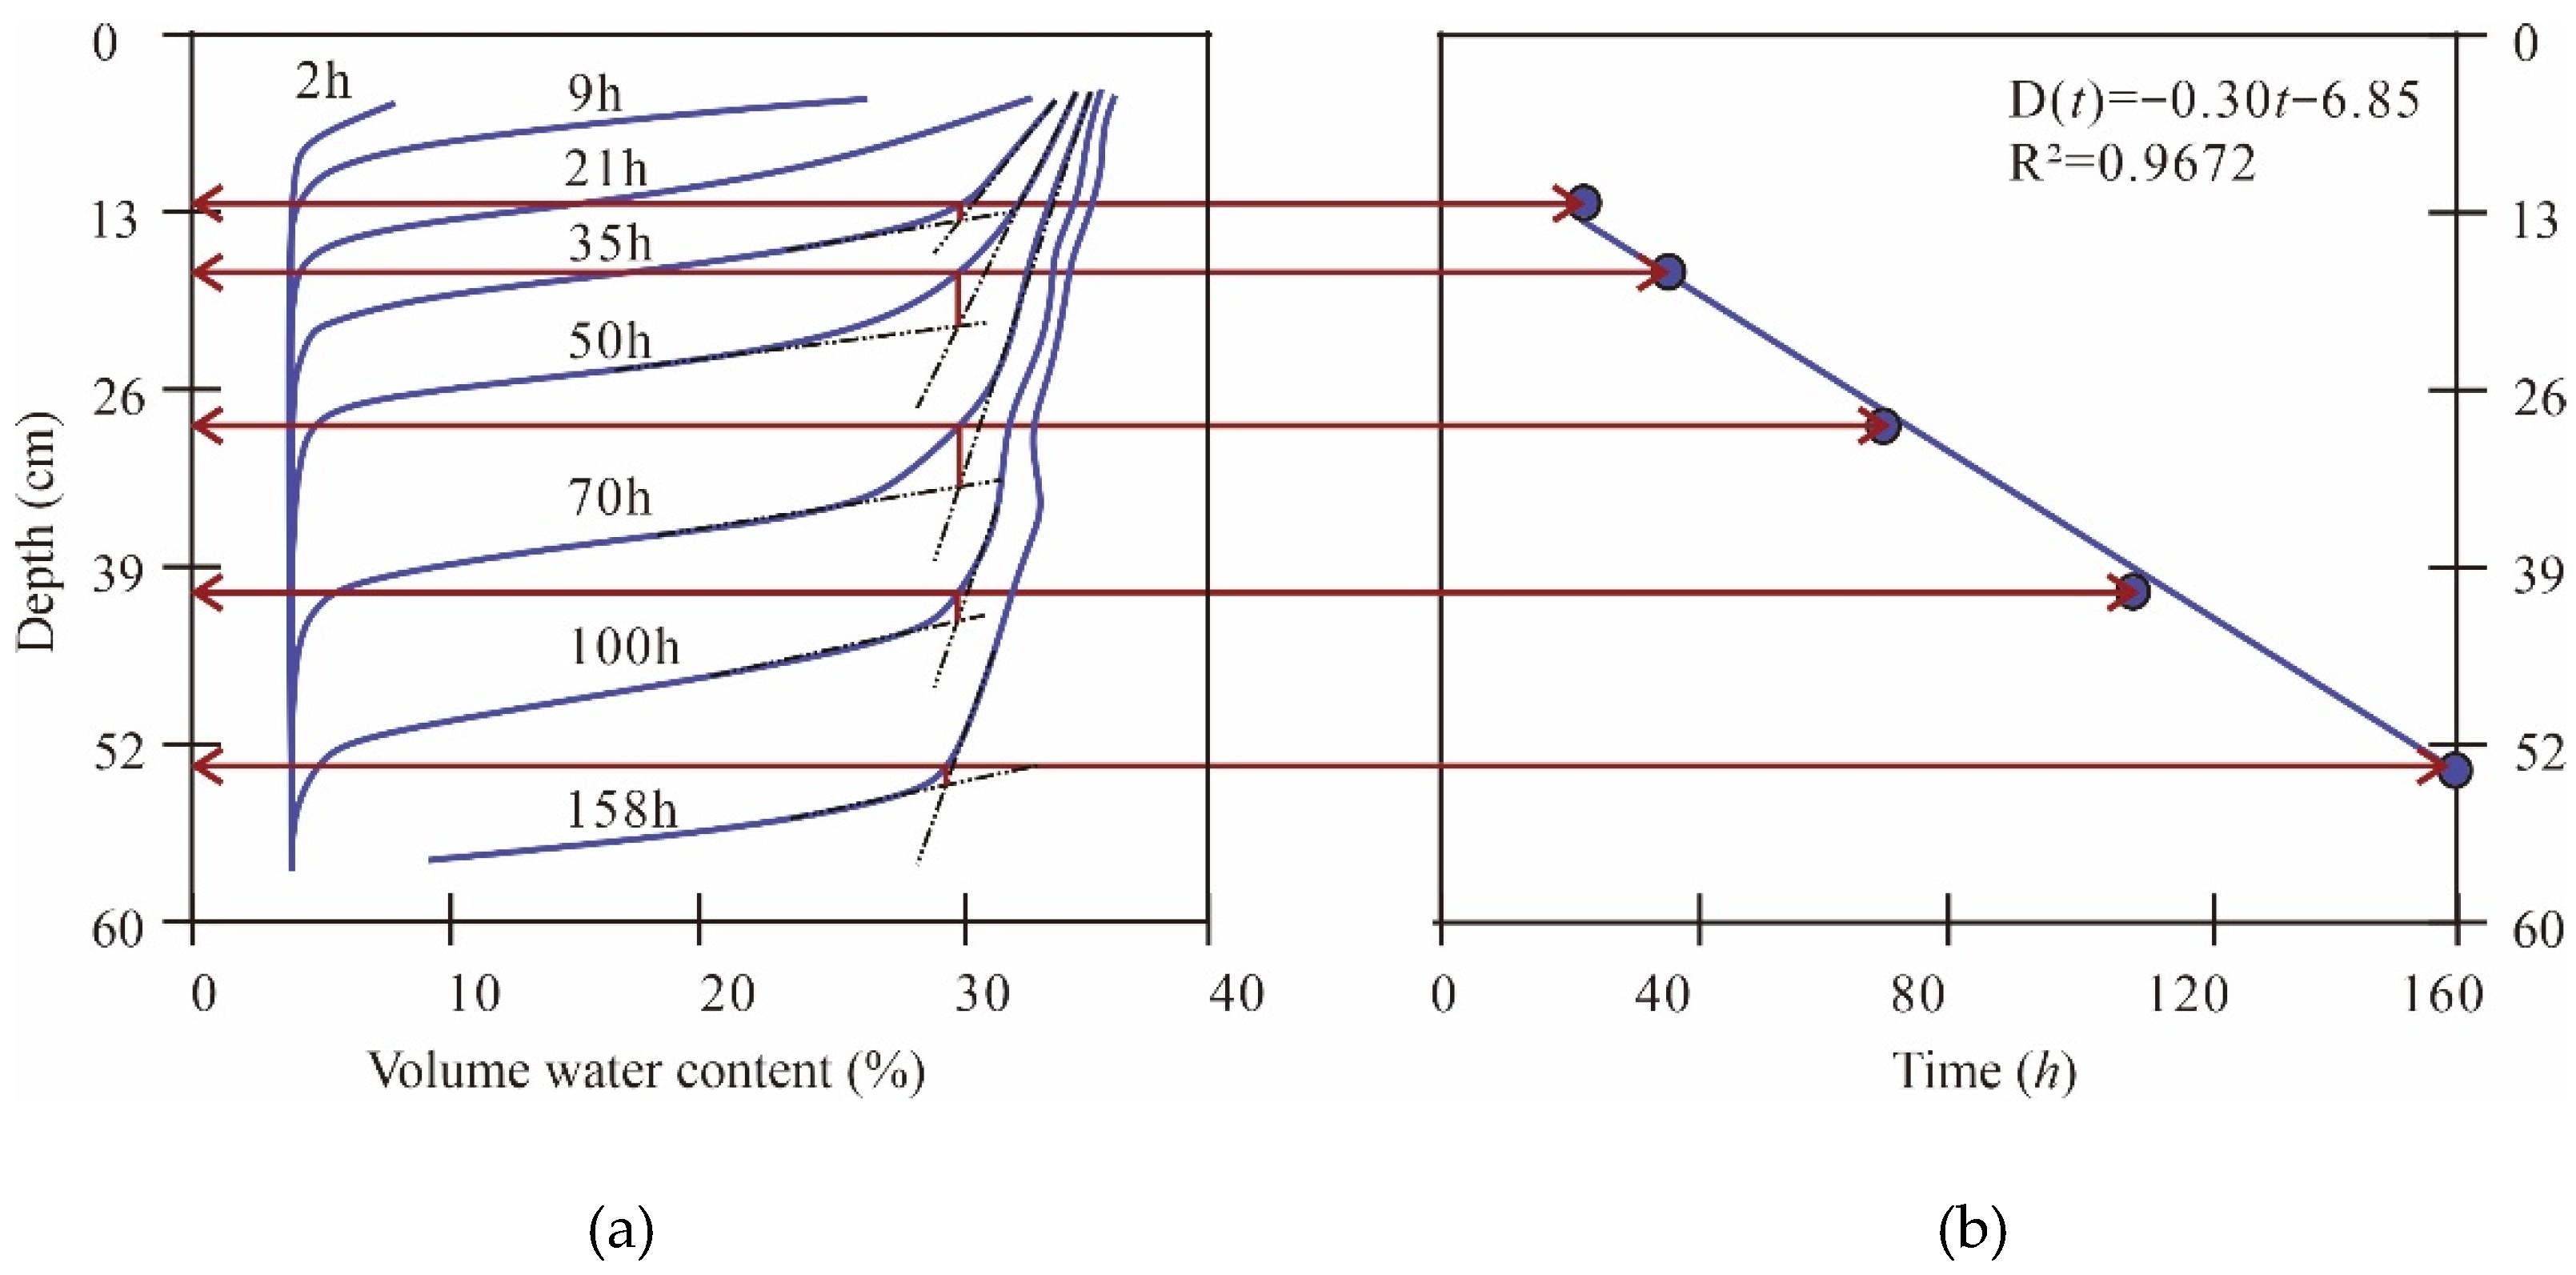
The soil water content profile of a drip irrigation experiment in the site is shown in Figure 6.
The relationship between wetting front depth (D) and time is approximate linear function, the fitted equation is
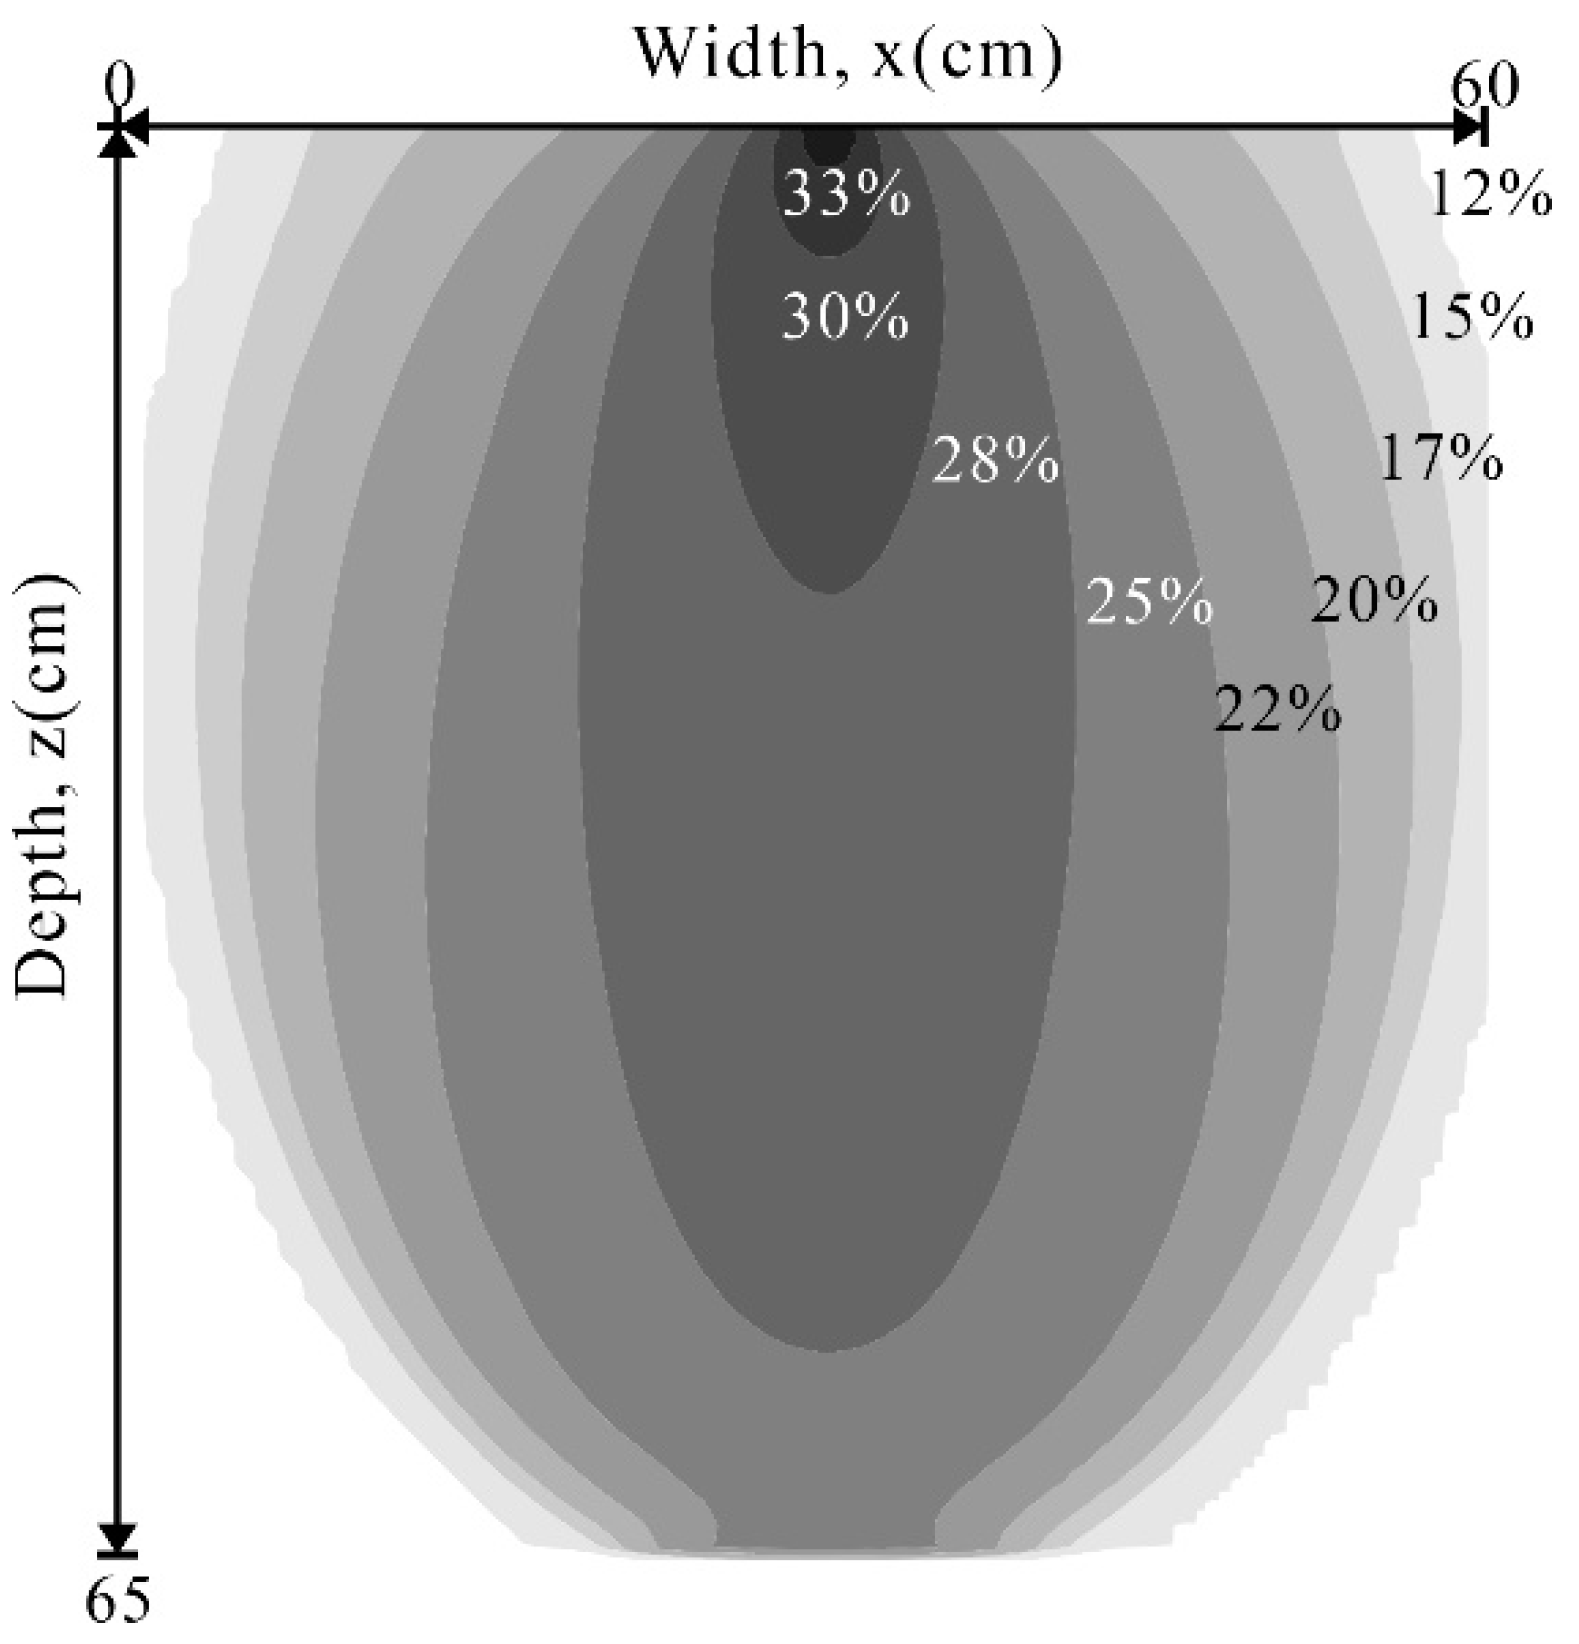
The component of the line is the moving speed of the wetting front, which is 0.3 cm/h. When the wetting front approached a depth, the volumetric water content gradually increased to a higher value and remained relatively constant. At 180 h, the wetting front reached the boundary between the silt and sandy-gravel, and the suction value was close to the critical suction. Therefore, the depth of the boundary was used as the lower limit of the wetting during irrigation. The measured flow rate of the drip hole was 2.75 mL/min. The cross-section reveals that the wetting width of a single hole was approximately 0.6 m. We simulated the single- hole water dripping process using SWCC and the HCF values as inputs, and the results are shown in Figure 7 and Figure 8, respectively. These results are consistent with those of the in situ test experiment. The lateral width of the wetting zone was approximately 0.6 m.
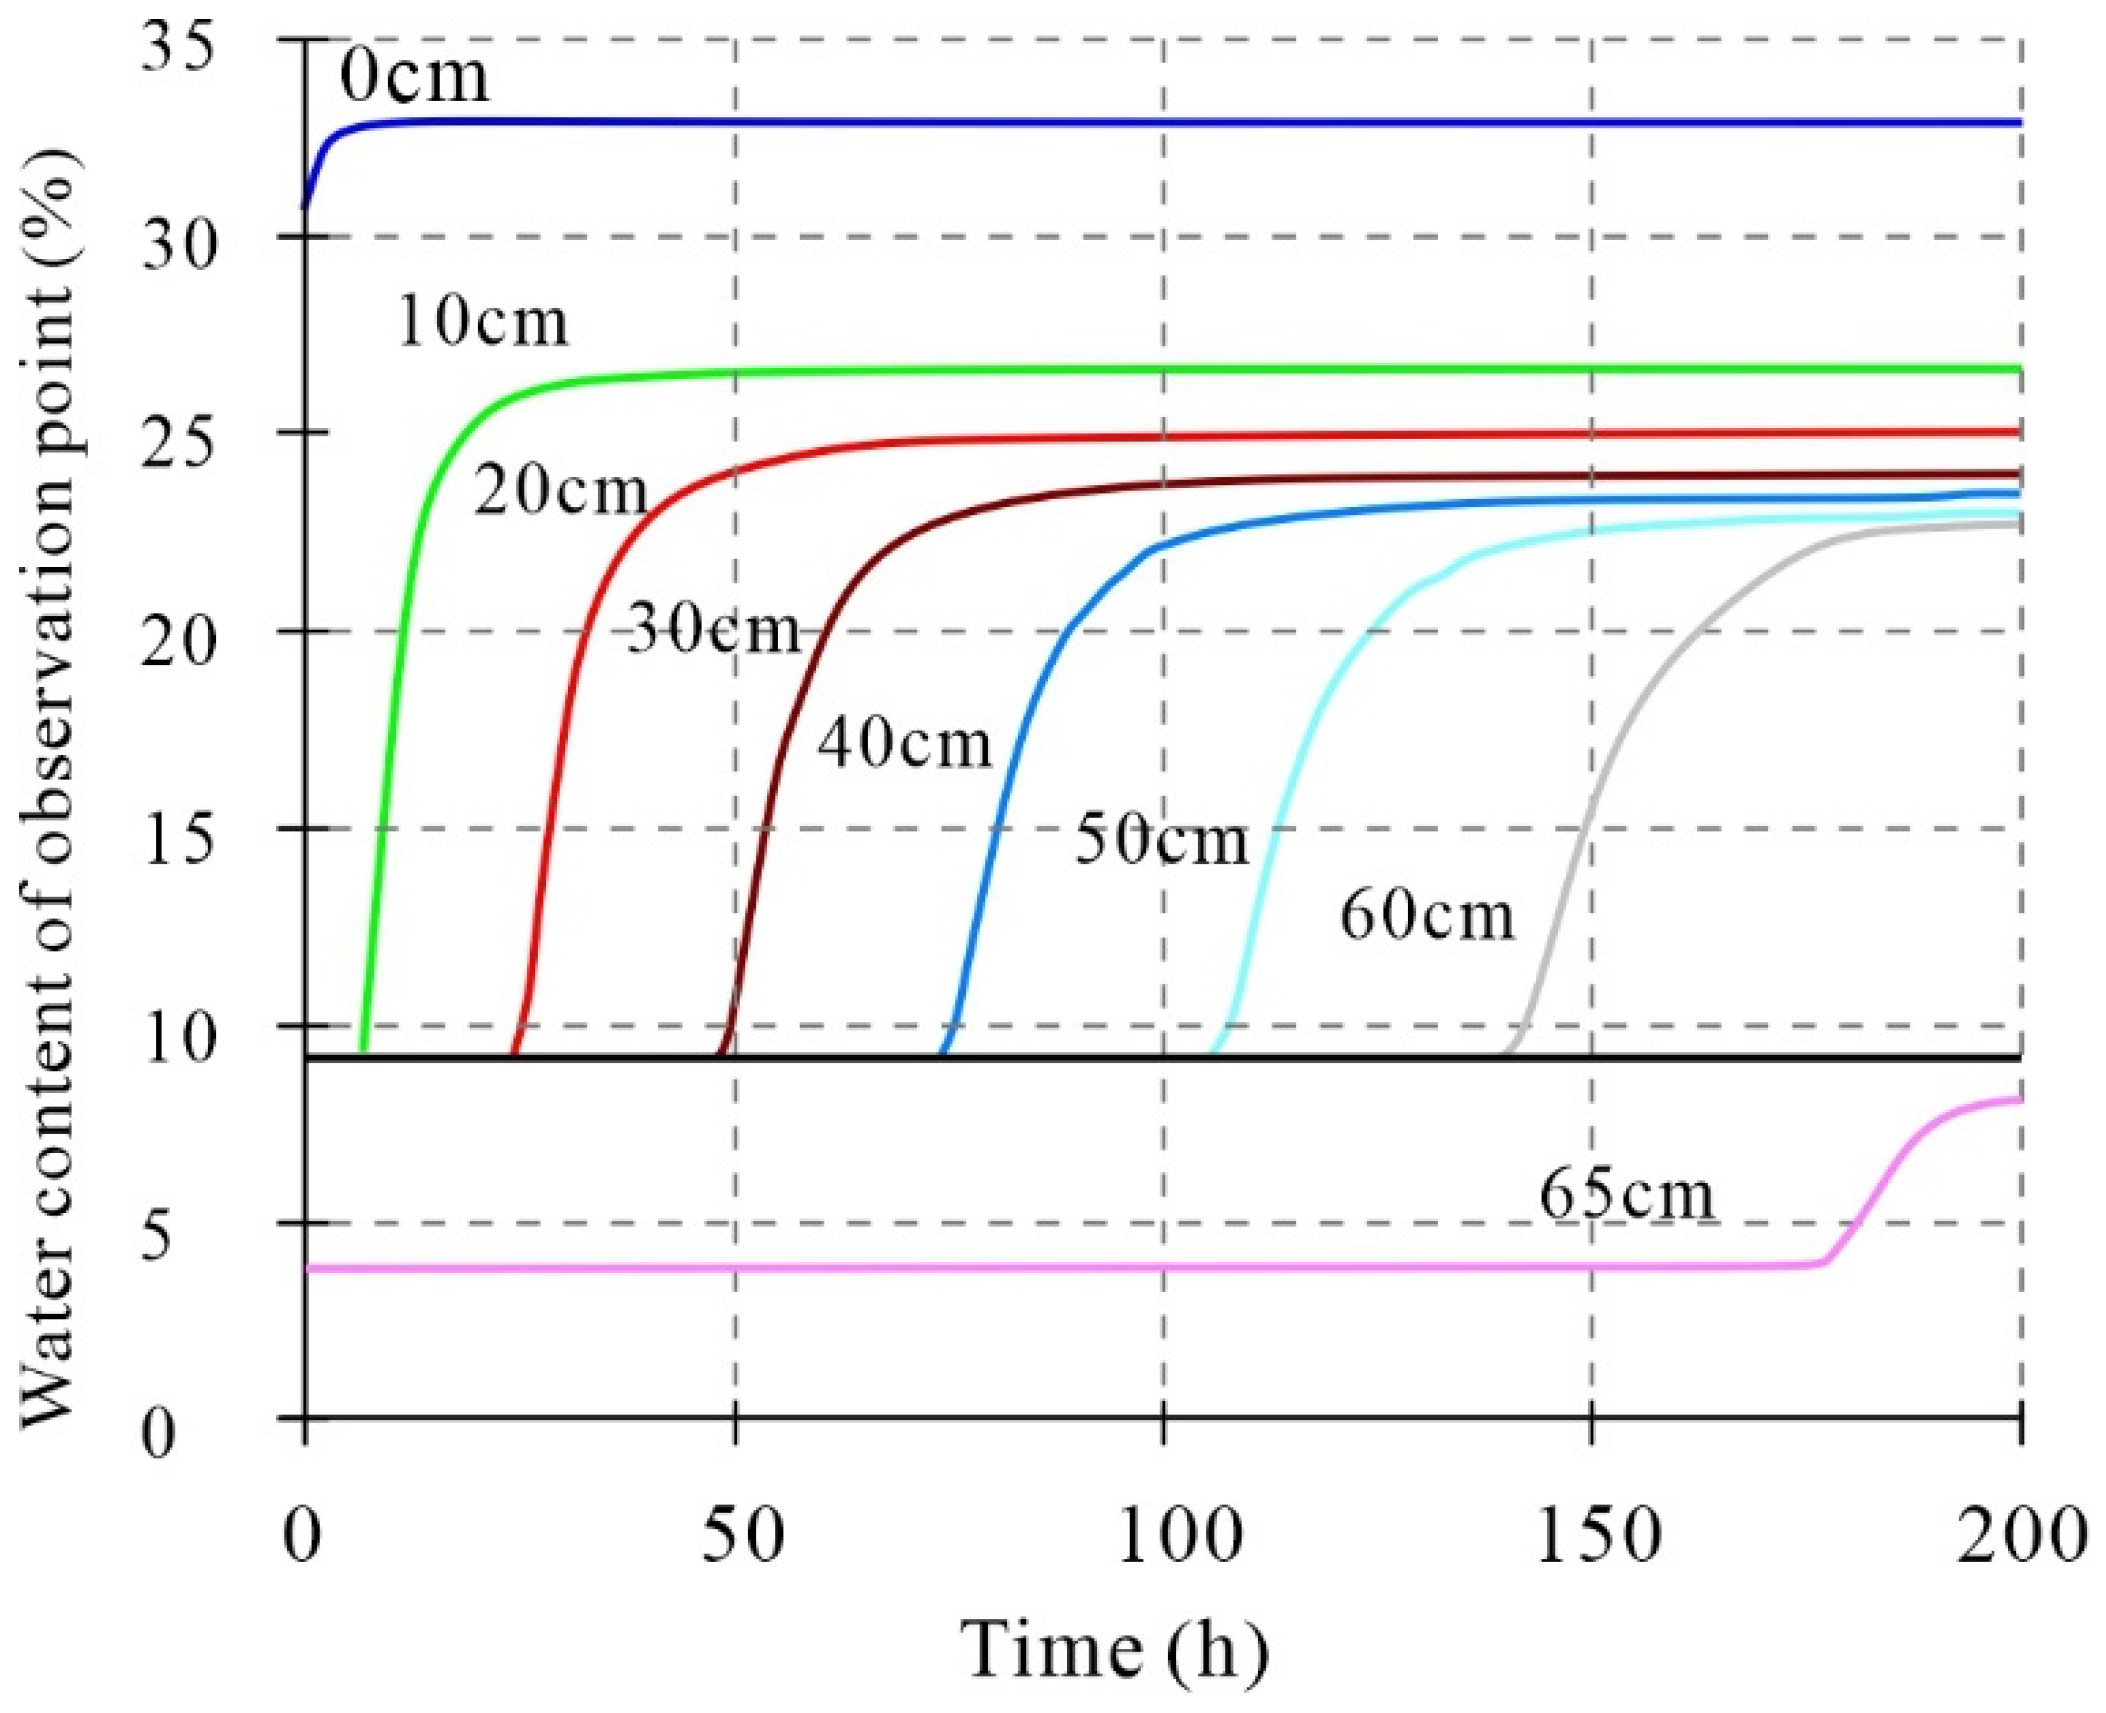
According to the parameters achieved above, the drip irrigation plan for the pasture can be reasonably designed. The space of the drip pipes can be 0.6 m and that of drip holes on the pipe is also 0.6 m. The thickness of the upper silt layer of the pasture is generally not more than 65 cm. It can be seen from Figure 8 that under the condition of irrigation in the current soil layer, continuous drip irrigation for more than 180 h will cause excess water to leak to the gravel layer and flow down to the groundwater, resulting in water loss. Therefore, for the initial time of drip irrigation, continuous drip irrigation is controlled within 180 h. After the initial drip irrigation, considering that the water in the soil layer rarely leaks downward, water is mainly eliminated through evapotranspiration. The amount of irrigation in the later period can be kept in balance with the water eliminated by evapotranspiration. In order to further reduce evaporation, the local mature film-cover is used, so that the subsequent irrigation amount is mainly balanced with the plant transpiration. The plant transpiration can be calculated with the average transpiration rate per month in the growing season in daily time. The time is 14 h each day.
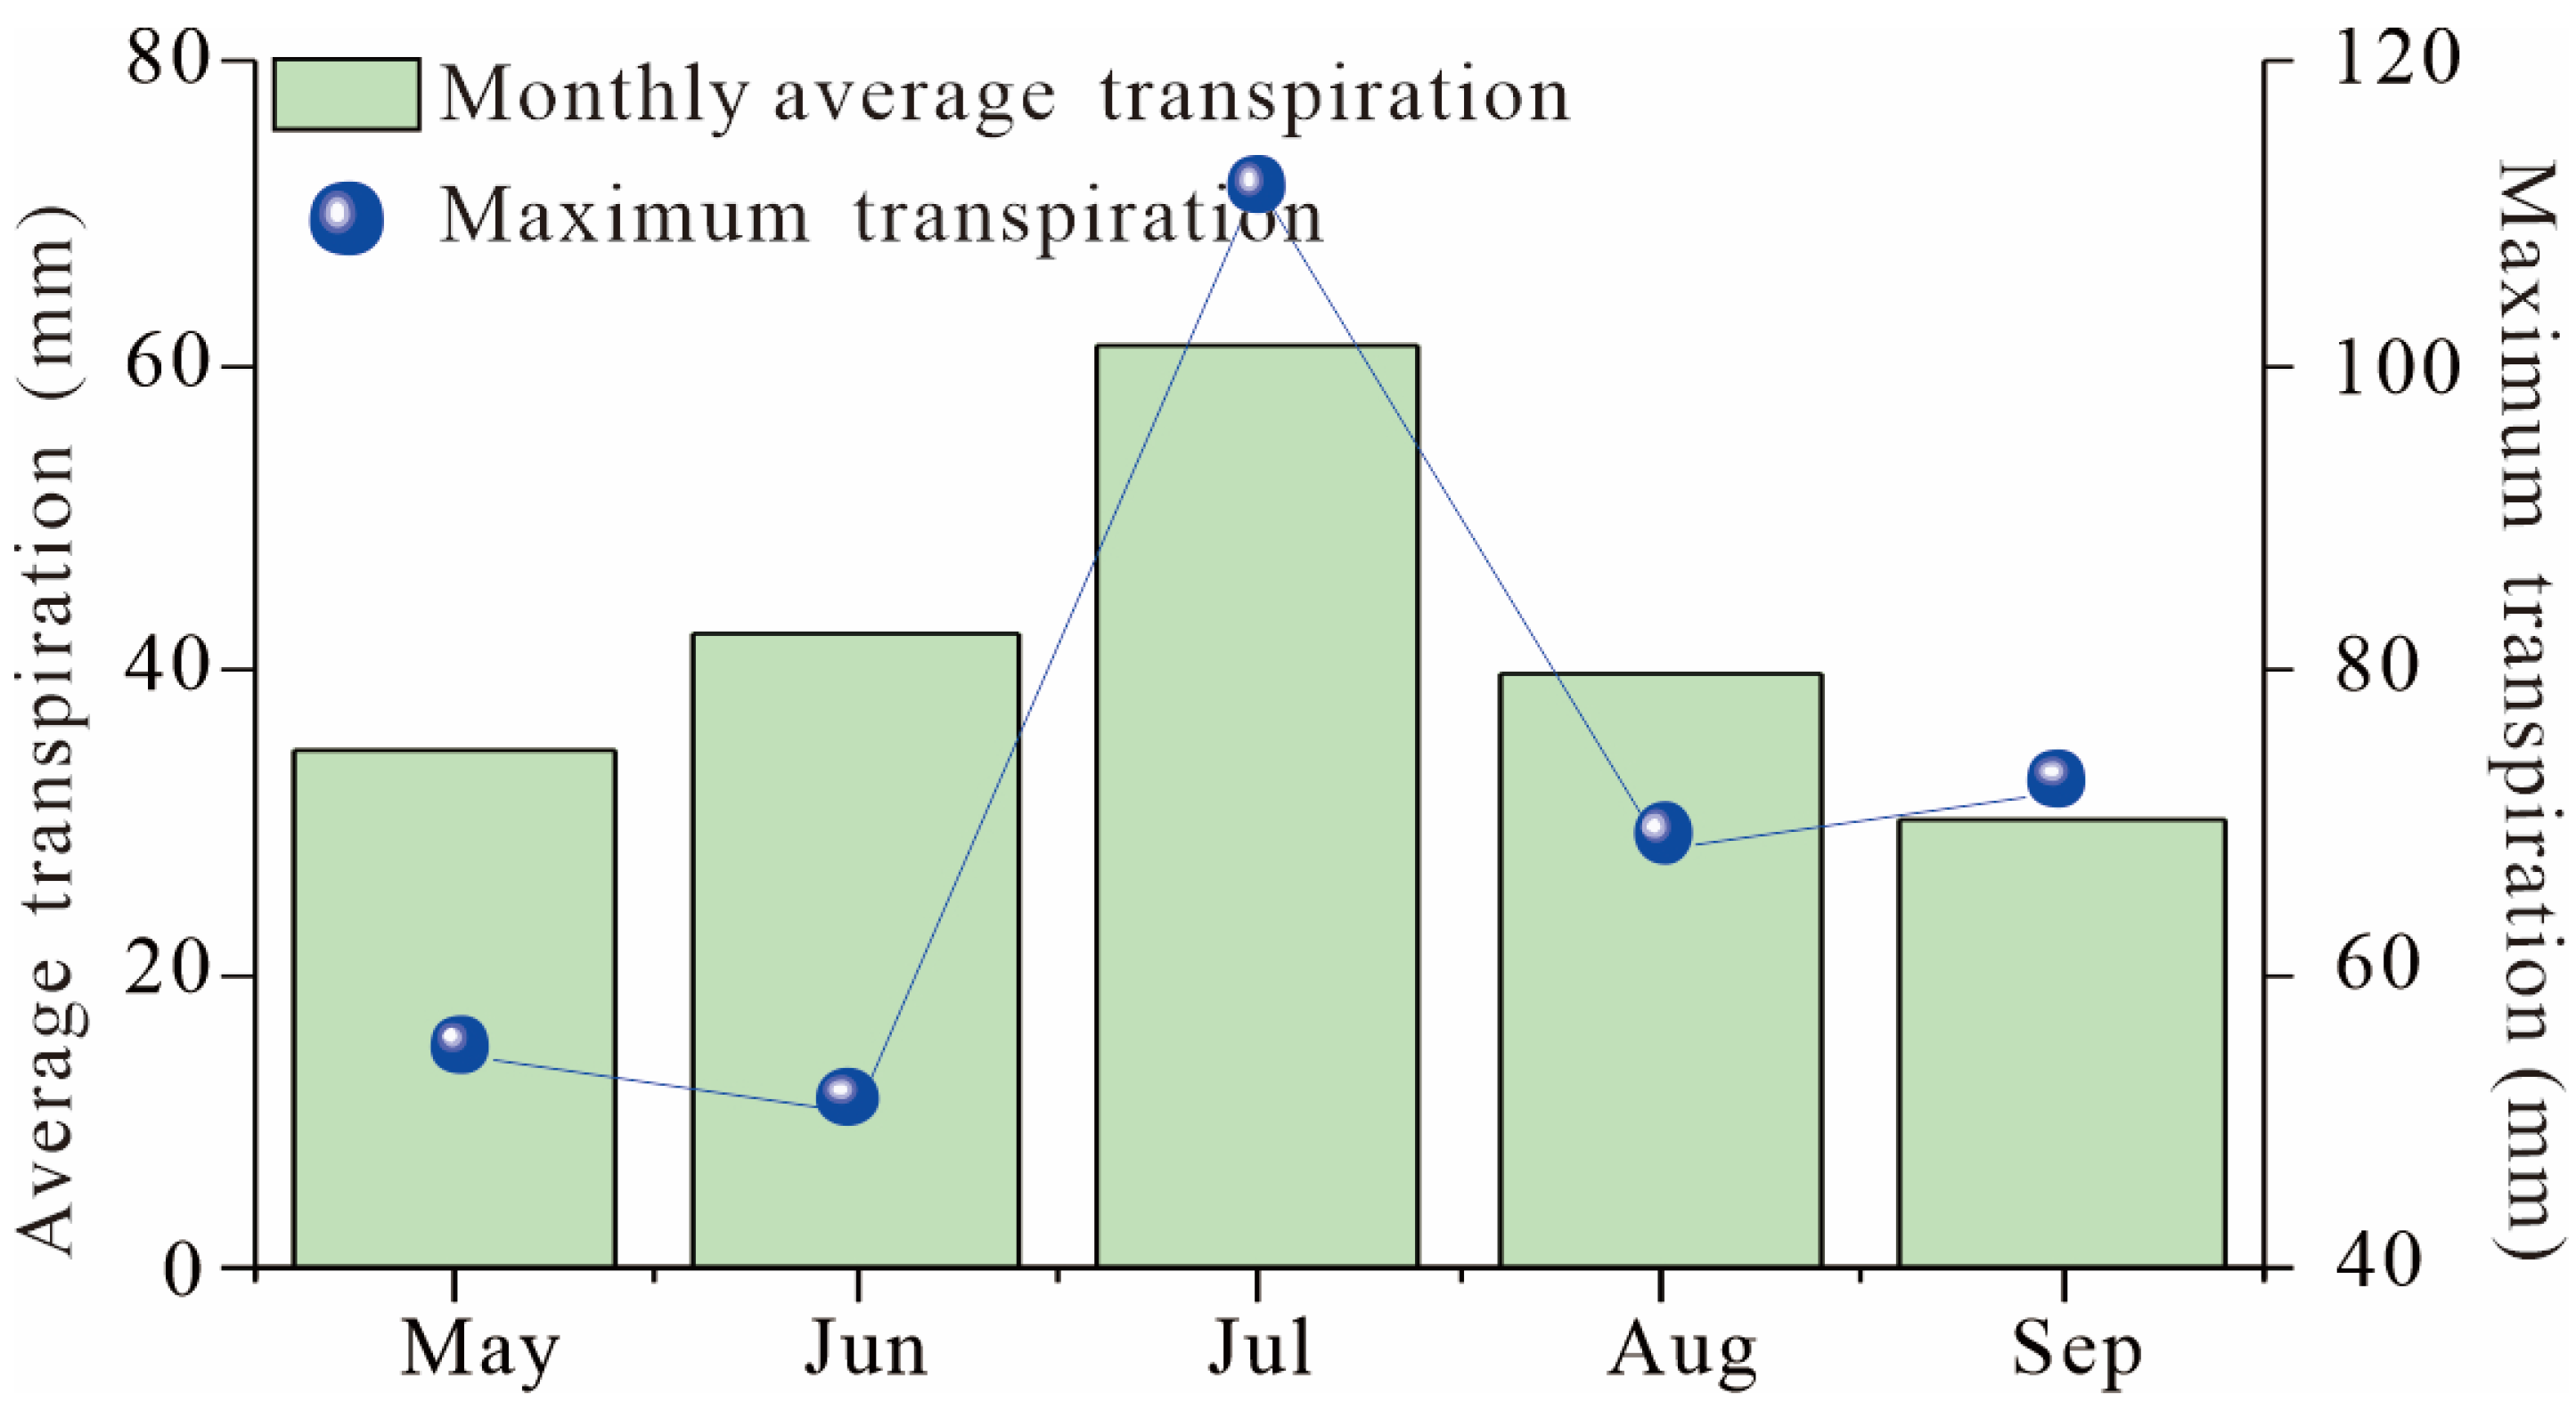
Figure 9 shows the monthly average transpiration of C. korshinskii during the pasture growing season. The accumulated monthly average transpiration of C. korshinskii shows that the total average transpiration water consumption in the growing season was 202.4 mm, and the daily average transpiration was 1.32 mm. The maximum transpiration water consumption in the growing season was 357.1 mm and the maximum daily transpiration was 2.33 mm. In the drip irrigation experiment, the spacing between the drip irrigation pipes was 60 cm, and that between the drip irrigation holes was 60 cm. The infiltration area of each drip hole was 60 × 60 = 3600 cm2. The daily drip irrigation volume for each hole was calculated by multiplying the daily transpiration volume by the infiltration area, and it was calculated to be 475.2–838.8 mL. The flow rate of the drip hole was 2.75 mL/min, and the drip irrigation time was 110.4–194.4 min every night. Considering this, the pasture needs 13.5~22.5 m3/hm2 of water every day.
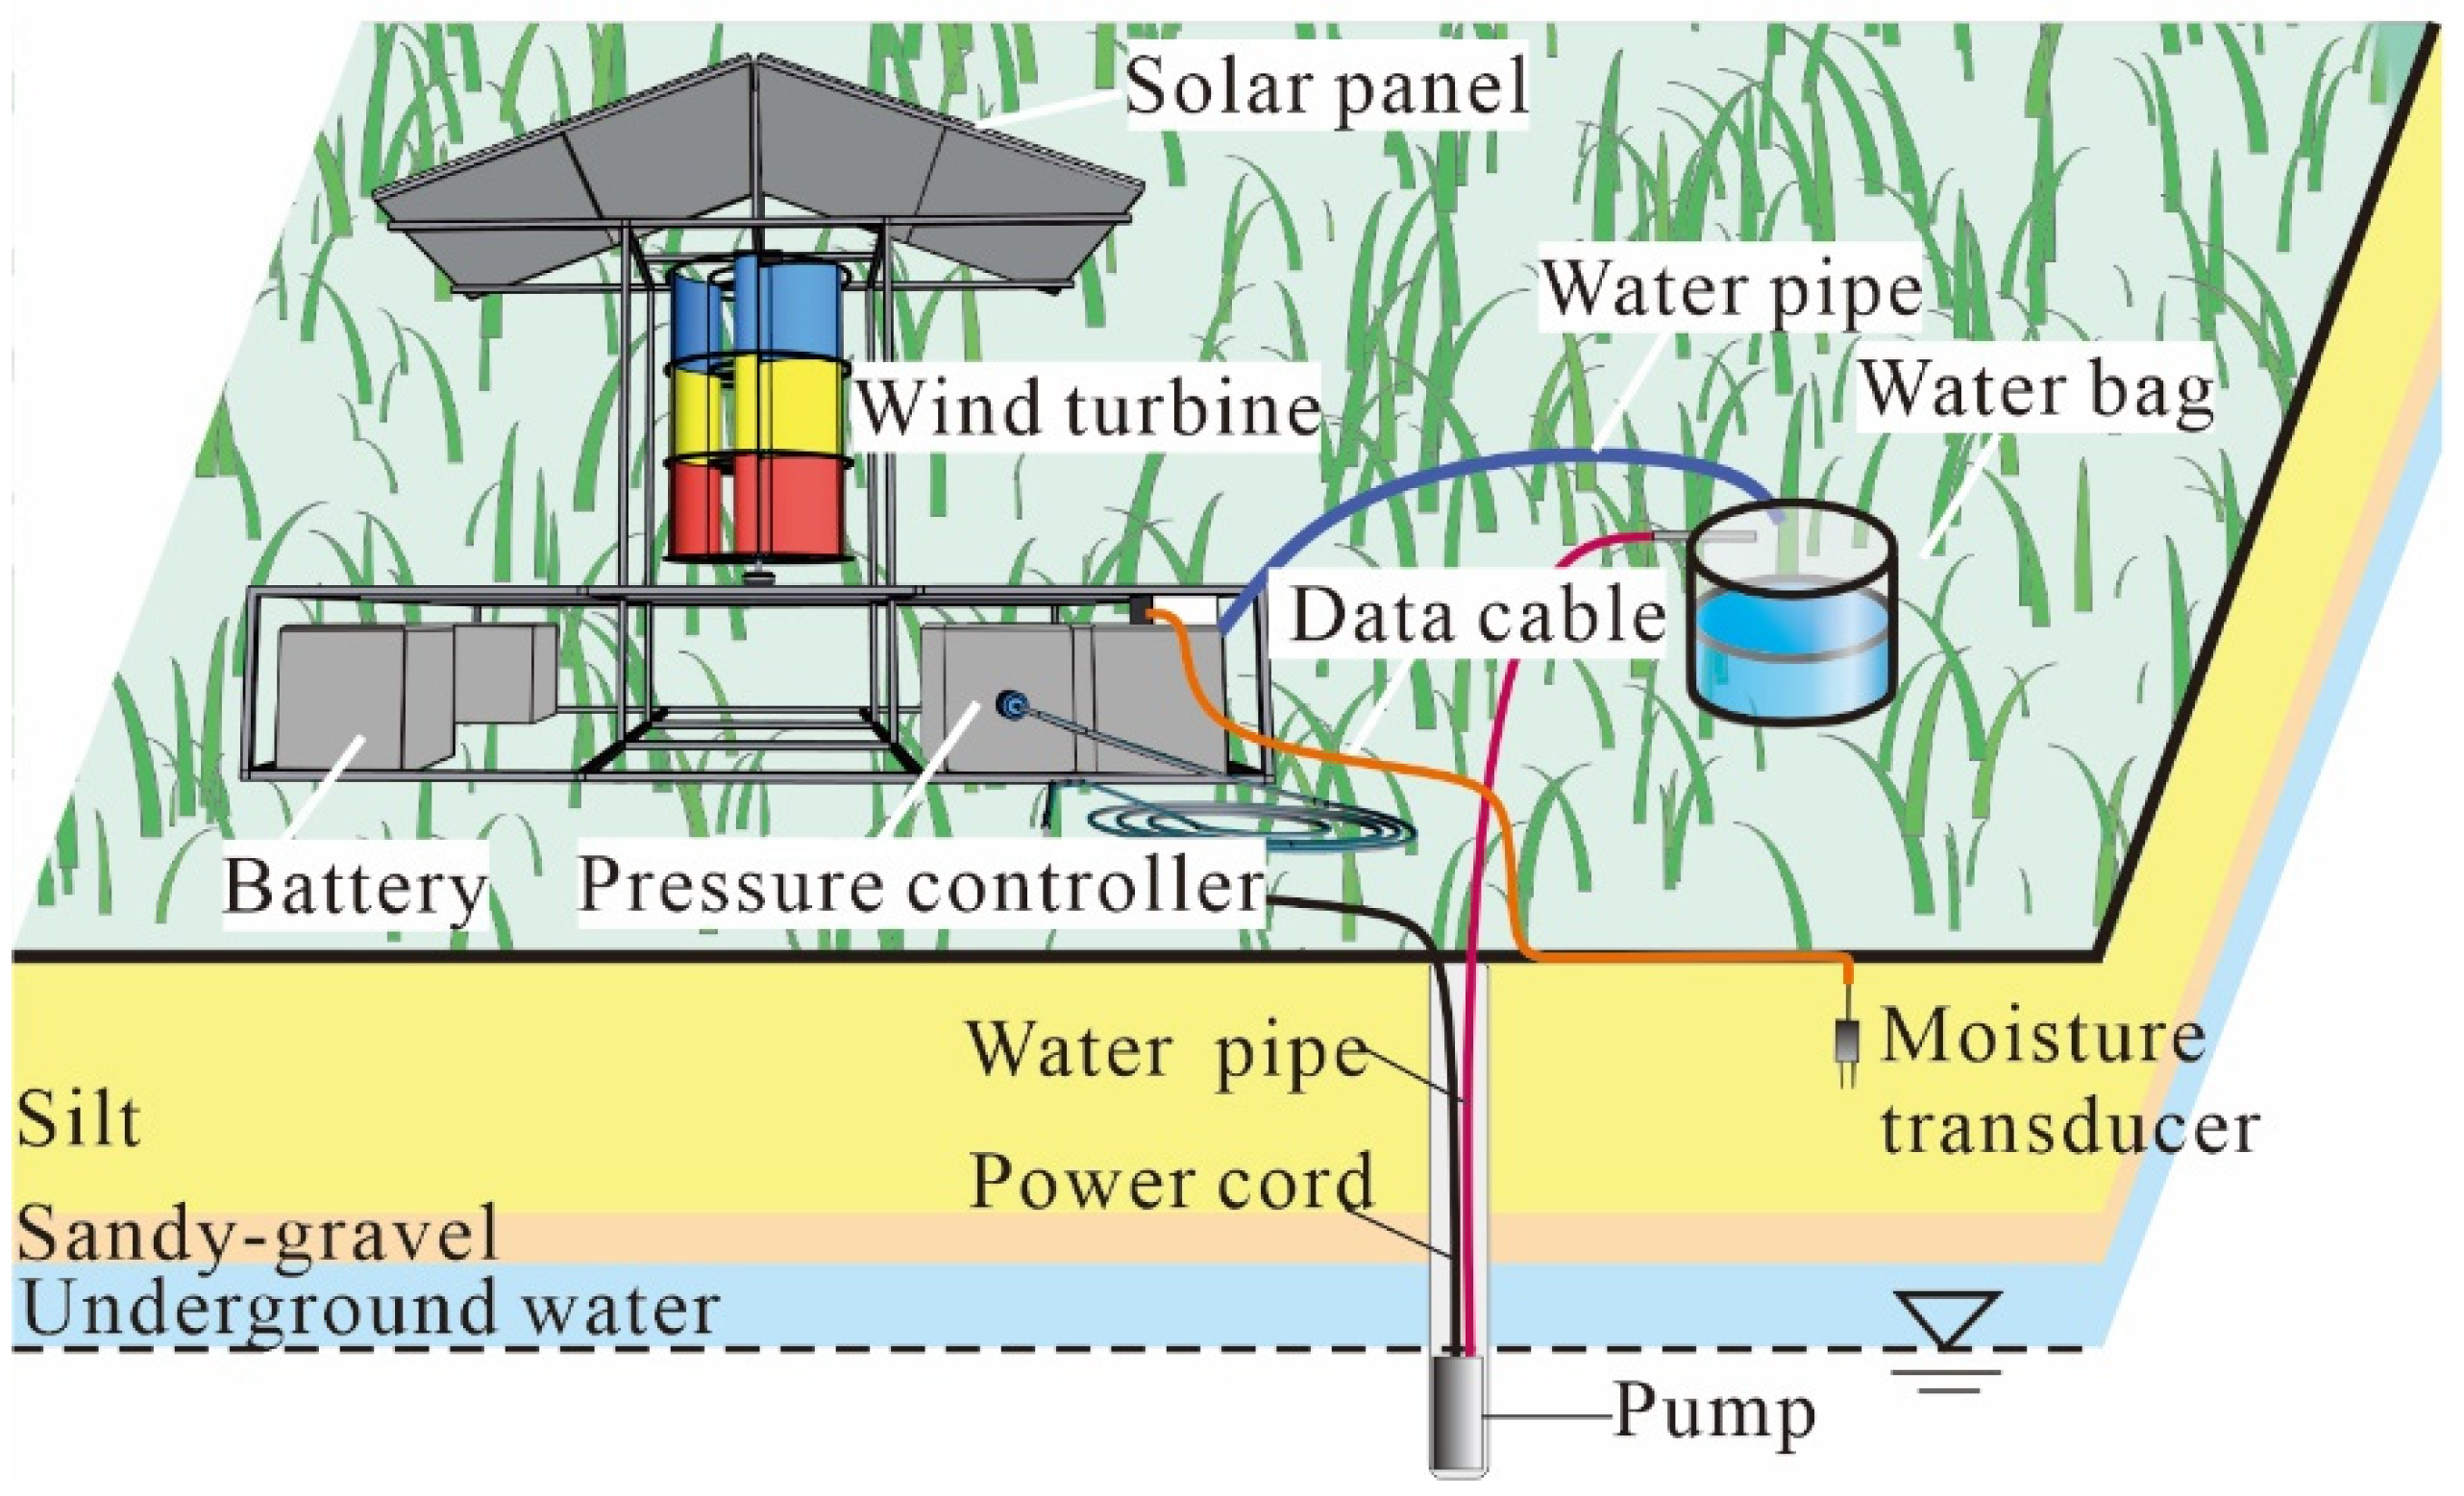
Figure 10 shows the wind-photovoltaic hybrid power water lifting and drip irrigation system including solar panels, wind turbines, batteries, pumps, and moisture transducers. The system is based on wind and solar energy to generate electricity and extract groundwater resources. In addition, using an automatic control system, the system automatically turns on the drip irrigation when the water content is lower than 13.1% of the PWP. Similarly, when the FC is higher than 34.6% of the FC, the system stops drip irrigation.
There were several water intake wells in the pasture. The most barren area was conducted for on-site drip irrigation experiments. The area is 100 × 100 m2. The bottom-hole pressure pump is directly connected to the drip irrigation pipe for water supply. The surface vegetation is cultivated by artificial transplantation, and one plant near each drip hole is used, C. korshinskii. The test started in January 2017, and the on-site inspection was carried out in April 2021. The surface vegetation was completely covered with a coverage rate of more than 90%. Due to the adoption of water-saving measures, limited groundwater can maintain long-term irrigation. At present, this measure has been adopted by the pasture manager to restore vegetation.
5. Conclusions
Based on the soil water energy, a new method for measuring the FC, PWP, and SWAC is proposed. It is different from the definition and existing measurement method that the air-entry and residual value of SWCC were corresponding to the FC and PWP, and a soil column apparatus was designed based on the instantaneous profile method combined with the filter paper method to determine the SWCC and HCF. Specifically, weighing the filter papers and soil specimens at regular time intervals, the water content profiles can be derived from the water content of the specimens, and the matric suction profiles can be derived from the water content of the filter papers with the calibration curves of the filter paper. The method is inexpensive, and the testing specimen is less disturbed. The drip irrigation volume and time were quantified based on drip irrigation, capillary barrier, and the transpiration testing. Our study optimized FC and PWP of the definition and existing measurement methods. Furthermore, our irrigation methods proposed provided a certain reference for the local irrigation system. At the same time, it can be applied to other dryland pastures with similar geological backgrounds and climate.
Author Contributions
Conceptualization, T.L. and R.J.; methodology, T.L. and R.J.; formal analysis, R.J.; investigation, R.J. and Y.D.; data curation, R.J. and T.L.; writing—original draft preparation, R.J. and Z.J.; writing—review and editing, T.L. and R.J.; supervision, T.L.; funding acquisition, T.L. All authors have read and agreed to the published version of the manuscript.
Funding
This research was financially supported by the National Natural Science Foundation of China (Grant No. 41772278 and 42072311) and the Fundamental Research Foundation of the Central Universities of China (Grant No. 300102261507). The above financial support is gratefully acknowledged.
Institutional Review Board Statement
Not applicable.
Informed Consent Statement
Not applicable.
Data Availability Statement
The data supporting the conclusions of this article are available from the corresponding author upon reasonable request.
Acknowledgments
We also thank Hua Li, Yu Wang and Jian Guo for their kind assistance with the laboratory tests.
Conflicts of Interest
The authors declare no conflict of interest.
References
- Neupane, J.; Guo, W.X. Agronomic Basis and Strategies for Precision Water Management: A Review. Agronomy 2019, 9, 87. [Google Scholar] [CrossRef]
- Bhattacharya, A. Effect of Soil Water Deficits on Plant–Water Relationship: A Review. In Soil Water Deficit and Physiological Issues in Plants; Springer: Singapore, 2021; pp. 1–98. [Google Scholar]
- Li, J.S. Increasing Crop Productivity in an Eco-Friendly Manner by Improving Sprinkler and Micro-Irrigation Design and Management: A Review of 20 Years’ Research at the IWHR, China. Irrig. Drain. 2018, 67, 97–112. [Google Scholar] [CrossRef]
- Ladanyi, Z.; Barta, K.; Blanka, V. Assessing Available Water Content of Sandy Soils to Support Drought Monitoring and Agricultural Water Management. Water Resour. Manag. 2021, 35, 869–880. [Google Scholar] [CrossRef]
- Horne, D.J.; Scotter, D.R. The available water holding capacity of soils under pasture. Agric. Water Manag. 2016, 177, 165–171. [Google Scholar] [CrossRef]
- Inforsato, L.; van Lier, Q.J. Polynomial functions to predict flux-based field capacity from soil hydraulic parameters. Geoderma 2021, 404, 115308. [Google Scholar] [CrossRef]
- Kirkham, M.B. Principles of Soil and Plant Water Relations; Academic Press: Cambridge, MA, USA, 2005; Volume 8, pp. 101–115. [Google Scholar]
- Richards, L.A.; Wadleigh, C.H. Soil water and plant growth. Soil physical conditions and plant growth. Agron. Monogr. 1952, 2, 86–99. [Google Scholar]
- Jiang, B.; Zhong, C.; Li, H.Y. Field capacity determination method based on dynamic mechanism of soil moisture. Water Resour. Hydropower Eng. 2020, 51 (Suppl. S1), 267–270, (In Chinese with English Abstract). [Google Scholar]
- Gunarathna, M.; Sakai, K.; Nakandakari, T.; Momii, K.; Kumari, M.; Amarasekara, M. Pedotransfer functions to estimate hydraulic properties of tropical Sri Lankan soils. Soil Tillage Res. 2019, 190, 109–119. [Google Scholar] [CrossRef]
- Geng, Z.C.; Dai, W. Agrology. In Pedology; Science Press: Beijing, China, 2011; pp. 91–93. [Google Scholar]
- Li, X.D.; Shao, M.A.; Zhao, C.L. Spatial Variability and Simulation of Soil Hydraulic Parameters in Arid Northwest China. Arid Zone Res. 2019, 36, 1325–1332, (In Chinese with English Abstract). [Google Scholar]
- Gao, X.Y.; Liu, T.X.; Duan, L.M.; Tong, X. Determination and Effect of Dune-Meadow Field Capacity in the Horqin Sandy Land. Arid Zone Res. 2016, 33, 1336–1344, (In Chinese with English Abstract). [Google Scholar]
- Assi, A.T.; Mohtar, R.H.; Braudeau, E. Soil pedostructure-based method for calculating the soil-water holding properties. MethodsX 2018, 5, 950–958. [Google Scholar] [CrossRef] [PubMed]
- Jing, X.V. Comparative Study on the Field Capacity Based on Different Test Methods. Master’s Thesis, Jilin University, Changchun, China, 2018. (In Chinese with English Abstract). [Google Scholar]
- Jiang, P.F.; Lei, T.W.; Liu, X.H.; Wu, Y.; Li, X.; Wang, Q.J. Principles and experimental verification of capillary suction method for fast measurement of field capacity. Trans. Chin. Soc. Agric. Eng. 2006, 22, 1–5, (In Chinese with English Abstract). [Google Scholar]
- Lu, N.; Likos, W.J. Suction stress characteristic curve for unsaturated soil. J. Geotech. Geo-Environ. Eng. 2006, 132, 131–142. [Google Scholar] [CrossRef]
- Hou, X.K.; Vanapalli, S.K.; Li, T.L. Water infiltration characteristics in loess associated with irrigation activities and its influence on the slope stability in Heifangtai loess highland, China. Eng. Geol. 2017, 234, 27–37. [Google Scholar] [CrossRef]
- van Genuchten, M.T. A closed-form equation for predicting the hydraulic conductivity of unsaturated soils. Soil Sci. Soc. Am. J. 1980, 44, 892–898. [Google Scholar] [CrossRef] [Green Version]
- Vanapalli, S.K.; Fredlund, D.G.; Pufahl, D.E.; Clifton, A.W. Model for the prediction of shear strength with respect to soil suction. Can. Geotech. J. 1996, 33, 379–392. [Google Scholar] [CrossRef]
- Li, H.; Li, T.L.; Jiang, R.J.; Fan, J.W. Measurement of unsaturated permeability curve using filter paper method. Rock Soil Mech. 2020, 41, 895–904, (In Chinese with English Abstract). [Google Scholar]
- ASTM D5298-10; Standard Test Method for Measurement of Soil Potential (Suction) Using Filter Paper. ASTM International: West Conshohocken, PA, USA, 2013.
- Stormont, J.C.; Morris, C.E. Method to Estimate Water Storage Capacity of Capillary Barriers. J. Geotech. Geo-Environ. Eng. 1998, 124, 297–302. [Google Scholar] [CrossRef] [Green Version]
- Lu, N.; Likos, W.J. Unsaturated Soil Mechanics; John Wiley & Sons, Inc.: Hoboken, NJ, USA, 2004; pp. 341–345. [Google Scholar]
Figure 1.
Variations in major meteorological data in half-months intervals.

Figure 2.
Experimental setup (a) schematic sketch, (b) detail of two contact soil specimens.

Figure 3.
Drip irrigation testing.

Figure 4.
Moisture content of the soil profile in the pasture.

Figure 5.
(a) Soil water characteristic curves (SWCCs) and (b) hydraulic conductivity functions (HCFs) of the silt and sandy-gravel in the pasture.
Figure 5.
(a) Soil water characteristic curves (SWCCs) and (b) hydraulic conductivity functions (HCFs) of the silt and sandy-gravel in the pasture.

Figure 6.
(a) Variation of volumetric water content with time (b) the wetting front with time.

Figure 7.
Depth and extent of the infiltration zone at 180 h.

Figure 8.
Variation of volumetric water content with time.

Figure 9.
Seasonal variation in the transpiration of Caragana Korshinskii.

Figure 10.
Schematic diagram of the improved wind-photovoltaic hybrid power of water lifting and drip irrigation of system.
Figure 10.
Schematic diagram of the improved wind-photovoltaic hybrid power of water lifting and drip irrigation of system.


Table 1.
Hydraulic properties of silt and sandy-gravel.
| Symbol | Parameter | Unit | Silt | Sandy-Gravel |
|---|---|---|---|---|
| θs | Saturated water content | % | 34.6 | 27.2 |
| θr | Residual water content | % | 13.1 | 10.7 |
| Ks | Saturated hydraulic conductivity | m·s−1 | 5.0 × 10⁻⁶ | 3.0 × 10⁻⁴ |
| α | Water exchange coefficient | kPa−1 | 0.002 | 2.324 |
| n | Fitting parameter | - | 1.550 | 11.586 |
| m | Fitting parameter | - | 8.500 | 3.800 |
| R2 | coefficient of determination | - | 0.9974 | 0.9856 |
Publisher’s Note: MDPI stays neutral with regard to jurisdictional claims in published maps and institutional affiliations. |
© 2022 by the authors. Licensee MDPI, Basel, Switzerland. This article is an open access article distributed under the terms and conditions of the Creative Commons Attribution (CC BY) license (https://creativecommons.org/licenses/by/4.0/).
Share and Cite
MDPI and ACS Style
Jiang, R.; Li, T.; Jia, Z.; Dong, Y. Determining Soil Available Water Capacity and Reasonable Irrigation Volume in Dryland Pasture. Water 2022, 14, 2760. https://doi.org/10.3390/w14172760
AMA Style
Jiang R, Li T, Jia Z, Dong Y. Determining Soil Available Water Capacity and Reasonable Irrigation Volume in Dryland Pasture. Water. 2022; 14(17):2760. https://doi.org/10.3390/w14172760
Chicago/Turabian StyleJiang, Ruijun, Tonglu Li, Zhijie Jia, and Yonglu Dong. 2022. "Determining Soil Available Water Capacity and Reasonable Irrigation Volume in Dryland Pasture" Water 14, no. 17: 2760. https://doi.org/10.3390/w14172760
Note that from the first issue of 2016, this journal uses article numbers instead of page numbers. See further details here.