

Effects of Climatic Variability on Soil Water Content in an Alpine Kobresia Meadow, Northern Qinghai–Tibetan Plateau, China

1
Key Laboratory of Adaptation and Evolution of Plateau Biota, Northwest Institute of Plateau Biology, Chinese Academy of Sciences, Xining 810008, China
2
Qinghai Haibei National Field Research Station of Alpine Grassland Ecosystem, Haibei 812200, China
*
Author to whom correspondence should be addressed.
Water 2022, 14(17), 2754; https://doi.org/10.3390/w14172754
Submission received: 16 July 2022
/
Revised: 25 August 2022
/
Accepted: 31 August 2022
/
Published: 4 September 2022
(This article belongs to the Special Issue Impacts of Climate Change on Water Resources and Water Risks)
Abstract
:Soil moisture dynamics play an active role in ecological and hydrological processes. Although the variation of the soil water moisture of multiple ecosystems have been well-documented, few studies have focused on soil hydrological properties by using a drying and weighing method in a long time series basis in the Qinghai-Tibet Plateau (QTP). In this study, 13 year (2008–2020) time-series observational soil moisture data and environmental factors were analyzed in a humid alpine Kobresia meadow on the Northern Qinghai–Tibetan Plateau. The results showed no significant upward trend in soil water content during the 2008–2020 period. In the growth season (May–October), the soil water content showed a trend of decreasing firstly, then increasing, and finally, decreasing. Correlation analysis revealed that five meteorology factors (temperature, humidity, net radiation, dew point temperature, and vapor pressure) and a biomass element (above-ground biomass) had a significant effect on the soil moisture, and air temperature impacted the soil water variation negatively in 0–50 cm, indicating that global warming would reduce soil moisture. Humidity and net radiation made a difference on shallow soil (0–10 cm), while dew point temperature and vapor pressure played a role on the deep soil (30–50 cm). Above-ground biomass only effected 30–50 cm soil moisture variation, and underground biomass had little effect on the soil moisture variation. This indirectly indicated that below-ground biomass is not limited by soil moisture. These results provide new insights for the rational allocation of water resources and management of vegetation in alpine meadows, in the context of climate change.
1. Introduction
Soil moisture is one of the important parts of the hydrological cycle in ecosystems and climatic systems, and it has a direct influence on vegetation growth and ecosystem stability [1,2,3,4]. The temporal variation of soil moisture is influenced by both climate and human activity [5,6,7,8,9,10]. Climate change affects the availability of soil moisture [6,11,12], and human activities change the distribution of soil moisture by affecting the vegetation cover [13,14,15]. Temperature was the main factor to drive moisture transport and showed a negative correlation to the soil moisture in the northern part of China [16,17,18]. Precipitation is an important source of soil moisture and makes an important contribution to soil moisture recharge [19,20,21]. Evapotranspiration was the main pathway for soil water loss [22,23,24]. The pattern of above- and below-ground biomass allocation to vegetation can also vary under different grazing management patterns, thereby effecting the movement of water in the soil [25,26].
The Qinghai-Tibetan Plateau (QTP) is the highest plateau in the world [1] and one of the most sensitive regions responding to global climate change [27]. Over the past three decades, the soil water content of the seasonal permafrost zone had shown a significant increase in the Qinghai-Tibet Plateau [28]. The alpine meadows are one of the most widespread grassland types in the Qinghai–Tibetan Plateau and distribute in major riverine areas, playing an important water conservation function [29,30]. In the past few decades, the alpine grassland system was sensitive to the changing climate [31], and climate changing is affecting vegetation distribution [32]. In the alpine meadow, changes of vegetation distribution have led to dramatic changes in soil moisture [33,34]. A healthy plant–soil ecosystem requires that soil moisture balance, otherwise it leads to a water deficit [35]. Therefore, it is crucial to explore soil moisture dynamics and factors affecting soil water content for the healthy operation of an ecosystem.
The Qinghai-Tibetan Plateau has a severe environment, as well as a cold and arid climate-caused seasonal permafrost. The soil freezes gradually from middle of October to the end of December, with thawing until April or May. Therefore, the growth season is short in the Qinghai-Tibetan Plateau—approximately six months, from May to October [27]. A large number of studies on soil moisture trends and influence factors had been carried out [29,36,37,38,39,40]. However, a previous study mainly focused on short-term soil moisture variability, and the analysis of the factors influencing it has mostly focused on a few meteorological factors (air temperature, precipitation, and grazing management) [18,41,42]. Due to the complex interactions between atmospheric, soil, and biological factors, the effects of climate and biology on the soil moisture remain unclear. On this basis, we used a 16-year (2008–2020) time-series of soil moisture and climate data to explore the inter-annual variations of soil moisture under climate change effects from 2008 to 2020, particularly focusing on the response of soil moisture to climate change, such as altered temperature and precipitation, as well as the relationship between above- and below-biomass and soil moisture across different soil layers, and we tried to explain the possible factors driving these changes.
2. Materials and Methods
2.1. Site Description
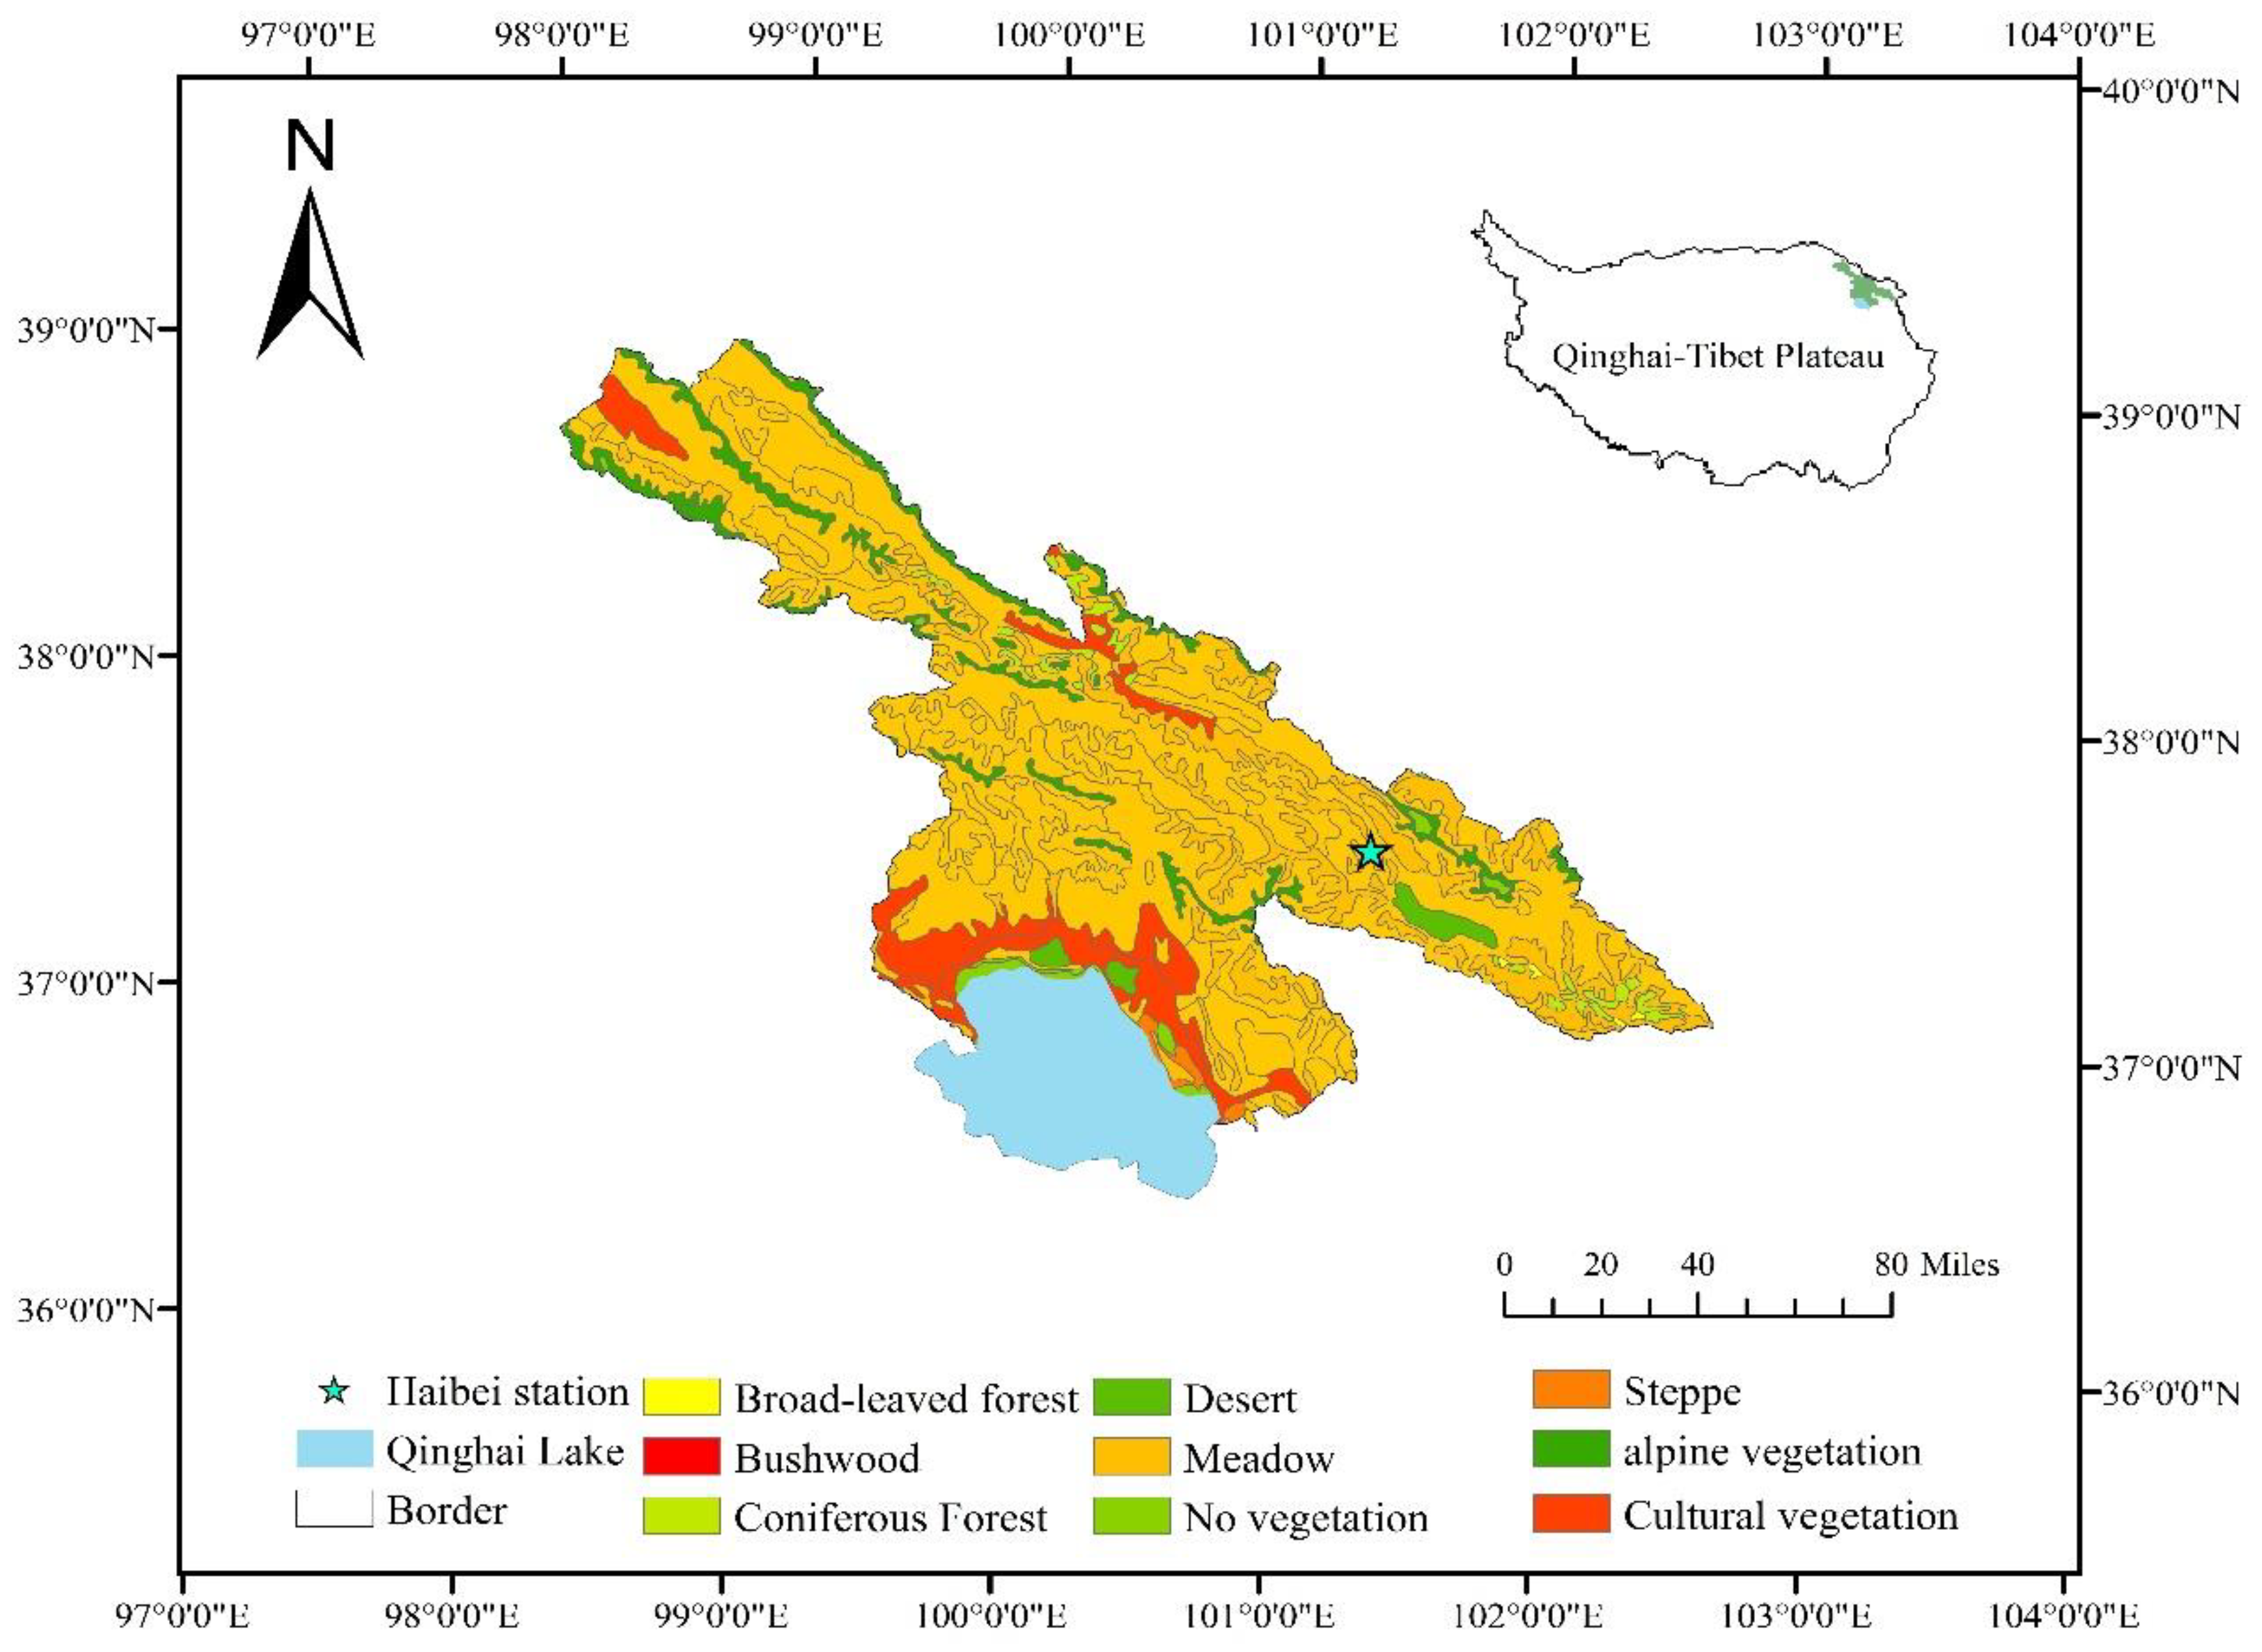
The study was performed at Qinghai Haibei National Field Research Station of Alpine Grassland Ecosystem (Haibei station, 101°19′ E, 37°37′ N, 3200 m above sea level) (Figure 1). The region is situated on the northeastern QTP and has a typical plateau continental monsoon climate [43]. The average annual air temperature is 0.52 °C (2008–2020). The average annual precipitation is 467.5 mm, and more than 80% of precipitation is concentrated in plant growing season (from May to October) as rain. The study area is seasonal frozen soil area, and the maximum frozen soil depth reaches 220 cm. The average number of frozen days is 212. The average reference evapotranspiration (ET0) is approximately 750.60 mm. The community type of study area is Kobresia humilis, and the vegetation cover reaches up to 80–100%. The dominant species include Kobresia humilis (C.A. Mey.) Serg., Elymus nutans Griseb, Stipa aliena Keng, Taraxacum dissectum (Ledeb) Ledeb, Anaphalislactea Maxim, and Potentilla anserina L. Sp. Pl [14]. The soil types of Haibei station are alpine meadow soil. The alpine meadow soil is a silt loam of approximately 60–80 cm thickness. A lower coarse sandy loam containing rock fragments occurs below 90 cm.
2.2. Data Collection
Since 2008, long-term positioning monitoring of soil water content has been carried out in Haibei station, and soil moisture was determined using mass water content (mg). Representative sample plots were selected in the study area; to remove the vegetation and top layer of floating soil at sample plots, 5 cm diameter drill was used to collect the soil of 0–10, 10–20, 20–30, 30–40, and 40–50 cm depth. The collected soil was quickly packed into aluminum boxes of known weight and taken back to the laboratory for weighing; the measured masses were accurate to 0.01 g, and the mass was noted as m1. The weighed samples were dried in an oven at 105 ± 5 °C for 12 h, removed, cooled to room temperature in a desiccator, and weighed immediately; we noted down the data and repeated the above steps until the data was stable. The final figure was recorded as m2. All samples were sampled in 3 replicates, and mg was averaged over 3 replicates. Soil moisture was measured each year, from May to October, in intervals of 5 days.
Soil water content sensor (HydraProbeII) was installed in the comprehensive observation field at Haibei station, and it can measure soil volumetric water content (mv, cm3/cm3) continuously. The measurement range and accuracy were 0–100% and 0.001. The time interval for the data collector (CR1000X) to record data was 0.5 h. The data of soil water contents in 2017 and 2019 were selected to study the short-term variation of soil moisture.
Above- and below-biomass were collected at the vicinity of the soil moisture collection point, and specific sampling and measuring methods can be obtained from Dai’s study [43]. The climatic data were collected from the meteorological station from 2008–2020 at the Haibei Station, including precipitation, temperature, humidity, net radiation, soil heat flux, wind speed, dew point temperature, and vapor pressure.
Soil water storage (SWS, mm) is the amount of water contained in the soil at a certain depth, affected by precipitation, evaporation, transpiration, and other factors. The formula is shown below:
where SWS is the soil water storage (mm), Wi is the volumetric water content of layer i of soil (vol%), and hi is the thickness of layer i of soil (mm).
The data of soil water content of from manual monitoring was mass water content (wt.%), so it should be changed to volumetric water content (vol.%):
where Wmi is the mass water content of layer i of soil, and ρb is the soil bulk density (g/m3).
Soil water deficit (D, %) is degree of water deficit during the plant growth. When the soil water deficit is large, it can lead to a reduction in productivity and, in severe cases, plant death. The formula is shown below:
where Da is the water deficits of soil (mm), and F is the field water holding. When D is larger than 0, it indicates a soil moisture deficit; when D is less than 0, it indicates that water deficits have been alleviated.
ET0 is calculated using the formulae of FAO Penman–Monteith, and the drought index was calculated as follows: r = ET0/precipitation [43].
2.3. Statistical Analysis
Correlation and regression analyses are common statistical methods in the research of hydrological processes of ecosystems. In this study, correlation analysis was applied to determine the correlation between environmental factors and soil moisture. The correlation analysis was conducted in SPSS (IBM SPSS Statistics 25.0, Chicago, IL, USA). In order to further clarify the effects of environmental factors on soil moisture variability, regression relationships between the environmental variables and soil moisture need to be determined. The results of the correlation analysis showed strong collinearities between both meteorological and biological variables. Therefore, general regression analysis is no longer applicable, so the dominance analysis is used to estimate the contribution of the environmental factors to soil moisture variability. The dominance analysis was conducted in R 4.0.4, and the analytical principles can be obtained from Azen’ research [44].
All graphs in this study were drawn by using Excel 2010.
3. Results
3.1. Meteorological Factors Change Characteristics
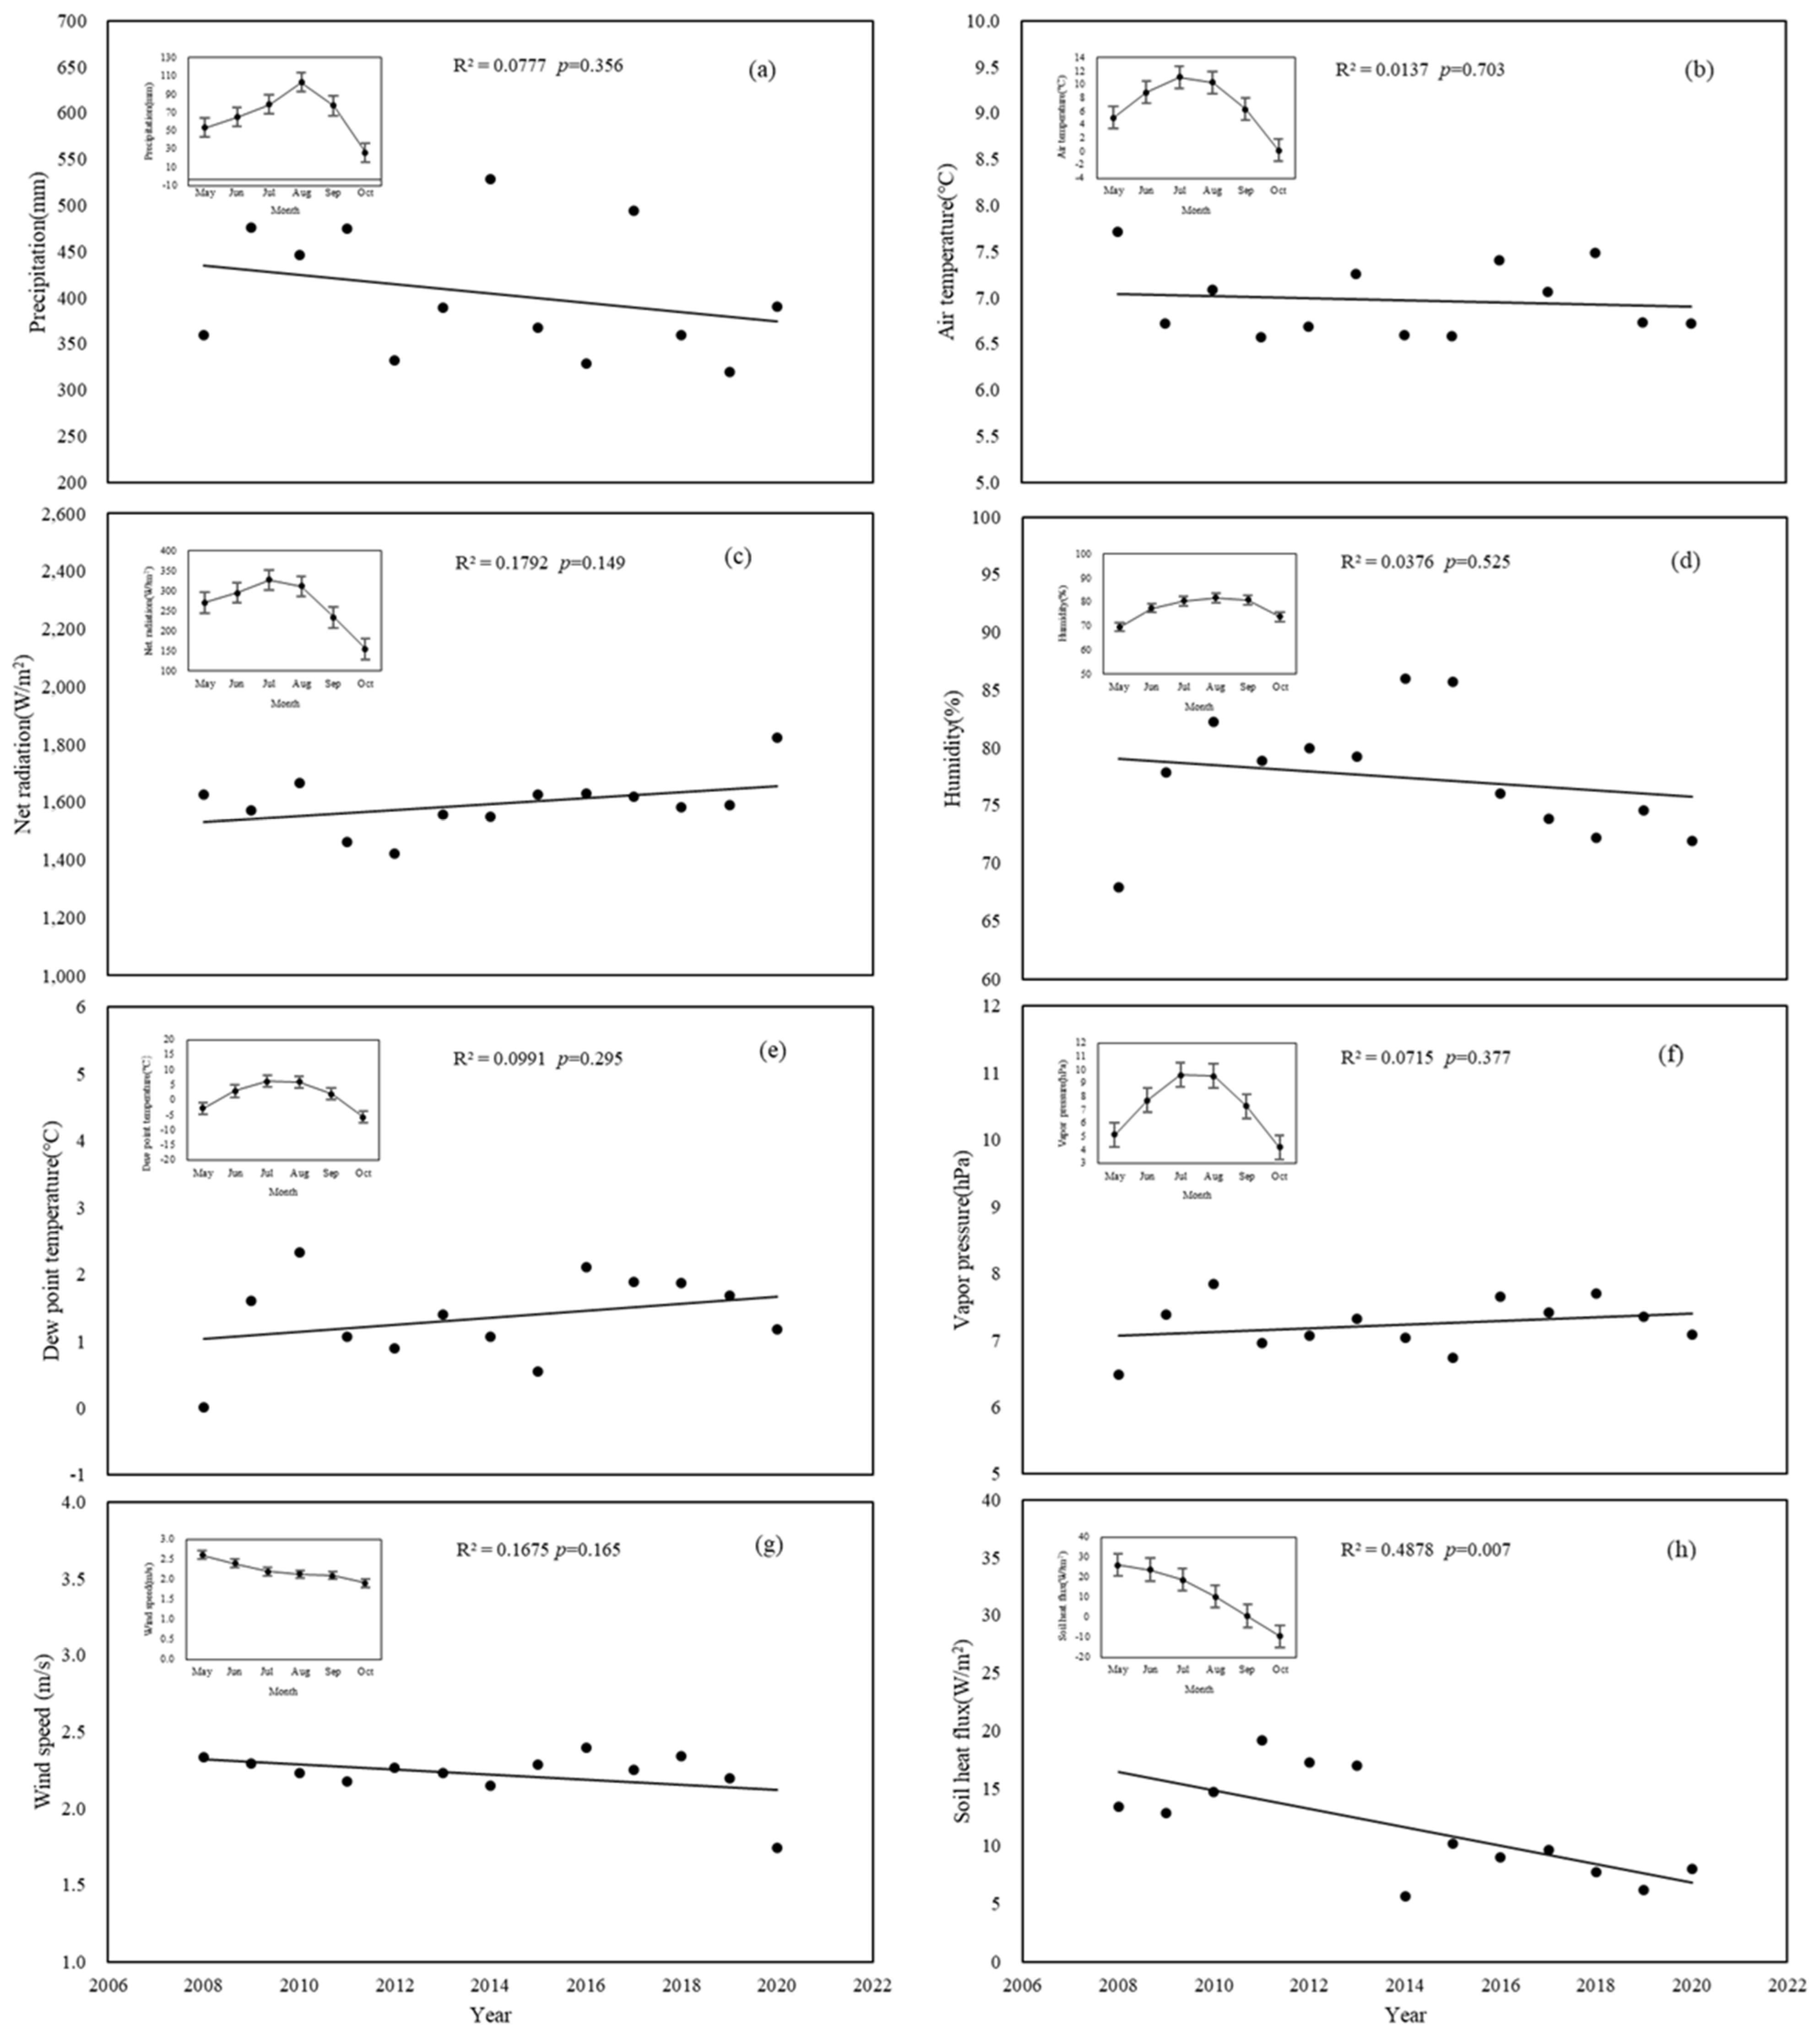
In this study, eight meteorological elements were selected for trend analysis. The net radiation, dew point temperature, and vapor pressure displayed an insignificant upward trend (p > 0.05) (Figure 2c,e,f). The precipitation, temperature, humidity, and wind speed displayed an insignificant downward trend (p > 0.05) (Figure 2a,b,d,g). The soil heart flux displayed a significant downward trend (p < 0.05). As for the monthly variation, the precipitation, air temperature, net radiation, humidity, dew point temperature, and vapor pressure showed a trend that increased first, and then decreased in the growth season; the wind speed and soil heat flux showed a continuing downward trend. These results indicated that the meteorological elements remained relatively stable, except for soil heat flux; the soil absorbed heat in the first half of the year and released heat in the second half of the year.
3.2. Soil Moisture Variability Characteristics
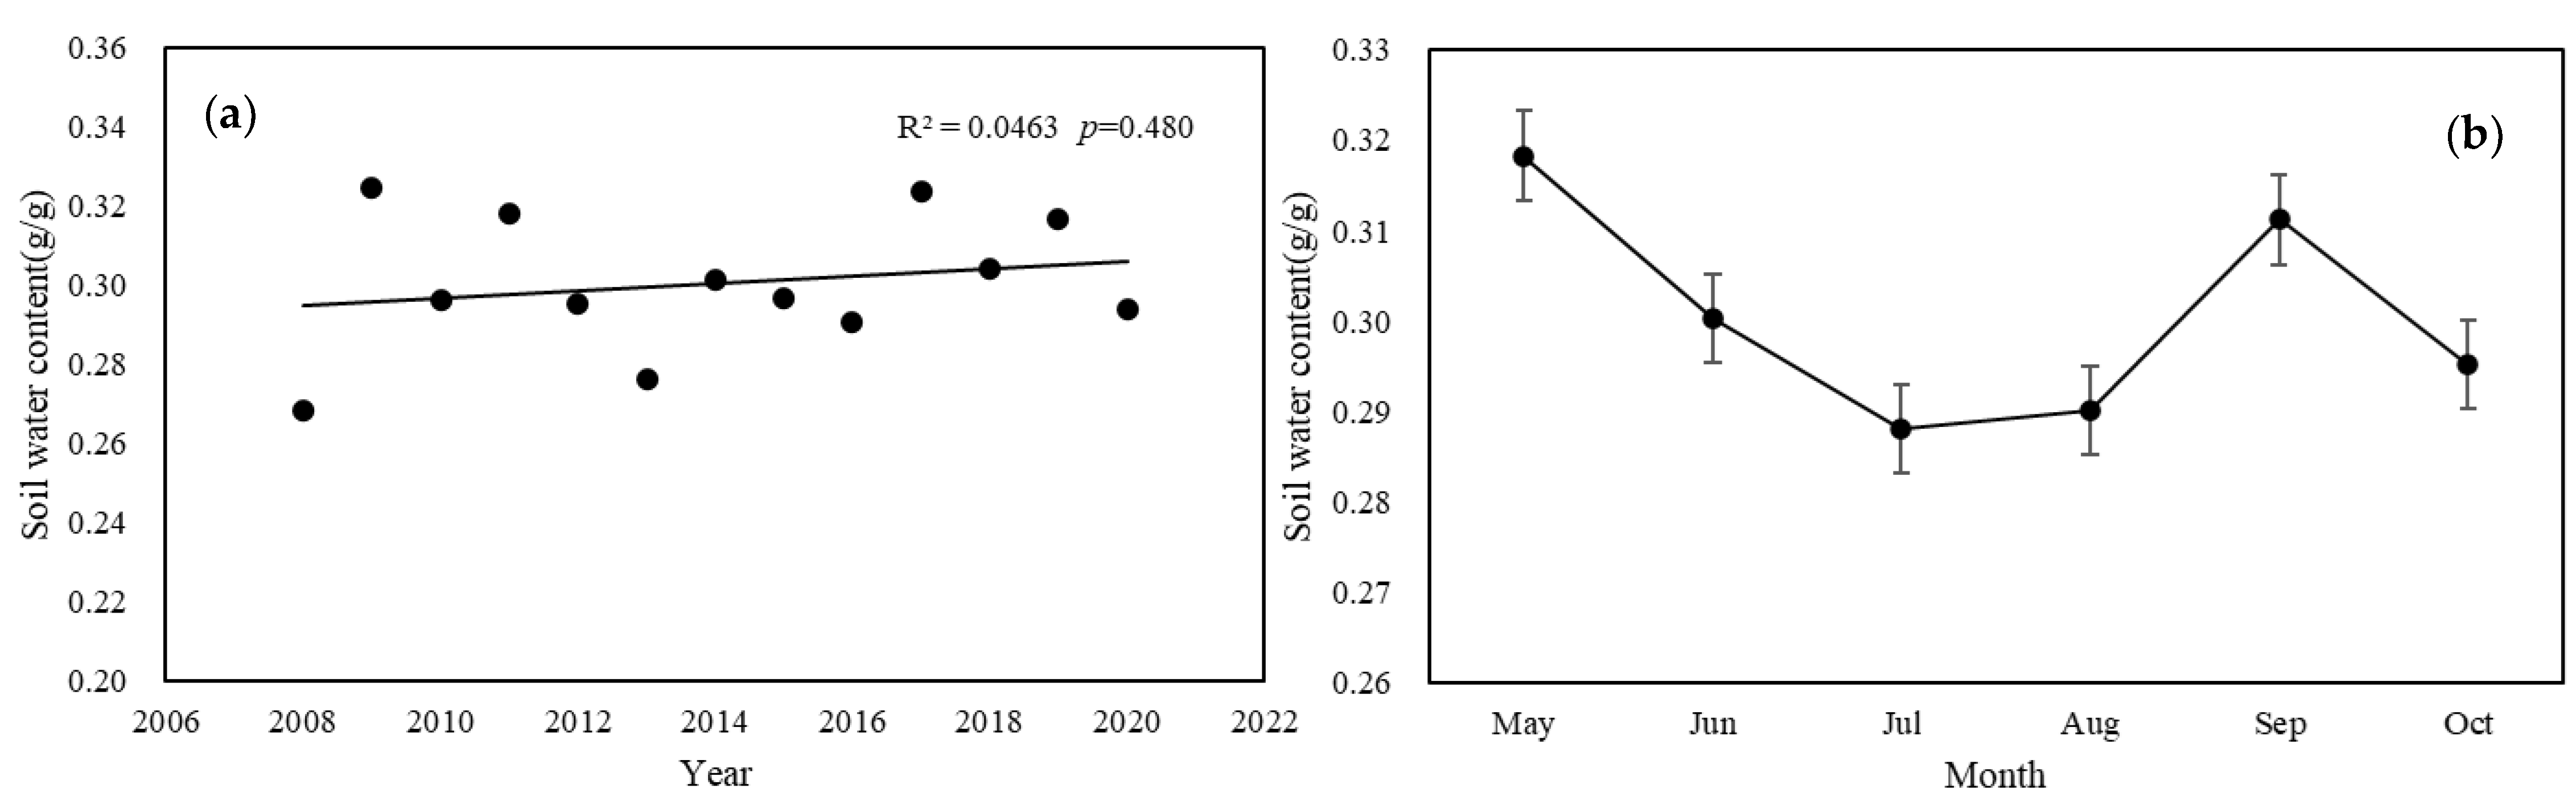
The multi-year average soil water content was 0.301 ± 0.02 g/g (2008–2020), and the soil water content showed a slightly increased trend (p = 0.480, Figure 3a), with a maximum in 2009 and minimum in 2008; they were 0.325 and 0.268 g/g, respectively. In the growing season (May–October), soil moisture showed a fluctuating trend (Figure 3b), and it showed a continuous decreasing trend from May to August, with the lowest soil water content in August. It first displayed an increase and then a decline from August to October, with a maximum in May and minimum August. This indicates that soil moisture consumption reached its peak in July.
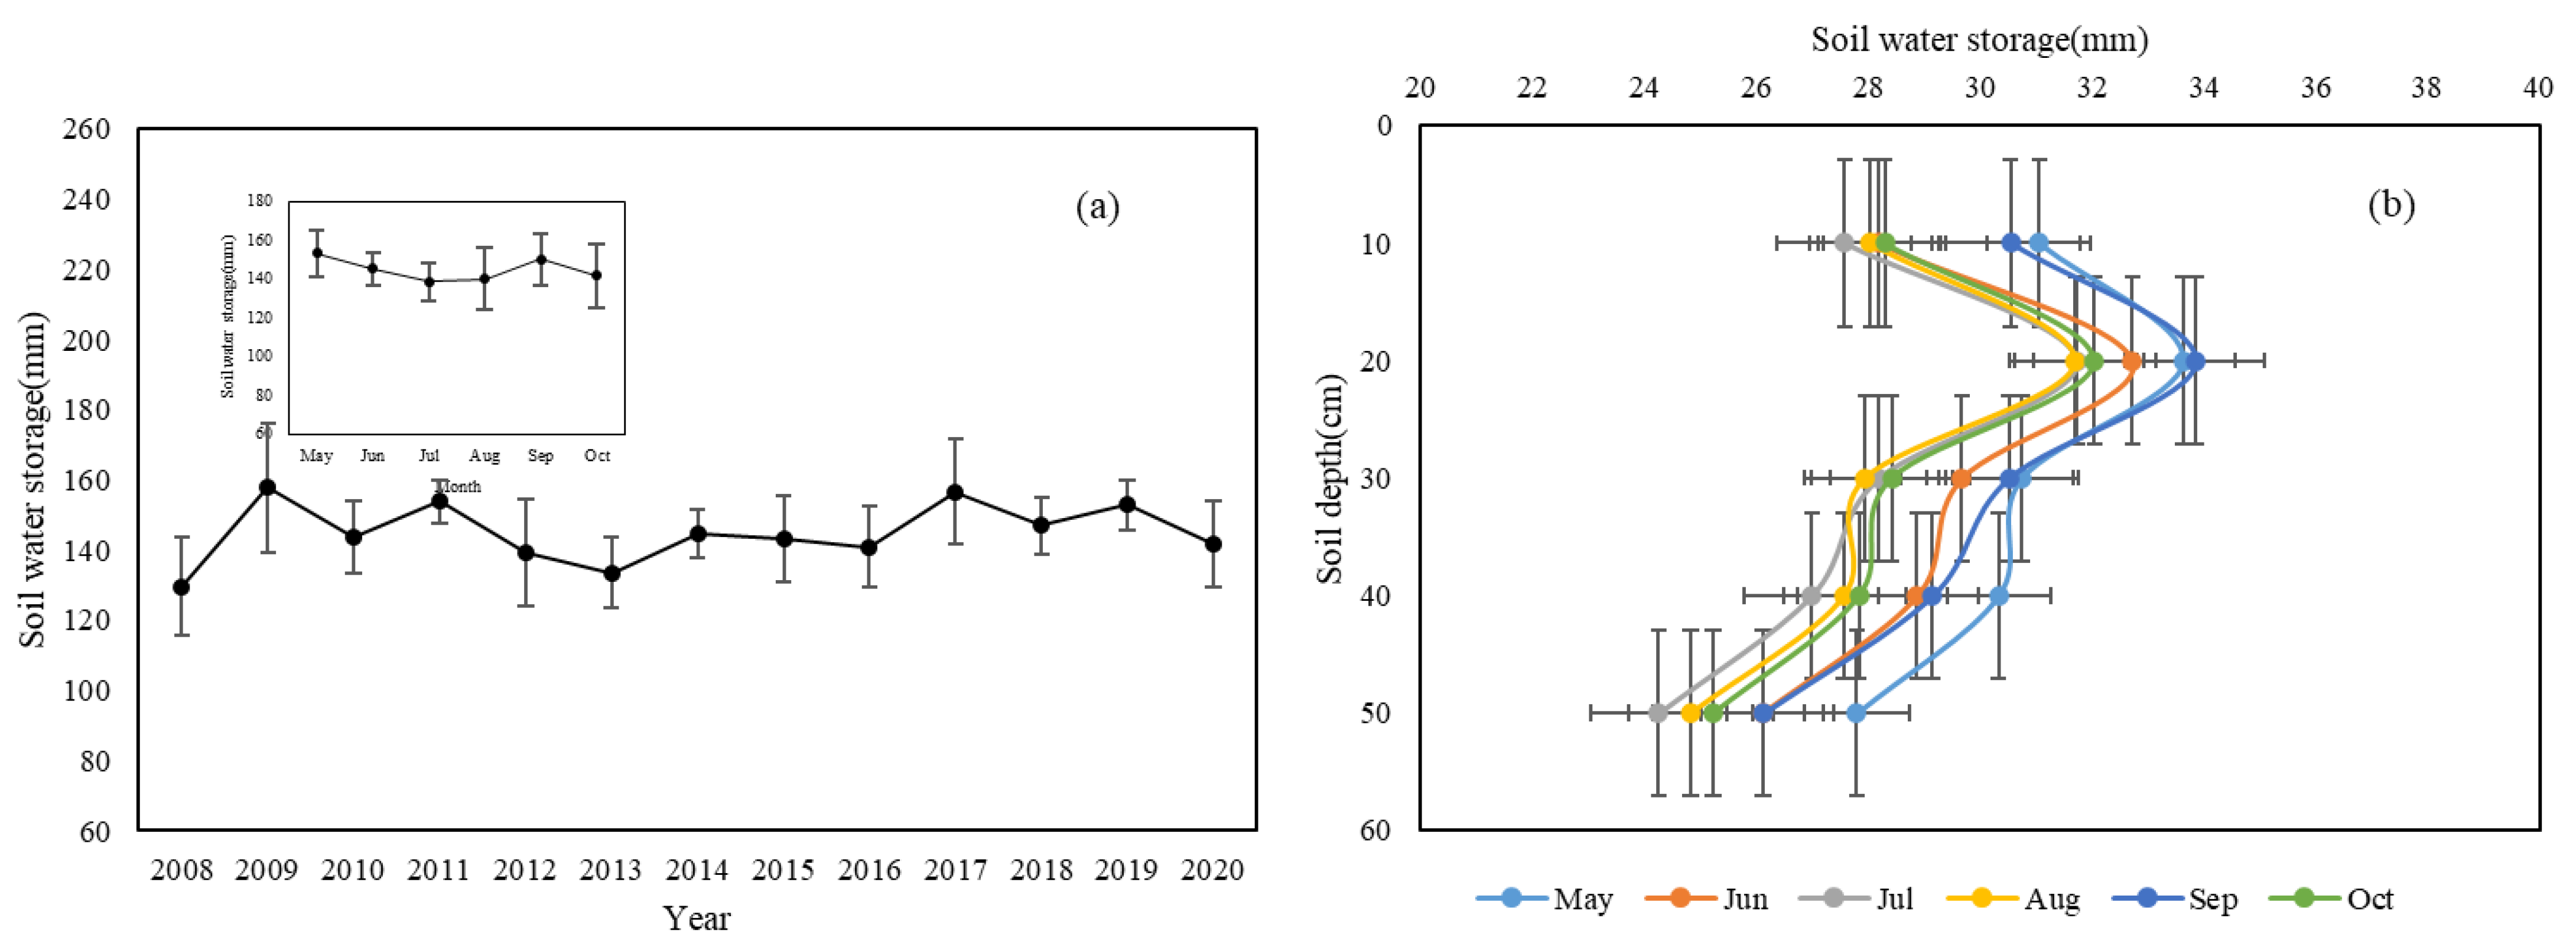
The multi-year average soil water storage was 145.00 ± 8.55 mm (2008–2020) at a depth of 0–50 cm, and its trend was consistent with the soil water content, with a maximum in 2009 and minimum in 2008; they were 157.77 and 129.57 mm, respectively (Figure 4a). In the growing season, soil water storage was highest in May and lowest in August, and they were 154.39 ± 13.10 and 138.07 ± 16.32 mm, separately (Figure 4a). In the vertical direction, the soil water storage at depth of 20 cm was most, and that at 50 cm was least. There was no significant difference in the soil water storage in the different months.
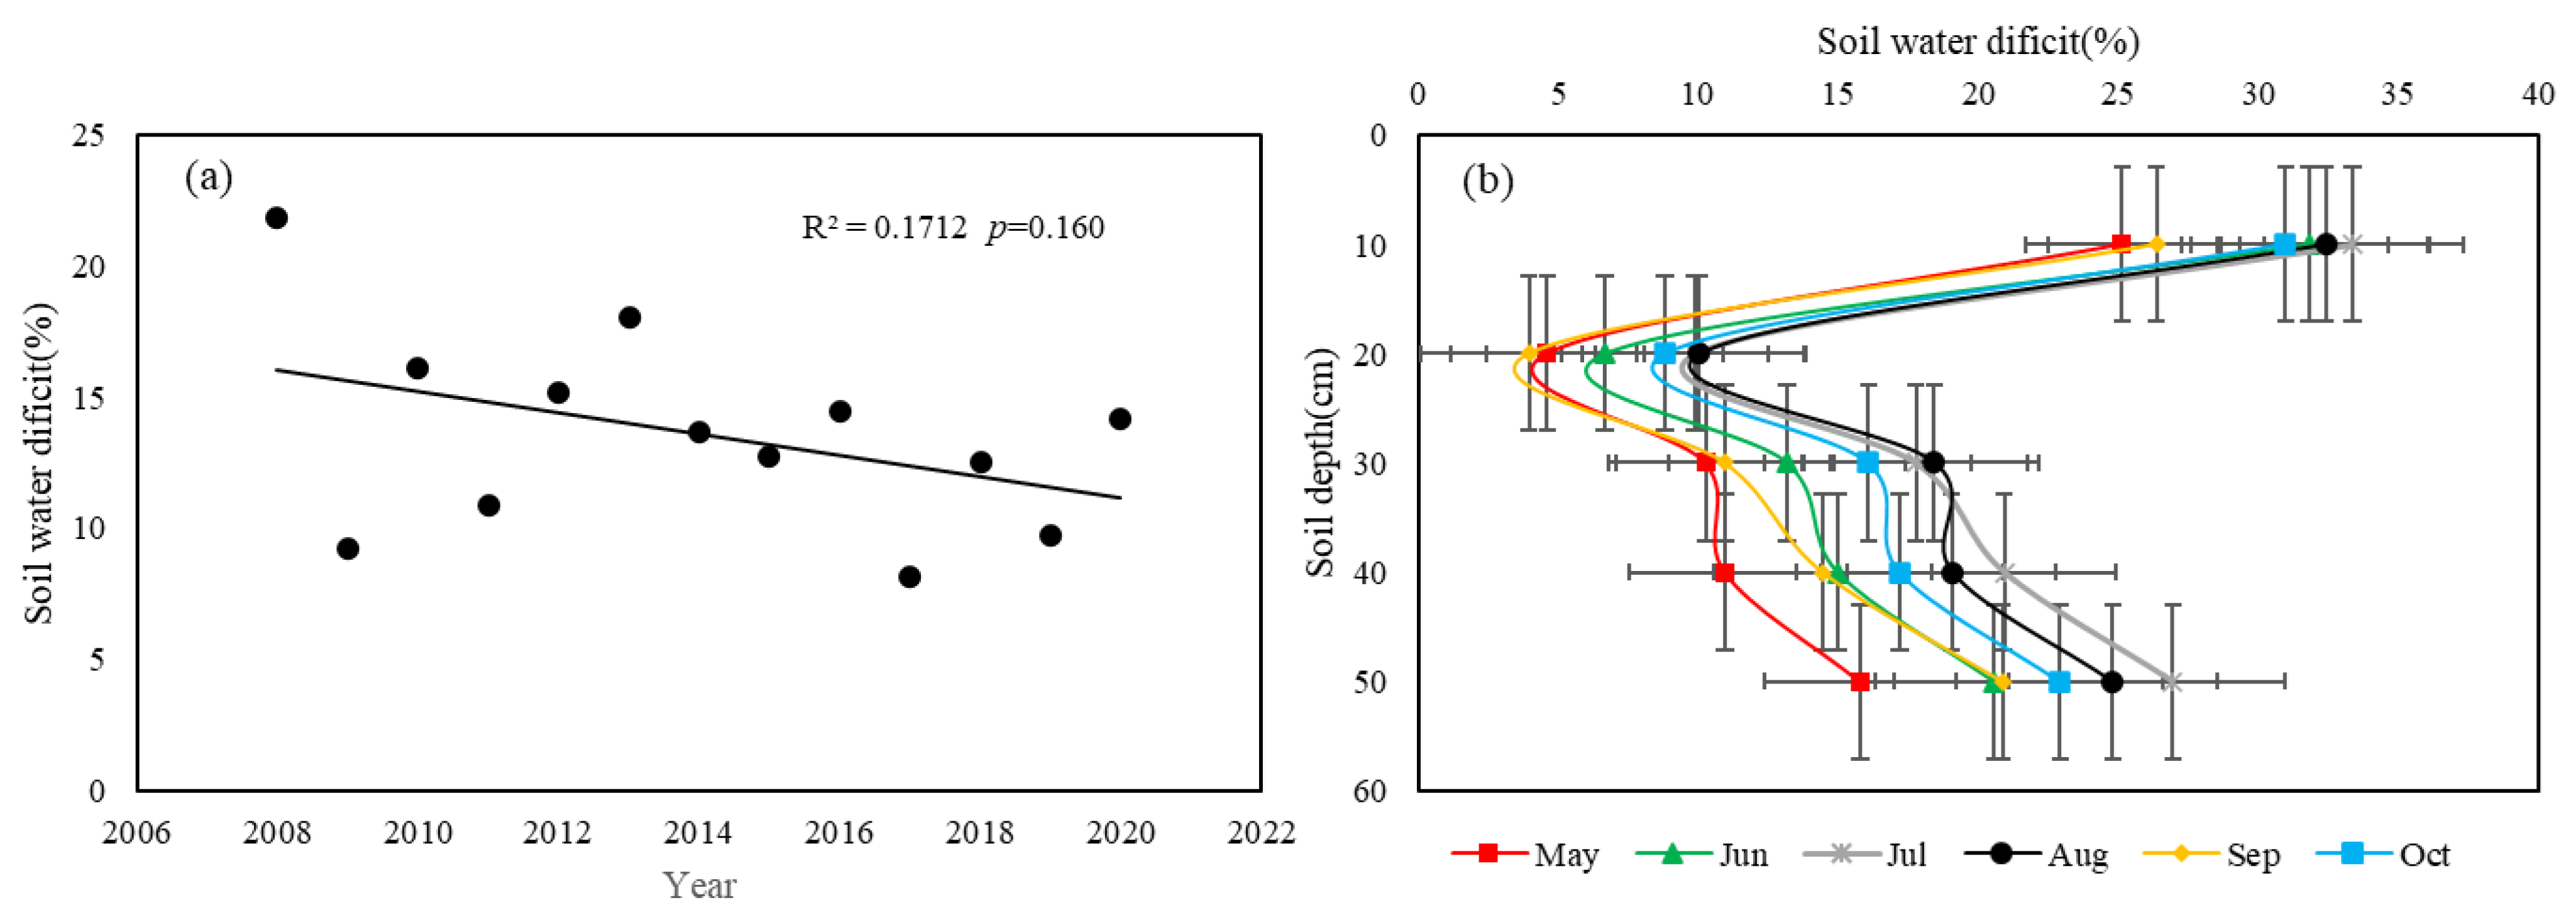
The soil water deficit showed insignificant declining trend in 2008–2020 (p = 0.16, Figure 5a). During the study period, the highest soil moisture deficit was 21% in 2008, and the lowest was only 8% in 2017 (Figure 5a). In the vertical direction, the soil water deficit displayed a decreasing trend first and then an increased trend, with a dramatized decreasing trend in 10–20 cm; in 20–50 cm, it showed gradual increased trend. In 10–20 cm soil depth, the soil moisture deficits were relatively similar during growing season; in 20–50 cm, the differences in the soil water deficit were evident among the months, with a minimum in May and maximum in July and August (Figure 5b).
3.3. Variation Characteristics of Evapotranspiration and Drought Index
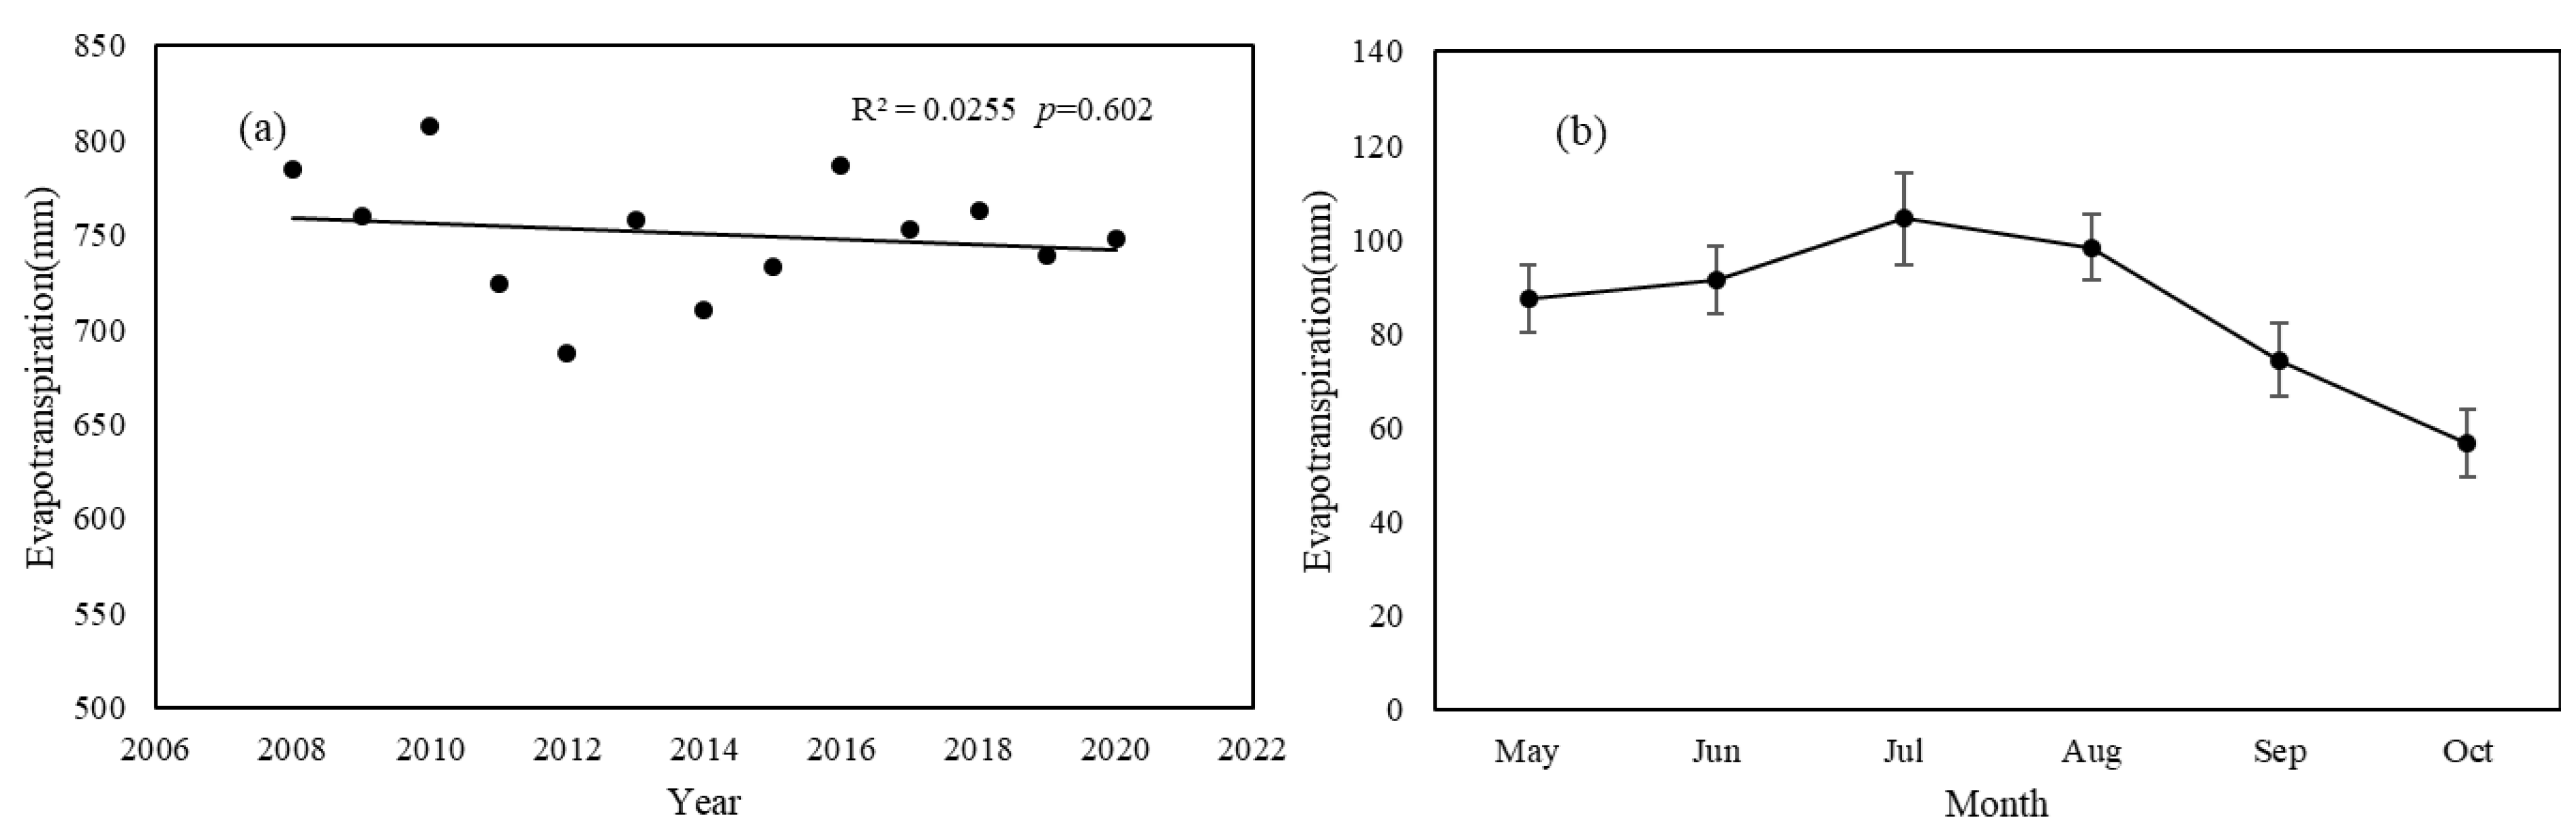
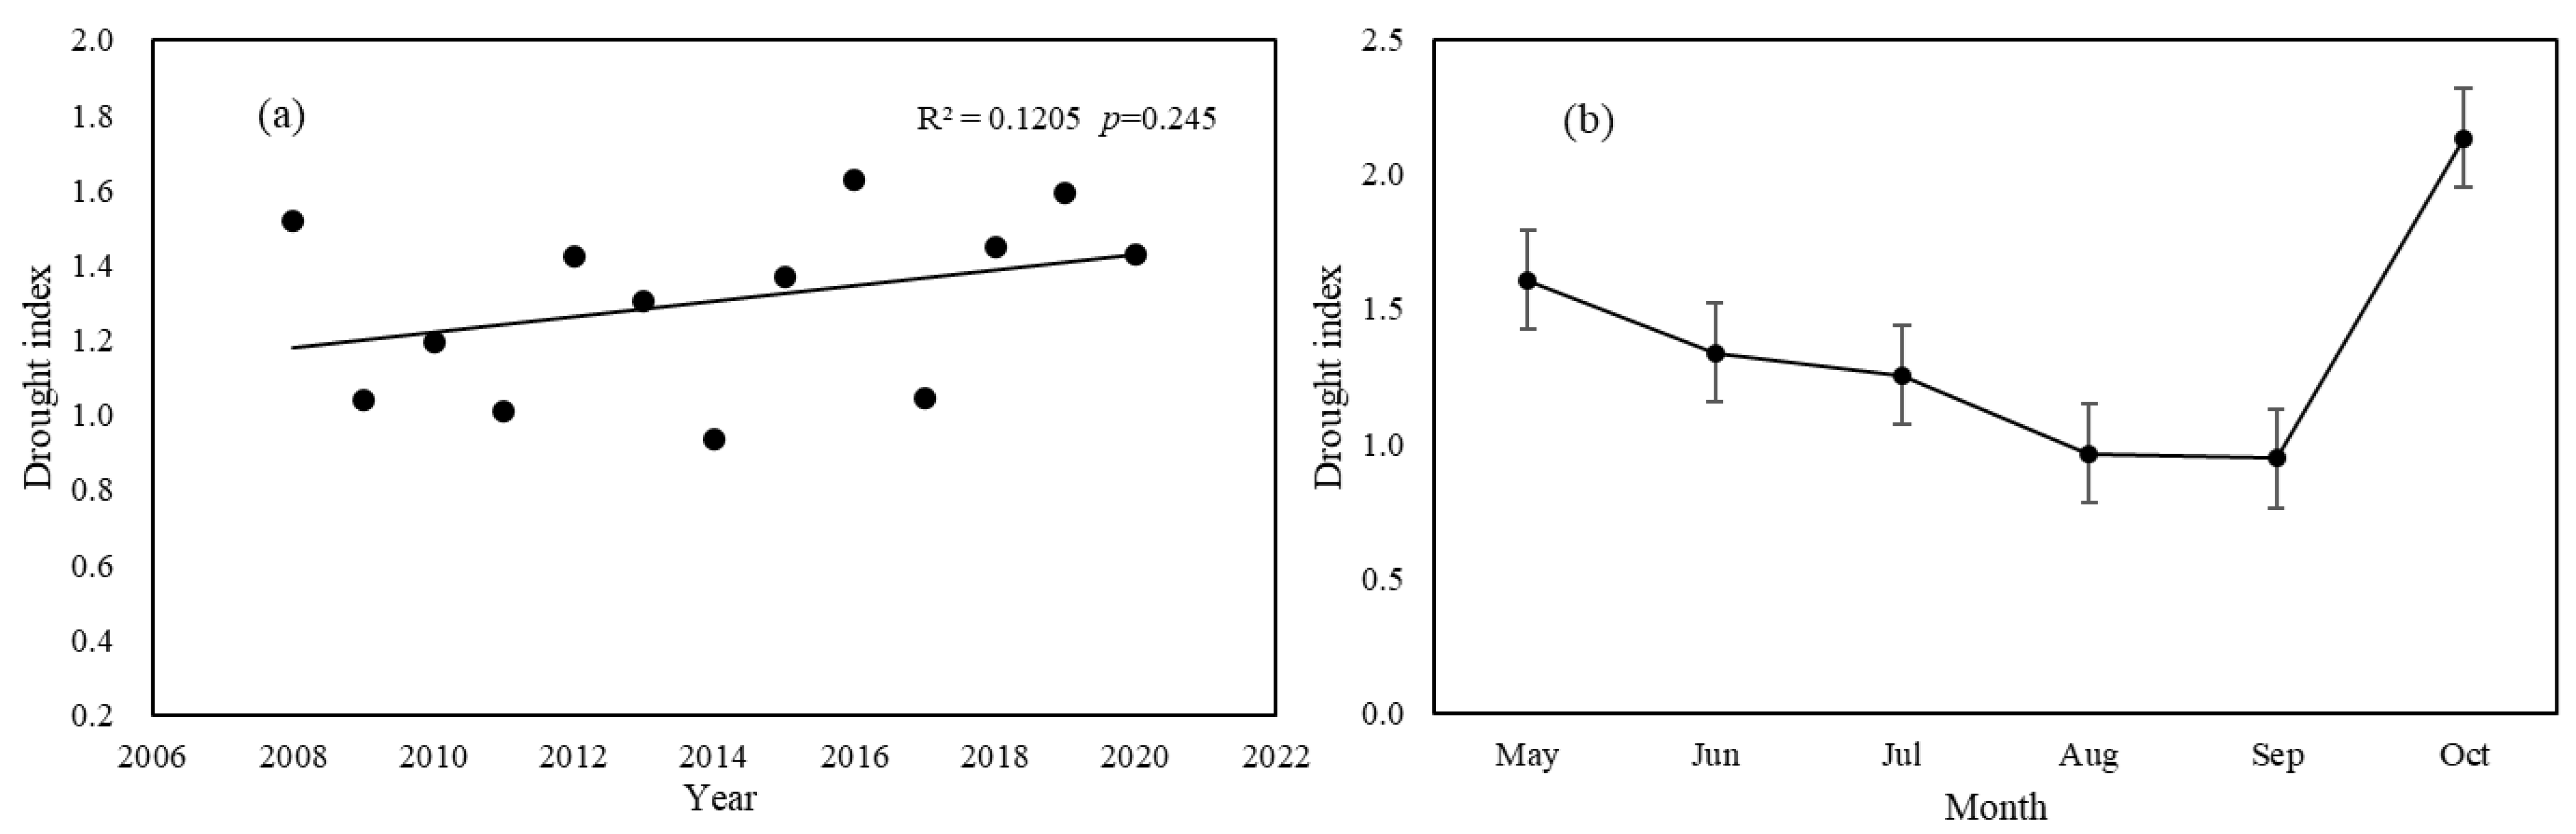
The evapotranspiration had an insignificantly decreasing trend (p = 0.602, Figure 6a); on the contrary, the drought index had an insignificantly decreasing trend (p = 0.245, Figure 7a). The multi-year average evapotranspiration was 750.41 ± 32.65 mm, with a maximum in 2010 of 807.94 mm and minimum in 2012 of 687.61 mm. The intra-annual trends of evapotranspiration and drought index were completely opposite. The evapotranspiration showed an inverted “V” (Figure 6b); the maximum evapotranspiration was 104.44 ± 9.87 mm in July, and minimum was 23.32 ± 5.73 mm in December. The drought index showed a U-shape, declined slowly from May to September, and rose sharply from September to October (Figure 7b).
3.4. Response of Soil Moisture Content to Single Rainfall Practices
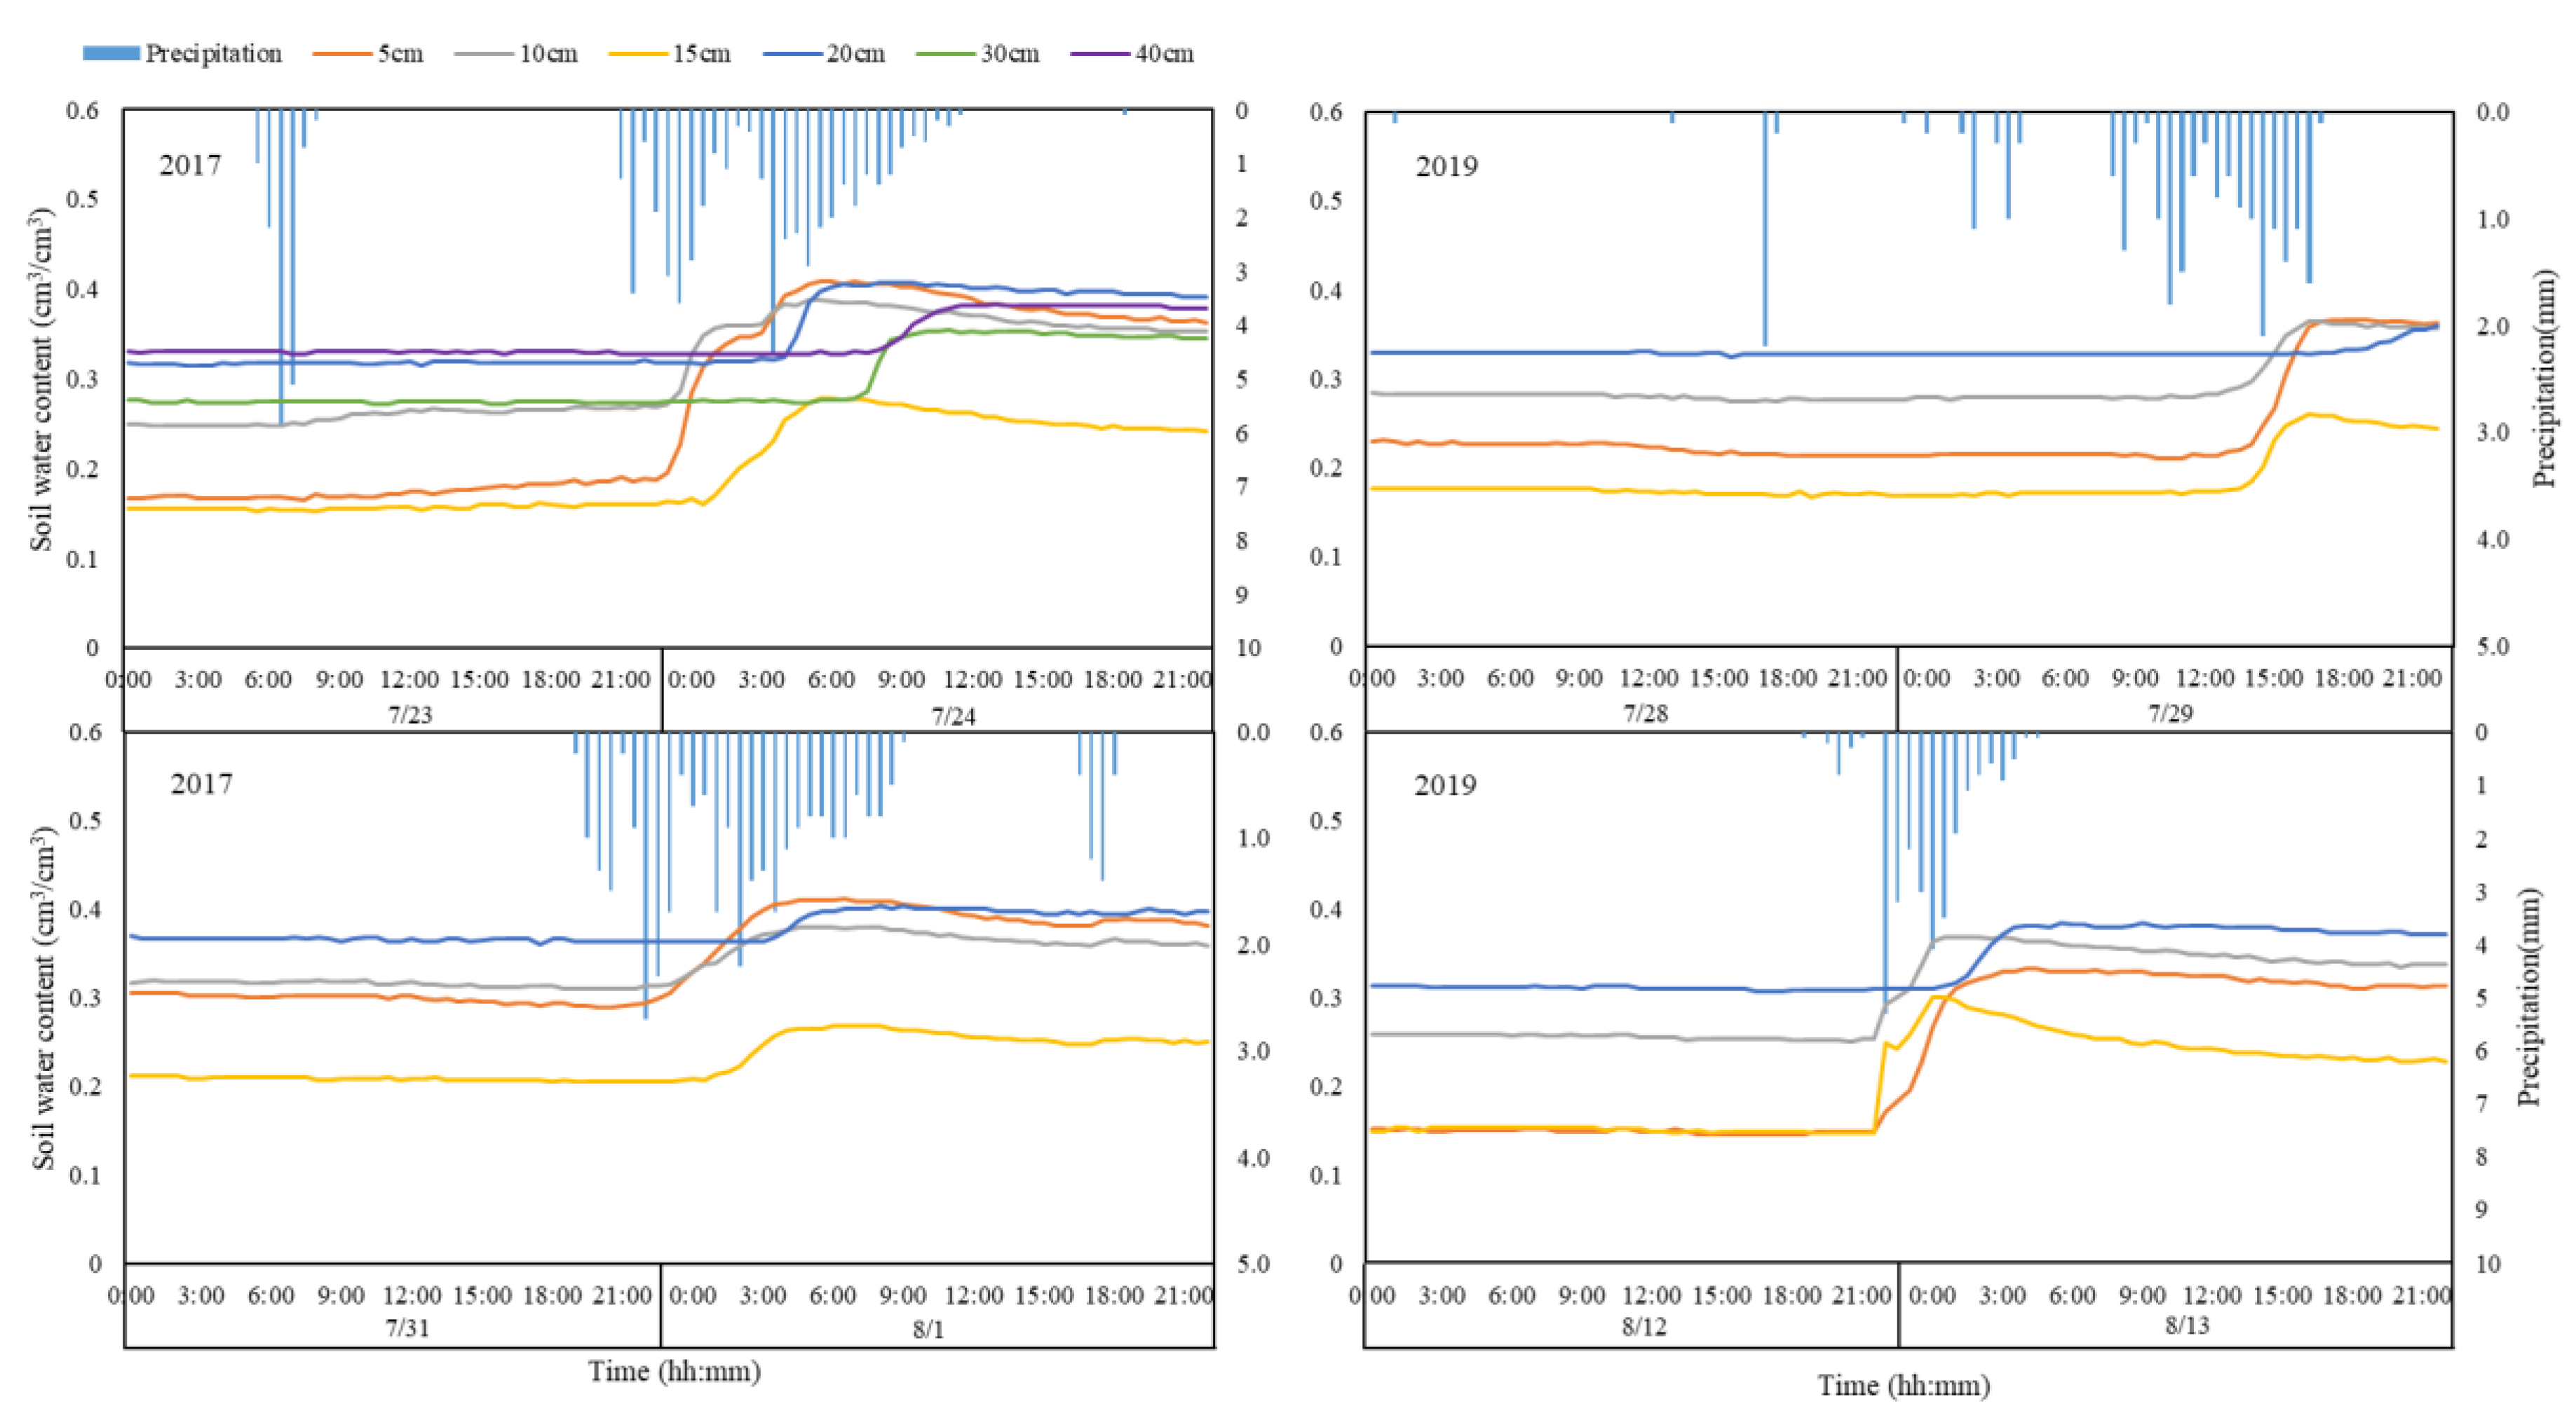
Infiltration of rainfall caused a rapid increase in soil water content. In order to investigate the response process of soil water content in different soil layers under different rainfall conditions, we selected four rainfall events in 2017 and 2019. When the rainfall amount reached 63.3 mm, rainfall could infiltrate to 40 cm soil depth and cause an increase in soil water content, and the soil moisture increment gradually decreased, with increasing depth of the soil layer (Table 1). When the rainfall was 34.5, 24, and 28.8 mm, the rainfall could only infiltrate up to 20 cm soil depth. One interesting phenomenon was that, when the rainfall was 34.4 mm, the soil moisture increment was less, compared with when the rainfall was 24 and 28.8 mm. This is due to the difference in initial soil water content (Table 1); the smaller the initial soil water content, the larger the soil water increment. With the increase of soil depth, the delay effect of soil moisture increment was more obvious (Figure 8). Take the rainfall event on 23–24 July 2017 as an example—the response time of the soil water content at 40 cm to rainfall was delayed 8 h, compared with that at 5 cm.
3.5. Effect of Environmental Factors on Soil Moisture Variability
In this study, eight meteorological factors (wind speed, temperature, humidity, precipitation, net radiation, soil heat flux, dew point temperature, and vapor pressure), as well as five biological elements (above-ground biomass, 0–10, 10–20, 20–30, and 30–40 cm underground biomass) were selected to carried out a correlation analysis. The results showed that five meteorological factors (temperature, humidity, net radiation, dew point temperature, and vapor pressure) and above-ground biomass had a significant effect on soil water content (p < 0.05). Temperature had a significant negative effect on soil water content of 0–50 cm depth. Humidity and net radiation had a significant effect on the soil water content, mainly in the shallow soil depth (0–10 cm). Dew point temperature and vapor pressure had a negative correlation for deep soil depth (30–50 cm). The above-ground biomass only had a positive correlation at 30–50 cm soil depth.
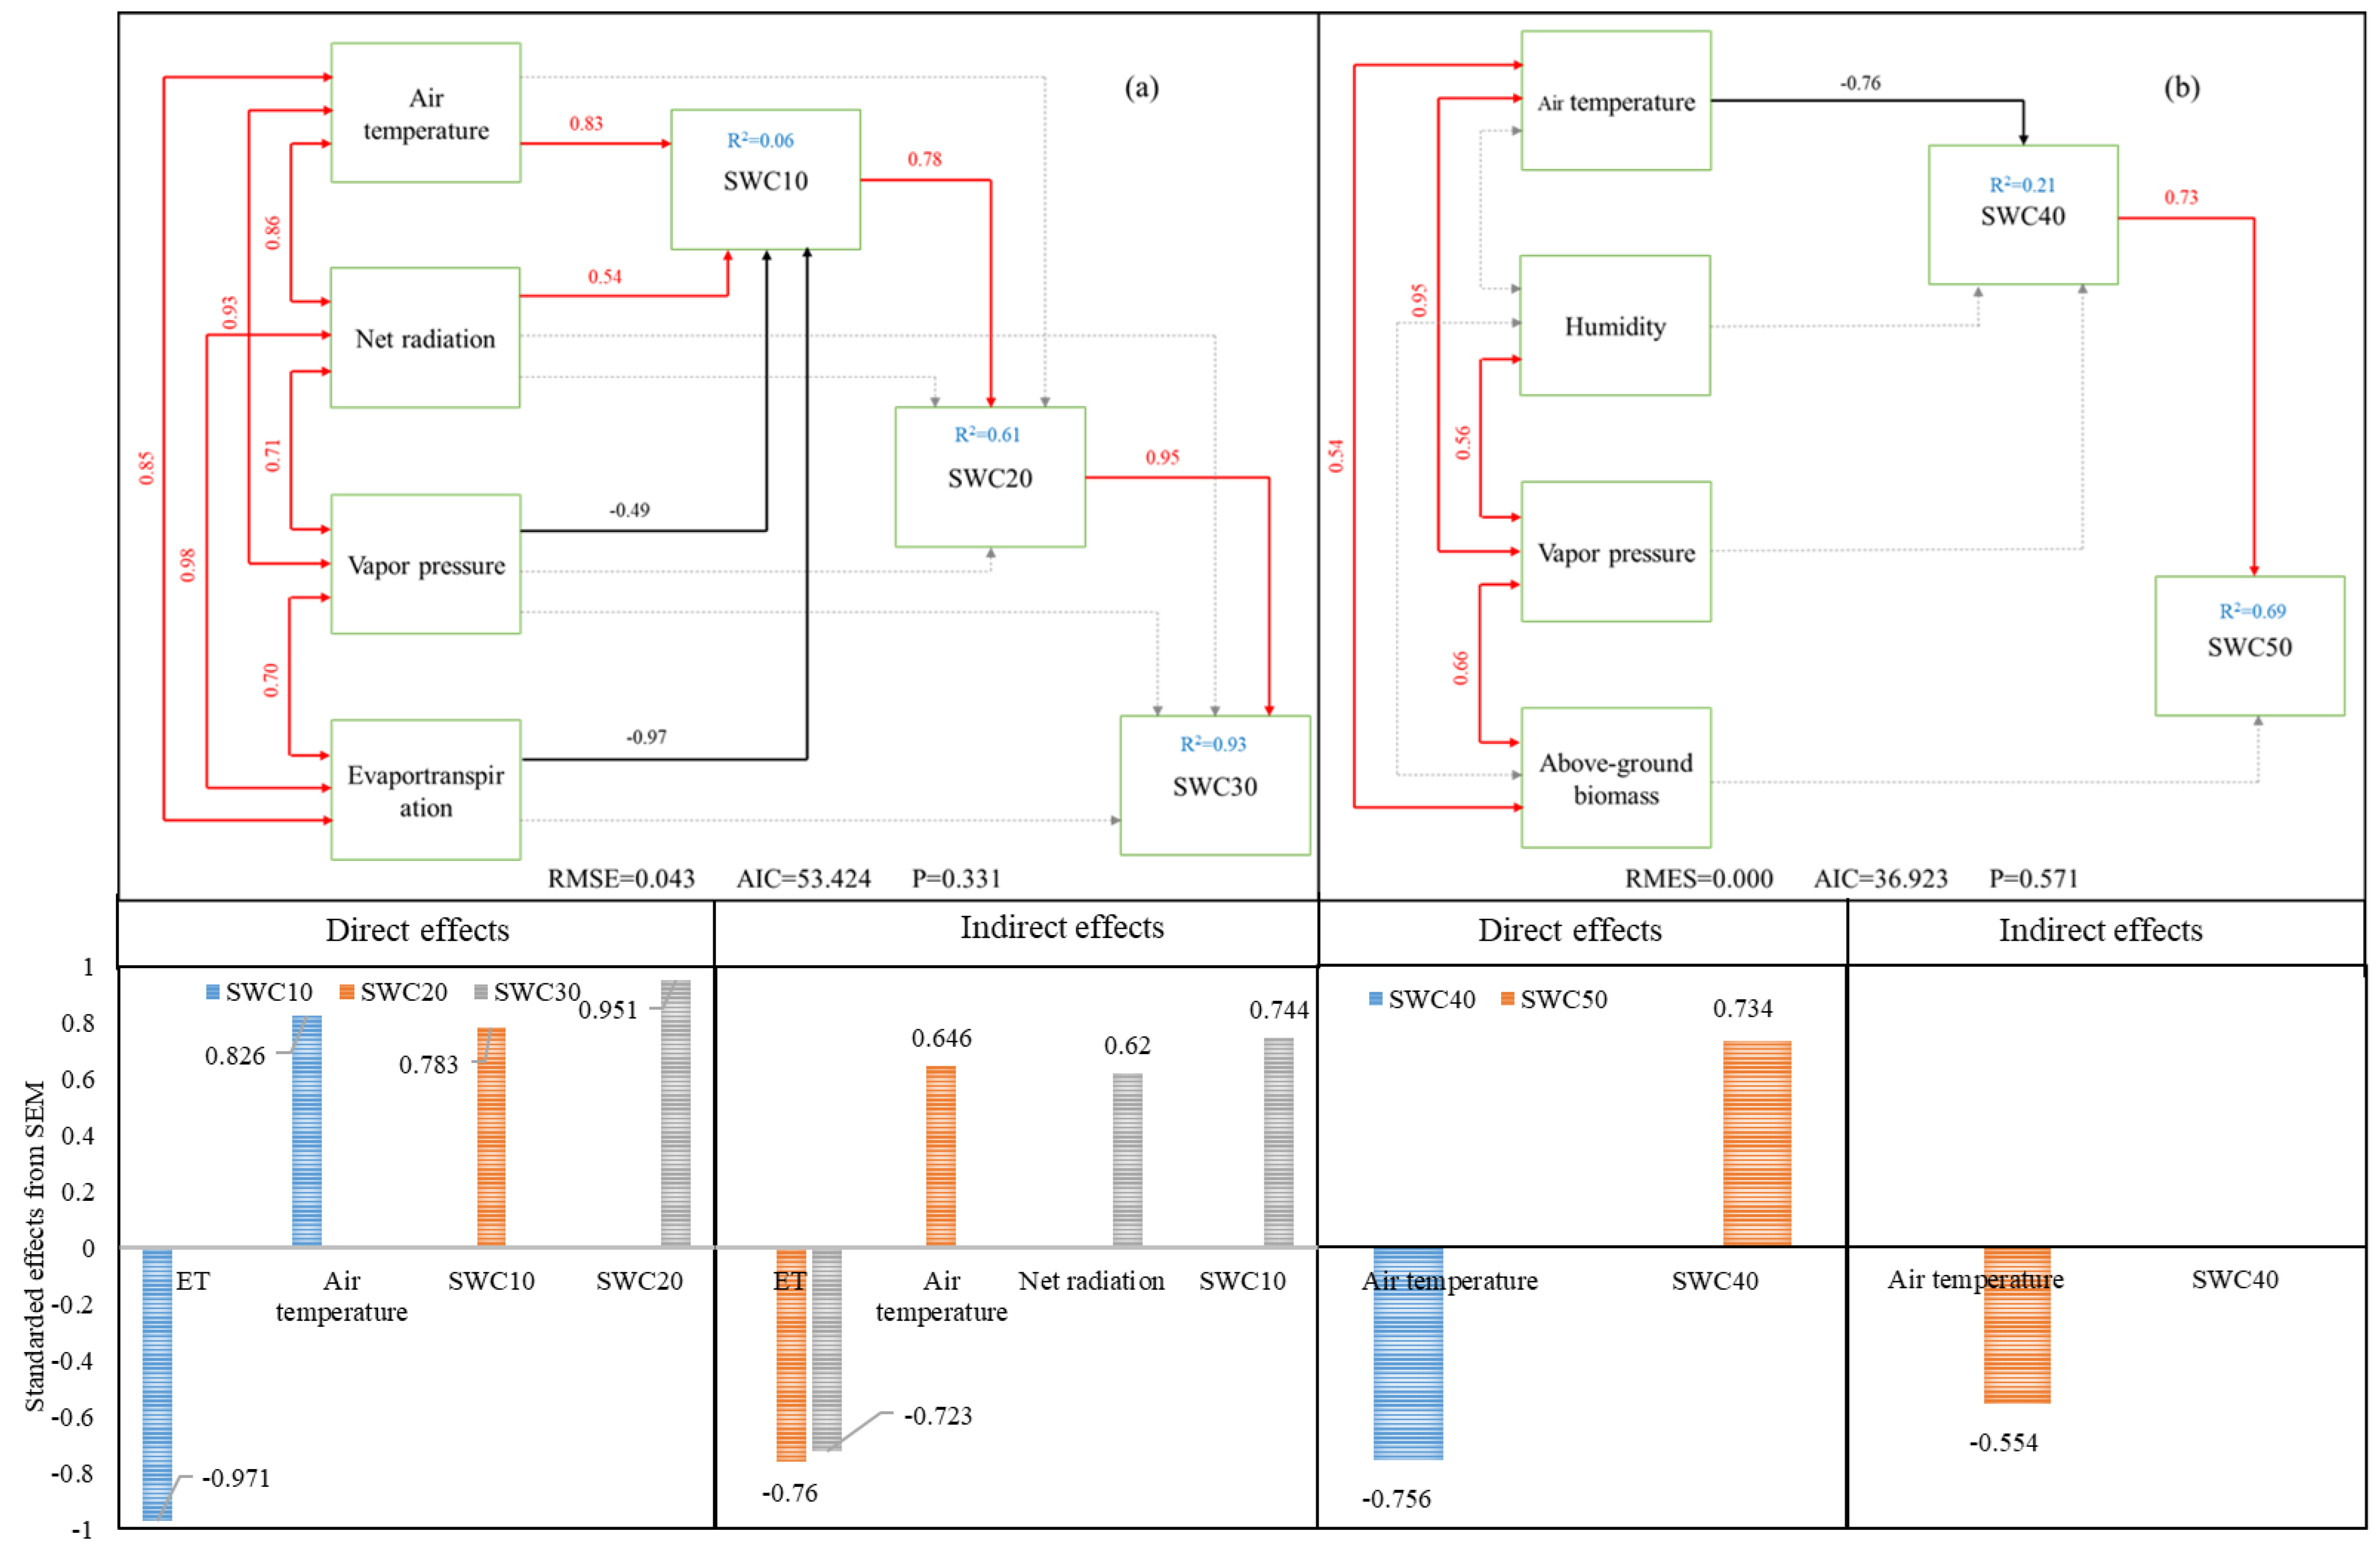
Through the correlation analysis, we confirmed that the factors significantly correlated with soil water content. To further confirm the effects of these factors to soil moisture variability, we used the SEM in the SPSS to quantitatively estimate the direct and indirect effects of meteorological factors and biological elements on soil moisture (Figure 9). In topsoil depth (0–30 cm), evapotranspiration had the strongest direct negative effect on soil moisture variability at 10 cm soil depth, and air temperature had the strongest direct positive effect. As for 20 and 30 cm soil depth, 10 and 20 cm soil water content had direct positive effects, ET and air temperature had indirect effects on the soil moisture variability of 20 cm soil depth, and net radiation and SWC10 had an indirect effect on SWC30. In the subsoil depth (40–50 cm), air temperature and SWC40 had direct effects on SWC40 and SWC50, and air temperature was the main indirect effect on SWC50.
Although SEM indicated the direct and indirect effects of environmental factors on the soil water content, the contribution of each factor to the variation in moisture was not clear. Dominance analysis can identify the individual contributions of each environmental factor on the soil water content. As Figure 10 shows, air temperature contributed the most to soil moisture variability at 0–50 cm soil depth, and the contributions in the 0–50 cm soil layer were 31.1%, 16.1%, 16%, 12.7%, and 19.5%, separately. Evapotranspiration was the second most important factor after air temperature in influencing soil moisture variability, and the contribution rates were 14.6%, 4.9%, 6.8%, 8.2%, and 1.7%. Combining the environmental factors, the largest contribution to the variation of soil water content at 10 cm was 57.7%, and the smallest contribution at 20 cm was 25.5%.
4. Discussion
4.1. Effects of Meteorological Factors on Soil Moisture Variability in This Study
In this study, all of the meteorological elements had no significant change trend, except the soil heat flux, and a decreased soil heat flux reflected a reduction in the release of heat from the soil to the atmosphere. In the alpine meadow on the Qinghai-Tibet Plateau, winter is the time that soil freezes and releases heat outward, and a decrease in the heat release reflected that the soil temperature increased in winter, and the frozen soil period was reduced. There were opposite trends in the temperature and soil water content, and a similar conclusion was reported in the alpine meadow on the northern Tibetan Plateau [17]. Evapotranspiration is the main factor caused soil moisture loss, and the reduced temperature inhibited the evapotranspiration process, especially on the shallow soil depth (0–10 cm) [4,45]. In this study, the soil moisture was higher, compared with the other alpine grassland ecosystem [17,46]. When the soil moisture increased, the rate of evaporation also and latent heat flux increased; correspondingly, the sensible heat flux and surface air temperature decreased, so the elevated soil moisture further reduced the temperature in the study area. However, other research showed there was a significant positive or negligible correlation between air temperature and soil moisture [4]; this is inconsistent with our results, and the discrepant results may be due to the altitude of the study area. In this study, the altitude was 3200 m; in Xie’s study [4], the altitude was 4500 m, and the max and min temperatures were 14.6 and 0.8 °C, respectively, in the growing season, which means that the soil water was frozen in most times of year, and elevated temperatures favored permafrost thawing, and the contribution to evapotranspiration was limited. Taken together, it was positive to keep soil moisture.
Precipitation is an important source of soil moisture [19,47]. Higher precipitation usually means higher soil moisture [48]; not only did the precipitation replenish soil moisture directly through infiltration, it also leaded to decreased air and soil temperatures, thus reducing evaporation and transpiration and increasing soil moisture [49]. However, in this study, there was no significant correlation between precipitation and soil moisture, which is different from other studies [50,51], and this may be due to the fact that precipitation is relatively little in the growing season. It has previously been shown that the maximum intensity rainfall can only affect the variability of soil moisture from 0–40 cm, with heavy daytime solar radiation and strong evapotranspiration in the study area. In addition, mattic epipedon hindered the infiltration of precipitation [52]. Overall, precipitation returns to the atmosphere in the form of evapotranspiration before it has time to infiltrate and replenish soil moisture, with a non-significant effect on soil moisture.
In previous research, the dew point temperature and water vapor pressure were rarely mentioned when exploring the influences of soil moisture. However, the role of dew point temperature and water vapor pressure in the ecosystem’s hydrological cycle are essential. Dew point temperature was confirmed to represent an actual measure of the available moisture in the atmosphere [53], and the vapor pressure deficit is the difference between saturation and actual water vapor pressure in the air. Alpine meadow is sensitive to vapor pressure and has become increasing vulnerable under climate changing, due to the strong influence of vapor pressure on evapotranspiration [54]. A previous study showed that the variations in vapor pressure can explain 29.5 to 52.3% of the variance in water use efficiency [55]. In this research, vapor pressure and dew point temperature had a significant effect on deep soil moisture (30–50 cm), as well as a non-significant contribution to shallow soil moisture variability. As we all know, temperature and vapor pressure are the main factors affecting evapotranspiration, and evapotranspiration is the main method of soil water loss. In this study, evapotranspiration was only significantly correlated with surface soil moisture (0–10 cm). This seems to contradict the effect of dew point temperature and water vapor pressure on soil moisture variation. This indicates that the interaction mechanism among dew point temperature, vapor pressure, and evapotranspiration need further exploration.
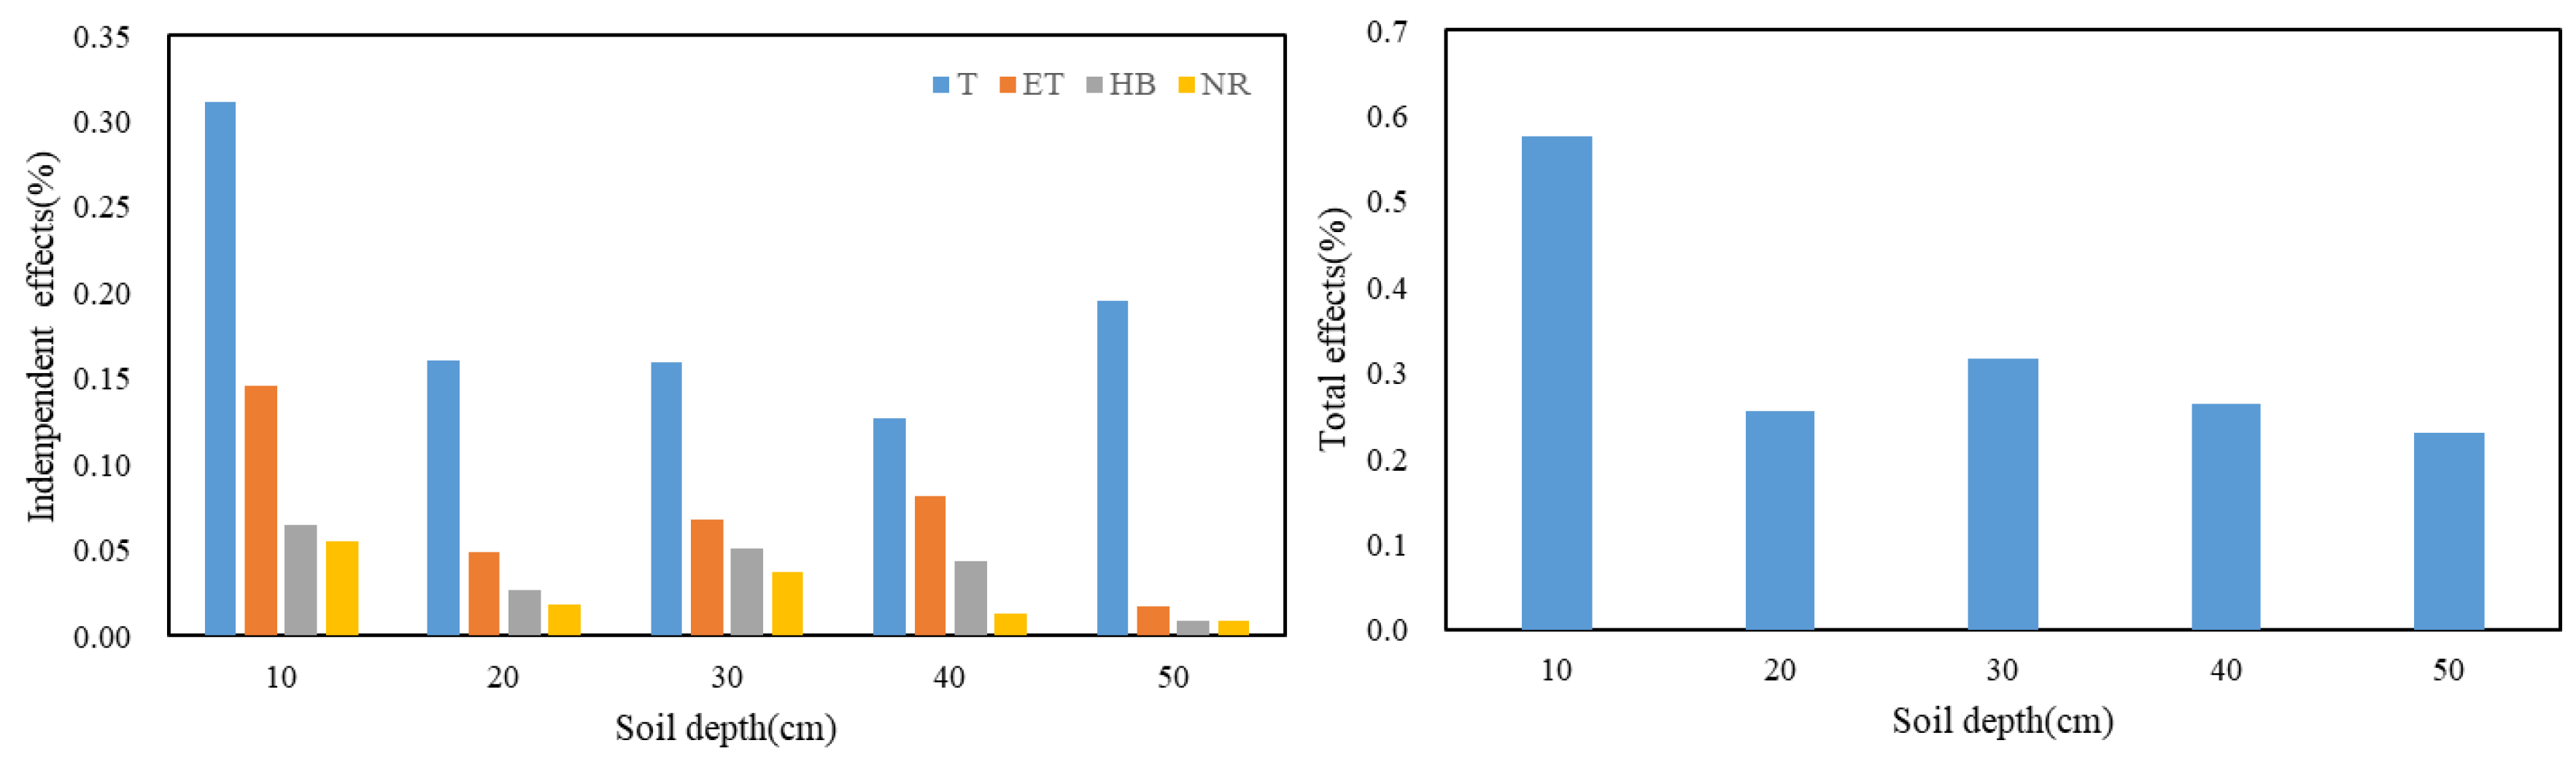
Droughts bring a profound effect on hydrological process of terrestrial ecosystems [56]. It is difficult to determine droughts’ onset, evolution, and end; therefore, it is very difficult to quantify their characteristics, in terms of intensity, duration, and spatial ex-tent [57]. Drought index is used to describe the drought properties by assimilating cli-mate factors, such as precipitation, temperature, and radiation [58,59]. In the past decade, the drought index showed an increasing trend (Figure 7a). Climate warming is advancing surface soil thawing in frozen soil areas [60,61,62], which may exacerbate soil water deficits and drought stress, due to increasing water loss through evapotranspiration [63]. Some studies have also shown that the potential evapotranspiration and drought degree of the Qinghai-Tibet plateau decreased from 1980 to 2014, and this difference may be due to the microclimate of the study area [64]. Although there was no significant correlation relationship between the precipitation and soil moisture, and evapotranspiration only had a negative effect to 0–10 cm soil water content in this study, the drought index had a significant negative correlation relationship with the soil water content (Figure 11), which means that the drought index may be a reliable indicator to confirm soil water storage under the climate change scenario.
4.2. Response of Above- and Below-Ground Vegetation to Soil Moisture Variability
From the correlation analysis in this study, it was clear that deep soil moisture (40–50 cm) had a significant negative effect on above-ground biomass (p < 0.05). More above-biomass usually means higher vegetation cover; vegetation cover enhanced the interception of precipitation and increased transpiration, which caused the reduction of soil moisture [65]. Different results were reported in Gu’s study [66], and the relationship between above-biomass and soil moisture was positive in the area for winner grazing. The relationship between the biomass and soil water content can be explain by the nutrient distribution [67,68]. In the study site, root biomass mainly distributed in 0–50 cm soil depth, and the root hair zone for water and inorganic salt uptake is mainly located at 30–50 cm soil depth. The soil moisture was higher than other ecosystems in this research [43]; high soil moisture enhances the salt leaching processes and raises the proportion of nutrients in deep soil depth [69]. More available nutrients increased the rate of photosynthesis and promoted the accumulation of above-ground biomass [70].
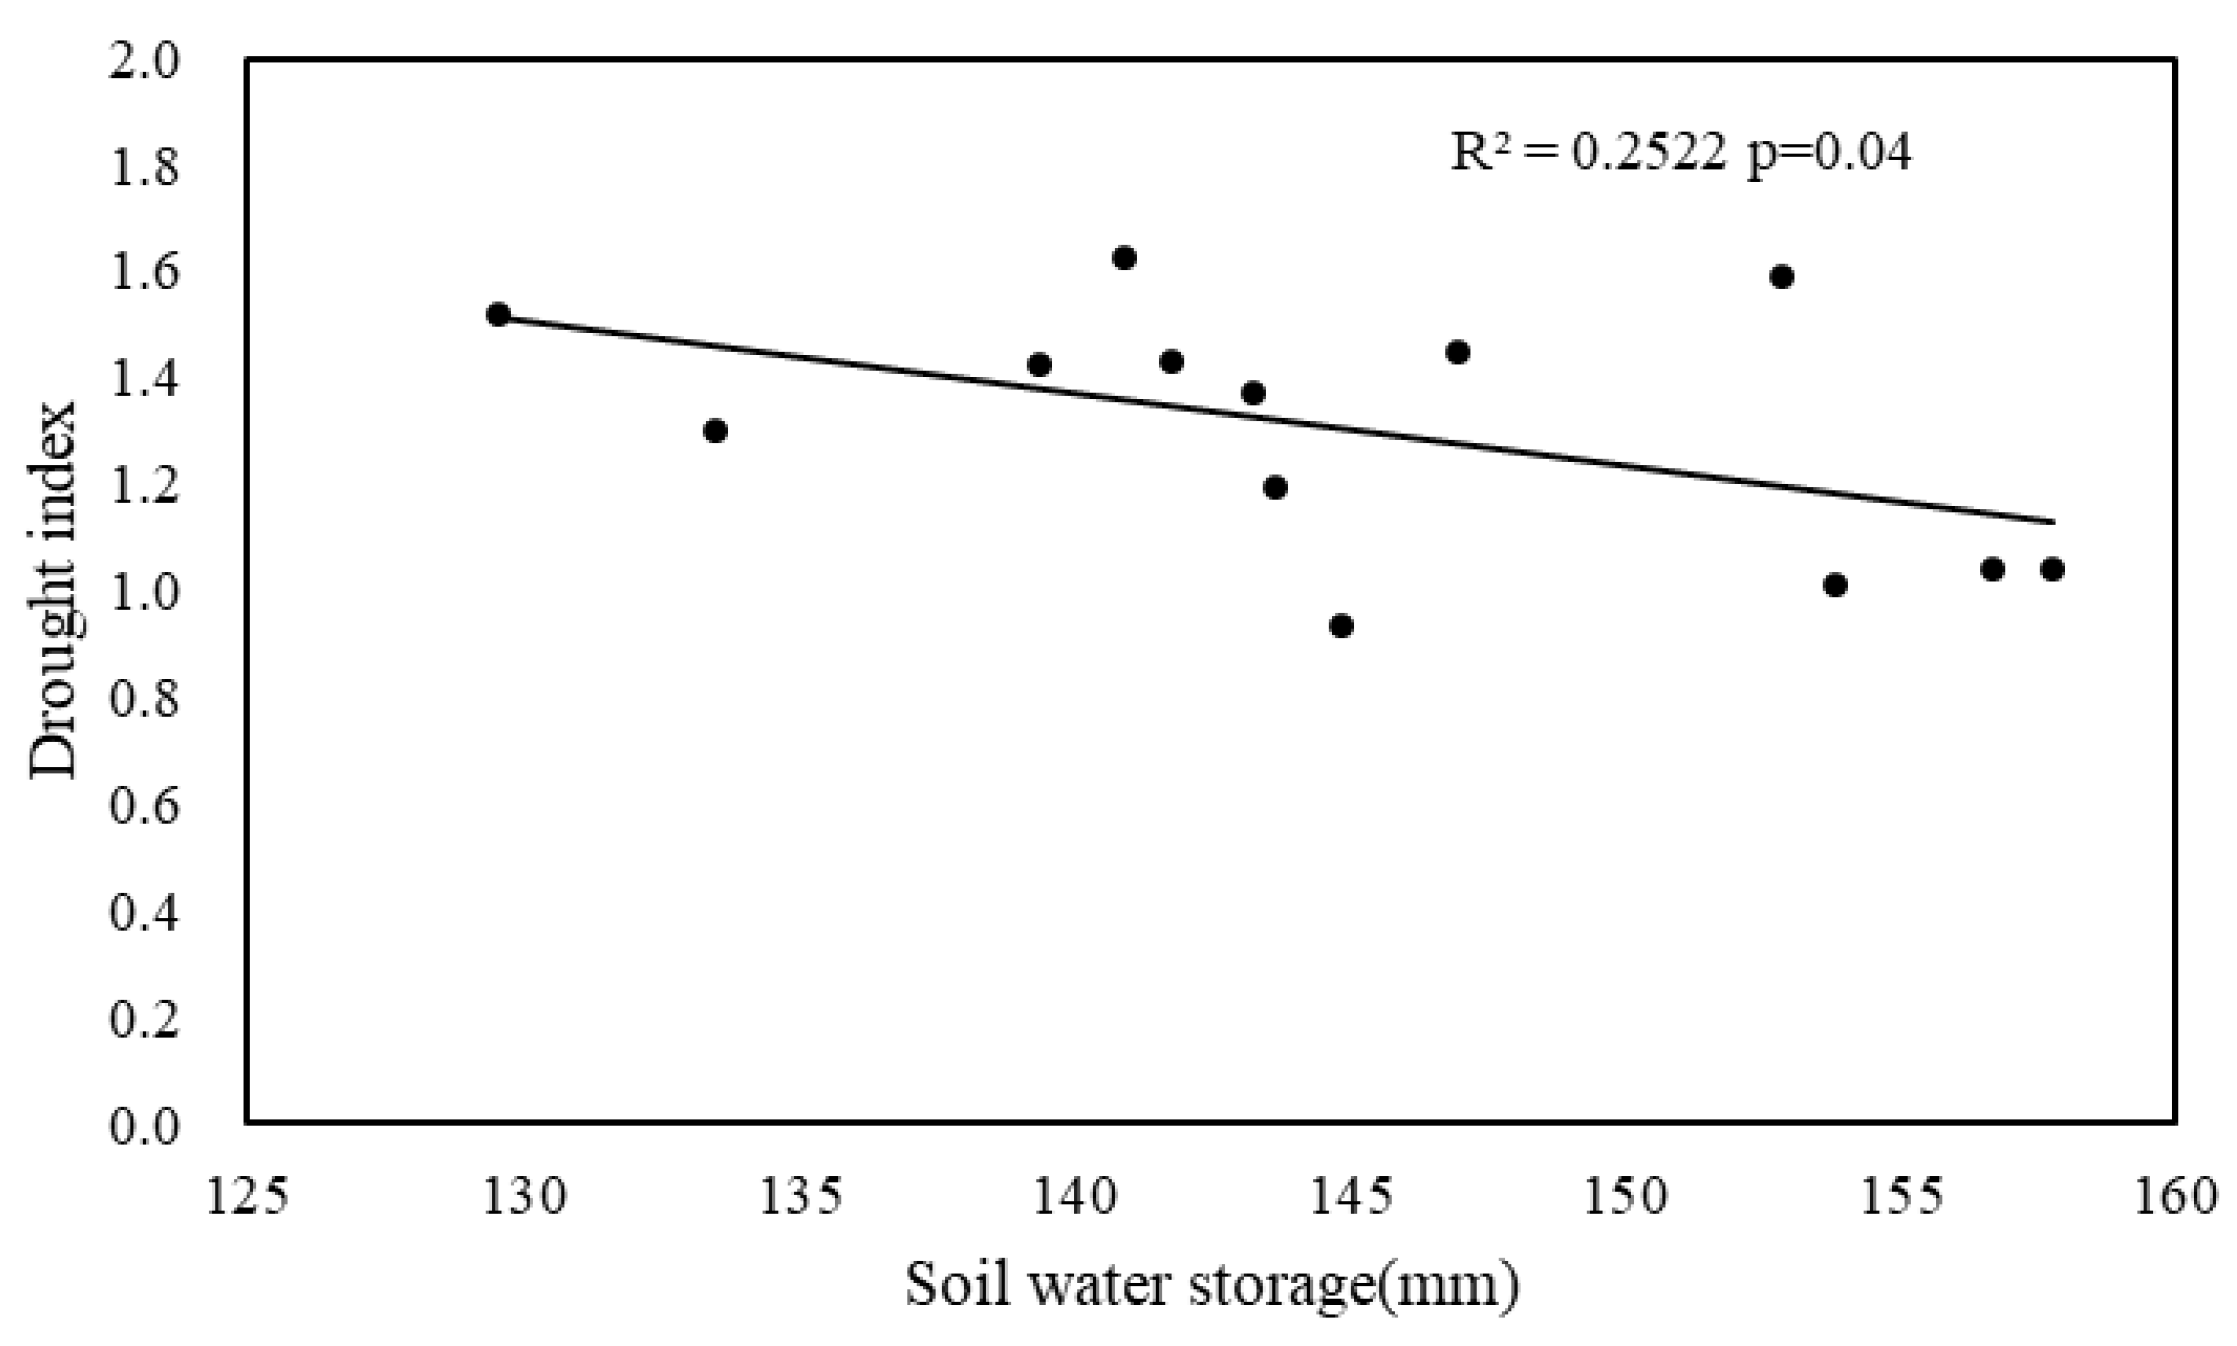
Root biomass have varied responses to soil moisture, compared to above-ground biomass. A previous study had indicated that increased soil water content significantly promoted the accumulation of root biomass [71]. It is possible that, compared to air temperature, soil temperature fluctuates less and increases with the depth of the soil layer. In a warm environment, moist soil conditions can enhance the rates of net nitrification and N mineralization, which benefits to plant growth [43]. On the hand, soil moisture controls the microbial community composition, and the rate of the decomposition of the root systems by microbial populations is an important factor that influences the below-ground biology [72]. In this study, only the soil water content in the 20 cm soil layer had a positive effect on the 0–10 cm underground biomass (Figure 12a). In the alpine grassland ecosystem, 0–10 cm below-ground accounted for more than 75% of total below-ground biomass, and the soil water content at 20 cm soil depth was lowest (Figure 5b). On the one hand, this showed the interception effect of mattic epipedon on the rainfall and evapotranspiration. On the other hand, this indicated that this soil layer was the main area for plant growth to obtain water. Although the effect of soil water content on below-ground biomass is limited by soil depth, the influence of wind speed on the underground biomass was throughout. For herbs, wind changes the leaf inclination, decreases occur in the leaf area index, photosynthesis decreases under long-term wind, and plants remove more biomass to below-ground, in order to adapt to the changed environment. Besides, wind sped up air flow and increased evaporation, and the loss of soil water drove the roots down to obtain more water.
5. Conclusions
The soil moisture of the alpine Kobresia meadow did not change significantly in 2008–2020. Among the meteorological factors affecting the soil water content, air temperature contributed the most to the soil moisture variation in deep soil, and humidity affected the soil moisture variation in the shallow soil. Precipitation can rapidly increase the soil water content. However, the positive effect of precipitation on soil water content is short-term, with no significant correlation between precipitation and soil water content at the monthly and annual scales. Above-biomass had a negative effect on the soil water content at 40–50 cm soil depth, and there was no significant correlation between underground biomass and soil water content. This research illustrated the soil moisture distribution characteristics of the alpine meadow ecosystem and revealed the influence of meteorological factors and plant growth on soil moisture variation. It provides data support and a theoretical basis for the study of the soil moisture variation process and vegetation succession trend for future climate change scenarios. Although the main factors affecting soil moisture variability were identified in this study, there are still some limitations: this study was only conducted in the Kobresia humilis community, which does not represent the alpine meadow ecosystem well. This study only considered the effects of meteorological and biomass factors on soil moisture variability. Grazing and soil properties are also important factors affecting soil moisture. This study used 13 years of time series data and cannot reflect the climate change in the study area. Due to these limitations, the mechanism of influence for the climatic and biological factors for soil moisture variability is still unclear. Based on this, the future scope should be based on long-term location monitoring, integrating multiple vegetation communities and exploring the mechanism of soil moisture variations, under the influence of multiple factors, as well as the response mechanism to climate change.
Author Contributions
Conceptualization, M.S. and X.G.; methodology, Y.L.; software, B.F.; validation, M.S.; formal analysis, M.S.; investigation, X.G.; resources, M.S.; data curation, M.S.; writing—original draft, M.S.; writing—review and editing, M.S. and X.G.; visualization, X.G.; supervision, G.C.; project administration, G.C.; funding acquisition, X.G. All authors have read and agreed to the published version of the manuscript.
Funding
This work was supported by the “National Natural Science Foundation of China (Y711641501)” to G.C. and “Natural Science Foundation of Qinghai (2021-HZ-811)” to X.G.
Institutional Review Board Statement
Not applicable.
Informed Consent Statement
Not applicable.
Data Availability Statement
Data sharing not applicable.
Acknowledgments
We are grateful to Jianshe Ge for the assistance in the data collection and routine maintenance of our instruments.
Conflicts of Interest
The authors declare no conflict of interest.
References
- Seneviratne, S.I.; Corti, T.; Davin, E.L.; Hirschi, M.; Jaeger, E.B.; Lehner, I.; Orlowsky, B.; Teuling, A.J. Investigating soil moisture–climate interactions in a changing climate: A review. Earth-Sci. Rev. 2010, 99, 125–161. [Google Scholar] [CrossRef]
- Sitch, S.; Smith, B.; Prentice, I.C.; Arneth, A.; Bondeau, A.; Cramer, W.; Kaplan, J.O.; Levis, S.; Lucht, W.; Sykes, M.T.; et al. Evaluation of ecosystem dynamics, plant geography and terrestrial carbon cycling in the LPJ dynamic global vegetation model. Glob. Chang. Biol. 2003, 9, 161–185. [Google Scholar] [CrossRef]
- Tyagi, J.V.; Qazi, N.; Rai, S.P.; Singh, M.P. Analysis of soil moisture variation by forest cover structure in lower western Himalayas, India. J. For. Res. 2013, 24, 317–324. [Google Scholar] [CrossRef]
- Xie, Q.; Li, J.; Zhao, Y. Effects of Air Temperature and Precipitation on Soil Moisture on the Qinghai-Tibet Plateau during the 2015 Growing Season. Adv. Meteorol. 2020, 2020, 4918945. [Google Scholar] [CrossRef]
- Albergel, C.; de Rosnay, P.; Gruhier, C.; Muñoz-Sabater, J.; Hasenauer, S.; Isaksen, L.; Kerr, Y.; Wagner, W. Evaluation of remotely sensed, modelled soil moisture products using global ground-based in situ observations. Remote Sens. Environ. 2012, 118, 215–226. [Google Scholar] [CrossRef]
- Dai, A. Increasing drought under global warming in observations, models. Nat. Clim. Chang. 2013, 3, 52–58. [Google Scholar] [CrossRef]
- Döll, P.; Fiedler, K.; Zhang, J. Global-scale analysis of river flow alterations due to water withdrawals, reservoirs. Hydrol. Earth Syst. Sci. 2009, 6, 126505–126506. [Google Scholar] [CrossRef]
- Wada, Y.; van Beek, L.P.H.; Wanders, N.; Bierkens, M.F.P. Human water consumption intensifies hydrological drought worldwide. Environ. Res. Lett. 2013, 8, 034036. [Google Scholar] [CrossRef]
- Wisser, D.; Fekete, B.M.; Vörösmarty, C.J.; Schumann, A.H. Reconstructing 20th century global hydrography: A contribution to the Global Terrestrial Network- Hydrology (GTN-H). Hydrol. Earth Syst. Sci. 2010, 14, 1–24. [Google Scholar] [CrossRef]
- Zhan, X.; Zheng, W.; Fang, L.; Liu, J.; Hain, C.; Yin, J.; Ek, M. A Preliminary Assessment of the Impact of SMAP Soil Moisture on Numerical Weather Forecasts from GFS and NUWRF Models; IEEE: Beijing, China, 2016; pp. 5229–5232. [Google Scholar]
- Feng, H. Individual contributions of climate and vegetation change to soil moisture trends across multiple spatial scales. Sci. Rep. 2016, 6, 32782. [Google Scholar] [CrossRef] [Green Version]
- Wentz, F.J.; Ricciardulli, L.; Kyle Hilburn, C.M. How Much More Rain Will Global Warming Bring? Science 2007, 317, 233–235. [Google Scholar] [CrossRef] [PubMed]
- Gao, Y.; Gao, J.; Wen, C.; Zhang, W. The Relationship between the Soil Water Condition and Vegetation Distribution Pattern in Yanchi. J. Northwest For. Coll. 2016, 21, 1–4. [Google Scholar]
- Guo, X.; Dai, L.; Li, Q.; Qian, D.; Cao, G.; Zhou, H.; Du, Y. Light Grazing Significantly Reduces Soil Water Storage in Alpine Grasslands on the Qinghai-Tibet Plateau. Sustainability 2020, 12, 2523. [Google Scholar] [CrossRef]
- Huang, Y.; Li, B.; Biswas, A.; Li, Z. Factors dominating the horizontal and vertical variability of soil water vary with climate and plant type in loess deposits. Sci. Total Environ. 2022, 811, 152172. [Google Scholar] [CrossRef]
- Han, G.; Wang, J.; Pan, Y.; Huang, N.; Zhang, Z.; Peng, R.; Wang, Z.; Sun, G.; Liu, C.; Ma, S.; et al. Temporal and Spatial Variation of Soil Moisture and Its Possible Impact on Regional Air Temperature in China. Water 2020, 12, 1807. [Google Scholar] [CrossRef]
- Zhang, S.-Y.; Li, X.-Y. Soil moisture and temperature dynamics in typical alpine ecosystems: A continuous multi-depth measurements-based analysis from the Qinghai-Tibet Plateau, China. Hydrol. Res. 2017, 49, 194–209. [Google Scholar] [CrossRef]
- Su, Z.; Wen, J.; Dente, L.; van der Velde, R.; Wang, L.; Ma, Y.; Yang, K.; Hu, Z. The Tibetan Plateau observatory of plateau scale soil moisture and soil temperature (Tibet-Obs) for quantifying uncertainties in coarse resolution satellite and model products. Hydrol. Earth Syst. Sci. 2011, 15, 2303–2316. [Google Scholar] [CrossRef]
- Liu, Y.; Liu, F.; Xu, Z.; Zhang, J.; Wang, L.; An, S. Variations of soil water isotopes and effective contribution times of precipitation and throughfall to alpine soil water, in Wolong Nature Reserve, China. Catena 2015, 126, 201–208. [Google Scholar] [CrossRef]
- Song, Y.; Lu, Y.; Guo, Z.; Xu, X.; Liu, T.; Wang, J.; Wang, W.; Hao, W.; Wang, J. Variations in Soil Water Content and Evapotranspiration in Relation to Precipitation Pulses within Desert Steppe in Inner Mongolia, China. Water 2019, 11, 198. [Google Scholar] [CrossRef]
- Yao, S.X.; Zhao, C.C.; Zhang, T.H.; Liu, X.P. Response of the soil water content of mobile dunes to precipitation patterns in Inner Mongolia, northern China. J. Arid. Environ. 2013, 97, 92–98. [Google Scholar] [CrossRef]
- Hao, L.; Sun, G.; Liu, Y.; Zhou, G.; Wan, J.; Zhang, L.; Niu, J.; Sang, Y.; He, J. Evapotranspiration and Soil Moisture Dynamics in a Temperate Grassland Ecosystem in Inner Mongolia, China. Trans. ASABE 2016, 59, 577–590. [Google Scholar]
- Wang, Y.; Zhang, Y.; Yu, X.; Jia, G.; Liu, Z.; Sun, L.; Zheng, P.; Zhu, X. Grassland soil moisture fluctuation and its relationship with evapotranspiration. Ecol. Indic. 2021, 131, 108196. [Google Scholar] [CrossRef]
- Chow, K.C.; Chan, J.C.L.; Shi, X.; Liu, Y.; Ding, Y. Time-lagged effects of spring Tibetan Plateau soil moisture on the monsoon over China in early summer. Int. J. Climatol. 2008, 28, 55–67. [Google Scholar] [CrossRef]
- Lin, X.; Zhao, H.; Zhang, S.; Li, X.; Gao, W.; Ren, Z.; Luo, M. Effects of animal grazing on vegetation biomass and soil moisture on a typical steppe in Inner Mongolia, China. Ecohydrology 2022, 15, e2350. [Google Scholar] [CrossRef]
- Liu, H.; Wu, J.; Tian, X.; Du, W. Dynamic of aboveground biomass and soil moisture as affected by short-term grazing exclusion on eastern alpine meadow of Qinghai-Tibet plateau, China. Chil. J. Agric. Res. 2016, 76, 321–329. [Google Scholar] [CrossRef]
- Yang, M.; Yao, T.; Gou, X.; Koike, T.; He, Y. The soil moisture distribution, thawing–freezing processes and their effects on the seasonal transition on the Qinghai–Xizang (Tibetan) plateau. J. Asian Earth Sci. 2003, 21, 457–465. [Google Scholar] [CrossRef]
- Wu, X.; Liu, G.; Li, X.; Ji, G.; Li, L.; Mao, N.; Xu, H.; Wu, X. Variation of Soil Moisture and Its Relation with Precipitation of Permafrost and Seasonally Frozen Soil Regions on the Qinghai-Tibet Plateau. J. China Hydrol. 2021, 41, 73–78, 101. [Google Scholar]
- Genxu, W.; Hongchang, H.; Guangsheng, L.; Na, L. Impacts of changes in vegetation cover on soil water heat coupling in an alpine meadow of the Qinghai-Tibet Plateau, China. Hydrol. Earth Syst. Sci. 2009, 13, 327–341. [Google Scholar] [CrossRef]
- Genxu, W.; Guangsheng, L.; Chunjie, L. Effects of changes in alpine grassland vegetation cover on hillslope hydrological processes in a permafrost watershed. J. Hydrol. 2012, 444–445, 22–33. [Google Scholar] [CrossRef]
- Sun, S.; Che, T.; Li, H.; Wang, T.; Ma, C.; Liu, B.; Wu, Y.; Song, Z. Water and carbon dioxide exchange of an alpine meadow ecosystem in the northeastern Tibetan Plateau is energy-limited. Agric. For. Meteorol. 2019, 275, 283–295. [Google Scholar] [CrossRef]
- Zhao, D.; Wu, S. Responses of vegetation distribution to climate change in China. Theor. Appl. Climatol. 2014, 117, 15–28. [Google Scholar] [CrossRef]
- Porporato, A.; Daly, E.; Rodriguez-Iturbe, I. Soil Water Balance and Ecosystem Response to Climate Change. Am. Nat. 2004, 164, 625–632. [Google Scholar] [CrossRef] [PubMed]
- Xue, X.; Peng, F.; You, Q.; Xu, M.; Dong, S. Belowground carbon responses to experimental warming regulated by soil moisture change in an alpine ecosystem of the Qinghai–Tibet Plateau. Ecol. Evol. 2015, 5, 4063–4078. [Google Scholar] [CrossRef]
- Chen, Y.; Wang, K.; Lin, Y.; Shi, W.; Song, Y.; He, X. Balancing green and grain trade. Nat. Geosci. 2015, 8, 739–741. [Google Scholar] [CrossRef]
- Wang, J.; Fu, B.; Qiu, Y.; Chen, L.; Wang, Z. Geostatistical analysis of soil moisture variability on Da Nangou catchment of the loess plateau, China. Environ. Geol. 2001, 41, 113–120. [Google Scholar] [CrossRef]
- Zhu, Q.; Lin, H. Influences of soil, terrain, and crop growth on soil moisture variation from transect to farm scales. Geoderma 2011, 163, 45–54. [Google Scholar] [CrossRef]
- Fang, X.; Zhao, W.; Wang, L.; Feng, Q.; Ding, J.; Liu, Y.; Zhang, X. Variations of deep soil moisture under different vegetation types and influencing factors in a watershed of the Loess Plateau, China. Hydrol. Earth Syst. Sci. 2016, 20, 3309–3323. [Google Scholar] [CrossRef]
- Suo, L.; Huang, M.; Zhang, Y.; Duan, L.; Shan, Y. Soil moisture dynamics and dominant controls at different spatial scales over semiarid and semi-humid areas. J. Hydrol. 2018, 562, 635–647. [Google Scholar] [CrossRef]
- Jiao, L.; An, W.; Li, Z.; Gao, G.; Wang, C. Regional variation in soil water and vegetation characteristics in the Chinese Loess Plateau. Ecol. Indic. 2020, 115, 106399. [Google Scholar] [CrossRef]
- Li, H.; Shen, W.; Zou, C.; Jiang, J.; Fu, L.; She, G. Spatio-temporal variability of soil moisture and its effect on vegetation in a desertified aeolian riparian ecotone on the Tibetan Plateau, China. J. Hydrol. 2013, 479, 215–225. [Google Scholar] [CrossRef]
- Zhang, T.; Xu, M.; Zhang, Y.; Zhao, T.; An, T.; Li, Y.; Sun, Y.; Chen, N.; Zhao, T.; Zhu, J.; et al. Grazing-induced increases in soil moisture maintain higher productivity during droughts in alpine meadows on the Tibetan Plateau. Agric. For. Meteorol. 2019, 269–270, 249–256. [Google Scholar] [CrossRef]
- Dai, L.; Guo, X.; Du, Y.; Ke, X.; Cao, Y.; Li, Y.; Cao, G.; Zhang, F. Thirteen-year variation in biomass allocation under climate change in an alpine Kobresia meadow, northern Qinghai–Tibetan Plateau. Grass Forage Sci. 2019, 74, 476–485. [Google Scholar] [CrossRef]
- Azen, R.; Traxel, N. Using Dominance Analysis to Determine Predictor Importance in Logistic Regression. J. Educ. Behav. Stat. 2009, 34, 319–347. [Google Scholar] [CrossRef]
- De Boeck, H.J.; Lemmens, C.M.H.M.; Gielen, B.; Bossuyt, H.; Malchair, S.; Carnol, M.; Merckx, R.; Ceulemans, R.; Nijs, I. Combined effects of climate warming and plant diversity loss on above- and below-ground grassland productivity. Environ. Exp. Bot. 2007, 60, 95–104. [Google Scholar] [CrossRef]
- Wang, X.; Yi, S.; Wu, Q.; Yang, K.; Ding, Y. The role of permafrost and soil water in distribution of alpine grassland and its NDVI dynamics on the Qinghai-Tibetan Plateau. Glob. Planet. Chang. 2016, 147, 40–53. [Google Scholar] [CrossRef]
- Hohenegger, C.; Brockhaus, P.; Bretherton, C.S.; Schär, C. The Soil Moisture–Precipitation Feedback in Simulations with Explicit and Parameterized Convection. J. Clim. 2009, 22, 5003–5020. [Google Scholar] [CrossRef]
- Zhang, Q.; Fan, K.; Singh, V.P.; Song, C.; Xu, C.-Y.; Sun, P. Is Himalayan-Tibetan Plateau “drying”? Historical estimations and future trends of surface soil moisture. Sci. Total Environ. 2019, 658, 374–384. [Google Scholar] [CrossRef]
- Cheng, S.; Guan, X.; Huang, J.; Ji, F.; Guo, R. Long-term trend and variability of soil moisture over East Asia. J. Geophys. Res. Atmos. 2015, 120, 8658–8670. [Google Scholar] [CrossRef]
- Deng, Y.; Wang, S.; Bai, X.; Luo, G.; Wu, L.; Chen, F.; Wang, J.; Li, Q.; Li, C.; Yang, Y.; et al. Spatiotemporal dynamics of soil moisture in the karst areas of China based on reanalysis and observations data. J. Hydrol. 2020, 585, 124744. [Google Scholar] [CrossRef]
- Luo, X.; Li, J.; Zhang, Y.; Jing, L.; Wang, Y.; Zhang, J. Response of Spatial and Temporal Variation of Soil Moisture to Precipitation Change in Desert Steppe. Res. Soil Water Conserv. 2021, 28, 142–150, 158. [Google Scholar]
- Zhang, W.; Yi, S.; Qin, Y.; Sun, Y.; Shangguan, D.; Meng, B.; Li, M.; Zhang, J. Effects of Patchiness on Surface Soil Moisture of Alpine Meadow on the Northeastern Qinghai-Tibetan Plateau: Implications for Grassland Restoration. Remote Sens. 2020, 12, 4121. [Google Scholar] [CrossRef]
- Ivancic, T.J.; Shaw, S.B. A U.S.-based analysis of the ability of the Clausius-Clapeyron relationship to explain changes in extreme rainfall with changing temperature. J. Geophys. Res. Atmos. 2016, 121, 3066–3078. [Google Scholar] [CrossRef]
- Zhang, H.; Dou, R. Interannual and seasonal variability in evapotranspiration of alpine meadow in the Qinghai-Tibetan Plateau. Arab. J. Geosci. 2020, 13, 968. [Google Scholar] [CrossRef]
- Wu, X.; Li, X.; Chen, Y.; Bai, Y.; Yaqin, T.; Wang, P.; Liu, H.; Wang, M.; Fangzhong, S.; Zhang, C.; et al. Atmospheric Water Demand Dominates Daily Variations in Water Use Efficiency in Alpine Meadows, Northeastern Tibetan Plateau. J. Geophys. Res. Biogeosci. 2019, 124, 2174–2185. [Google Scholar] [CrossRef]
- Sohrabi, M.M.; Ryu, J.H.; Abatzoglou, J.; Tracy, J. Development of Soil Moisture Drought Index to Characterize Droughts. J. Hydrol. Eng. 2015, 20, 04015025. [Google Scholar] [CrossRef]
- Vicente-Serrano, S.M.; Beguería, S.; López-Moreno, J.I. A Multiscalar Drought Index Sensitive to Global Warming: The Standardized Precipitation Evapotranspiration Index. J. Clim. 2010, 23, 1696–1718. [Google Scholar] [CrossRef]
- Mishra, A.K.; Singh, V.P. A review of drought concepts. J. Hydrol. 2010, 391, 202–216. [Google Scholar] [CrossRef]
- Zargar, A.; Sadiq, R.; Naser, B.; Khan, F.I. A review of drought indices. Environ. Rev. 2011, 19, 333–349. [Google Scholar] [CrossRef]
- Cheng, G.; Wu, T. Responses of permafrost to climate change and their environmental significance, Qinghai-Tibet Plateau. J. Geophys. Res. Earth Surf. 2007, 112. [Google Scholar] [CrossRef]
- Li, X.; Jin, R.; Pan, X.; Zhang, T.; Guo, J. Changes in the near-surface soil freeze–thaw cycle on the Qinghai-Tibetan Plateau. Int. J. Appl. Earth Obs. Geoinf. 2012, 17, 33–42. [Google Scholar] [CrossRef]
- Wu, Q.; Zhang, T.; Liu, Y. Permafrost temperatures and thickness on the Qinghai-Tibet Plateau. Glob. Planet. Chang. 2010, 72, 32–38. [Google Scholar] [CrossRef]
- Genxu, W.; Guangsheng, L.; Chunjie, L.; Yan, Y. The variability of soil thermal and hydrological dynamics with vegetation cover in a permafrost region. Agric. For. Meteorol. 2012, 162–163, 44–57. [Google Scholar] [CrossRef]
- Liang, J.; Zhang, B.; Ma, B.; Wei, H.; Zhang, J.; Ma, S. Drought evolution characteristics on the Tibetan Plateau based on daily standardized precipitation evapotranspiration index. J. Glaciol. Geocryol. 2018, 40, 1100–1109. [Google Scholar]
- Yuan-shou, L.I.; Gen-xu, W.; Lin, Z.; Qing-bai, W.U.; Yi-bo, W.; Ren-he, Z. Response of Soil Moisture in the Permafrost Active Layer to the Change of Alpine Meadow Coverage on the Tibetan Plateau. J. Glaciol. Geocryol. 2010, 32, 157–165. [Google Scholar]
- Gu, Y.; Li, D.; Hou, F. Relationship between soil moisture and biomass in grazing land of wapiti on an alpine steppe. Pratacultural Sci. 2019, 36, 1490–1497. [Google Scholar]
- He, Y. Changes of Biomass and Soil Nutrients in the Differently Degraded Alpine Salix paraqplesia Shrub Meadows. Acat Agric. Boreali-Occident. Sin. 2014, 23, 184–190. [Google Scholar]
- Wang, H.; Sun, J.; Li, W.; Wu, J.; Chen, Y.; Liu, W. Effects of soil nutrients and climate factors on belowground biomass in an alpine meadow in the source region of the Yangtze-Yellow rivers, Tibetan Plateau of China. J. Arid. Land 2016, 8, 881–889. [Google Scholar] [CrossRef]
- Lin, L.; Cao, G.; Xu, X.; Li, C.; Fan, B.; Li, B.; Lan, Y.; Si, M.; Dai, L. Changes and Relationships between Components in the Plant-Soil System and the Dominant Plant Functional Groups in Alpine Kobresia Meadows Due to Overgrazing. Diversity 2022, 14, 183. [Google Scholar] [CrossRef]
- Zhao, D.-D.; Ma, H.-Y.; Li, Y.; Wei, J.-P.; Wang, Z.-C. Effects of water and nutrient additions on functional traits and aboveground biomass of Leymus chinensis. Chin. J. Plant Ecol. 2019, 43, 501–511. [Google Scholar] [CrossRef]
- Ma, X.; Yan, Y.; Lu, X.; Wang, X. Dynamics of Belowground Biomass and Its Relationship with Soil Moisture in Alpine Grassland on the North Tibetan Plateau. Ecol. Environ. Sci. 2016, 25, 189–195. [Google Scholar]
- Frindte, K.; Pape, R.; Werner, K.; Löffler, J.; Knief, C. Temperature and soil moisture control microbial community composition in an arctic–alpine ecosystem along elevational and micro-topographic gradients. ISME J. 2019, 13, 2031–2043. [Google Scholar] [CrossRef] [PubMed]
Figure 1.
Geographical location of the study area.

Figure 2.
Change trend of meteorological elements from 2008 to 2020. (a) Indicates precipitation, (b) indicates air temperature, (c) indicates net radiation, (d) indicates humidity, (e) indicates dew point temperature, (f) indicates vapor pressure, (g) indicates wind speed, and (h) indicates soil heat flux.

Figure 3.
Inter- and intra-annual variation of soil water content. (a) Indicates interannual variation of soil water content, and (b) indicates months’ variation of soil water content in growth season.
Figure 3.
Inter- and intra-annual variation of soil water content. (a) Indicates interannual variation of soil water content, and (b) indicates months’ variation of soil water content in growth season.

Figure 4.
Inter- and intra-annual variation of soil water storage. (a) Indicates interannual variation of soil water storage, and (b) indicates months’ variation of soil water storage in growth season.
Figure 4.
Inter- and intra-annual variation of soil water storage. (a) Indicates interannual variation of soil water storage, and (b) indicates months’ variation of soil water storage in growth season.

Figure 5.
Inter-annual and vertical variation of soil water deficit. (a) Indicates interannual variation of soil water deficit, and (b) indicates vertical variation of soil water deficit in different of growth season.
Figure 5.
Inter-annual and vertical variation of soil water deficit. (a) Indicates interannual variation of soil water deficit, and (b) indicates vertical variation of soil water deficit in different of growth season.

Figure 6.
Inter- and intra-annual variation of evapotranspiration. (a) Indicates interannual variation of evapotranspiration, and (b) indicates months’ variation of soil water deficit.
Figure 6.
Inter- and intra-annual variation of evapotranspiration. (a) Indicates interannual variation of evapotranspiration, and (b) indicates months’ variation of soil water deficit.

Figure 7.
Inter- and intra-annual variation of drought index. (a) indicates interannual variation of evapotranspiration, (b) indicates months’ variation of soil water deficit in growth season.
Figure 7.
Inter- and intra-annual variation of drought index. (a) indicates interannual variation of evapotranspiration, (b) indicates months’ variation of soil water deficit in growth season.

Figure 8.
Soil water content response process to rainfall.

Figure 9.
The direct and indirect effects of environmental factors on soil water content from a structure equation models (SEM). (a) SEMs for the topsoil (030 cm) and (b) subsoil (40–50 cm). Arrowheads indicate the hypothesized direction of causation. Red and black arrows reflect positive and negative relationships, respectively. Grey dotted arrows indicate insignificant relationship. The numbers adjacent to the arrows are the standardized path coefficients. R2 is the proportion of the variation explained by all paths. Meteorological, biological, and soil moisture were monthly-average values in growth season. SWC10, SWC20, SWC30, SWC40, and SWC50 indicate soil water content at the soil depths of 10, 20, 30, 40, and 50 cm, respectively.

Figure 10.
Independent and total effects of environmental factors on soil water content.

Figure 11.
Relationship between soil water storage and drought.

Figure 12.
Relationship between soil water content of 20 cm soil depth and 0–10 cm below-ground biomass (a), 10–20 cm below-ground biomass (b), 20–30 cm below-ground biomass (c) and 30–40 cm below-ground biomass (d), between wind speed and 0–10 cm below-ground biomass (e), 10–20 cm below-ground biomass (f), 20–30 below-ground biomass (g), 30–40 cm below-ground biomass (h).


Table 1.
Response of soil moisture content to rainfall during a single rainfall event.
| Date | Soil Depth | Precipitation | Initial Soil Water Content | Soil Moisture Increment |
|---|---|---|---|---|
| cm | mm | (cm3/cm3) | (cm3/cm3) | |
| 23–24 July 2017 | 5 | 63.3 | 0.167 | 0.242 |
| 10 | 0.248 | 0.140 | ||
| 15 | 0.156 | 0.122 | ||
| 20 | 0.318 | 0.090 | ||
| 30 | 0.274 | 0.080 | ||
| 40 | 0.331 | 0.053 | ||
| 31 July–1 August 2017 | 5 | 34.5 | 0.291 | 0.116 |
| 10 | 0.31 | 0.069 | ||
| 15 | 0.208 | 0.060 | ||
| 20 | 0.367 | 0.038 | ||
| 28–29 July 2019 | 5 | 24.0 | 0.215 | 0.154 |
| 10 | 0.28 | 0.089 | ||
| 15 | 0.172 | 0.093 | ||
| 20 | 0.327 | 0.040 | ||
| 12–13 August 2019 | 5 | 28.8 | 0.146 | 0.184 |
| 10 | 0.252 | 0.116 | ||
| 15 | 0.148 | 0.138 | ||
| 20 | 0.308 | 0.074 |
Publisher’s Note: MDPI stays neutral with regard to jurisdictional claims in published maps and institutional affiliations. |
© 2022 by the authors. Licensee MDPI, Basel, Switzerland. This article is an open access article distributed under the terms and conditions of the Creative Commons Attribution (CC BY) license (https://creativecommons.org/licenses/by/4.0/).
Share and Cite
MDPI and ACS Style
Si, M.; Guo, X.; Lan, Y.; Fan, B.; Cao, G. Effects of Climatic Variability on Soil Water Content in an Alpine Kobresia Meadow, Northern Qinghai–Tibetan Plateau, China. Water 2022, 14, 2754. https://doi.org/10.3390/w14172754
AMA Style
Si M, Guo X, Lan Y, Fan B, Cao G. Effects of Climatic Variability on Soil Water Content in an Alpine Kobresia Meadow, Northern Qinghai–Tibetan Plateau, China. Water. 2022; 14(17):2754. https://doi.org/10.3390/w14172754
Chicago/Turabian StyleSi, Mengke, Xiaowei Guo, Yuting Lan, Bo Fan, and Guangmin Cao. 2022. "Effects of Climatic Variability on Soil Water Content in an Alpine Kobresia Meadow, Northern Qinghai–Tibetan Plateau, China" Water 14, no. 17: 2754. https://doi.org/10.3390/w14172754
Note that from the first issue of 2016, this journal uses article numbers instead of page numbers. See further details here.