Article

Brown Trout Upstream Passage Performance for a Fishway with Water Drops between Pools beyond Fish Passage Design Recommendations

by
Francisco Javier Bravo-Córdoba
1,*,
Juan Francisco Fuentes-Pérez
2,
Ana García-Vega
1,
Francisco Jesús Peñas
3,
José Barquín
3 and
Francisco Javier Sanz-Ronda
2
1
Centro Tecnológico Agrario y Agroalimentario Itagra.ct, Avenida de Madrid 44, Campus La Yutera, 34004 Palencia, Spain
2
Area of Hydraulics and Hydrology, Department of Agroforestry Engineering, University of Valladolid, Avenida de Madrid 44, Campus La Yutera, 34004 Palencia, Spain
3
IHCantabria—Instituto de Hidráulica Ambiental de la Universidad de Cantabria, Avda. Isabel Torres 15, Parque Científico y Tecnológico de Cantabria, 39011 Santander, Spain
*
Author to whom correspondence should be addressed.
Water 2022, 14(17), 2750; https://doi.org/10.3390/w14172750
Submission received: 22 July 2022 / Revised: 26 August 2022 / Accepted: 1 September 2022 / Published: 3 September 2022
(This article belongs to the Special Issue Advances and Experiences in Fishway Design and Assessment)

Abstract

:
This work aims to assess brown trout (Salmo trutta) passage through a free-flow pool-weir-type fishway with hydrodynamic notches and extreme water drops between pools. It consists of an old-school fishway design, commonly constructed in salmon rivers of Spain during the period of 1950–1980. To assess their performance, a field test was designed with confined trial conditions during the spawning migratory season. The mean water drop between pools was 0.65 m and the total water height considered for the trial was 11.8 m. The monitoring was carried out using PIT telemetry. The initial hypothesis, considering the fishway design and assessment guidelines, classified this structure as hardly insurmountable. Results showed an ascent success of 19% with a median transit time of 29.1 min/m of ascended height. Larger fish and fishway sections with lower values of volumetric power dissipation were related to a better performance in the passage. The results suggest that in certain circumstances, such as limited construction areas where other design or management options are difficult to implement (e.g., canyons), this type of fishway may be an alternative for the upstream passage of at least a small proportion of the brown trout population, although a selection effect is expected.

1. Introduction

River fragmentation caused by man-made structures is one of the major threats affecting freshwater fish [1,2]. Since the implementation of the European Water Framework Directive, the restoration of river connectivity is a key measure for achieving the good ecological status of water bodies [3] and EU state members are required to ensure it. This is even more relevant in rivers with the presence of migratory species included in the Habitats Directive [4]. However, no specifications are established on how to successfully restore the river connectivity, with the construction of fishways being one of the most extended solutions to date. Most of the transposition of the Directives to EU member states’ legislation does not establish nor recommend a specific fishway type, as it is understood that the most efficient solution is case-dependent. Although there are many fishway typologies, pool-weir fishways (also named step-pool fishways) are the most commonly used [5,6,7], despite their variable efficiency [8,9,10].
Pool-weir fishways consist of a succession of pools separated by cross-walls arranged in a stepped pattern, equipped with orifices, notches, and/or slots, which are used by the fish to move from pool to pool. The cross-walls split the total height of the obstacle into smaller drops, ideally providing hydraulic conditions compatible with the target ichthyofauna [11].
Depending on the boundary conditions in the river, fishways present different working modes [12,13,14]. In the case of pool-weir fishways consisting of notches, they can operate under two well-differentiated regimes based on the water level of the pools and water drop in the cross-walls: (1) plunging (also called weir or nappe) flow, where the main current is oriented towards the bottom of the pools and the water level in the downstream pool is generally below the crest of the notch, and (2) streaming (also called skimming) flow, where the main current remains at the top of the pools and a surface stream appears to flow over the crest of the notches [7,11,15]. Likewise, it is also possible to define different sub-regimes and/or transitional flows within these two main regimes [14], either due to changes in the discharge magnitude and/or variations in the headwater or tailwater levels, resulting in non-uniform profiles [16,17]. This brings another dimension of complexity to fishway design, as it is also required to select the working regimen. Nonetheless, it is difficult to establish the best regimen, as their effects on a fish’s ascent through fishways have been scarcely studied and/or compared. The few existing studies concerning these regimens show a significantly better performance for cyprinids in streaming flows [18], a better fishway attraction for eels with plunging flows [19], and no differences in the case of salmonids [20], although lower performance has been observed during transitional flow conditions [21].
In the case of plunging flow, the water drop between pools plays an important role in the fish passage, as there is no contact between upstream and downstream water levels in a cross-wall and thus, fish are forced to swim through the nappe or to jump. Considering this, the use of fishways with plunging performance should be reserved for good swimmers and jumpers, such as salmonids [6,11]. Although the most recognized fishway design guidelines recommend maximum values of water drops between pools of 0.20–0.30 m, they also suggest that wider limits (0.50–0.60 m) could be acceptable for large salmonids [6,11]. Fishway experiments with adult Atlantic salmon (Salmo salar) in Norwegian rivers with plunging performance and water drops around the maximum limits (0.50–0.60 m) showed high rates of passage (mean total height of the fishways assessed was 7.3 m) [22]. Another extreme example with brook trout (Salvelinus fontinalis) demonstrated passage occurrences over a water drop greater than 70 cm [23]. However, to the best of our knowledge, there are no more study cases for other fish species under such extreme design conditions.
A water drop in the cross-wall higher than usual recommendations (but always within admissible swimming limits) may have some benefits in the fishway passage. For example, it can enhance the fish motivation, as it will generate a more distinctive flow pattern and higher water velocities in the fishway entrance, improving the attraction efficiency [10,24] and, in turn, increasing the fishway entry attempts. On the contrary, higher water drops may limit the entrance and passage of weaker swimmers, due to a greater water velocity (water drop is proportional to maximum velocity in the cross-wall) and turbulence [11,17,25], which may cause disorientation or increase the energy demand of fish [26,27,28].
The successful passage in fishways with plunging flows also depends on other geometrical and hydraulic parameters, for instance, the notch width (at least 60 cm to ensure a successful jumping [29]), or the water depth in the pool (at least 1.25 times the water drop [30] or 1–2 times the fish body length [23,31]). In addition, the depth of the water nappe over the weir can be also decisive. Depending on the flow conditions, it can allow the fish to swim through the nappe instead of jumping, for instance in adherent nappes of hydrodynamic notches [32]. Furthermore, other environmental and physical factors may also interact and generate more or less favorable conditions for the passage, such as the angle of jumping [32], the fish length [33,34,35,36], or the water temperature [37], among others.
Taking into account the current fishway design trends and most extended fishway guidelines, to date no fishway engineer will propose as a design alternative a pool-weir fishway with notches working under plunging flow and extreme water drops. However, during the late 19th and the 20th century, due to the great interest in salmon fishing and the difficult access (cliffs and canyons) and working conditions (bedrock) in their migration paths, this type of structure was considered the only alternative to recover the longitudinal connectivity, frequently lost due to the presence of hydropower facilities which are common in these mountain streams. Under those circumstances, “salmon ladders” were born [38]. To date, despite the presence of these old-school fishways, the scientific evidence of their performance is still not well documented. Nevertheless, connectivity is a must for long-distance migrating species such as Salmo salar and both anadromous and potamodromous Salmo trutta (Annex II of the Habitats Directive and vulnerable in [39], and therefore a priority of conservation in the European Union). This is especially relevant in the southern limits of these species, as it happens in the Cantabrian rivers of the Iberian Peninsula.
Considering the above and the lack of information about the biological performance of this fishway type, in this study we try to go a step forward by studying the brown trout (Salmo trutta) passage in a pool-weir fishway with hydrodynamic notches, plunging flow, and high water drops between pools (0.4–0.74 m), in a representative salmon river of the Iberian Peninsula (Cares River) in the southern limit of the distribution of Atlantic populations of anadromous salmonids. Potamodromous brown trout is the most abundant species in the study section, and it has been considered a sibling species to Atlantic salmon and anadromous brown trout, which have fewer distribution problems. Experiments with this species will help in knowing whether the fish passage is functional for native salmonids. The specific goals were: (1) to characterize the upstream fish passage through the main metrics (ascent success, transit time, transit time by fishway section, and a motivation index: time between the beginning of the trial and the first attempt); (2) to illustrate the main effect on the passage metrics of the principal biometric characteristics (body length and condition factor); and (3) to analyze possible influence of main hydraulic parameters such as water drops (and thus, the velocity at the notches) and volumetric power dissipation (VPD) in the passage.
Results from the study are relevant for the fishway design in locations with important space constraints, such as canyon sections, or with high economical limitations (the greater the water drop, the lower the number of pools) when other more fish-friendly solutions are not feasible.

2. Materials and Methods
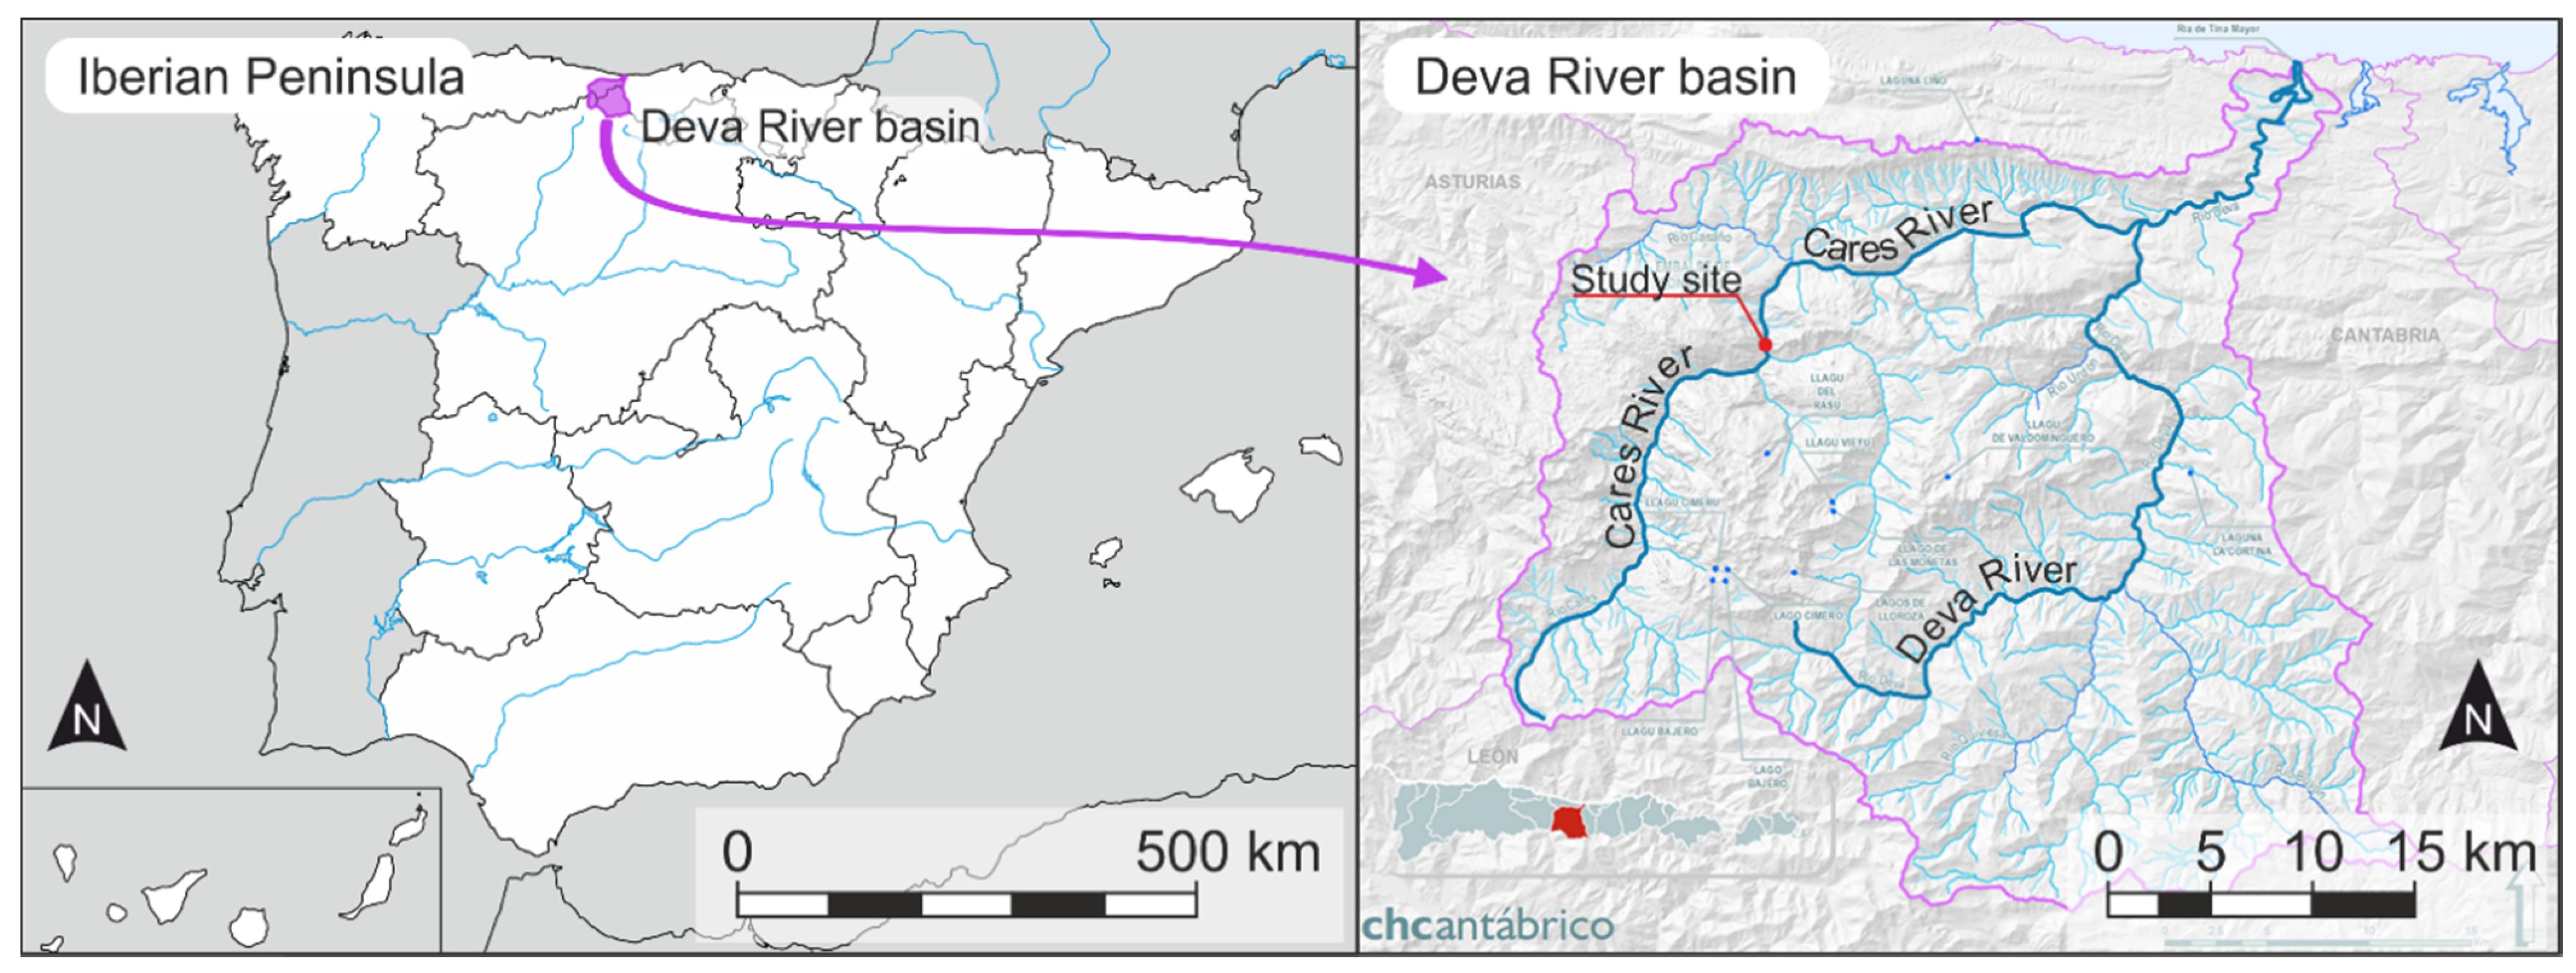
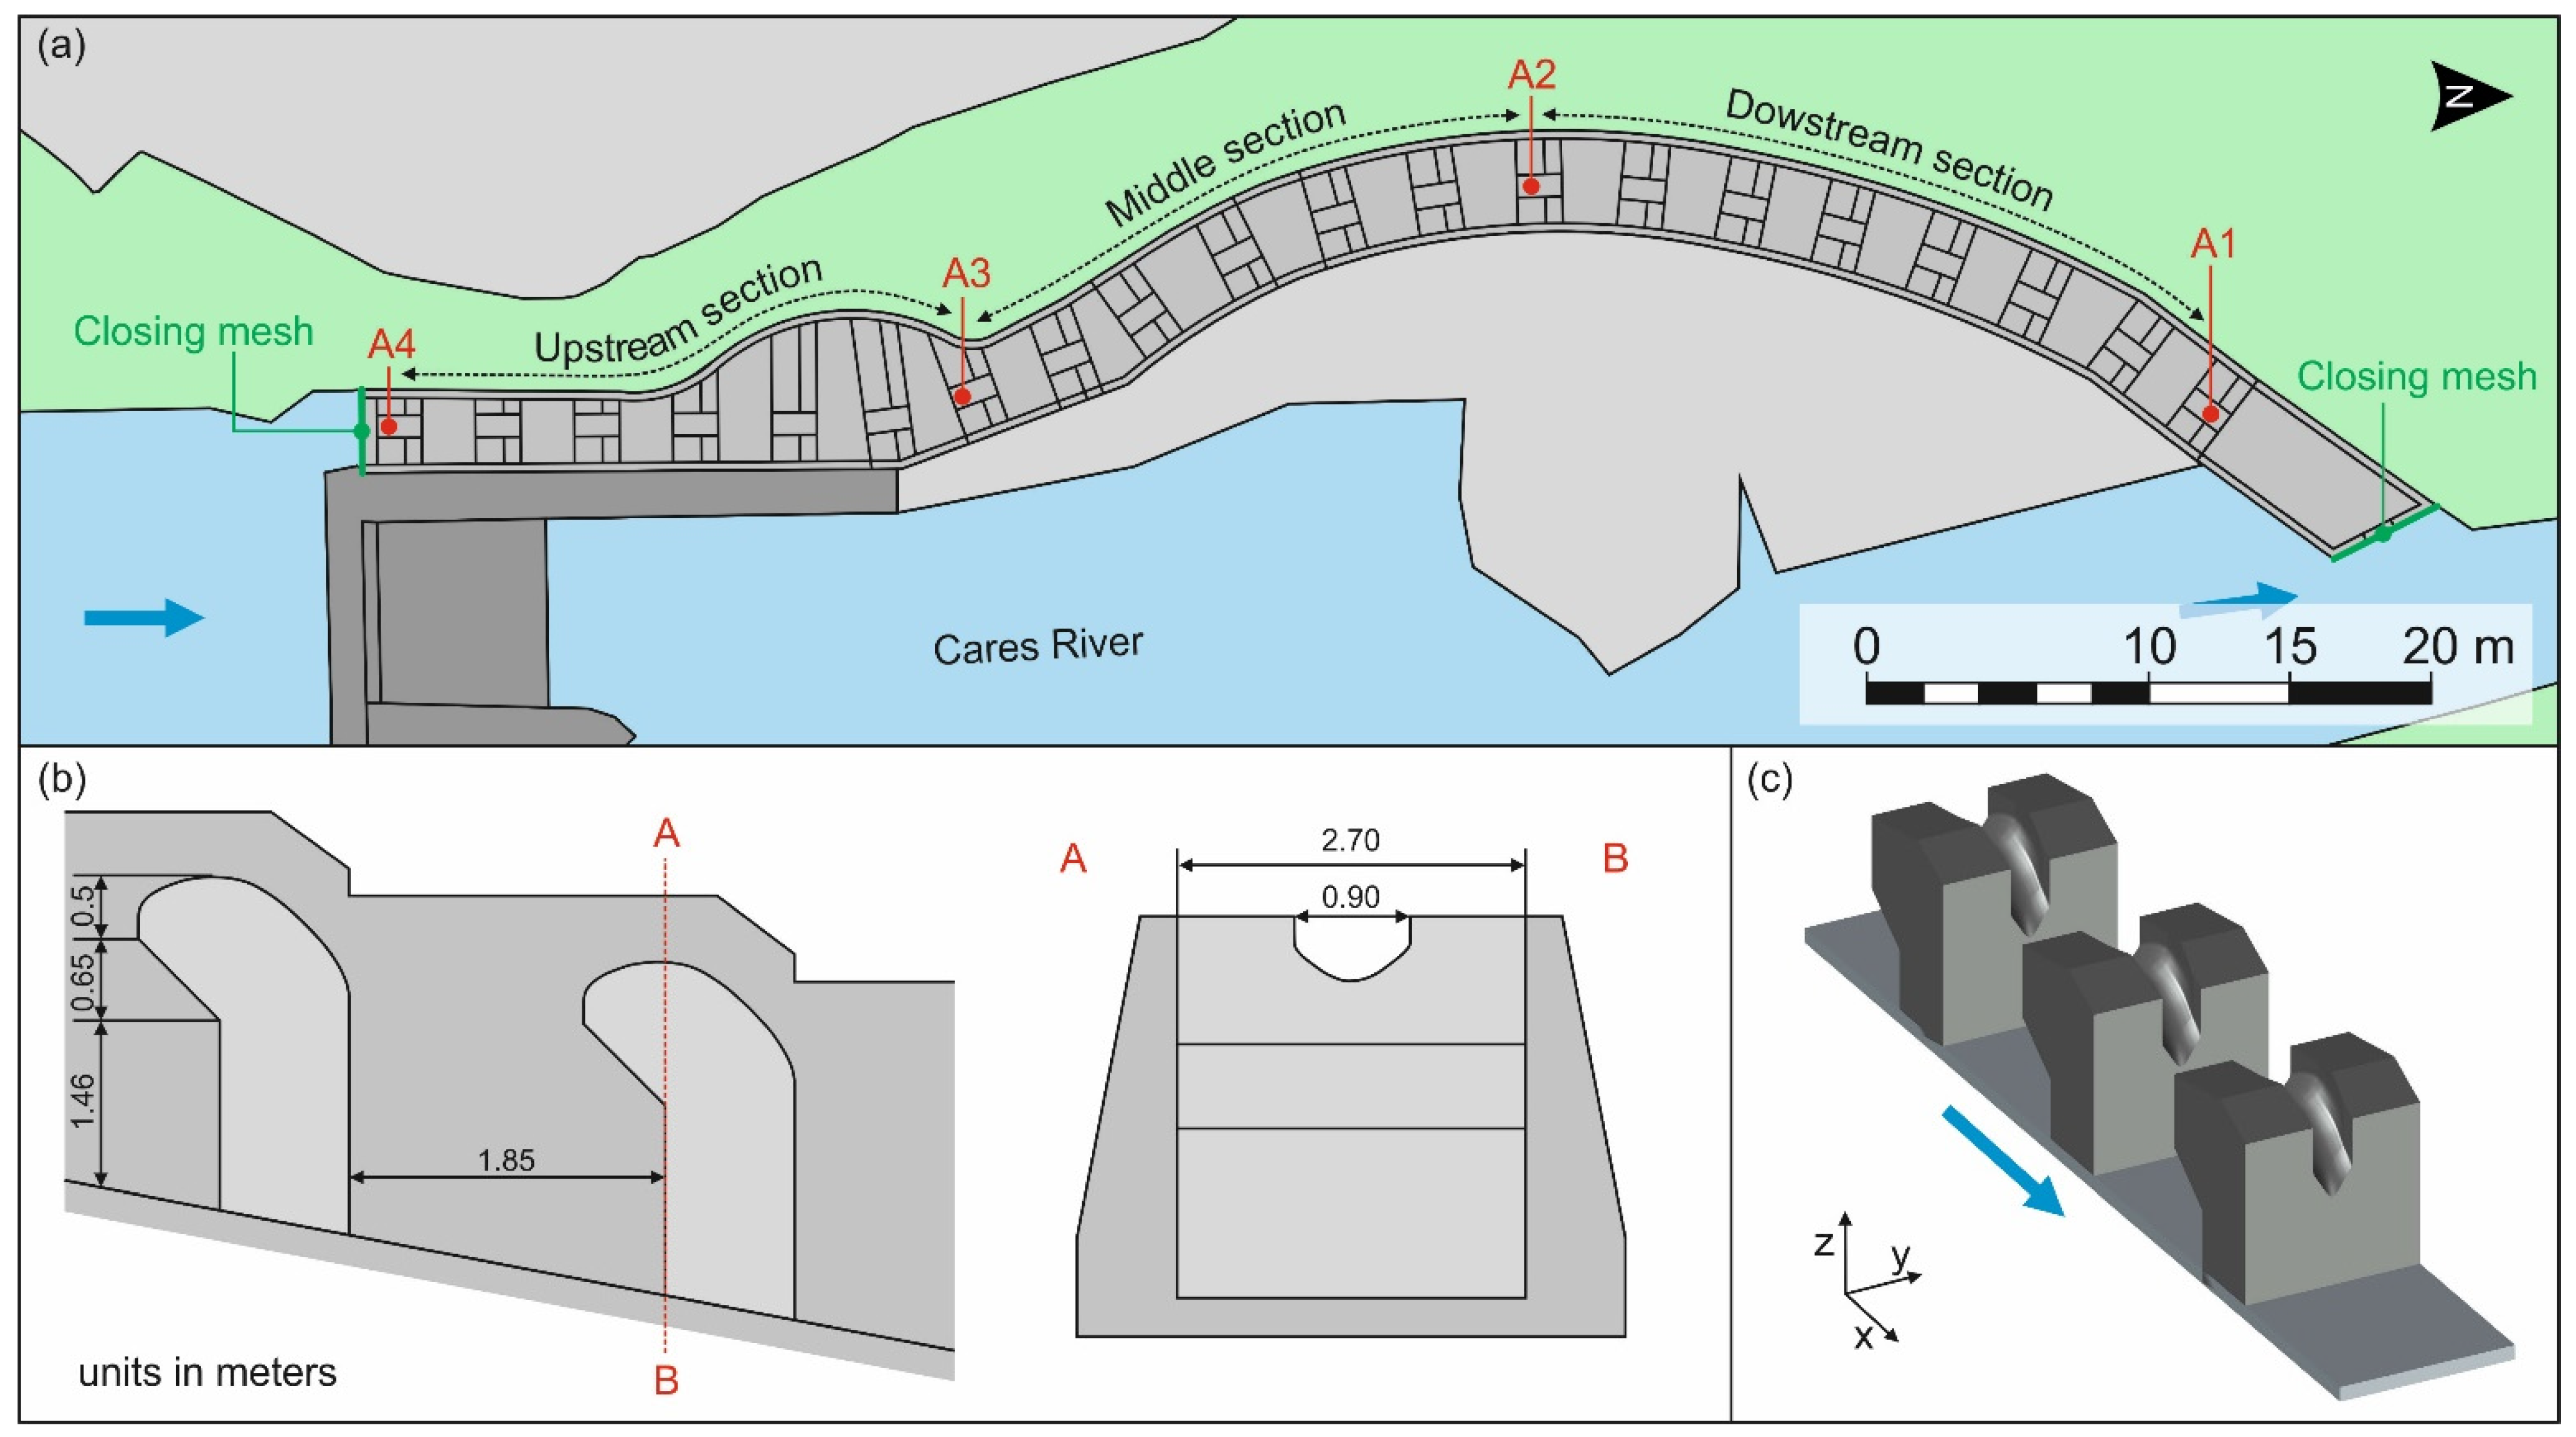
2.1. Study Site

The studied fishway is located in the Cares River (Asturias, north coast of Spain), a tributary of the Deva River that flows into the Cantabrian Sea. The Cares River has a basin of 489 km2 and an average annual discharge of 10.8 m3/s [40] (Figure 1). The study river section (270 km2) is placed in the influence area of the Picos de Europa National Park, in the trout zone [41], specifically in the Epirhithron zone [42], and is characterized by a deep and narrow canyon, with large pools and bed material formed by bedrock and boulders (Rosgen A category [43]). The fish community in this river reach is dominated by potamodromous brown trout. The fish assemblage was historically composed also of anadromous species, such as the anadromous brown trout, the Atlantic salmon, and the European eel (Anguilla anguilla). However, due to the existence of impassable barriers downstream of the studied fishway, the presence of anadromous species in the study reach has dramatically decreased.
The fishway was installed in the late 1950s in a run-of-the-river hydropower plant (HPP) with a dam of 14.4 m high (from the foundation) and a diversion channel of about 5 km long. The HPP has a gross head of 74 m, with a maximum turbined flow of 14 m3/s and an installed power of 9.6 MW [44]. The fishway is a pool-weir type, with 20 pools connected by broad crested notches with plunging performance. The notch geometry is unusual, with a large wall thickness (1.6 m), a semi-circular cross-section of variable width (0.9–0.6 m, following the flow direction), and a longitudinal section with an Ogee or Creager profile (Table 1 and Figure 2). Pools have a mean length and width of 1.85 × 2.7 m, respectively, and the depths vary along the fishway, with values near 1 m depth in the downstream pools and up to 5 m in the upstream section (Table 1).

2.2. The 3D Numerical Model

To characterize the hydraulics of the fishway and try to relate the biological results to the main hydraulic parameters of the fishway (velocities and VPD), two partial computational fluid dynamics (CFD) models (a succession of 5 pools) were developed, considering two main pool depths in the fishway (1.8 and 5.0 m).

2.2.1. CFD Methods

The 3D model was implemented using the open-source numerical C++ toolbox OpenFOAM (v2112). OpenFOAM uses a tensorial approach and finite volume method (FVM) for the resolution of CFD problems. The resolution of the transient flow of two fluids separated by an interface (water–air) is achieved with the prebuilt Eulerian solver interFoam [32], i.e., an implementation of the classical VOF (Volume of Fluid) method [33]. A detailed description of the procedure and methods used (flow equations, boundary conditions, and the simulation process applied) for modeling can be found in Fuentes-Pérez et al. [34].
To solve turbulence, in all the models, Reynolds-Averaged Navier–Stokes (RANS) turbulence modeling methods were used (k-ε turbulent model). To date, RANS turbulence modeling techniques are the most popular alternative for fishway modeling [13,14,35].

2.2.2. Mesh, Boundary Conditions, and Time Sensitivity Analysis

All studied meshes were generated using the described procedure in [34]. After generating the 3D models in stl format, the block-mesh utility [38] was used to create a structured hexahedral mesh of the fishway channel (without the cross-walls). Next, the defined cross-walls were subtracted from the channel using the snappyHexMesh utility [38], creating a high-quality hex-dominant mesh. Multiple mesh sizes were tested until an invariable solution was reached (mesh independency analysis). The final mesh size used to report the results was 0.04 m, which follows other studies [13,14,34,39].
The overall performance of the hydraulic scenario was controlled by defining a constant flow rate at the inlet, enabling the free water level oscillation and a constant mean velocity in the outlet. A complete description of the methodology and boundary conditions can be found in [34].
In all the simulations, the differences between time steps on water levels and mass flow were monitored to ensure that an asymptotic behavior was reached. To report the simulation results, the last 50 time steps were averaged. To validate the model, the simulated values were compared to those velocities measured in the cross-walls of the fishway using a propeller-type current meter (Swoffer Model 2100 Current Velocity Meter) to ensure that the modeled values were in accordance with field observations.

2.2.3. CFD Data Treatment and Hydraulic Variables

CFD data from OpenFOAM were plotted, visualized, and exported to text format with Paraview software (version 5.8.0). Final analysis, visualization, and comparisons were performed in Matlab R2019a. Due to the big scale of the biological behavior analyzed (transit of fish through long sections of the fishway), for this study, only velocity was considered to report 3D results. However, a more accurate (lower-scale) and deeper hydraulic analysis is planned for a near-future paper.

2.3. Fish Response

To characterize the upstream passage through the fishway and relate it to the main biometric and hydraulic parameters, a PIT-tag tracking experiment was carried out.

2.3.1. Fish Collection and Tagging

Captures of brown trout were carried out during their migration period (September 2020) by electrofishing (Hans-Grassl ELT60II backpack equipment; 180–200 V and 1.8–2.0 A) in the bypass channel of the HPP due to fishing difficulties at this river section (deep canyon, high water depth, and turbulence). From the capture date (22 September 2020) to the start of the experiment (20 October 2020), fish were kept in a fish farm until the flow conditions in the river were optimal (typical conditions and weather during migration) to carry out the trials. To achieve greater statistical robustness and decrease variability of the findings, thus increasing the reliability of the conclusions, two replicates were conducted, dividing fish randomly into two groups (Table 2).
Before the experiments, fish were tagged with passive integrated transponder (PIT) tags (Half-Duplex of 23 × 3.85 mm and 0.6 g; Oregon RFID®). All fish were anesthetized with clove oil with a concentration of 50 mg/L (diluted in a proportion 1:10 in ethanol). They were measured (fork length), weighted, and tagged intraperitoneally by an incision posterior to the left pectoral fin. No fish died during or after the tagging process. Afterward, fish could recover and acclimate to the new environment 24 h before the trials in recovery boxes located in the fishway inside the staging area (the most downstream pool, Figure 2) with a low discharge in the fishway to avoid stress or fatigue.

2.3.2. Data Collection

Trials were carried out under confined conditions (i.e., closing meshes in the downstream and upstream sections of the fishway, Figure 2). A PIT-tag system with four pass-through antennas in the notches was installed for monitoring the fish movements. Each antenna (A) was connected to a multiplexer reader sending and receiving at 14 Hz (0.29 s per antenna) (Oregon RFID®, Portland, OR, USA). The system was supplied by 12 V lead–acid batteries (60 Ah). The total water height covered by the antennas was 11.8 m, and the fishway was divided into three sections: downstream section = A1–A2 = 3.8 m, middle section = A2–A3 = 3.9 m, and upper section: A3–A4 = 4.1 m (Figure 2).
Before the start of the experiments, the fishway upstream gate was opened until the desired water level conditions were achieved. Then, the closing mesh above the staging pool was removed, allowing the fish to volitionally move through the fishway (although they could not escape due to the closing meshes in the lower and uppermost sections of the fishway). Two trials (one per group) were carried out starting at 18:00 h and lasting 24 h.
Water temperature and water levels in the fishway were monitored at 15 min intervals with a MS Pressure Logger (version 1.2, GEA-Ecohidráulica, Palencia, Spain; https://www.gea-ecohidraulica.org/GEA_en/sensors.php accessed on 14 January 2022). The water temperature ranged between 6.5 and 8.2 °C. The weather was stable and cloudy with no rain during the experiments. There was no influence in the lower part of the fishway due to the boundary conditions of the river (there was a high free waterfall at the entrance of the fishway) and the discharge was kept constant throughout the experiment, producing uniform conditions with steady water levels in the pools along the fishway (water level changes into the pools of about ± 0.06 m were considered negligible).
During the experiment, fish were able to make different movements and several attempts. To separate the movements of interest (ascent movements) from the exploratory movements, the next criteria were established:
  • Fish with attempts were those with at least two records in A1, or one record in A1 and any other record in any of the subsequent antennas. The attempt percentage was defined as the total number of fish that made at least one attempt divided by the total number of fish.
  • Successful events were assigned to those fish that reached A4. If not, they were considered failure events. The ascent success was defined as the total number of fish that reached A4 divided by the total number of fish that made at least one attempt.
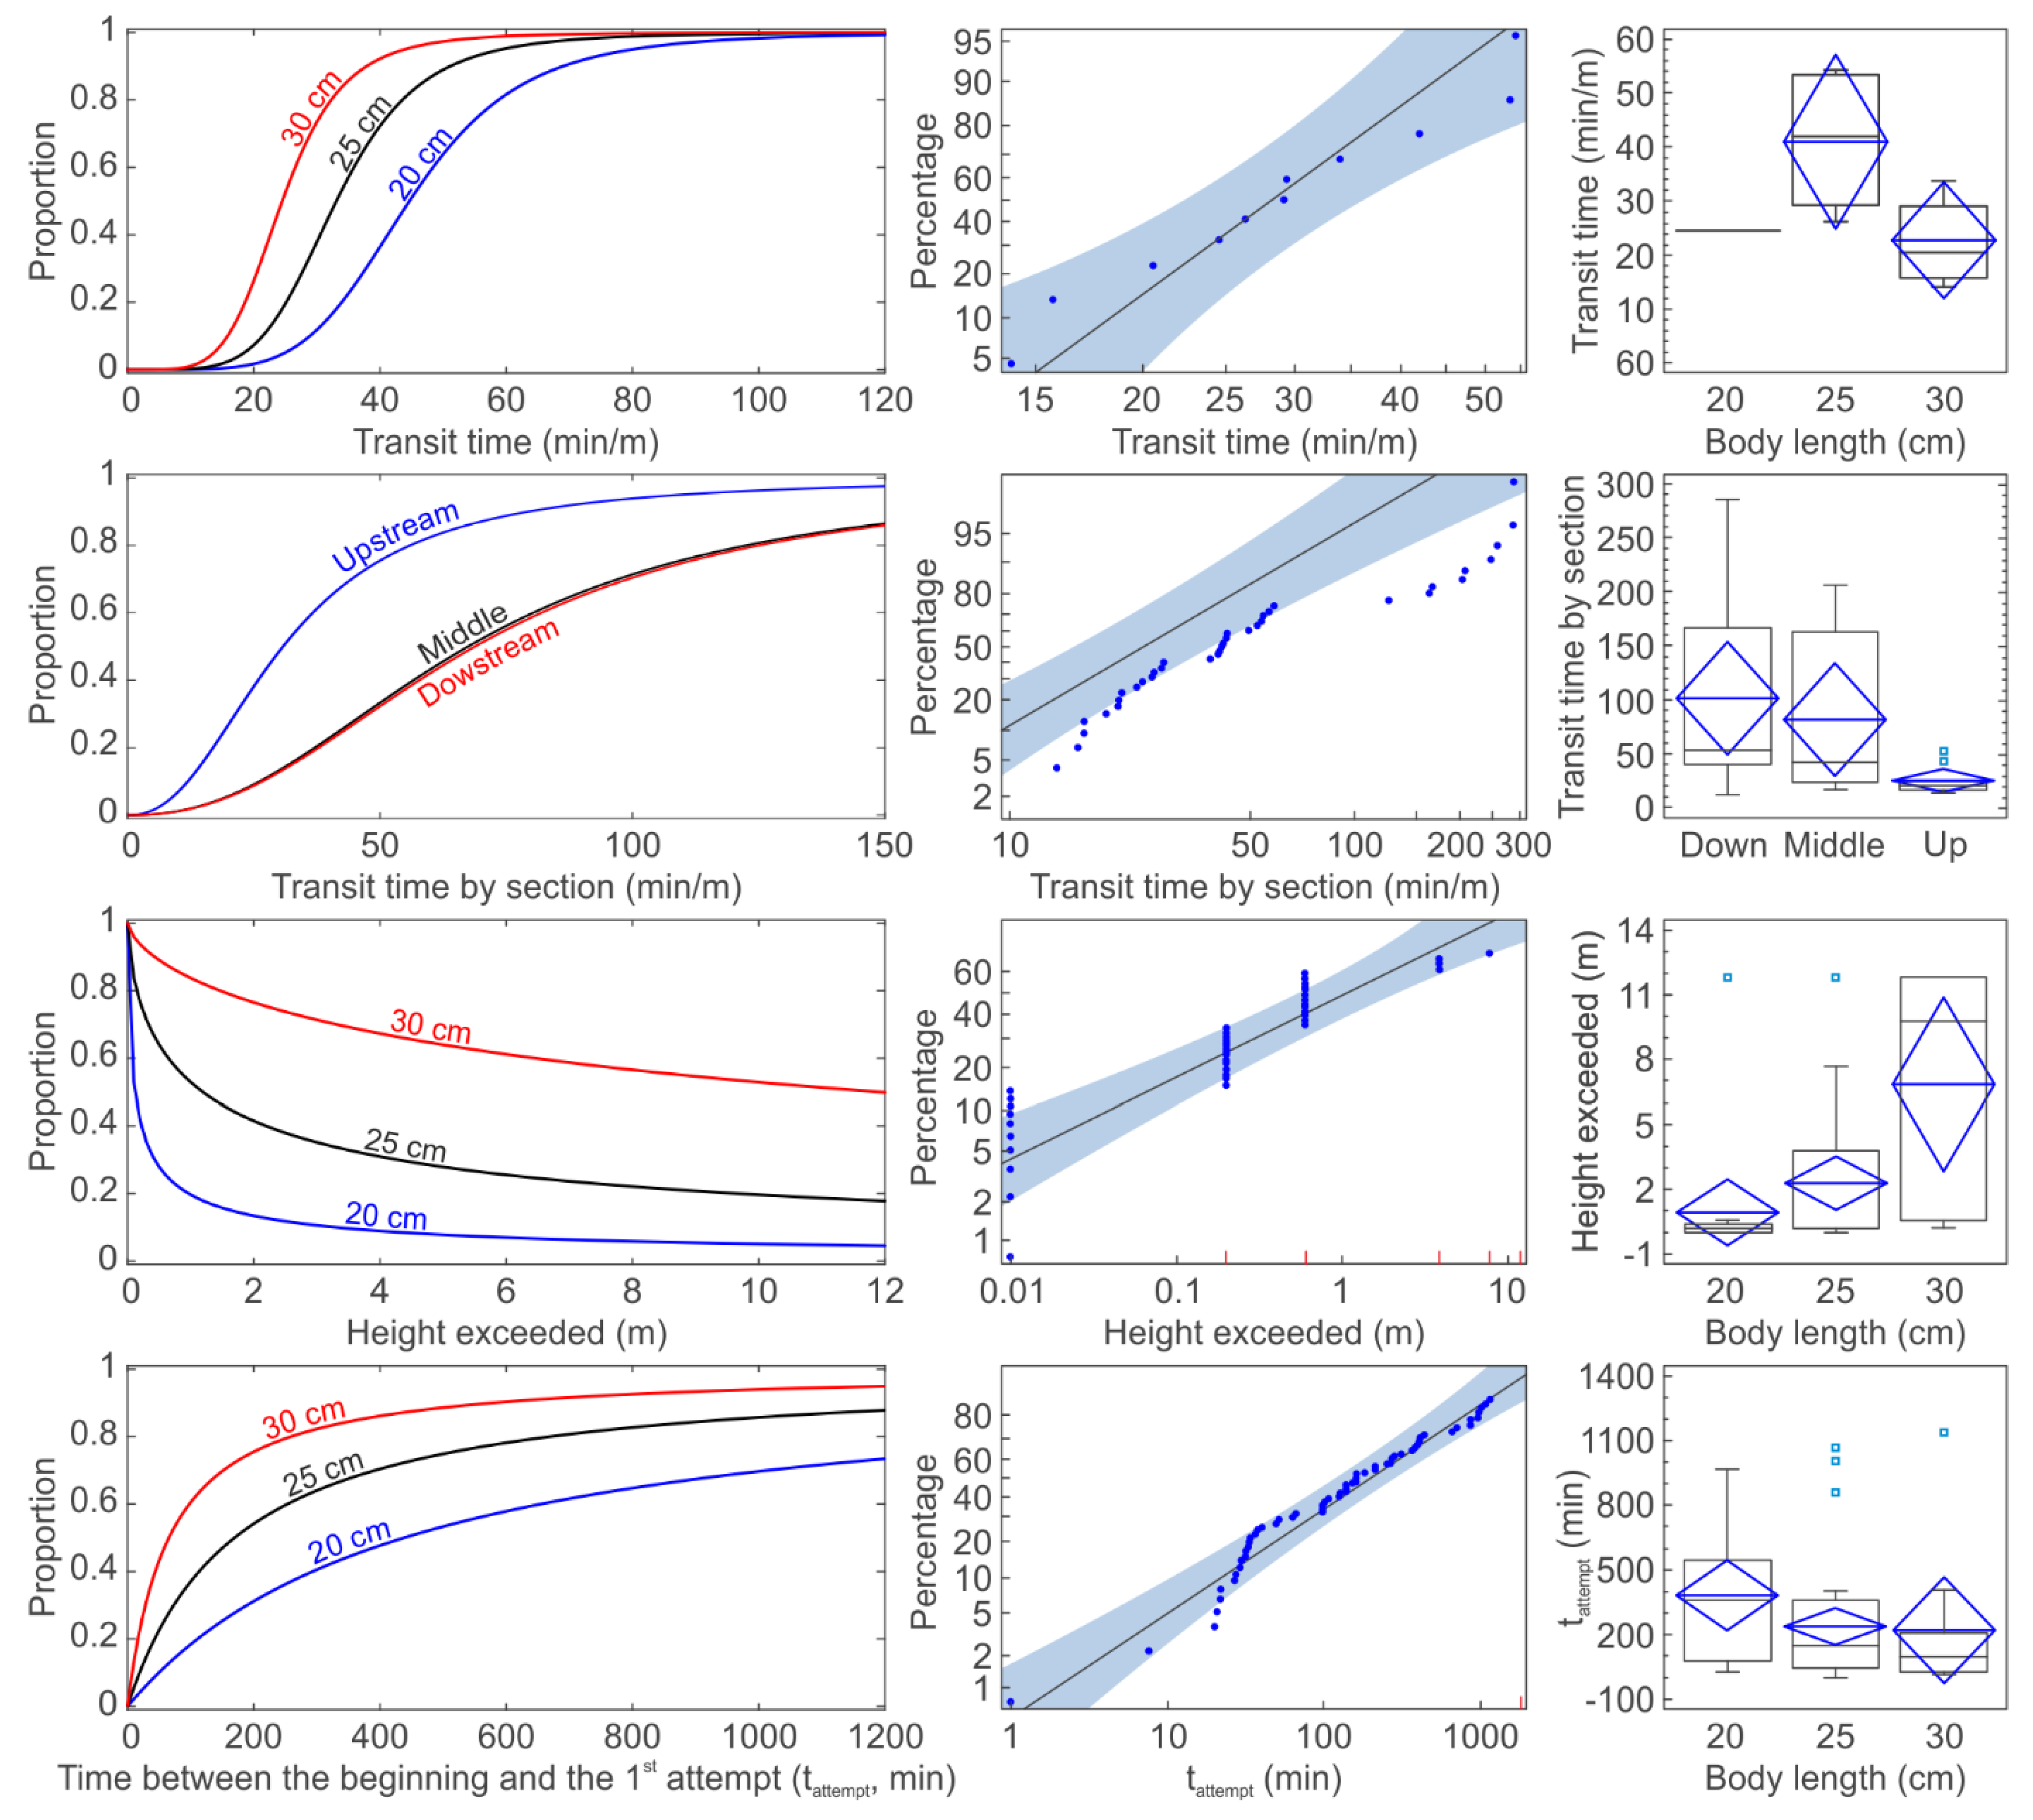
  • Height exceeded was a categorical variable based on the upstream antenna that the fish were able to overcome (A1 = 0.6 m/A2 = 3.8 m/A3 = 7.7 m/A4 = 11.8 m).
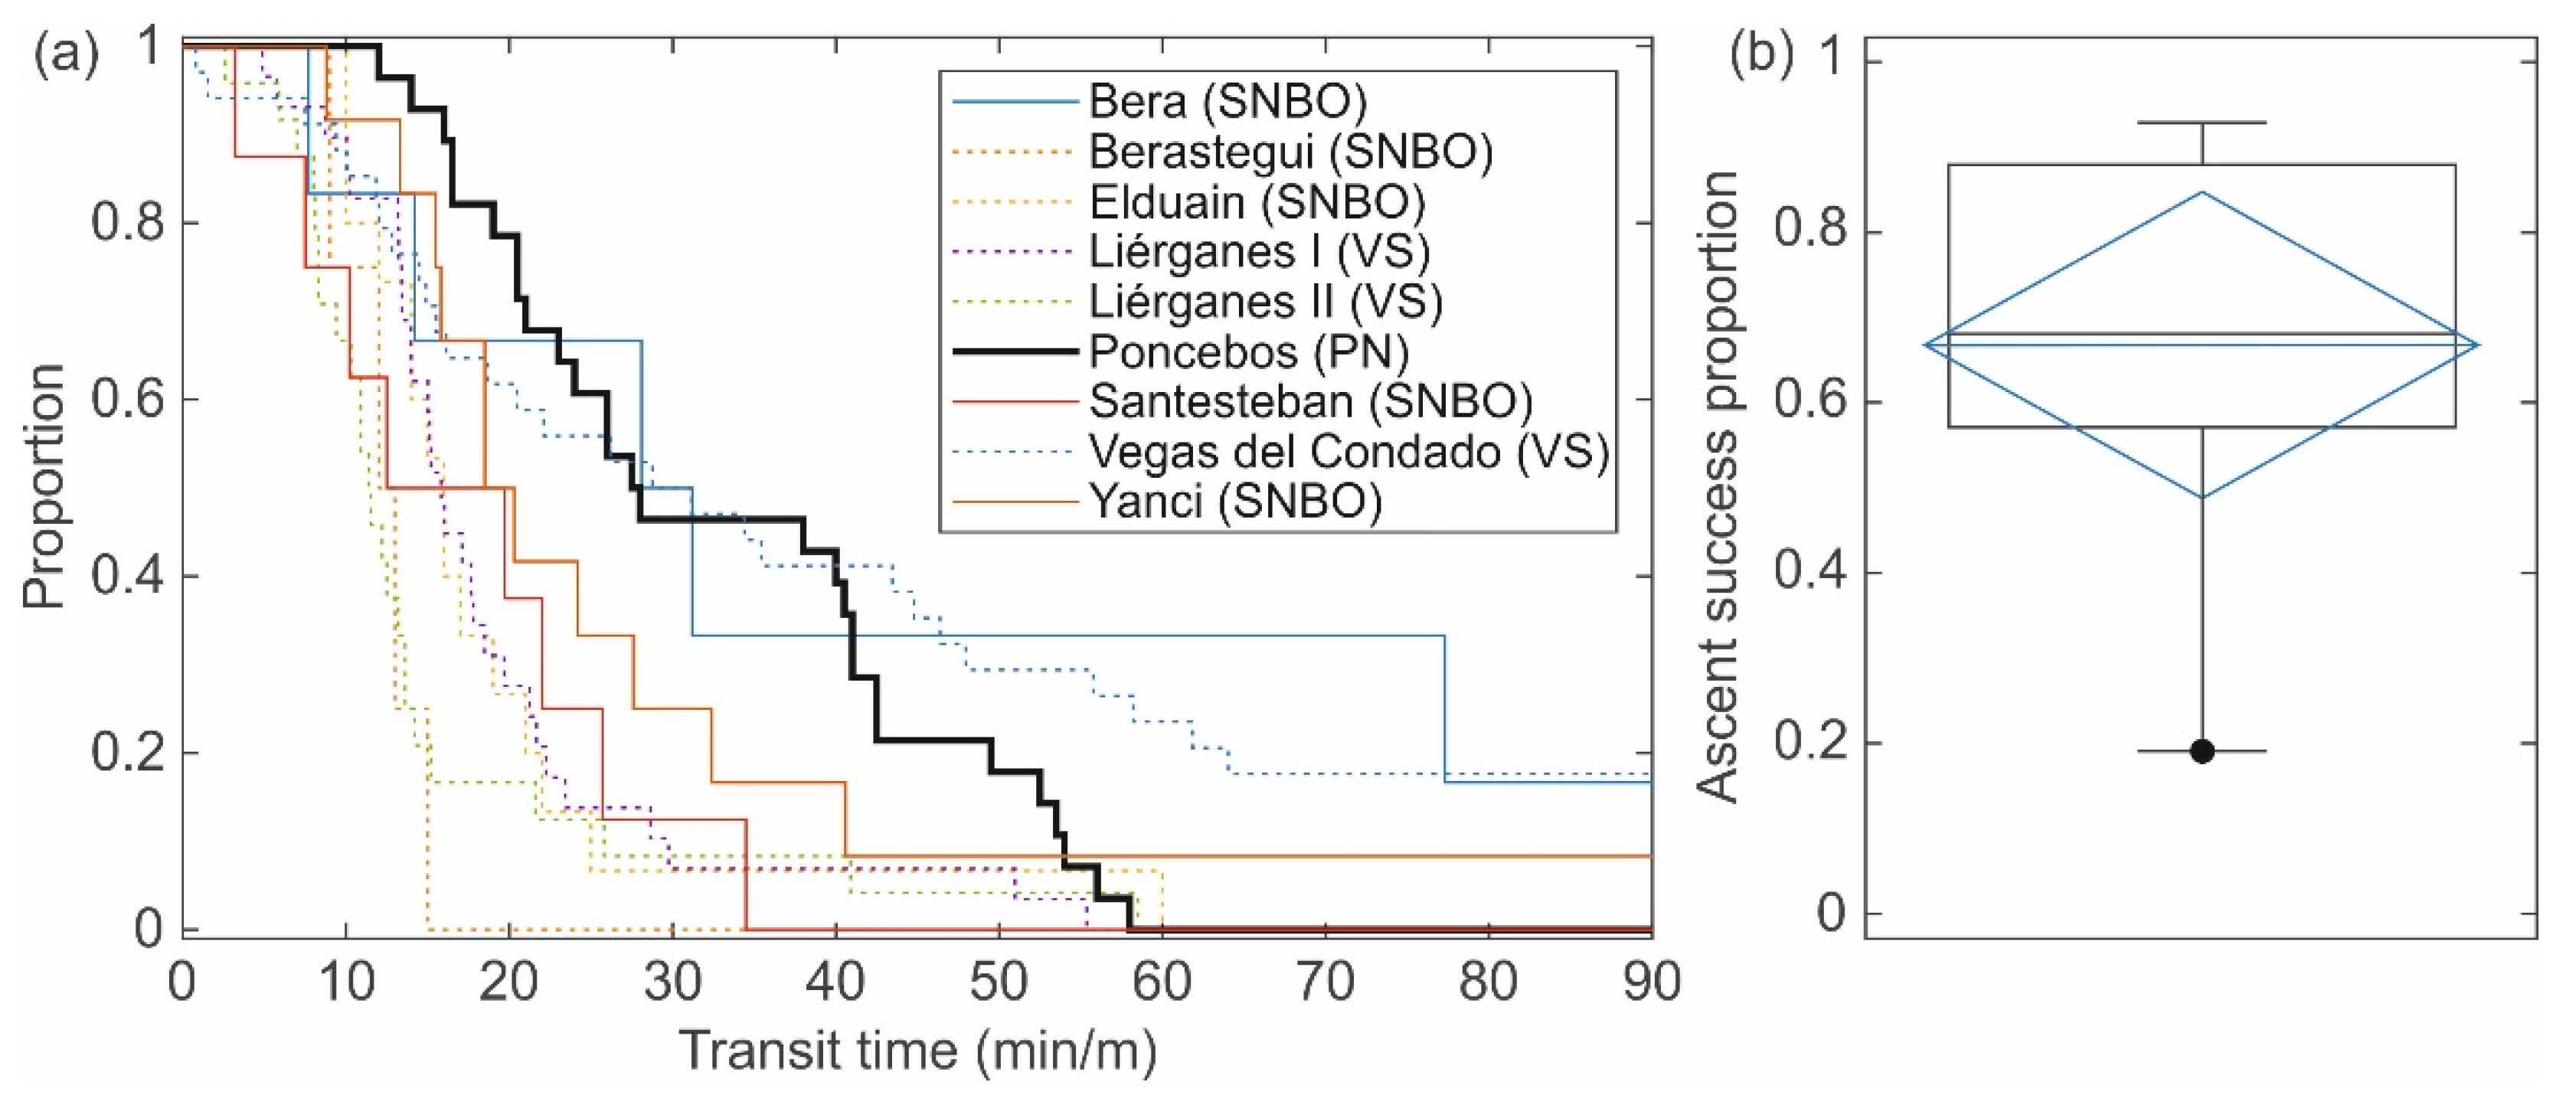
  • The transit time was calculated as the time between the last detection in A1 and the first detection in A4 (only for fish with successful events). In addition, transit time was also calculated in each fishway section as the time between the downstream and the upstream antenna of the section (see Figure 2; downstream section: between A1 and A2, middle section: between A2 and A3, upstream section: between A3 and A4). To make possible the comparisons between other fishway assessments from the literature or between the different fishway sections, data of transit time were relativized by the water height difference between antennas, i.e., transit time per meter of ascended height [10].
  • The time between the beginning of the trial and the first attempt was included as a sign of motivation. For those fish with at least one attempt, this time was considered as the lapse between the beginning of the trial and its first detection.

2.3.3. Data Analysis

All statistical analyses were performed in Statgraphics Centurion statistical software (Version 18.1) and SAS® (version 9.4). All data visualization was performed in Matlab R2019a and hydraulic data extraction was performed in Paraview software (version 5.8.0).
The two fish groups were compared to assess whether there were significant differences between them and, if there were not, to merge them to improve the consistency of the results. Comparisons of biometric characteristics (body length, weight, and condition factor) of the two fish groups were carried out via Student’s t-test, the comparison of the attempt percentage and the passage success was performed using the chi-square test of independence, and the analysis of transit time per meter of height ascended in relation with the height exceeded was performed via the Mann–Whitney test (due to the non-normality of the data).
To assess the effect of the main covariates (body length, weight, and condition factor) on each of the response variables (transit time, transit time by fishway section, height exceeded, and time between the beginning and the first attempt), survival analysis through Cox Proportional Hazard regression [34,45] was used, applying the concept of survival time (i.e., time or height until an event occurs). In addition, the evolution of the passage along the fishway sections was also assessed considering the transit time by fishway section. To check possible multicollinearity between the main covariates, the variance inflation factor (VIF) was calculated [46]. Non-proportionality was tested through Martingale and Schoenfeld residuals. The selection of relevant covariates was conducted using a stepwise procedure (p-value ≤ 0.25 to enter the model and p-value ≤ 0.05 to stay in the model). For the transit time, only the best successful attempt (i.e., the fastest) for each fish was considered. However, the transit time by fishway section is not necessarily related to a successful attempt, but to a successful passage on each fishway section. For the height exceeded, right censoring was applied to those fish that arrived at the top of the fishway, selecting only the attempt with the highest height per fish. For the time between the beginning and the first attempt, all fish without attempts were included as right-censored observations, assigning them the total time duration of the trial.
Once the significant and relevant covariates using Cox Proportional Hazard regression were confirmed, survival analysis based on parametric models [47] was used to make the predictions of the effects of those covariates on each of the response variables. Three different distributions were considered (exponential, log-logistic, and Weibull) and the model with the best fitting was selected using Akaike’s information criterion [48]. In addition, for evaluating the model fit a probability plot was created (probplot procedure in SAS [45]), which compares ordered variable values with the percentiles of the specified theoretical distribution. If the data distribution matches the theoretical distribution, the points on the plot form a linear pattern and should lie within the 95% confidence bands.
Kruskall–Wallis test was performed to find differences in VPD and water drop between pool values by fishway sections, to relate the possible effect of the fishway section on transit time and the main hydraulic parameters. If the Kruskall–Wallis test showed significant differences, post hoc Dunn’s pairwise test comparison with Bonferroni correction was conducted. This test was selected due to the non-normal distribution of the data.

3. Results

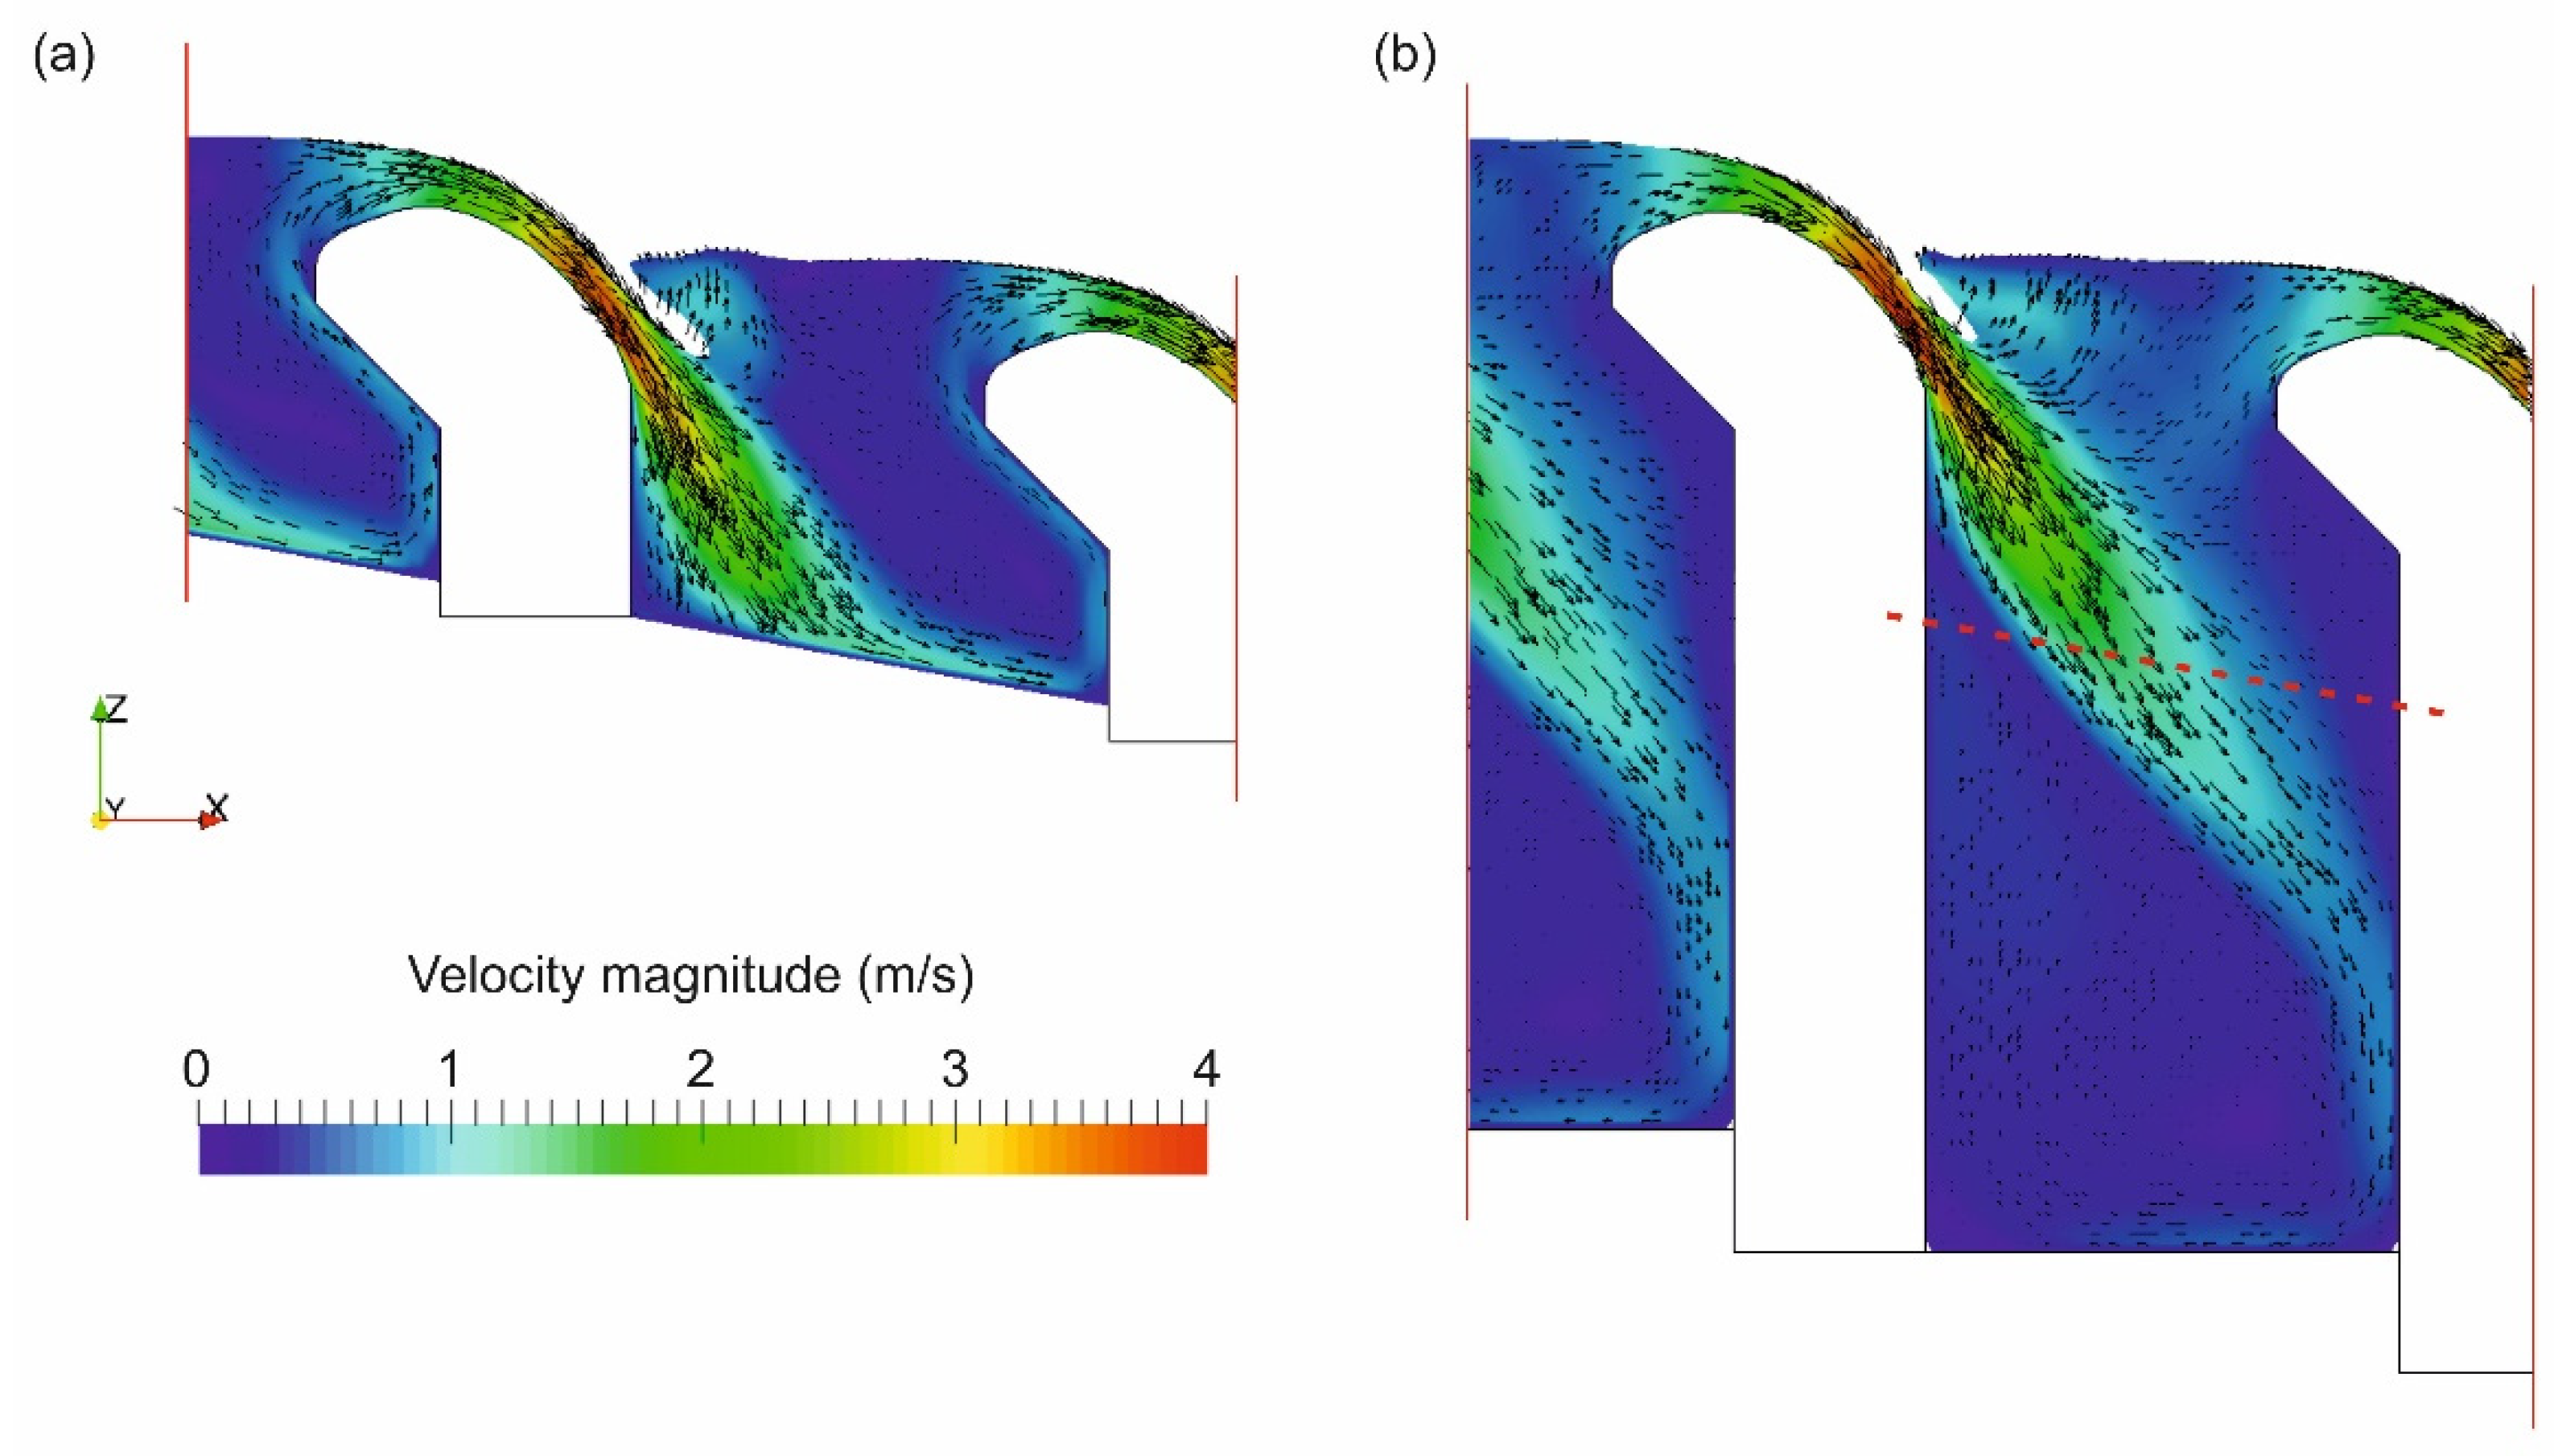
3.1. The 3D Numerical Models

To understand the hydraulic conditions that fish were facing, two simulations were performed, one considering the common situation in the lower part of the fishway with a mean depth of 1.8 m in the pool and another with a depth of 5.0 m, representing the upper section of the fishway (Figure 3). The flow velocity pattern over the cross-wall is similar in both sections; the flow starts in a decelerated manner at the beginning of the cross-wall and progressively increases until it reaches a maximum velocity of 4 m/s, once the jet is submerged at the end of the cross-wall. The Mean Absolute Error between the measured and simulated maximum velocity values was 0.21 m/s. The recirculation pattern in the pools allows an effective deceleration of the flow which reduces the influence of above cross-walls on below ones. In this sense, a higher depth allows for a bigger recirculation area in the top part of the pools, which in turn increases the available area for fish to face successive cross-walls.

3.2. Fish Response

Regarding the comparisons between the two fish groups, there were no significant differences in biometric characteristics (Table 2) nor in the passage metrics (attempt percentage, passage success, height exceeded, and transit time p-values = 0.463, 0.602, 0.568, and 0.949, respectively). Considering this, to study the following relations and increase the number of data, both groups were merged and analyzed together.
The attempt percentage was 86% (59/69), with a mean number of attempts of 2.2 per fish. The ascent success was 19% (11/59), and the smallest trout with a registered success had a body length of 22 cm. The median transit time per meter of ascended height was 29.1 min/m (interquartile range = 20.5–41.9 min/m; minimum and maximum = 14.0–54.2 min/m), the fastest fish being the largest trout (40.5 cm body length), which took less than 3 h to ascend the whole 11.8 m high fishway section.
The studied fishway presents greater transit time (slower passage) and lower success than most of the pool-weir fishways previously studied in Bravo-Córdoba et al. [9] (Figure 4).
Given the significant collinearity between weight and body length (VIF > 30), and also because the condition factor relates to both covariates [46], weight was dropped from subsequent analysis. Considering this, body length was the only significant covariate for all the response variables (Table 3). It showed a negative correlation with the three response variables related to time and a positive correlation with the height exceeded. Furthermore, the fishway section showed a significant effect on the transit time, with a significantly greater value in the downstream section (median transit time of 40.3 min/m vs. 21.2 min/m for the upstream section), where the VPD was also significantly greater (Table 4). None of the selected Cox models violated the proportional hazard assumptions.
Once the significant variables were selected by the Cox Proportional Hazard model, their effects were characterized and illustrated via survival analysis based on parametric models (Table 5 and Figure 5 show the best-fitted parametric model for the response variables; log-logistic was the best-fitted distribution in all cases). It can be seen how the trend of the models is corroborated by the box-plots. However, despite the significance of the model, the probability plots show that the variability of the studied metrics was not perfectly explained by the considered variables, especially for the transit time by section and the height exceeded, probably due to the unknown influence of other covariates and/or the small sample size.

4. Discussion

With this study case, we went a step forward in filling the knowledge gap on the limits of fish passage design, by the assessment of the brown trout ascent passage via PIT telemetry in a pool-weir fishway with plunging flow and extreme water drops. The studied fishway showed better performance than expected, taking into account that according to design recommendations and assessment guidelines this fishway would have been almost impossible to overcome [6,11,49,50,51]. Results showed that almost a fifth of the fish that attempted to ascend the fishway made it with success and took less than half a day. Although it does not seem a high proportion of fish, it is an encouraging result that shows a possible design alternative for those obstacles where fishway solutions are discarded due to geometrical constraints. Nevertheless, further biological experiments and detailed hydraulic studies are required to recommend (or even improve) similar designs.
Monitoring the hydraulic variables that characterize a fishway and their link with passage failures is vital to understand fishways’ performance [52], thus, allowing its improvement [51,53]. The hydraulic variables in this type of fishway turned out to be quite different from most typical pool-weir fishway designs (i.e., vertical slots and submerged notches with orifice) [54]. In particular, the plunging flow, the high water drop between pools, and the hydrodynamic profile of the notch make the studied fishway quite unusual. Instead of the theoretical jump that is required for the fish when it moves from one pool to the upper, the hydrodynamic profile generates an adherent nappe that allows the fish to swim through the jet in the notch. This means that a fishway considered a priori as very demanding, both in its horizontal (thickness of the cross-wall) and vertical (water drops between pools) dimensions, could be overcome by some fish.
Swimming through the jet at the notch can be also quite challenging, as the water velocity in some notches was quite high: maximum measured values near 3.8 m/s (in the notch) and simulated value of 4 m/s (after the notch). According to specialized references in fishway design and swimming capacity, this value is out of the allowable velocity in fish pass structures [6,11,55], and near the limit of the swimming capacity of the brown trout [56], which can explain the selective effect of fish length on the passage metrics. The depth of the pool is also a relevant parameter when ascending a plunging notch, as the impulsion depth is vital for either the jump or the swimming propulsion [31,32]. For example, the brook trout, a species with great jumping abilities, can develop jumps of more than 4 body lengths when the pool depth is greater than 1.5 times its body length [23]. In the studied fishway, the minimum measured depth in the field was 1 m, which represents 2.5 times the length of the largest fish (40.5 cm) in the experiments, whereas the mean depth (1.8 m) is near 4.5 times, which ensured adequate impulse conditions. Thus, due to the jet direction towards the bottom of the pool, the higher the depth, the higher the available space to develop the maximum jump.
Another key hydraulic parameter related to the fish passage is the VPD, which is considered an index of the turbulence conditions during the design and assessment of fishways [6,51,57]. In the studied fishway, higher than recommended values of VPD were measured. The usual recommendations show maximum values of 200 W/m3 for salmonid species [6,11,55], whereas VPD reached values close to 400 W/m3 in the studied fishway, which may partially explain the selectivity of smaller-bodied fish. Moreover, a non-homogeneous distribution of the turbulence in the pools was observed, with most of the dissipation occurring in the vicinity of the plunging flow, and low turbulence in the rest of the pool, with large resting and recirculating areas. This is in line with the findings of Ead et al. [14], which demonstrated that 90% of the total energy loss happened in the first quarter of the pool. In addition, different mean values between the studied fishway sections were observed, with the greatest values in the downstream part. This, together with the bigger space to develop the jump or to face the successive cross-walls, can explain the higher passage success and lower transit times in the upper parts of the fishway. It is important to note that these differences in VPD among sections were mainly due to the different depth of the pools but were also conditioned by the greater presence of sediments in the downstream section as a consequence of the accumulation after floods and the lack of maintenance due to the difficult accessibility. The slope of the fishway is also too high (16.38%), considering the usual recommendations for these types of fishways (maximum slope near 10% [6,11]).
Regarding the passage assessment, the use of standardized metrics [9,10,36,58,59] allowed to make comparisons with other study cases. For example, results indicate a passage success lower than most of the fishways assessed by Bravo-Córdoba et al. in [10] for brown trout passage, where more modern fishways designed considering current fishway guidelines, with lower overall height (11.8 m vs. a range from 1 to 6 m) and other types of connections (vertical slot and submerged notch with bottom orifices) were assessed. Even so, it is within the passage success range for a wider variety of fishways according to the review of Bunt et al. [60].
Regarding the median transit time per meter of ascended height, results indicate a slower ascent when compared to the fishways evaluated in [10] (29.1 min/m vs. a range from 5.2 to 30.0 min/m). Other references with transit time relativized in terms of time per ascended pool showed transit times from 1 to 5 min per pool (maximum water drop between pools of 30 cm and with Salmonid and Clupeid species) [20,21,61,62]. The median transit time in the studied fishway is equivalent to 18.1 min per pool. This wider time may indicate a higher demand in each pool for fish, which is in accordance with the high observed velocities. However, it is necessary to point out that this relativization per pool could be not representative of an actual delay during the fishway passage. For example, a fish with a transit time of two minutes per pool with a water drop between pools of 30 cm would take 20 min to ascend a fishway of 3 m. If the water drop between pools is 60 cm, to ascend the same fishway (3 m high) in the same total time (20 min), the fish would have to double the transit time per pool (i.e., 4 min/pool).
The passage metrics also revealed the importance of the fish size on the probability of successfully ascending the fishway, which indicates the possibility that this fishway could be acting as a selective barrier. The consequences of the exclusive passage of some sizes may produce a pressure effect on upstream populations, inducing some phenotypic changes due to the possible decrease in body length variability [36]. Results showed that larger fish had better passage performance and started their attempts earlier than smaller ones, which follows current meta-analyses on fishway efficiency [8,9,10]. In general, swimming performance is strongly affected by fish size [33,35,63], and differences in motivation have been documented due to the link between size–age maturity and spawning movements [64]. On the other hand, despite the condition factor has shown to be a relevant predictor by other authors [36], in this study case there was no evidence of any significant effect on the passage performance, which was also pointed out by [65]. A hypothesis that could explain this lack of effect is the isometric growth of the studied population, which has an allometry coefficient of the length–weight relationship close to the value 3 [66].
It is necessary to highlight that trial conditions (i.e., confined trials and especially trial duration) may have had some influence on the results. With free trials and mainly experiments lasting the entire migration period or even the full year, the passage success could have varied. On the other hand, to clarify the effect of the different fishway sections on the passage, experiments per section would have been necessary, releasing fish of all sizes in each section. This would have avoided the possible bottleneck effect on small-sized fish in the first section, which reduced the attempts of smaller fish in the middle and upstream sections. In addition, other variables such as the water temperature, the river/fishway discharge, and their variations along the migration period could influence the results, due to their effect on a fish’s swimming performance and motivation [37].
Finally, it is necessary to highlight other limitations of this study, mainly related to the determination of successful passage. Here, only the upstream passage was assessed. Other relevant phases during fishway usage such as the location, entry, and exit from the fishway [51] with their respective metrics (rates and times), the downstream passage of the obstacle, or even return events with a possible learning process [67] have not been assessed and they are necessary to understand the overall effect of a fishway over the fish population. On the other hand, other possible migratory routes (restitution channels, turbines, spillways, etc.) or even the lack of maintenance at the fishway [51,68] could affect its effectiveness. Consequently, what constitutes successful connectivity needs to be directly tied to biological responses and needs to be put in the context of what limited passage will achieve or prevent in terms of the watershed’s goals of abundance, diversity, and resiliency.

5. Summary and Conclusions

The recommendations in fishway design have evolved over the years towards more “fish friendly and holistic solutions”, i.e., less demanding designs in terms of fish swimming capacity to guarantee the free migration of a greater number of species and life stages. Even so, there are many fishways in operation with conditions outside the currently recommended ranges, often inheritances from past times but still with a long lifespan, and without enough scientific evidence on their performance.
In this work, the operation of a free-flow pool-weir fishway with hydrodynamic notches and extreme water drops between pools (a common old design in salmon rivers of Spain) has been assessed. Almost a fifth of the brown trout that attempted to ascend the fishway was able to complete the fishway passage, although with slower transit times when compared to other types of fishways from the literature. The passage metrics were strongly affected by the fish size and the different fishway sections, and in turn related to the differences in their main hydraulic characteristics, which shows the possible bottleneck effect for small-bodied fish and also the need for a deeper and lower scale hydraulic and biological analysis of these types of fishways.
Despite the high drops between pools, results were better than expected (several individuals showed successful ascents in this highly demanding fishway design). Nevertheless, considering the lower success rates of this fishway when compared to other fishway types that follow the classical design guidelines, it cannot be recommended when other design types are feasible.
Hence, even though the design of the fishway assessed in this study is far from optimal for assuring the overall passage, our results indicate that, in the absence of other alternatives, this design could be considered to improve the upstream passage when compared with a non-action alternative. In this regard, in river reaches located in deep and narrow canyons, commonly with transversal barriers due to hydropower facilities, where the available area and the construction processes are a great challenge and other fish passage alternatives are not possible, this might be the unique option, although it should be a case-by-case study to determine the best solution.
In those cases, instead of a complete barrier, this last-place recommended alternative could ensure upstream passage, thus improving the access to new spawning, feeding, and shelter areas and enabling gene flow (although with a possible strong selection effect), which may contribute to the maintenance of diverse and viable salmonid populations [69].

Author Contributions

Conceptualization, F.J.P., J.B. and F.J.S.-R.; Data curation, F.J.B.-C. and A.G.-V.; Funding acquisition, F.J.P., J.B., and F.J.S.-R.; Investigation, F.J.B.-C., J.F.F.-P., and F.J.S.-R.; Methodology, F.J.B.-C., J.F.F.-P., and F.J.S.-R.; Project administration, F.J.P., J.B., and F.J.S.-R.; Supervision, F.J.S.-R.; Validation, J.F.F.-P. and A.G.-V.; Writing—original draft, F.J.B.-C. and J.F.F.-P.; Writing—review and editing, F.J.B.-C., J.F.F.-P., A.G.-V., F.J.P., J.B., and F.J.S.-R. All authors will be informed about each step of manuscript processing including submission, revision, revision reminder, etc., via emails from our system or the assigned Assistant Editor. All authors have read and agreed to the published version of the manuscript.

Funding

This project has received funding from the European Union’s LIFE program under agreement no. LIFE18 NAT/ES/000121 (Life DivAqua). J.F. Fuentes-Pérez’s contribution was funded by the European Union’s Horizon 2020 Research and Innovation program under the Marie Skłodowska-Curie grant agreement no. 101032024 (Smart Fishways).

Institutional Review Board Statement

The study was conducted according to the European Union ethical guidelines (Directive 2010/63/UE) and Spanish Act RD 53/2013 for the protection of animals used for scientific purposes, with a favorable report from the Animal Research Ethics Committee from the University of Valladolid as well as the approval of the competent authorities, i.e., Regional Government on Natural Resources (Principado de Asturias) and Water Management Authority (Confederación Hidrográfica del Cantabrico).

Informed Consent Statement

Not applicable.

Data Availability Statement

Data are available upon reasonable request to the corresponding author.

Acknowledgments

We specifically thank the HPP staff and El Esmerillon fisheries society. We would also like to thank the GEA staff and the Itagra.ct technological centre for logistic support, as well as the fishing services of the Regional Government on Natural Resources (Asturias).

Conflicts of Interest

The authors declare no conflict of interest.

References

  1. Nilsson, C.; Reidy, C.A.; Dynesius, M.; Revenga, C. Fragmentation and flow regulation of the world’s large river systems. Science 2005, 308, 405–408. [Google Scholar] [CrossRef] [PubMed]
  2. Reid, A.J.; Carlson, A.K.; Creed, I.F.; Eliason, E.J.; Gell, P.A.; Johnson, P.T.J.; Kidd, K.A.; MacCormack, T.J.; Olden, J.D.; Ormerod, S.J.; et al. Emerging threats and persistent conservation challenges for freshwater biodiversity. Biol. Rev. 2019, 94, 849–873. [Google Scholar] [CrossRef] [PubMed]
  3. European Commission Directive 2000/60/EC of the European Parliament and of the Council Establishing a Framework for the Community Action in the Field of Water Policy 2000. Available online: https://www.eea.europa.eu/policy-documents/directive-2000-60-ec-of (accessed on 3 March 2022).
  4. Habitats Directive Council Directive 92/43/EEC of 21 May 1992 on the conservation of natural habitats and wild fauna and flora. Off. J. Eur. Communities 1992, 206, 7–50. [CrossRef]
  5. Clay, C.H. Design of Fishways and Other Fish Facilities; CRC Press: Ottawa, ON, Canada, 1995; ISBN 1566701112. [Google Scholar]
  6. FAO/DVWK Fish Passes: Design, Dimensions, and Monitoring; FAO: Rome, Italy, 2002; ISBN 9251048940.
  7. Santos, J.M.; Silva, A.T.; Katopodis, C.; Pinheiro, P.; Pinheiro, A.; Bochechas, J.; Ferreira, M.T. Ecohydraulics of pool-type fishways: Getting past the barriers. Ecol. Eng. 2012, 48, 38–50. [Google Scholar] [CrossRef]
  8. Noonan, M.J.; Grant, J.W.A.; Jackson, C.D. A quantitative assessment of fish passage efficiency. Fish Fish. 2012, 13, 450–464. [Google Scholar] [CrossRef]
  9. Hershey, H. Updating the consensus on fishway efficiency: A meta-analysis. Fish Fish. 2021, 22, 735–748. [Google Scholar] [CrossRef]
  10. Bravo-Córdoba, F.J.; Valbuena-Castro, J.; García-Vega, A.; Fuentes-Pérez, J.F.; Ruiz-Legazpi, J.; Sanz-Ronda, F.J. Fish passage assessment in stepped fishways: Passage success and transit time as standardized metrics. Ecol. Eng. 2021, 162, 106172. [Google Scholar] [CrossRef]
  11. Larinier, M. Pool fishways, pre-barrages and natural bypass channels. Bull. Fr. Pêche Piscic. 2002, 364, 54–82. [Google Scholar] [CrossRef]
  12. Fuentes-Pérez, J.F.; Eckert, M.; Tuhtan, J.A.A.; Ferreira, M.T.; Kruusmaa, M.; Branco, P. Spatial preferences of Iberian barbel in a vertical slot fishway under variable hydrodynamic scenarios. Ecol. Eng. 2018, 125, 131–142. [Google Scholar] [CrossRef]
  13. Wu, S.; Rajaratnam, N.; Katopodis, C. Structure of flow in vertical slot fishway. J. Hydraul. Eng. 1999, 125, 351–360. [Google Scholar] [CrossRef]
  14. Ead, S.A.; Katopodis, C.; Sikora, G.J.; Rajaratnam, N. Flow regimes and structure in pool and weir fishways. J. Environ. Eng. Sci. 2004, 3, 379–390. [Google Scholar] [CrossRef]
  15. Rajaratnam, N.; Katopodis, C.; Mainali, A. Plunging and streaming flows in pool and weir fishways. J. Hydraul. Eng. 1988, 114, 939–944. [Google Scholar] [CrossRef]
  16. Fuentes-Pérez, J.F.; García-Vega, A.; Sanz-Ronda, F.J.; Martínez de Azagra Paredes, A. Villemonte’s approach: Validation of a general method for modeling uniform and non-uniform performance in stepped fishways. Knowl. Manag. Aquat. Ecosyst. 2017, 418, 11. [Google Scholar] [CrossRef]
  17. Rajaratnam, N.; Van der Vinne, G.; Katopodis, C. Hydraulics of vertical slot fishways. J. Hydraul. Eng. 1986, 112, 909–927. [Google Scholar] [CrossRef]
  18. Branco, P.; Santos, J.M.; Katopodis, C.; Pinheiro, A.; Ferreira, M.T. Pool-Type Fishways: Two Different Morpho-Ecological Cyprinid Species Facing Plunging and Streaming Flows. PLoS ONE 2013, 8, e65089. [Google Scholar] [CrossRef] [PubMed]
  19. Piper, A.T.; Wright, R.M.; Kemp, P.S. The influence of attraction flow on upstream passage of European eel (Anguilla anguilla) at intertidal barriers. Ecol. Eng. 2012, 44, 329–336. [Google Scholar] [CrossRef]
  20. Thompson, C. Effect of Flow on Performance and Behavior of Chinook Salmon in Fishways; No. 601.; US Department of the Interior, Bureau of Commercial Fisheries: Fairfax, VA, USA, 1970. [Google Scholar]
  21. Collins, C.; Elling, C. Fishway Research at the Fisheries-Engineering Research Laboratory; United States, Department of the Interior, Fish and Wildlife Service, Bureau of Commercial Fisheries: Fairfax, VA, USA, 1960. [Google Scholar]
  22. Fjeldstad, H.-P.; Alfredsen, K.; Forseth, T. Atlantic salmon fishways: The Norwegian experiences. Vann 2013, 2, 191–204. [Google Scholar]
  23. Kondratieff, M.C.; Myrick, C.a. How High Can Brook Trout Jump? A Laboratory Evaluation of Brook Trout Jumping Performance. Trans. Am. Fish. Soc. 2006, 135, 361–370. [Google Scholar] [CrossRef]
  24. Weaver, C.R. Fluence of Water Velocity upon Orientation and Perform-Ance of Adult Migrating Salmonids. Fish. Bull. Fish Wildl. Serv. 1964, 63, 97–121. [Google Scholar]
  25. Liu, M.; Rajaratnam, N.; Zhu, D.Z. Mean flow and turbulence structure in vertical slot fishways. J. Hydraul. Eng. 2006, 132, 765–777. [Google Scholar] [CrossRef]
  26. Enders, E.C.; Boisclair, D.; Roy, A.G. The effect of turbulence on the cost of swimming for juvenile Atlantic salmon (Salmo salar). Can. J. Fish. Aquat. Sci. 2003, 60, 1149–1160. [Google Scholar] [CrossRef]
  27. Enders, E.C.; Boisclair, D.; Roy, A.G. A model of total swimming costs in turbulent flow for juvenile Atlantic salmon (Salmo salar). Can. J. Fish. Aquat. Sci. 2005, 62, 1079–1089. [Google Scholar] [CrossRef] [Green Version]
  28. Guiny, E.; Ervine, D.A.; Armstrong, J.D. Hydraulic and biological aspects of fish passes for Atlantic salmon. J. Hydraul. Eng. 2005, 131, 542–553. [Google Scholar] [CrossRef]
  29. Aaserude, R.; Orsborn, J. New Concepts in Fish Ladder Design, Volume II of IV, Results of Laboratory and Field Research on New Concepts in Weir and Pool Fishways, 1982–1984 Final. 1985. Available online: https://digital.library.unt.edu/ark:/67531/metadc1100445/ (accessed on 26 February 2022).
  30. Flosi, G.; Downie, S.; Bird, M.; Coey, R.; Collins, B. California Salmonid Stream Habitat Restoration Manual. 2002. Available online: https://creeks.berkeley.edu/publications/california-salmonid-stream-habitat-restoration-manual-4th-ed-part-1 (accessed on 14 February 2022).
  31. Meixler, M.S.; Bain, M.B.; Todd Walter, M. Predicting barrier passage and habitat suitability for migratory fish species. Ecol. Modell. 2009, 220, 2782–2791. [Google Scholar] [CrossRef]
  32. Amaral, S.D.; Branco, P.; Katopodis, C.; Ferreira, M.T.; Pinheiro, A.N.; Santos, J.M. To swim or to jump? Passage behaviour of a potamodromous cyprinid over an experimental broad-crested weir. River Res. Appl. 2018, 34, 174–182. [Google Scholar] [CrossRef]
  33. Beamish, F.W.H. Swimming capacity. In Fish Physiology, Vol. VII. Locomotion; Hoar, W.H., Randall, D.J., Eds.; Academic Press: New York, NY, USA, 1978; pp. 101–187. [Google Scholar]
  34. Haro, A.; Castro-Santos, T.; Noreika, J.; Odeh, M. Swimming performance of upstream migrant fishes in open-channel flow: A new approach to predicting passage through velocity barriers. Can. J. Fish. Aquat. Sci. 2004, 61, 1590–1601. [Google Scholar] [CrossRef]
  35. Ruiz-Legazpi, J.; Sanz-Ronda, F.J.; Bravo-Córdoba, F.J.; Fuentes-Pérez, J.F.; Castro-Santos, T. Influencia de factores ambientales y biométricos en la capacidad de nado del barbo ibérico (Luciobarbus bocagei Steindachner, 1864), un ciprínido potamódromo endémico de la Península Ibérica. Limnetica 2018, 37, 251–265. [Google Scholar] [CrossRef]
  36. David, G.; Céline, C.; Morgane, B.; Franck, C. Ecological connectivity of the upper Rhône River: Upstream fish passage at two successive large hydroelectric dams for partially migratory species. Ecol. Eng. 2022, 178, 106545. [Google Scholar] [CrossRef]
  37. Brett, J.R. Energetic Responses of Salmon to Temperature. A Study of Some Thermal Relations in the Physiology and Freshwater Ecology of Sockeye Salmon (Oncorhynchus nerkd). Am. Zool. 1971, 11, 99–113. [Google Scholar] [CrossRef]
  38. Francis, F. Reports on Salmon Ladders; Horace Cox, 346, Strand, W.C.: London, UK, 1870. [Google Scholar]
  39. Doadrio, I.; Perea, S.; Garzón-Heydt, P.; González, J.L. Ictiofauna Continental Española: Bases Para Su Seguimiento; Ministerio de Medio Ambiente y Medio Rural y Marino: Madrid, Spain, 2011. [Google Scholar]
  40. CHC Río Cares. Las cuencas Cantábricas; 2016. Available online: https://www.chcantabrico.es/las-cuencas-cantabricas/marco-fisico/hidrologia/rios/cares (accessed on 3 April 2022).
  41. Huet, M. Biologie, profils en long et en travers des eaux courantes. Bull. Français Piscic. 1954, 175, 41–53. [Google Scholar] [CrossRef]
  42. Illies, J.; Botoseanu, L. Problèmes et méthodes de la classification et de la-zonation écologique des eaux courantes, considérées surtout-du point de vue faunistique. Mitt. Int. Ver. Fuer Theor. Unde Amgewandte Limnol. 1963, 12, 1–57. [Google Scholar] [CrossRef]
  43. Rosgen, D.L.; Silvey, H.L. Applied River Morphology; Wildland Hydrology: Pagosa Springs, CO, USA, 1996; Volume 1481. [Google Scholar]
  44. IGME. Estudio Hidrogeológico de la Cuenca Norte de España (Asturias); 1982. Available online: info.igme.es/SidPDF/018000/829/Volumen%204%20Informe%20t%C3%A9cnico%202/18829_0006.pdf (accessed on 27 March 2022).
  45. Allison, P.D. Survival Analysis using Sas: A Practical Guide; SAS Institute: Cary, NC, USA, 2010. [Google Scholar]
  46. O’Brien, R.M. A Caution Regarding Rules of Thumb for Variance Inflation Factors. Qual. Quant. 2007, 41, 673–690. [Google Scholar] [CrossRef]
  47. Kleinbaum, D.G.; Klein, M. Survival analysis: A Self-Learning Text, 3rd ed.; Springer: Berlin/Heidelberg, Germany, 2010; ISBN 1441966455. [Google Scholar]
  48. Akaike, H. A new look at the statistical model Identification. IEEE Trans. Automat. Contr. 1974, 19, 716–723. [Google Scholar] [CrossRef]
  49. Towler, B.; Orvis, C.; Dow, D.; Haro, A. Fishway Inspection Guidelines; Univeristy of Massachusetts Amherst: Amherst, MA, USA, 2013; Volume 18. [Google Scholar]
  50. Baudoin, J.-M.; Burgun, V.; Chanseau, M.; Larinier, M.; Ovidio, M.; Sremski, W.; Steinbach, P.; Voegtle, B. Assessing the Passage of Obstacles by Fish. Concepts, Design and Application; Onema: Paris, France, 2015. [Google Scholar]
  51. Valbuena-Castro, J.; Fuentes-Pérez, J.F.; García-Vega, A.; Bravo-Córdoba, F.J.; Ruiz-Legazpi, J.; Martínez de Azagra-Paredes, A.; Sanz-Ronda, F.J. Coarse fishway assessment to prioritize retrofitting efforts: A case study in the Duero River basin. Ecol. Eng. 2020, 155, 105946. [Google Scholar] [CrossRef]
  52. Silva, A.T.; Lucas, M.C.; Castro-Santos, T.; Katopodis, C.; Baumgartner, L.J.; Thiem, J.D.; Aarestrup, K.; Pompeu, P.S.; O’Brien, G.C.; Braun, D.C. The future of fish passage science, engineering, and practice. Fish Fish. 2018, 19, 340–362. [Google Scholar] [CrossRef]
  53. Fuentes-Pérez, J.F.; Sanz-Ronda, F.J.; Martínez de Azagra-Paredes, A.; García-Vega, A. Non-uniform hydraulic behavior of pool-weir fishways: A tool to optimize its design and performance. Ecol. Eng. 2016, 86, 5–12. [Google Scholar] [CrossRef]
  54. Fuentes-Pérez, J.F.; Silva, A.T.; Tuhtan, J.A.; García-Vega, A.; Carbonell-Baeza, R.; Musall, M.; Kruusmaa, M. 3D modelling of non-uniform and turbulent flow in vertical slot fishways. Environ. Model. Softw. 2018, 99, 156–169. [Google Scholar] [CrossRef]
  55. DWA. Fischaufstiegsanlagen und Fischpassierbare Bauwerke. Gestaltung, Bemessung, Qualitätssicherung; Merkblatt DWA -M; DWA: Hennef, Germany, 2014; ISBN 9783942964913. [Google Scholar]
  56. Castro-Santos, T.; Sanz-Ronda, F.J.; Ruiz-Legazpi, J. Breaking the speed limit- comparative sprinting performance of brook trout (Salvelinus fontinalis) and brown trout (Salmo trutta). Can. J. Fish. Aquat. Sci. 2013, 70, 280–293. [Google Scholar] [CrossRef]
  57. Larinier, M.; Travade, F.; Porcher, J.P. Fishways: Biological basis, design criteria and monitoring. Bull. Français la Pêche la Piscic. 2002, 364, 208. [Google Scholar]
  58. Cooke, S.J.; Hinch, S.G. Improving the reliability of fishway attraction and passage efficiency estimates to inform fishway engineering, science, and practice. Ecol. Eng. 2013, 58, 123–132. [Google Scholar] [CrossRef]
  59. Ovidio, M.; Sonny, D.; Dierckx, A.; Watthez, Q.; Bourguignon, S.; de le Court, B.; Detrait, O.; Benitez, J.P. The use of behavioural metrics to evaluate fishway efficiency. River Res. Appl. 2017, 33, 1484–1493. [Google Scholar] [CrossRef]
  60. Bunt, C.M.; Castro-Santos, T.; Haro, A. Reinforcement and Validation of the Analyses and Conclusions Related to Fishway Evaluation Data from Bunt et al.: “Performance of Fish Passage Structures at Upstream Barriers to Migration”. River Res. Appl. 2016, 32, 2125–2137. [Google Scholar] [CrossRef]
  61. Elling, C.; Raymond, H. Fishway Capacity Experiment, 1956; US Department of Interior, Fish and Wildlife Service: Fairfax, VA, USA, 1959. [Google Scholar]
  62. USFWS (U.S. Fish and Wildlife Service). Fish Passage Engineering Design Criteria; USFWS: Hadley, MA, USA, 2017. [Google Scholar]
  63. Sánchez-González, J.R.; Morcillo, F.; Ruiz-Legazpi, J.; Sanz-Ronda, F.J. Fish morphology and passage through velocity barriers. Experience with northern straight-mouth nase (Pseudochondrostoma duriense Coelho, 1985) in an open channel flume. Hydrobiologia 2022, 849, 1351–1366. [Google Scholar] [CrossRef]
  64. Thurow, R.F. Life Histories of Potamodromous Fishes. In An Introduction to Fish Migration; Morais, P., Daverat, F., Eds.; CRC Press: Boca Raton, FL, USA, 2016; p. 29. [Google Scholar]
  65. Sanz-Ronda, F.J.; Bravo-Córdoba, F.J.; Sánchez-Pérez, A.; García-Vega, A.; Valbuena-Castro, J.; Fernandes-Celestino, L.; Torralva, M.; Oliva-Paterna, F.J. Passage Performance of Technical Pool-Type Fishways for Potamodromous Cyprinids: Novel Experiences in Semiarid Environments. Water 2019, 11, 2362. [Google Scholar] [CrossRef]
  66. Froese, R. Cube law, condition factor and weight–length relationships: History, meta-analysis and recommendations. J. Appl. Ichthyol. 2006, 22, 241–253. [Google Scholar] [CrossRef]
  67. Sanz-Ronda, F.J.; Fuentes-Pérez, J.F.; García-Vega, A.; Bravo-Córdoba, F.J. Fishways as downstream routes in small hydropower plants: Experiences with a potamodromous cyprinid. Water 2021, 13, 1041. [Google Scholar] [CrossRef]
  68. Fuentes-Pérez, J.F.; García-Vega, A.; Bravo-Córdoba, F.J.; Sanz-Ronda, F.J. A Step to Smart Fishways: An Autonomous Obstruction Detection System Using Hydraulic Modeling and Sensor Networks. Sensors 2021, 21, 6909. [Google Scholar] [CrossRef]
  69. Tamario, C.; Sunde, J.; Petersson, E.; Tibblin, P.; Forsman, A. Ecological and Evolutionary Consequences of Environmental Change and Management Actions for Migrating Fish. Front. Ecol. Evol. 2019, 7, 271. [Google Scholar] [CrossRef] [Green Version]
Figure 1. Location of the study site (Iberian Peninsula, Asturias, Cares River).
Water 14 02750 g001
Figure 2. (a) Experimental set-up. “A” refers to PIT antennas (four antennas were installed in the structure). (b) Front view and cross-section of the notches. (c) A 3D scheme of the fishway under study. Link to view the real image of the fishway through Google Street View: https://goo.gl/maps/NuVyGgFv9bHhyas89 (accessed on 15 July 2022).
Water 14 02750 g002
Figure 3. Numerical simulation of the fishway. (a) Pool depth of 1.8 m. (b) Pool depth of 5 m; dotted red line indicates the depth of 1.8 m.
Water 14 02750 g003
Figure 4. (a) Kaplan–Meier curves of the transit time (min/m) and (b) box-plot and diamond distribution of the passage success; data collected relative to brown trout passage in different pool-weir fishways based on [10] (VS: vertical slot; SNBO: submerged notch and bottom orifice; PN: plunging notch). The black solid line in (a) and the black dot in (b) represent the results of the present case study. Dashed lines represent studies with free trial conditions, whereas solid lines represent confined trial conditions.
Water 14 02750 g004
Figure 5. Left column graphs: illustrative log-logistic survival models as a function of body length (20, 25, and 30 cm, which represents 95% of the fish sample under study) for the different metrics. Middle column graphs: probability plots for evaluating the fit of the different models (ideally the points on the plot form a linear pattern and should lie within the 95% confidence bands which are shaded in blue). Right column graphs: box-plot and diamond distribution for the different metrics (body length was categorized in three groups of 20, 25, and 30 cm, respectively).
Water 14 02750 g005
Table 1. Mean geometric and hydraulic variables for the studied fishway. Range of values in brackets.
VariablesValues
Number of pools20
Total water height 113.33 m
Pool dimension 1
  Length1.85 (1.50–2.00) m
  Width2.70 (2.50–3.50) m
  Depth1.80 (1.00–5.00) m
Width of the notch 10.60–0.90 m
Thickness of the notch 11.60 m
Maximum water velocity at the notches 23.40 (2.80–3.81) m/s
Drop between pools 10.65 (0.40–0.74)
Slope16.38%
Flow discharge 30.23 ± 0.08 m3/s
Volumetric power dissipation163 (57–390) W/m3
Note: 1 Measured with a total station (model Leica TC307, Heerbrugg, Switzerland). 2 Direct measurements with a propeller meter (Model 2100 Swoffer Instruments Inc., Summer, WA, USA). Velocity measurements were taken along the longitudinal section of the jet over the notch between pools. The maximum velocity value (shown in Table 1) corresponds to the lower part of the notch. 3 Calculated according to [16].
Table 2. Fish samples. N: number of tagged fish. SD: Standard Deviation. Range: minimum and maximum. K: condition factor (100 × weight/length3). The p corresponds to the p-value of the Student’s t-tests for comparison between groups. Fork length was the body length type measurement.
Salmo truttaNBody Length (cm)Weight (g)K (g/cm3)
Mean ± SDRangeMean ± SDRangeMean ± SDRange
Group 13524.7 ± 4.017.5–40.5193 ± 10858–7101.19 ± 0.110.84–1.46
Group 23424.6 ± 2.620.2–30.5181 ± 6094–3561.18 ± 0.080.97–1.36
p = 0.564p = 0.867p = 0.563
Table 3. Estimation of the parameters of the Cox Proportional Hazard models (β: regression coefficient; HR: Hazard Ratio = exp(β); SE: Standard Error) for the response variables in relation to the body length (in mm), the condition factor, and the fishway section (the latter only for the evaluation of transit time by fishway section).
β ± SEp-ValueHR
Transit time (n = 11)
Body length (mm)0.038 ± 0.0190.0481.038
Condition factor 0.362
Transit time by fishway section (n = 37)
Body length (mm)0.022 ± 0.005<0.0011.022
Condition factor 0.080
Fishway section= upstream sectionReference level
Fishway section = downstream section−1.724 ± 0.493<0.0010.178
Fishway section = middle section−1.282 ± 0.486<0.0080.277
Height exceeded (n = 69)
Body length (mm)−0.021 ± 0.0060.0010.980
Condition factor 0.697
Time between the beginning and the first attempt (n = 69)
Body length (mm)0.013 ± 0.0040.0021.013
Condition factor 0.263
Table 4. Passage success and transit time per meter of height ascended (min/m) by fishway section (see Figure 2). The median values and ranges of the volumetric power dissipation (VPD), water drop between pools, and pool depth are provided, with the p-value of comparison among sections and superscript letters indicating the pairwise test comparison (if p-value < 0.05).
Downstream SectionMiddle SectionUpstream Section
Passage success
(N success/N attempt)
36% (21/59)71% (15/21)73% (11/15)
Median transit time
(min–max) (min/m)
53 (12–287)41 (16–207)21 (14–52)
Median VPD
(min–max) (W/m3)
243 (114–390) a89 (71–99) ab56 (51–62) b
p-value < 0.001
Median water drop
(min–max) (m)
0.63 (0.39–0.74)0.65 (0.63–0.72)0.64 (0.63–0.66)
p-value = 0.816
Median pool depth
(min–max) (m)
1.01 (0.85–2.5) a3.50 (3.00–4.00) ab5.00 (5.00–6.00) b
p-value < 0.001
Table 5. Summary of the parametric model for the prediction of the response variables (log-logistic was the best-fitted distribution). The β terms are the regression coefficients and SE is the Standard Error (see Figure 5 for the graphical representation).
βSE
Transit time (n = 11)
Intercept4.9990.620
Body length (mm)−0.0060.002
Shape0.1980.048
Transit time by fishway section (n = 37)
Intercept5.6460.786
Body length (mm)−0.0090.003
Fishway section= upstream sectionReference level
Fishway section = downstream0.8040.296
Fishway section = middle0.7840.337
Shape0.4310.059
Height exceeded (n = 69)
Intercept−11.3242.891
Body length (mm)0.0460.012
Shape1.5090.197
Time between the beginning and the first attempt (n = 69)
Intercept9.8831.508
Body length (mm)−0.0190.006
Shape0.9910.107
Publisher’s Note: MDPI stays neutral with regard to jurisdictional claims in published maps and institutional affiliations.

