

Performance Enhancement of Specific Adsorbents for Hardness Reduction of Drinking Water and Groundwater

 ,
,  ,
,  ,
,
Abstract
:1. Introduction
2. Materials and Methods
2.1. Adsorbents and Materials
2.2. Characterization of Adsorbents
2.3. Water Samples
2.4. Adsorption Experiments
2.5. Measurement of Target Parameters
2.5.1. Measurement of Total Hardness
2.5.2. Measurement of the Calcium Hardness
2.5.3. Measurement of Magnesium Hardness
2.6. Adsorption Isotherms
2.7. Adsorption Kinetics
2.7.1. Diffusion-Controlled Adsorption Models
2.7.2. Chemical Reaction-Controlled Adsorption Models
3. Results and Discussion
3.1. Characterization of Zeolite, Alumina, and Activated Carbon
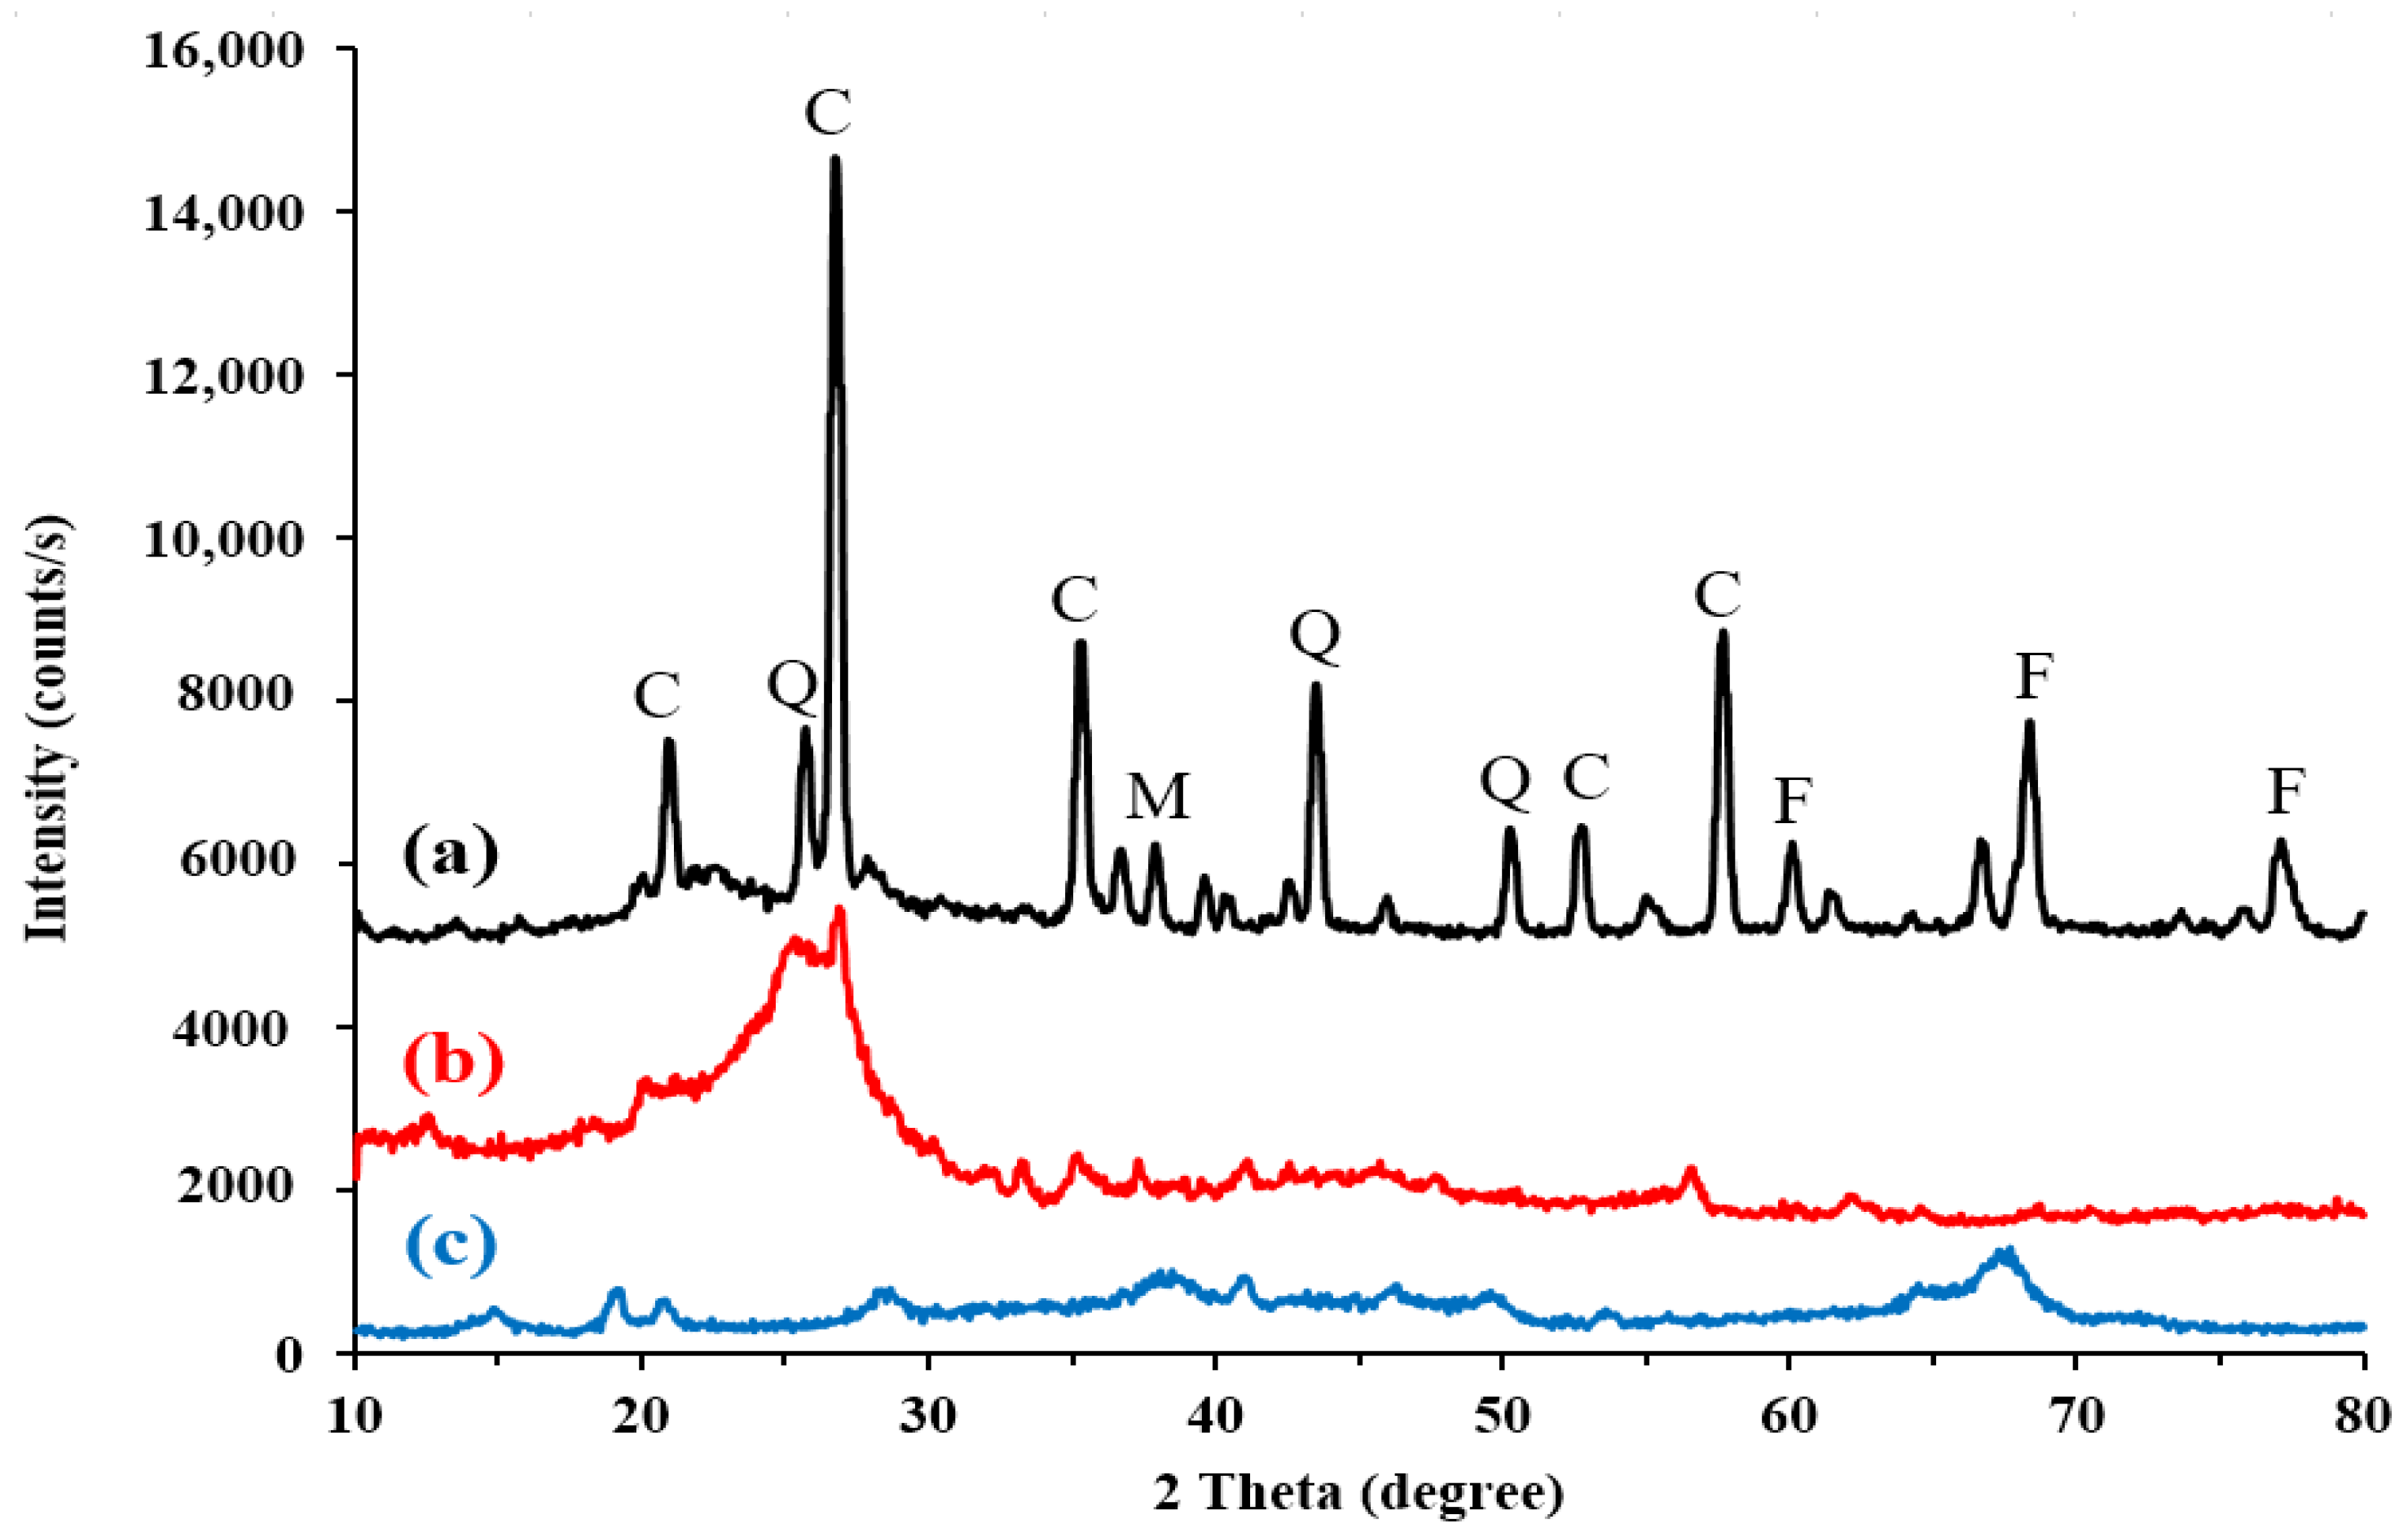
3.1.1. XRD
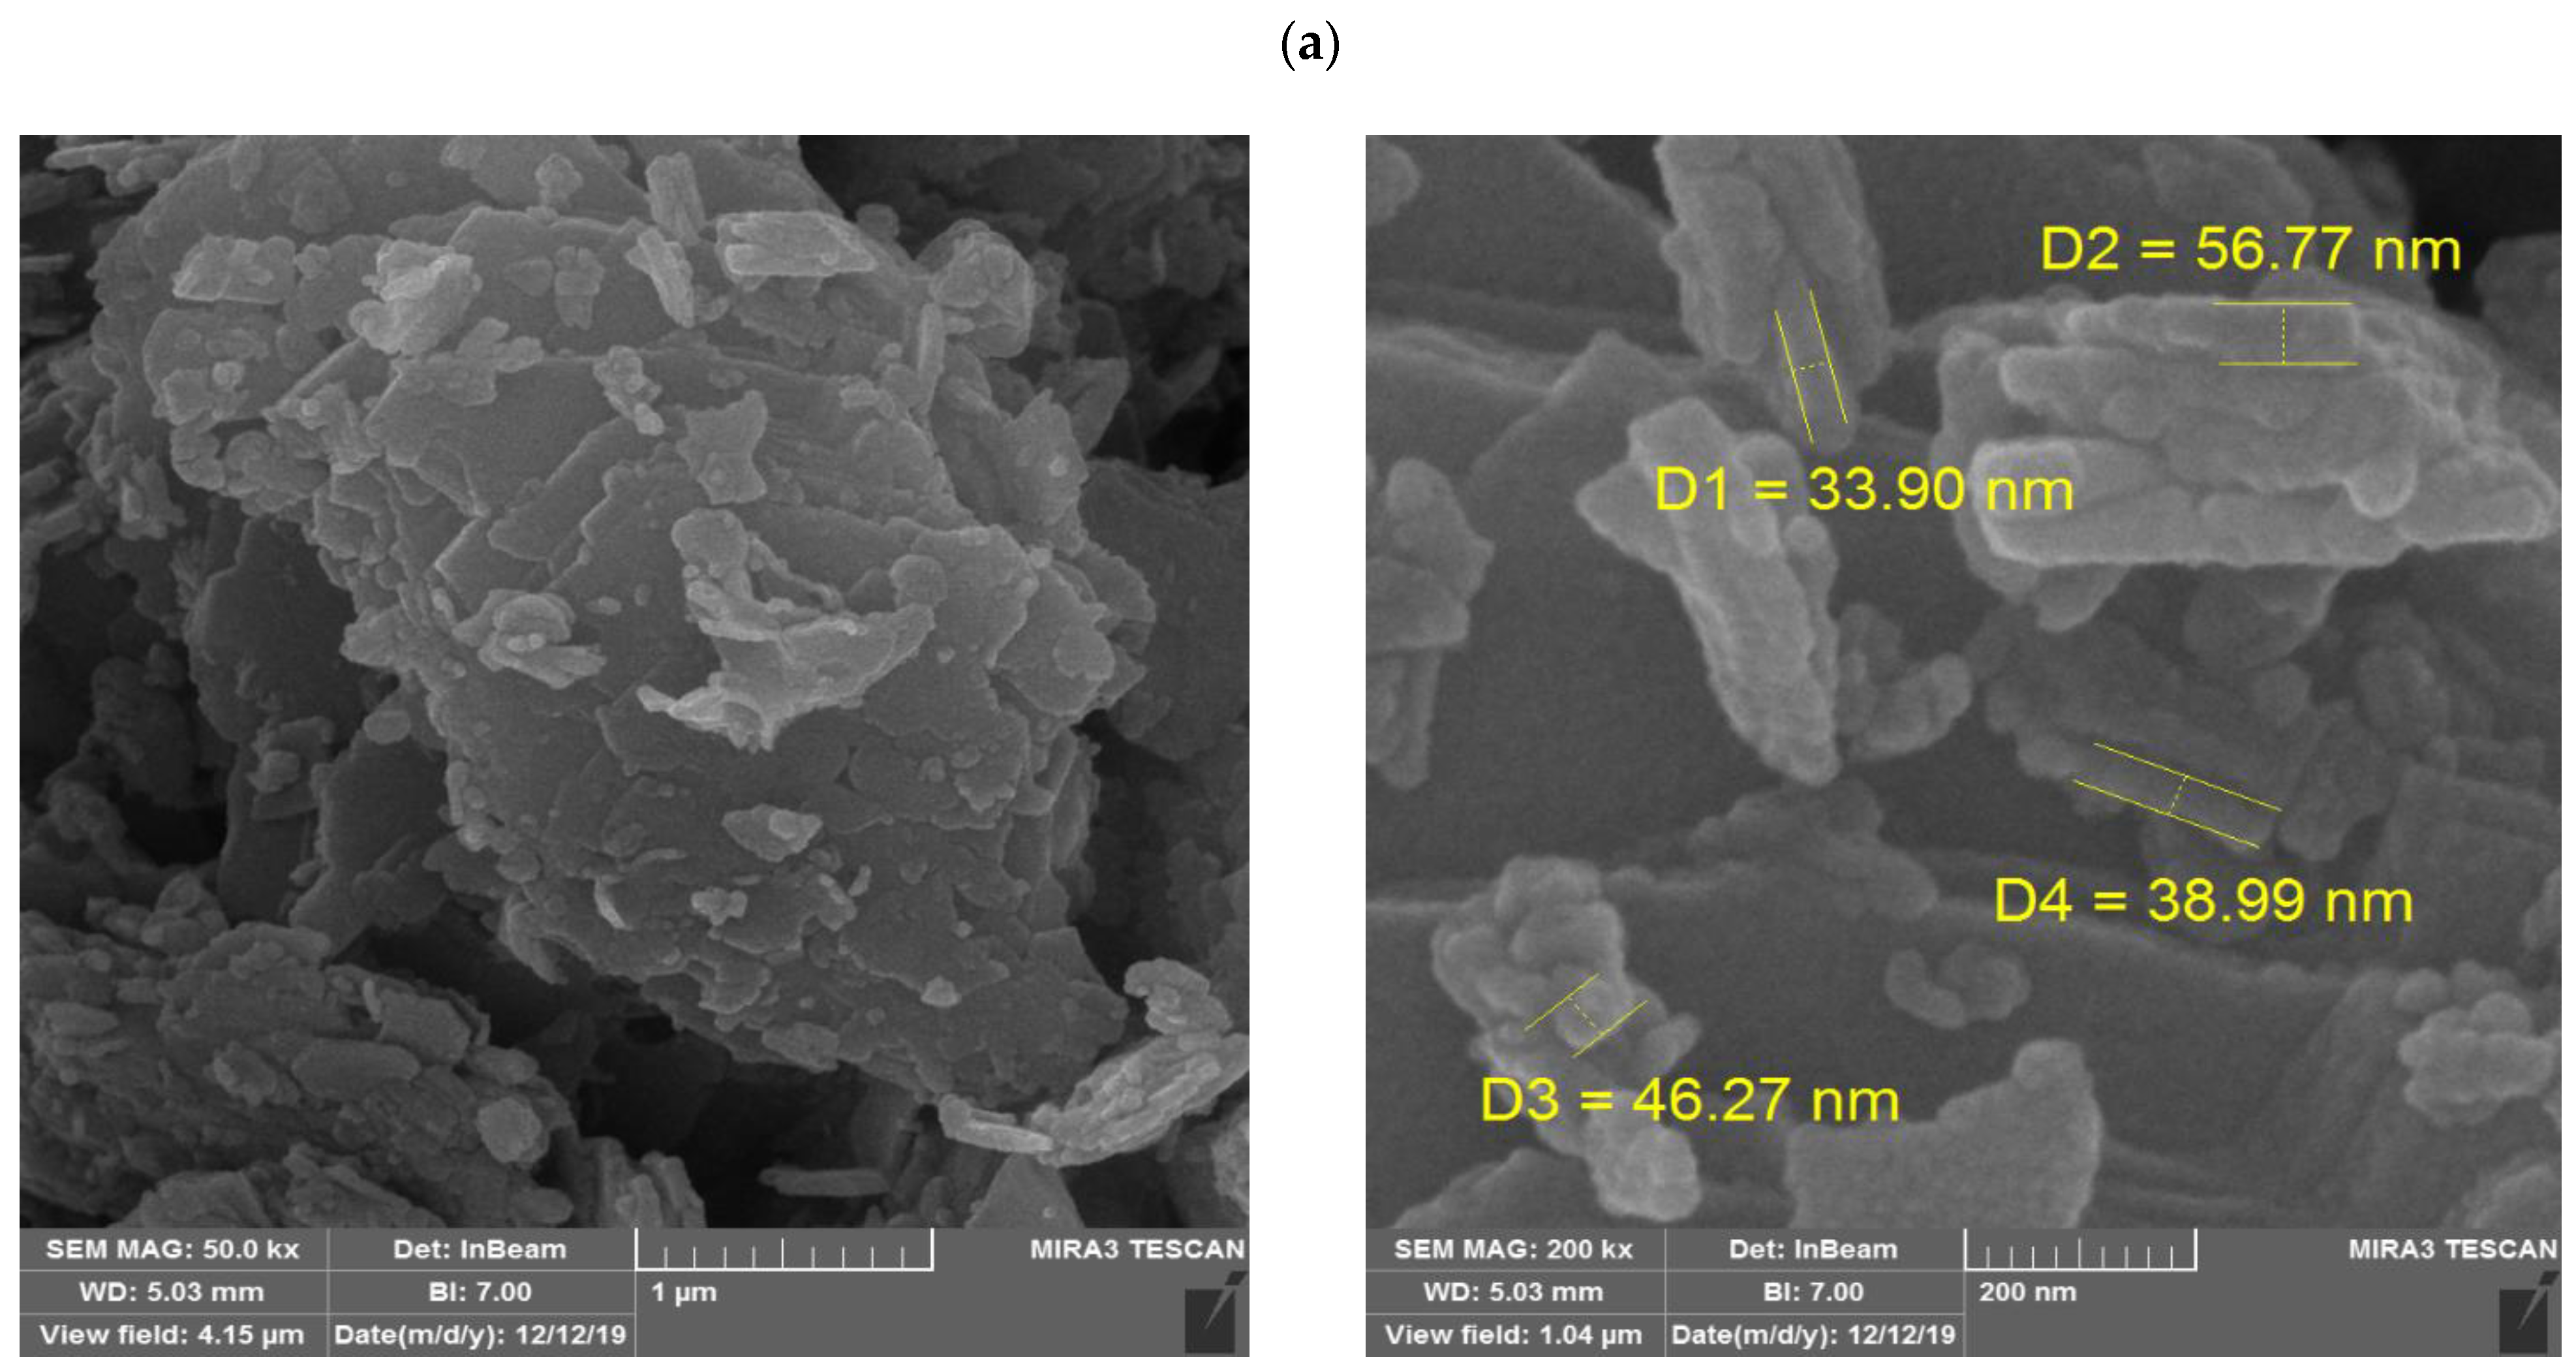
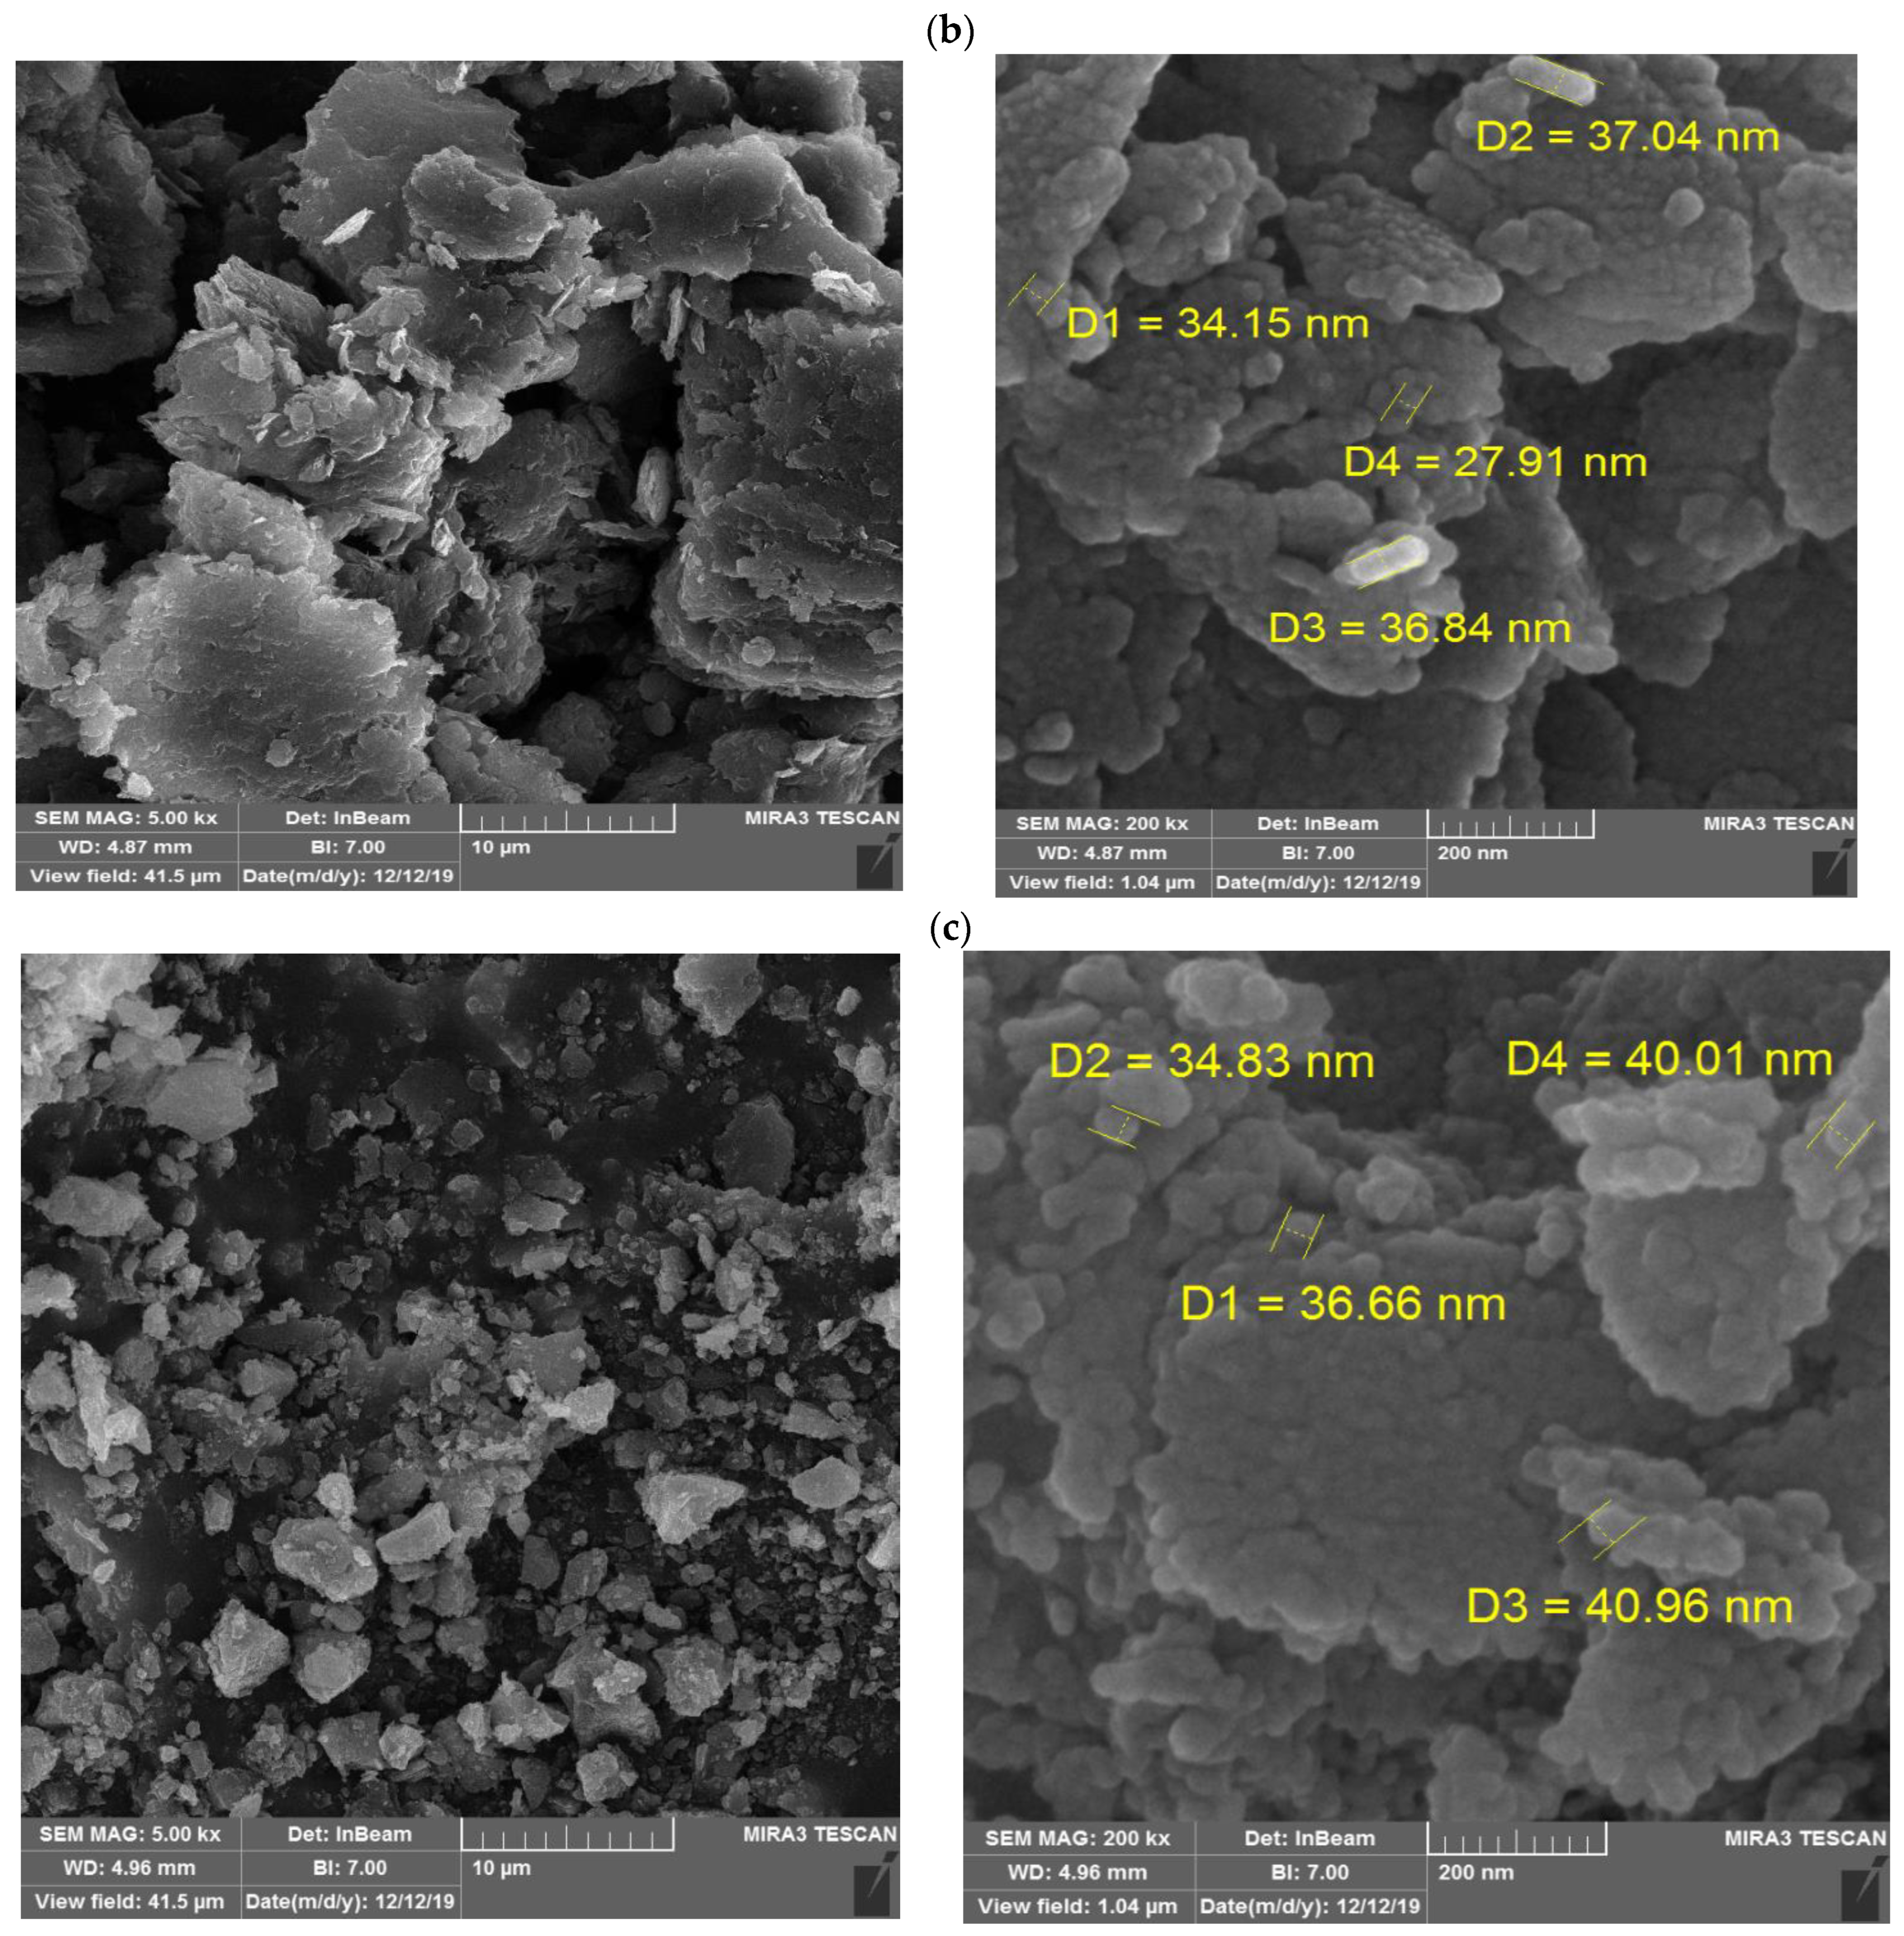
3.1.2. SEM
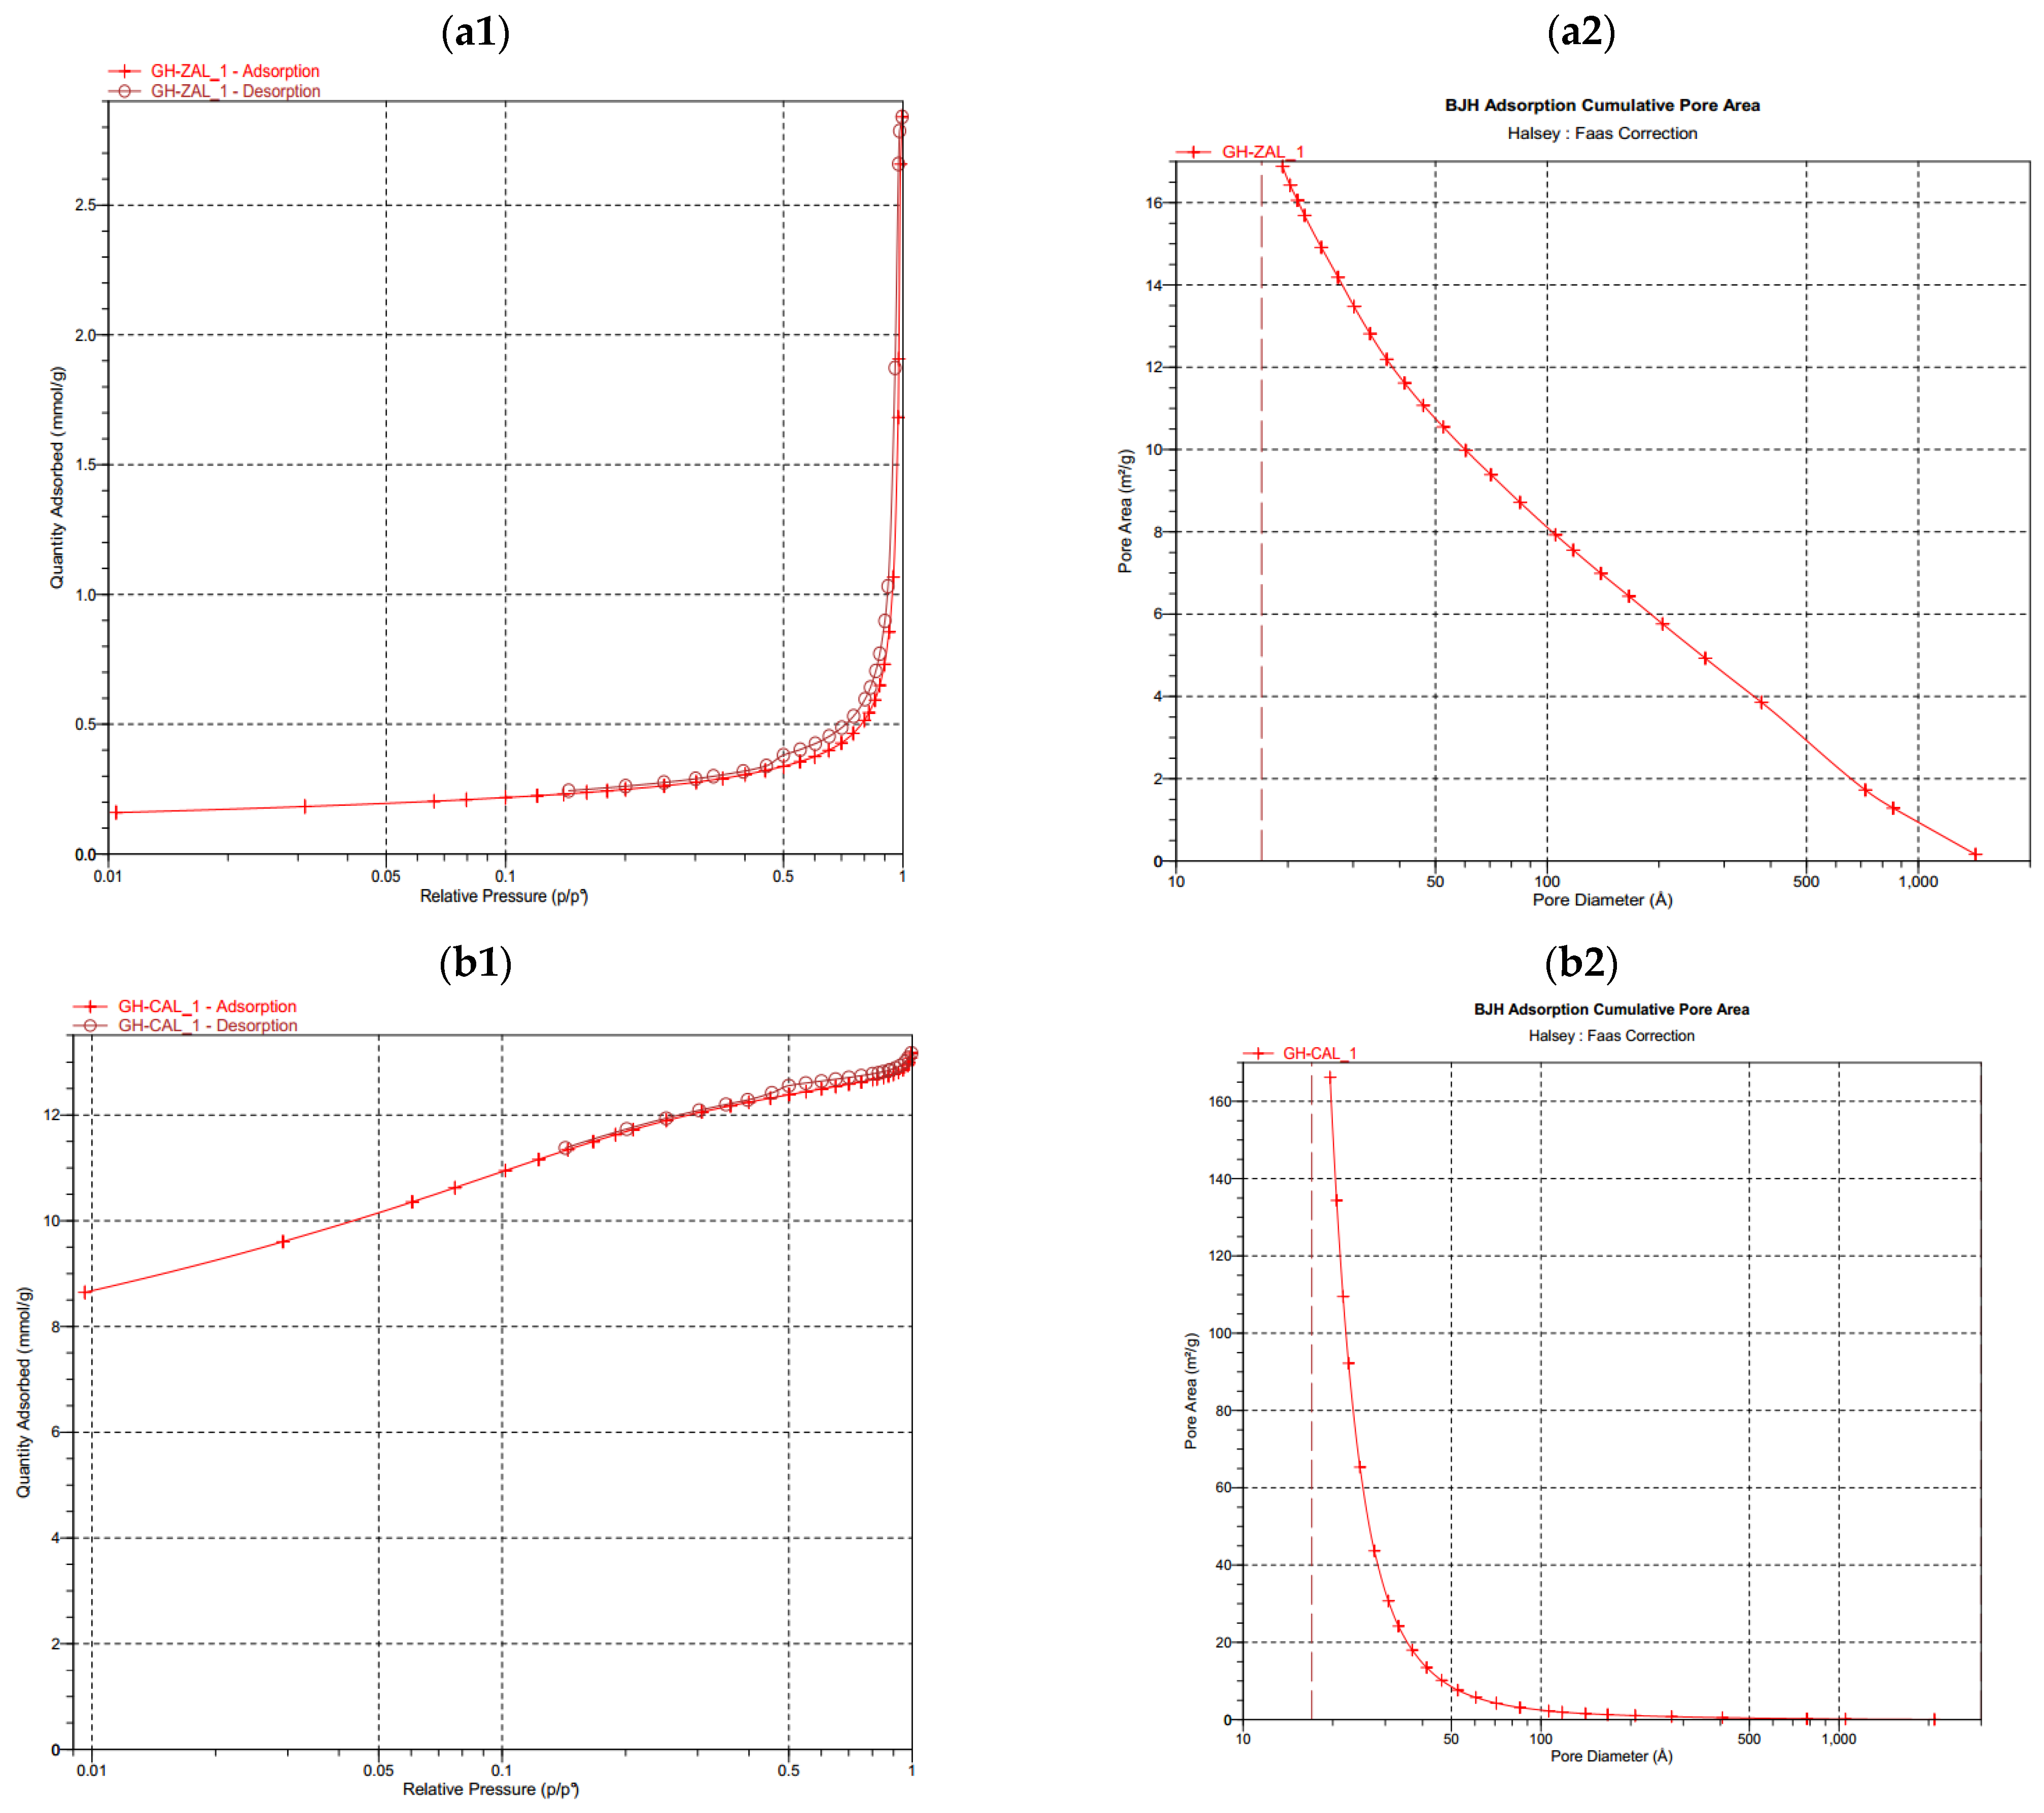
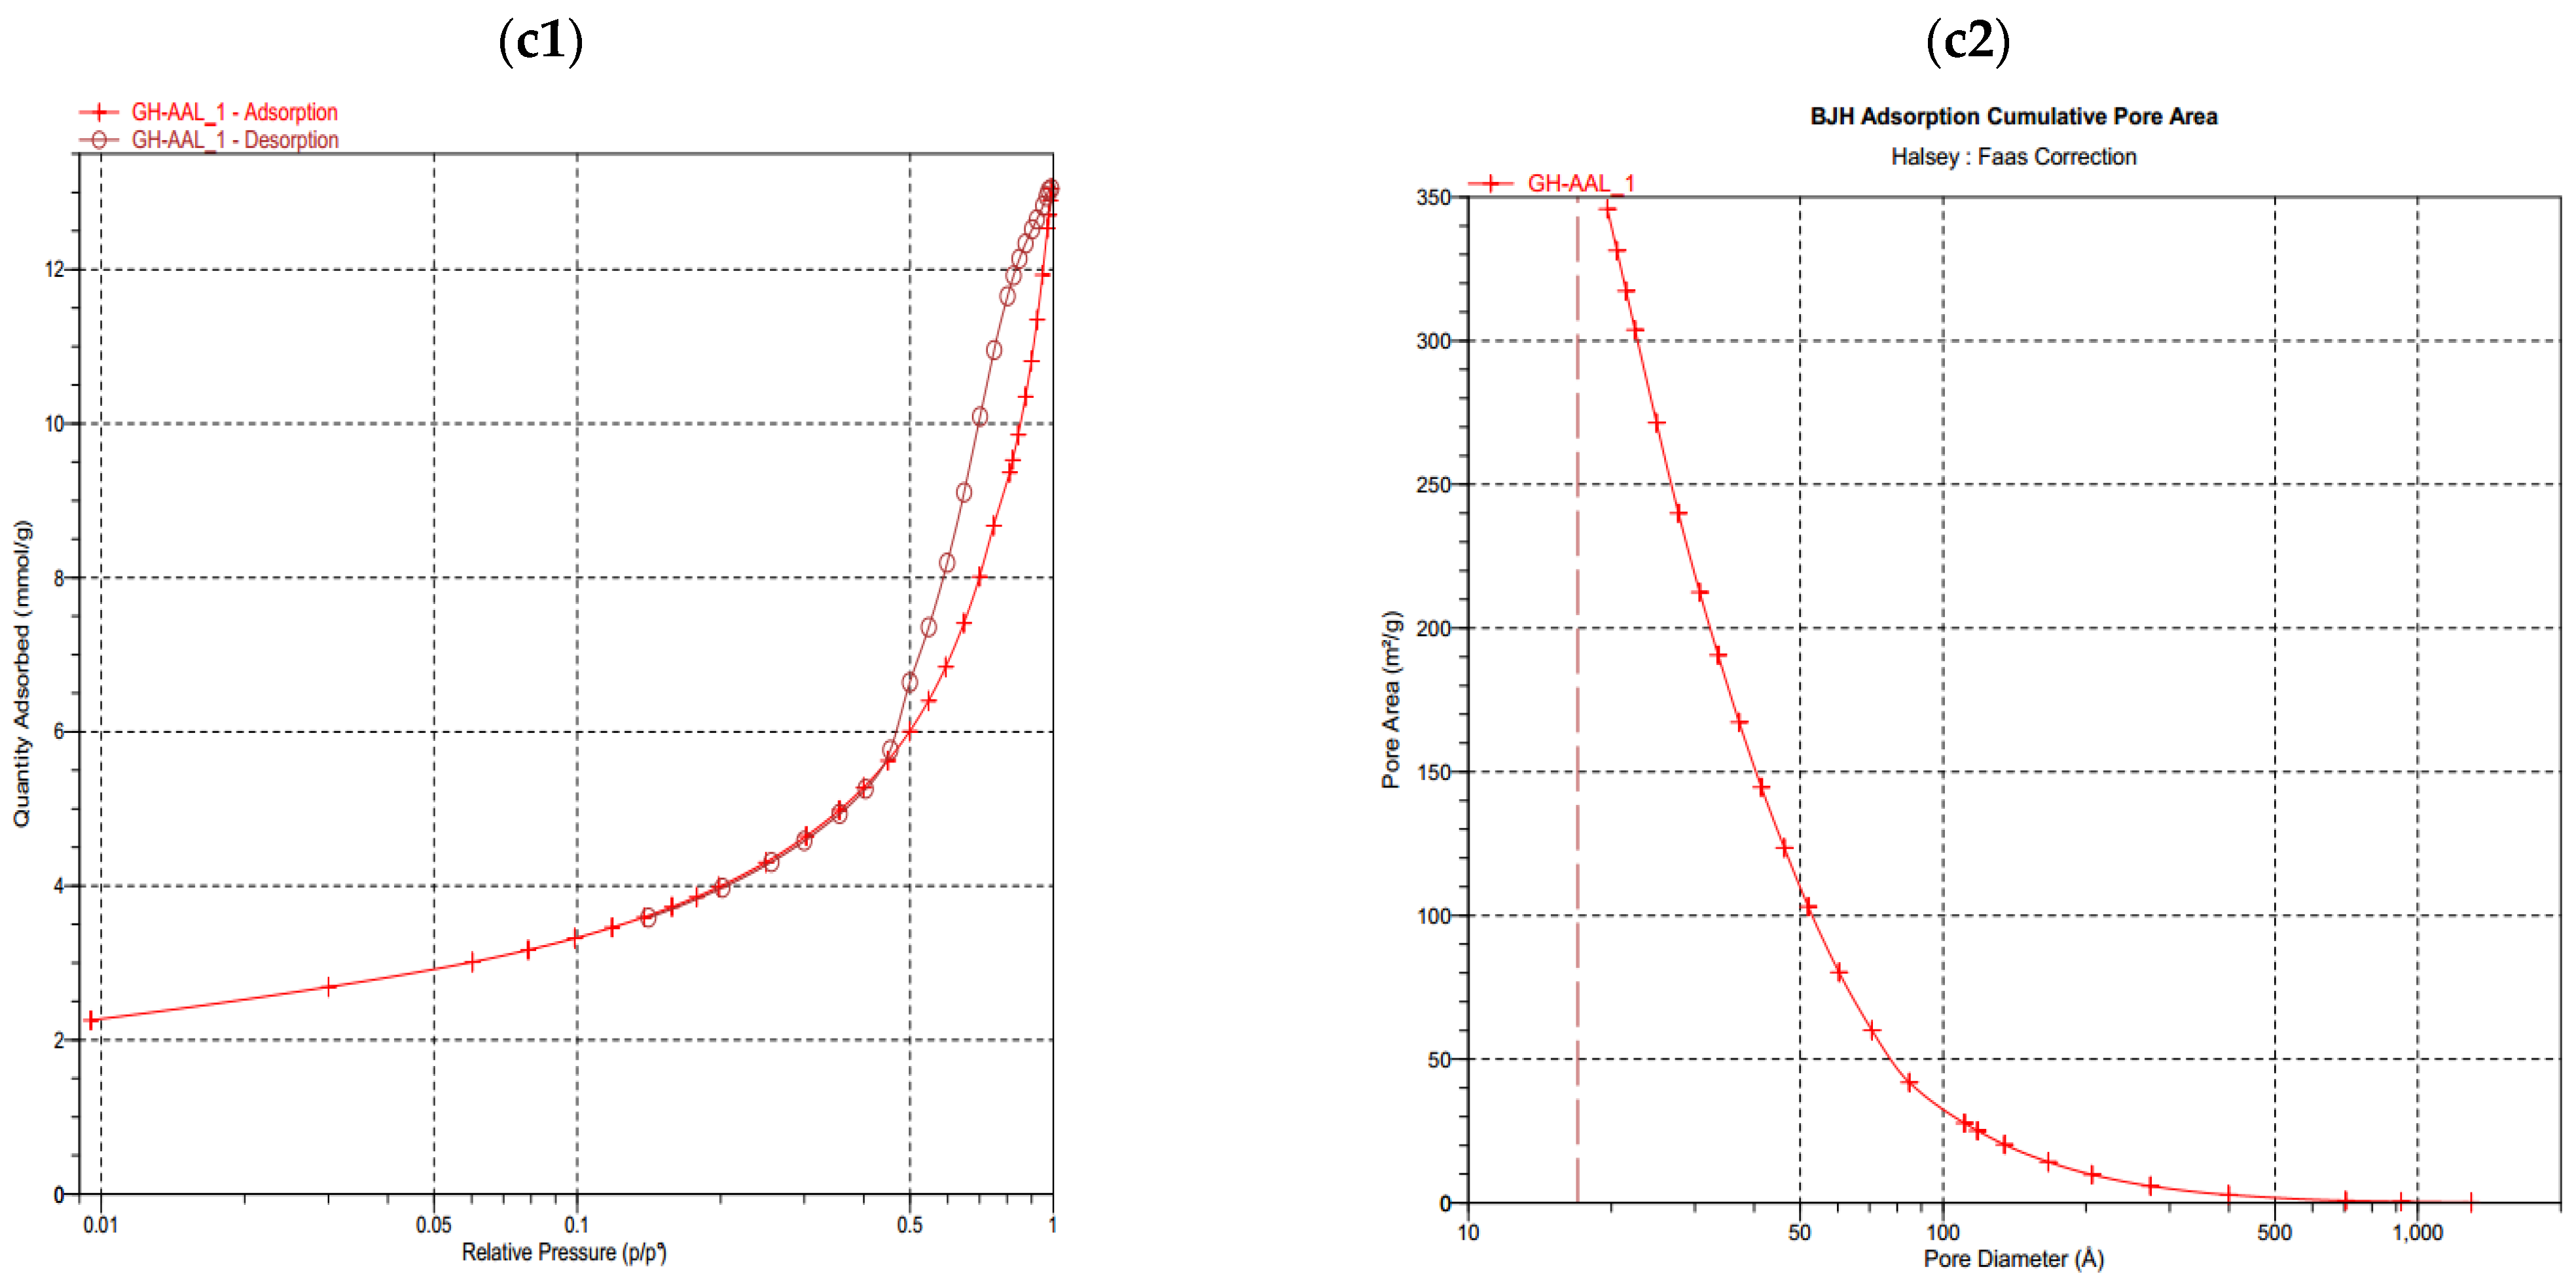
3.1.3. BET
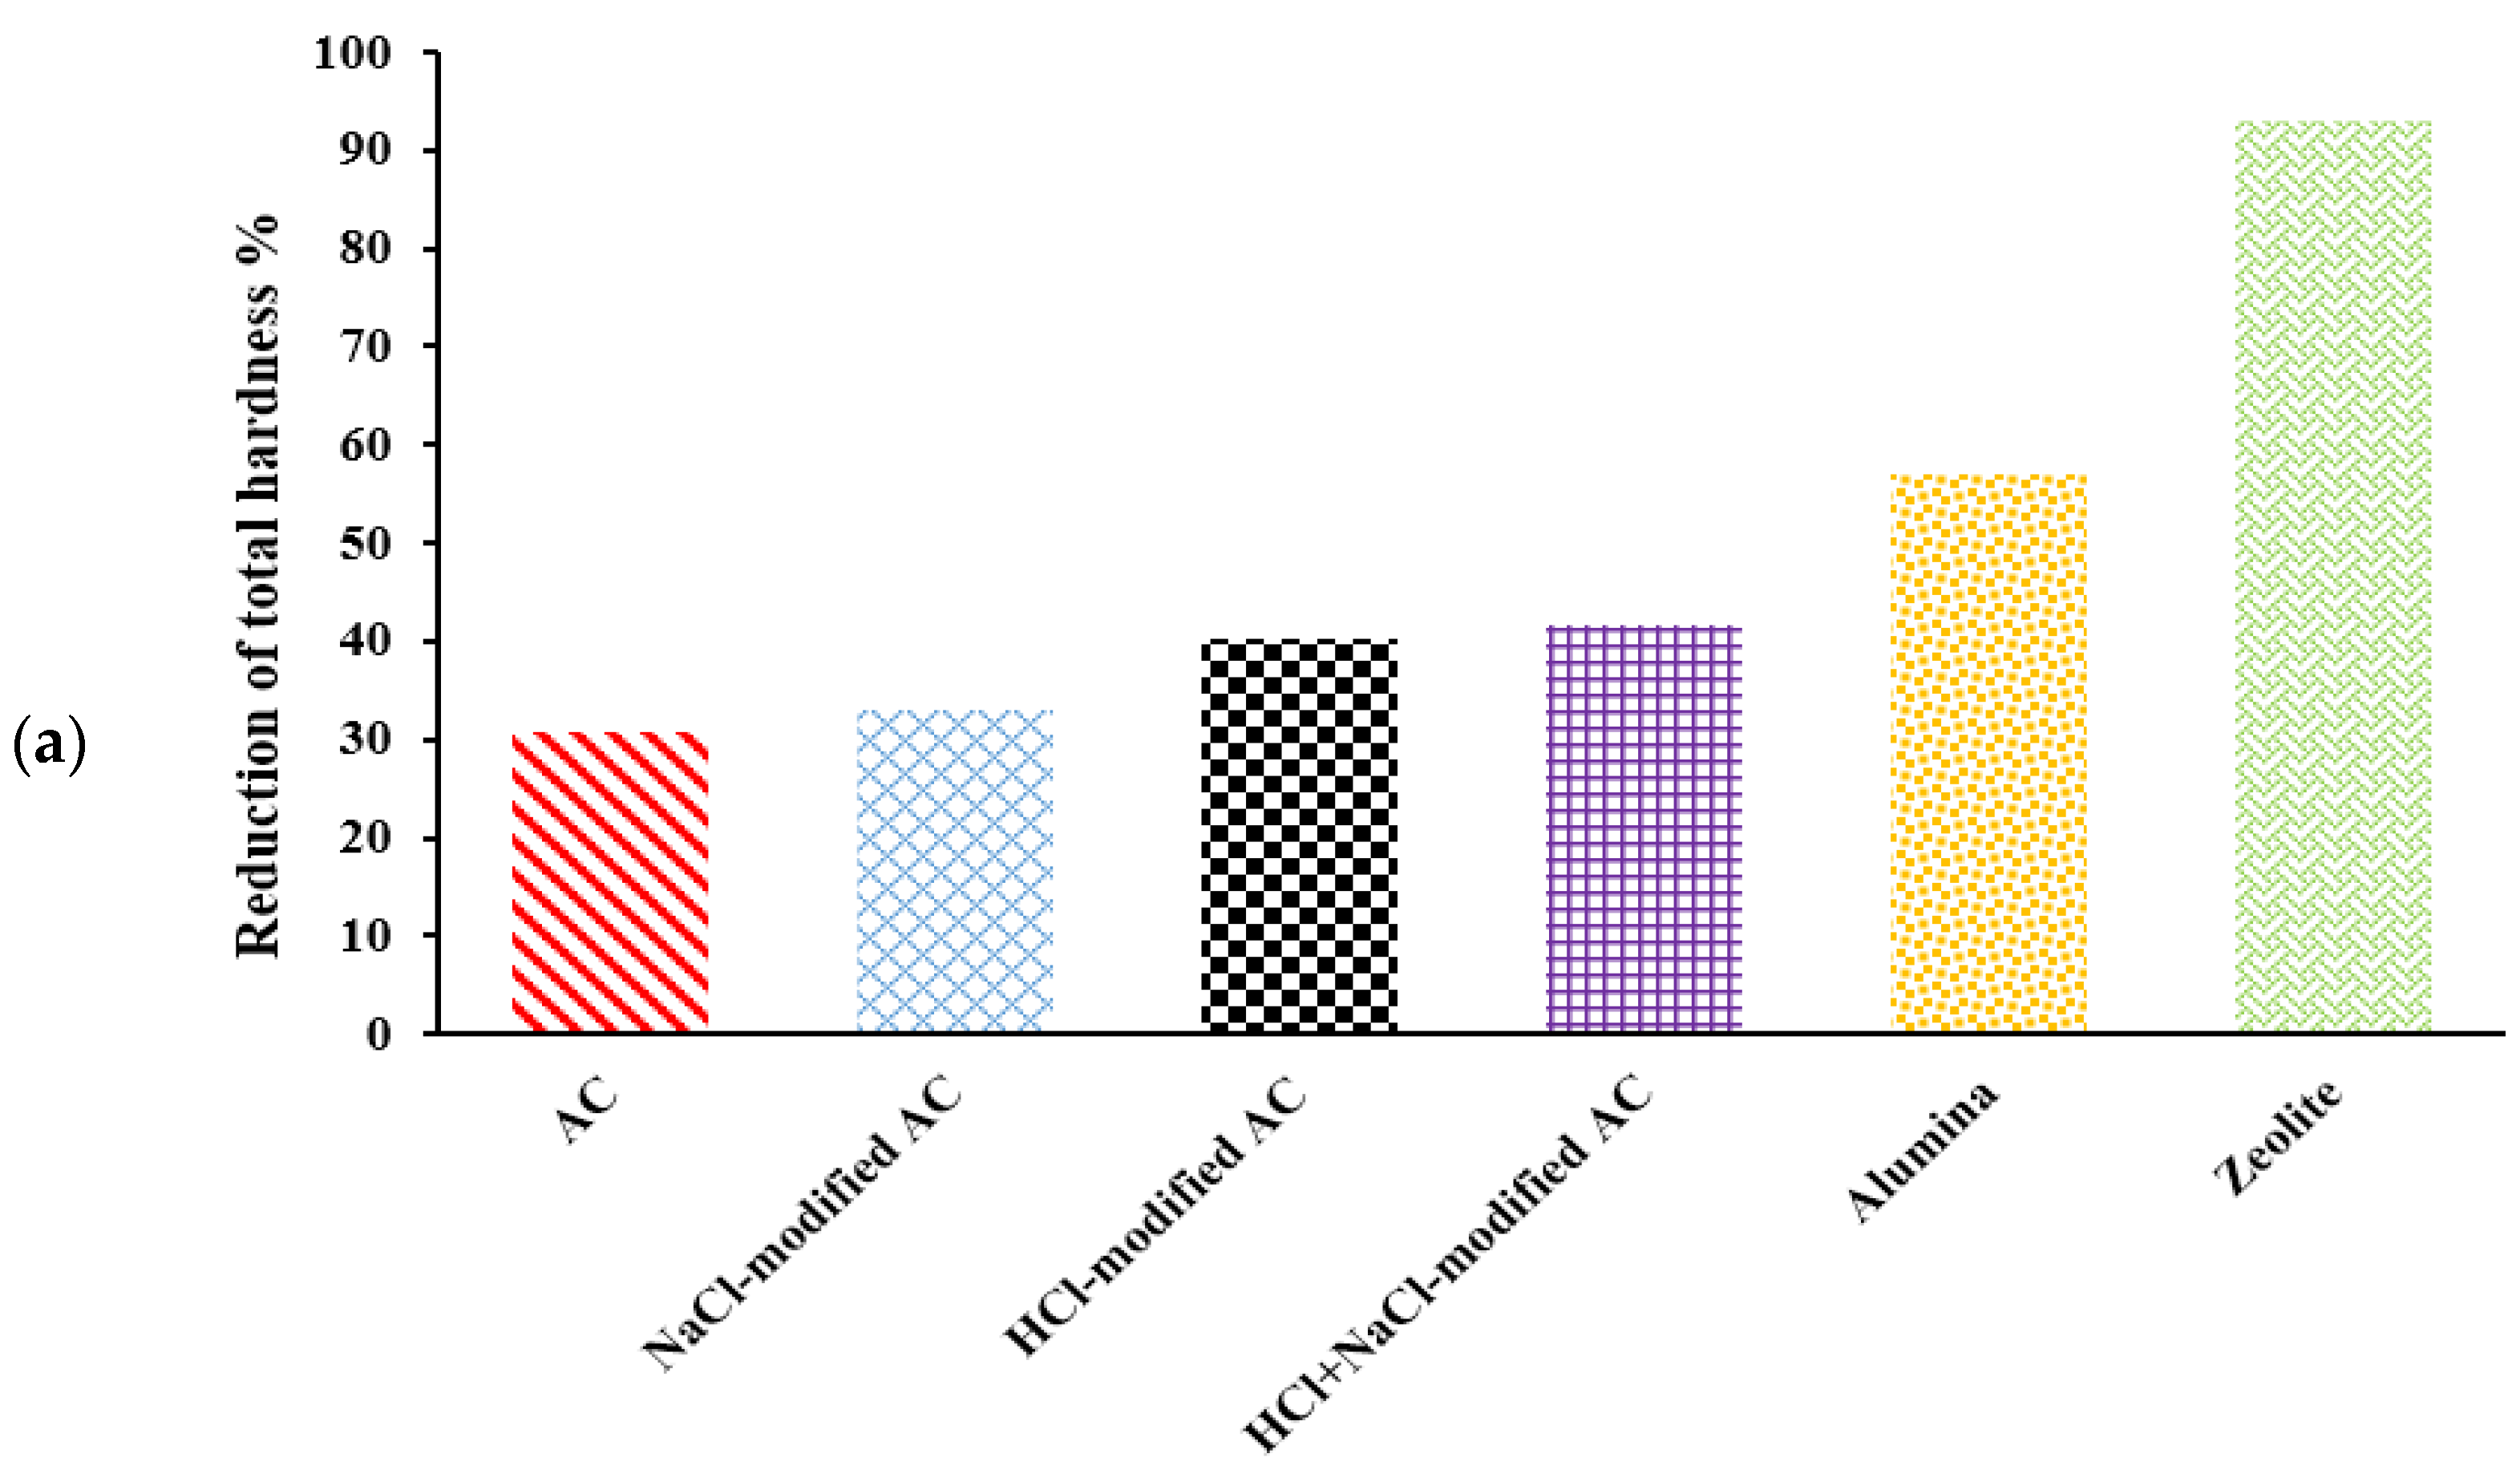
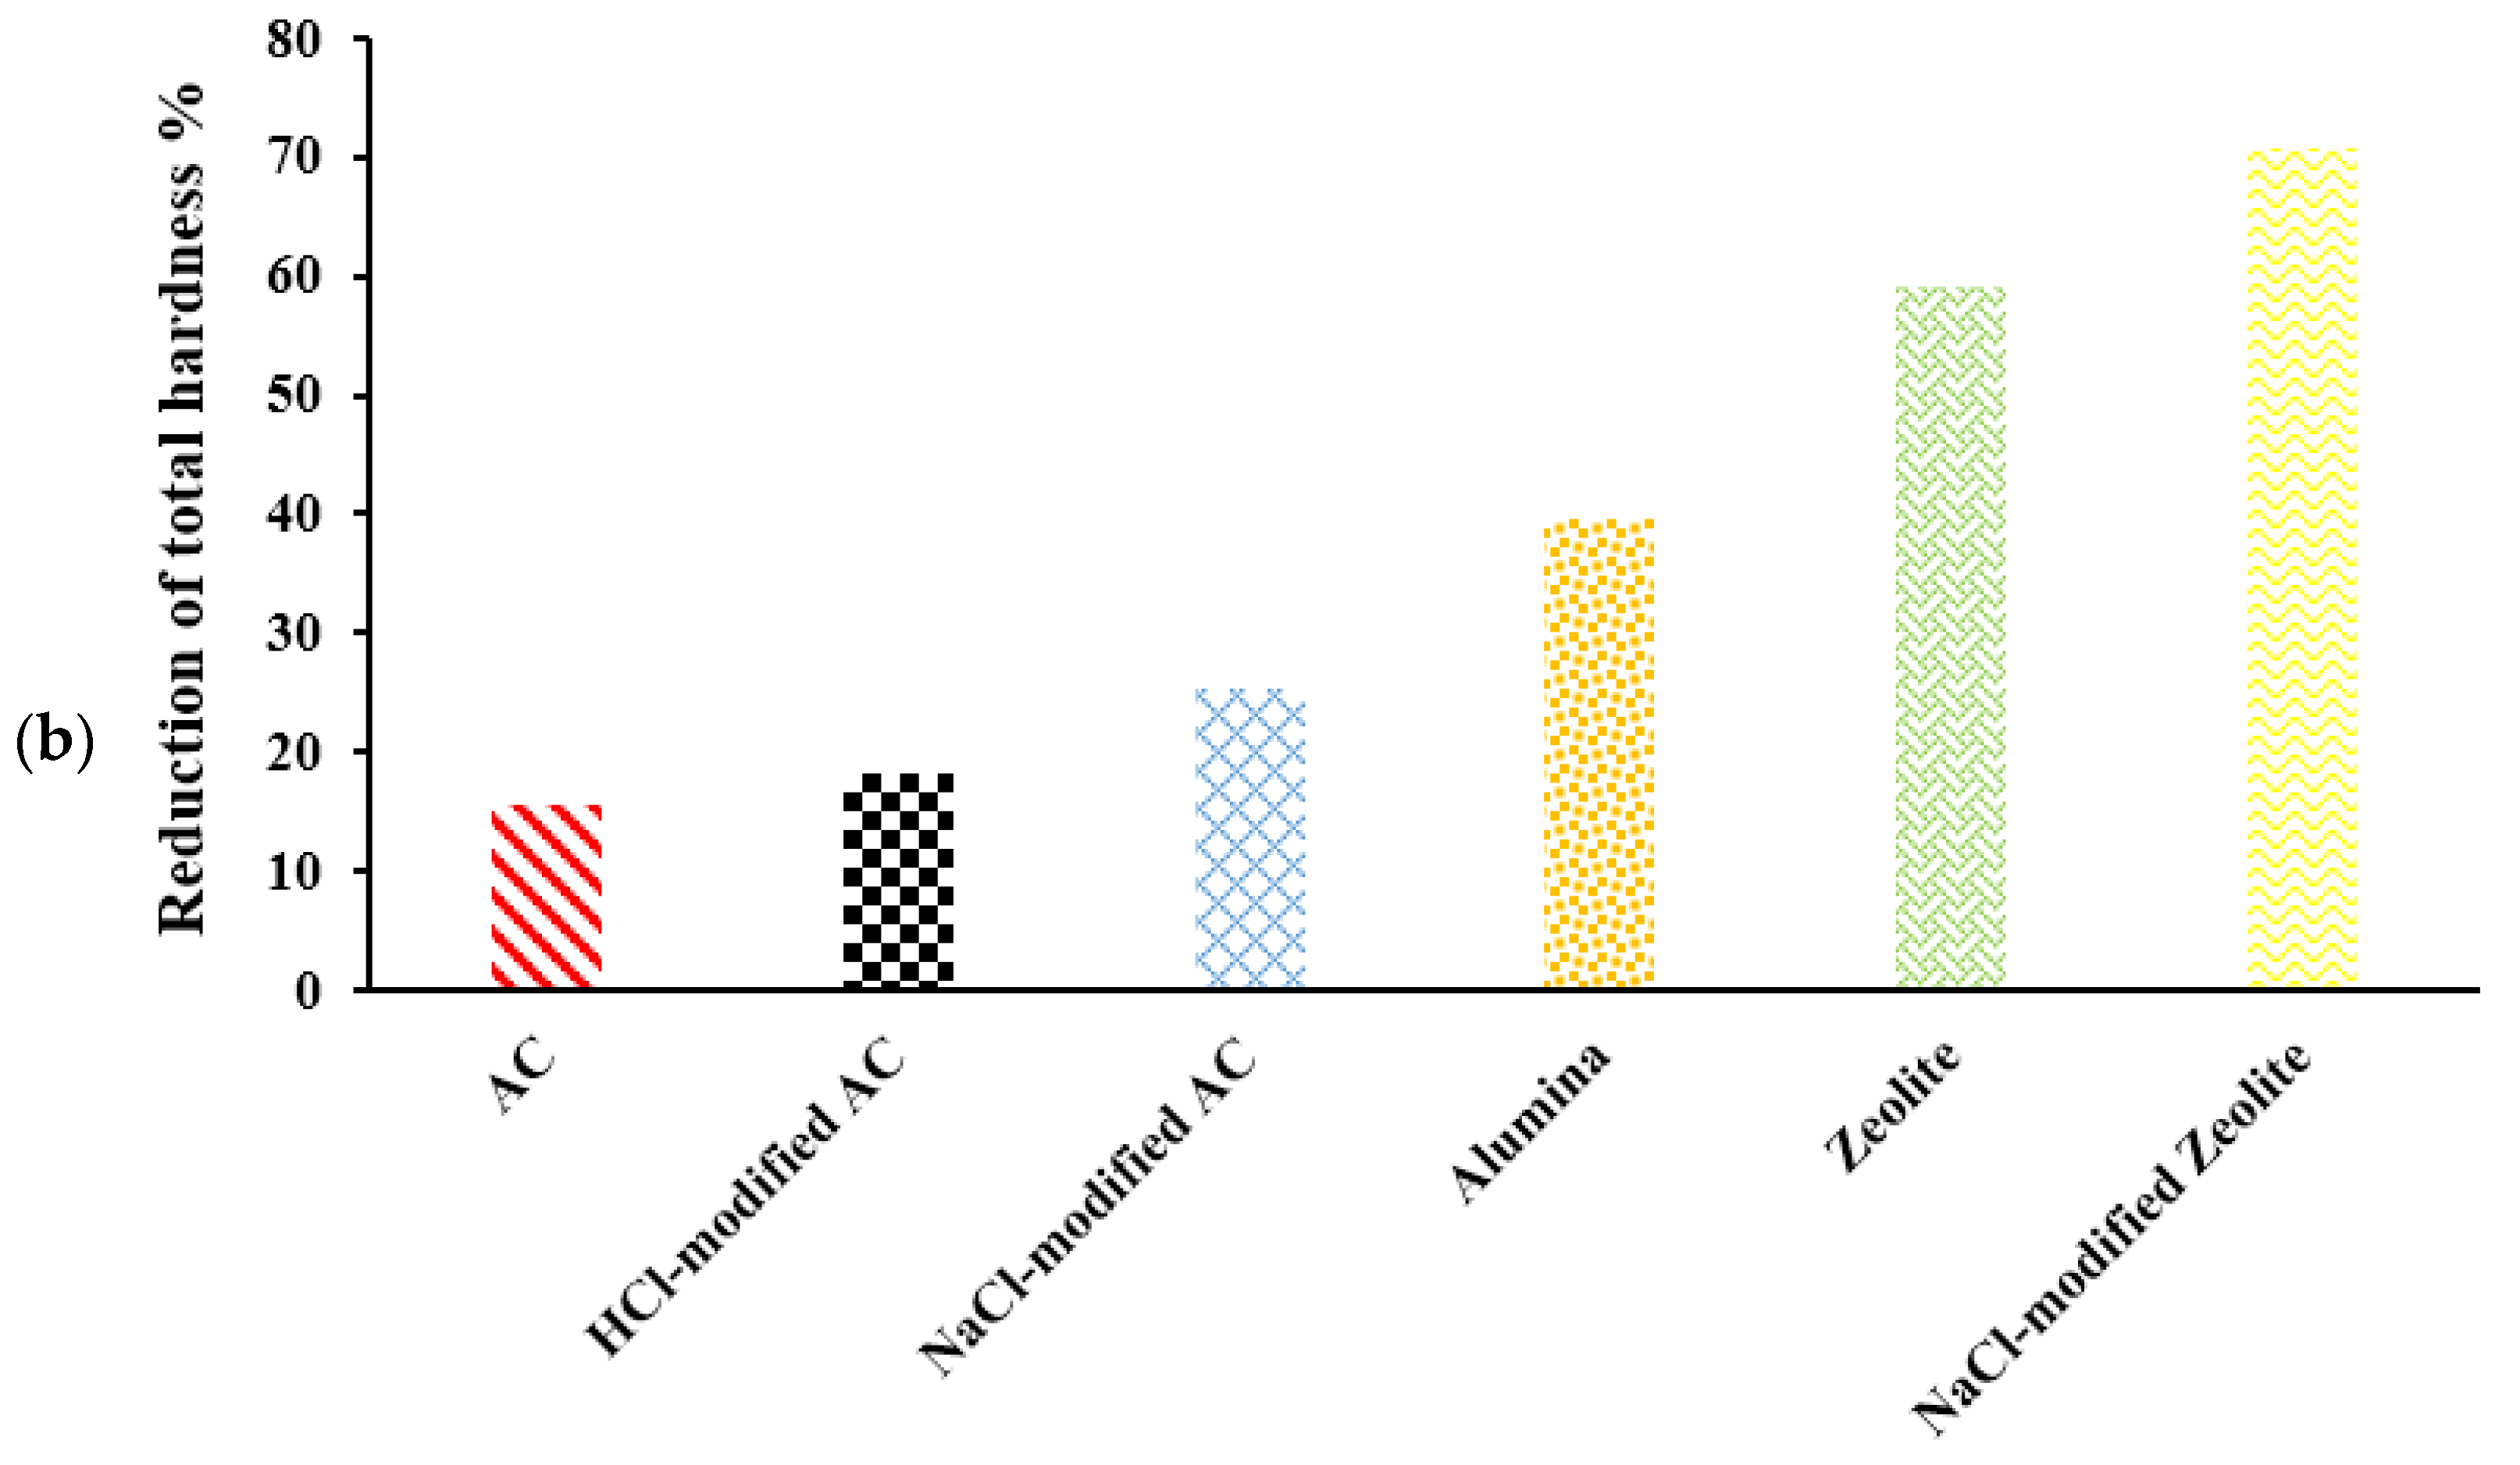
3.2. Reducing Water Hardness with Low-Cost Adsorbents and Their Modified Forms
3.2.1. Natural Zeolite Clinoptilolite Type
The Effect of Zeolite in Reducing Total Hardness
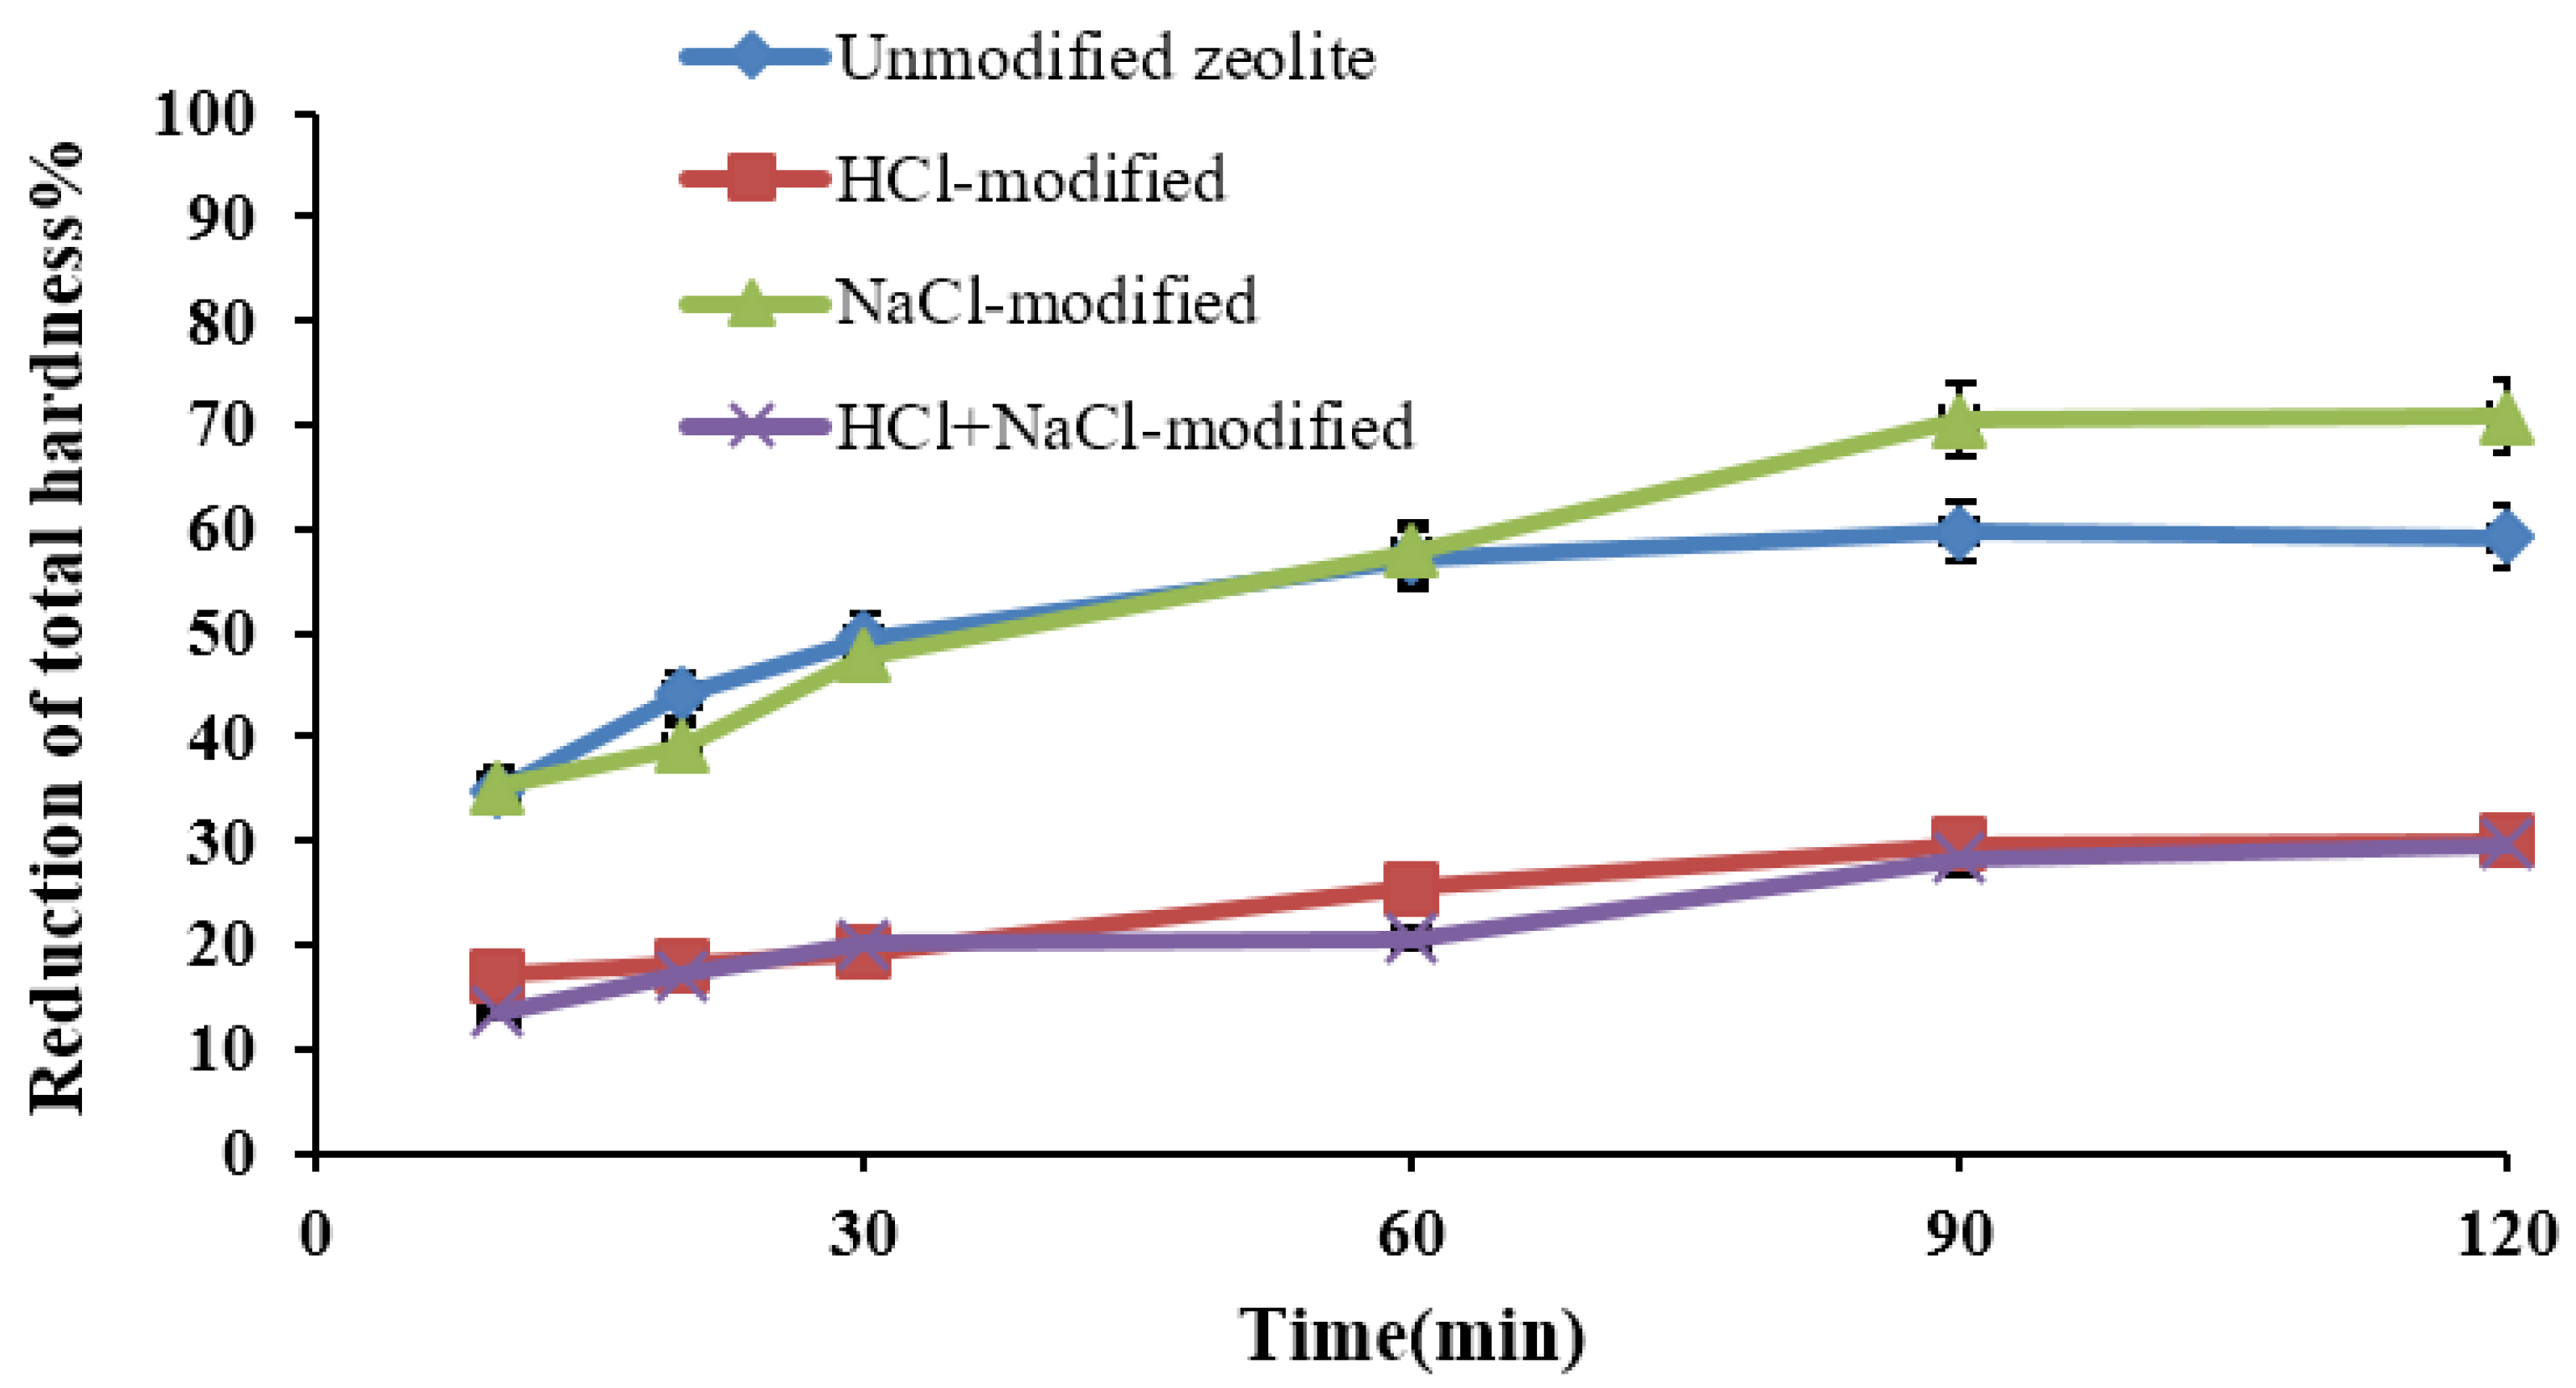
The Effect of Natural and Modified Zeolite in Reducing the Total Hardness in Groundwater
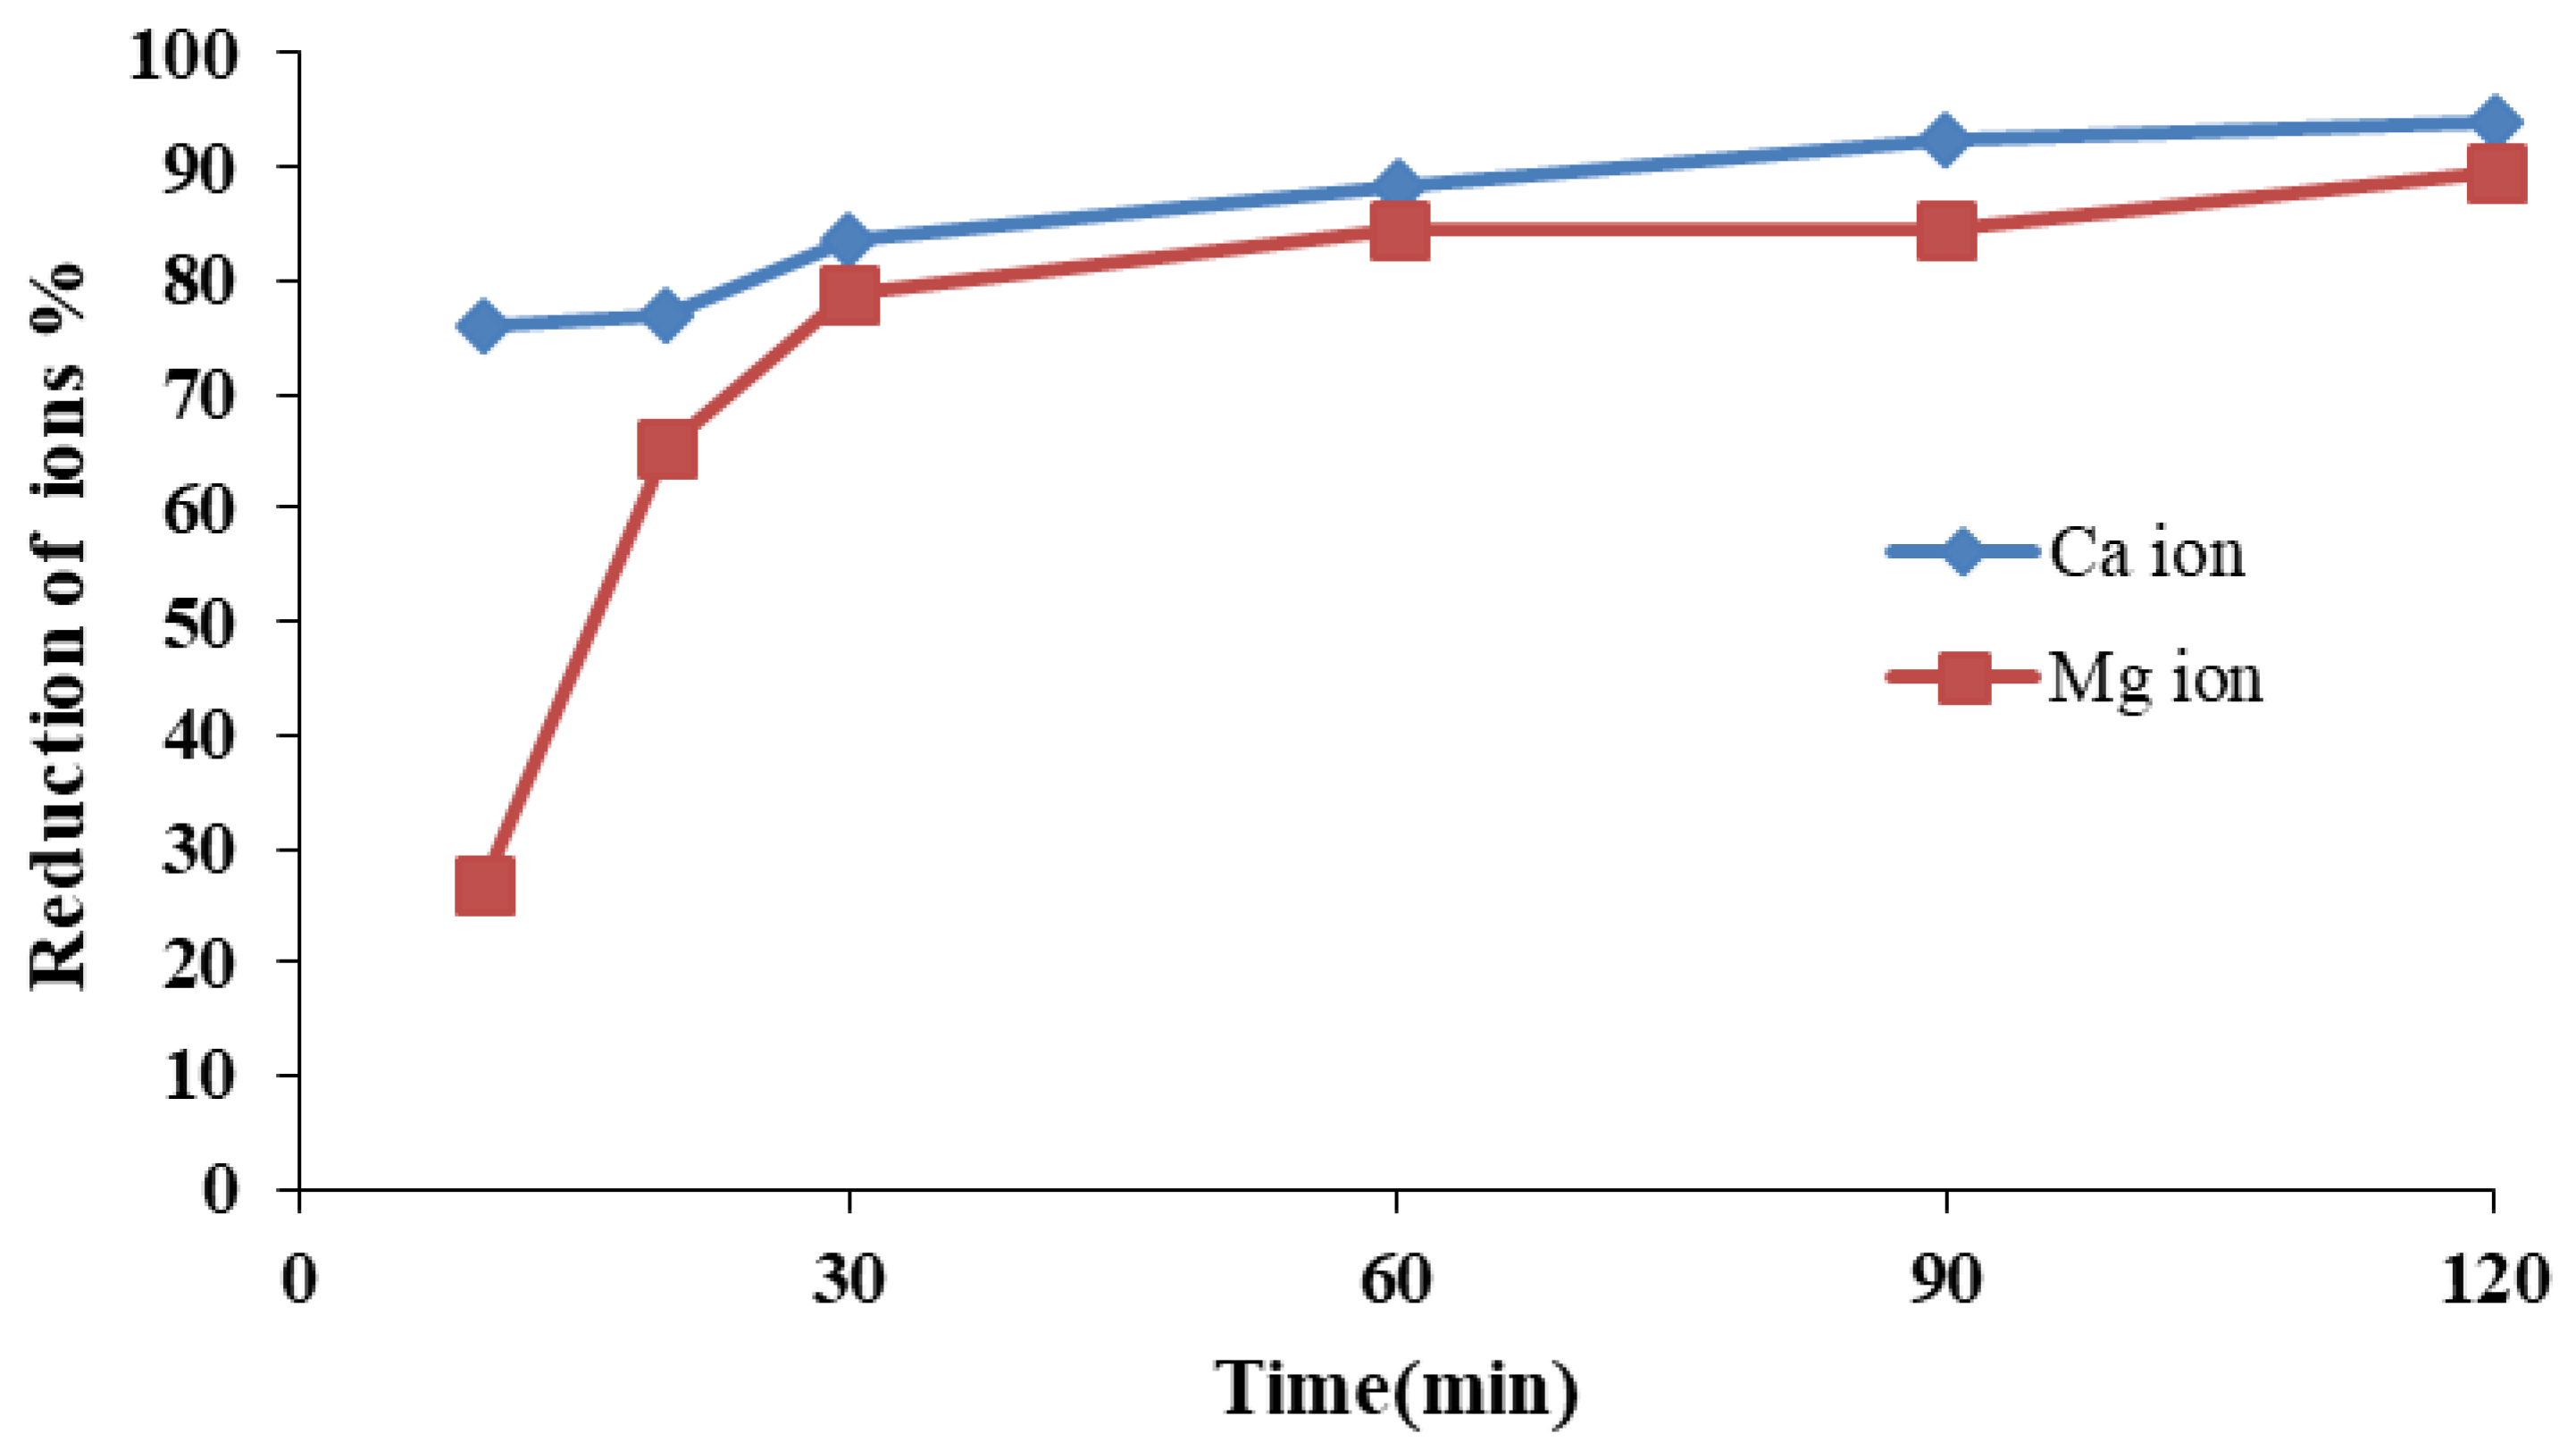
The Effect of Natural Zeolite in Decreasing Calcium and Magnesium Ions in Drinking Water
3.2.2. Activated Carbon
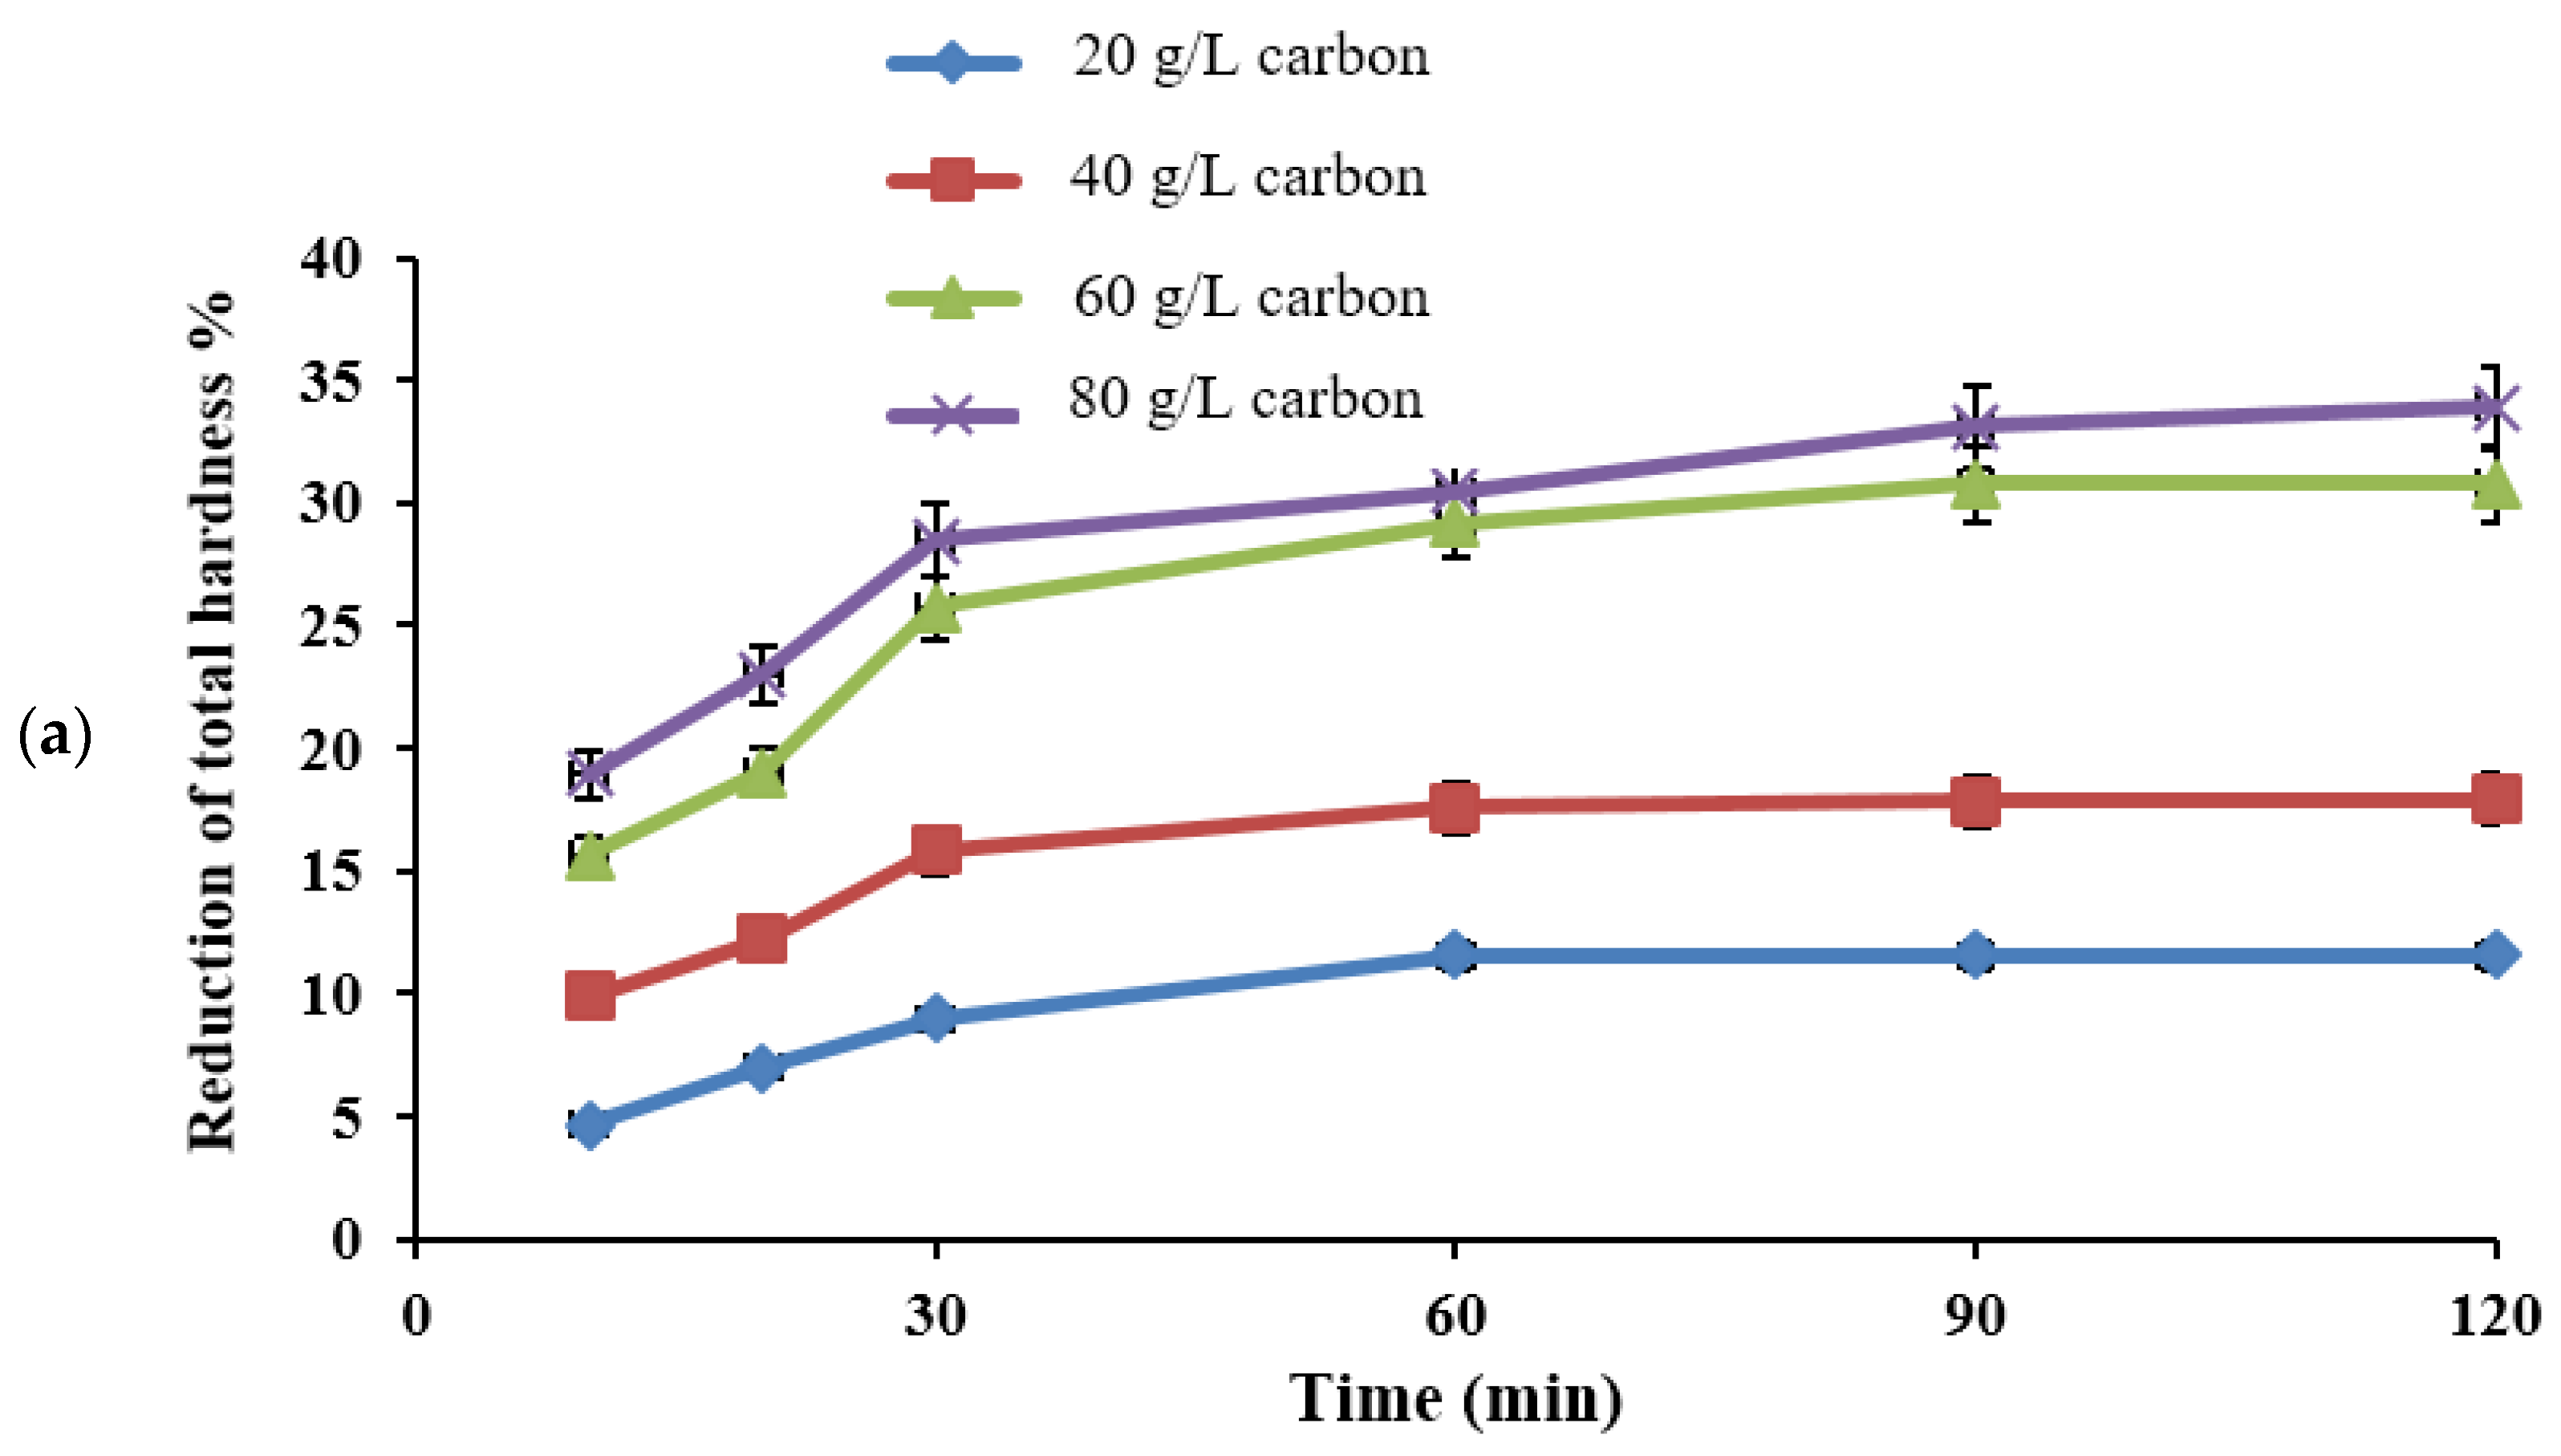
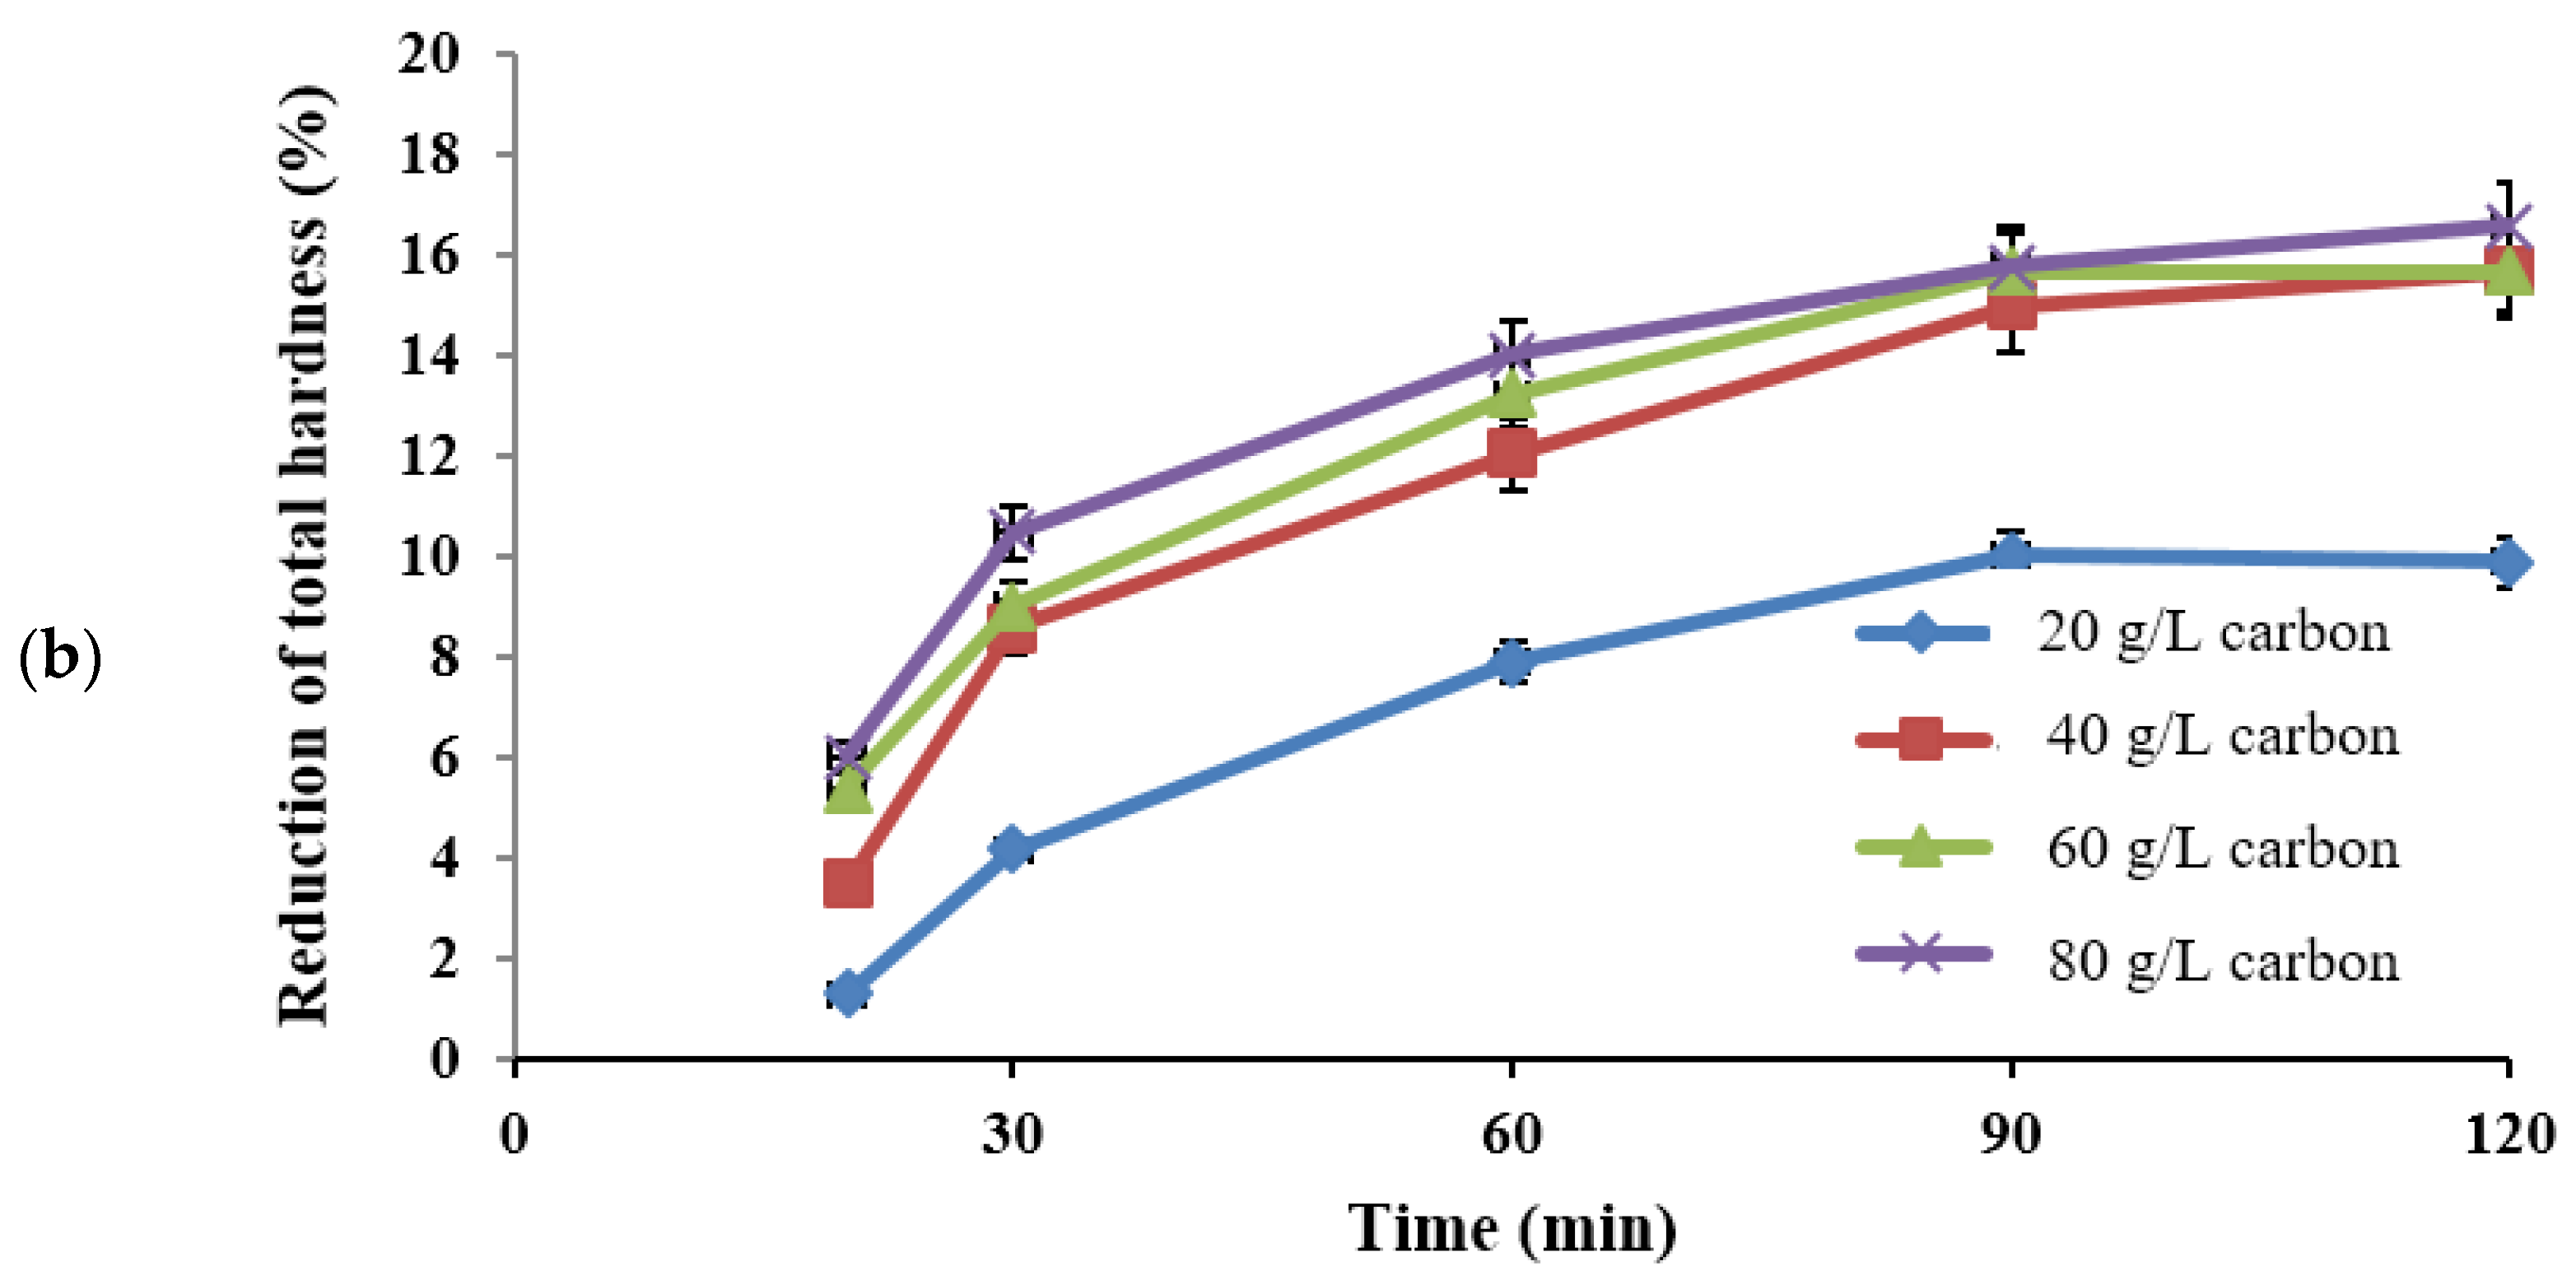
The Effect of Activated Carbon on Reducing Total Hardness
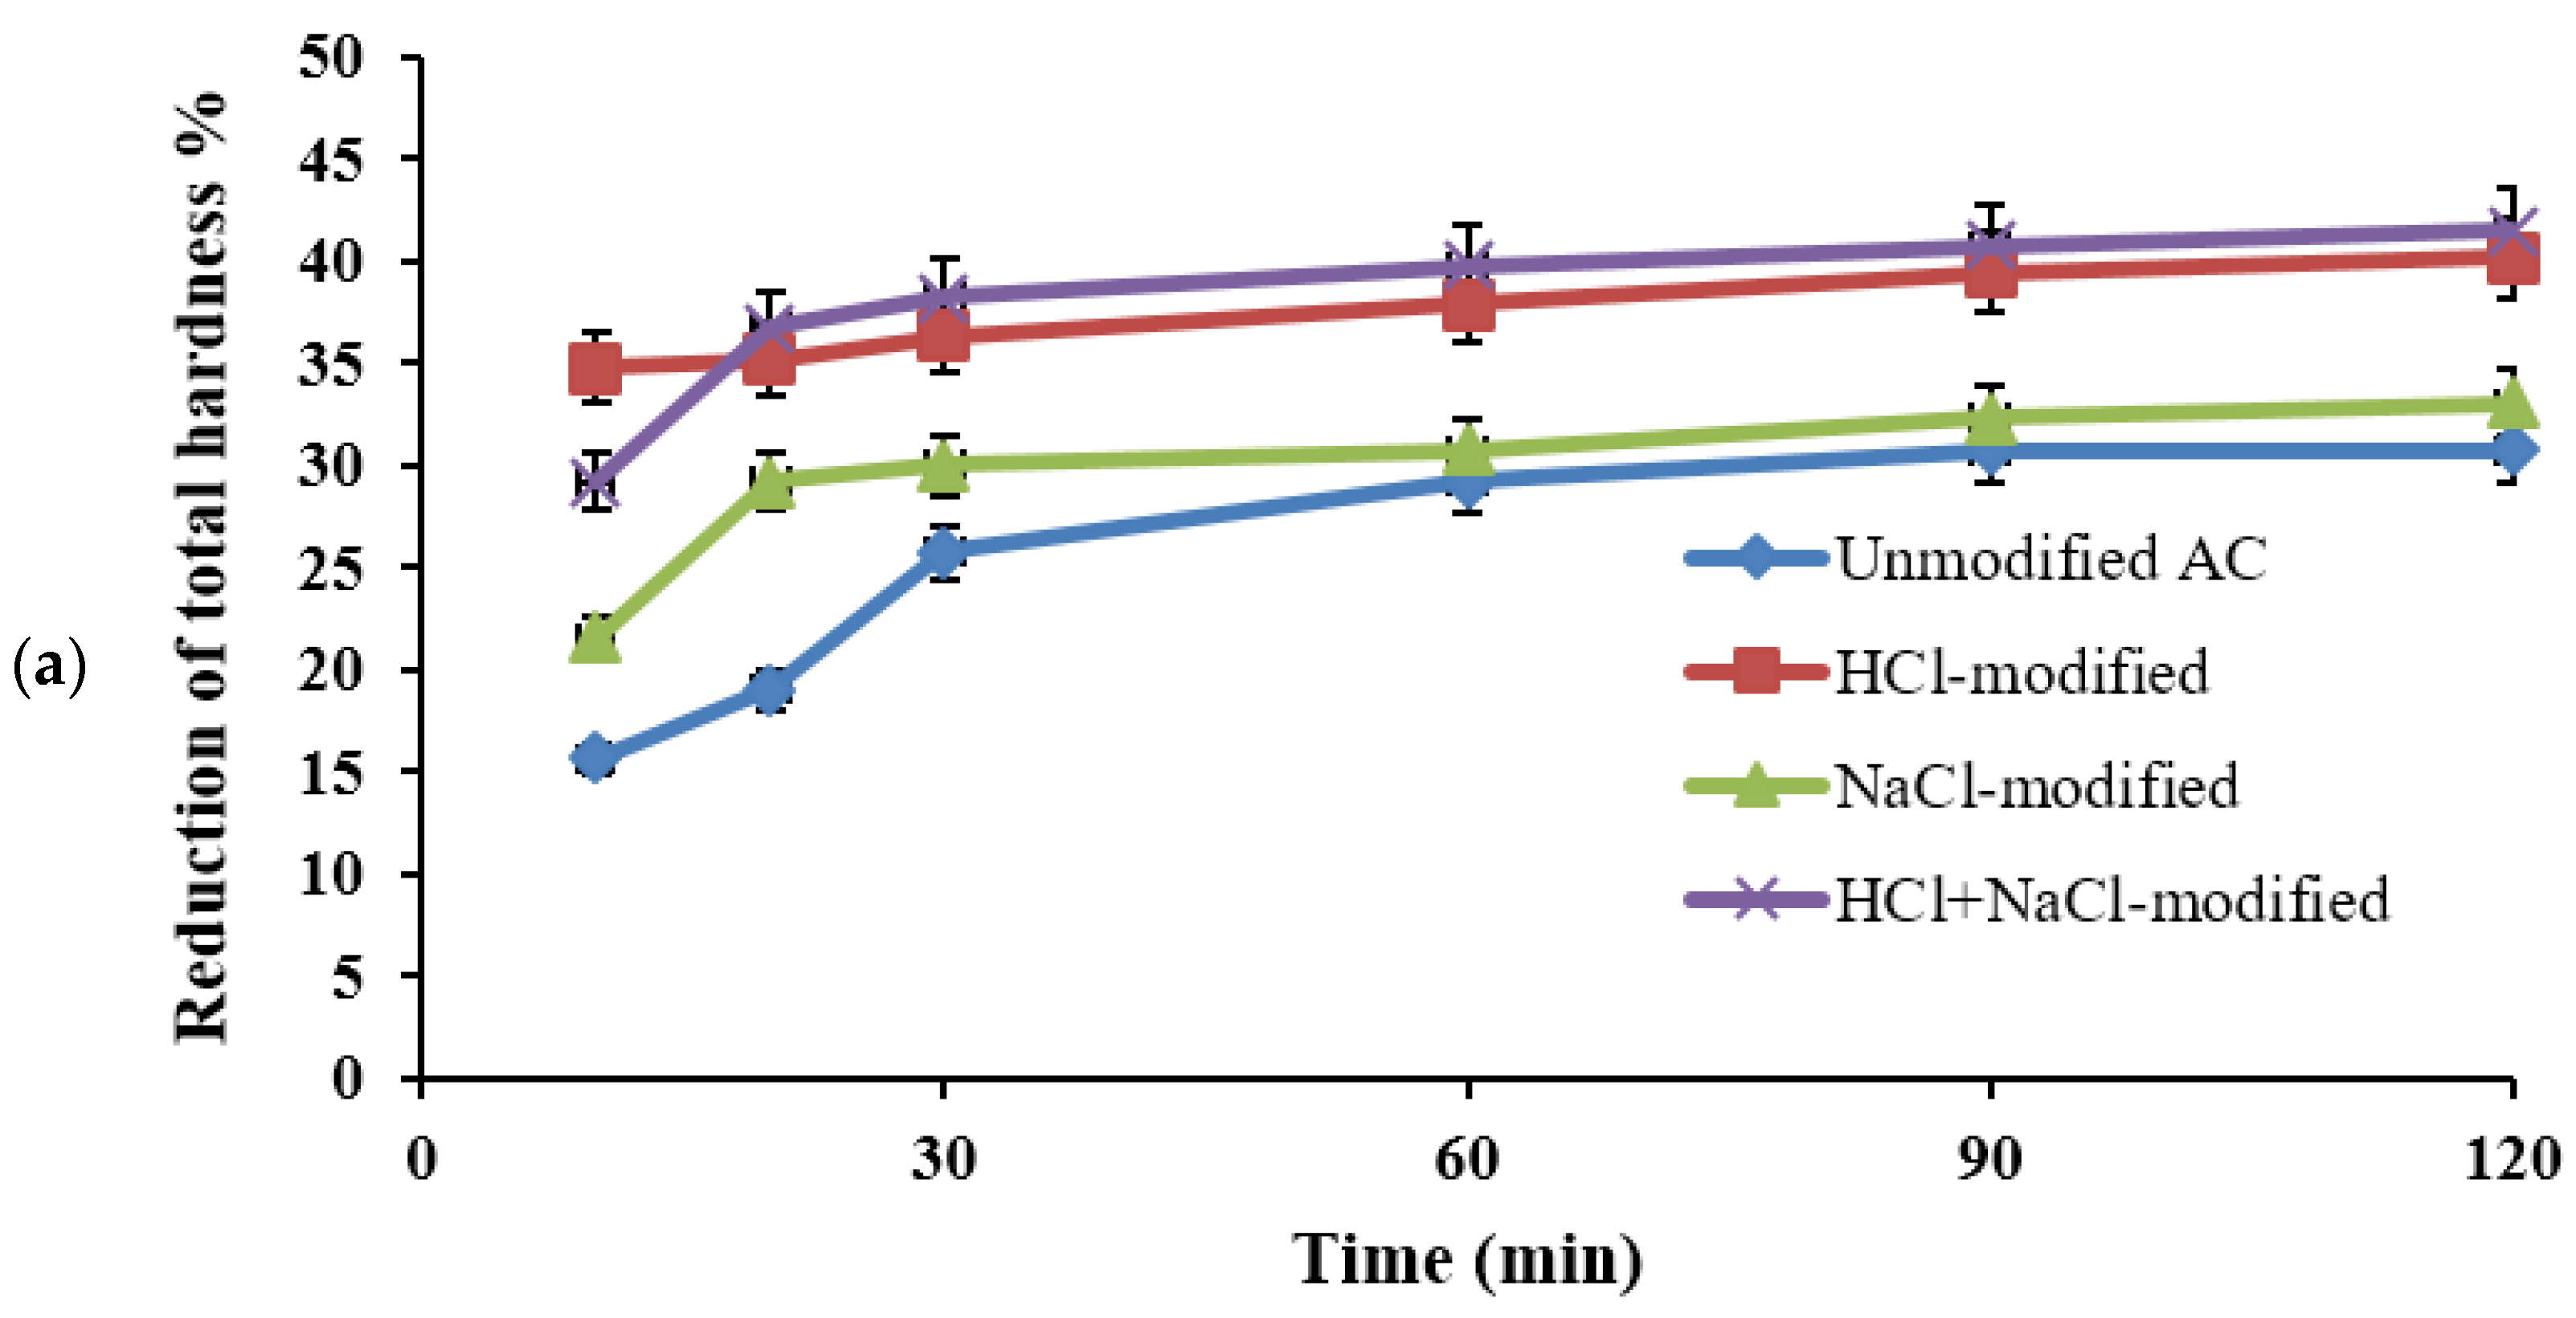
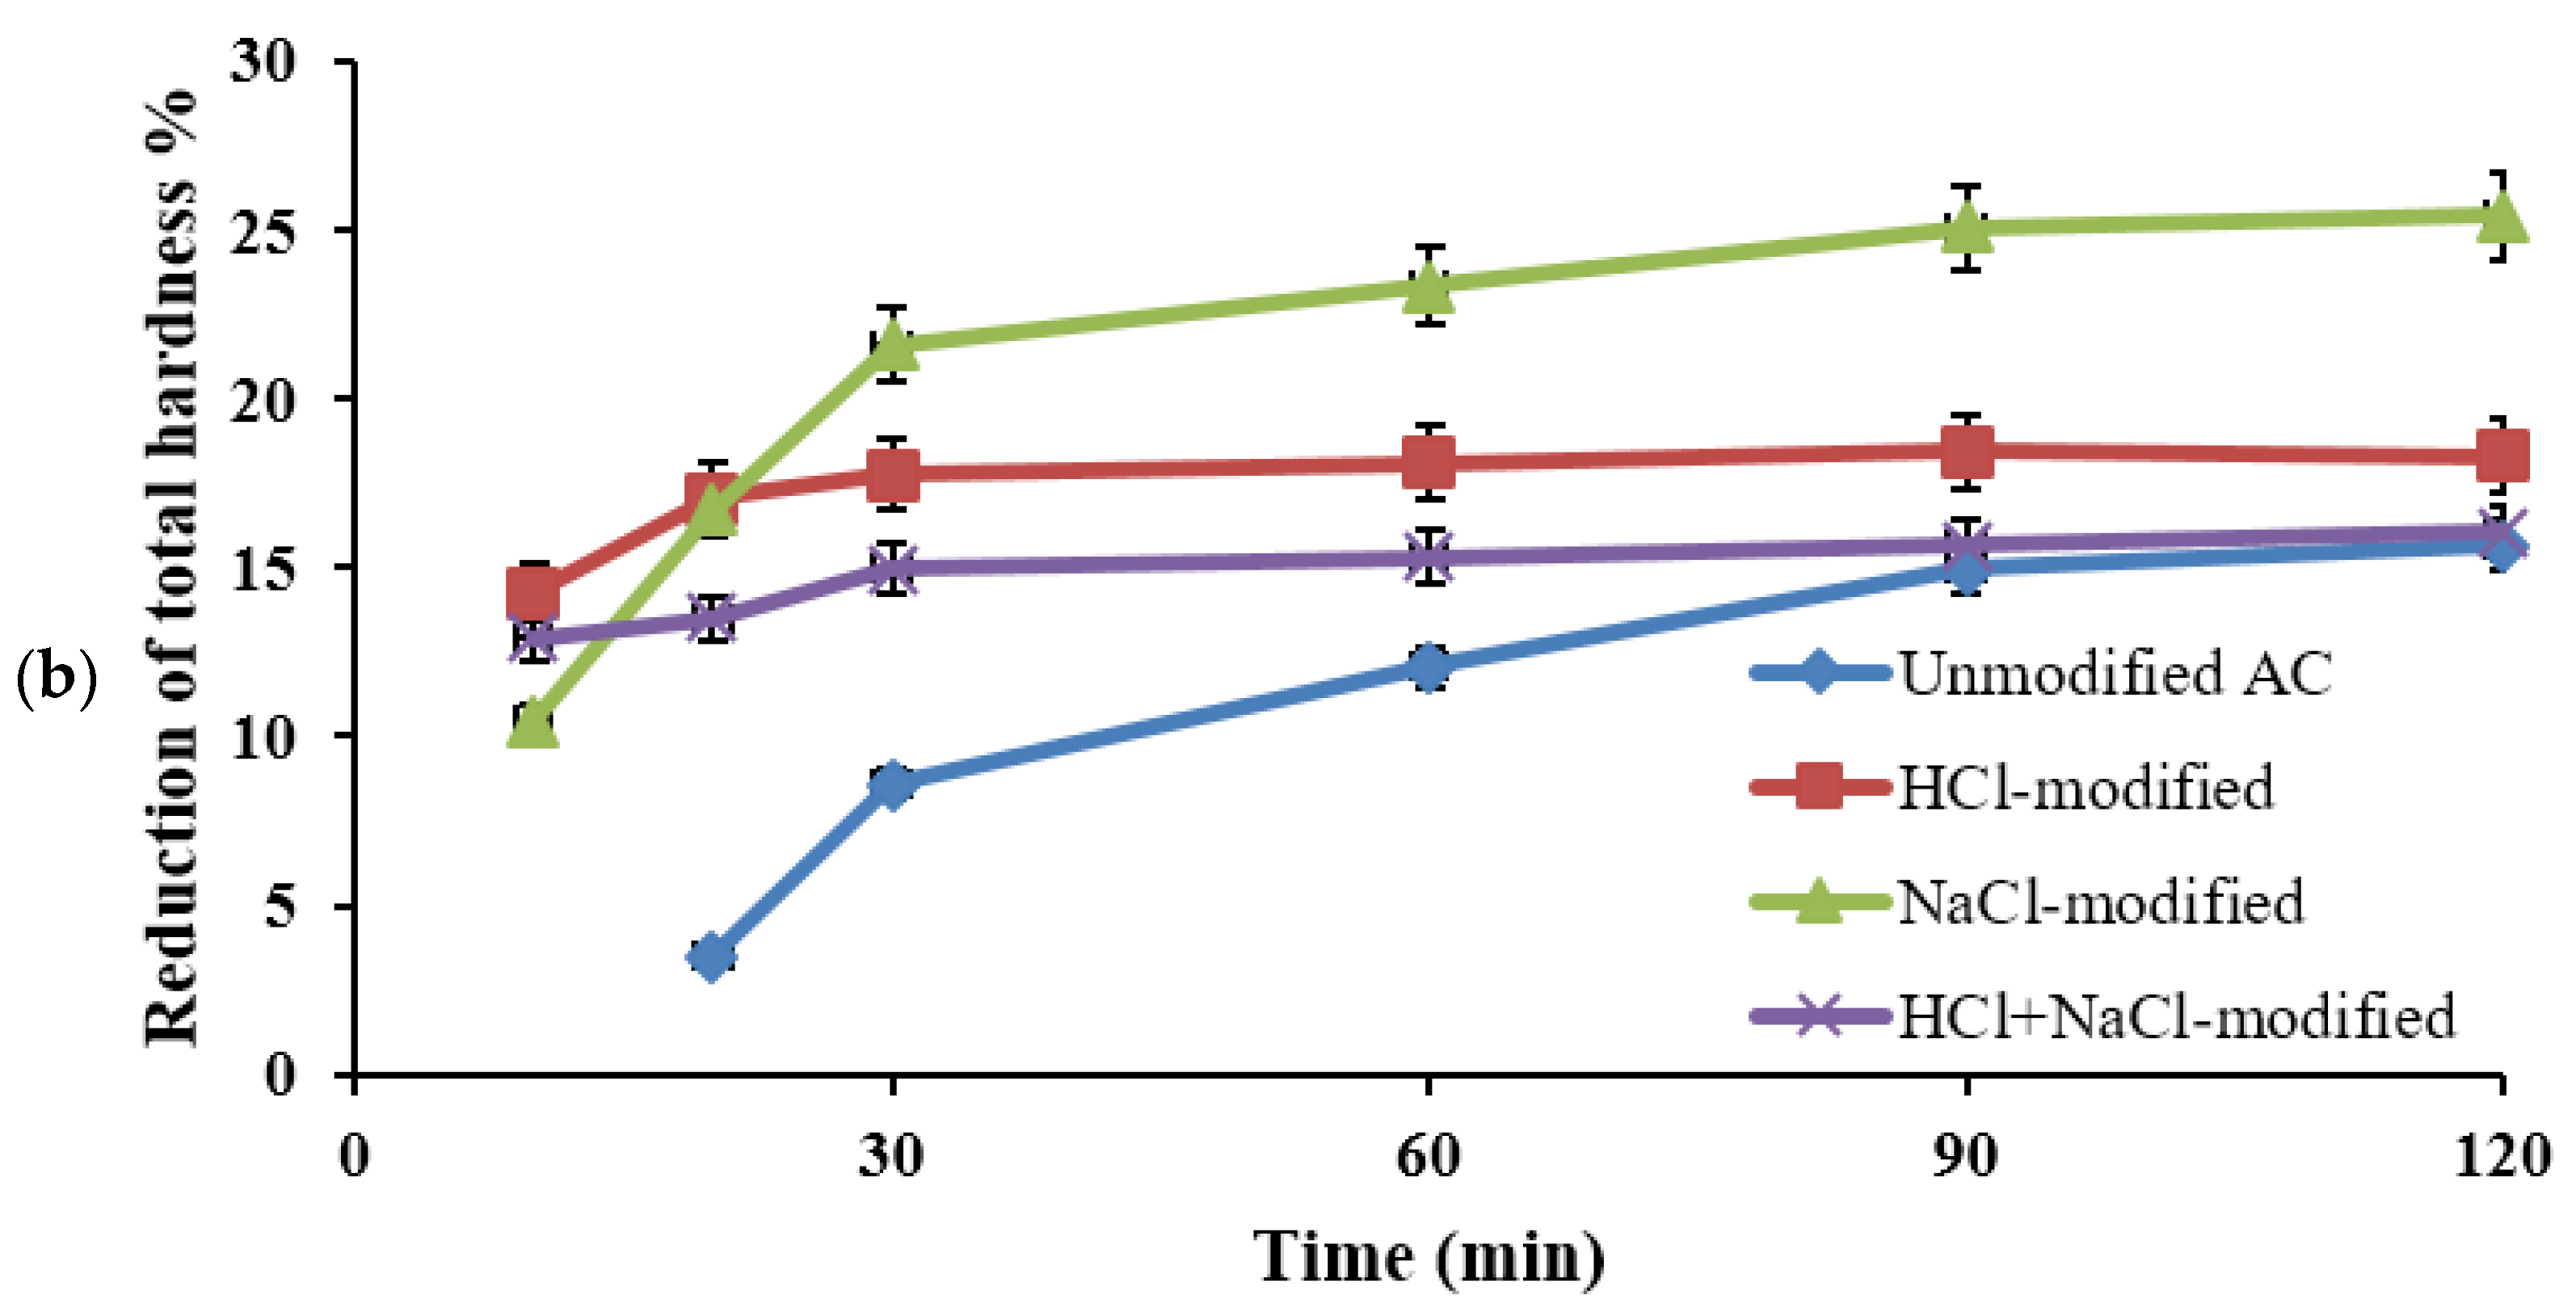
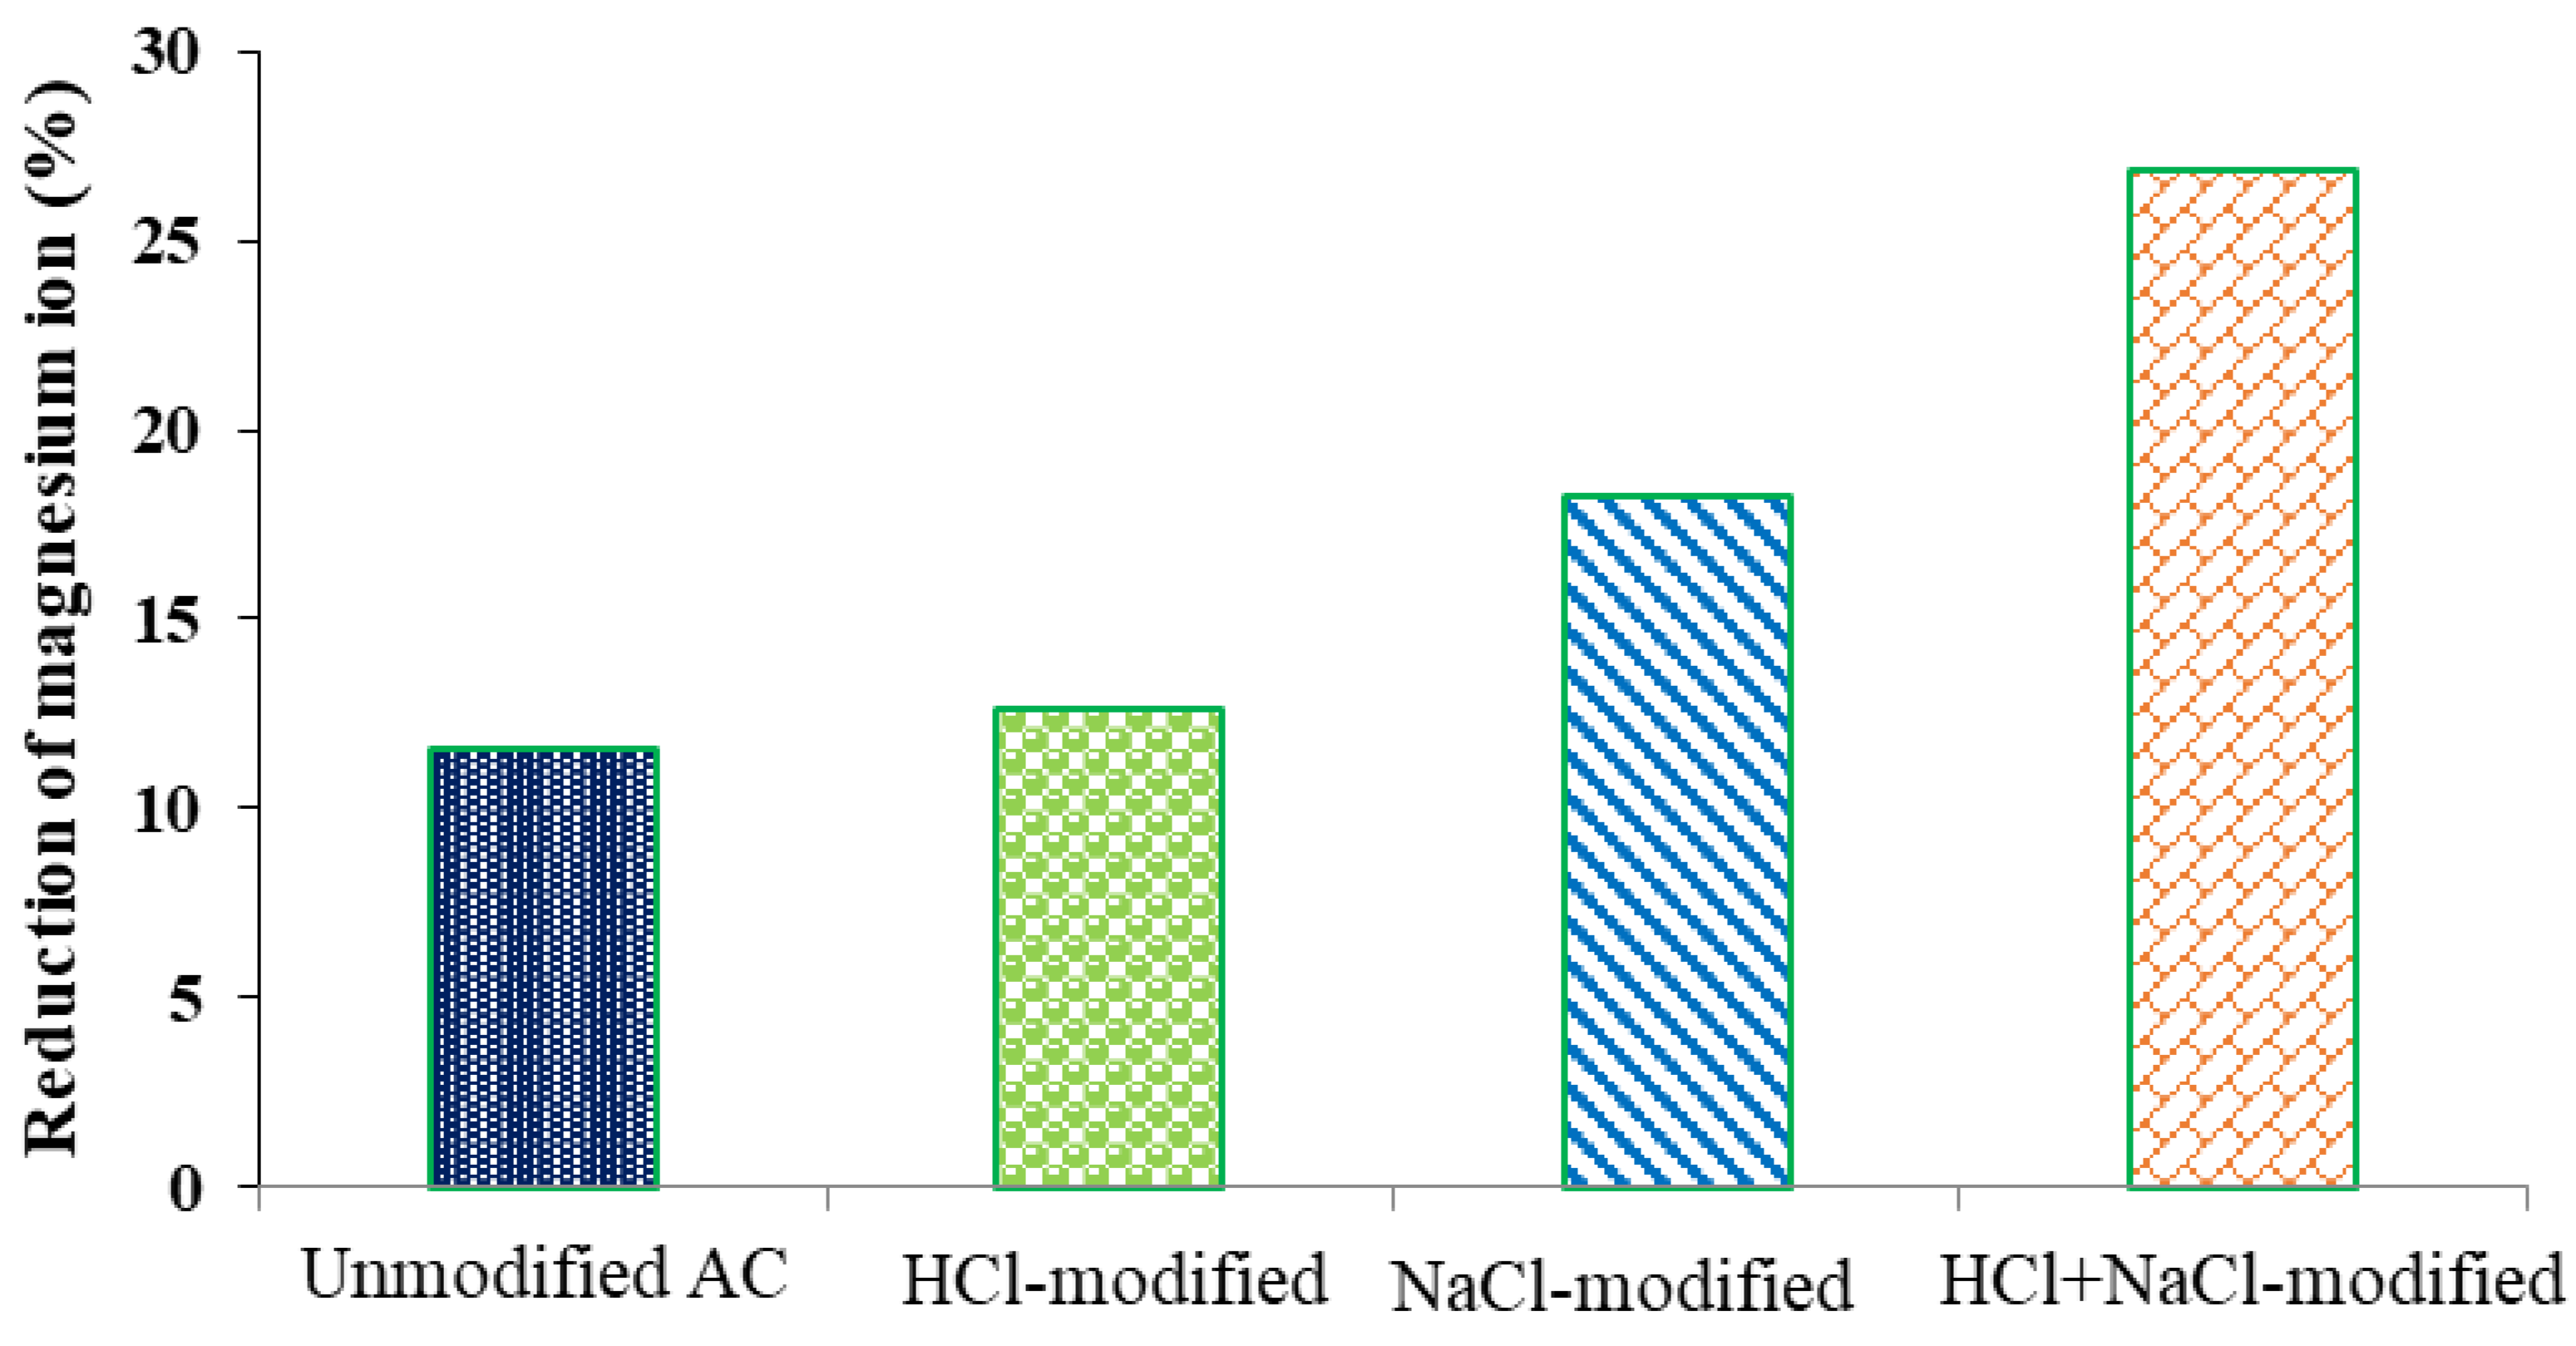
The Effect of Modified Activated Carbon on the Reduction in Total Hardness
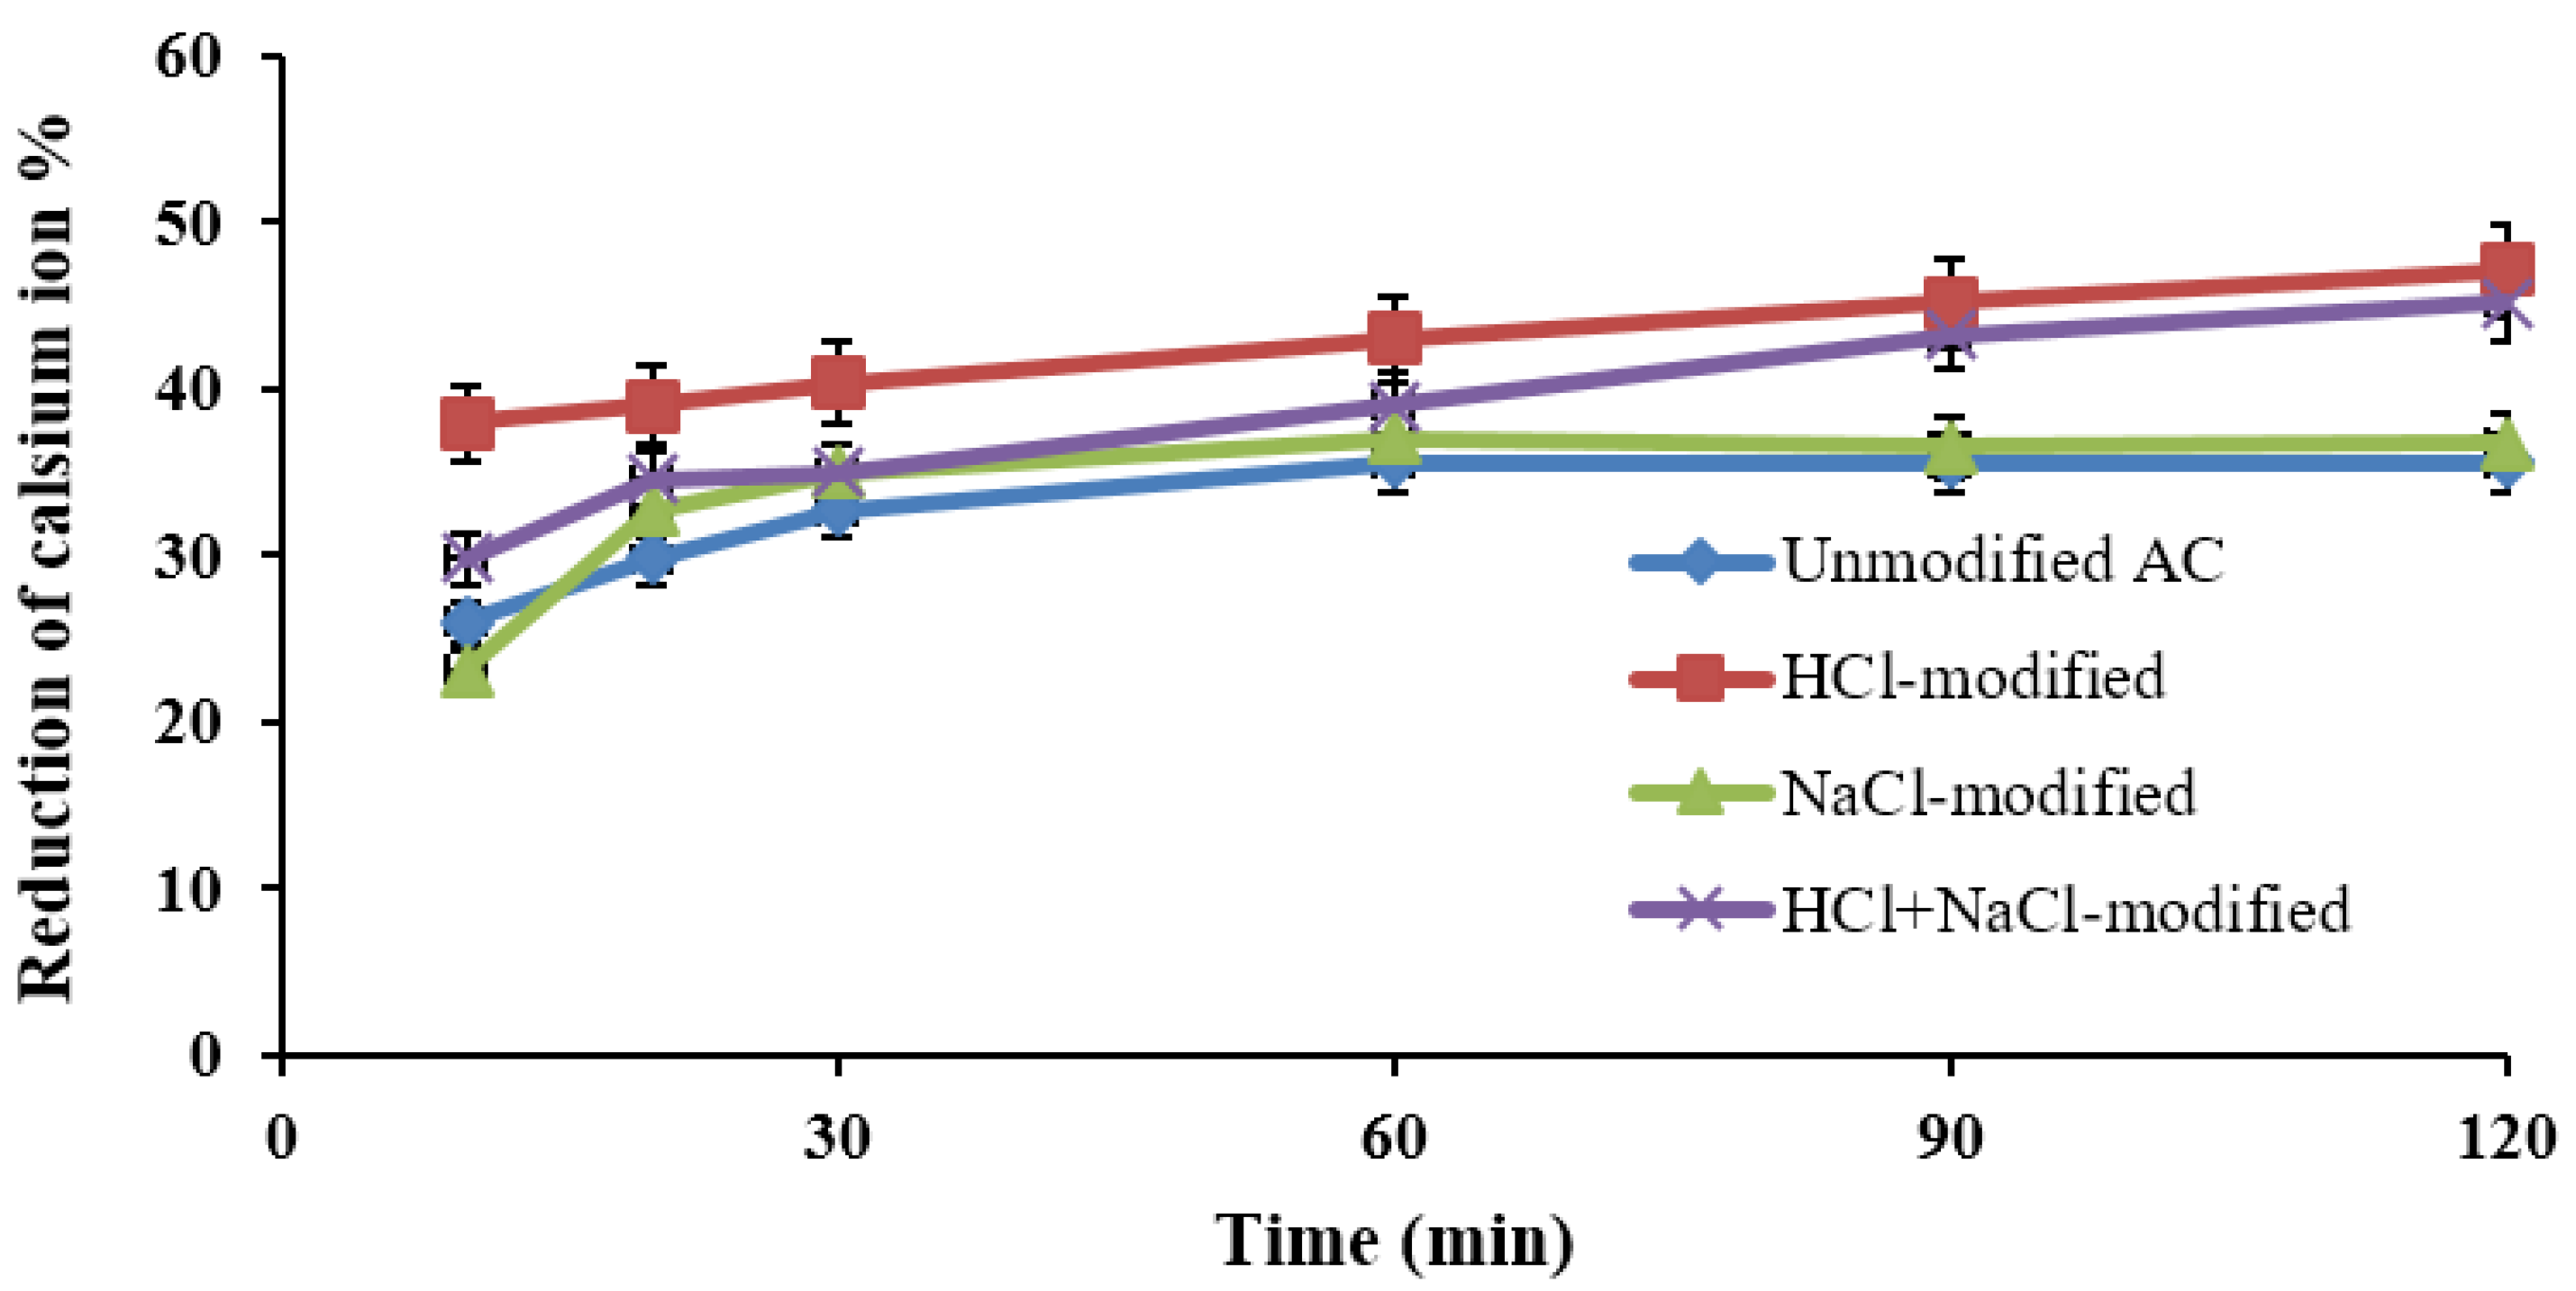
The Effect of Natural and Modified Activated Carbon on Decrease in Calcium and Magnesium Ions
3.2.3. Activated Alumina
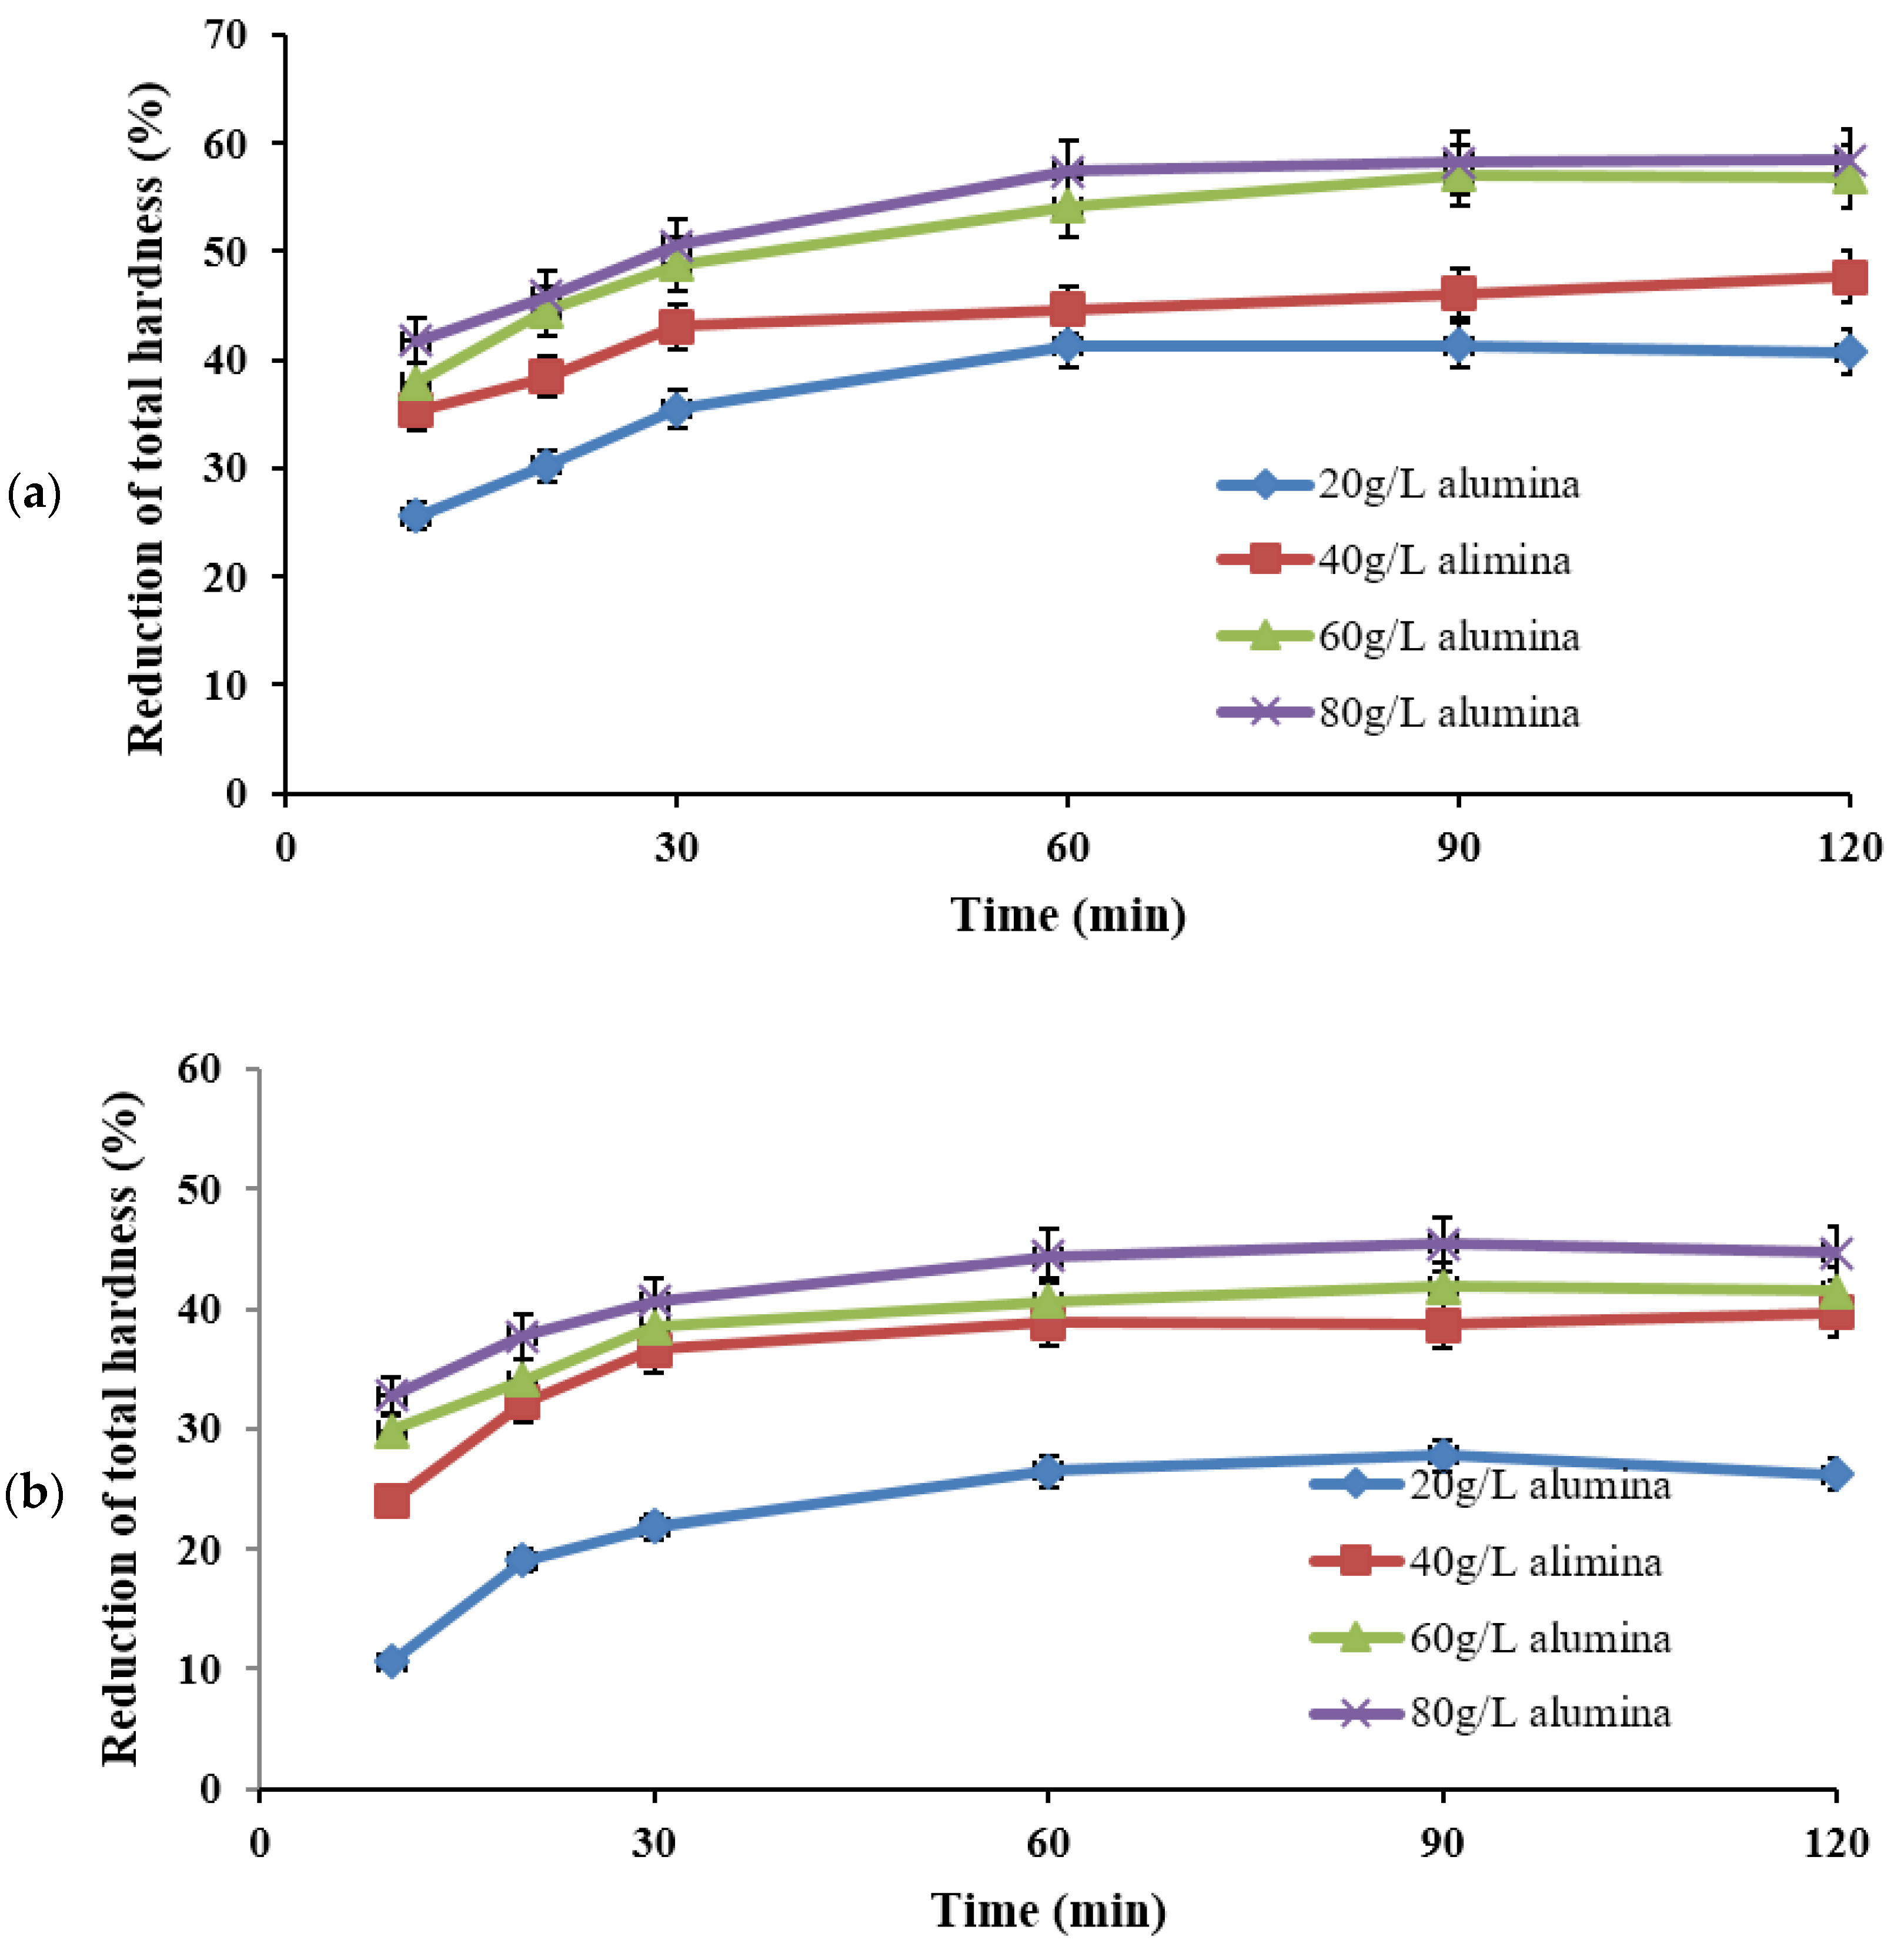
The Effect of Activated Alumina on Reducing Total Hardness
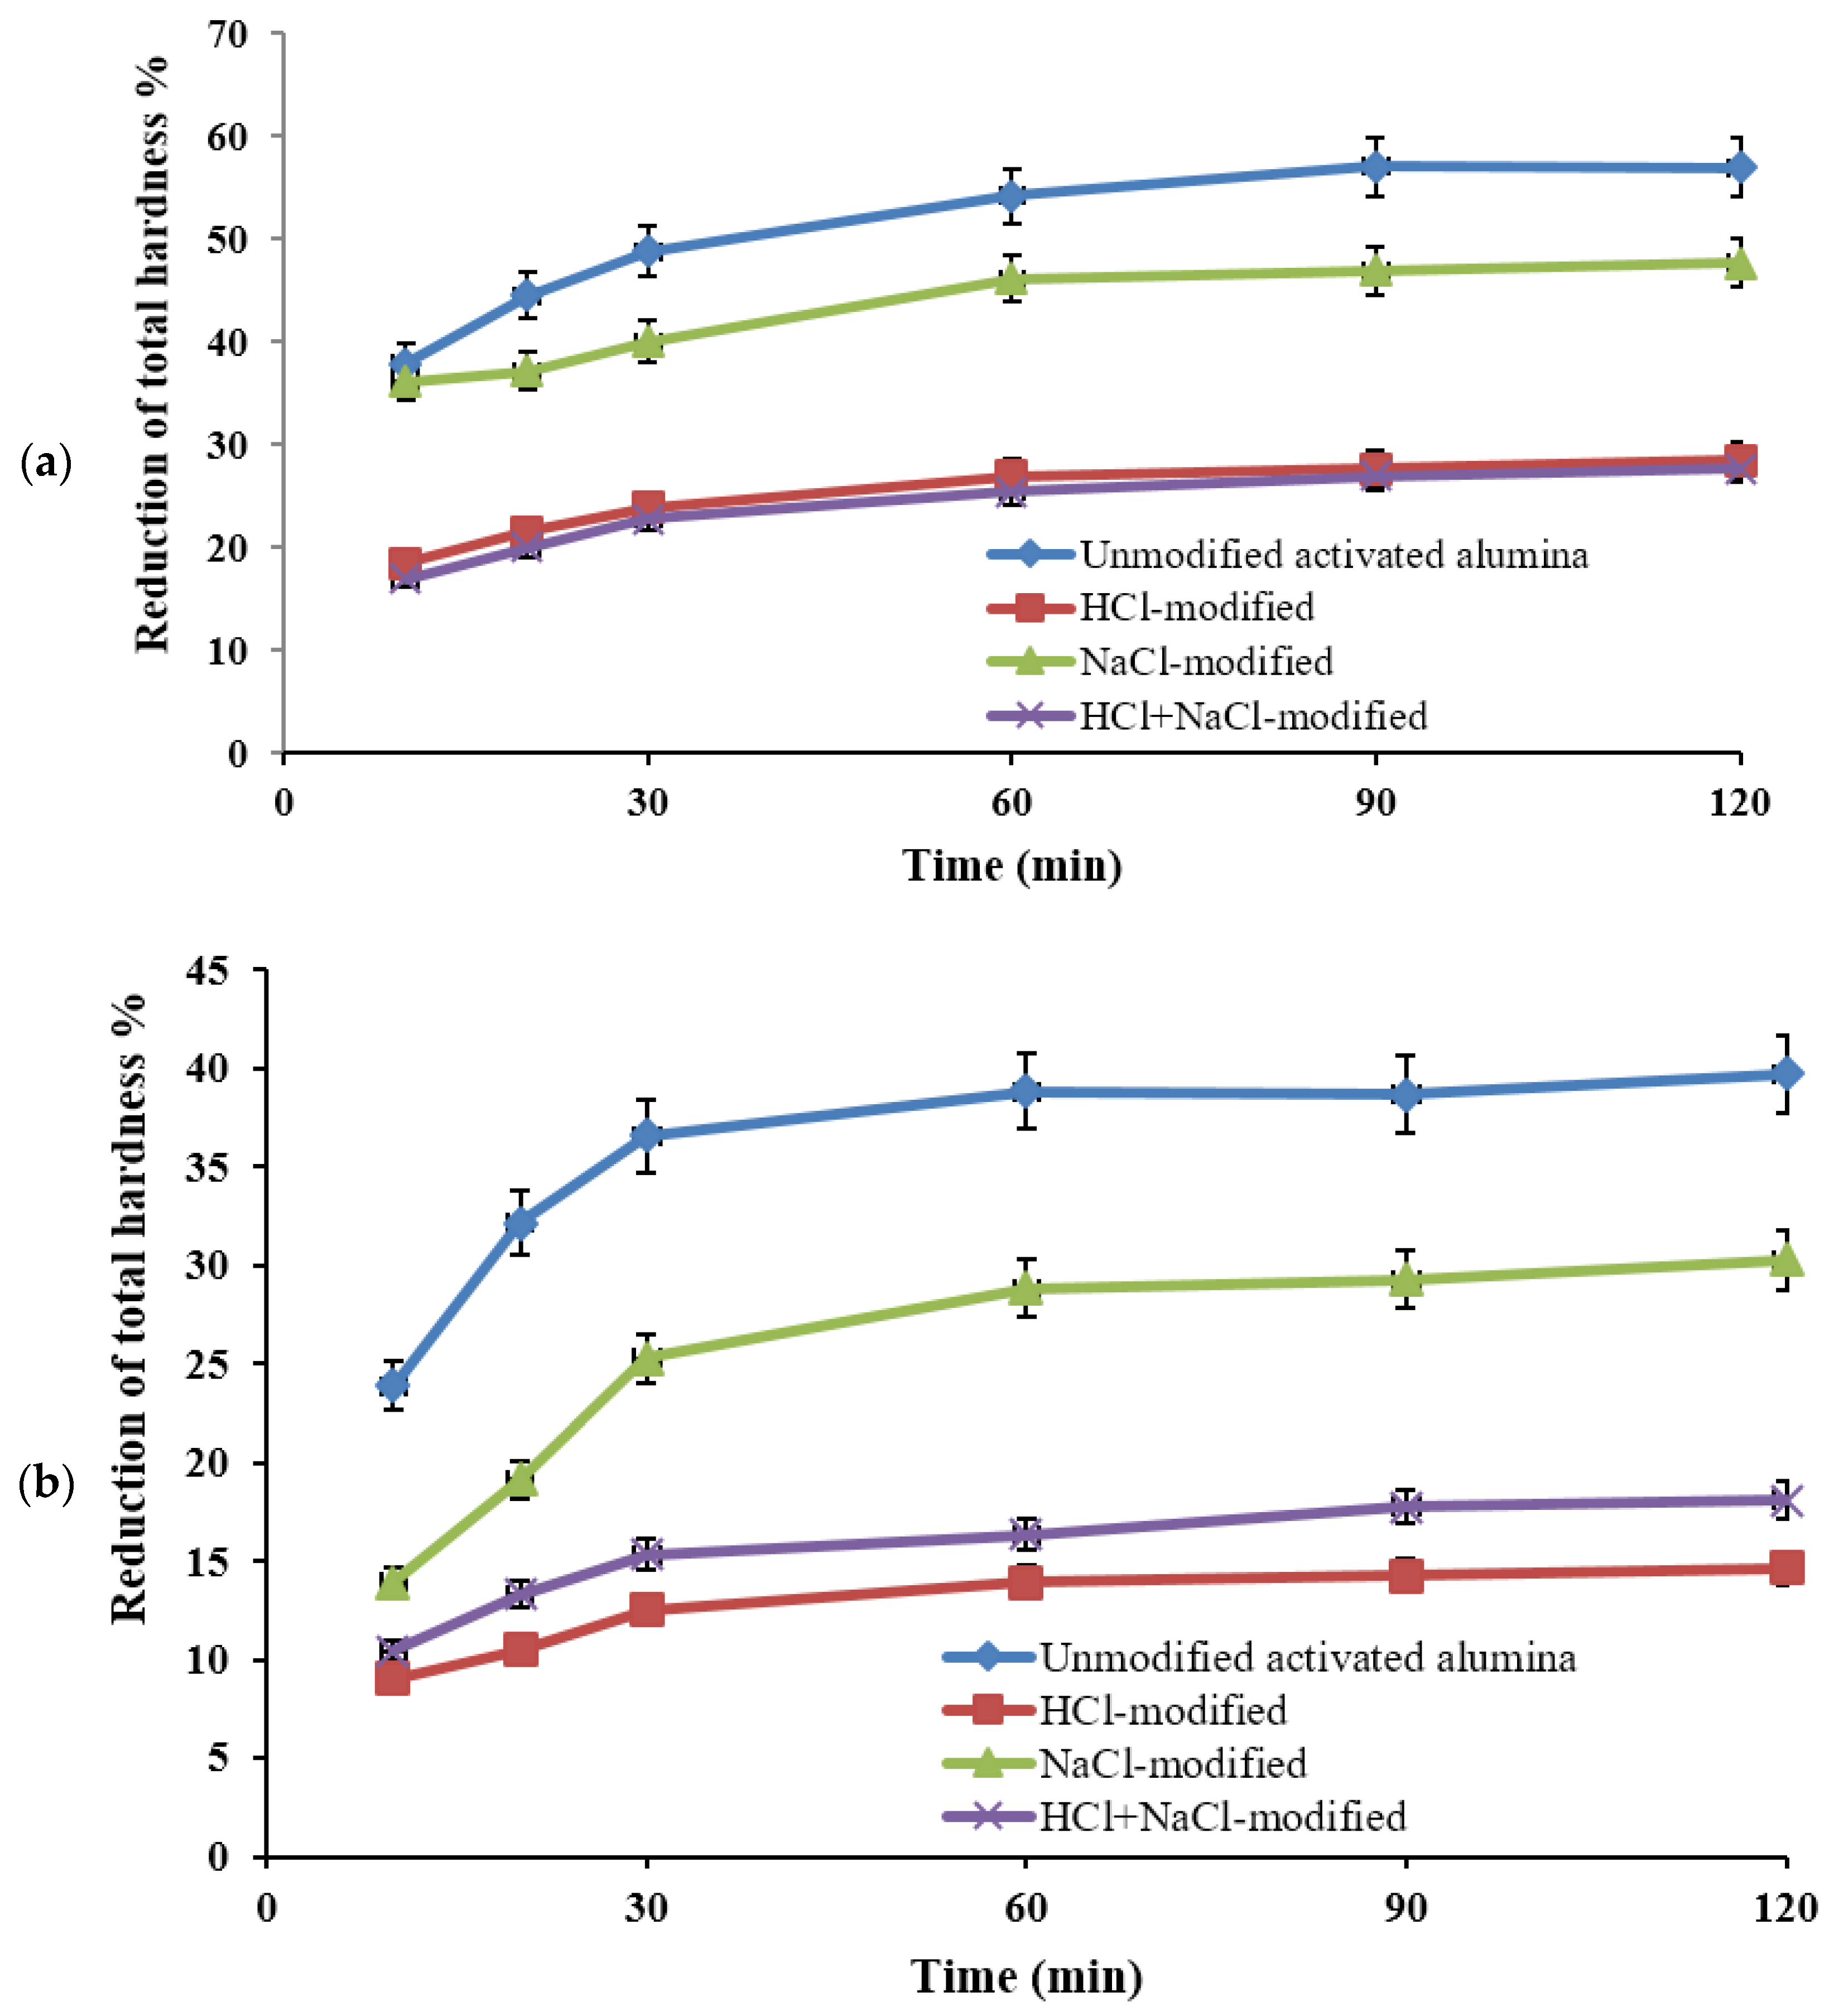
The Effect of Modified Activated Alumina on the Decrease in Total Hardness
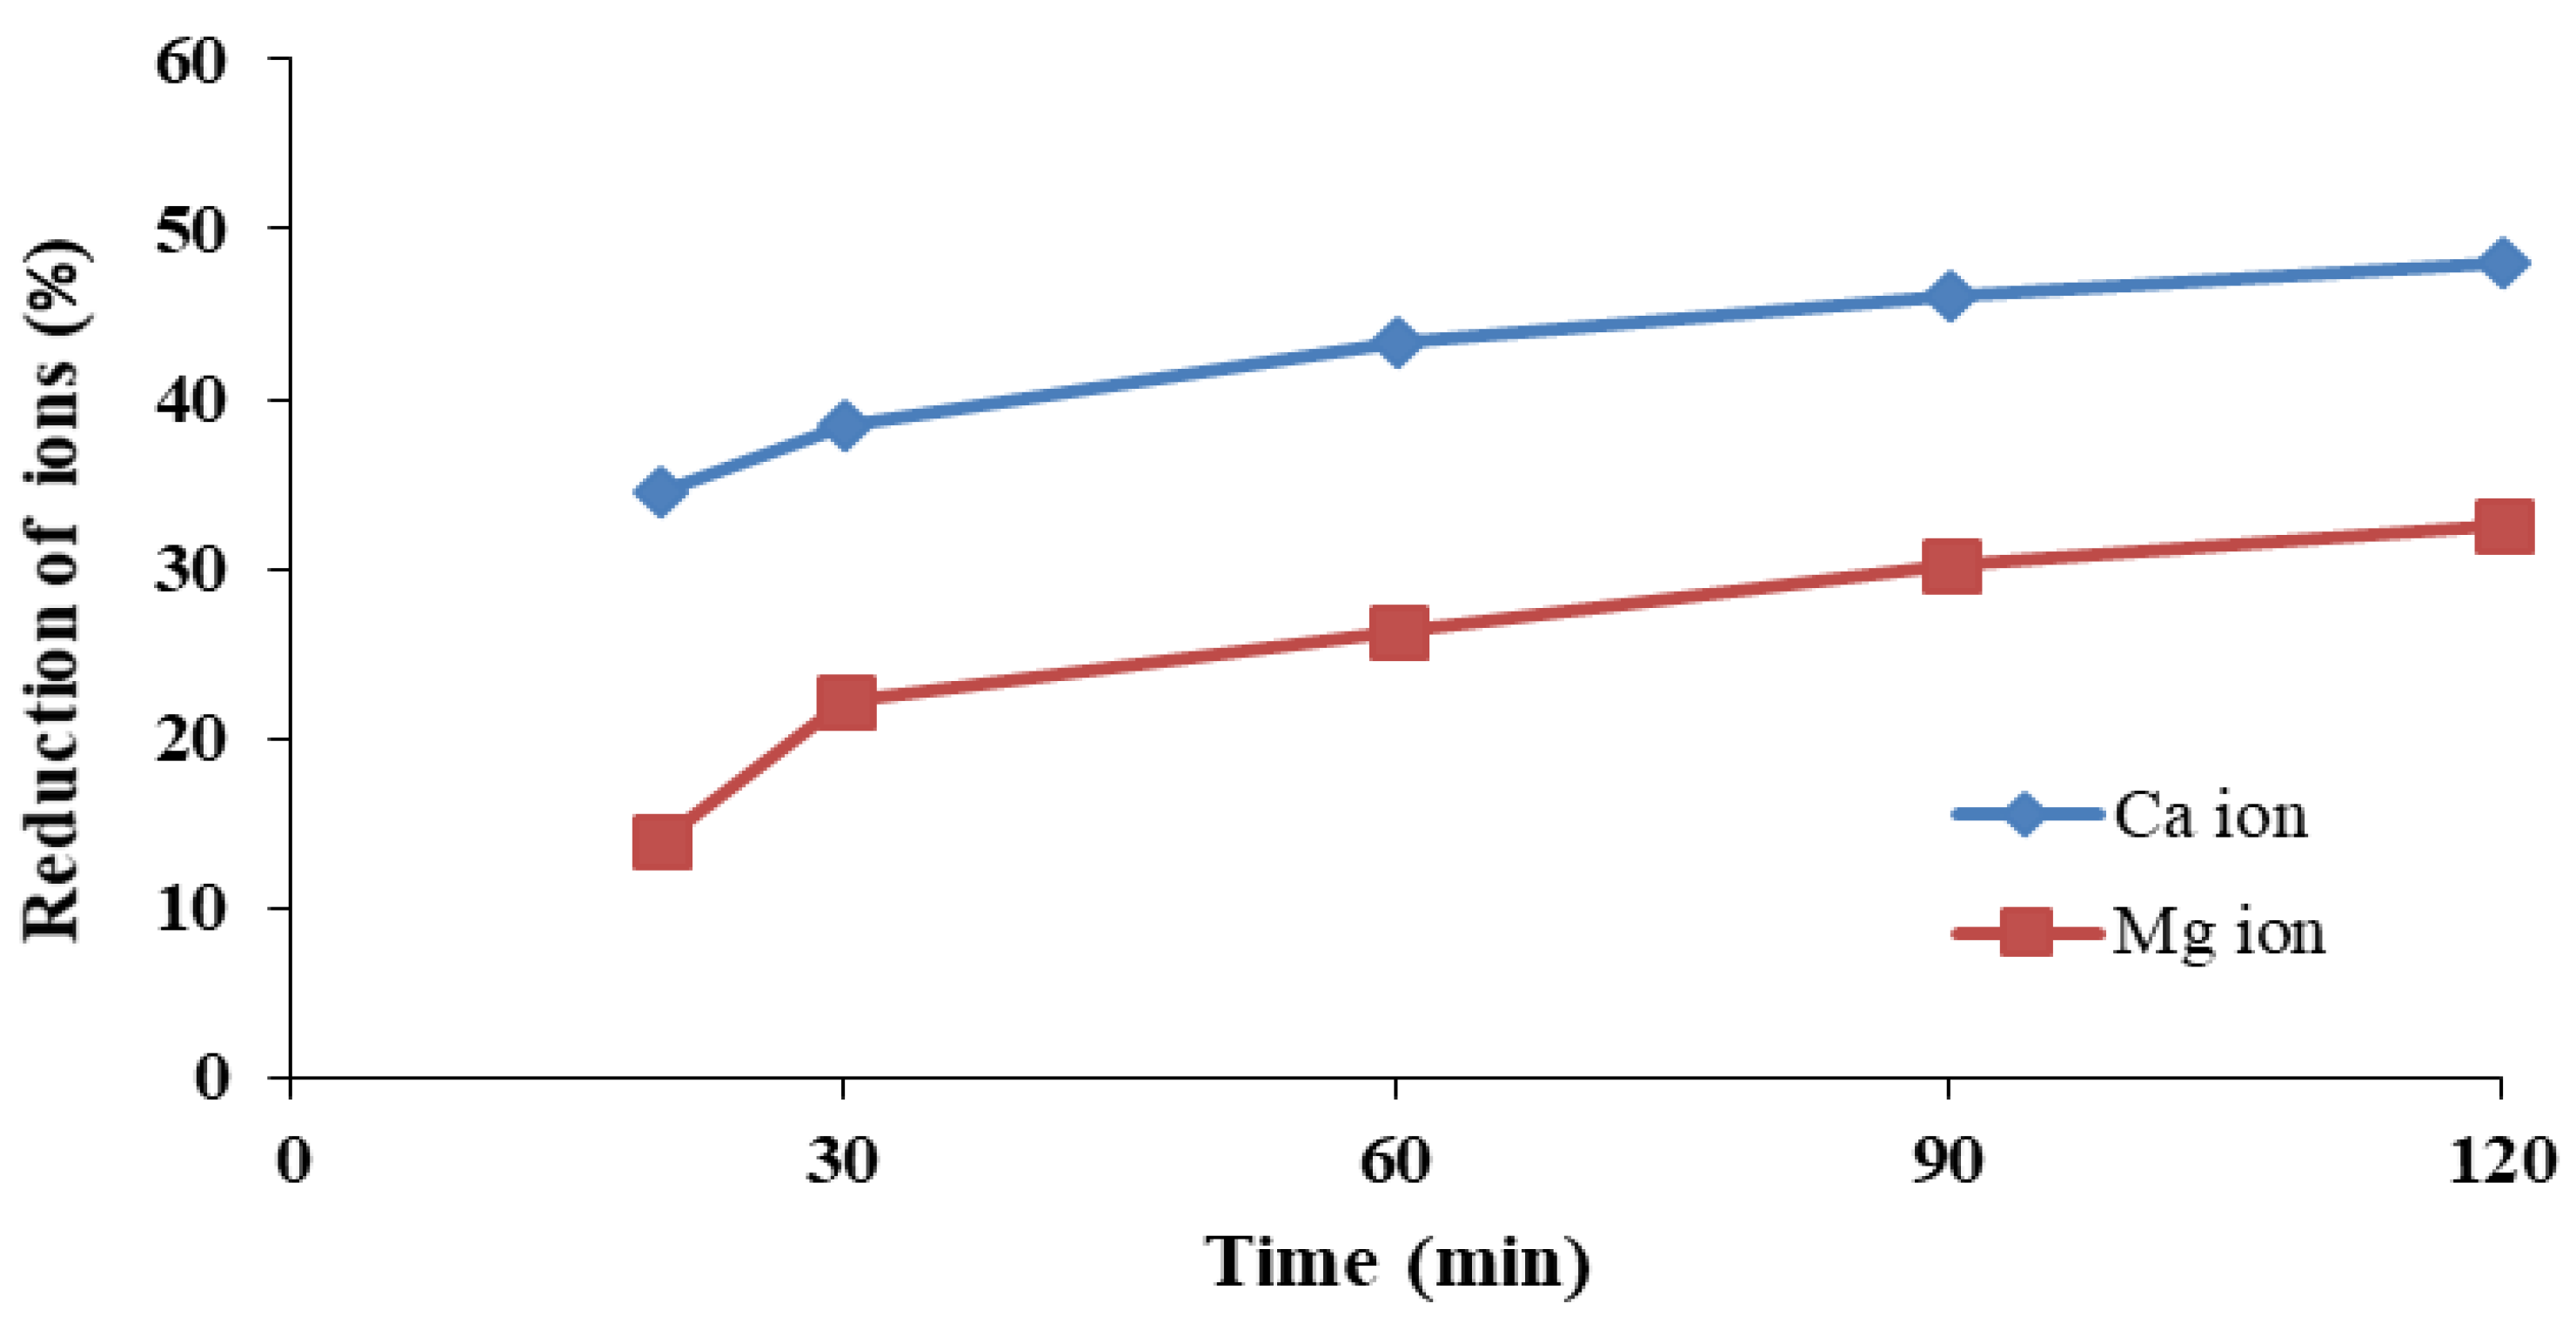
The Effect of Activated Alumina in Reducing Calcium and Magnesium Ions in Drinking Water
3.3. The Most Suitable Adsorbent
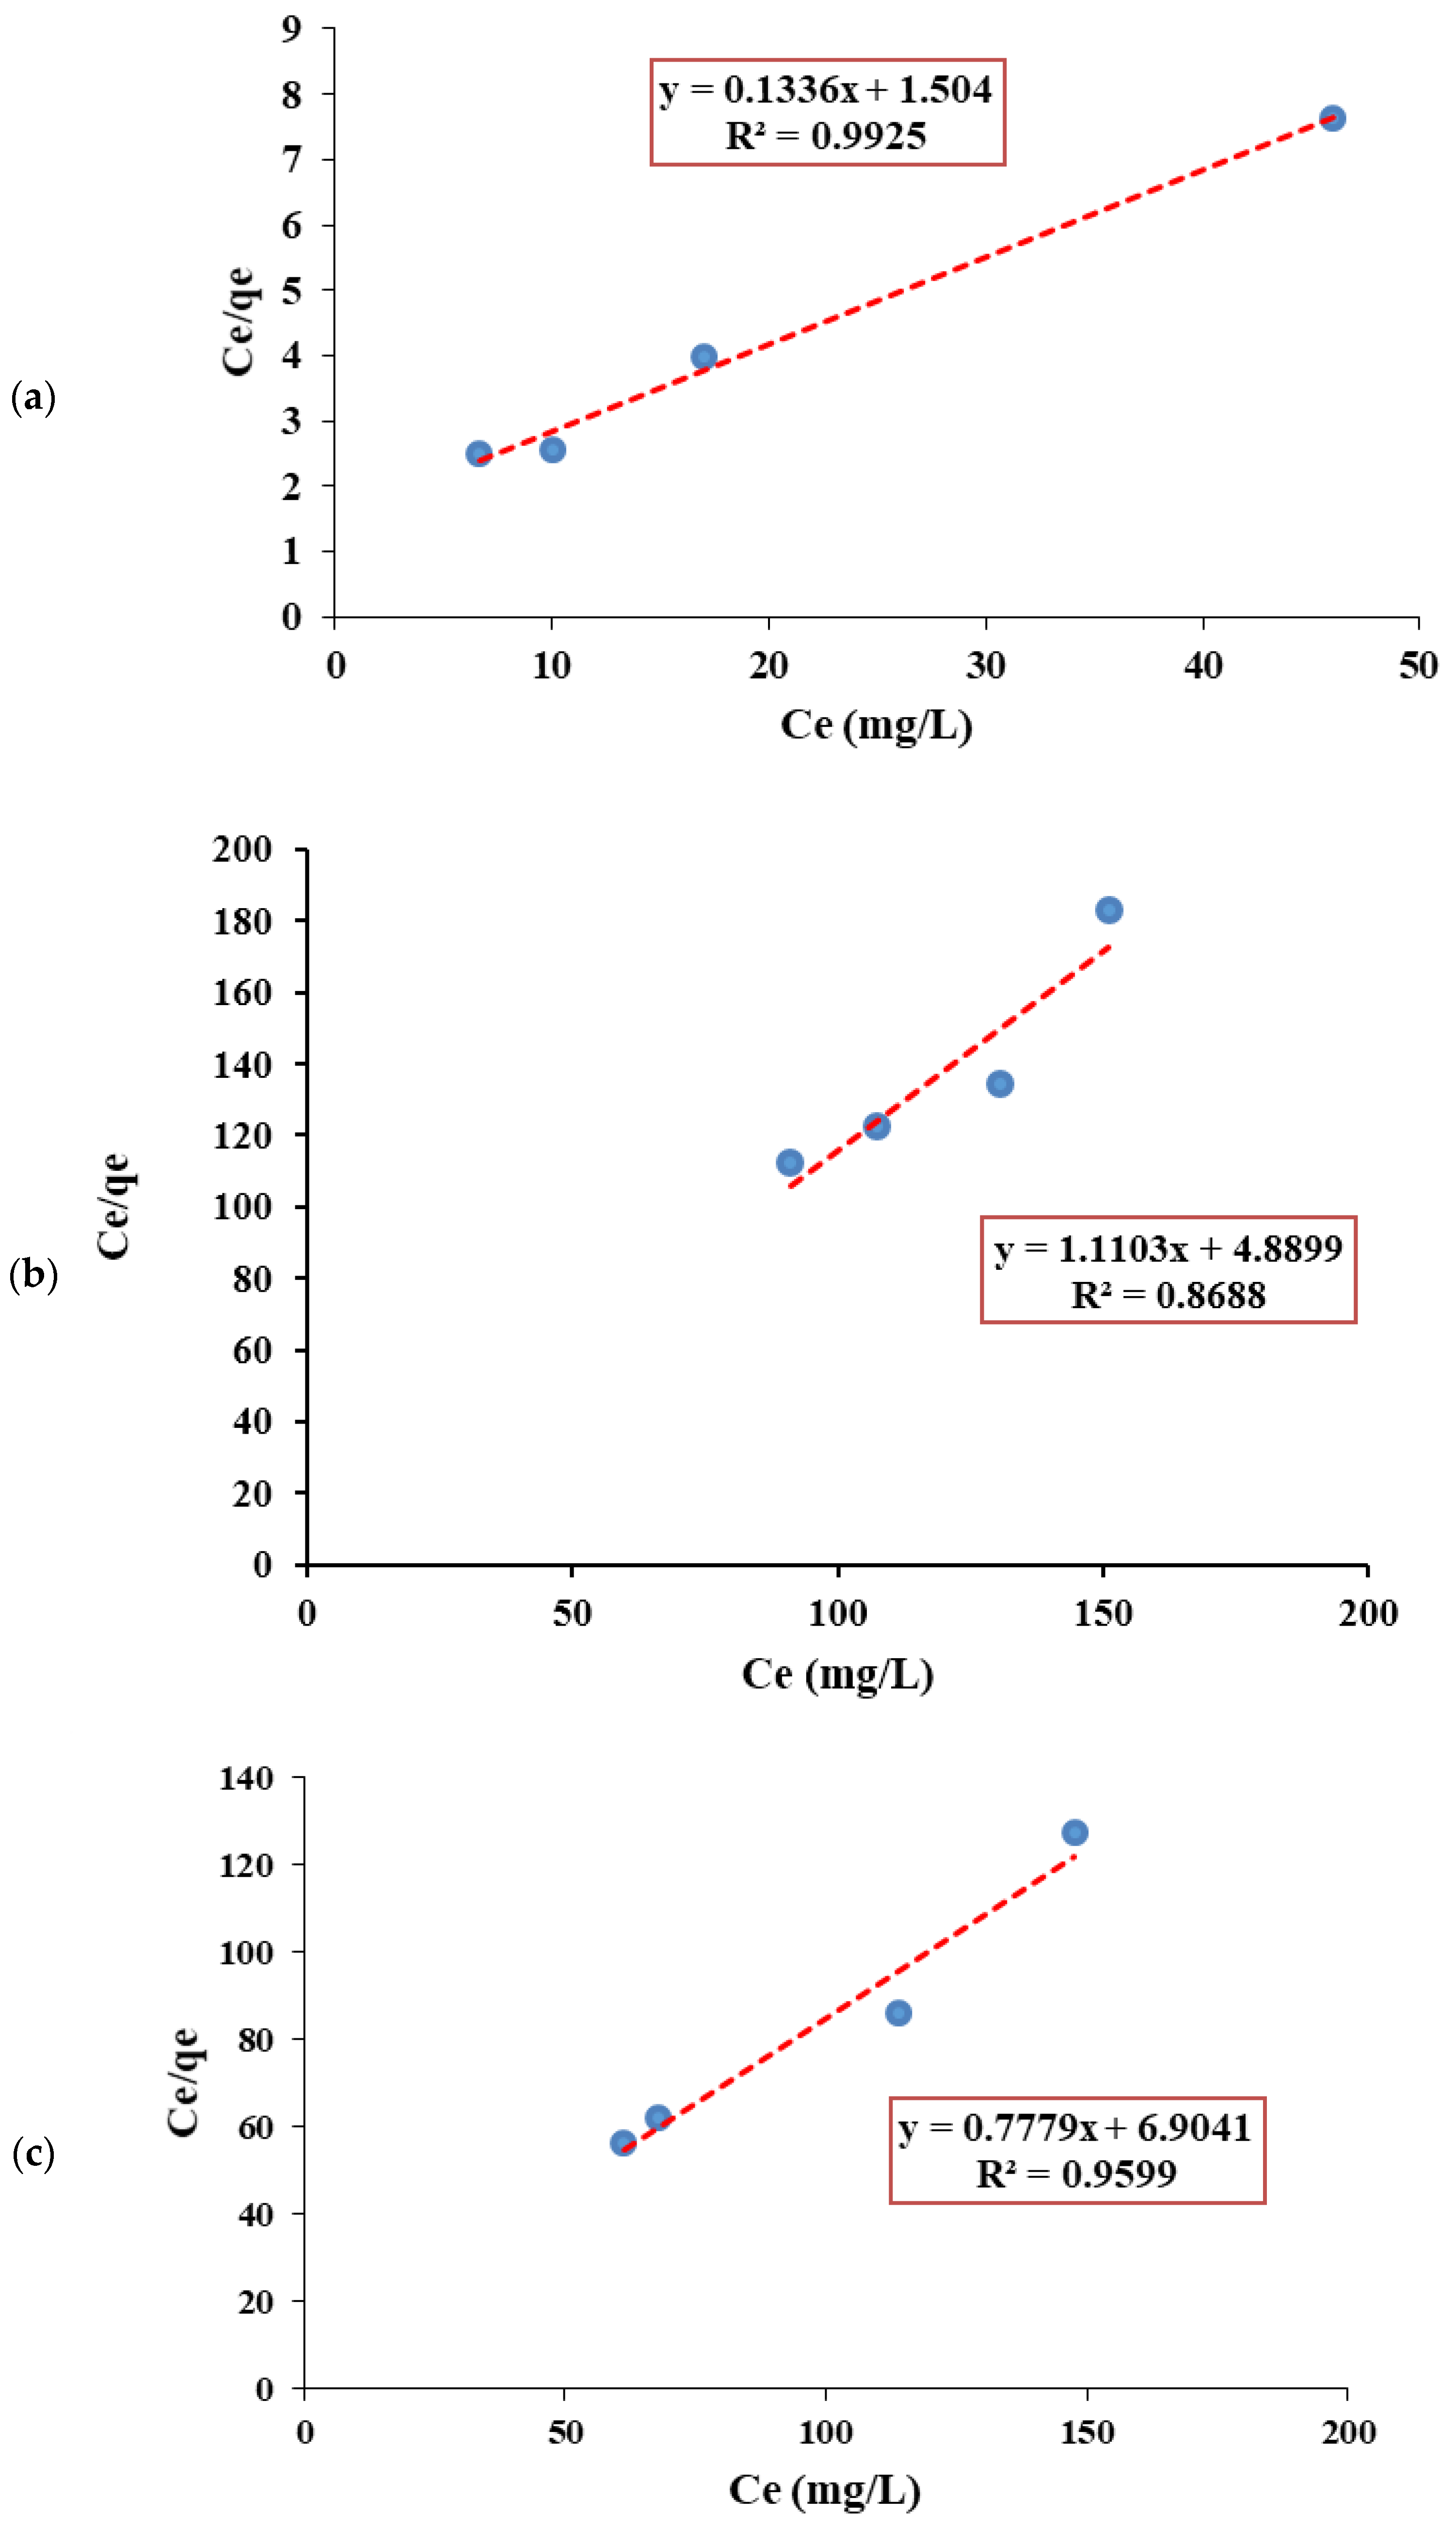
3.4. Adsorption Equilibrium Results
3.4.1. Langmuir Isotherm Model
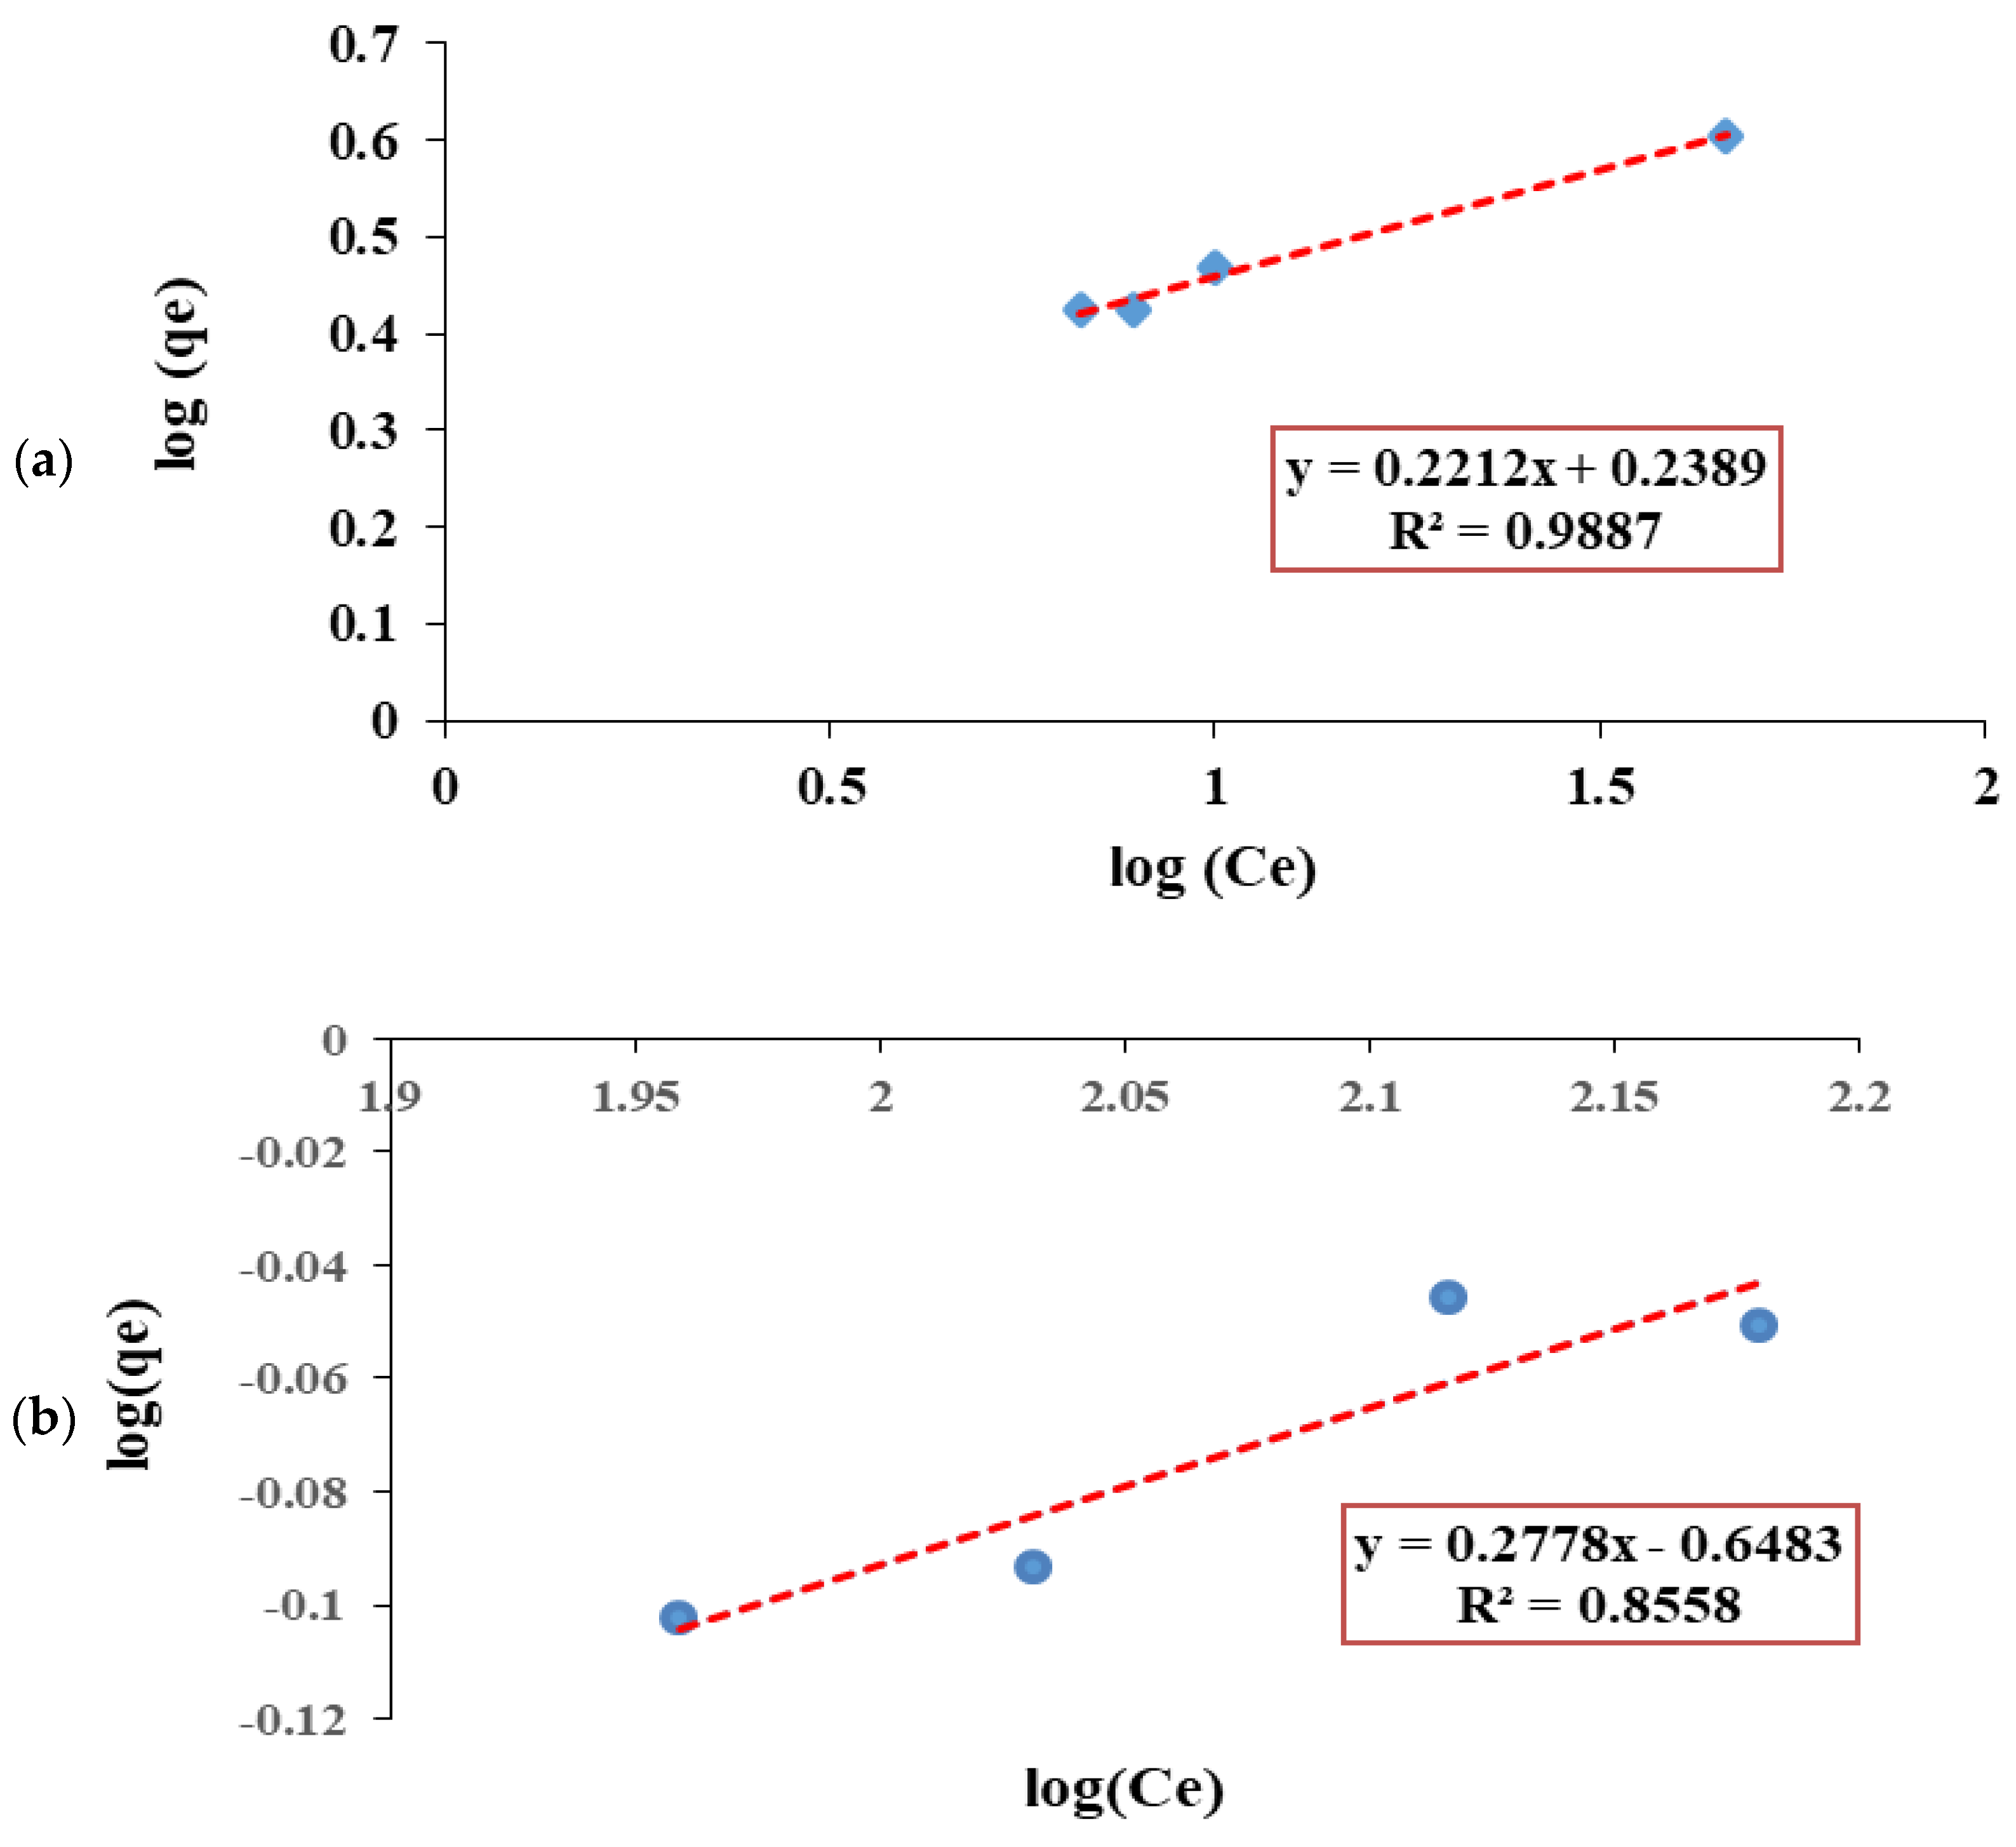
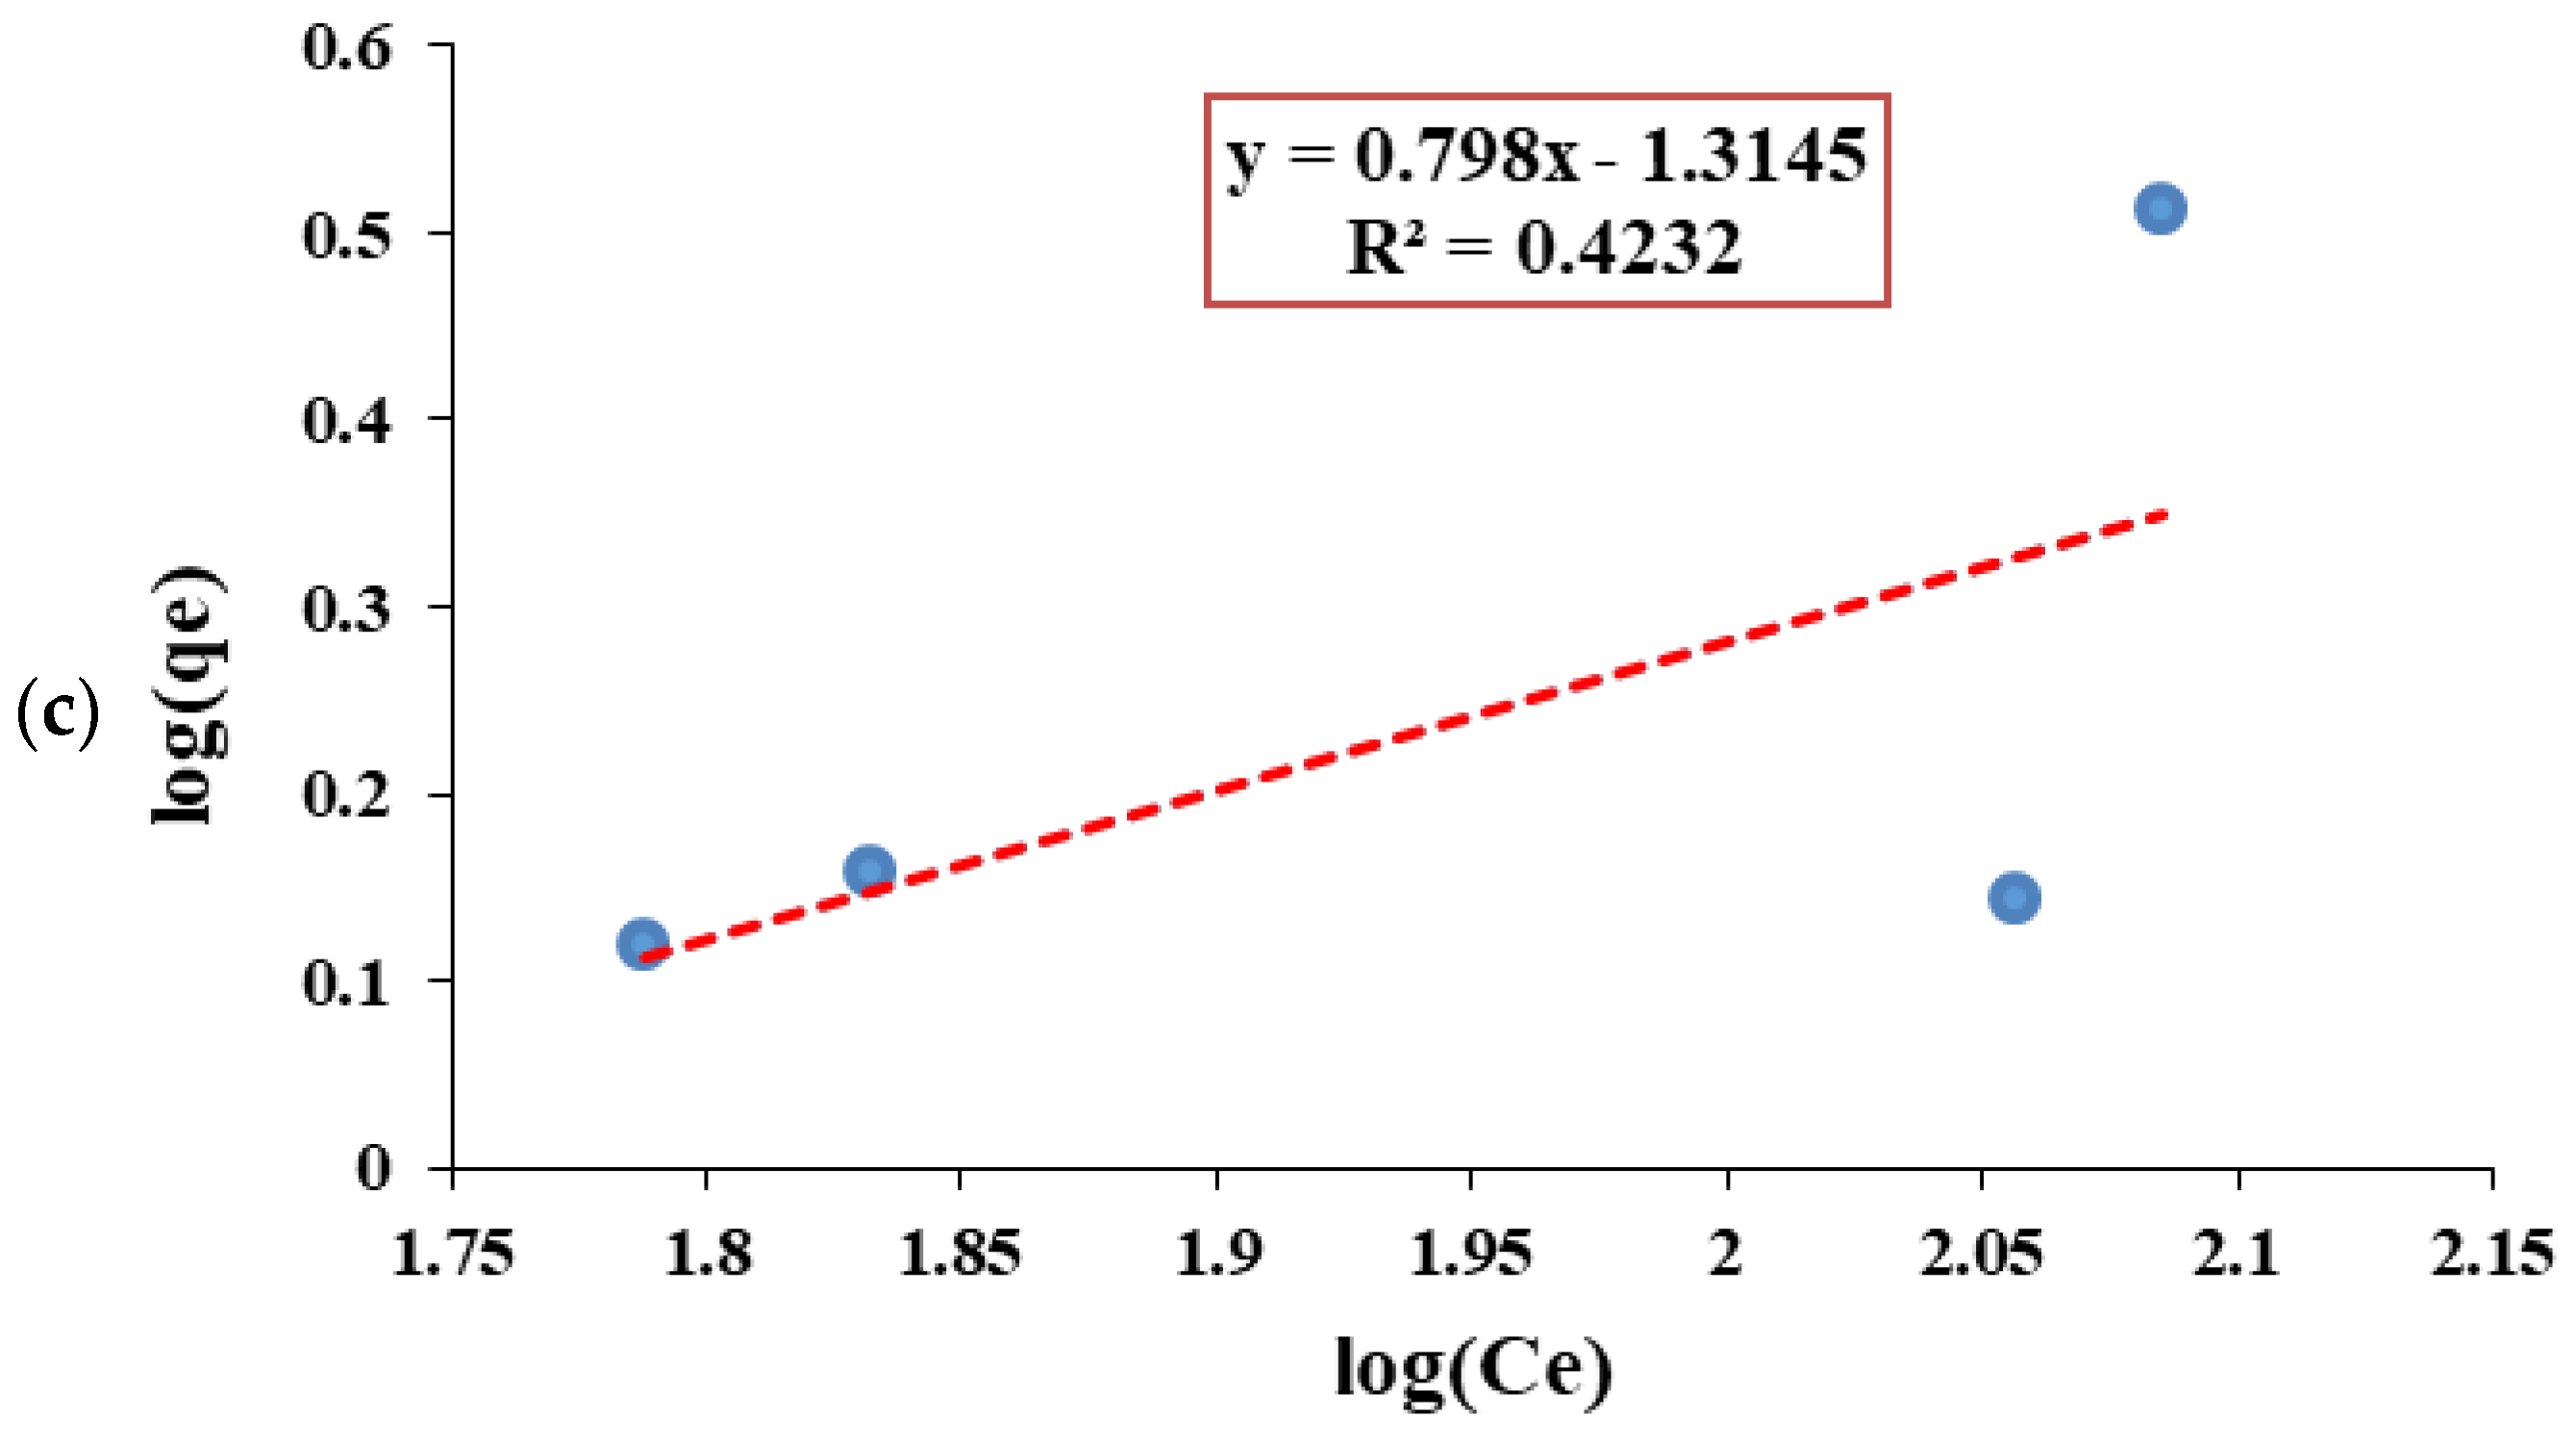
3.4.2. Freundlich Isotherm Model
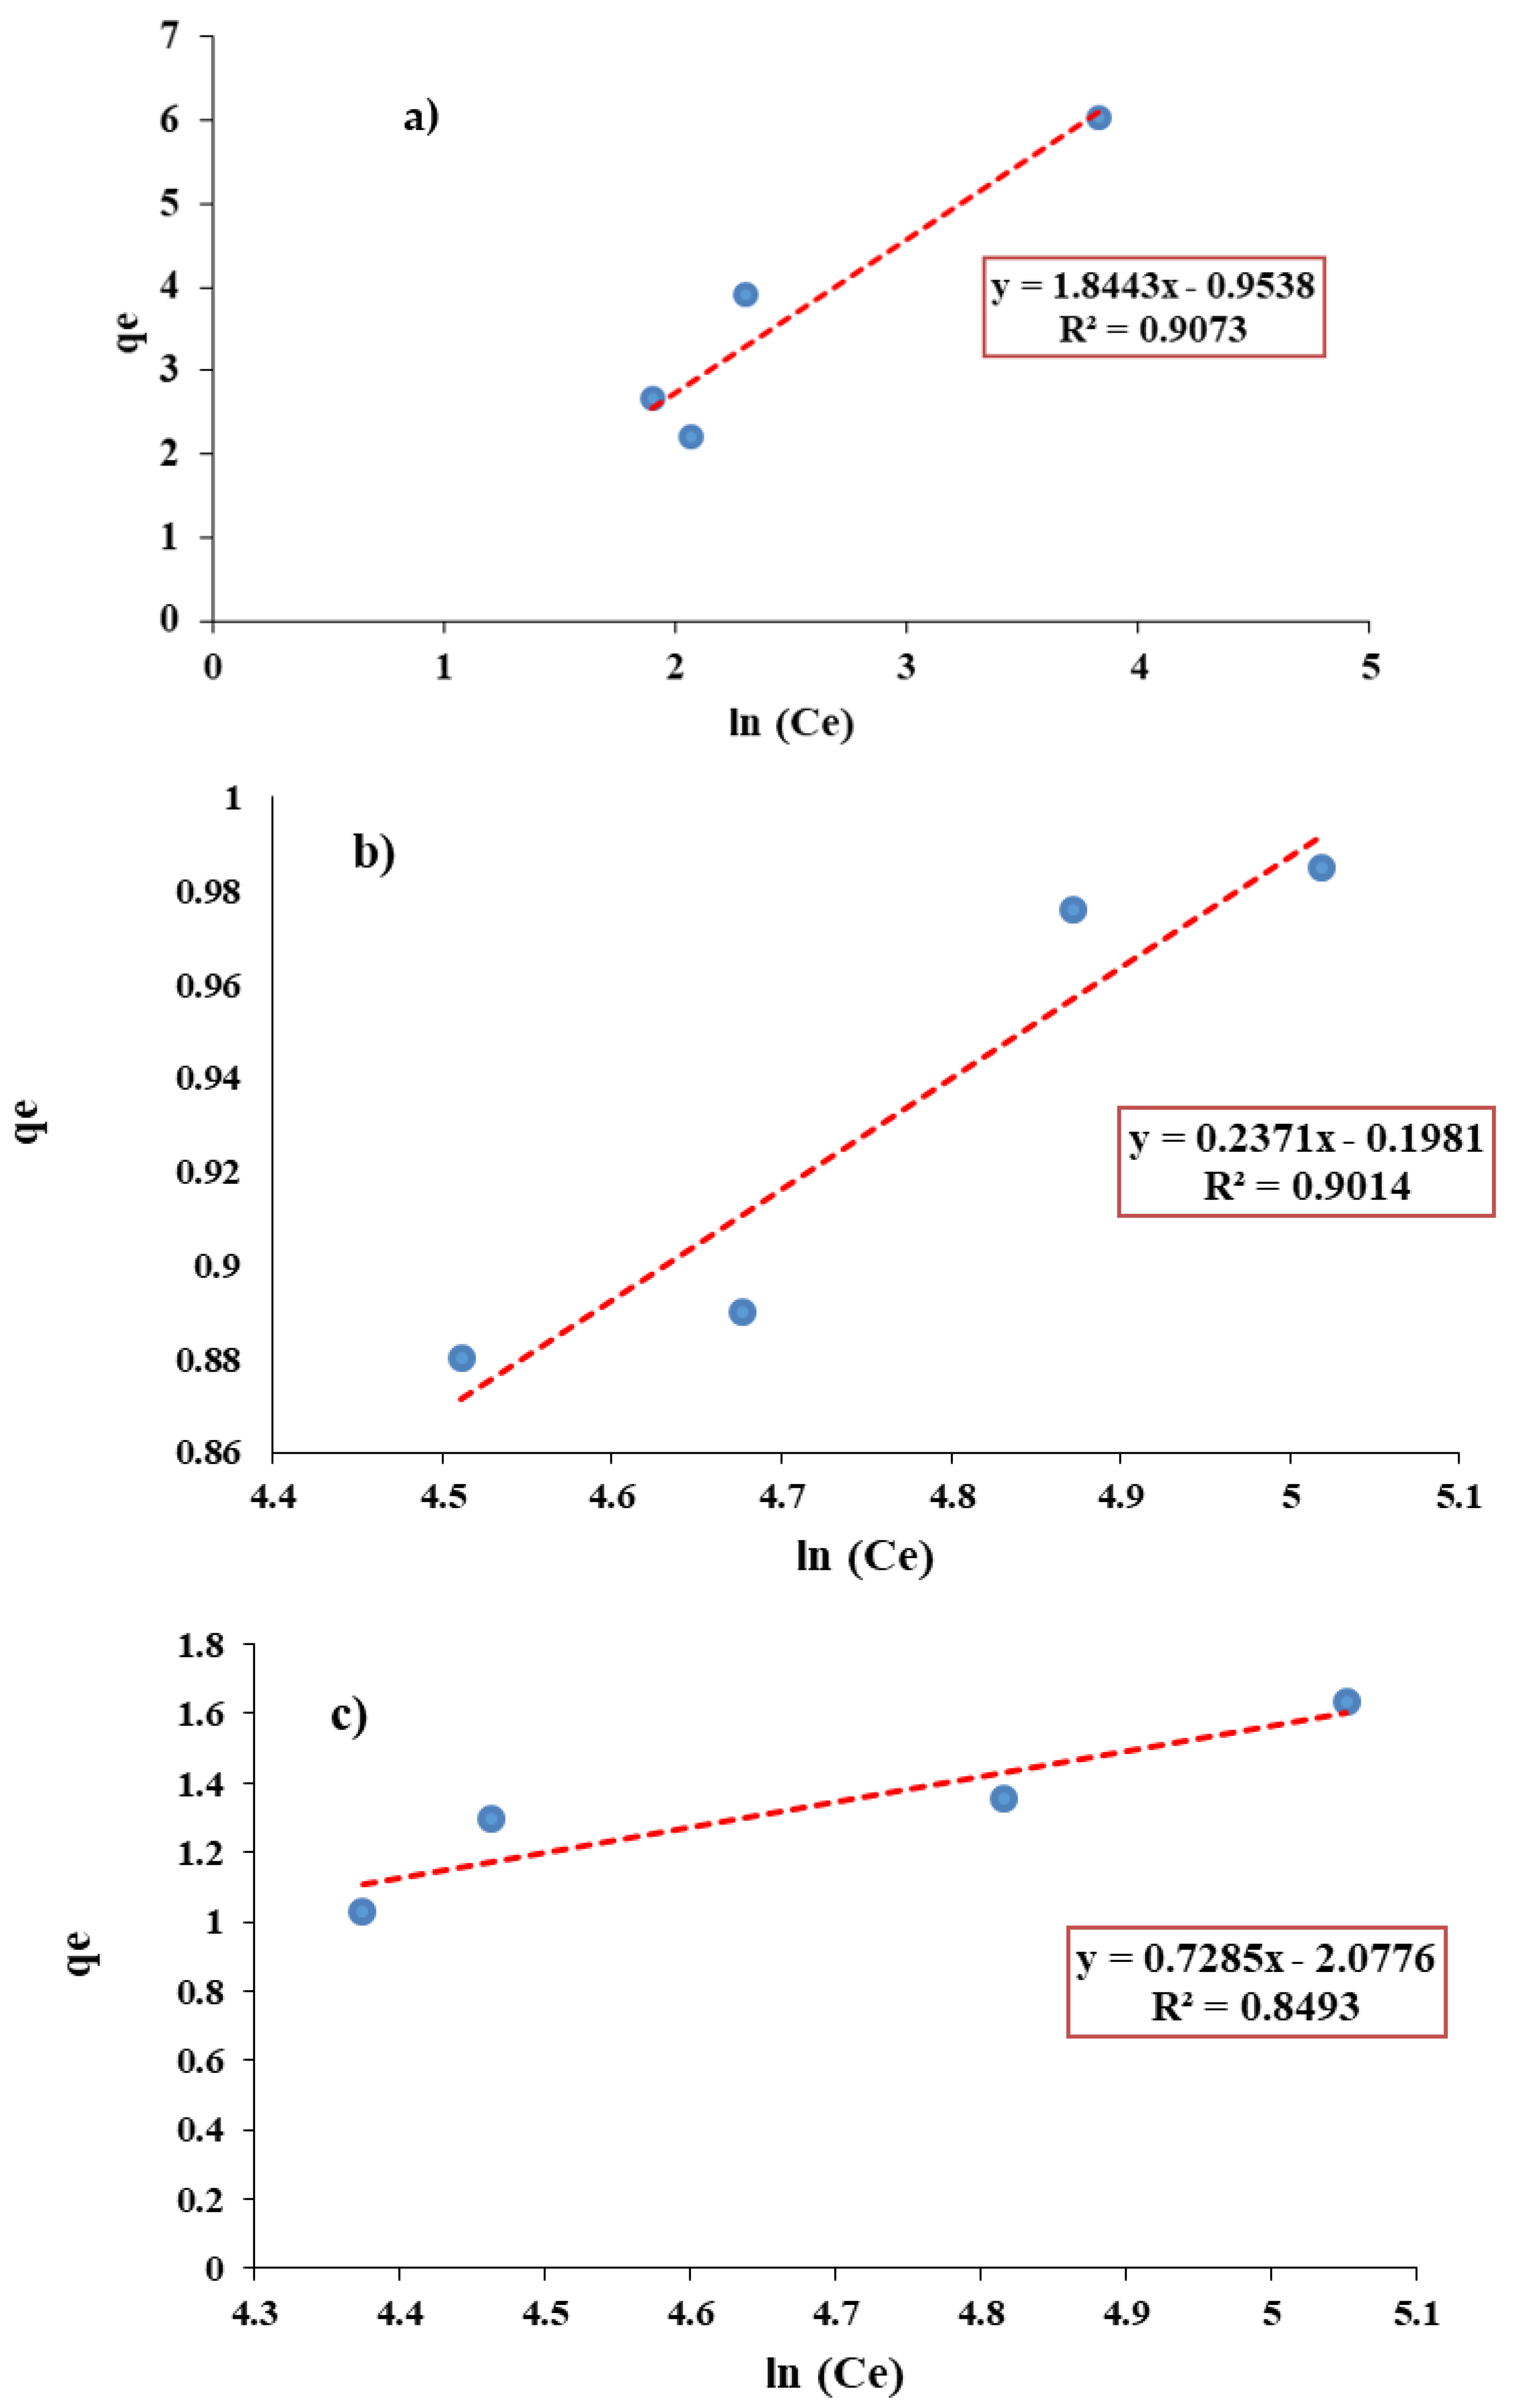
3.4.3. Temkin Isotherm Model
3.5. Adsorption Kinetic Results
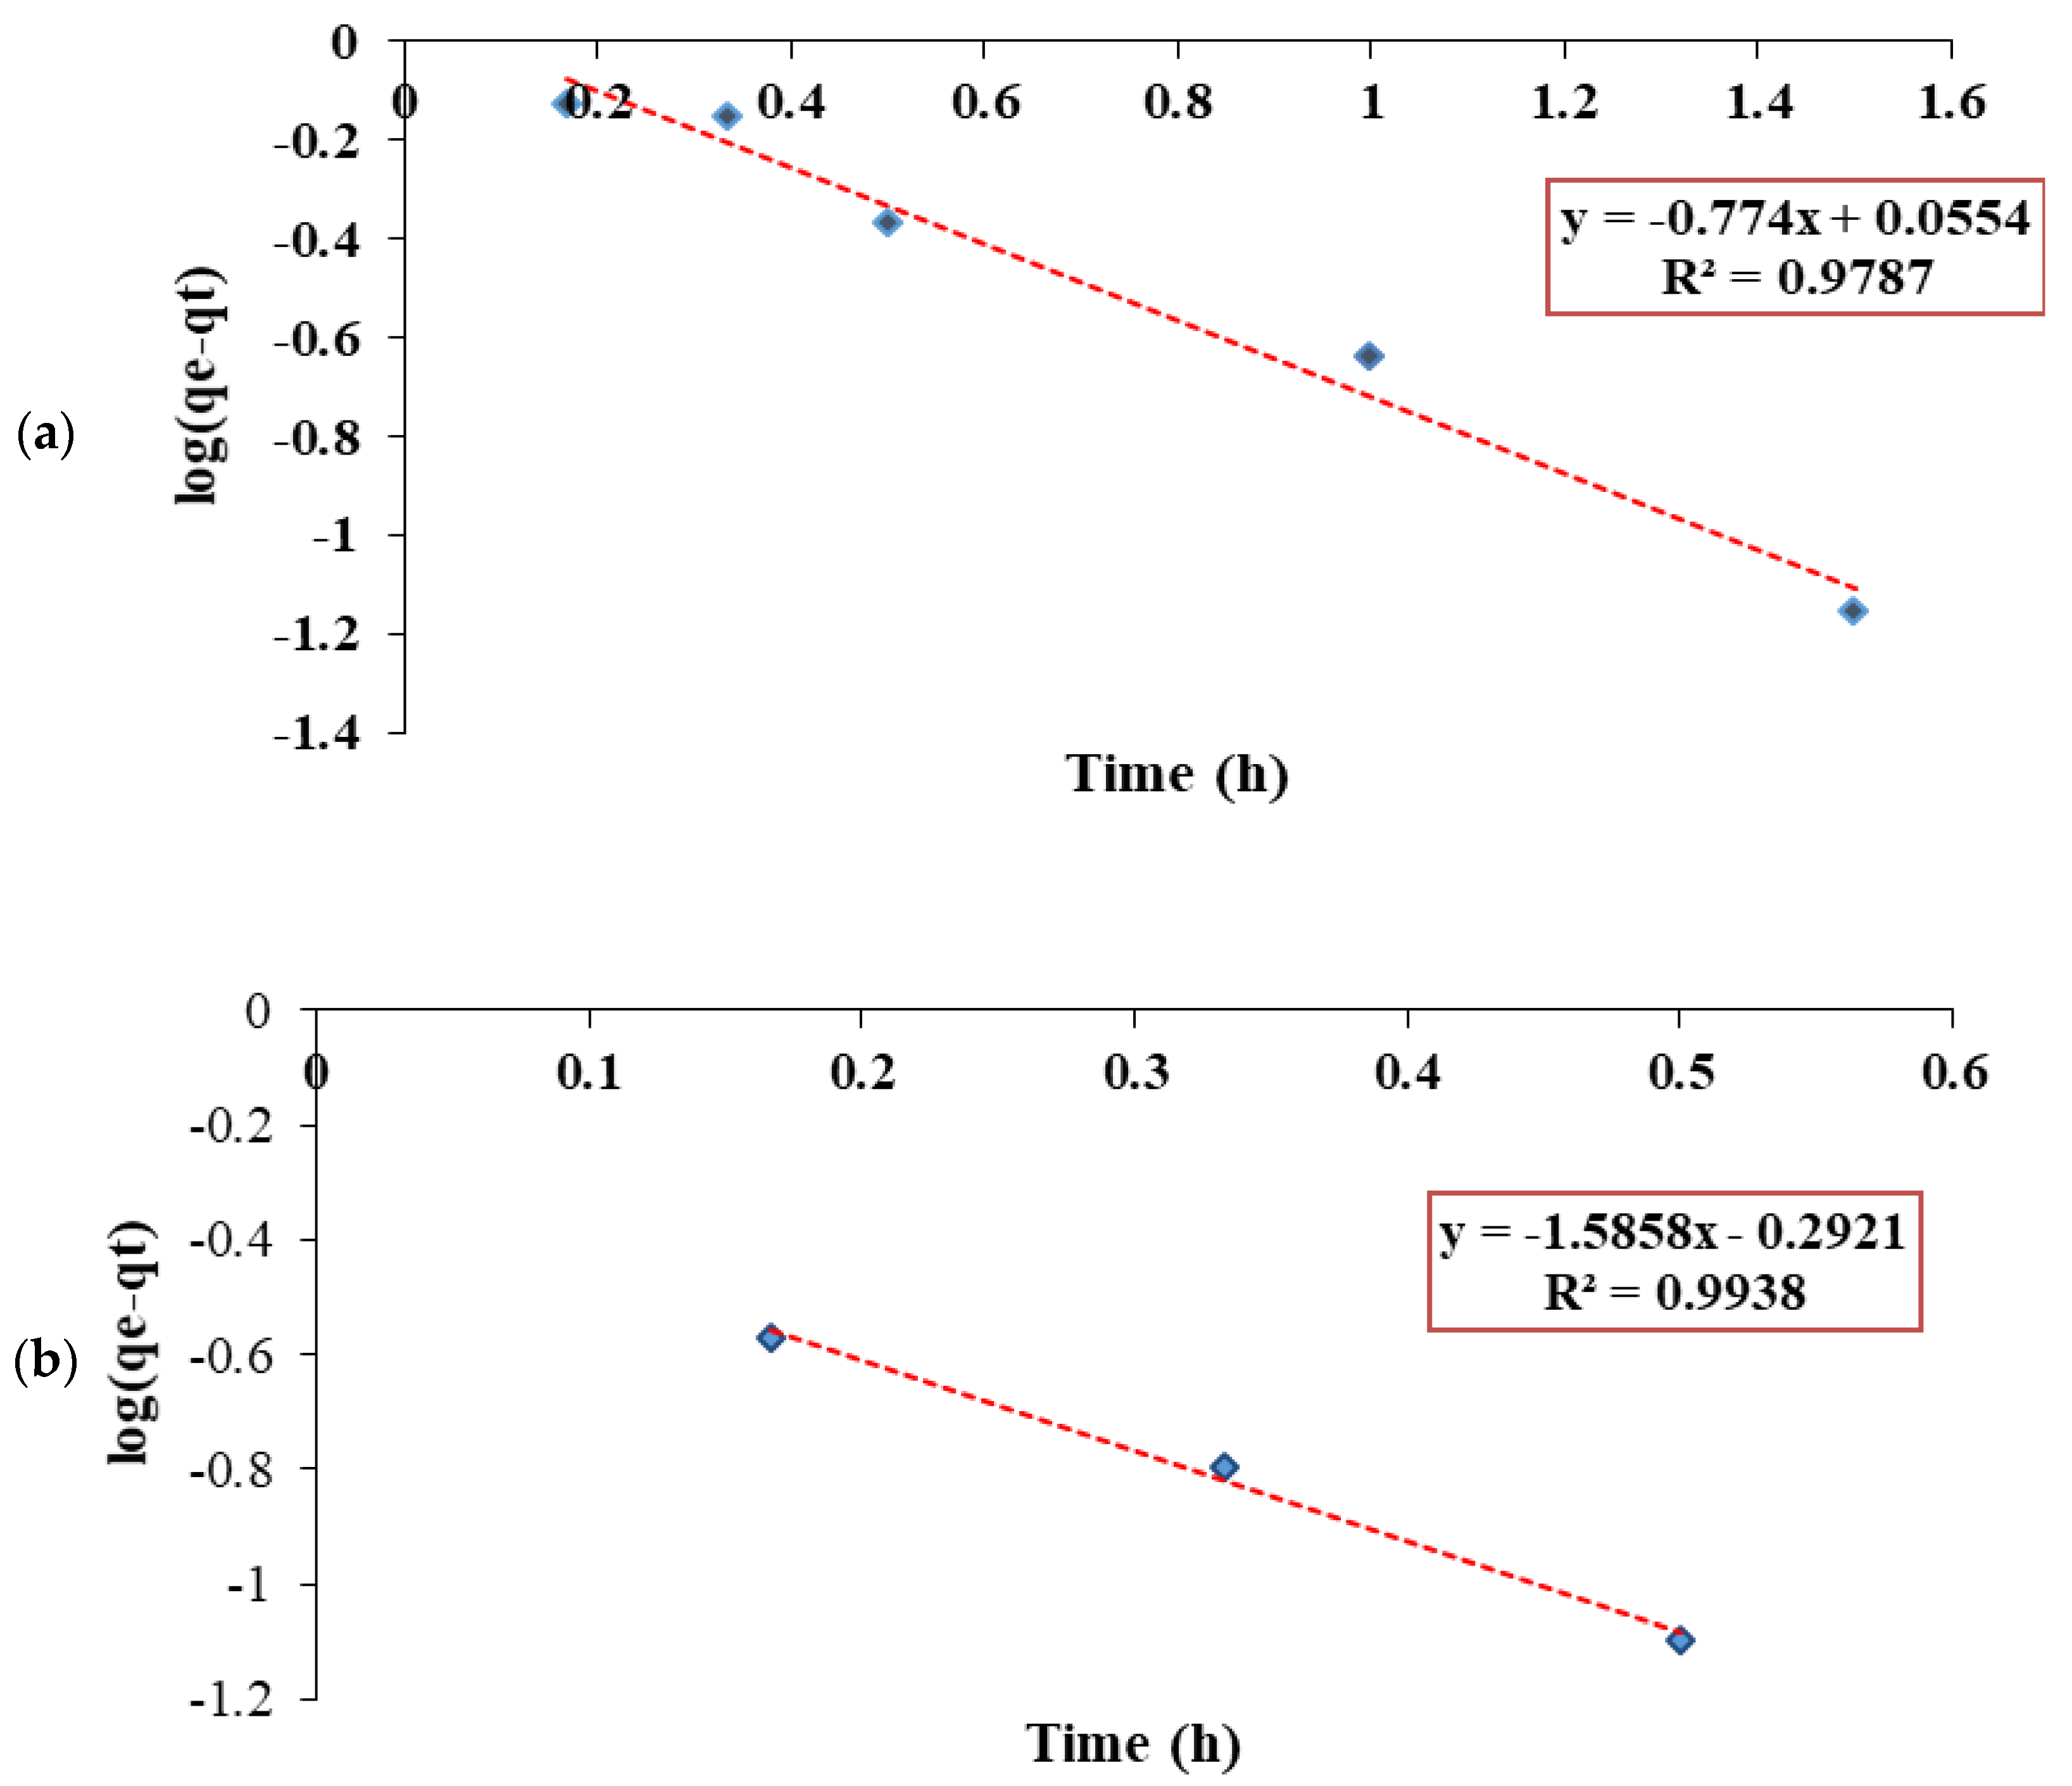
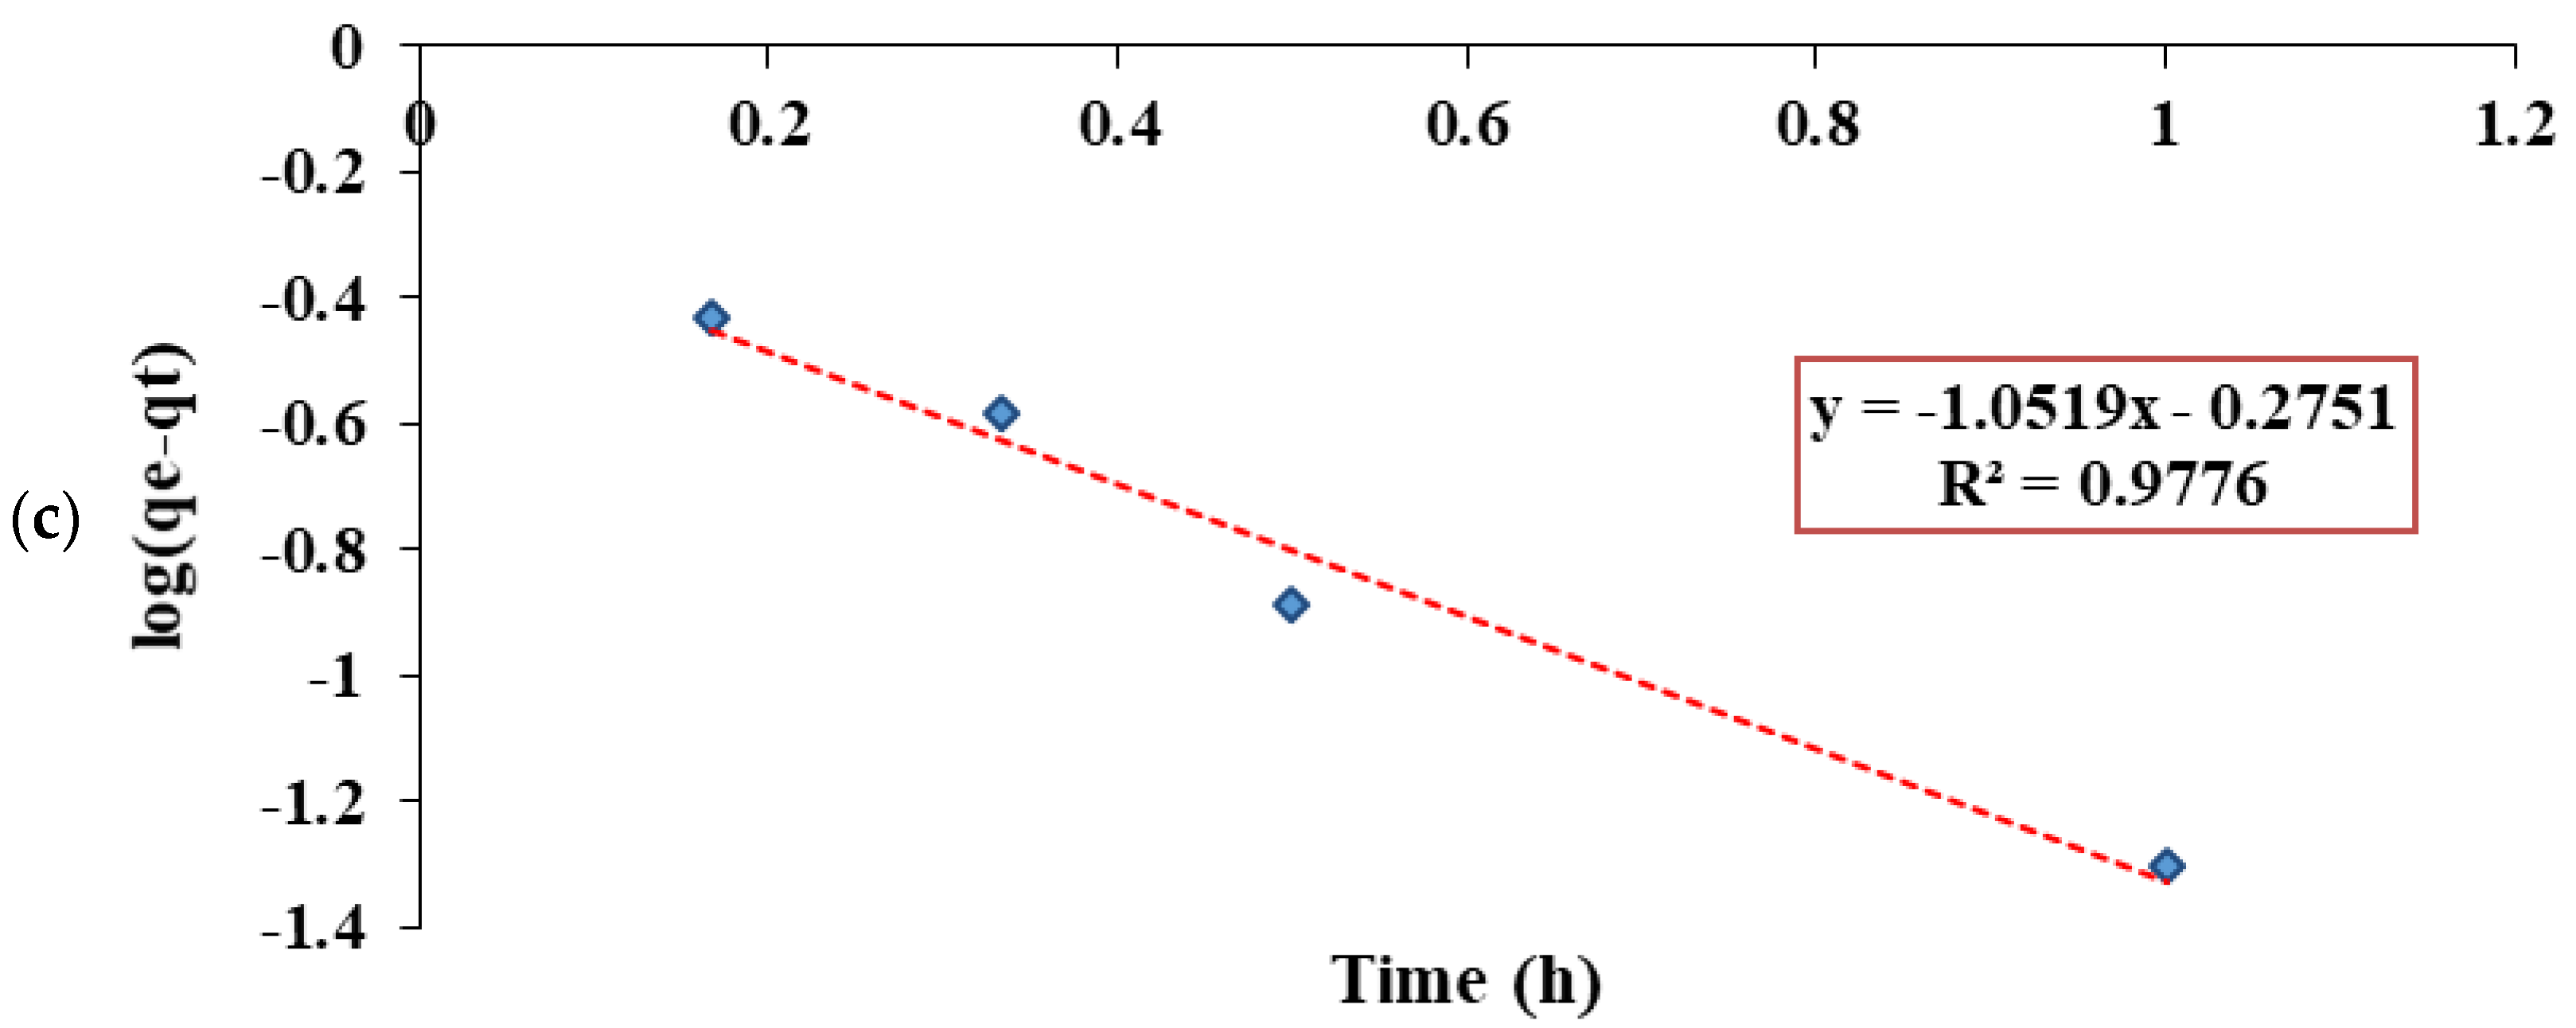
3.5.1. Pseudo-First-Order Kinetic Model
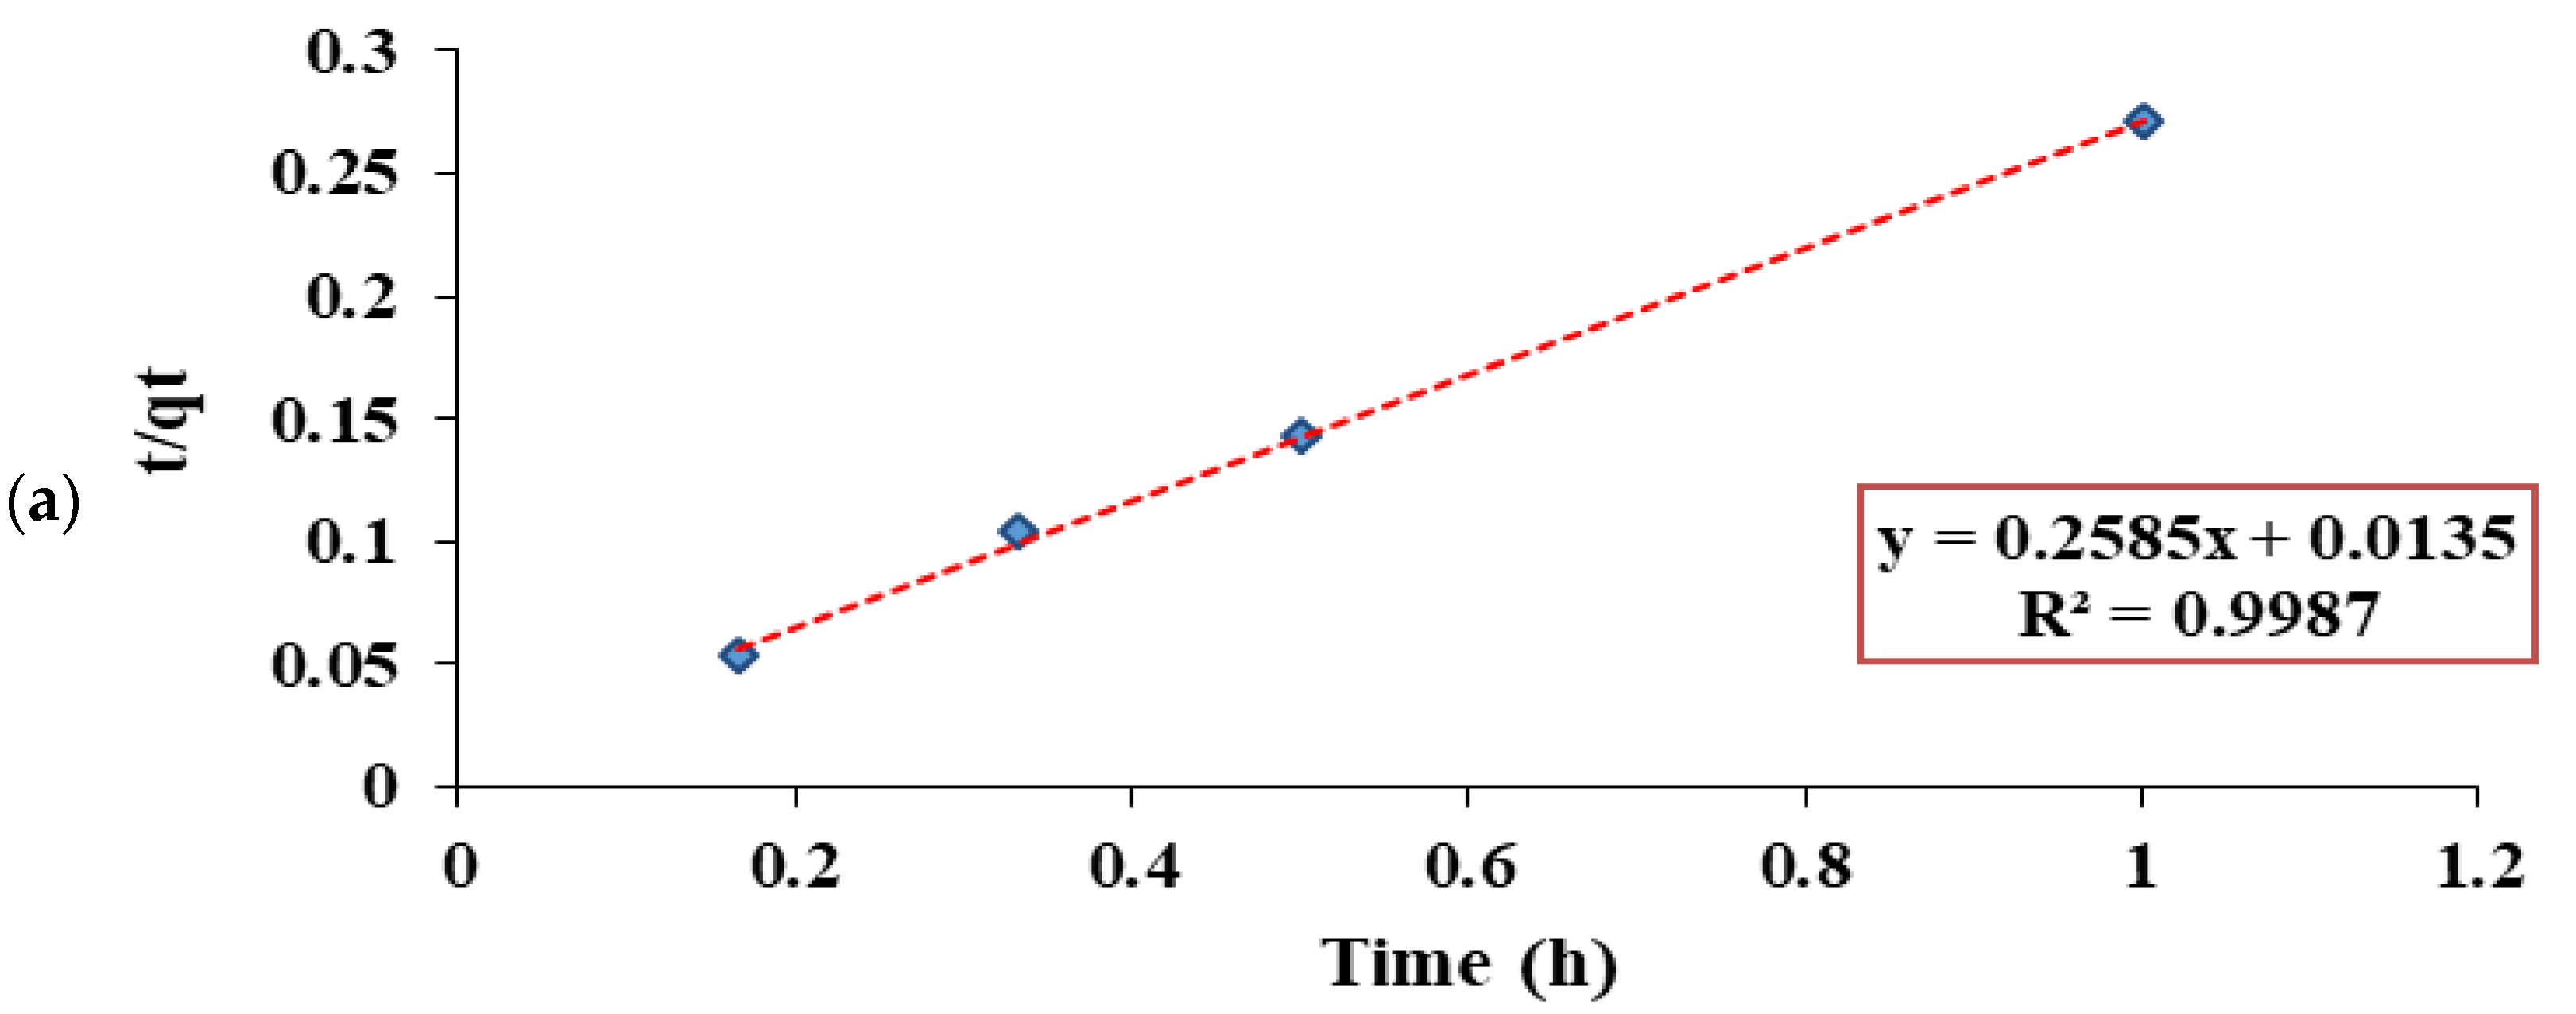
3.5.2. Pseudo-Second-Order Kinetic Model
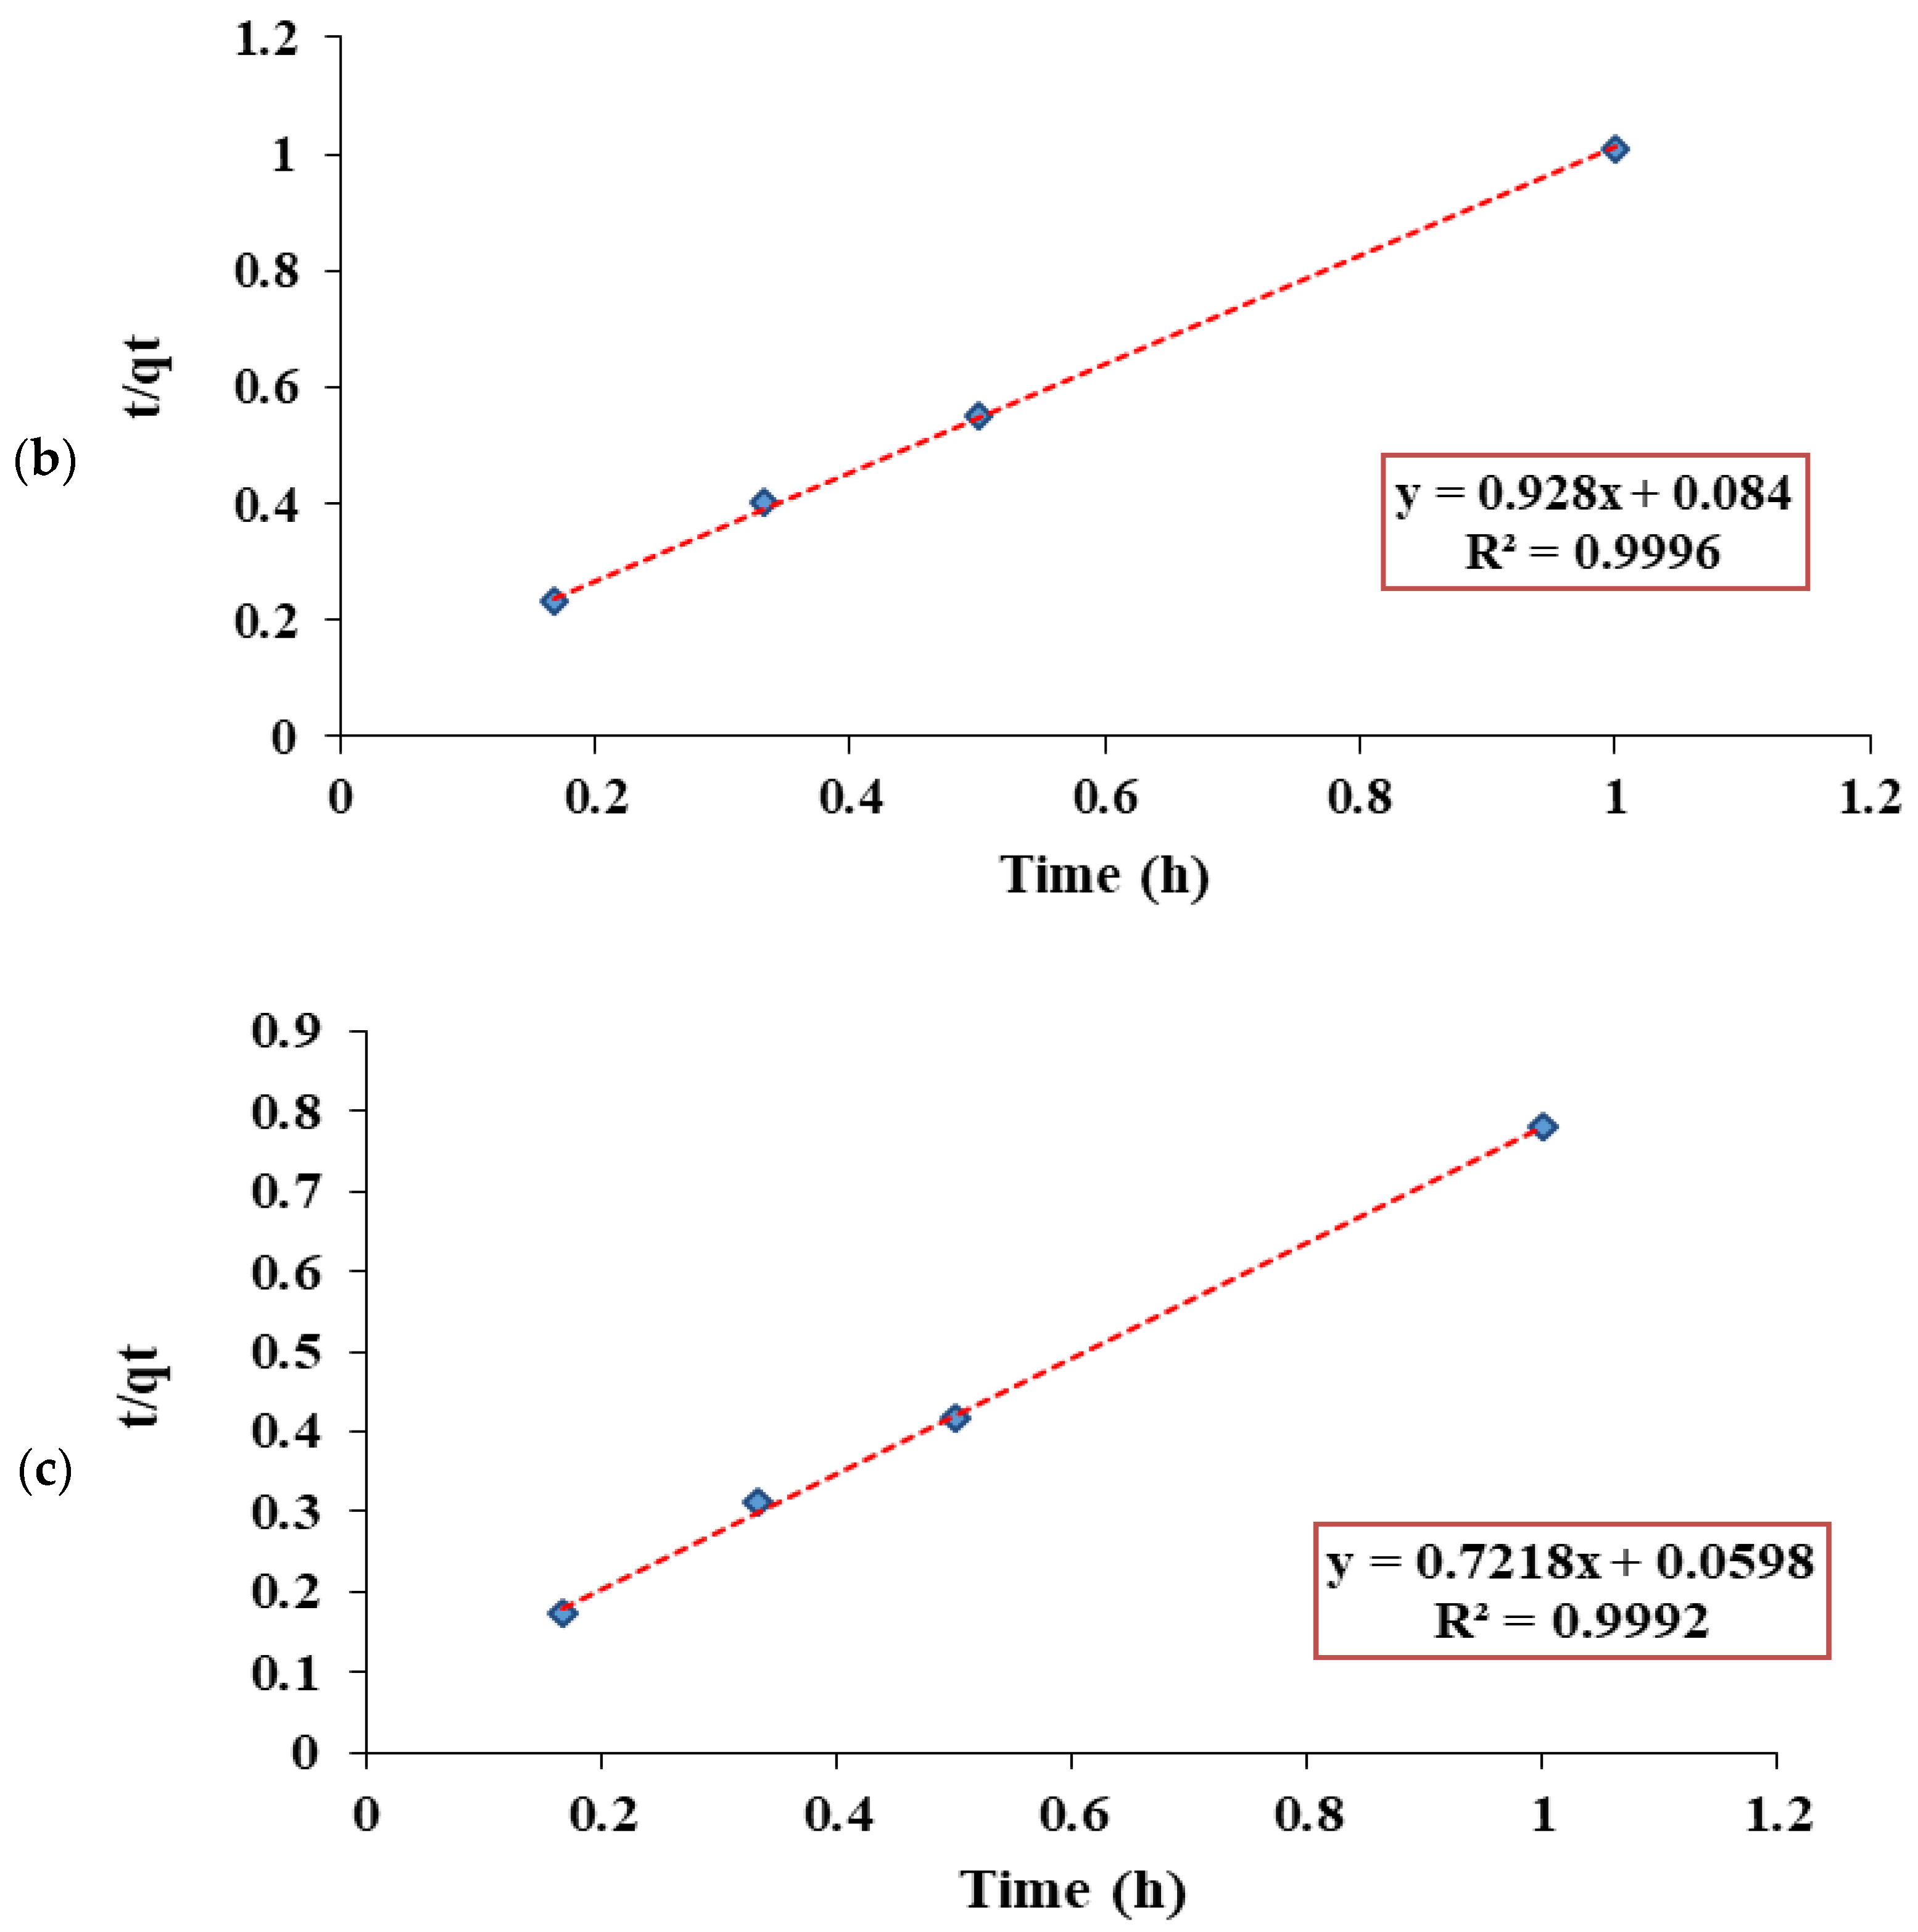
3.5.3. Morris–Weber Kinetic Model
4. Conclusions
Author Contributions
Funding
Institutional Review Board Statement
Informed Consent Statement
Data Availability Statement
Acknowledgments
Conflicts of Interest
References
- Nan Bakhsh, H. Chemical and microbial quality of drinking water sources. Urmia Med. J. 2003, 11, 41–50. [Google Scholar]
- Amin, M.; Alazba, A.; Manzoor, U. A review of removal of pollutants from water/wastewater using different types of nanomaterials. Adv. Mater. Sci. Eng. 2014, 2014, 825910. [Google Scholar] [CrossRef]
- Lall, S.P. The minerals. In Fish Nutrition; Elsevier: Amsterdam, The Netherlands, 2022; pp. 469–554. [Google Scholar]
- Asghari, F.B.; Jaafari, J.; Yousefi, M.; Mohammadi, A.A.; Dehghanzadeh, R. Evaluation of water corrosion, scaling extent and heterotrophic plate count bacteria in asbestos and polyethylene pipes in drinking water distribution system. Hum. Ecol. Risk Assess. Int. J. 2018, 24, 1138–1149. [Google Scholar] [CrossRef]
- Geldreich, E.E. Microbial Quality of Water Supply in Distribution Systems; CRC Press: Boca Raton, FL, USA, 2020. [Google Scholar]
- Akram, S.; Rehman, F. Hardness in drinking-water, its sources, its effects on humans and its household treatment. J. Chem. Appl. 2018, 4, 1–4. [Google Scholar]
- Emerson, A. Quantitative Forecasting of Problems in Industrial Water Systems; World Scientific: Singapore, 2003. [Google Scholar]
- Shams, M.; Mohamadi, A.; Sajadi, S.A. Evaluation of corrosion and scaling potential of water in rural water supply distribution networks of Tabas, Iran. World Appl. Sci. J. 2012, 17, 1484–1489. [Google Scholar]
- Świetlik, J.; Raczyk-Stanisławiak, U.; Piszora, P.; Nawrocki, J. Corrosion in drinking water pipes: The importance of green rusts. Water Res. 2012, 46, 1–10. [Google Scholar] [CrossRef]
- Henthorne, L.; Boysen, B. State-of-the-art of reverse osmosis desalination pretreatment. Desalination 2015, 356, 129–139. [Google Scholar] [CrossRef]
- Ping, Q.; Cohen, B.; Dosoretz, C.; He, Z. Long-term investigation of fouling of cation and anion exchange membranes in microbial desalination cells. Desalination 2013, 325, 48–55. [Google Scholar] [CrossRef]
- Gowing, J. Water and the Environment: Innovation Issues in Irrigation and Drainage; CRC Press: Boca Raton, FL, USA, 2003. [Google Scholar]
- Purkayastha, D.; Mishra, U.; Biswas, S. A comprehensive review on Cd (II) removal from aqueous solution. J. Water Process Eng. 2014, 2, 105–128. [Google Scholar] [CrossRef]
- Goud, R.V.; Kumar, B.L.; Abhilash, N.; Prasad, P.R.; Saradhi, B.V. Comparision studies on adsorbants for removal of hardness from water by using newly prepared zeolite. Int. J. Adv. Pharm. Biol. Chem. 2015, 4, 342–354. [Google Scholar]
- Pinto, X.; Al-Abed, S.R.; Balz, D.A.; Butler, B.A.; Landy, R.B.; Smith, S.J. Bench-scale and pilot-scale treatment technologies for the removal of total dissolved solids from coal mine water: A review. Mine Water Environ. 2016, 35, 94–112. [Google Scholar] [CrossRef]
- Hamidpour, M.; Kalbasi, M.; Afyuni, M.; Shariatmadari, H.; Holm, P.E.; Hansen, H.C.B. Sorption hysteresis of Cd (II) and Pb (II) on natural zeolite and bentonite. J. Hazard. Mater. 2010, 181, 686–691. [Google Scholar] [CrossRef] [PubMed]
- Yusof, A.M.; Malek, N.A.; Kamaruzaman, N.A.; Adil, M. Removal of Ca2+ and Zn2+ from aqueous solutions by zeolites NaP and KP. Environ. Technol. 2010, 31, 41–46. [Google Scholar] [CrossRef] [PubMed]
- Bello, O.S.; Adegoke, K.A.; Olaniyan, A.A.; AbdulAzeez, H. Dye adsorption using biomass wastes and natural adsorbents: Overview and future prospects. Desalination Water Treat. 2015, 53, 1292–1315. [Google Scholar] [CrossRef]
- Paul, P.J. Value Added Products from Gasification Activated Carbon; Combustion Gasifica-tion and Propulsion Laboratory Department of Aerospace Engineering; Indian Institute of Science: Bangalore, India, 2002. [Google Scholar]
- Zsilák, Z.; Szabó-Bárdos, E.; Fónagy, O.; Horváth, O.; Horváth, K.; Hajós, P. Degradation of benzenesulfonate by heterogeneous photocatalysis combined with ozonation. Catal. Today 2014, 230, 55–60. [Google Scholar] [CrossRef]
- Shokrolahzadeh, A.; Shokuhi Rad, A.; Adinehvand, J. Modification of nano Clinoptilolite Zeolite using sulfuric Acid and its application toward removal of Arsenic from water sample. J. Nanoanalysis 2017, 4, 48–58. [Google Scholar]
- Mahvi, A.H.; Vosoughi, M.; Mohammadi, M.J.; Asadi, A.; Hashemzadeh, B.; Zahedi, A.; Pourfadakar, S. Sodium dodecyl sulfate modified-zeolite as a promising adsorbent for the removal of natural organic matter from aqueous environments. Health Scope 2016, 5, 1–8. [Google Scholar] [CrossRef]
- Farrag, A.; Moghny, A.; Gad, A.M.; Saleem, S.S.; Fathy, M.; Ahmed, M. Removing of hardness salts from groundwater by thermogenic synthesis zeolite. J. Hydrogeol. Hydrol. Eng. 2016, 5, 9647. [Google Scholar]
- Aghazadeh, S.; Safarzadeh, E.; Gharabaghi, M.; Irannajad, M. Modification of natural zeolite for Cu removal from waste waters. Desalination Water Treat. 2016, 57, 27843–27850. [Google Scholar] [CrossRef]
- Akhtari, M.; Borazjani, H.; Arefkhani, M. Efficacy of lignocellulosics materials, zeolite and perlite for removal of cation and anions from sea and waste water. Wood Res. 2015, 60, 273–280. [Google Scholar]
- Khatmode, N.P.; Thakare, S.B. Removal of pH, TDS, TSS & color from textile effluent by using sawdust as adsorbent. Int. J. Sci. Basic Appl. Res. 2015, 24, 158–163. [Google Scholar]
- Rolence, C.; Machunda, R.; Njau, K.N. Water hardness removal by coconut shell activated carbon. Proc. Int. For. Environ. Symp. 2014, 25, 52. [Google Scholar] [CrossRef]
- Sepehr, M.N.; Zarrabi, M.; Kazemian, H.; Amrane, A.; Yaghmaian, K.; Ghaffari, H.R. Removal of hardness agents, calcium and magnesium, by natural and alkaline modified pumice stones in single and binary systems. Appl. Surf. Sci. 2013, 274, 295–305. [Google Scholar] [CrossRef]
- Payus, C.; Refdin, M.; Zahari, N.; Rimba, A.; Geetha, M.; Saroj, C.; Gasparatos, A.; Fukushi, K.; Oliver, P.A. Durian husk wastes as low-cost adsorbent for physical pollutants removal: Groundwater supply. Mater. Today Proc. 2021, 42, 80–87. [Google Scholar] [CrossRef]
- Liu, W.; Singh, R.P.; Jothivel, S.; Fu, D. Evaluation of groundwater hardness removal using activated clinoptilolite. Environ. Sci. Pollut. Res. 2020, 27, 17541–17549. [Google Scholar] [CrossRef]
- Mubarak, M.F.; Mohamed, A.M.G.; Keshawy, M.; Elmoghny, T.A.; Shehata, N. Adsorption of heavy metals and hardness ions from groundwater onto modified zeolite: Batch and column studies. Alex. Eng. J. 2022, 61, 4189–4207. [Google Scholar] [CrossRef]
- Kaewmee, P.; Hungwe, D.; Takahashi, F. Adsorptive reduction of water hardness by a highly porous and regenerative geopolymer fabricated from coal fly ash waste with low-temperature calcination. Environ. Sci. Pollut. Res. 2021, 28, 54594–54607. [Google Scholar] [CrossRef]
- Cai, P.; Zhao, J.; Zhang, X.; Zhang, T.; Yin, G.; Chen, S.; Dong, C.-L.; Huang, Y.-C.; Sun, Y.; Yang, D.; et al. Synergy between cobalt and nickel on NiCo2O4 nanosheets promotes peroxymonosulfate activation for efficient norfloxacin degradation. Appl. Catal. B Environ. 2022, 306, 121091. [Google Scholar] [CrossRef]
- Zhang, R.; Li, D.; Sun, J.; Cui, Y.; Sun, Y. In Situ synthesis of FeS/Carbon fibers for the effective removal of Cr (VI) in aqueous solution. Front. Environ. Sci. Eng. 2020, 14, 1–12. [Google Scholar] [CrossRef]
- Pourshadlou, S.; Mobasherpour, I.; Majidian, H.; Salahi, E.; Bidabadi, F.S.; Mei, C.-T.; Ebrahimi, M. Adsorption system for Mg2+ removal from aqueous solutions using bentonite/γ-alumina nanocomposite. J. Colloid Interface Sci. 2020, 568, 245–254. [Google Scholar] [CrossRef]
- Gabol, N.M.; Khalique, A.; Memon, M.A.; Qureshi, A. Adsorption studies on the removal of cod and tds by using natural resources. Int. Res. J. Mod. Eng. Technol. Sci. 2021, 3, 1176–1180. [Google Scholar]
- Zuo, Q.; Zhang, Y.; Zheng, H.; Zhang, P.; Yang, H.; Yu, J.; Tang, J.; Zheng, Y.; Mai, J. A facile method to modify activated carbon fibers for drinking water purification. Chem. Eng. J. 2019, 365, 175–182. [Google Scholar] [CrossRef]
- Kumari, U.; Behera, S.K.; Meikap, B. A novel acid modified alumina adsorbent with enhanced defluoridation property: Kinetics, isotherm study and applicability on industrial wastewater. J. Hazard. Mater. 2019, 365, 868–882. [Google Scholar] [CrossRef] [PubMed]
- Zereffa, E.A.; Bekalo, T.B. Clay Ceramic Filter for Water Treatment. Mater. Sci. Appl. Chem. 2017, 34, 69–74. [Google Scholar] [CrossRef]
- Chambers, P. Standard methods for the examination of water and wastewater. Sci. e-Resour. 2019, 21, 130–170. [Google Scholar]
- Omraei, M.; Najafpour, G.D. Removal of zinc from aqueous phase by charcoal ash. World Appl. Sci. J. 2011, 13, 331–340. [Google Scholar]
- Asl, S.H.; Ahmadi, M.; Ghiasvand, M.; Tardast, A.; Katal, R. Artificial neural network (ANN) approach for modeling of Cr (VI) adsorption from aqueous solution by zeolite prepared from raw fly ash (ZFA). J. Ind. Eng. Chem. 2013, 19, 1044–1055. [Google Scholar] [CrossRef]
- Tang, C.; Shu, Y.; Zhang, R.; Li, X.; Song, J.; Li, B.; Zhang, Y.; Ou, D. Comparison of the removal and adsorption mechanisms of cadmium and lead from aqueous solution by activated carbons prepared from Typha angustifolia and Salix matsudana. RSC Adv. 2017, 7, 16092–16103. [Google Scholar] [CrossRef]
- Gupta, S.S.; Bhattacharyya, K.G. Immobilization of Pb (II), Cd (II) and Ni (II) ions on kaolinite and montmorillonite surfaces from aqueous medium. J. Environ. Manag. 2008, 87, 46–58. [Google Scholar] [CrossRef]
- Katal, R.; Pahlavanzadeh, H. Zn (II) ion removal from aqueous solution by using a polyaniline composite. J. Vinyl Addit. Technol. 2011, 17, 138–145. [Google Scholar] [CrossRef]
- Bhattacharya, A.K.; Naiya, T.K.; Mandal, S.N.; Das, S.K. Adsorption, kinetics and equilibrium studies on removal of Cr (VI) from aqueous solutions using different low-cost adsorbents. Chem. Eng. J. 2008, 137, 529–541. [Google Scholar] [CrossRef]
- Horvath, G.; Kutics, K.; Suzuki, M. Adsorption Engineering; Kodansha: Tokyo, Japan, 1990; Volume 14. [Google Scholar]
- Bansal, R.C.; Goyal, M. Activated Carbon Adsorption; CRC Press: Boca Raton, FL, USA, 2005. [Google Scholar]


| Composition | Content (wt.%) | |
|---|---|---|
| Zeolite | SiO2 | 68.5% |
| Al2O3 | 11% | |
| Na2O | 3.8% | |
| K2O | 4.4% | |
| CaO | 0.6% | |
| Fe2O3 | 0.2% | |
| Loss on ignition (L.O.I) | 11.5% | |
| Activated alumina | Al2O3 | 6% |
| L.O.I | 6% | |
| Na2O | 0.35% | |
| Fe2O3 | 0.02% | |
| SiO2 | 0.02% |
| Parameters | Unit | Values | |
|---|---|---|---|
| Drinking water | Total hardness | (mg/L CaCO3) | 520 |
| TDS | (mg/L) | 627 | |
| EC | (µS/cm) | 1248 | |
| Calcium | (mg/L) | 166.73 | |
| Magnesium | (mg/L) | 25.27 | |
| pH | - | 7.72 | |
| Groundwater | Total hardness | (mg/L CaCO3) | 1148 |
| TDS | (mg/L) | 1330 | |
| EC | (µS/cm) | 2361 | |
| Calcium | (mg/L) | 218.03 | |
| Magnesium | (mg/L) | 146.77 | |
| pH | - | 7.82 |
| Parameter | Natural Zeolite | Activated Carbon | Activated Alumina |
|---|---|---|---|
| Specific pore volume (cm3/g) | 0.098 | 0.128 | 0.48 |
| Average pore diameter (nm) | 11.7 | 2 | 5.3 |
| Specific surface area (m2/g) | 19.87 | 897.5 | 327.02 |
| Adsorbents | Langmuir | Freundlich | Temkin | ||||||
|---|---|---|---|---|---|---|---|---|---|
| R2 | qmax (mg.g−1) | c | R2 | n | KF (mg.g−1) | R2 | B | KT | |
| Zeolite clinoptilolite | 0.9925 | 7.485 | 0.088 | 0.9887 | 4.521 | 1.733 | 0.9073 | 1.844 | 0.596 |
| Activated alumina | 0.9599 | 1.285 | 0.112 | 0.5681 | 1.253 | 0.048 | 0.849 | 0.728 | 0.057 |
| Activated carbon | 0.8688 | 0.901 | 0.227 | 0.8558 | 3.599 | 0.225 | 0.9014 | 0.237 | 0.437 |
| Adsorbents | Pseudo-First Order | Pseudo-Second Order | Morris–Weber | ||||||
|---|---|---|---|---|---|---|---|---|---|
| R2 | qe (mg.g−1) | K1 (h−1) | R2 | qe (mg.g−1) | K2 (g mg−1. h−1) | R2 | C (mg.g−1) | kid (mg.g−1. h−0.5) | |
| Zeolite clinoptilolite | 0.9787 | 1.136 | 1.782 | 0.9978 | 3.868 | 4.951 | 0.9577 | 2.79 | 0.8833 |
| Activated alumina | 0.9776 | 0.531 | 2.422 | 0.9992 | 1.385 | 8.712 | 0.9138 | 0.7581 | 0.4772 |
| Activated carbon | 0.9938 | 0.51 | 3.652 | 0.9996 | 1.077 | 10.263 | 0.8654 | 0.6323 | 0.3264 |
Publisher’s Note: MDPI stays neutral with regard to jurisdictional claims in published maps and institutional affiliations. |
© 2022 by the authors. Licensee MDPI, Basel, Switzerland. This article is an open access article distributed under the terms and conditions of the Creative Commons Attribution (CC BY) license (https://creativecommons.org/licenses/by/4.0/).
Share and Cite
Ghanbarizadeh, P.; Parivazh, M.M.; Abbasi, M.; Osfouri, S.; Dianat, M.J.; Rostami, A.; Dibaj, M.; Akrami, M. Performance Enhancement of Specific Adsorbents for Hardness Reduction of Drinking Water and Groundwater. Water 2022, 14, 2749. https://doi.org/10.3390/w14172749
Ghanbarizadeh P, Parivazh MM, Abbasi M, Osfouri S, Dianat MJ, Rostami A, Dibaj M, Akrami M. Performance Enhancement of Specific Adsorbents for Hardness Reduction of Drinking Water and Groundwater. Water. 2022; 14(17):2749. https://doi.org/10.3390/w14172749
Chicago/Turabian StyleGhanbarizadeh, Parnian, Mohammad Mehdi Parivazh, Mohsen Abbasi, Shahriar Osfouri, Mohammad Javad Dianat, Amir Rostami, Mahdieh Dibaj, and Mohammad Akrami. 2022. "Performance Enhancement of Specific Adsorbents for Hardness Reduction of Drinking Water and Groundwater" Water 14, no. 17: 2749. https://doi.org/10.3390/w14172749