
Abundance and Diversity of Nitrifying Microorganisms in Marine Recirculating Aquaculture Systems
by
 , and
, and
Qintong Li
1,*, 
Ryo Hasezawa
1,
Riho Saito
1,
Kunihiro Okano
2,
Kazuya Shimizu
1 and
Motoo Utsumi
3,4 1
Department of Applied Biosciences, Faculty of Life Sciences, Toyo University, 1-1-1 Izumino, Itakura, Ora, Tokyo 374-0193, Japan
2
Department of Biological Environment, Akita Prefectural University, Shimo-Shinjo Nakano, Akita 010-0195, Japan
3
Faculty of Life and Environmental Sciences, University of Tsukuba, 1-1-1 Tennodai, Tsukuba 305-8572, Ibaraki, Japan
4
Microbiology Research Center for Sustainability, University of Tsukuba, 1-1-1 Tennodai, Tsukuba 305-8572, Ibaraki, Japan
*
Author to whom correspondence should be addressed.
Water 2022, 14(17), 2744; https://doi.org/10.3390/w14172744
Submission received: 1 August 2022
/
Revised: 27 August 2022
/
Accepted: 29 August 2022
/
Published: 2 September 2022
(This article belongs to the Topic Microorganisms in Aquatic Environments)
Abstract
:Recirculating aquaculture systems (RAS) are important for water quality management in aquaculture facilities, and can help resume water consumption. However, information about the community structure of the micro-ecosystem existing in biofilters, especially the participation of the known nitrifying groups (i.e., AOA, AOB, NOB, and comammox Nitrospira), remains to be fully clarified. In this research, we compared the community structures in three RAS systems operated at different temperatures in a marine aquarium, through both amoA-targeted qPCR assay and 16S rRNA-targeted next-generation sequencing. As result, AOA was the primary nitrifier in the biofilters and was typically abundant and diverse in high-temperature samples (ca. 25 °C). NOB’s relative abundance patterns were numerically similar to that of AOA, suggesting a cooperation relationship between AOA and NOB in the marine RAS system. AOB was at a comparable level with AOA in medium-temperature samples (ca. 19 °C), while their abundance sharply decreased in high-temperature samples. The number of observed OTUs of AOA in high-temperature samples was 1.9 and 1.5 times as much as that detected in low (ca. 10 °C) and medium temperature samples respectively, suggesting a much more diverse and predominant occurrence of AOA at high temperatures. Comammox Nitrospira was only detected at a low level in the biofilter samples, suggesting a negligible contribution to the nitrification process in such ammonia-limited, saline biofilms. Although comammox Nitrospira cannot be detected by 16S rRNA-based analysis, the high diversity and abundance of NOB that were detected in high-temperature samples indicated the prospective possibility of the occurrence of complete ammonia oxidation at high temperatures.
1. Introduction
Recirculating aquaculture systems (RAS) have been widely applied in aquariums and fish farming global wide [1,2,3]. In RAS, water is recirculated through biofilters to remove solid waste and also purify water quality; purified water is then sent back to aquaculture tanks to reduce water consumption. Compared to conventional flow-through aquaculture systems, RAS remarkably reduce 90–99% water consumption [4,5], lower fish disease risk, and contribute to effective management [6]. On the filter surface of the RAS system, microorganisms functioning in water purification aggregate and form a biofilm with high diversity [7,8]. Among these, nitrifying microorganisms existing in the biofilm are critical to the removal of nitrogenous compounds generated from fish metabolites and feed waste. The key process is nitrification, which converts ammonium into nitrate through nitrite to reduce toxic chemical risks for aquarium organisms. Conventional nitrification had been considered as a two-step reaction performed separately by two groups of microorganisms: ammonia oxidizers including ammonia-oxidizing archaea (AOA) and ammonia-oxidizing bacteria (AOB) conduct the first oxidation from ammonia to nitrite [9,10], while nitrite-oxidizing bacteria (NOB) conduct the next oxidation to nitrate [11]. In addition to that, recent studies found that some Nitrospira (comammox Nitrospira) were able to independently catalyze the complete ammonia oxidation to nitrate, which largely changed the conventional understanding of nitrification [12,13]. Later, the occurrence of comammox Nitrospira has been reported in some municipal and natural systems, though their participation in different environments remains to be fully understood, and the key factors that drive the composition of comammox Nitrospira and canonical ammonia oxidizers stay unknown.
Although general microbial communities and abundances of the nitrifiers (especially AOA and AOB) have been analyzed in some RAS [14,15,16,17], we still lack information on 1. general community structure difference under different operation temperatures; 2. relative compositions and diversities of nitrifying microorganisms including the perspective of commamox Nitrospira; 3. the niche difference of nitrifying microorganisms and the possible factors that drive the difference. To solve the above questions, we present a comparative study of microbial communities in three RAS systems operated under different temperatures in a marine aquarium, mainly focusing on the distribution and diversity of nitrifying microorganisms (AOA, AOB, and comammox Nitrospira).
2. Materials and Methods
2.1. Sampling
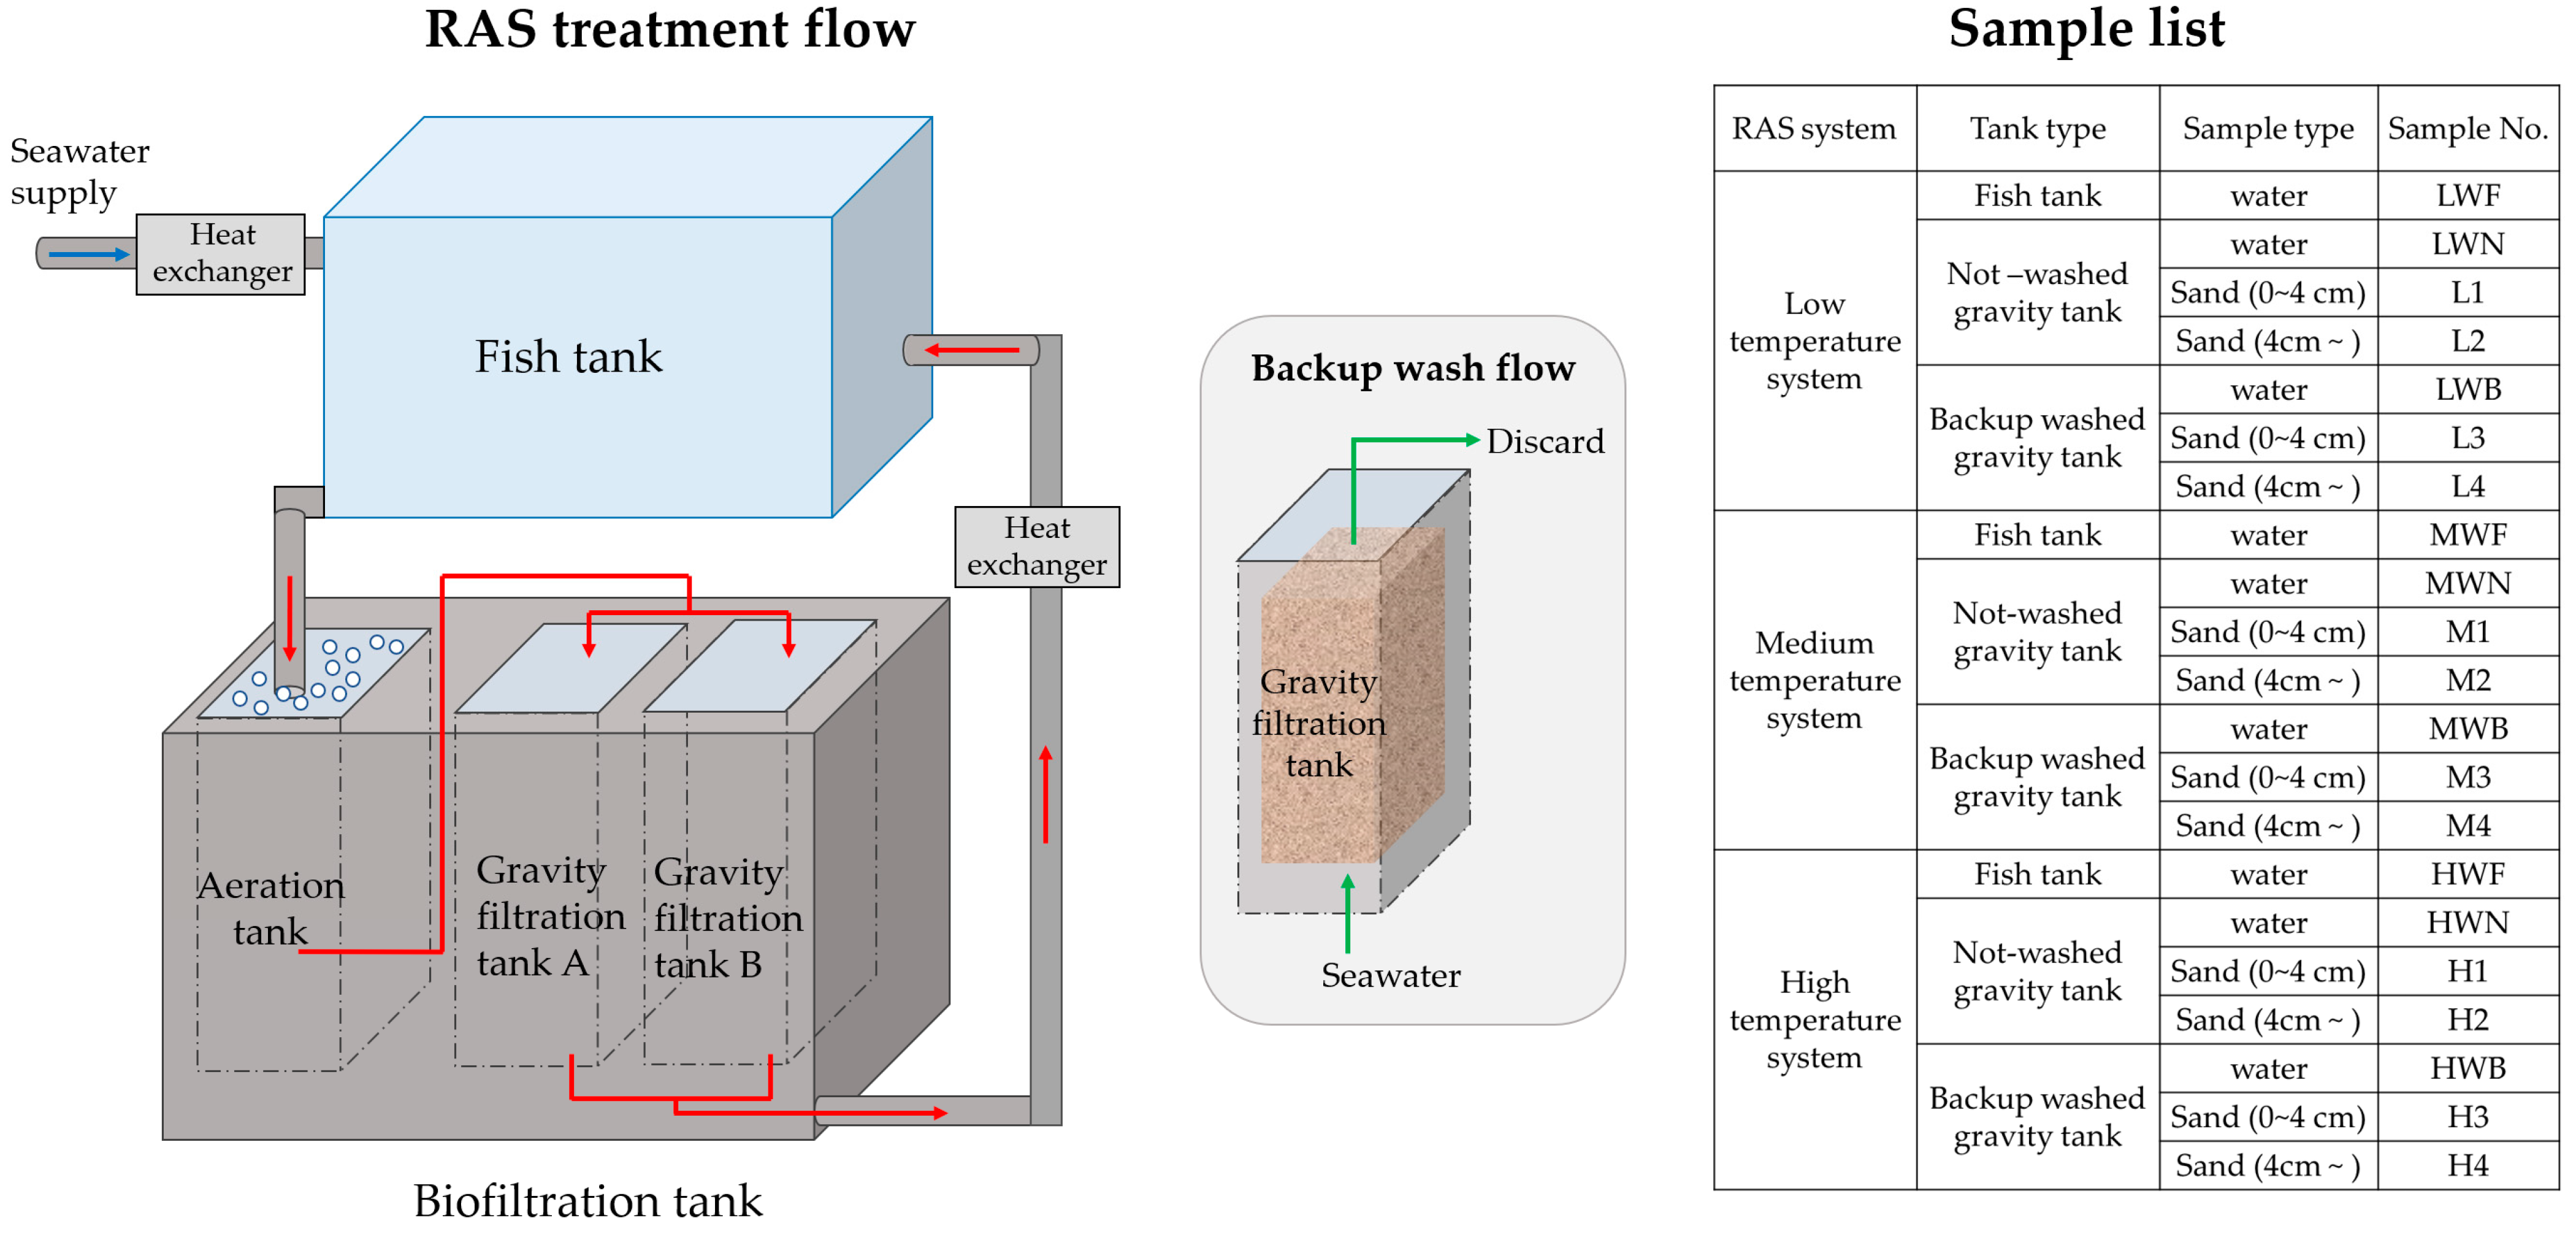
Water samples and biofiltration sand samples were collected from a public aquarium (Aqua World Ibaraki Prefectural Oarai Aquarium, Ibaraki, Japan) on March 1st, 2021. Three RAS systems that operate under continuous thermal control at different temperatures were chosen as the research targets (water temperatures: ca. 10 °C, 19 °C, and 25 °C, respectively). According to the water temperatures, the three RAS systems were named “Low-temperature system” (ca. 10 °C), “Medium temperature system” (ca. 19 °C), and “High-temperature system” (ca. 25 °C). Each RAS system shares identical construction and flow strategy shown in Figure 1. In each RAS system, about 5 to 10% of fresh seawater is supplied to the fish tank after temperature adjustment. Used water from the fish tank is then flowed through an aeration tank and filtered through a gravity filtration tank (each filled with 1 m-depth grain of sand as filtration materials). Filtered water is sent back to the fish tank after temperature adjustment. To remove the organic suspension in the surficial sands in gravity filtration tanks, a backup wash is carried out routinely every 1 or 2 months (depending on the situation). When either one of the two gravity filtration tanks is under backup-wash treatment, the other gravity filtration tank is kept used for water filtration. For water samples, ca. 2 L of water was collected from each fish tank and gravity filtration tank in the three RAS systems, stored in 2 L PE bottles at 4 °C during transportation. Then, ca. 1 L of water samples were filtered through 0.2 μm pore-size polycarbonate filters, and the filters were saved at −30 °C for the use of DNA extraction. For the use of inorganic nutrient measurements, ca. 500 mL of water samples were filtered through GF/C glass fiber filters, and the filtrate was saved at 4 °C. For Biofilm samples, 6–10 cm from the surface to the depth of the sand sample were collected by a probe-type sediment sampler (AMP401, ISIS, Osaka, Japan) from one newly backup-washed gravity filtration tank, and one not-washed gravity filtration tank in each RAS system. The sand samples were kept at 4 °C during transportation, and then divided into two parts: the upper 4 cm depth layer (0 to 4 cm depth), and the lower layer (4 cm and deeper) and stored at −30 °C for further use. The abbreviation names of water samples and biofilm samples were listed in Figure 1.
2.2. Water Chemistry Analysis
Physiochemical data (pH, DO, and water temperature) in each tank of the three RAS systems were measured in situ using a waterproof portable multi-water quality logger (AS810, AS ONE Corporation) during sampling. NH4+-N were determined by the indophenol-blue method (JIS K 0102 42.2). NO2−-N were determined by the diazotization method (JIS K 0102 43.1.1). NO3−-N were determined by the brucine method (JIS K 0102 43.2.4). PO43−-P were determined by the molybdenum blue method (JIS K 0102 46.1.1). The measurements of inorganic nutrients were carried out within 36 h after sampling.
2.3. DNA Extraction and Quantitative PCR Assays
DNA was extracted from ca. 0.5 g of wet sand or ca. 1 L of seawater (filtered through 0.2μm pore-size polycarbonate filters), using DNeasy PowerBiofilm Kit (Qiagen, Hilden, Germany) according to the manufacturer’s protocol. The quantitative PCR (qPCR) assays were performed on StepOnePlusTM Real-time PCR System (Applied Biosystems, Foster City, CA, USA) equipped with StepOneTM Plus v2.3 software. The copy numbers of archaeal amoA, bacterial amoA, and comammox amoA in all samples were determined in triplicate on non-diluted samples using the SYBR green method, and the copy number of bacterial and archaeal 16S rRNA genes were determined by TaqMan probe method. For real-time PCR analysis, either THUNDERBIRD® SYBR® qPCR Mix or THUNDERBIRD® Probe qPCR Mix (TOYOBO corp., Osaka, Japan) was used. Primers used in this research are shown in Table 1. Thermal conditions and primer concentrations were optimized for the specificity and efficiency of the amplifications of each target gene. Efficiencies of all real-time PCR assays ranged from 90.3% to 99.8%, with R2 values > 0.99 for standard curves. Standards for qPCR were prepared from environmental clones as described previously [18].
2.4. 16 S rRNA Amplicon Sequencing
DNA collected from each sample was amplified using the 515f and 806r primer set [23] for prokaryotes’ 16S rRNA V4 region. Two 20 μL independent PCR reactions were performed using TaKaRa Ex Taq® Hot Start Version (TaKaRa Bio Inc., Shiga, Japan) at 94 °C for 2 min followed by 20 cycles of 94 °C (30 s), 50 °C (30 s), and 72 °C (30 s), and a final extension step at 72 °C for 5 min (1st PCR); 94 °C for 2 min followed by 8 cycles of 94 °C (30 s), 60 °C (30 s) and 72 °C (30 s), and a final extension step at 72 °C for 5 min (2nd PCR). All amplicons were sequenced using a Miseq system (Illumina, San Diego, CA, USA) by Fasmac (Genetic Analysis Division, Fasmac, Kanagawa, Japan). Raw reads were checked by USEARCH (ver. 8.0.1623_i186linux64) to examine the quality and remove chimera. The microbial composition was determined by Qiime (ver. 1.9.0), and sequences were clustered into operational taxonomic units (OTUs) defined by 97% similarity. The representative OTU sequences were determined by BLAST+ (ver. 2.2.29).
2.5. Nucleotide Sequence Accession Numbers
The raw reads of the 16S rRNA V4 region of all 12 samples in this research were deposited in the DDBJ Sequence Read Archive (DRA) under accession number DRA013133 (DRX320677-DRX320688, DRR331680-DRR331691).
2.6. Statistical Analysis
The student’s t-test was performed using SPSS software ver. 26.0 (IBM corp., New York, NY, USA). Differences were considered significant at p-values ≤ 0.05. Bioinformatic analysis was performed using R statistical language ver. 4.1.3 (https://www.r-project.org/) (accessed on 1 March 2022) and the OmicStudio tools (https://www.omicstudio.cn/tool) (accessed on 1 June 2022).
3. Results
3.1. Water Quality in Each Tank
The results of water quality in each tank are shown in Table 2. The pH in all tanks was in the range of 7.4 to 7.7. The average dissolved oxygen (DO) in mg/L in each system was 8.93 in the low-temperature system, 7.88 in the medium-temperature system, and 6.00 in the high-temperature system. In all tanks, ammonium was detected at low levels (<10 μg/L), and nitrite was not detectable. For nitrate concentration, the highest nitrate concentration was detected in the medium-temperature system (125.88 μg/L on average), and the lowest nitrate concentration was detected in the low-temperature system (34.81 μg/L on average). In all three systems, the nitrate concentrations in fish tanks were slightly higher than in gravity filtration tanks. Low concentrations of the three forms of nitrogen compounds indicated that the biofiltration systems were operating efficiently. In all three systems, the average phosphate concentrations were 1.19 μg/L in the low-temperature system, 3.72 μg/L in the medium-temperature system, and 1.26 μg/L in the high-temperature system.
3.2. Quantification Results of Archaeal, Beta-Proteobacterial, and Comammox Nitrospira Amoa Genes
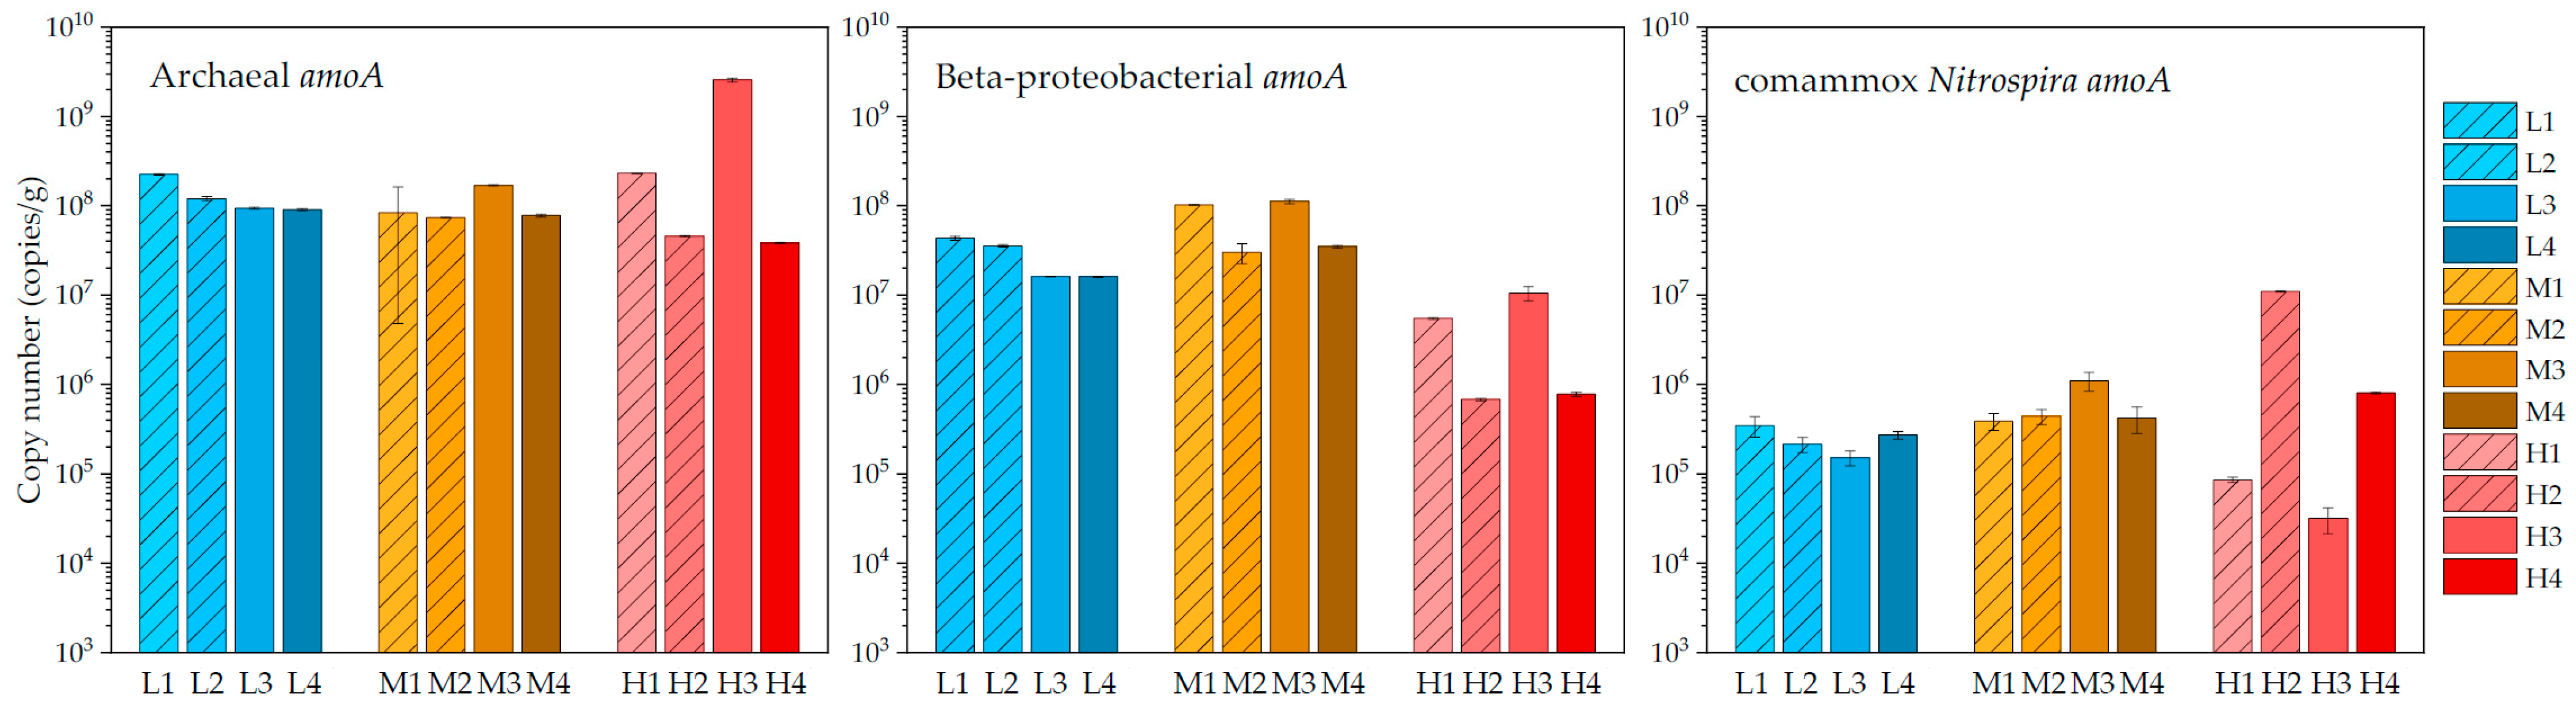
The populations of three types of nitrifiers were determined by quantification of amoA genes of thaumarchaeota, beta-proteobacteria, and comammox Nitrospira using qPCR. As the result (Figure 2), AOA was dominant to AOB and comammox Nitrospira in most samples with one exception in medium temperature system (i.e., M4). The abundance of AOA slightly fluctuated from 3.8 × 10⁷ to 2.3 × 10⁸ copies/g sand, except for one sample in the high-temperature system (i.e., 2.6 × 10⁹ copies/g sand in H3). AOA was 5.0-fold higher than AOB in the low-temperature system, 1.8-fold higher in the medium-temperature system, and 101.0-fold higher in the high-temperature system. While the average ratio of AOA to comammox Nitrospira in the three systems was 543.5, 180.8, and 20,976.0 respectively. This indicated that the predominance of AOA over the other two nitrifier counterparts was greater in the high-temperature system than in the low or medium temperatures. In contrast to the preference for the high temperature of AOA, the abundance of AOB sharply decreased by one magnitude in the high-temperature system. Among the three systems, AOB was most numerically abundant in medium temperature samples (7.0 × 10⁷ copies/g sand on average, maximum of 1.1 × 10⁸ copies/g sand (M3)). For the comammox Nitrospira, its amoA gene was detected in all samples but with relatively low values (3.1 × 10⁴ to 8.0 × 10⁵ copies/g sand). Based on quantitative data by qPCR, comammox Nitrospira only comprised less than 0.5% of all nitrifiers in most samples except for two samples in the lower layer in the high-temperature system (i.e., H2 and H4). The numerical inferiority of comammox Nitrospira indicated that complete nitrification may not be a primary strategy for biofilm microorganisms in our samples.
To test the significance of the difference in microbial abundances between backup-washed samples and not-washed samples (and between upper-layer samples and lower-layer samples), Student’s t-tests were conducted for these two pairs of samples. As result, although there were numerical differences between backup-washed samples and not-washed samples (and between upper-layer samples and lower-layer samples), the differences were not statistically significant in these two pairs of samples (p > 0.05).
In addition to microorganisms in the biofilm of bio-filtration systems, planktonic nitrifiers present in water may also contribute to the removal of ammonia. As result (Table 3), the average abundances of AOA, AOB, and comammox Nitrospira were 2.6 × 10⁴ copies/mL water, 2.9 × 10² copies/mL water, and 1.3 × 101 copies/mL water, respectively. In accordance with the results of biofilm, AOA was also the dominant nitrifying microorganism in the planktonic phase.
3.3. Microbial Communities Based on 16S rRNA V4 Region Amplicon Sequencing
A total of 991,060 reads were retrieved from 12 biofilm samples, forming 20,662 unique OTUs at 97% identity. An average of 70,978 clean reads were retrieved, and an average of 4011 OTUs were identified per sample (Table 4).
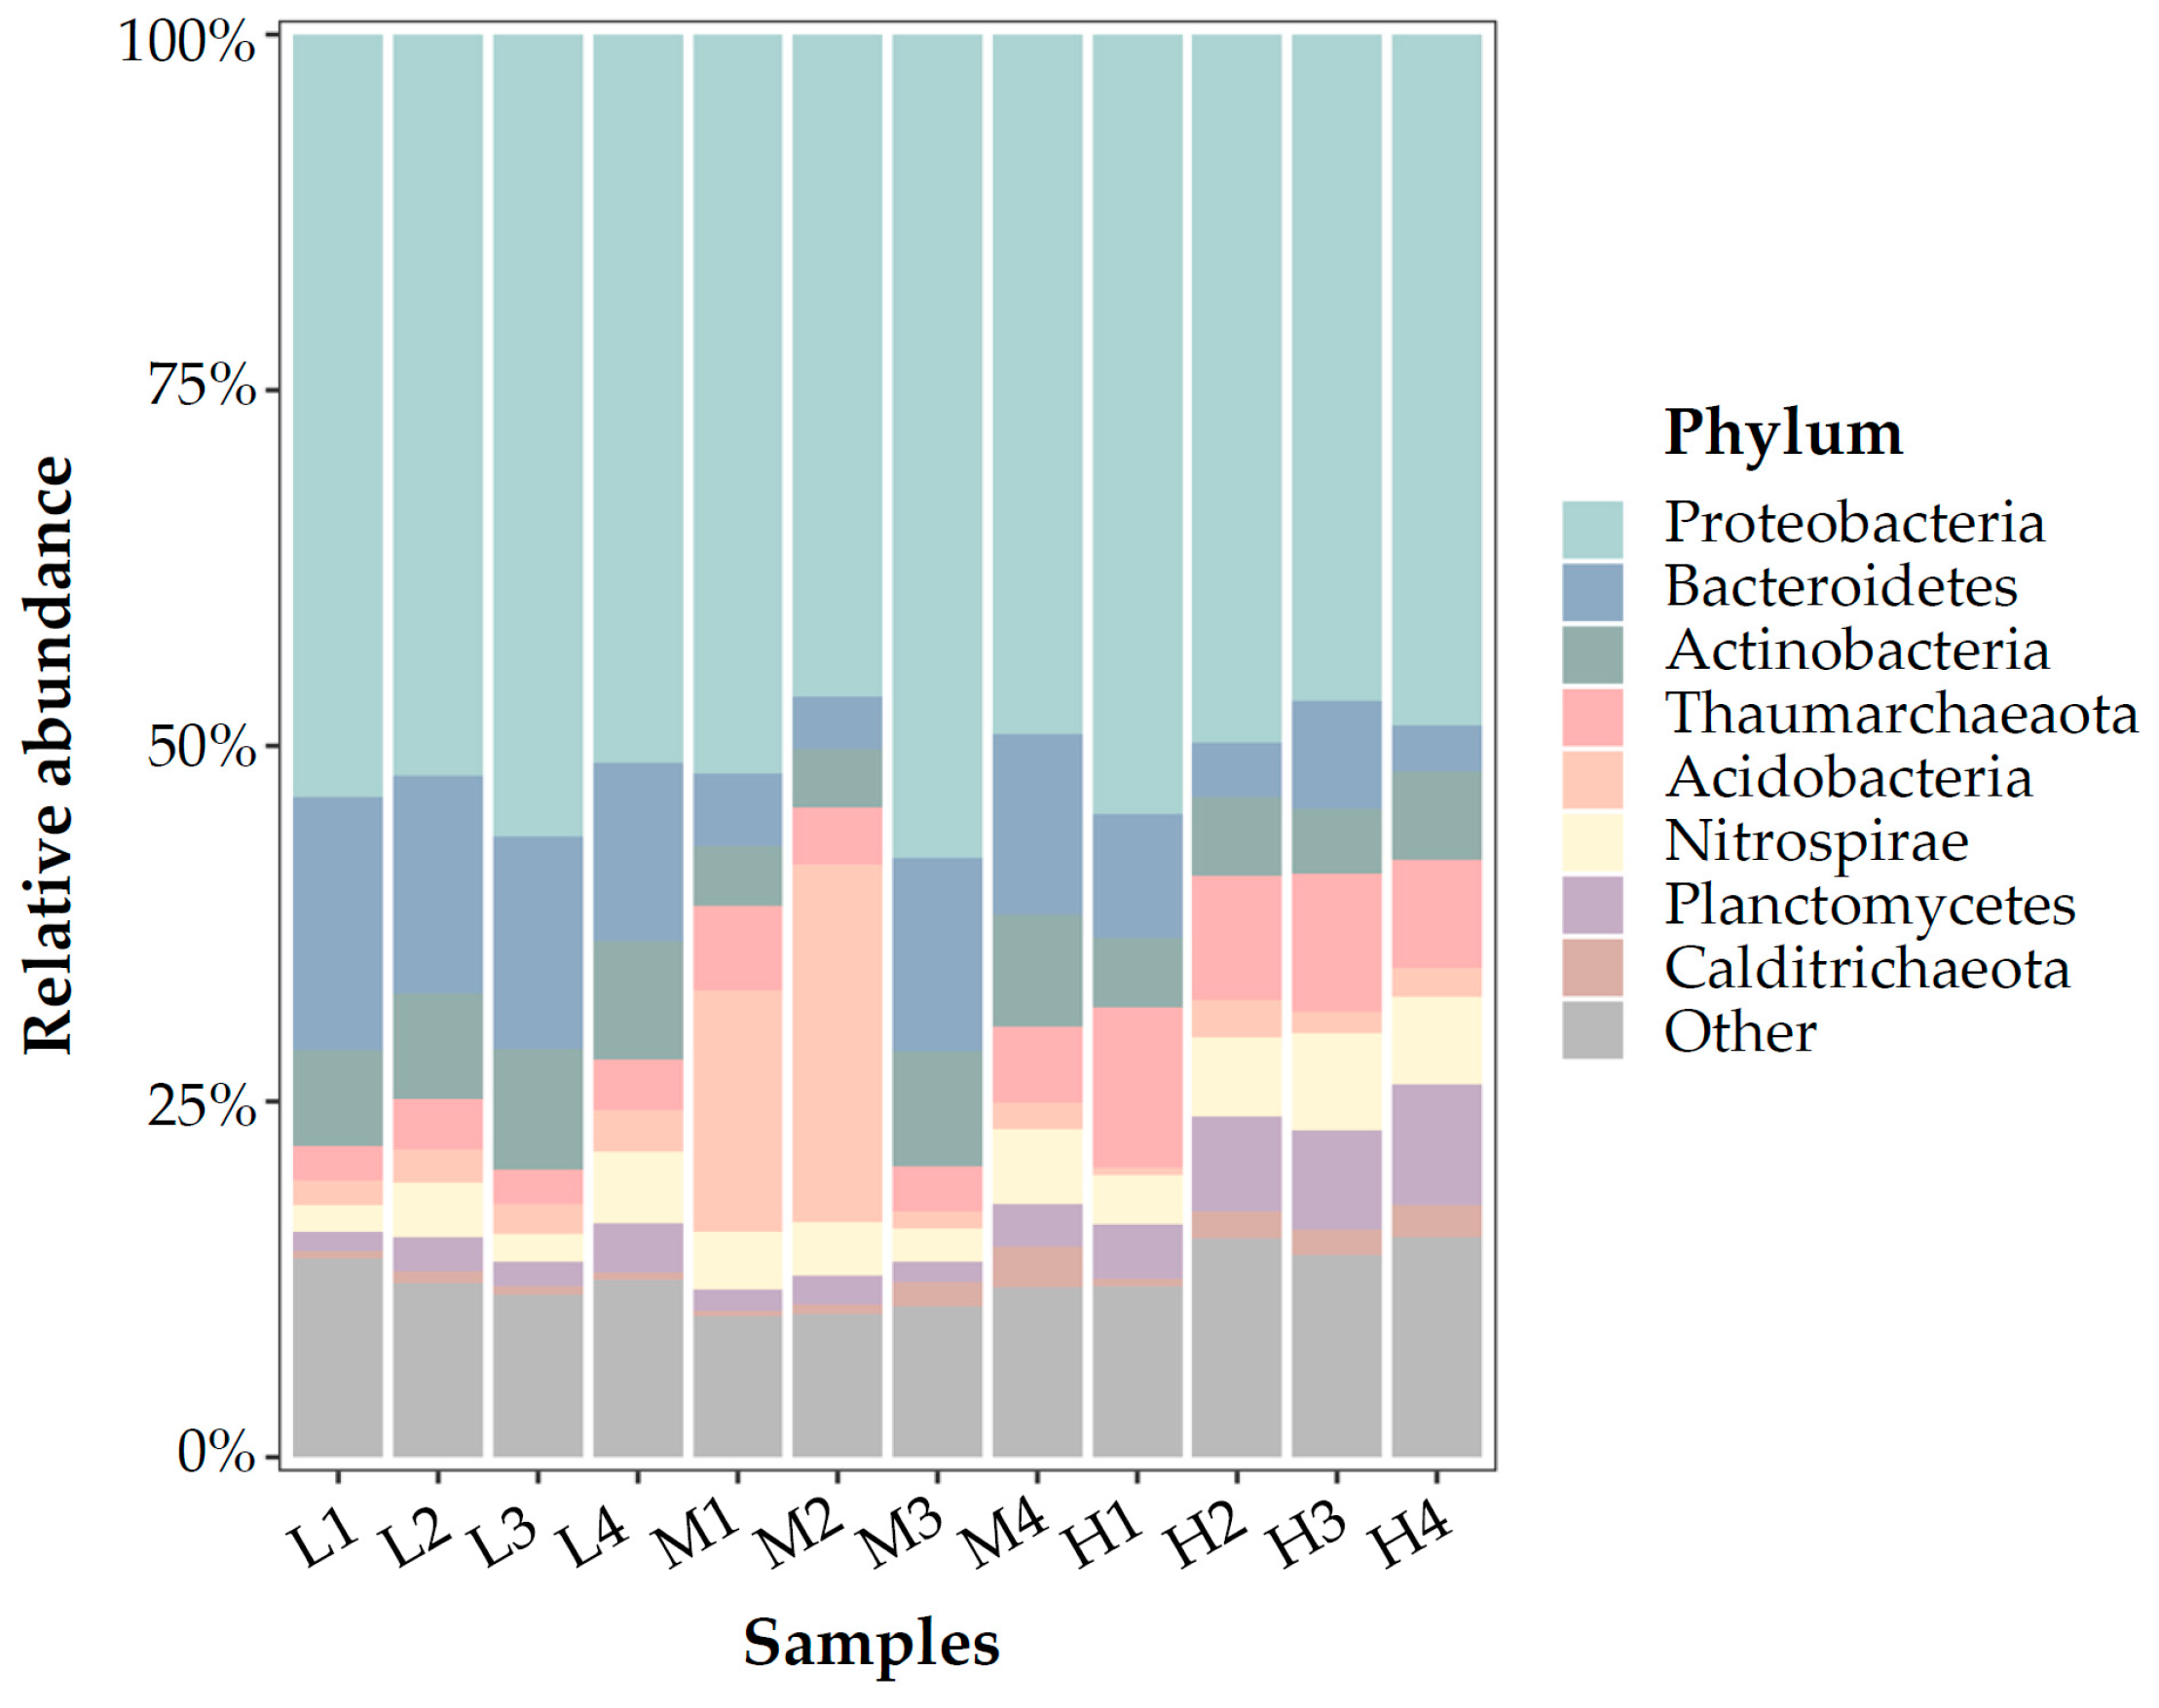
At the phylum level (Figure 3), Proteobacteria dominated in all 12 biofilm samples, accounting for approximately 50% of all reads. Following Proteobacteria, Actinobacteria and Bacteroidetes also shared considerable proportions and predominated especially in medium-temperature samples and low-temperature samples. While in the high-temperature samples, Thaumarchaeota was the second predominant phylum (avg. 9.3%), followed by Actinobacteria, Planctomycetes, Bacteroidetes, and Nitrospira, with almost even ratios (avg. for those communities were between 5.5 to 6.9%). At the phylum level, although the difference between backup washed and not-washed samples can be observed in some samples (ie. the relative abundances of Acidobacteria and Bacteroidetes in medium-temperature samples), the difference in phylum communities between washed and not washed samples was not statistically significant (student’s t-test, p > 0.05). The difference in phylum communities between the upper layer and lower layer samples was not statistically significant either (student’s t-test, p > 0.05).
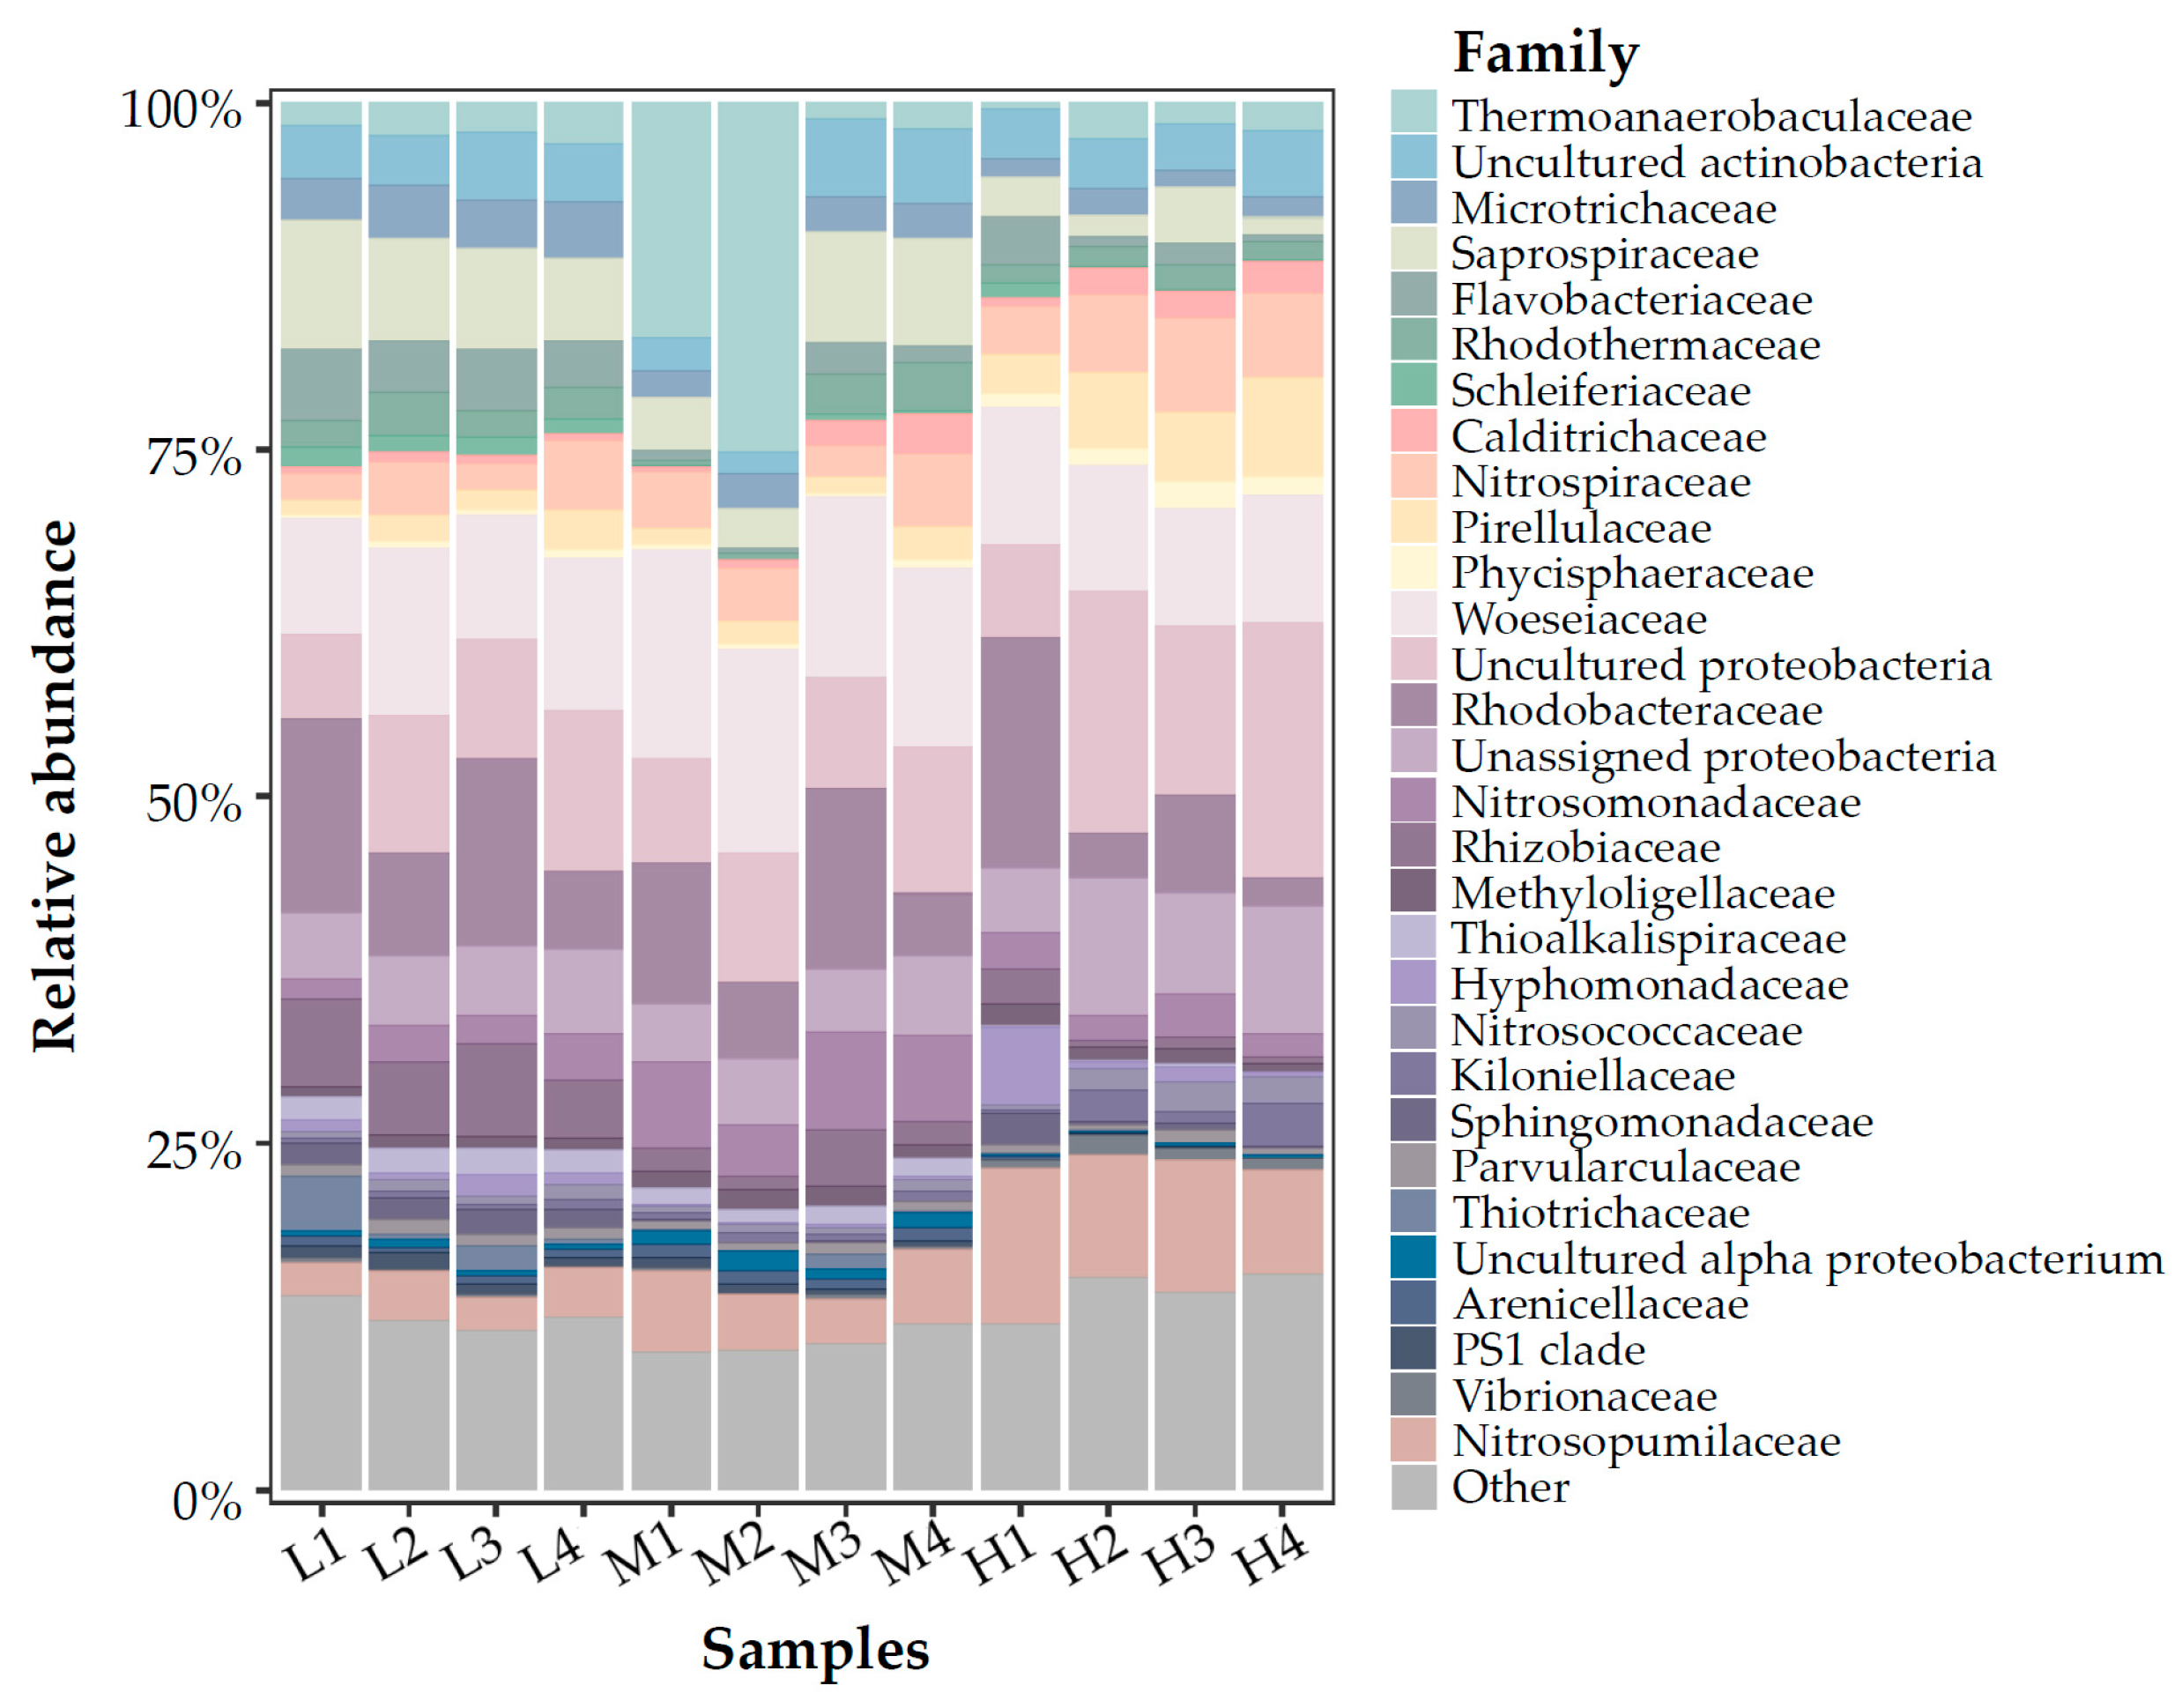
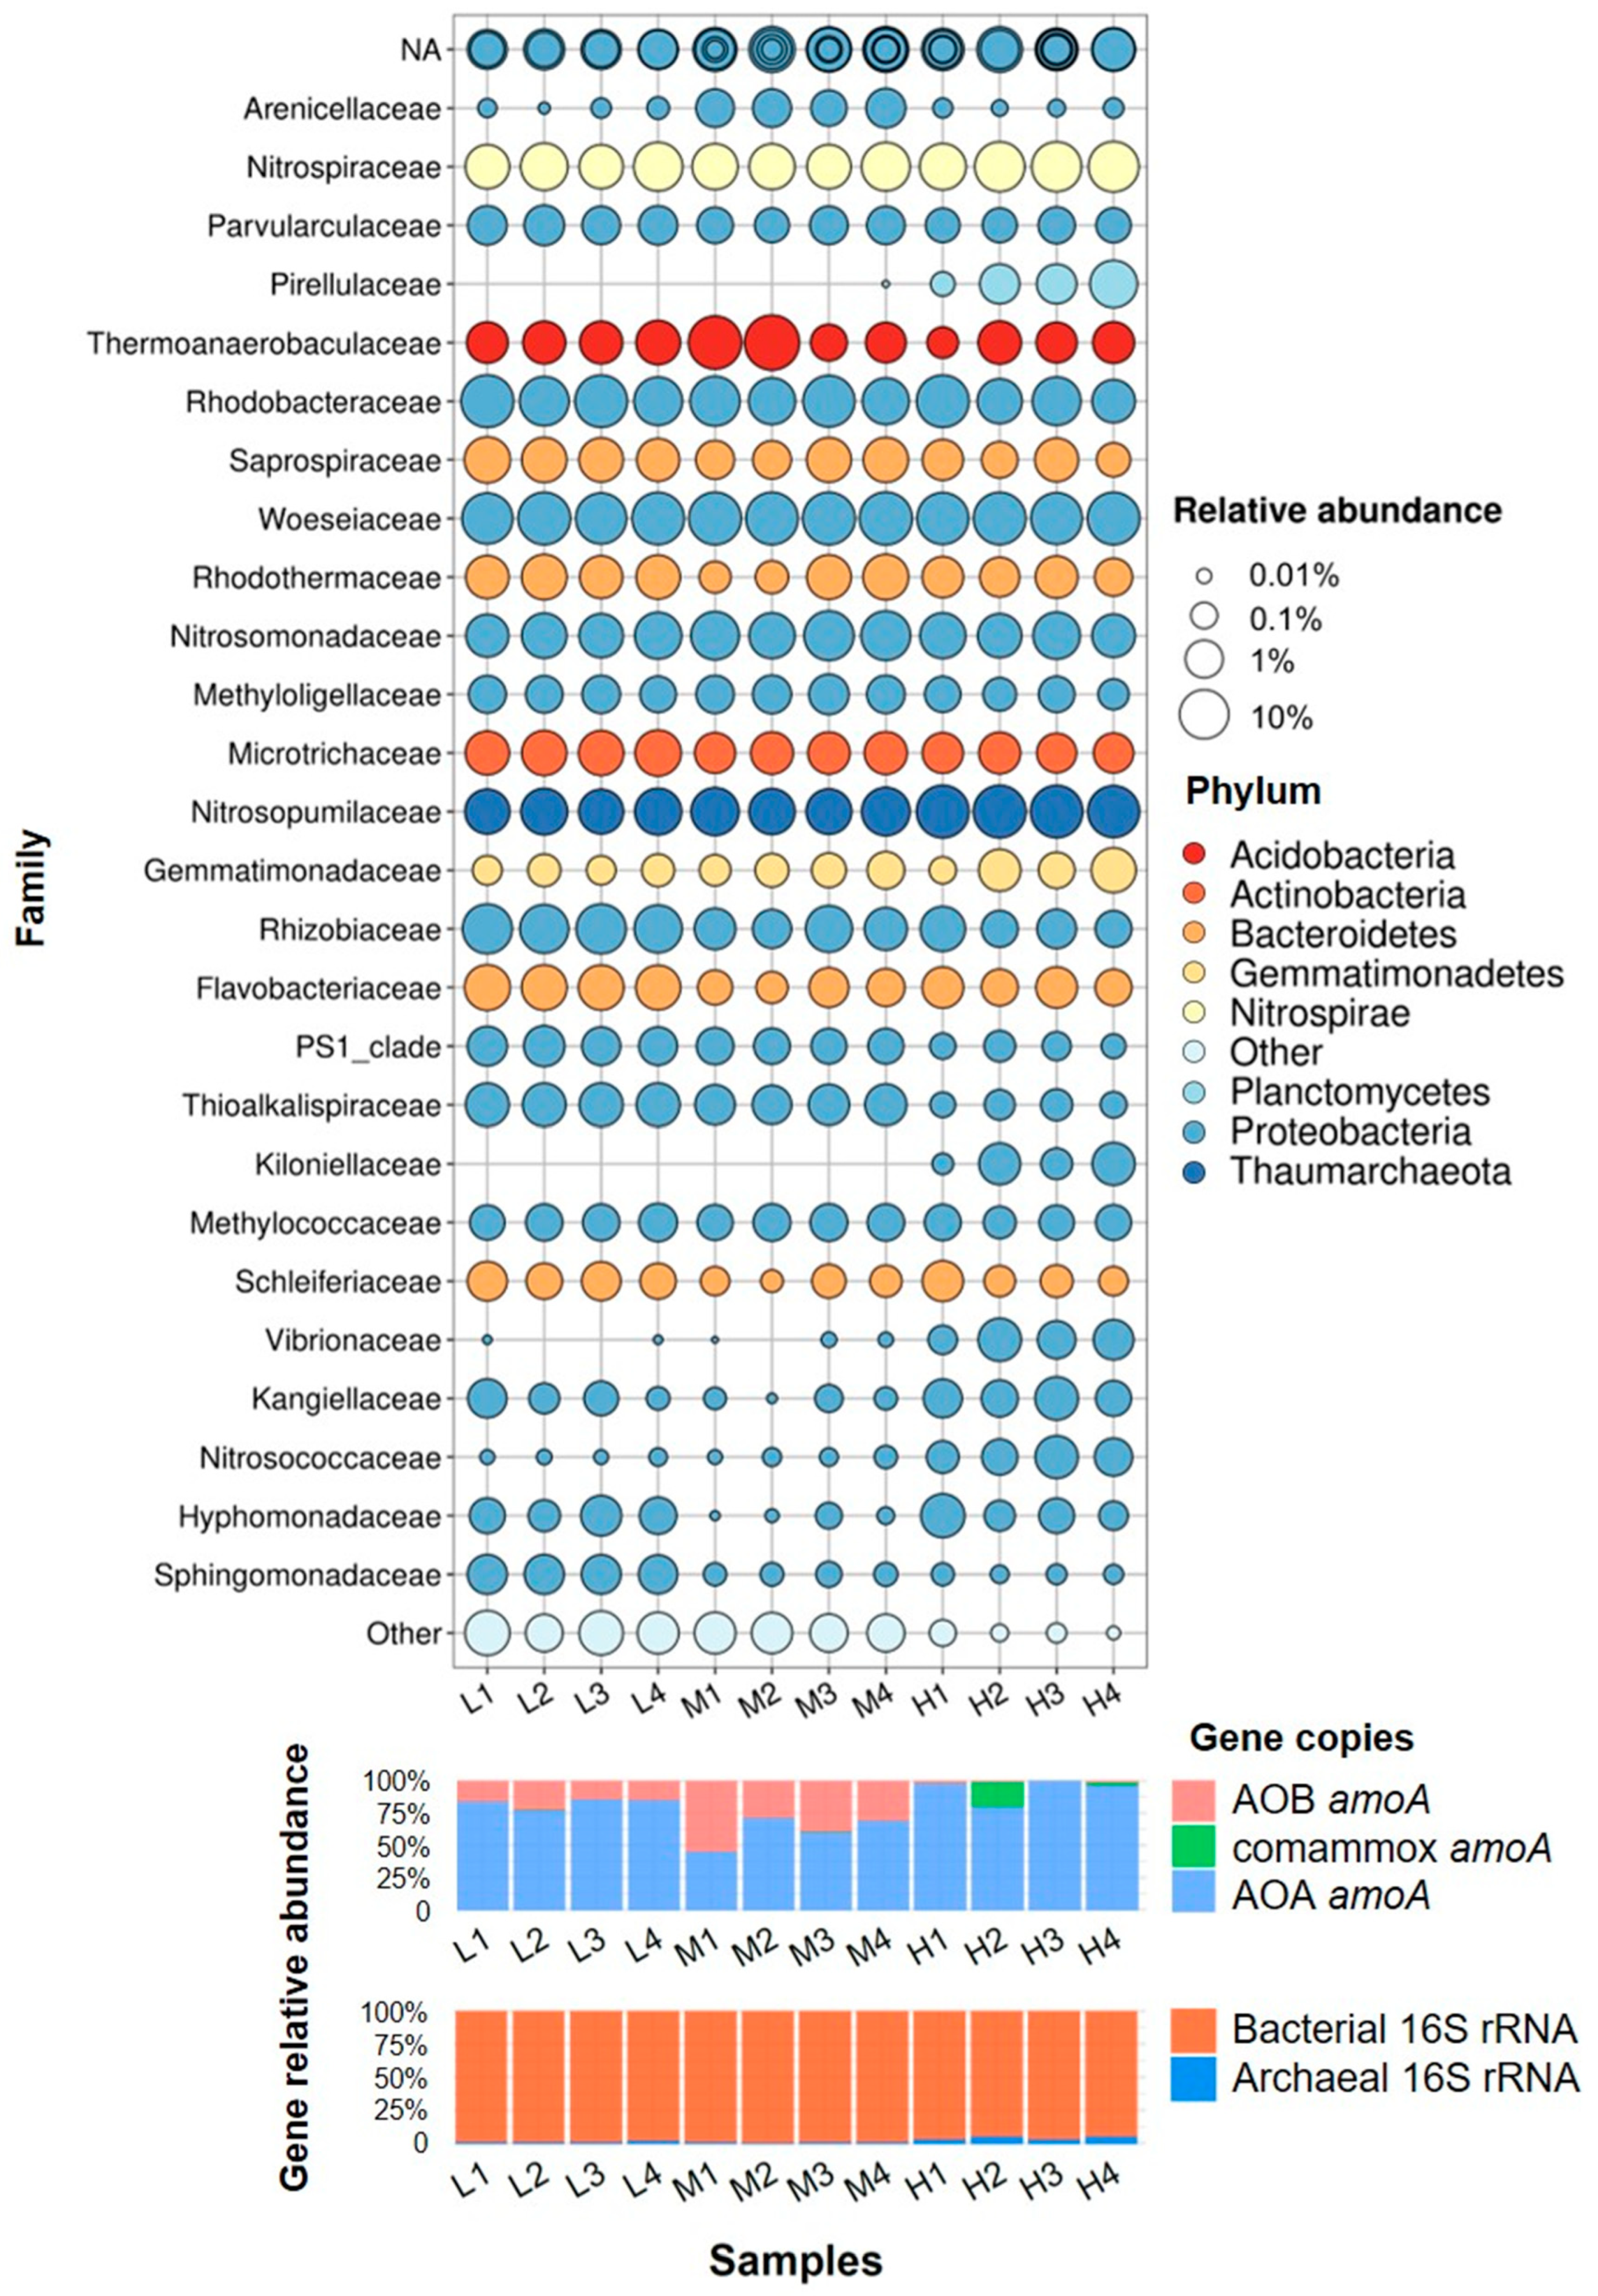
At the family level (Figure 4 and Figure 5), Woeseiaceae (proteobacteria) were the most abundant phylum, accounting for 9.9% to 15.5% of all reads. Besides that, Rhodobacteraceae, Nitrosopumilaceae, Saprospiraceae, and Thermoanaerobaculaceae also shared considerable proportions. The relative abundance of Nitrosopumilaceae was much higher in high-temperature samples than in other samples. Similarly, we can find some other phyla which were particularly abundant in the high-temperature samples while absent or negligible in other temperatures (ie. Pirellulaceae, Kiloniellaceae, Vibrionaceae, Nitrosococcaceae). In contrast to that, some phyla occupied higher percentages in low or medium-temperature samples than in the high-temperature samples (i.e., PS1_clade, Thioalkalispiraceae). When comparing backup washed with not washed samples (or compared upper layer with lower layer), some notable differences in community structure at the family level could be found in the relative abundances of some phyla, especially in medium temperature samples. However, the student’s t-test used for two pairs of samples showed no significant difference between washed and not-washed samples (nor between upper and lower layer samples).
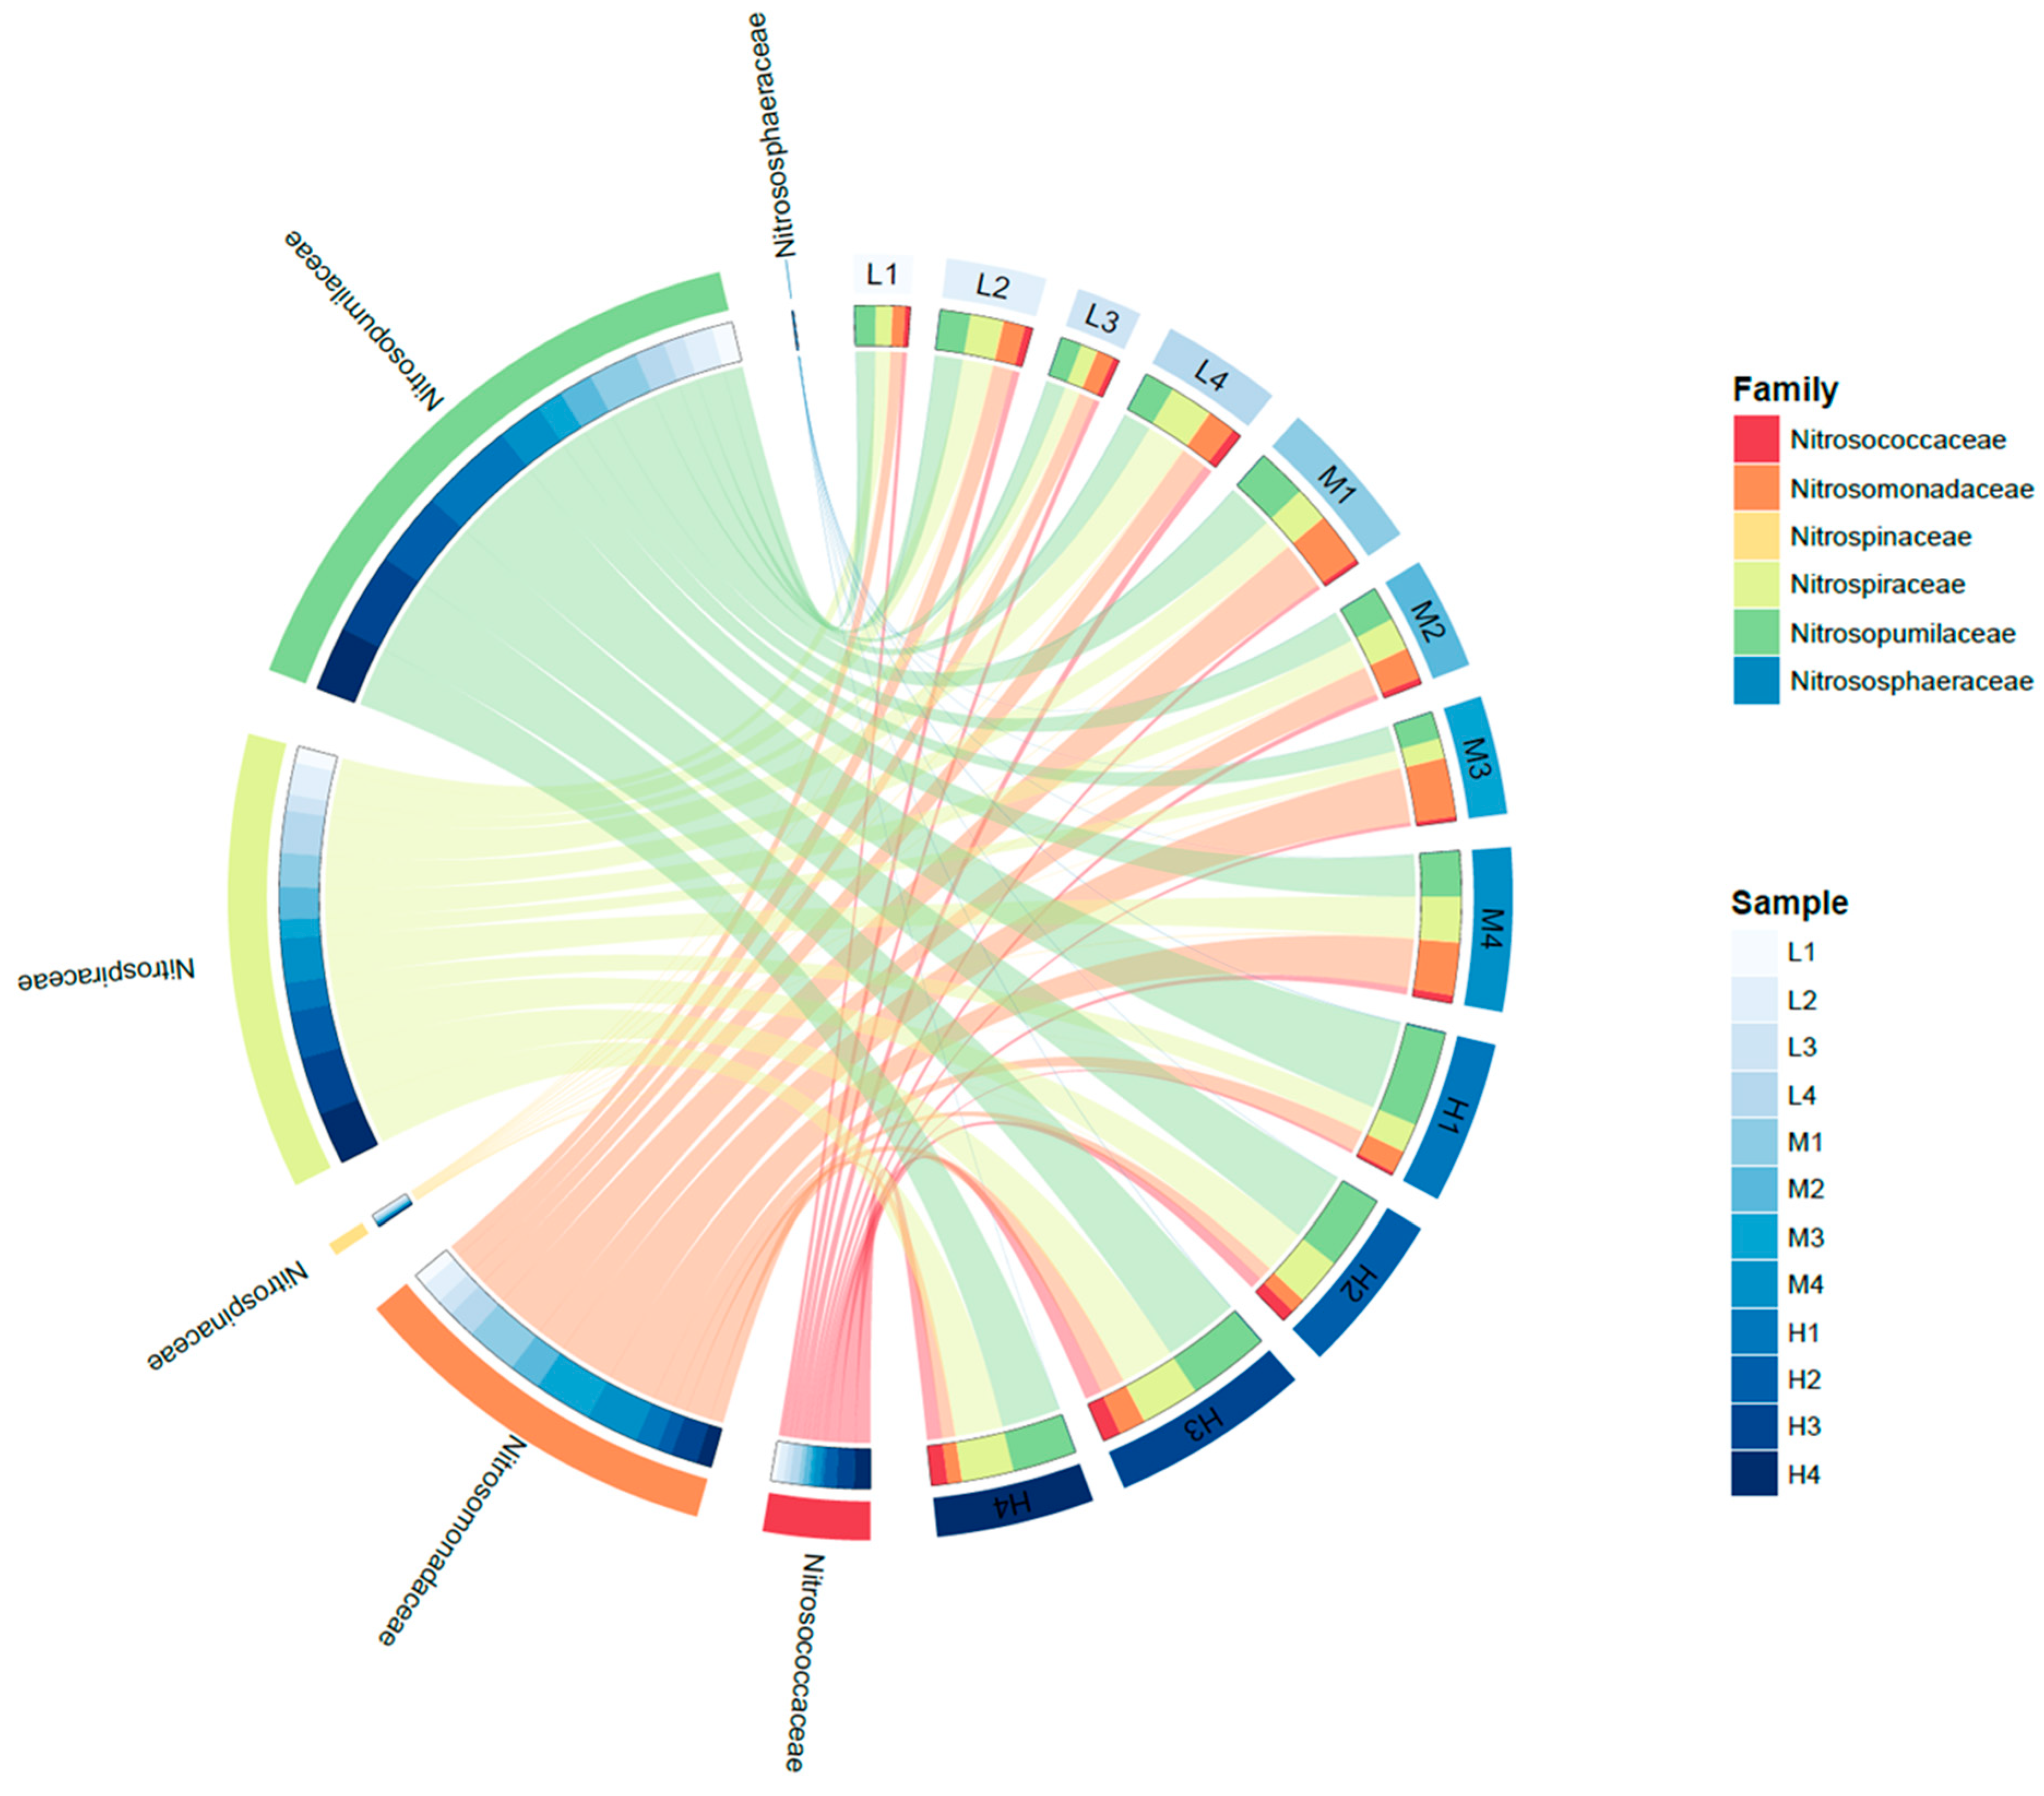
The reads of the known family that are involved in nitrification (ammonia oxidation and nitrite oxidation) were extracted and plotted in Figure 6 (Here, the abundance was described as the read number of each family). As known as AOA, Nitrosopumalaceae were the important nitrifiers in all samples and predominant in the high-temperature samples, which is in accordance with qPCR results and relative-abundance results. Another known AOA, Nitrososphaeraceae was only detected in some high-temperature samples with extremely few reads. For AOB, Nitrosomonadaceae were the dominant AOB in all samples, and their abundances were comparable with AOA in medium-temperature samples. Another known AOB, Nitrosococcaceae showed slightly higher abundance in high-temperature samples than others, but they were much less abundant than Nitrosomonadaceae in all samples. The sum of AOB (Nitrosomonadaceae and Nitrosococcaceae) was highest in medium temperature samples (avg. 6.4%), which was in accordance with that observed by the qPCR method. For nitrite oxidizers, Nitrospiraceae were the dominant NOB, and their abundance in all samples was relatively even. In general, the total abundance of nitrifiers (based on amplicon sequencing reads) was higher in high-temperature samples than in low-temperature samples.
4. Discussion
4.1. Microbial Community in Marine Aquarium Gravel Biofilm
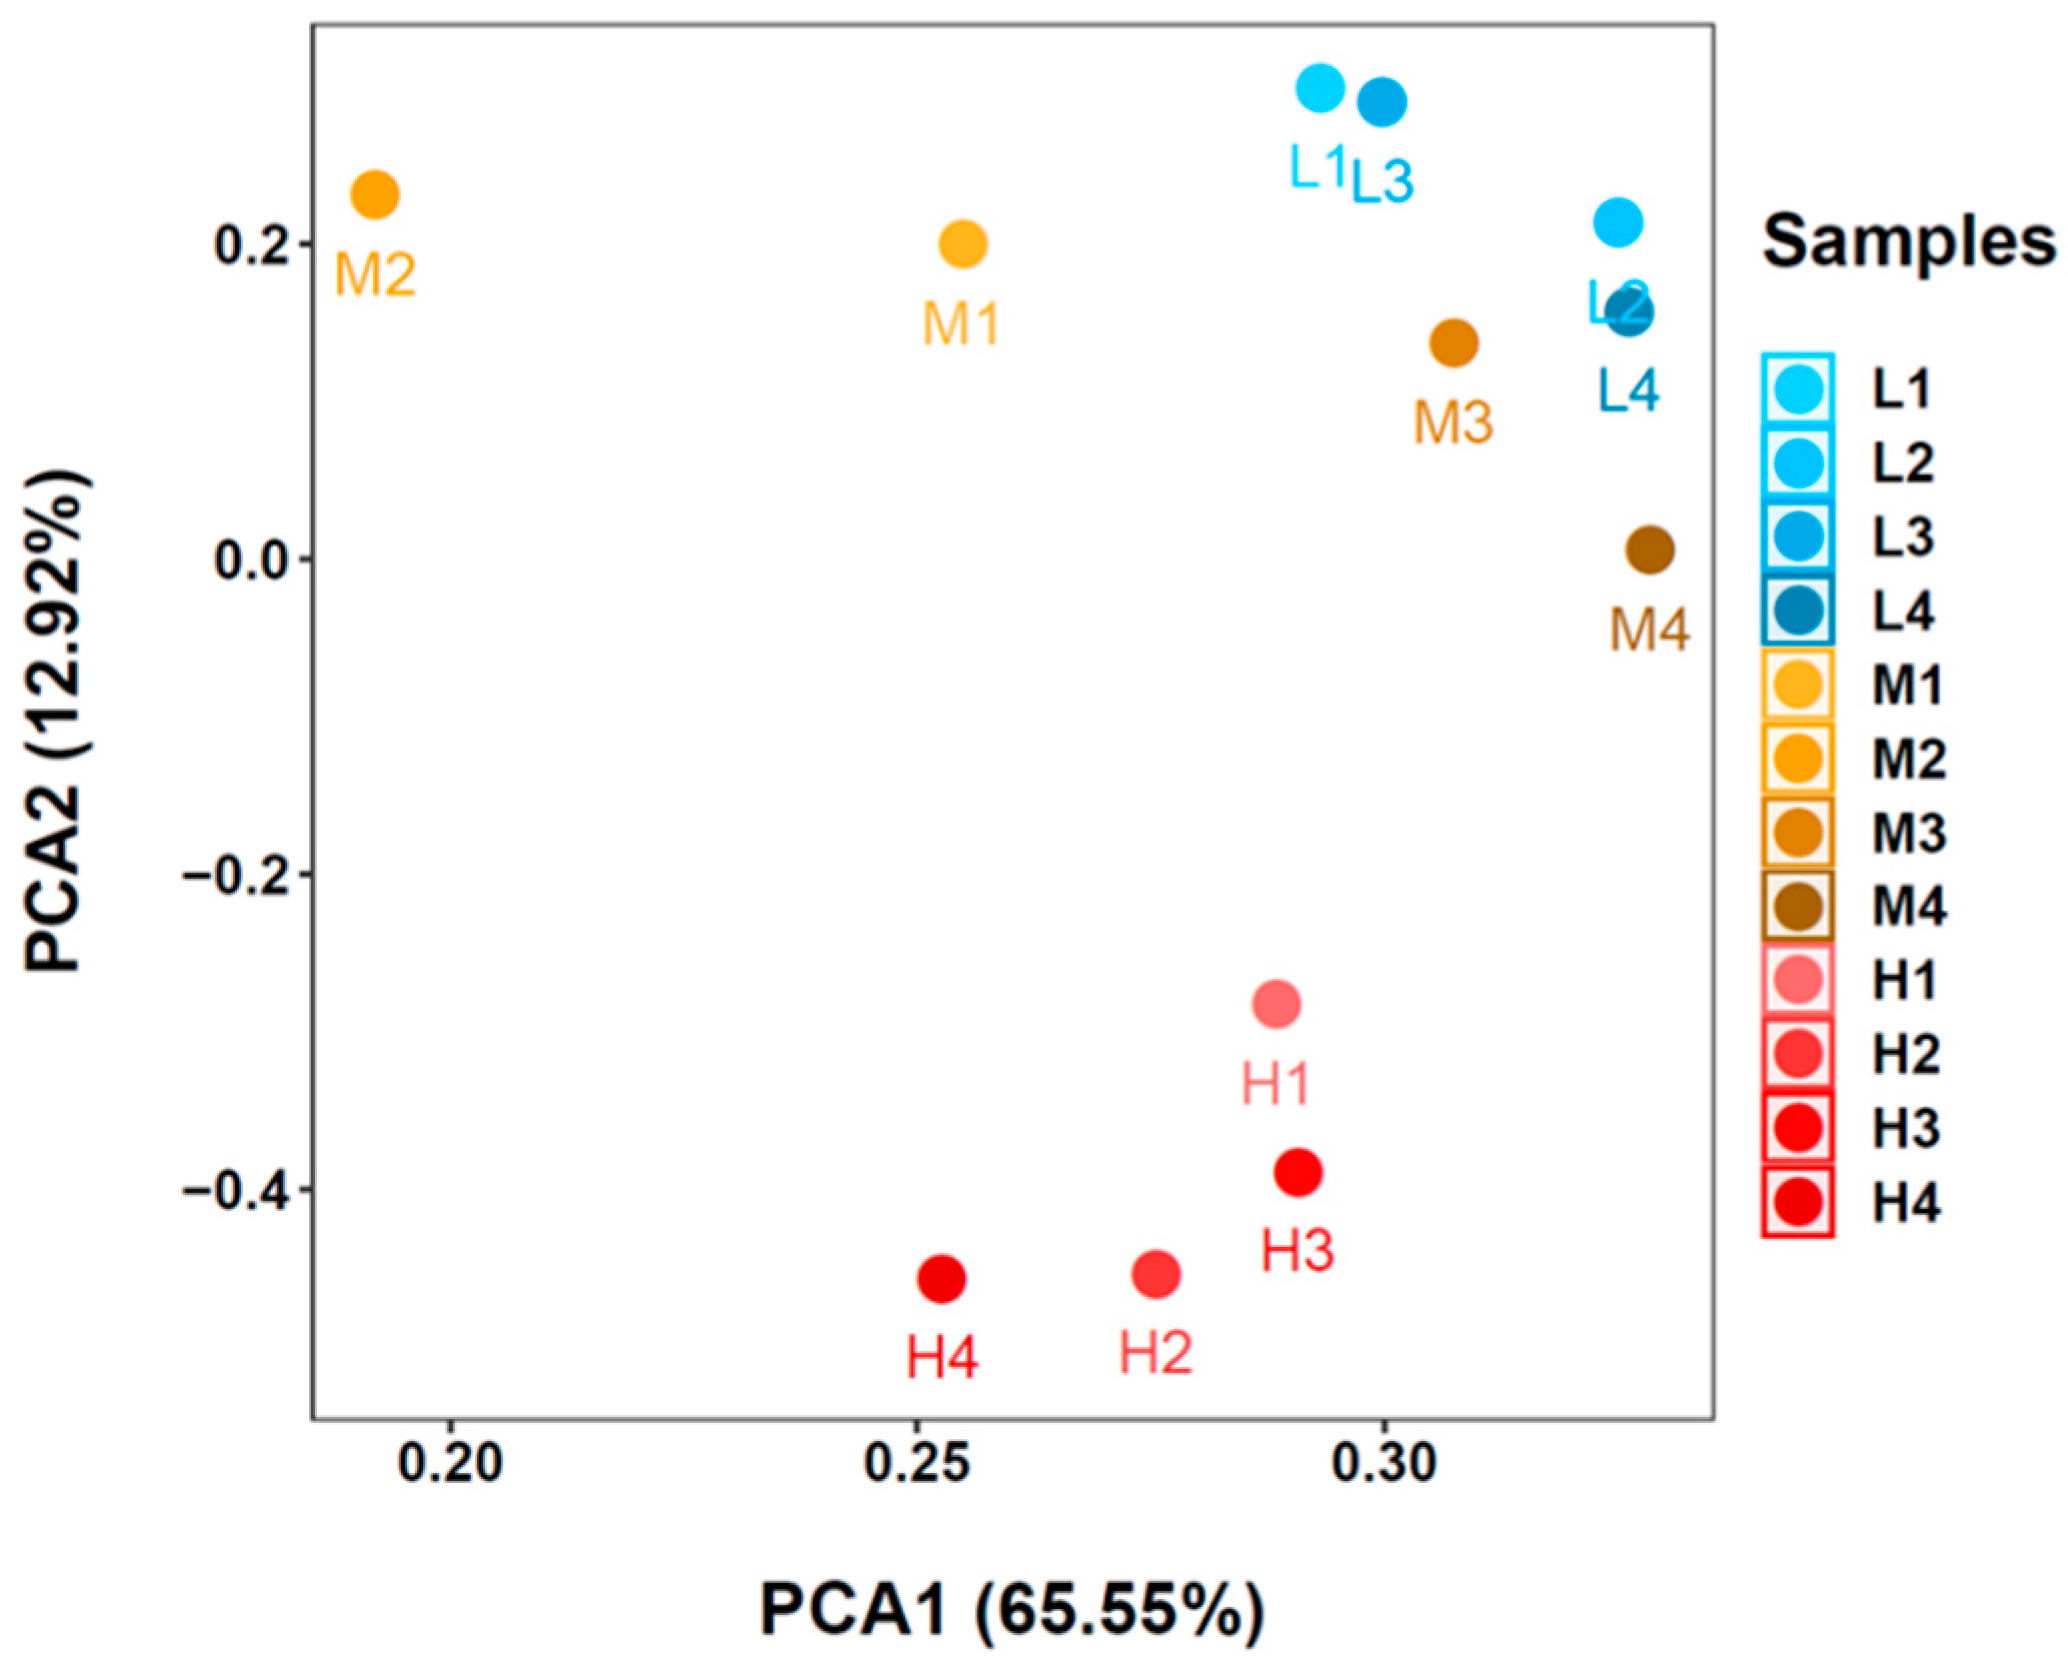
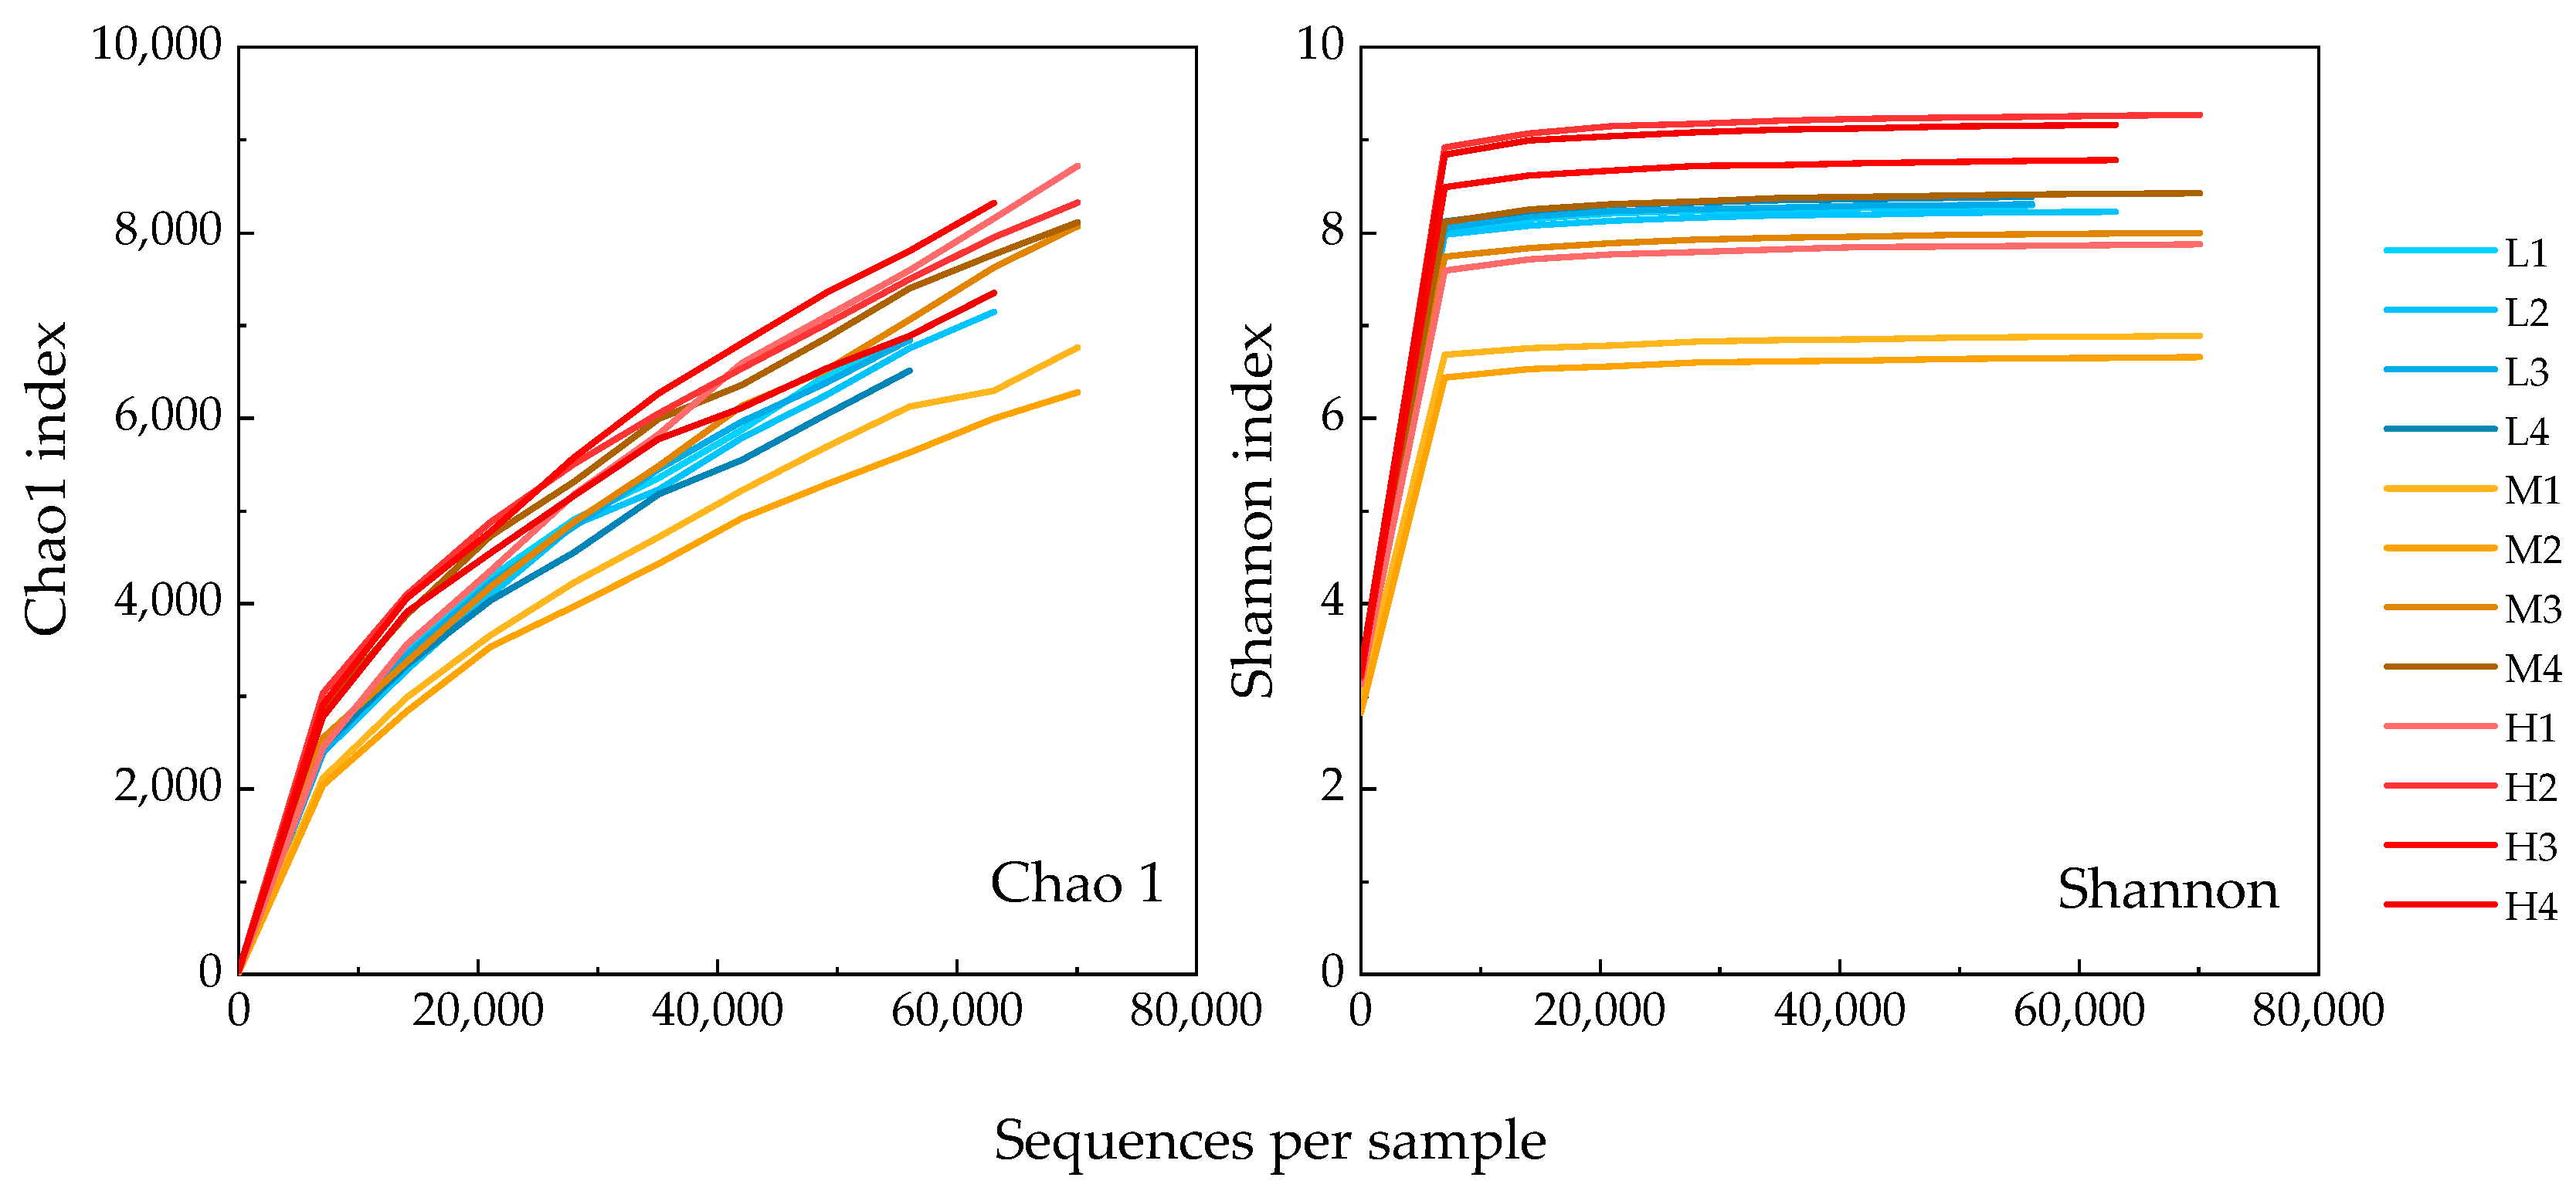
Similar to our results, Proteobacteria were found to be the most predominant phylum in both marine [14,17,24,25] and freshwater RAS biofilters [8,16,26]. Proteobacteria in the RAS system is usually diverse [17,27,28], playing important roles in reactions like nitrification, anammox, and denitrification [7,8,29]. We also identified Bacteroidetes (AVG 9.9%), Actinobacteria (AVG 6.4%), Thaumarchaeota (AVG 5.6%), Acidobacteria (AVG 5.1%), Nitrospira (AVG 4.2%), Planctomycetes (AVG 3.4%) and Calditrichaeota (AVG 1.2%) as minor-predominant phyla in our samples. Most of these phyla were also common in other RAS biofilters, while some of those results analyzed only the bacteria domain so the existence of Thaumarchaeota was not mentioned [14,15,17,25]. The composition of the minor-predominant phyla in the present study varied in each sample. In the low and medium-temperature systems, specific phyla showed remarkable predominance over other phyla (i.e., Bacteroidetes and Actinobacteria in the low-temperature system, Acidobacteria, and Bacteroidetes in the medium-temperature system). In contrast to this, the composition of these minor predominant phyla was more even in the high-temperature system than in others. At the OTU level, PCA analysis (Figure 7) also showed community compositions in high-temperature samples were distinct from that in low or medium-temperature samples, and the composition in medium-temperature samples may vary markedly to the sampling position in biofilters. Moreover, rarefaction curves for Chao 1 and Shannon index values (Figure 8) revealed that the high-temperature system held the highest diversity in all samples. Similar to the present results, Lee et al. (2016) [15] applied 16S rRNA amplicon sequencing to compare bacterial diversity for RAS biofilters at 15 °C, 20 °C, and 25 °C and observed lower diversity (by Shannon index) in low-temperature samples than in others. And prior to the next-generation sequencing, Urakawa et al. [30], reported sharply decreased diversities of both AOA and AOB in cold-water tanks (5.5 °C) compared to moderate-temperature tanks (ca. 19 °C) using sanger sequencing. In the present research, using next-generation sequencing, the diversity of the general microbial community and nitrifiers at three temperatures generally follows the conclusion of Urakawa et al. [30], but the diversity in low-temperature samples was not as low as predicted. In fact, some medium-temperature samples (i.e., M1 and M2) shared the lowest diversity among all samples. These result differences may be due to the different sequencing technologies, as next-generation sequencing tends to target more non-predominant species.
Although Chloroflexi was also reported as one of the most frequent phyla by its high relative abundance in many RAS systems [14,15,17,25], the relative abundance of Chloroflexi was low in all our samples (average value less than 1%). The absence of Chloroflexi in our study may be related to the filtration strategy (which is, sand gravel bed in the present study), as the above works of literature which reported considerable existence of Chloroflexi were generally based on strategies like MBBR (Moving bed biofilm reactor) filtration. Similar to this, Huang et al. [14] also reported Chloroflexi’s absence in their sand filter samples, while using the same methods they recorded abundant Chloroflexi in all other biofilter samples, suggesting Chloroflexi may only be common in MBBR and submerged type RAS systems, but not in sand-filter RAS systems.
In addition to the filter type, community structures in RAS systems may also vary with their operational controls and sampling positions [16,28,31], suggesting each RAS system may hold a unique “microbial fingerprint”. In support of this idea, differences in taxa proportions and existence were observed in samples under different operation periods (before or after backup wash), and samples at different depths (the surface 4 cm or below 4 cm depth). Although these differences were not statistically significant, our data suggested that ignoring this spatial difference in RAS systems may cause numerical deviation in microbial composition, which may lead to different conclusions when other factors were taken into consideration.
4.2. Nitrifying Microorganisms
Thaumarchaeota play an important role in the marine nitrogen cycle and contribute to ammonia removal in marine RAS systems. In the present study, we found the dominance of AOA over AOB in almost all the samples (except for M1), which is supported by both amoA-based qPCR assay and 16S rRNA-based NGS results. Similar to this result, the predominance of thaumarchaeal ammonia oxidizers over bacterial compartments has been broadly reported in RAS biofilters and marine environments [16,17,30,32,33,34,35,36]. In such ammonia-depleted environments, AOA seemingly out-compete AOB by having higher ammonia affinity than AOB [36,37,38,39]. Besides ammonia concentration, the temperature is also considered a niche segregation factor for the relative abundance of AOA and AOB. Experiments based on isolated strains showed that most AOB strains were mesophilic [40], while AOA strains seemed to prefer higher temperatures (25 °C for Nitrosopumilus maritimus HCA1, 26 °C for Nitrosopumilus maritimus PS0, 35 to 40 °C for Candidatus Nitrososphaera sp.JG1, 60 to 74 °C for Candidatus Nitrosocaldus yellowstonii) [41,42,43]. By quantifying amoA-gene in an engineered water treatment system, Lin et al. [44] found that AOA’s numerical predominance over AOB was the greatest at 35 °C (Ratio AOA/AOB was 2.19 × 10³), lowest at 20 °C (6.78 × 10²), but still high at 10 °C (which is, 1.25 × 10³). Similarly, the ratio of AOA to AOB in the present study was 101.0, 1.8, and 5.0 in the average of the high--, medium- and low-temperature systems respectively. In another research modeling soil nitrification at different temperatures (4–42 °C), Taylor et al. [45] found that the optimum temperature for AOA was 12 °C higher than for AOB. These results suggested that AOA may be more adaptive to non-moderate temperatures than AOB, and can numerically thrive at high temperatures. Prior to next-generation sequencing, using sanger sequencing on archaeal and bacterial amoA gene, Urakawa et al., [30] reported sharply-decreased phylogenetic diversity of both archaeal and bacterial amoA in cold-water biofilter samples (5 °C) compared to moderate water tanks (19.0 and 19.9 °C). Using next-generation sequencing, the present study recorded the highest AOA diversity in high-temperature samples (OTU observed: 75.7 ± 8.7), while the AOA diversity at medium and low temperatures was at similar levels (medium: 50.3 ± 14.7, low: 40.3 ± 6.2). For AOB, diversity at high and medium temperatures was similar (medium: 60.8 ± 9.0, high: 57.5 ± 12.4), and decreased to 39.3 (±6.3) at low temperatures. Nevertheless, these results suggested that temperature might have an impact on the abundance, diversity, and relative ratio of AOA and AOB.
Following the oxidation of ammonia to nitrite, the oxidation of nitrite to nitrate is the second step in nitrification, performed by seven genera belonging to four phyla of bacteria [46]. Among these NOBs, Nitrospinae is particularly predominant in meso- and bathy-pelagic seawaters and sediments [47,48,49,50]; while Nitrospirae is the most diverse and abundant NOB in engineered systems [51,52] and is also ubiquitous in nature [46]. In the present study, Nitrospirae was the dominant NOB in all samples, comprising 1.9% to 6.9% of all clean reads. To be mentioned, the relative abundance of Nitrospirae was higher in the high-temperature system (AVG 5.5%) than in medium (AVG 3.8%) or low-temperature systems (AVG 3.2%). Moreover, there were 42.8 (±5.6) Nitrospirae OTUs in high-temperature samples, which is about twice as much as that in medium (21 ± 3.6) and low-temperature samples (17.3 ± 4.2). This indicated that high temperatures may be beneficial for the growth and diversity of Nitrospirae. In contrast to Nitrospirae, only tens to hundreds of Nitrospinae reads were detected, accounting for 0.1% of all clean reads in general. Genus of Nitrobacter, Nitrococcus, Nitrotoga, Nitrolancea, and Candidatus Nitromaritima were not detected. The abundance patterns of NOB generally followed the patterns of AOA, suggesting a cooperation relationship between AOA and NOB in the marine RAS system.
As newly recognized nitrifying bacteria, the existence of comammox Nitrospira has been widely reported in freshwater systems [53,54], estuaries [55,56], paddy and forest soils [57,58], drinking and wastewater treatment systems [18,59,60] and some RAS biofilters [13,16]. However, the involvement of comammox Nitrospira in marine environments remains unclear. Current knowledge on comammox Nitrospira showed it had higher ammonium affinity than most canonical ammonia oxidizers [61,62], and also tend to aggregate in densely-packed cells [63,64,65], and therefore comammox Nitrospira may have an advantage in ammonia-limited and biofilm environments [62]. Based on these characteristics, the target marine aquarium RAS system in the present study was supposed to be an appropriate habitat for comammox Nitrospira, as this habitat was low in ammonia concentrations, and was functioning by biofilms on the surface of gravel sands. However, our qPCR results indicated a low contribution of comammox Nitrospira in nitrification in the marine RAS systems. As comammox Nitrospira cannot be distinguished from canonical NOB by 16S rRNA gene-based methods [62], we were not able to extract comammox-like reads from next-generation sequencing results. The reason that drives the failure of comammox Nitrospira in the competition with AOA and AOB in the marine RAS in the present study may be salinity. Most of the above-mentioned existence of comammox Nitrospira was in freshwater systems. In the present study, salinity was not measured, but based on a previous report in the same area [30], salinity in Oarai seawater should be around 33 to 34 PSU. In a large-scale investigation of the distribution of comammox Nitrospira across several estuary tidal wetlands in China, Sun et al. [56] found the abundance of comammox Nitrospira was 2.21 to 5.44 fold lower than canonical ammonia oxidizers, suggesting salinity as a negative impacting factor on comammox Nitrospira. Similarly, another study targeting 10 locations along Yangtze Estuary revealed that both comammox Nitrospira and potential nitrification rates were negatively correlated to salinity (p = −0.463 ** and −0.573 **, respectively. ** p < 0.01) [55]. These results suggested that salinity may be an important selective factor shaping the relative composition of comammox Nitrospira and canonical ammonia oxidizers.
Nevertheless, the observed OTU numbers of NOB in the present study were considerable in high-temperature samples (49.5 on average), and the comammox amoA copy number was relatively high in some high-temperature samples (i.e., H2 and H4). As NOB is versatile in its metabolic capability [46], and considering the rare species which may be ignored by the current clustering methods (97% similarity), there may be the possibility that some NOB at high temperatures may participate in the comammox process but are not detectable using current primers. In Liu et al.’s research [66], although comammox Nitrospira was found to be less abundant than AOA, its abundance exceeded AOB in 4 out of 6 sampling sites in mangrove ecosystems, which includes sites with salinity as high as 55 PSU. These results suggested that the influence of salinity may be complex as comammox Nitrospira may be capable to adapt to some extreme high salinity environments. Thus, although generally less significant, we suggest that the potential comammox process may minorly contribute to ammonia removal in high-temperature saline waters.
5. Conclusions
In the present study, we analyzed microbial communities in biofilters in three RAS systems in a marine aquarium using both quantitative PCR and next-generation amplicon sequencing. Both qPCR and next-generation sequencing showed AOA was the primary nitrifier, which predominance and diversity were most remarkable in high-temperature samples. AOB was relatively important in medium-temperature samples, as it shared a comparable level of abundances and diversities with AOA in these samples. The abundance pattern of NOB was numerically similar to that of AOA, suggesting a cooperation relationship between AOA and NOB in the marine RAS system. The abundance of comammox Nitrospira was low in all samples, suggesting a negligible contribution to nitrification in the marine RAS system. Here we suggest, that in such an ammonia-limited saline biofilm environment, AOA and NOB together performed most of the nitrification generally, while AOB shared the second importance, especially at moderate temperatures (near 19 °C). Salinity may be the main factor that drives the relative composition of canonical ammonia oxidizers and comammox Nitrispira, while the temperature may play a significant role in determining the diversity and abundance of AOA and AOB.
Author Contributions
Conceptualization, Q.L. and M.U.; methodology and experiments, Q.L., R.H. and R.S.; data analysis, Q.L., R.H., K.S., K.O. and M.U.; writing—original draft preparation, Q.L.; writing—review and editing, Q.L., K.S., K.O. and M.U. All authors have read and agreed to the published version of the manuscript.
Funding
This research was funded by Toyo University (annual research funds of the year 2021, G0000218062).
Institutional Review Board Statement
Not applicable.
Informed Consent Statement
Not applicable.
Acknowledgments
We would like to especially thank Y. Osuga (Deputy associate director of Aqua World Ibaraki Prefectural Oarai Aquarium) for providing the sampling opportunity and the technical assistance.
Conflicts of Interest
The authors declare no conflict of interest.
References
- Dalsgaard, J.; Lund, I.; Thorarinsdottir, R.; Drengstig, A.; Arvonen, K.; Pedersen, P.B. Farming Different Species in RAS in Nordic Countries: Current Status and Future Perspectives. Aquac. Eng. 2013, 53, 2–13. [Google Scholar] [CrossRef]
- Summerfelt, S.T.; Davidson, J.; May, T.; Good, C.; Vinci, B. Emerging Trends in Salmonid RAS—Part II. System Enhancements. Glob. Aquac. Advocate 2015, 18, 64–65. [Google Scholar]
- De Guzman, M.L. New Land-Based Salmon Producer Bares Plans to Build Global RAS Facilities; Hatchery International: Simcoe, ON, Canada, 2018. [Google Scholar]
- Verdegem, M.C.J.; Bosma, R.H.; Verreth, J.A.J. Reducing Water Use for Animal Production through Aquaculture. Water Resour. Dev. 2006, 22, 101–113. [Google Scholar] [CrossRef]
- Badiola, M.; Mendiola, D.; Bostock, J. Recirculating Aquaculture Systems (RAS) Analysis: Main Issues on Management and Future Challenges. Aquac. Eng. 2012, 51, 26–35. [Google Scholar] [CrossRef]
- Piedrahita, R.H. Reducing the Potential Environmental Impact of Tank Aquaculture Effluents through Intensification and Recirculation. Aquaculture 2003, 226, 35–44. [Google Scholar] [CrossRef]
- Ruiz, P.; Vidal, J.M.; Sepúlveda, D.; Torres, C.; Villouta, G.; Carrasco, C.; Aguilera, F.; Ruiz-Tagle, N.; Urrutia, H. Overview and Future Perspectives of Nitrifying Bacteria on Biofilters for Recirculating Aquaculture Systems. Rev. Aquac. 2020, 12, 1478–1494. [Google Scholar] [CrossRef]
- Schreier, H.J.; Mirzoyan, N.; Saito, K. Microbial Diversity of Biological Filters in Recirculating Aquaculture Systems. Curr. Opin. Biotechnol. 2010, 21, 318–325. [Google Scholar] [CrossRef]
- Bock, E.; Wagner, M. Oxidation of Inorganic Nitrogen Compounds as an Energy Source. Prokaryotes 2006, 2, 457–495. [Google Scholar]
- Könneke, M.; Bernhard, A.E.; de La Torre, J.R.; Walker, C.B.; Waterbury, J.B.; Stahl, D.A. Isolation of an Autotrophic Ammonia-Oxidizing Marine Archaeon. Nature 2005, 437, 543–546. [Google Scholar] [CrossRef]
- Abeliovich, A. The Nitrite-Oxidizing Bacteria. Prokaryotes 2006, 5, 861–872. [Google Scholar]
- Daims, H.; Lebedeva, E.V.; Pjevac, P.; Han, P.; Herbold, C.; Albertsen, M.; Jehmlich, N.; Palatinszky, M.; Vierheilig, J.; Bulaev, A.; et al. Complete Nitrification by Nitrospira Bacteria. Nature 2015, 528, 504–509. [Google Scholar] [CrossRef]
- Van Kessel, M.A.; Speth, D.R.; Albertsen, M.; Nielsen, P.H.; Op den Camp, H.J.; Kartal, B.; Jetten, M.S.; Lücker, S. Complete Nitrification by a Single Microorganism. Nature 2015, 528, 555–559. [Google Scholar] [CrossRef]
- Huang, Z.; Wan, R.; Song, X.; Liu, Y.; Hallerman, E.; Dong, D.; Zhai, J.; Zhang, H.; Sun, L. Metagenomic Analysis Shows Diverse, Distinct Bacterial Communities in Biofilters among Different Marine Recirculating Aquaculture Systems. Aquacult. Int. 2016, 24, 1393–1408. [Google Scholar] [CrossRef]
- Lee, D.-E.; Lee, J.; Kim, Y.-M.; Myeong, J.-I.; Kim, K.-H. Uncultured Bacterial Diversity in a Seawater Recirculating Aquaculture System Revealed by 16S RRNA Gene Amplicon Sequencing. J. Microbiol. 2016, 54, 296–304. [Google Scholar] [CrossRef]
- Bartelme, R.P.; McLellan, S.L.; Newton, R.J. Freshwater Recirculating Aquaculture System Operations Drive Biofilter Bacterial Community Shifts around a Stable Nitrifying Consortium of Ammonia-Oxidizing Archaea and Comammox Nitrospira. Front. Microbiol. 2017, 8, 101. [Google Scholar] [CrossRef]
- Hüpeden, J.; Wemheuer, B.; Indenbirken, D.; Schulz, C.; Spieck, E. Taxonomic and Functional Profiling of Nitrifying Biofilms in Freshwater, Brackish and Marine RAS Biofilters. Aquac. Eng. 2020, 90, 102094. [Google Scholar] [CrossRef]
- Fowler, S.J.; Palomo, A.; Dechesne, A.; Mines, P.D.; Smets, B.F. Comammox Nitrospira Are Abundant Ammonia Oxidizers in Diverse Groundwater-Fed Rapid Sand Filter Communities: Comammox Nitrospira in Drinking Water Biofilters. Environ. Microbiol. 2018, 20, 1002–1015. [Google Scholar] [CrossRef]
- Wuchter, C.; Abbas, B.; Coolen, M.J.L.; Herfort, L.; van Bleijswijk, J.; Timmers, P.; Strous, M.; Teira, E.; Herndl, G.J.; Middelburg, J.J.; et al. Archaeal Nitrification in the Ocean. Proc. Natl. Acad. Sci. USA 2006, 103, 12317–12322. [Google Scholar] [CrossRef]
- Rotthauwe, J.H.; Witzel, K.P.; Liesack, W. The Ammonia Monooxygenase Structural Gene AmoA as a Functional Marker: Molecular Fine-Scale Analysis of Natural Ammonia-Oxidizing Populations. Appl. Environ. Microbiol. 1997, 63, 4704–4712. [Google Scholar] [CrossRef]
- Hornek, R.; Pommerening-Röser, A.; Koops, H.-P.; Farnleitner, A.H.; Kreuzinger, N.; Kirschner, A.; Mach, R.L. Primers Containing Universal Bases Reduce Multiple AmoA Gene Specific DGGE Band Patterns When Analysing the Diversity of Beta-Ammonia Oxidizers in the Environment. J. Microbiol. Methods 2006, 66, 147–155. [Google Scholar] [CrossRef]
- Suzuki, M.T.; Taylor, L.T.; DeLong, E.F. Quantitative Analysis of Small-Subunit RRNA Genes in Mixed Microbial Populations via 5′-Nuclease Assays. Appl. Environ. Microbiol. 2000, 66, 4605–4614. [Google Scholar] [CrossRef] [PubMed]
- Caporaso, J.G.; Lauber, C.L.; Walters, W.A.; Berg-Lyons, D.; Huntley, J.; Fierer, N.; Owens, S.M.; Betley, J.; Fraser, L.; Bauer, M. Ultra-High-Throughput Microbial Community Analysis on the Illumina HiSeq and MiSeq Platforms. ISME J. 2012, 6, 1621–1624. [Google Scholar] [CrossRef] [PubMed]
- Ruan, Y.-J.; Guo, X.-S.; Ye, Z.-Y.; Liu, Y.; Zhu, S.-M. Bacterial Community Analysis of Different Sections of a Biofilter in a Full-Scale Marine Recirculating Aquaculture System. N. Am. J. Aquac. 2015, 77, 318–326. [Google Scholar] [CrossRef]
- Gonzalez-Silva, B.M.; Jonassen, K.R.; Bakke, I.; Østgaard, K.; Vadstein, O. Nitrification at Different Salinities: Biofilm Community Composition and Physiological Plasticity. Water Res. 2016, 95, 48–58. [Google Scholar] [CrossRef]
- Smith, K.F.; Schmidt, V.; Rosen, G.E.; Amaral-Zettler, L. Microbial Diversity and Potential Pathogens in Ornamental Fish Aquarium Water. PLoS ONE 2012, 7, e39971. [Google Scholar] [CrossRef]
- Michaud, L.; Lo Giudice, A.; Troussellier, M.; Smedile, F.; Bruni, V.; Blancheton, J.-P. Phylogenetic Characterization of the Heterotrophic Bacterial Communities Inhabiting a Marine Recirculating Aquaculture System. J. Appl. Microbiol. 2009, 107, 1935–1946. [Google Scholar] [CrossRef]
- Blancheton, J.P.; Attramadal, K.J.K.; Michaud, L.; d’Orbcastel, E.R.; Vadstein, O. Insight into Bacterial Population in Aquaculture Systems and Its Implication. Aquac. Eng. 2013, 53, 30–39. [Google Scholar] [CrossRef]
- Marchant, H.K.; Tegetmeyer, H.E.; Ahmerkamp, S.; Holtappels, M.; Lavik, G.; Graf, J.; Schreiber, F.; Mussmann, M.; Strous, M.; Kuypers, M.M. Metabolic Specialization of Denitrifiers in Permeable Sediments Controls N2O Emissions. Environ. Microbiol. 2018, 20, 4486–4502. [Google Scholar] [CrossRef]
- Urakawa, H.; Tajima, Y.; Numata, Y.; Tsuneda, S. Low Temperature Decreases the Phylogenetic Diversity of Ammonia-Oxidizing Archaea and Bacteria in Aquarium Biofiltration Systems. Appl. Environ. Microbiol. 2008, 74, 894–900. [Google Scholar] [CrossRef]
- Sugita, H.; Nakamura, H.; Shimada, T. Microbial Communities Associated with Filter Materials in Recirculating Aquaculture Systems of Freshwater Fish. Aquaculture 2005, 243, 403–409. [Google Scholar] [CrossRef]
- Francis, C.A.; Roberts, K.J.; Beman, J.M.; Santoro, A.E.; Oakley, B.B. Ubiquity and Diversity of Ammonia-Oxidizing Archaea in Water Columns and Sediments of the Ocean. Proc. Natl. Acad. Sci. USA 2005, 102, 14683–14688. [Google Scholar] [CrossRef]
- Agogué, H.; Brink, M.; Dinasquet, J.; Herndl, G.J. Major Gradients in Putatively Nitrifying and Non-Nitrifying Archaea in the Deep North Atlantic. Nature 2008, 456, 788–791. [Google Scholar] [CrossRef]
- Sauder, L.A.; Engel, K.; Stearns, J.C.; Masella, A.P.; Pawliszyn, R.; Neufeld, J.D. Aquarium Nitrification Revisited: Thaumarchaeota Are the Dominant Ammonia Oxidizers in Freshwater Aquarium Biofilters. PLoS ONE 2011, 6, e23281. [Google Scholar] [CrossRef] [Green Version]
- Sakami, T.; Andoh, T.; Morita, T.; Yamamoto, Y. Phylogenetic Diversity of Ammonia-Oxidizing Archaea and Bacteria in Biofilters of Recirculating Aquaculture Systems. Mar. Genom. 2012, 7, 27–31. [Google Scholar] [CrossRef]
- Brown, M.N.; Briones, A.; Diana, J.; Raskin, L. Ammonia-Oxidizing Archaea and Nitrite-Oxidizing Nitrospiras in the Biofilter of a Shrimp Recirculating Aquaculture System. FEMS Microbiol. Ecol. 2013, 83, 17–25. [Google Scholar] [CrossRef]
- Martens-Habbena, W.; Qin, W.; Horak, R.E.; Urakawa, H.; Schauer, A.J.; Moffett, J.W.; Armbrust, E.V.; Ingalls, A.E.; Devol, A.H.; Stahl, D.A. The Production of Nitric Oxide by Marine Ammonia-oxidizing Archaea and Inhibition of Archaeal Ammonia Oxidation by a Nitric Oxide Scavenger. Environ. Microbiol. 2015, 17, 2261–2274. [Google Scholar] [CrossRef]
- Hatzenpichler, R. Diversity, Physiology, and Niche Differentiation of Ammonia-Oxidizing Archaea. Appl. Environ. Microbiol. 2012, 78, 7501–7510. [Google Scholar] [CrossRef]
- Roalkvam, I.; Drønen, K.; Dahle, H.; Wergeland, H.I. Comparison of Active Biofilm Carriers and Commercially Available Inoculum for Activation of Biofilters in Marine Recirculating Aquaculture Systems (RAS). Aquaculture 2020, 514, 734480. [Google Scholar] [CrossRef]
- Liu, S.; Hu, J.-J.; Shen, J.-X.; Chen, S.; Tian, G.-M.; Zheng, P.; Lou, L.-P.; Ma, F.; Hu, B.-L. Potencial Correlated Environmental Factors Leading to the Niche Segregation of Ammonia-Oxidizing Archaea and Ammonia-Oxidizing Bacteria: A Review. Appl. Environ. Biotechnol. 2017, 2, 11–19. [Google Scholar] [CrossRef]
- Qin, W.; Amin, S.A.; Martens-Habbena, W.; Walker, C.B.; Urakawa, H.; Devol, A.H.; Ingalls, A.E.; Moffett, J.W.; Armbrust, E.V.; Stahl, D.A. Marine Ammonia-Oxidizing Archaeal Isolates Display Obligate Mixotrophy and Wide Ecotypic Variation. Proc. Natl. Acad. Sci. USA 2014, 111, 12504–12509. [Google Scholar] [CrossRef]
- Kim, J.-G.; Jung, M.-Y.; Park, S.-J.; Rijpstra, W.I.C.; Sinninghe Damsté, J.S.; Madsen, E.L.; Min, D.; Kim, J.-S.; Kim, G.-J.; Rhee, S.-K. Cultivation of a Highly Enriched Ammonia-oxidizing Archaeon of Thaumarchaeotal Group I. 1b from an Agricultural Soil. Environ. Microbiol. 2012, 14, 1528–1543. [Google Scholar] [CrossRef] [PubMed]
- De la Torre, J.R.; Walker, C.B.; Ingalls, A.E.; Könneke, M.; Stahl, D.A. Cultivation of a Thermophilic Ammonia Oxidizing Archaeon Synthesizing Crenarchaeol. Environ. Microbiol. 2008, 10, 810–818. [Google Scholar] [CrossRef]
- Lin, Z.; Huang, W.; Zhou, J.; He, X.; Wang, J.; Wang, X.; Zhou, J. The Variation on Nitrogen Removal Mechanisms and the Succession of Ammonia Oxidizing Archaea and Ammonia Oxidizing Bacteria with Temperature in Biofilm Reactors Treating Saline Wastewater. Bioresour. Technol. 2020, 314, 123760. [Google Scholar] [CrossRef]
- Taylor, A.E.; Giguere, A.T.; Zoebelein, C.M.; Myrold, D.D.; Bottomley, P.J. Modeling of Soil Nitrification Responses to Temperature Reveals Thermodynamic Differences between Ammonia-Oxidizing Activity of Archaea and Bacteria. ISME J. 2017, 11, 896–908. [Google Scholar] [CrossRef] [PubMed]
- Daims, H.; Lücker, S.; Wagner, M. A New Perspective on Microbes Formerly Known as Nitrite-Oxidizing Bacteria. Trends Microbiol. 2016, 24, 699–712. [Google Scholar] [CrossRef] [PubMed]
- Füssel, J.; Lam, P.; Lavik, G.; Jensen, M.M.; Holtappels, M.; Günter, M.; Kuypers, M.M. Nitrite Oxidation in the Namibian Oxygen Minimum Zone. ISME J. 2012, 6, 1200–1209. [Google Scholar] [CrossRef]
- Jorgensen, S.L.; Hannisdal, B.; Lanzén, A.; Baumberger, T.; Flesland, K.; Fonseca, R.; Øvreås, L.; Steen, I.H.; Thorseth, I.H.; Pedersen, R.B. Correlating Microbial Community Profiles with Geochemical Data in Highly Stratified Sediments from the Arctic Mid-Ocean Ridge. Proc. Natl. Acad. Sci. USA 2012, 109, E2846–E2855. [Google Scholar] [CrossRef] [PubMed]
- Beman, J.M.; Leilei Shih, J.; Popp, B.N. Nitrite Oxidation in the Upper Water Column and Oxygen Minimum Zone of the Eastern Tropical North Pacific Ocean. ISME J. 2013, 7, 2192–2205. [Google Scholar] [CrossRef]
- Nunoura, T.; Takaki, Y.; Hirai, M.; Shimamura, S.; Makabe, A.; Koide, O.; Kikuchi, T.; Miyazaki, J.; Koba, K.; Yoshida, N. Hadal Biosphere: Insight into the Microbial Ecosystem in the Deepest Ocean on Earth. Proc. Natl. Acad. Sci. USA 2015, 112, E1230–E1236. [Google Scholar] [CrossRef]
- Gruber-Dorninger, C.; Pester, M.; Kitzinger, K.; Savio, D.F.; Loy, A.; Rattei, T.; Wagner, M.; Daims, H. Functionally Relevant Diversity of Closely Related Nitrospira in Activated Sludge. ISME J. 2015, 9, 643–655. [Google Scholar] [CrossRef]
- Cao, Y.; van Loosdrecht, M.C.M.; Daigger, G.T. Mainstream Partial Nitritation–Anammox in Municipal Wastewater Treatment: Status, Bottlenecks, and Further Studies. Appl. Microbiol. Biotechnol. 2017, 101, 1365–1383. [Google Scholar] [CrossRef]
- Palomo, A.; Jane Fowler, S.; Gülay, A.; Rasmussen, S.; Sicheritz-Ponten, T.; Smets, B.F. Metagenomic Analysis of Rapid Gravity Sand Filter Microbial Communities Suggests Novel Physiology of Nitrospira Spp. ISME J. 2016, 10, 2569–2581. [Google Scholar] [CrossRef]
- Liu, S.; Wang, H.; Chen, L.; Wang, J.; Zheng, M.; Liu, S.; Chen, Q.; Ni, J. Comammox Nitrospira within the Yangtze River Continuum: Community, Biogeography, and Ecological Drivers. ISME J. 2020, 14, 2488–2504. [Google Scholar] [CrossRef]
- Sun, D.; Zhao, M.; Tang, X.; Liu, M.; Hou, L.; Zhao, Q.; Li, J.; Gu, J.-D.; Han, P. Niche Adaptation Strategies of Different Clades of Comammox Nitrospira in the Yangtze Estuary. Int. Biodeterior. Biodegrad. 2021, 164, 105286. [Google Scholar] [CrossRef]
- Sun, D.; Tang, X.; Zhao, M.; Zhang, Z.; Hou, L.; Liu, M.; Wang, B.; Klümper, U.; Han, P. Distribution and Diversity of Comammox Nitrospira in Coastal Wetlands of China. Front. Microbiol. 2020, 11, 589268. [Google Scholar] [CrossRef]
- Pjevac, P.; Schauberger, C.; Poghosyan, L.; Herbold, C.W.; van Kessel, M.A.H.J.; Daebeler, A.; Steinberger, M.; Jetten, M.S.M.; Lücker, S.; Wagner, M.; et al. AmoA-Targeted Polymerase Chain Reaction Primers for the Specific Detection and Quantification of Comammox Nitrospira in the Environment. Front. Microbiol. 2017, 8, 1508. [Google Scholar] [CrossRef]
- Osburn, E.D.; Barrett, J.E. Abundance and Functional Importance of Complete Ammonia-Oxidizing Bacteria (Comammox) versus Canonical Nitrifiers in Temperate Forest Soils. Soil Biol. Biochem. 2020, 145, 107801. [Google Scholar] [CrossRef]
- Roots, P.; Wang, Y.; Rosenthal, A.F.; Griffin, J.S.; Sabba, F.; Petrovich, M.; Yang, F.; Kozak, J.A.; Zhang, H.; Wells, G.F. Comammox Nitrospira Are the Dominant Ammonia Oxidizers in a Mainstream Low Dissolved Oxygen Nitrification Reactor. Water Res. 2019, 157, 396–405. [Google Scholar] [CrossRef]
- Cotto, I.; Dai, Z.; Huo, L.; Anderson, C.L.; Vilardi, K.J.; Ijaz, U.; Khunjar, W.; Wilson, C.; De Clippeleir, H.; Gilmore, K.; et al. Long Solids Retention Times and Attached Growth Phase Favor Prevalence of Comammox Bacteria in Nitrogen Removal Systems. Water Res. 2020, 169, 115268. [Google Scholar] [CrossRef]
- Kits, K.D.; Sedlacek, C.J.; Lebedeva, E.V.; Han, P.; Bulaev, A.; Pjevac, P.; Daebeler, A.; Romano, S.; Albertsen, M.; Stein, L.Y.; et al. Kinetic Analysis of a Complete Nitrifier Reveals an Oligotrophic Lifestyle. Nature 2017, 549, 269–272. [Google Scholar] [CrossRef]
- Koch, H.; van Kessel, M.A.H.J.; Lücker, S. Complete Nitrification: Insights into the Ecophysiology of Comammox Nitrospira. App.l Microbiol. Biotechnol. 2019, 103, 177–189. [Google Scholar] [CrossRef] [PubMed]
- Daims, H.; Nielsen, J.L.; Nielsen, P.H.; Schleifer, K.-H.; Wagner, M. In Situ Characterization of Nitrospira -Like Nitrite-Oxidizing Bacteria Active in Wastewater Treatment Plants. Appl. Environ. Microbiol. 2001, 67, 5273–5284. [Google Scholar] [CrossRef] [PubMed]
- Juretschko, S.; Timmermann, G.; Schmid, M.; Schleifer, K.-H.; Pommerening-Röser, A.; Koops, H.-P.; Wagner, M. Combined Molecular and Conventional Analyses of Nitrifying Bacterium Diversity in Activated Sludge: Nitrosococcus Mobilis and Nitrospira-Like Bacteria as Dominant Populations. Appl. Environ. Microbiol. 1998, 64, 3042–3051. [Google Scholar] [CrossRef] [PubMed] [Green Version]
- Bartosch, S.; Wolgast, I.; Spieck, E.; Bock, E. Identification of Nitrite-Oxidizing Bacteria with Monoclonal Antibodies Recognizing the Nitrite Oxidoreductase. Appl. Environ. Microbiol. 1999, 65, 4126–4133. [Google Scholar] [CrossRef] [PubMed]
- Liu, Z.; Zhang, C.; Wei, Q.; Zhang, S.; Quan, Z.; Li, M. Temperature and Salinity Drive Comammox Community Composition in Mangrove Ecosystems across Southeastern China. Sci. Total Environ. 2020, 742, 140456. [Google Scholar] [CrossRef] [PubMed]
Figure 1.
Schematic diagram of the aquarium RAS system. Sample type and its abbreviation name (samples No.) are shown in the sample list on the right.
Figure 1.
Schematic diagram of the aquarium RAS system. Sample type and its abbreviation name (samples No.) are shown in the sample list on the right.

Figure 2.
Quantitative result of amoA genes of nitrifying microorganisms biofilm samples. ((left): archaeal amoA; (middle): beta-proteobacterial amoA; (right): comammox Nitrospira amoA).
Figure 2.
Quantitative result of amoA genes of nitrifying microorganisms biofilm samples. ((left): archaeal amoA; (middle): beta-proteobacterial amoA; (right): comammox Nitrospira amoA).

Figure 3.
Taxonomic classification at the phylum level.

Figure 4.
Taxonomic classification at the family level.

Figure 5.
Relative abundance bubble plot of 16S-v4 gene profile at the family level (up), quantification results of amoA gene via qPCR (middle), quantification result of 16S rRNA gene via qPCR (down).
Figure 5.
Relative abundance bubble plot of 16S-v4 gene profile at the family level (up), quantification results of amoA gene via qPCR (middle), quantification result of 16S rRNA gene via qPCR (down).

Figure 6.
Circus plot of abundances of nitrifying microorganisms in all 12 samples. Abundances were represented by reading numbers of each family via 16S v4 amplicon sequencing. (AOB: Nitrosococcaceae, Nitrosomonadaceae; NOB: Nitrospinaceae, Nitrospiraceae; AOA: Nitrosopumilaceae, Nitrososphaeraceae).

Figure 7.
Principal coordinate analysis (PCA) on the composition of microbial communities at operational taxonomic units (OTU) level.
Figure 7.
Principal coordinate analysis (PCA) on the composition of microbial communities at operational taxonomic units (OTU) level.

Figure 8.
Rarefaction results of Chao1 and Shannon index of observed OTUs in all samples.


Table 1.
Primer/probe information used in qPCR assays.
| Target Gene | Primer/Probe | Sequence | Ref. |
|---|---|---|---|
| Thaumarchaeal amoA | amoA-for | STAATGGTCTGGCTTAGACG | [19] |
| amoA-rev | GCGGCCATCCATCTGTATGT | ||
| Beta-proteobacterial amoA | amoA-1F | GGGGTTTCTACTGGTGGT | [20] |
| amoA-rNew | CCCCTCBGSAAAVCCTTCTTC | [21] | |
| Comammox Nitrospira amoA | Ntsp-amoA162F | GGATTTCTGGNTSGATTGGA | [18] |
| Ntsp-amoA359R | WAGTTNGACCACCASTACCA | ||
| Archaeal 16S rRNA | ARCH1-1369F | CGGTGAATACGTCCCTGC | [22] |
| ARCH2-1369F | CGGTGAATATGCCCCTGC | ||
| PROK 1541R | AAGGAGGTGATCCRGCCGCA | ||
| Tm1389F | CTTGTACACACCGCCCGTC | ||
| Bacterial 16S rRNA | BACT1369F | CGGTGAATACGTTCYCGG | [22] |
| PROK1492R | GGWTACCTTGTTACGACTT | ||
| Tm1389F | CTTGTACACACCGCCCGTC |
Table 2.
General information on the three filtration systems in the present study. Values are shown by average ± standard deviation (n = 3).
Table 2.
General information on the three filtration systems in the present study. Values are shown by average ± standard deviation (n = 3).
| Sample No. | Temp (°C) | pH | DO (mg/L) | NH4+-N (μg/L) | NO3− -N (μg/L) | PO43-P (μg/L) |
|---|---|---|---|---|---|---|
| LWF | 10.0 | 7.6 | 8.90 | 2.54 (±0.68) | 41.71 (±3.37) | 1.07 (±0.03) |
| LWN | 10.1 | 7.6 | 9.03 | 2.35 (±1.11) | 32.43 (±3.79) | 1.28 (±0.13) |
| LWB | 10.1 | 7.6 | 8.87 | 5.07 (±1.33) | 30.29 (±2.67) | 1.21 (±0.19) |
| MWF | 19.0 | 7.5 | 7.90 | 1.86 (±4.07) | 138.50 (±15.35) | 3.55 (±0.06) |
| MWN | 18.4 | 7.7 | 8.04 | 6.43 (±0.09) | 113.86 (±6.93) | 3.84 (±0.03) |
| MWB | 18.4 | 7.7 | 7.70 | 1.96 (±0.32) | 125.29 (±2.77) | 3.77 (±0.12) |
| HWB | 26.8 | 7.4 | 5.28 | 3.32 (±0.05) | 98.86 (±5.15) | 1.35 (±0.17) |
| HWN | 24.7 | 7.5 | 6.58 | 2.64 (±0.17) | 81.71 (±8.37) | 1.14 (±0.09) |
| HWB | 24.7 | 7.5 | 6.15 | 3.51 (±0.80) | 88.86 (±7.16) | 1.28 (±0.03) |
Table 3.
Quantitative result of amoA genes of nitrifying microorganisms (planktonic phase) in water samples (copies/mL). Values are shown by average ± standard deviation (n = 3).
Table 3.
Quantitative result of amoA genes of nitrifying microorganisms (planktonic phase) in water samples (copies/mL). Values are shown by average ± standard deviation (n = 3).
| Sample No. | AOA | AOB | Comammox Nitrospira |
|---|---|---|---|
| LWF | 1.76 × 10⁴ (±659.14) | 1.50 × 10² (±23.54) | 1.6 × 101 (±2.40) |
| LWN | 5.04 × 10³ (±49.83) | 1.17 × 10² (±19.01) | 3.81 × 101 (±7.91) |
| LWB | 2.40 × 10⁴ (±678.11) | 1.37 × 10² (±3.33) | 2.23 × 101 (±0.26) |
| MWF | 2.13 × 10⁴ (±747.40) | 5.94 × 10² (±86.85) | 3.87 × 100 (±1.01) |
| MWN | 1.84 × 10⁴ (±260.69) | 5.52 × 10² (±23.31) | 8.7 × 100 (±0.44) |
| MWB | 2.03 × 10⁴ (±253.31) | 6.57 × 10² (±12.38) | 7.54 × 100 (±0.32) |
| HWF | 5.2 × 10⁴ (±1177.35) | 1.82 × 10² (±19.52) | 1.18 × 101 (±3.7) |
| HWN | 4.17 × 10⁴ (±1122.59) | 1.55 × 10² (±10.35) | 9.91 × 100 (±1.08) |
| HWB | 3.36 × 10⁴ (±686.65) | 8.13 × 101 (±11.69) | 5.33 × 100 (±1.56) |
Table 4.
A general summary of the results of next-generation sequencing.
| Raw Reads | Clean Reads | AOA Reads | AOB Reads | NOB Reads | OTU No. | AOA OTU No. | AOB OTU No. | NOB OTU No. | |
|---|---|---|---|---|---|---|---|---|---|
| L1 | 69,800 | 59,133 | 1443 | 1220 | 1177 | 3543 | 36 | 32 | 17 |
| L2 | 77,781 | 65,949 | 2328 | 2275 | 2645 | 3732 | 41 | 49 | 28 |
| L3 | 68,202 | 57,731 | 1401 | 1569 | 1193 | 3513 | 34 | 36 | 24 |
| L4 | 69,915 | 59,308 | 2089 | 2631 | 3098 | 3565 | 50 | 40 | 28 |
| M1 | 87,868 | 74,951 | 4433 | 5026 | 3135 | 3450 | 60 | 64 | 25 |
| M2 | 82,719 | 70,304 | 2813 | 3114 | 2756 | 3281 | 38 | 47 | 24 |
| M3 | 85,189 | 72,402 | 2283 | 5402 | 1733 | 4011 | 34 | 60 | 23 |
| M4 | 101,204 | 85,612 | 4569 | 6095 | 4666 | 4961 | 69 | 72 | 33 |
| H1 | 96,814 | 77,850 | 8808 | 2368 | 2689 | 4265 | 87 | 37 | 49 |
| H2 | 90,945 | 76,243 | 6676 | 2503 | 4300 | 4937 | 74 | 63 | 47 |
| H3 | 77,410 | 64,298 | 6222 | 3390 | 4492 | 4412 | 79 | 70 | 59 |
| H4 | 83,213 | 69,846 | 5273 | 2521 | 4313 | 4470 | 63 | 60 | 43 |
Publisher’s Note: MDPI stays neutral with regard to jurisdictional claims in published maps and institutional affiliations. |
© 2022 by the authors. Licensee MDPI, Basel, Switzerland. This article is an open access article distributed under the terms and conditions of the Creative Commons Attribution (CC BY) license (https://creativecommons.org/licenses/by/4.0/).
Share and Cite
MDPI and ACS Style
Li, Q.; Hasezawa, R.; Saito, R.; Okano, K.; Shimizu, K.; Utsumi, M. Abundance and Diversity of Nitrifying Microorganisms in Marine Recirculating Aquaculture Systems. Water 2022, 14, 2744. https://doi.org/10.3390/w14172744
AMA Style
Li Q, Hasezawa R, Saito R, Okano K, Shimizu K, Utsumi M. Abundance and Diversity of Nitrifying Microorganisms in Marine Recirculating Aquaculture Systems. Water. 2022; 14(17):2744. https://doi.org/10.3390/w14172744
Chicago/Turabian StyleLi, Qintong, Ryo Hasezawa, Riho Saito, Kunihiro Okano, Kazuya Shimizu, and Motoo Utsumi. 2022. "Abundance and Diversity of Nitrifying Microorganisms in Marine Recirculating Aquaculture Systems" Water 14, no. 17: 2744. https://doi.org/10.3390/w14172744
Note that from the first issue of 2016, this journal uses article numbers instead of page numbers. See further details here.