
Inspection of Cracks in the Piston Rod of a Hydraulic Cylinder Using Injected Alternating Current-Field Measurement

1
National Center for Dam Safety Engineering Technology Research, Changjiang River Scientific Research Institute, Wuhan 430010, China
2
School of Mechanical Science and Engineering, Huazhong University of Science and Technology, Wuhan 430074, China
*
Author to whom correspondence should be addressed.
Water 2022, 14(17), 2736; https://doi.org/10.3390/w14172736
Submission received: 8 August 2022
/
Revised: 31 August 2022
/
Accepted: 31 August 2022
/
Published: 2 September 2022
(This article belongs to the Special Issue Safety Monitoring and Management of Reservoir and Dams)
Abstract
:This paper proposes a method of injected alternating current-field measurement (IAC-FM) for detecting orthogonal cracks in the piston rod of a hydraulic cylinder in a gate hoist. Using this method, both longitudinal and transverse cracks can be detected at the same time. An alternating magnetic field is produced inside the steel rod by axially injecting an alternating current into the rod. The longitudinal crack perturbs the circumferential magnetic field, whereas the transverse crack perturbs the current in the axial direction. Analyses of the behaviors of the magnetic field in the vicinity of the cracks were proposed, using a three-dimensional finite element software. An experimental setup was built and validation experiments were performed. The effects of the operating frequency and scan path were also studied. The results verified the feasibility of the IAC-FM method and showed great potential for the inspection of in-service hydraulic cylinders of gate hoists.
1. Introduction
The gate hoist is a very important mechanical structure used for opening and closing gates in water conservancy projects. A hydraulic cylinder is a vital component of a gate hoist which usually operates under load. During long-term service, both longitudinal and circumferential cracks may appear on the surface of the piston rod of the hydraulic cylinder, and affect the lifespan of the gate hoist. In-service nondestructive testing (NDT) techniques for the piston rods are in great need in the industry.
The harsh environmental conditions, metal coating and mud covering of in-service hydraulic cylinders of gate hoists makes the inspection difficult. Many conventional NDT methods face challenges when applied to the piston rod of a hydraulic cylinder. Machine vision methods can be applied to inspect cracks in piston rods [1,2]. The inspection has high sensitivity and efficiency, however, if dust, mud and oil are covering the surface, the results may become unreliable. Many other electromagnetic NDT methods, such as eddy current testing (ECT) and magnetic flux leakage (MFL) testing can also be applied to detect surface cracks. In the MFL method, a magnetizer consisting of magnets or coils is required [3,4,5,6]. To magnetize the steel bar into saturation, the magnetizer usually has a large size and weight. Thus, they are not suitable for in-service inspection. ECT has also been applied to test steel specimens [7,8,9], whereby the probe is placed above the specimen surface. Due to the existence of metal coating, part of the energy is absorbed and the testing signal is affected.
In order to reduce the influence of surface coverage, an injected alternating current-field measurement (IAC-FM) method is proposed in this paper. Instead of excitation coils and magnetizers, an alternating current is directly injected into the piston rod to magnetize it uniformly. The technique of directly injecting a current into a specimen has been used in some previous studies, especially the direct current potential drop (DCPD) and alternating-current potential drop (ACPD) [10,11,12,13]. In some other studies, after injecting a current into a specimen, either the magnetic field or electric field above the specimen is extracted to evaluate the defects [14,15,16]. In this study, an alternating current is injected into the piston rod axially. According to the Biot–Savart law, magnetic fields are generated in the circumferential direction. Since defects are easier to detect when they are perpendicular to the source field, the IAC-FM method is suitable for the inspection of longitudinal cracks with magnetic field perturbation and transverse cracks with current perturbation.
The remainder of the paper is organized as follows. In Section 2, the distribution of currents and magnetic fields are analyzed. Section 3 presents the finite element simulation results to show that cracks in both directions can be detected. Finally, experimental verification of the IAC-FM is presented and the effects of operating frequency and scan path are discussed.
2. Theories of IAC-FM
In the proposed IAC-FM method, currents are injected directly into the rod. Thus, the current is in the axial direction whereas the magnetic field is in the circumferential direction. These characteristics provide the benefit of simultaneously detecting longitudinal and transverse cracks at the same time. In order to better illustrate the distribution of the electromagnetic fields, a theoretical model is developed in this section.
2.1. Theoretical Model
The piston rod is regarded as an infinitely long cylindrical conductor with a radius of R, as depicted in Figure 1. Since the current is injected along the axial direction, J has only z component Jz. According to Maxwell’s equations and Ohm’s law, the magnetic vector potential A in the conductor conforms to the following equation [17]
where ω, μ and σ are angular frequency, magnetic permeability and electrical conductivity, respectively, j is the imaginary number.
Expand Equation (1) in cylindrical coordinates, the following equation can be obtained:
According to Ohm’s law and Faraday’s law of induction, the vector potential A and current density J satisfy: J = σE = −jωσA, where E is the electric field. Thus, A only has only z component Az. Then, Equation (2) can be simplified as:
According to the general solution to Bessel equation, Az can be expressed as
where , J0(.) is the zero order Bessel function of the first kind and Y0(.) is the zero order Bessel function of the second kind. According to the property of Bessel functions, Y0(x) goes to infinity when x approaches 0. To guarantee the convergence of Az at r = 0, C2 must be equal to 0. Then, Equation (4) can be written as:
Accordingly, . Assume the current density at r = R is JR, then the boundary condition is , and Jz can be expressed as
It is known that the total current inside the rod is I. JR can be obtained by integrating the Equation (6):
Therefore, the current density at any position of the rod can be expressed as
The magnetic flux density B satisfies , thus B has only φ component Bφ, which can be expressed as
To sum up, the current density and magnetic flux density in the cylindrical conductor are:
2.2. Distribution of Eddy Current and Magnetic Field
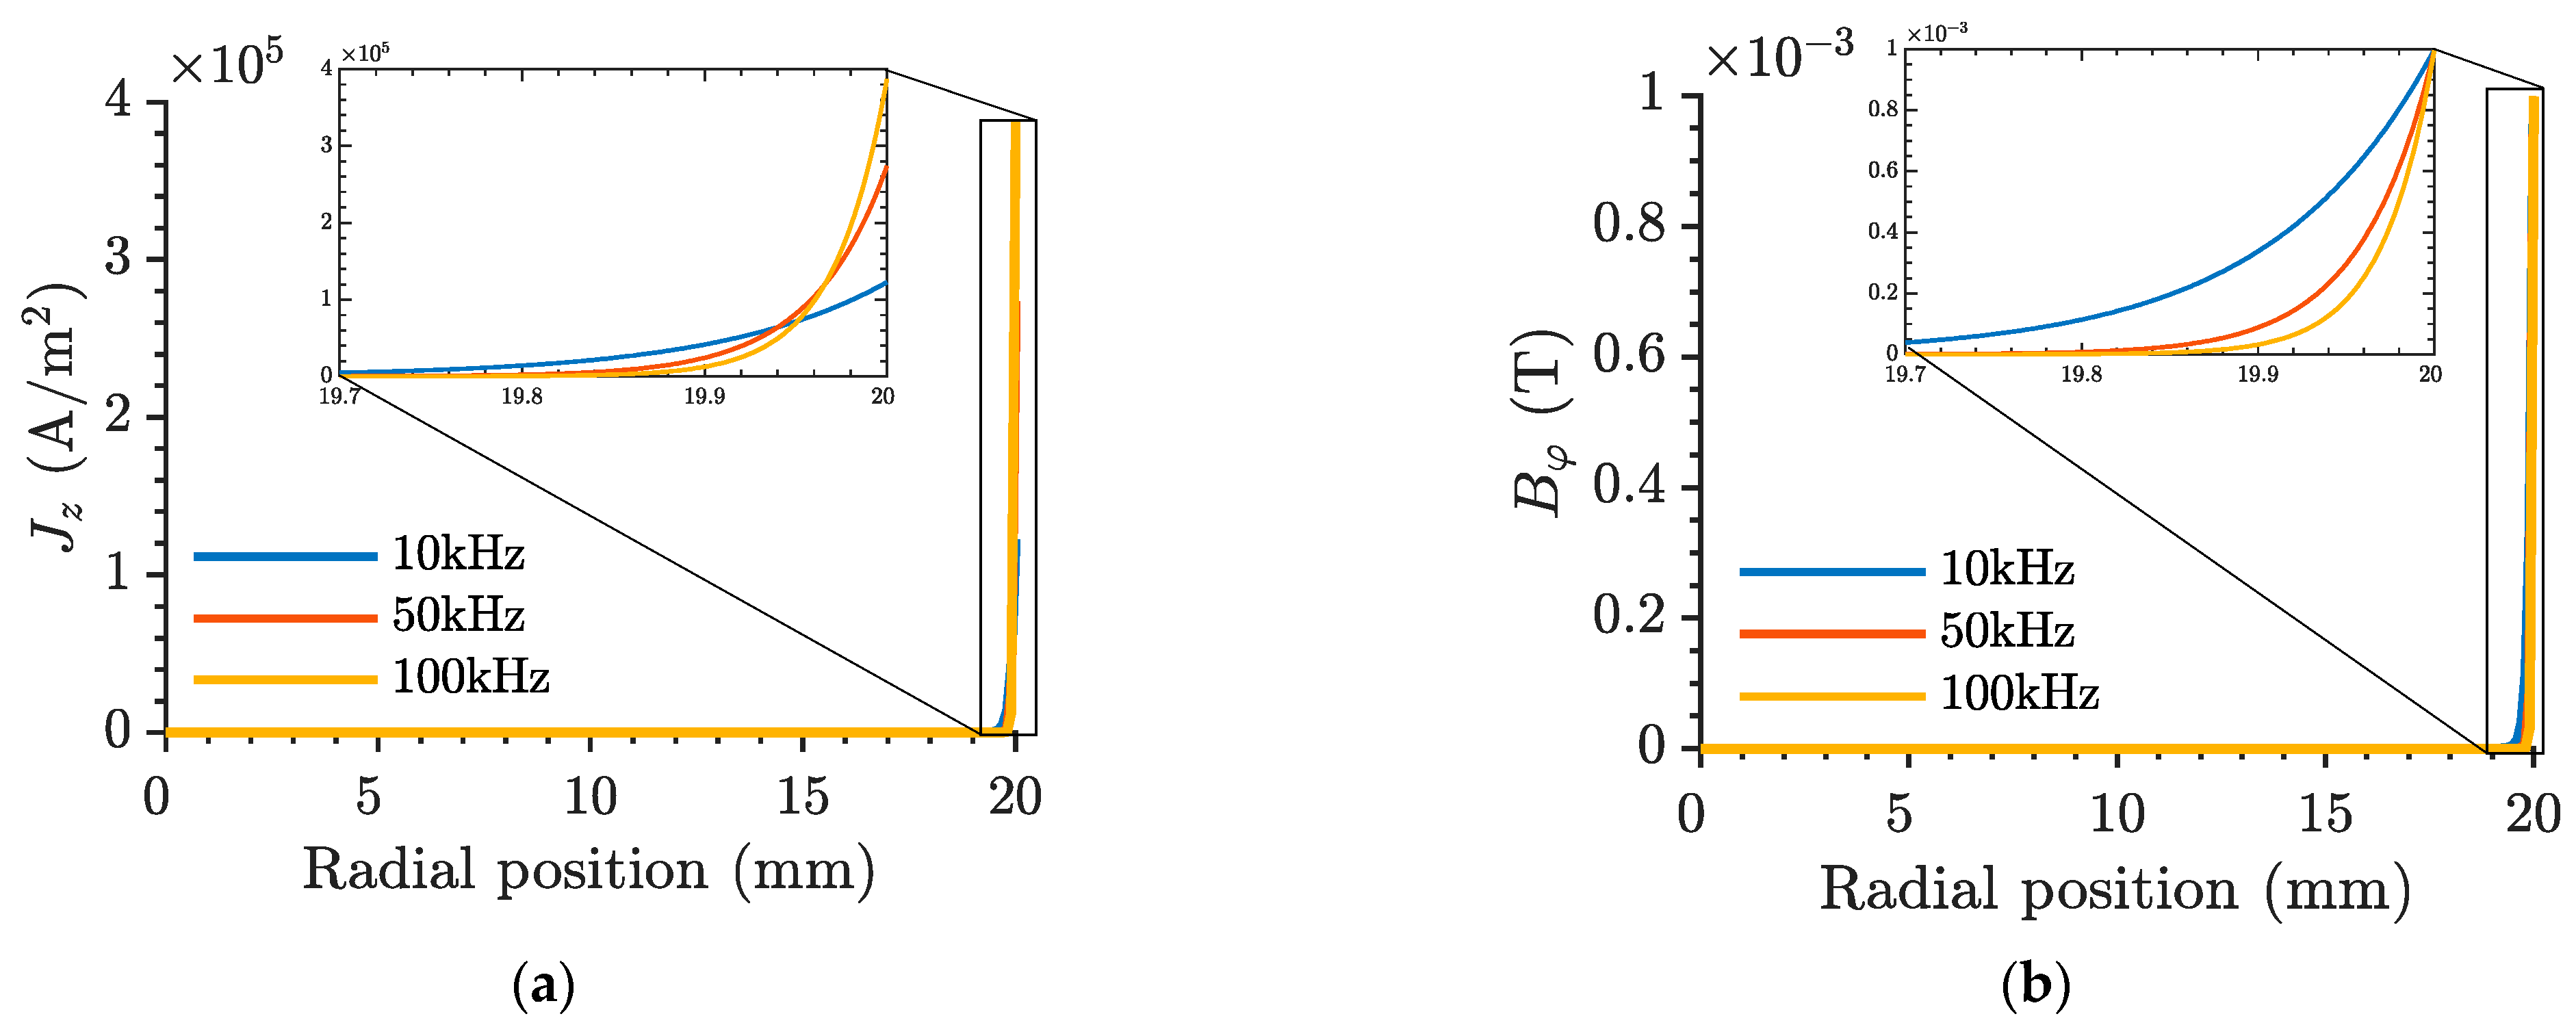
In order to graphically illustrate the distribution of eddy currents and magnetic fields, specific values were considered to perform the numerical calculation. The radius of the rod was set to 20 mm and the relative permeability and conductivity were set to 100 and 3 × 10⁷ S/m. The frequency of alternating current was set to 10 kHz, 50 kHz and 100 kHz, and the total current was 1 A. The variations of Jz and Bφ with the radius are shown in Figure 2. It can be concluded from Figure 1 and Figure 2 that the magnetic field and current are both concentrated on the surface of the rod, which is beneficial for the inspection of surface cracks. In addition, the magnetic field and current are in orthogonal directions, making the detection of both longitudinal and transverse cracks possible.
3. Finite Element Simulation
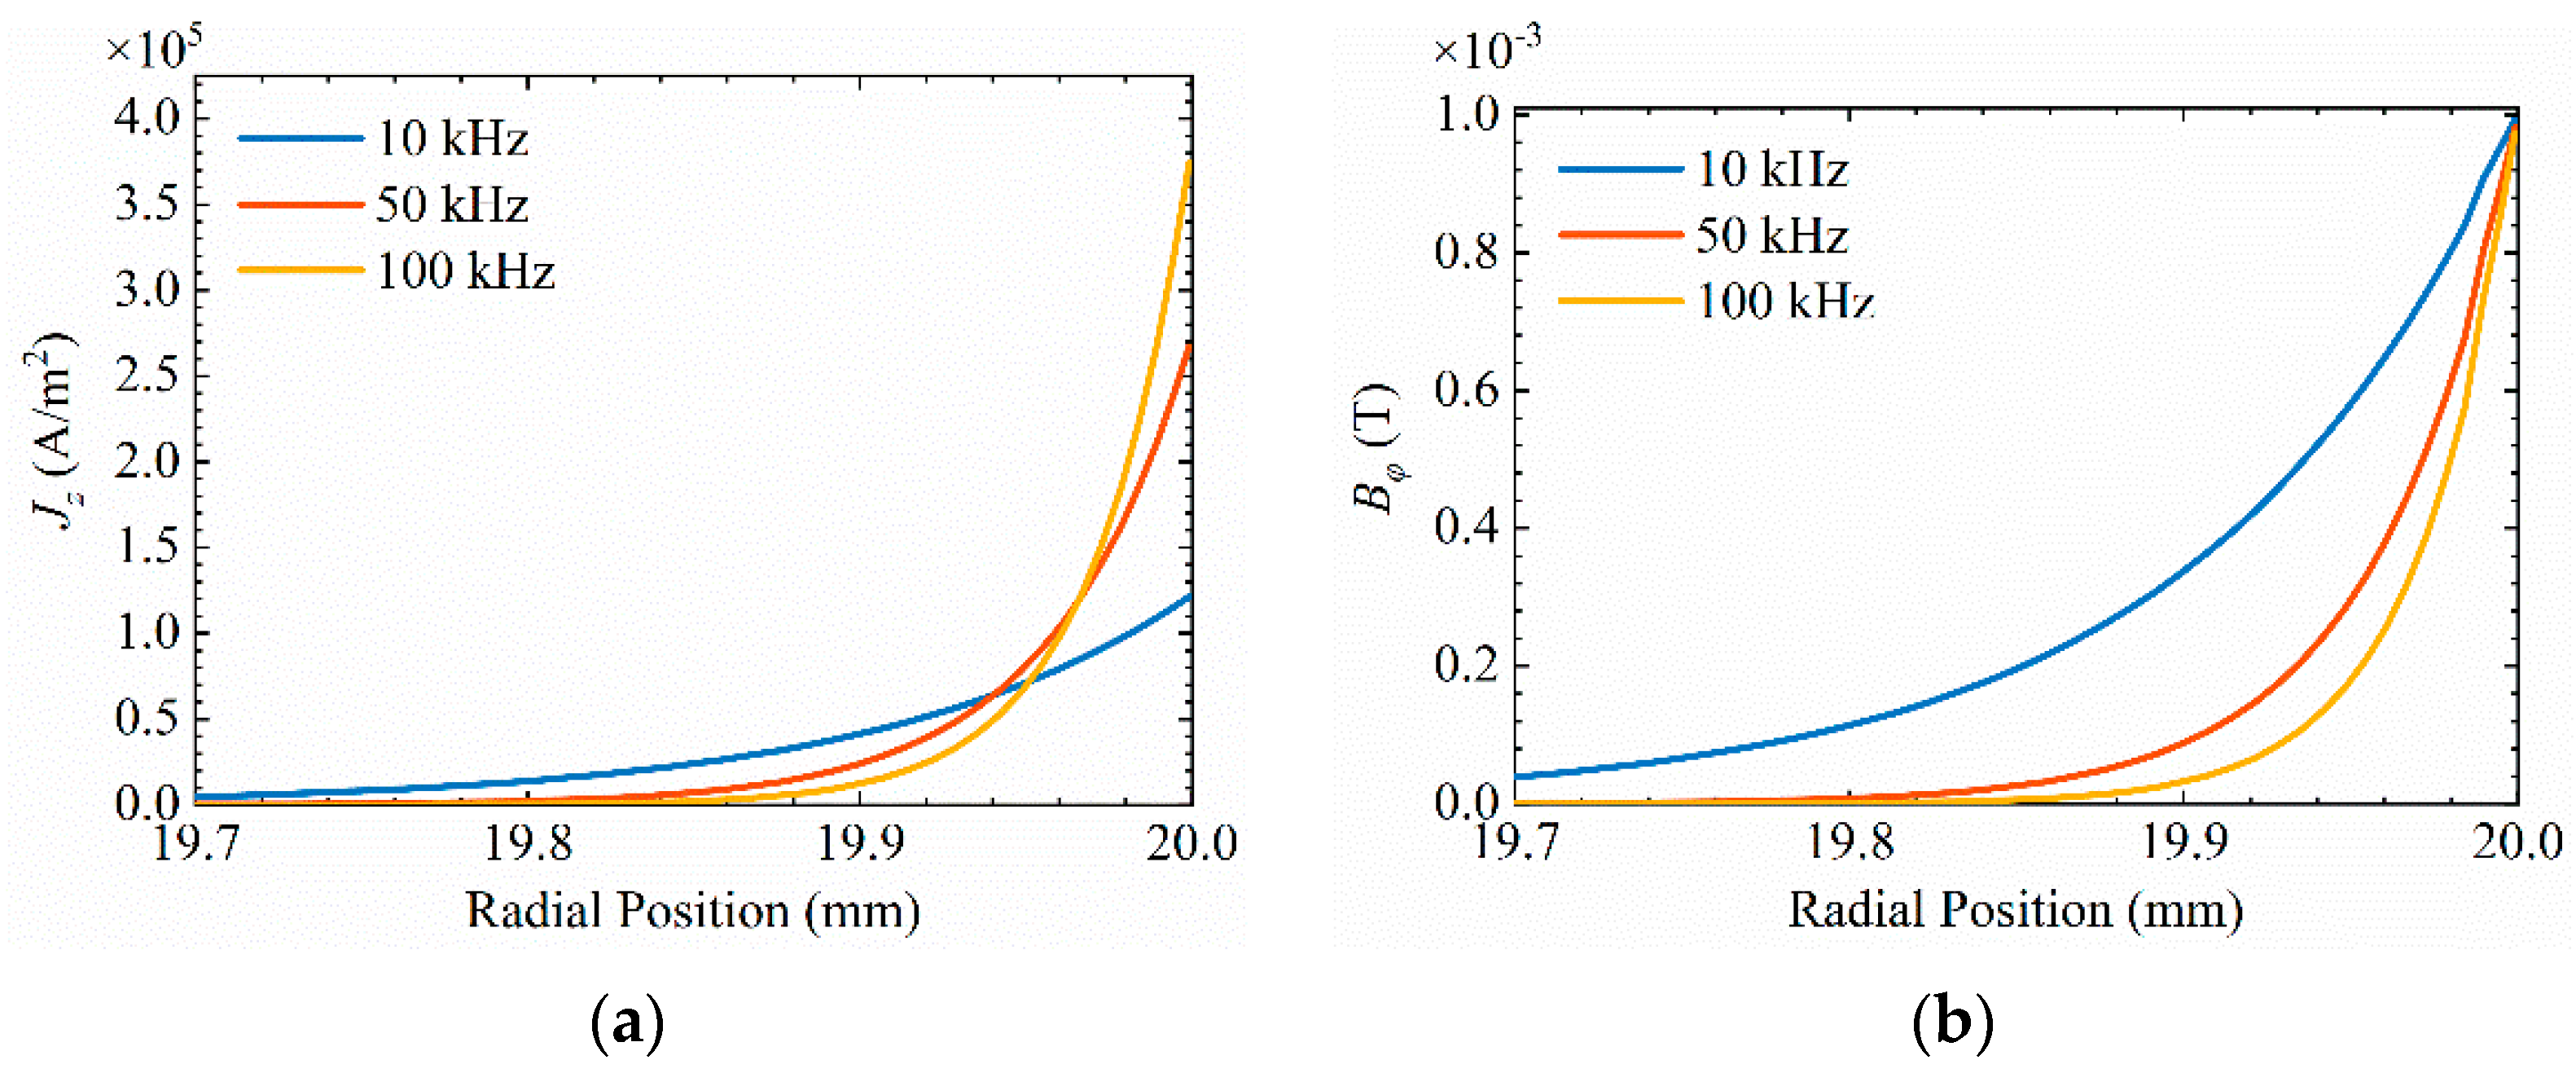
It is relatively difficult to include defects in the theoretical model due to the complex boundary conditions. Thus, finite element simulation was further carried out to analyze the characteristics of defect signals. Before applying finite element simulation to rods with cracks, a cross-verification was made for fields in intact rods between analytical model and finite element simulations. A simulation was performed with the same excitation parameters and material properties used in the analytical model, and the results are shown in Figure 3. It can be seen that these results are in agreement with the results obtained from the analytical model (insets of Figure 2).
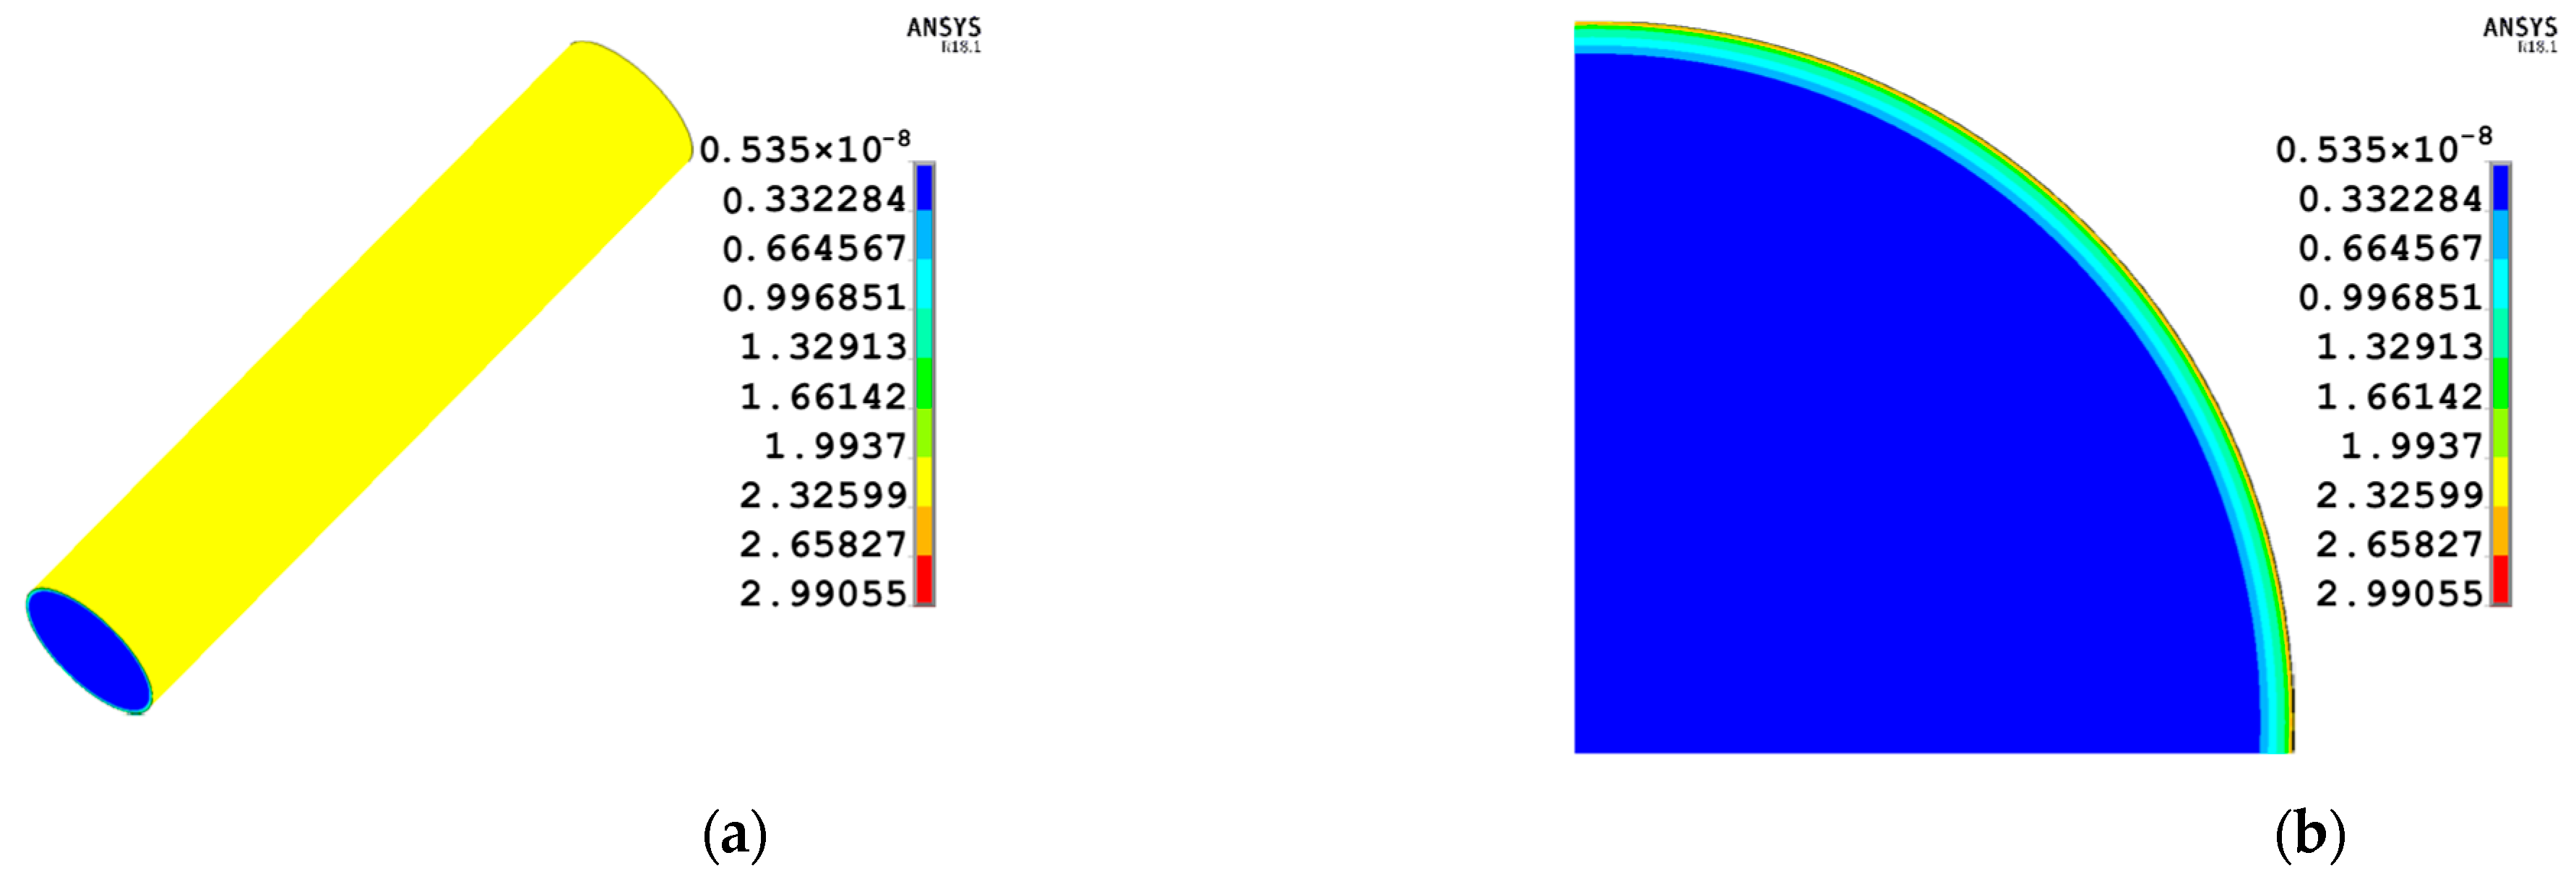
A 100 × Φ20 mm piston rod was also constructed in the simulation, with an alternating voltage of 10 kHz and 1 V. The contour plot of the magnetic field is shown in Figure 4. As we can see, the magnetic field distributes uniformly along the circumference and concentrates at the rod surface.
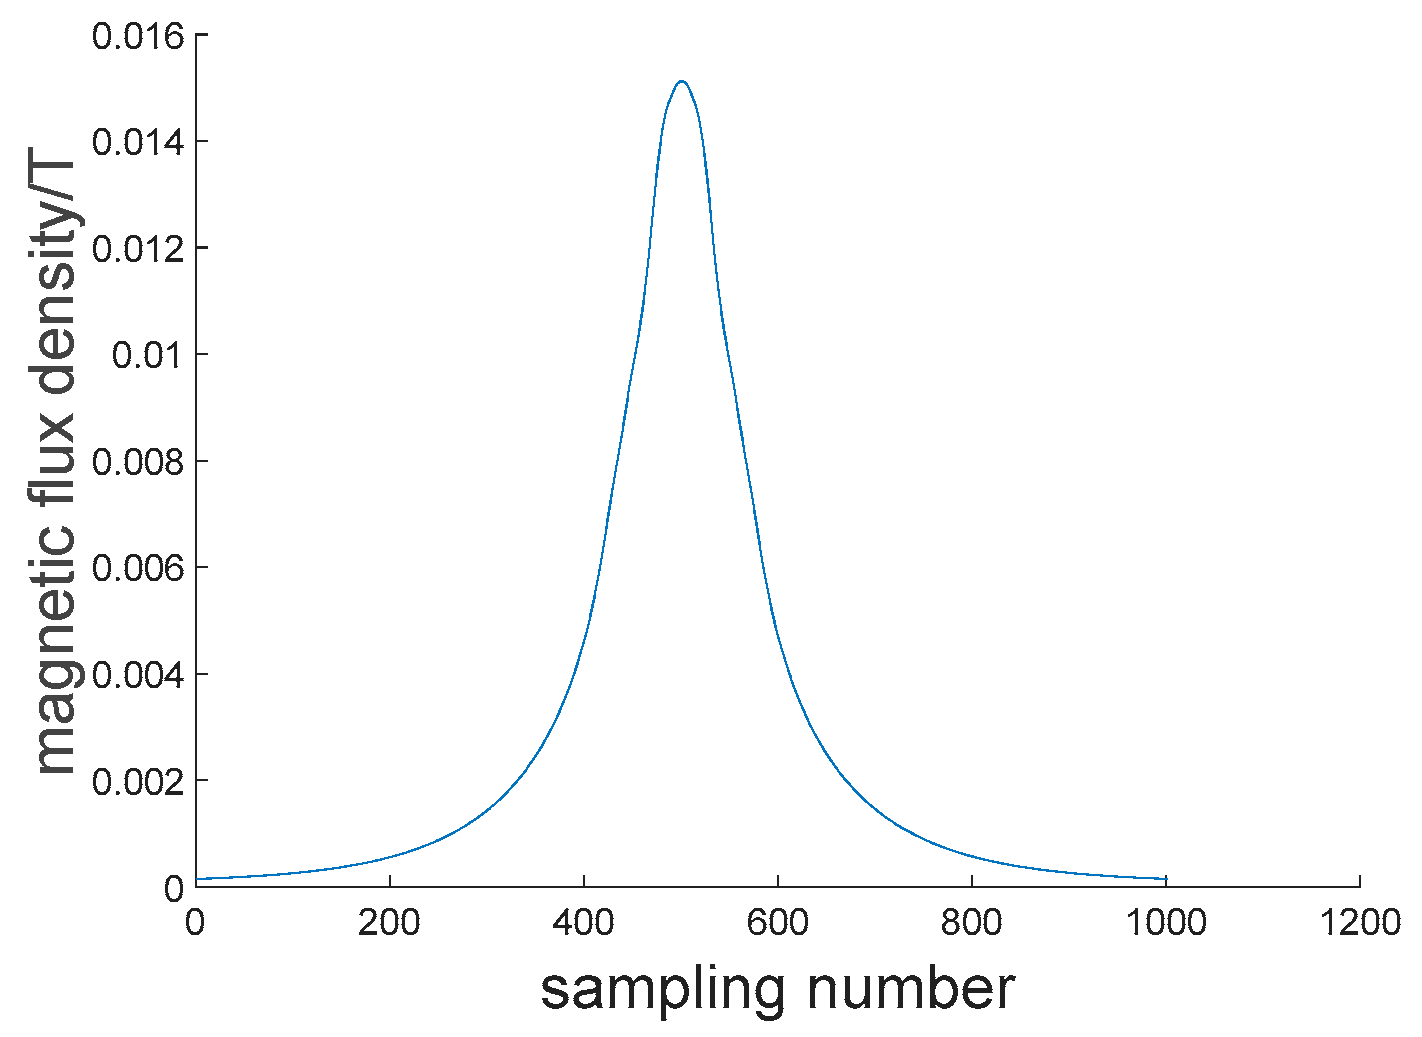
To further study the signal characteristics, a longitudinal crack with the dimension of 7 mm (length) × 1 mm (width) × 1 mm (depth) was created in the piston rod, and the magnetic field above the crack was extracted with a lift-off of 0.4 mm. The extracted signal is shown in Figure 5, where the peak of the signal corresponds to the center of the crack. In the region away from the crack, the most magnetic flux concentrated in the steel rod due to its high permeability, thus the magnetic field extracted above the rod has relatively small value. In the region around the crack, the change of magnetic reluctance forces the magnetic field to leak into the nearby air, and causes the increase of magnetic flux density in the signal.
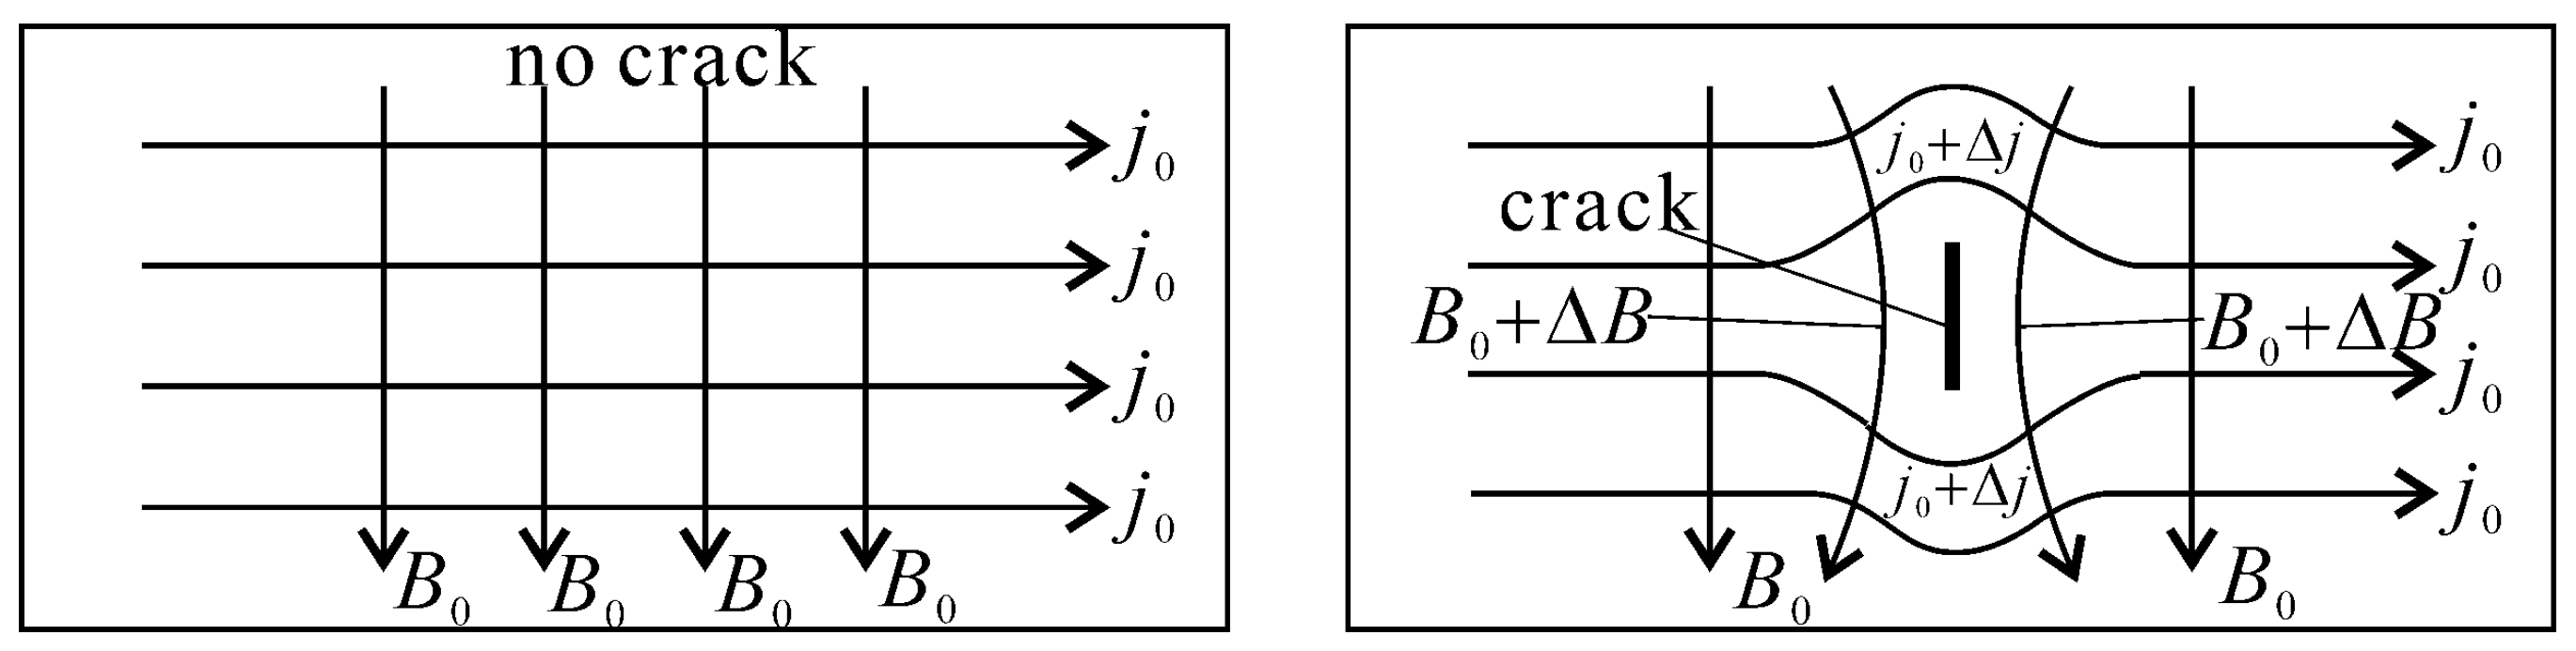
For transverse cracks, since the magnetic field was parallel to the crack, little perturbation occurs. However, the variation in the magnetic field produced by the perturbation of the current is distinct. Figure 6 shows the principle of current perturbation. By injecting an alternating current (current density j0) into the steel bar, an alternating magnetic field B0 will be produced around the workpiece in the air. In the area without cracks, the current density is uniform. When the current flows around the vicinity of the transverse crack, it will not only be disturbed but also change the exterior magnetic field, with Δj and ΔB produced, which can be obtained by coils scanning axially over the crack.
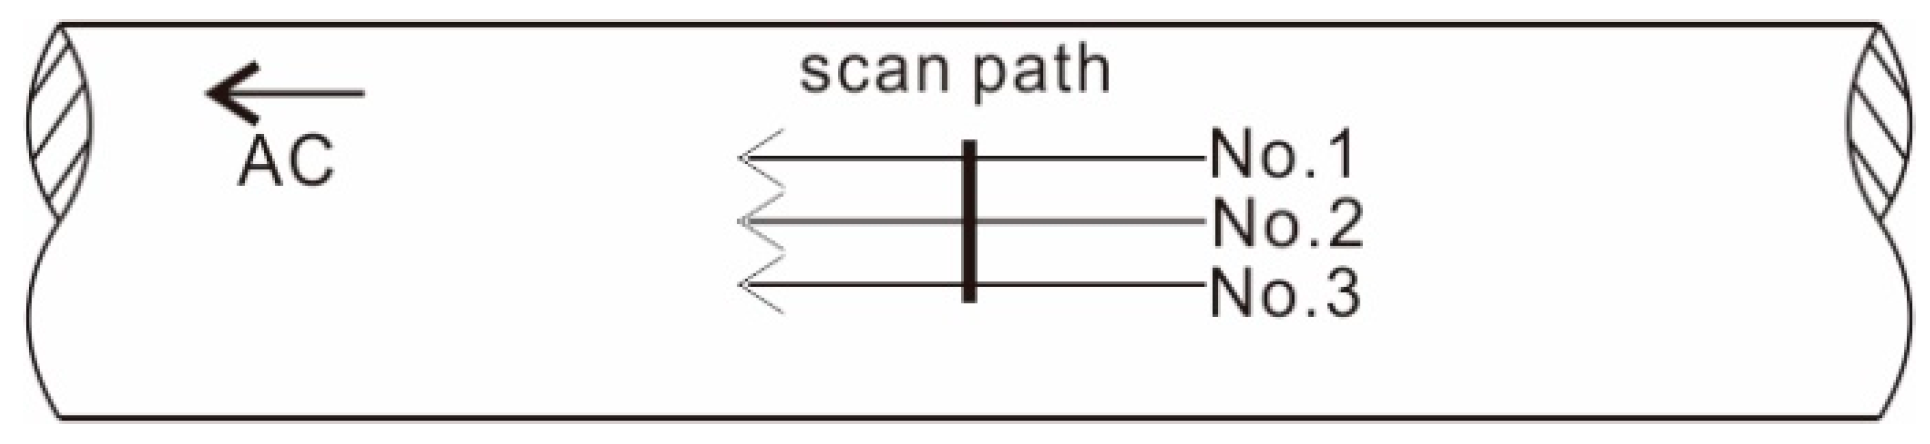
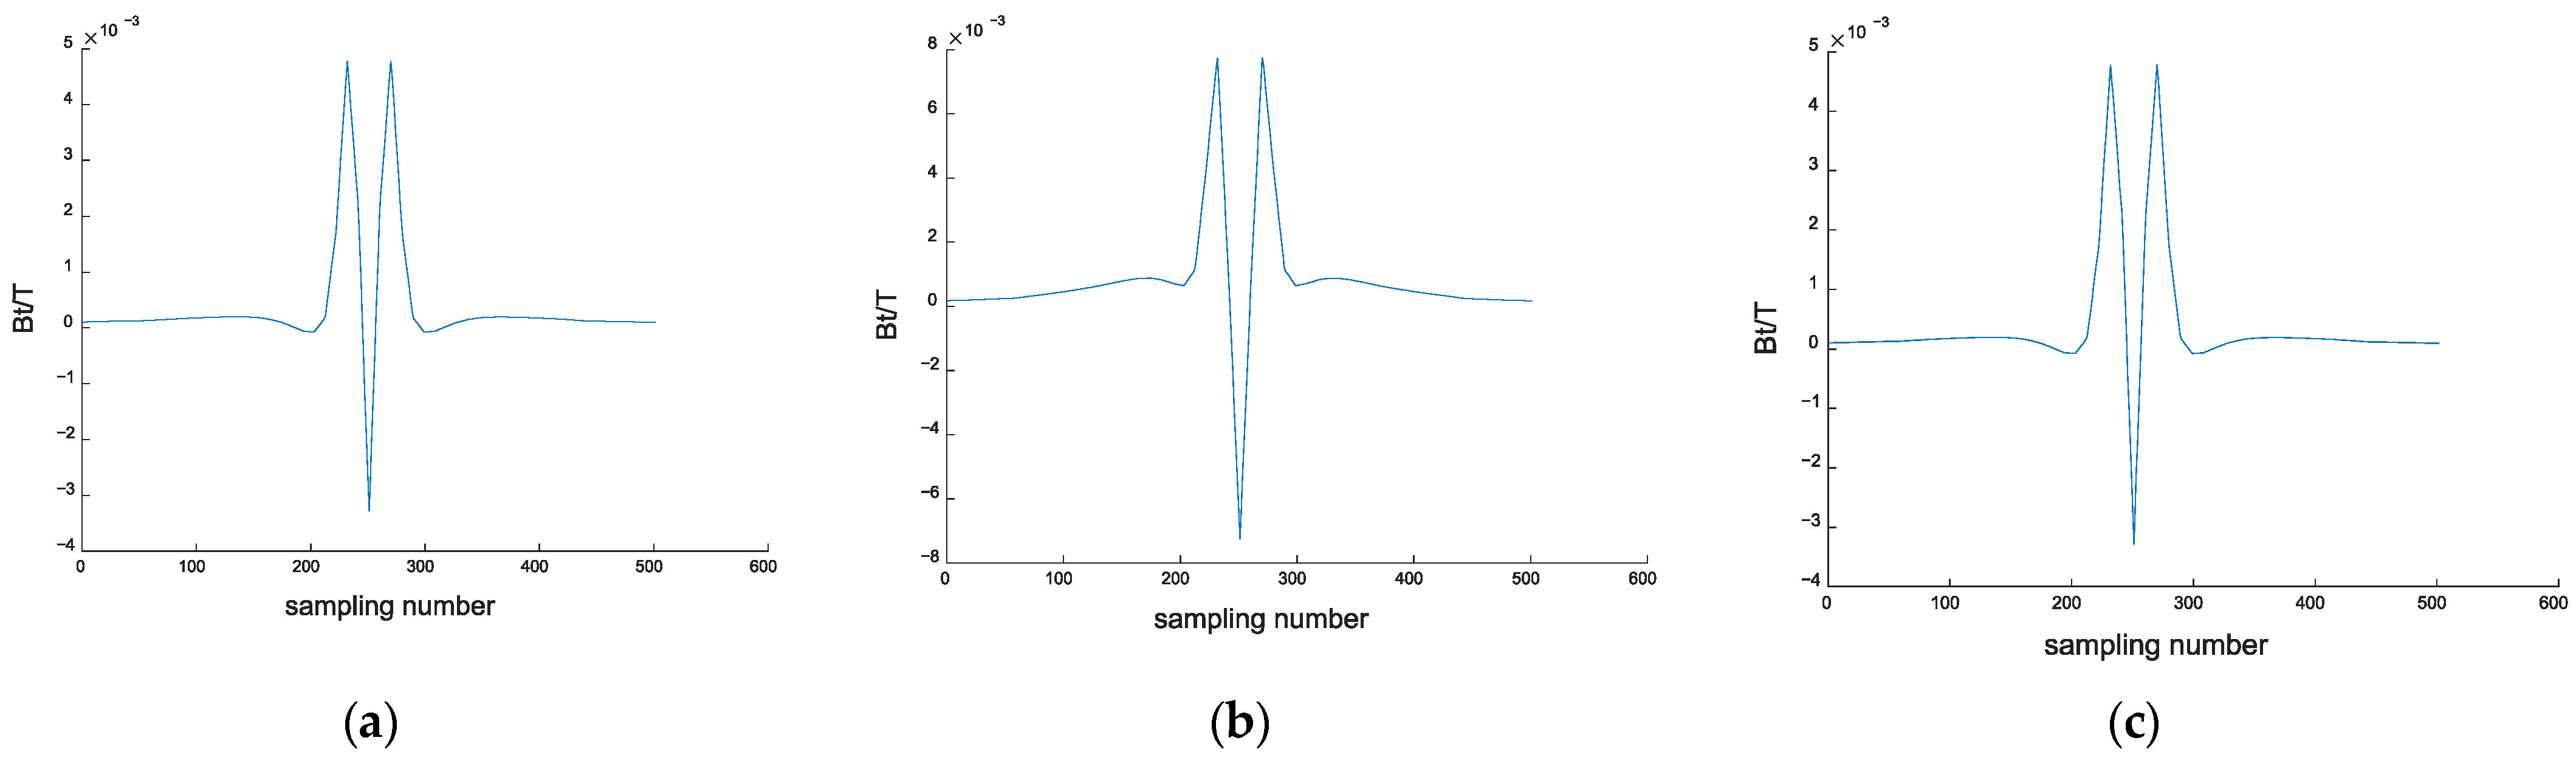
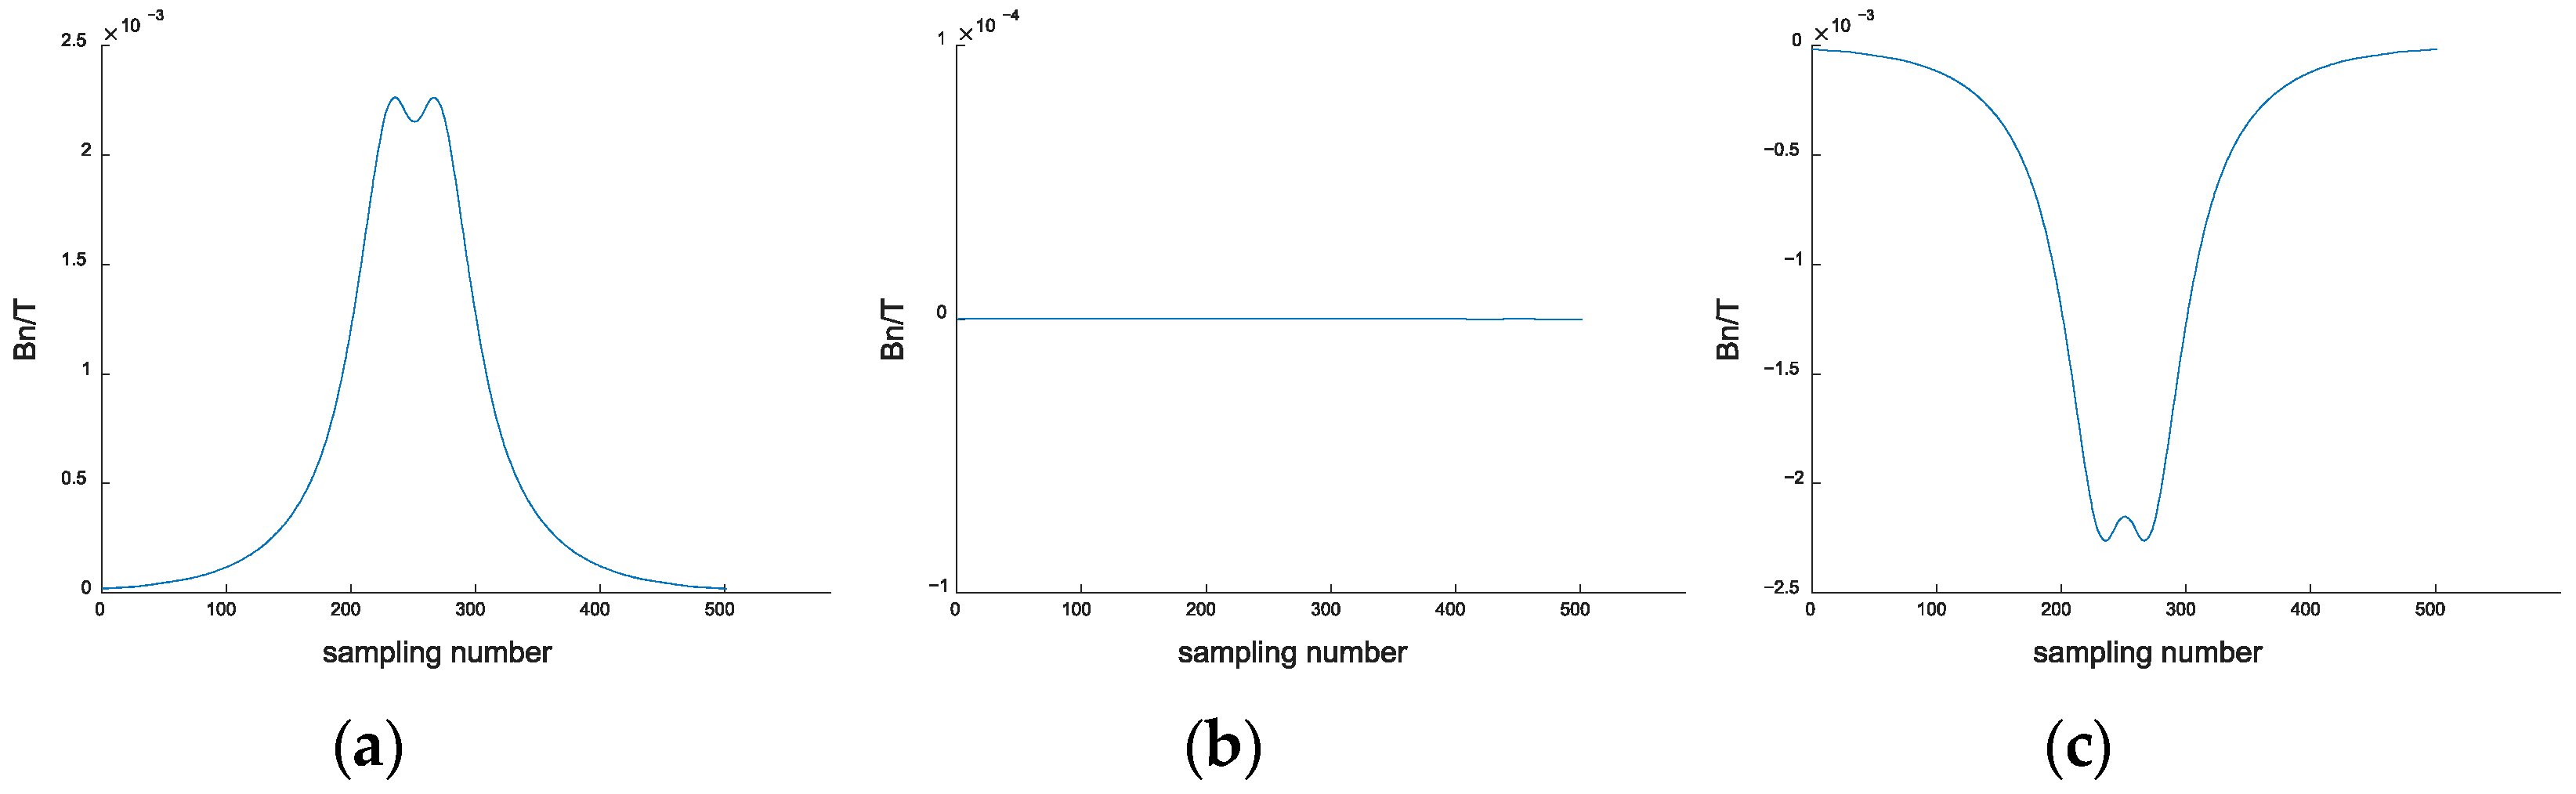
In the simulation for transverse crack testing, three scanning paths were set above the crack. Path No. 2 was above the center of the crack. Path No. 1 and No. 3 were above the crack edges, both 3 mm away from path No. 2, as shown in Figure 7. The tangential magnetic field (Bt) and normal magnetic field (Bn) in three paths is shown in Figure 8 and Figure 9. In the region away from the crack, the current distributed uniformly, so the extracted magnetic field was a constant value. In the vicinity of the crack, the currents passed around the crack from its ends and bottom and caused perturbation to the magnetic field above the crack. In the center of the crack, the currents mainly bypassed the crack from the bottom, thus were still in the axial direction. Accordingly, there was no magnetic field perturbation for Path No. 2.
4. Experiments and Discussion
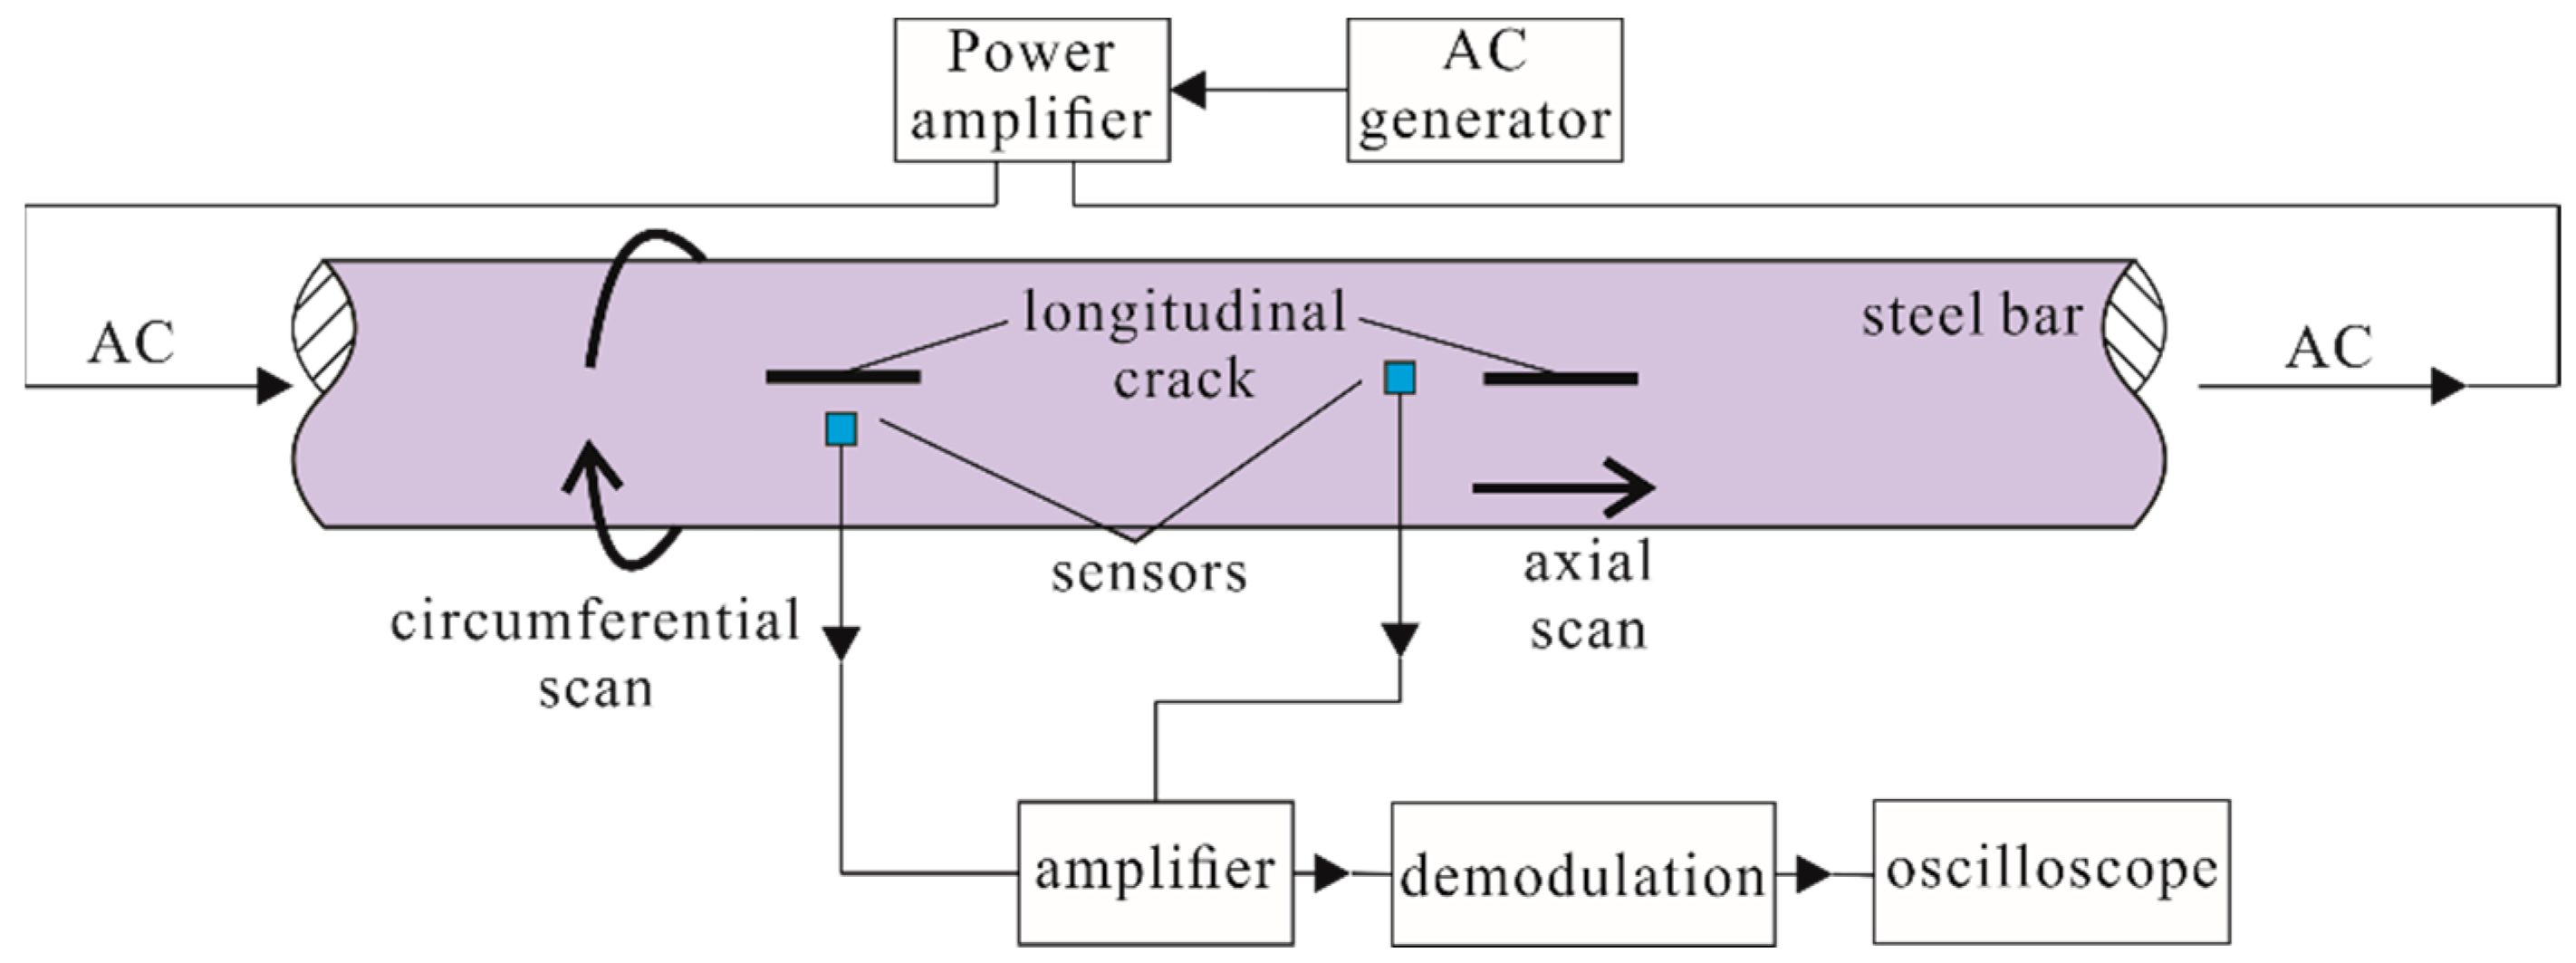
In order to verify the abovementioned principle, an experimental setup was built as shown in Figure 10. The length of the standard crack is 10 mm, width is 0.5 mm and depth is 0.5 mm. A 100 × Φ20 mm piston rod with a standard longitudinal crack and a standard transverse crack was used as testing piece. An alternating current was injected into the steel bar from the two ends. The voltage between the two ends was 1 V. The magnetic sensor was a 3 mm (diameter) × 1 mm (height) × 0.08 mm (wire diameter) inductance coil with 50 turns.
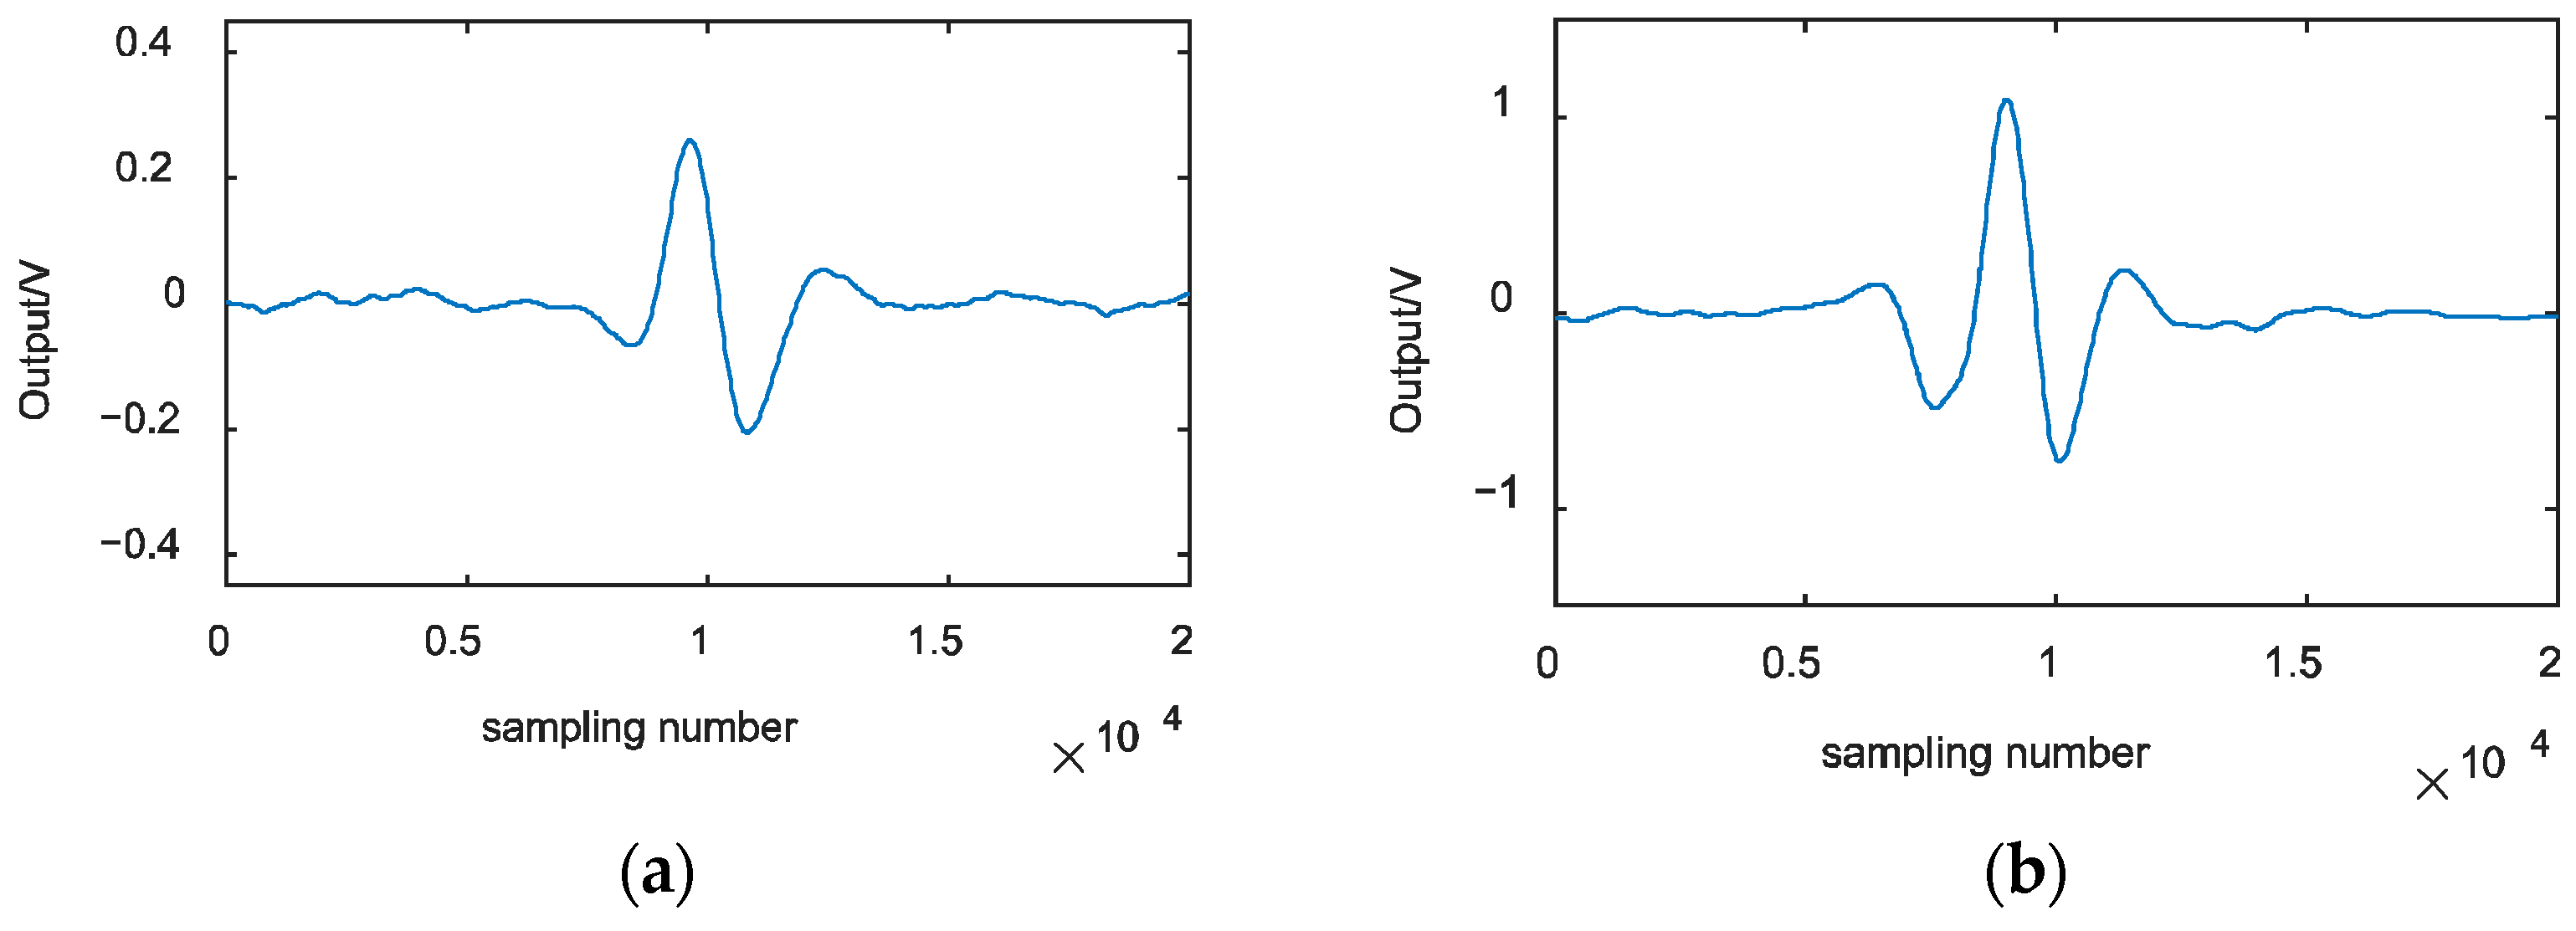
The results of the experiments are shown in Figure 11. The coil axis is along the tangential line of the rod surface. The scan paths of both longitudinal and transverse cracks are above the center of the cracks. This indicates that the IAC-FM method is able to detect the longitudinal and transverse cracks at the same time.
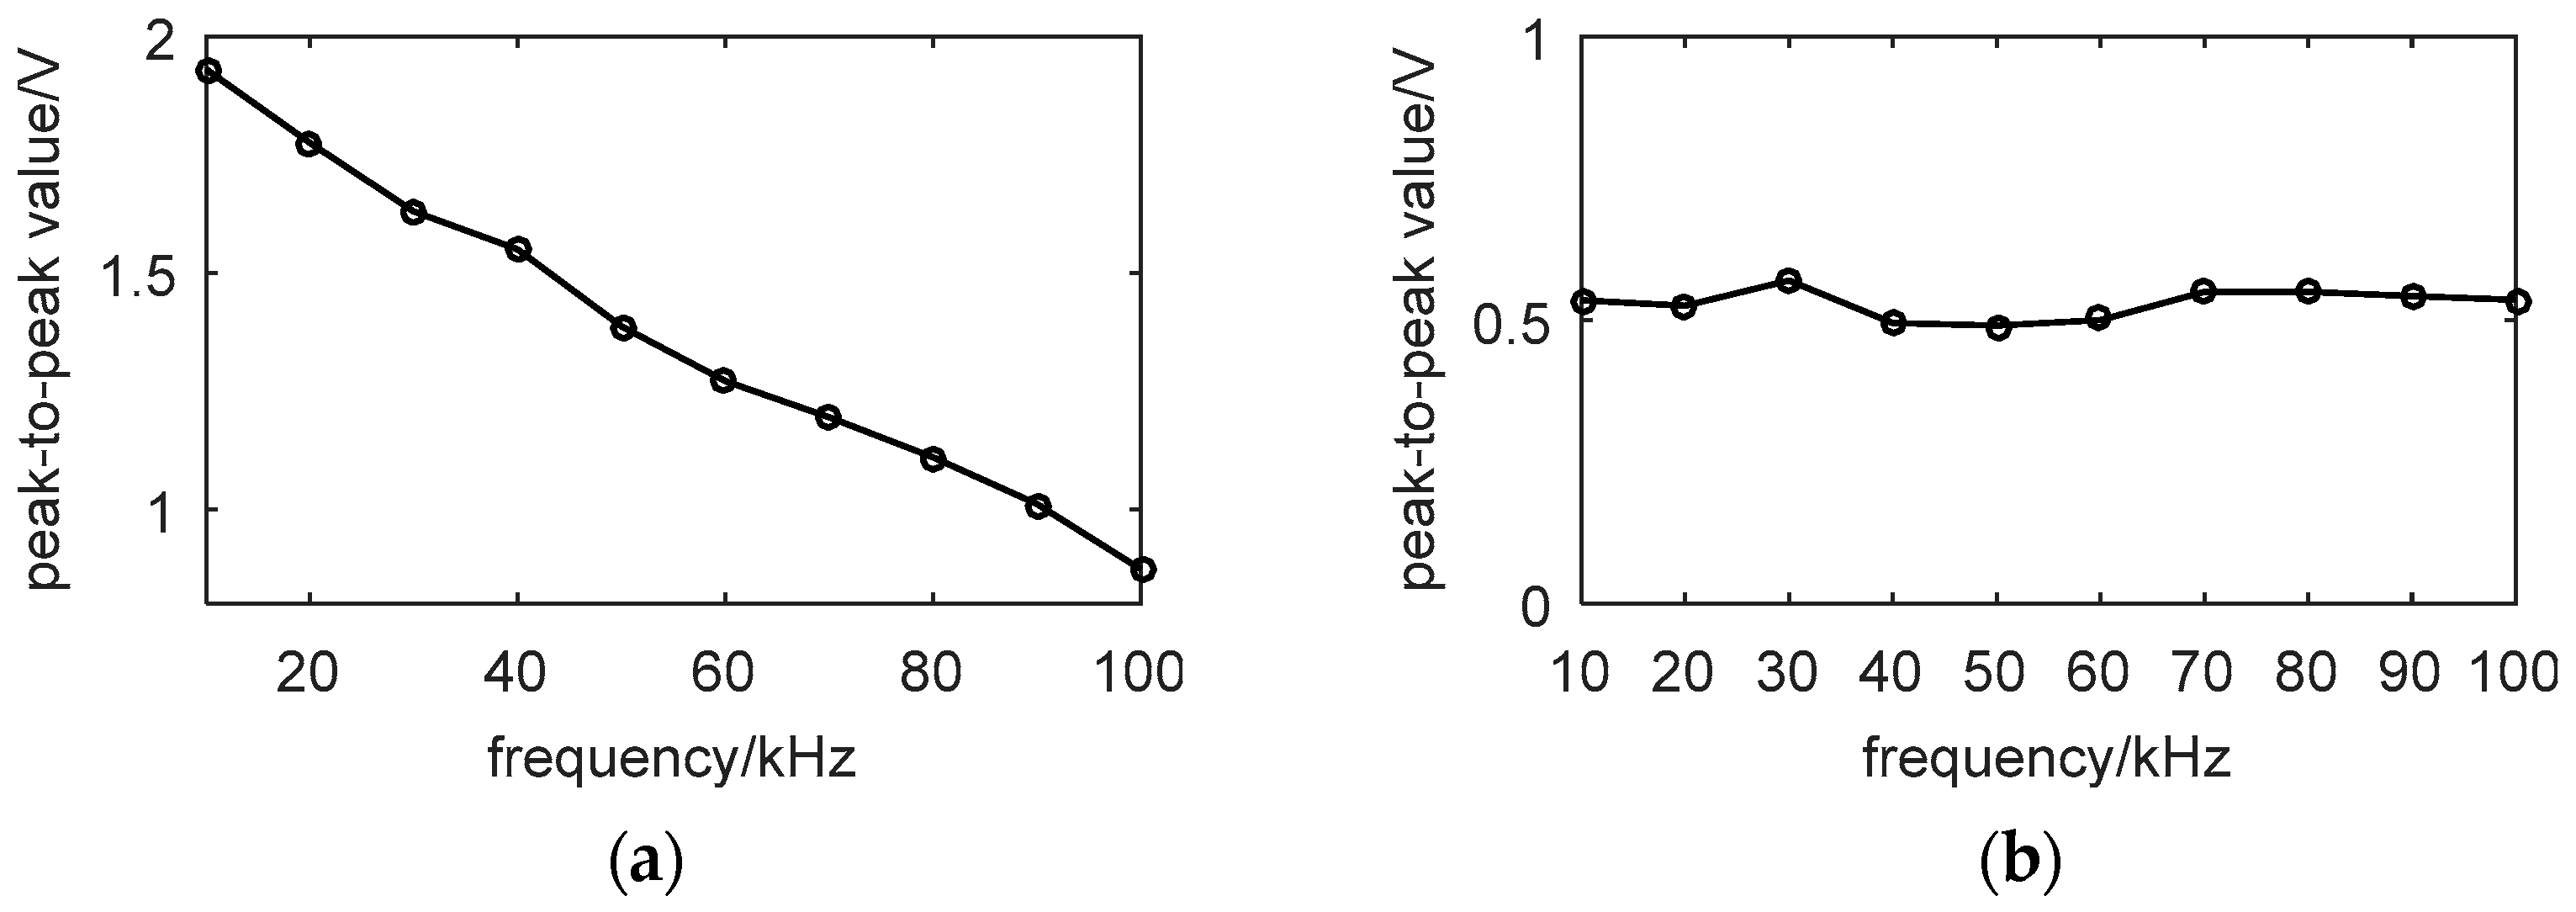
In the IAC-FM method, the injected alternating current plays an important role in the excitation. Hence, the optimal operating frequency is significant for the detection sensitivity. Frequencies from 10 kHz to 100 kHz with an interval of 10 kHz are compared for the detection of both longitudinal and transverse cracks. The amplitude of the output voltage of the testing signal determines the detection sensitivity. The results in Figure 12 indicate that the output of the longitudinal crack testing signal decreases with its frequency. Although the current density increases with the frequency on the surface, the voltage of the AC generator is fixed in this experiment, which causes a decrease in the output of the longitudinal crack. The results of the transverse crack show that it is not affected by the frequency in this condition.
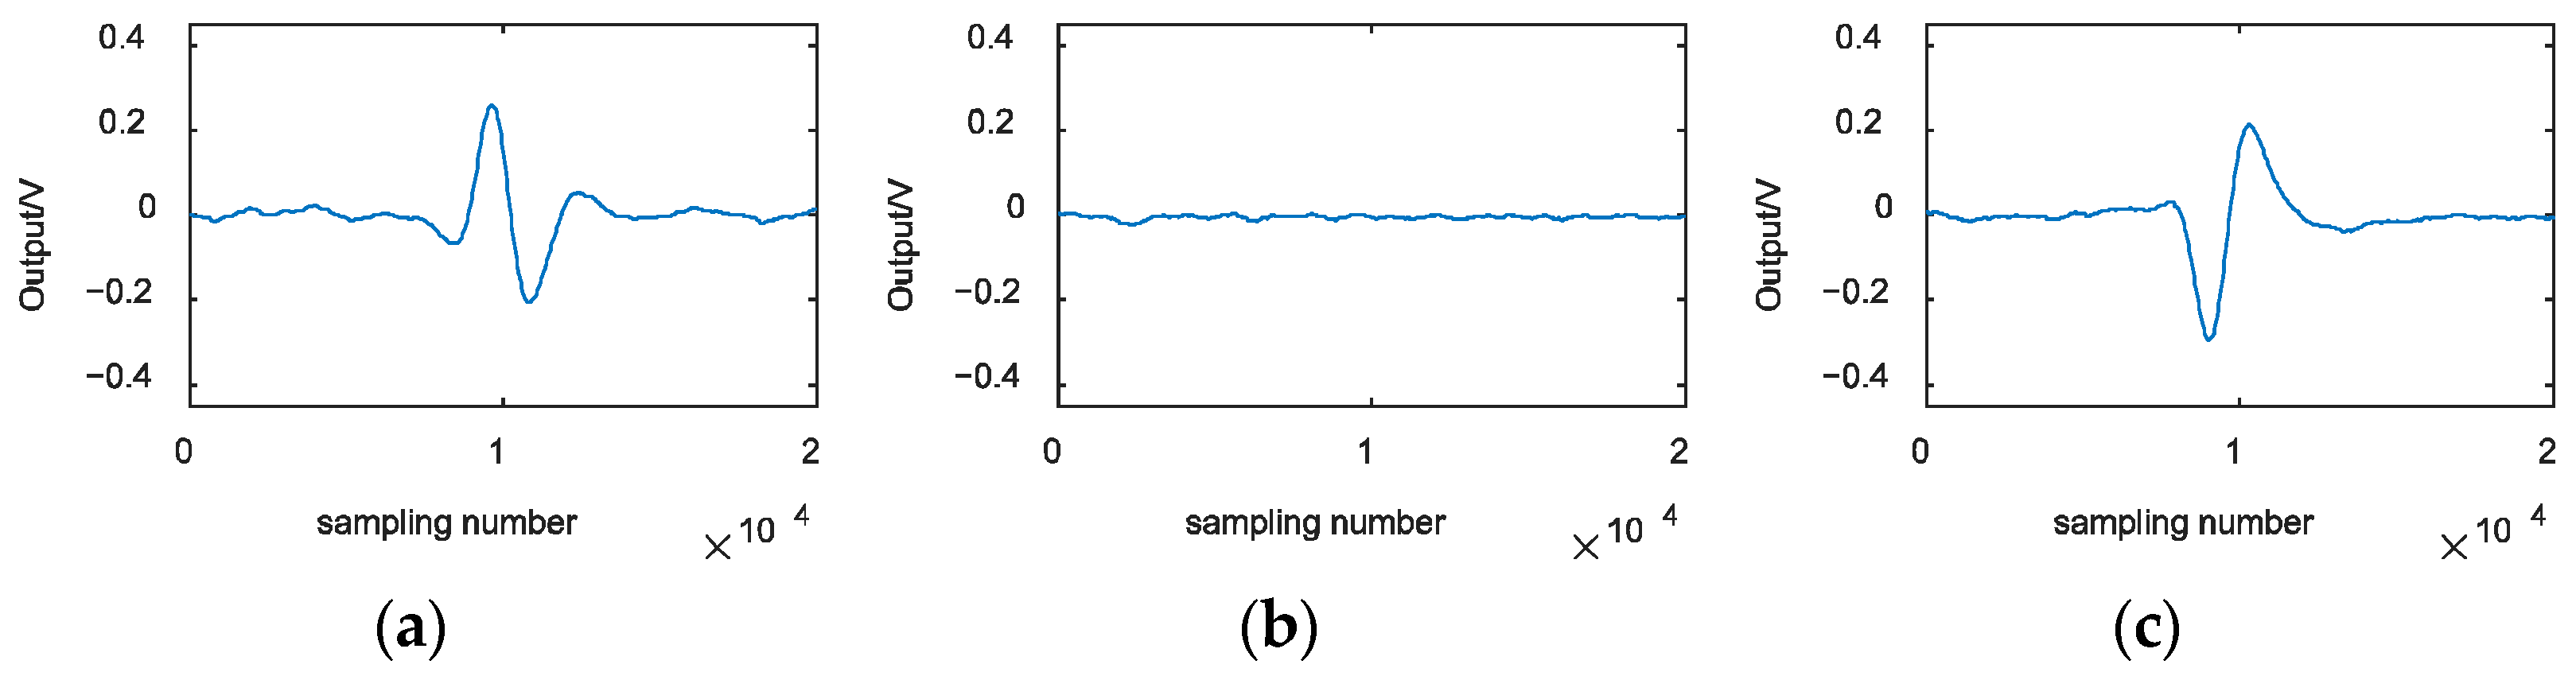
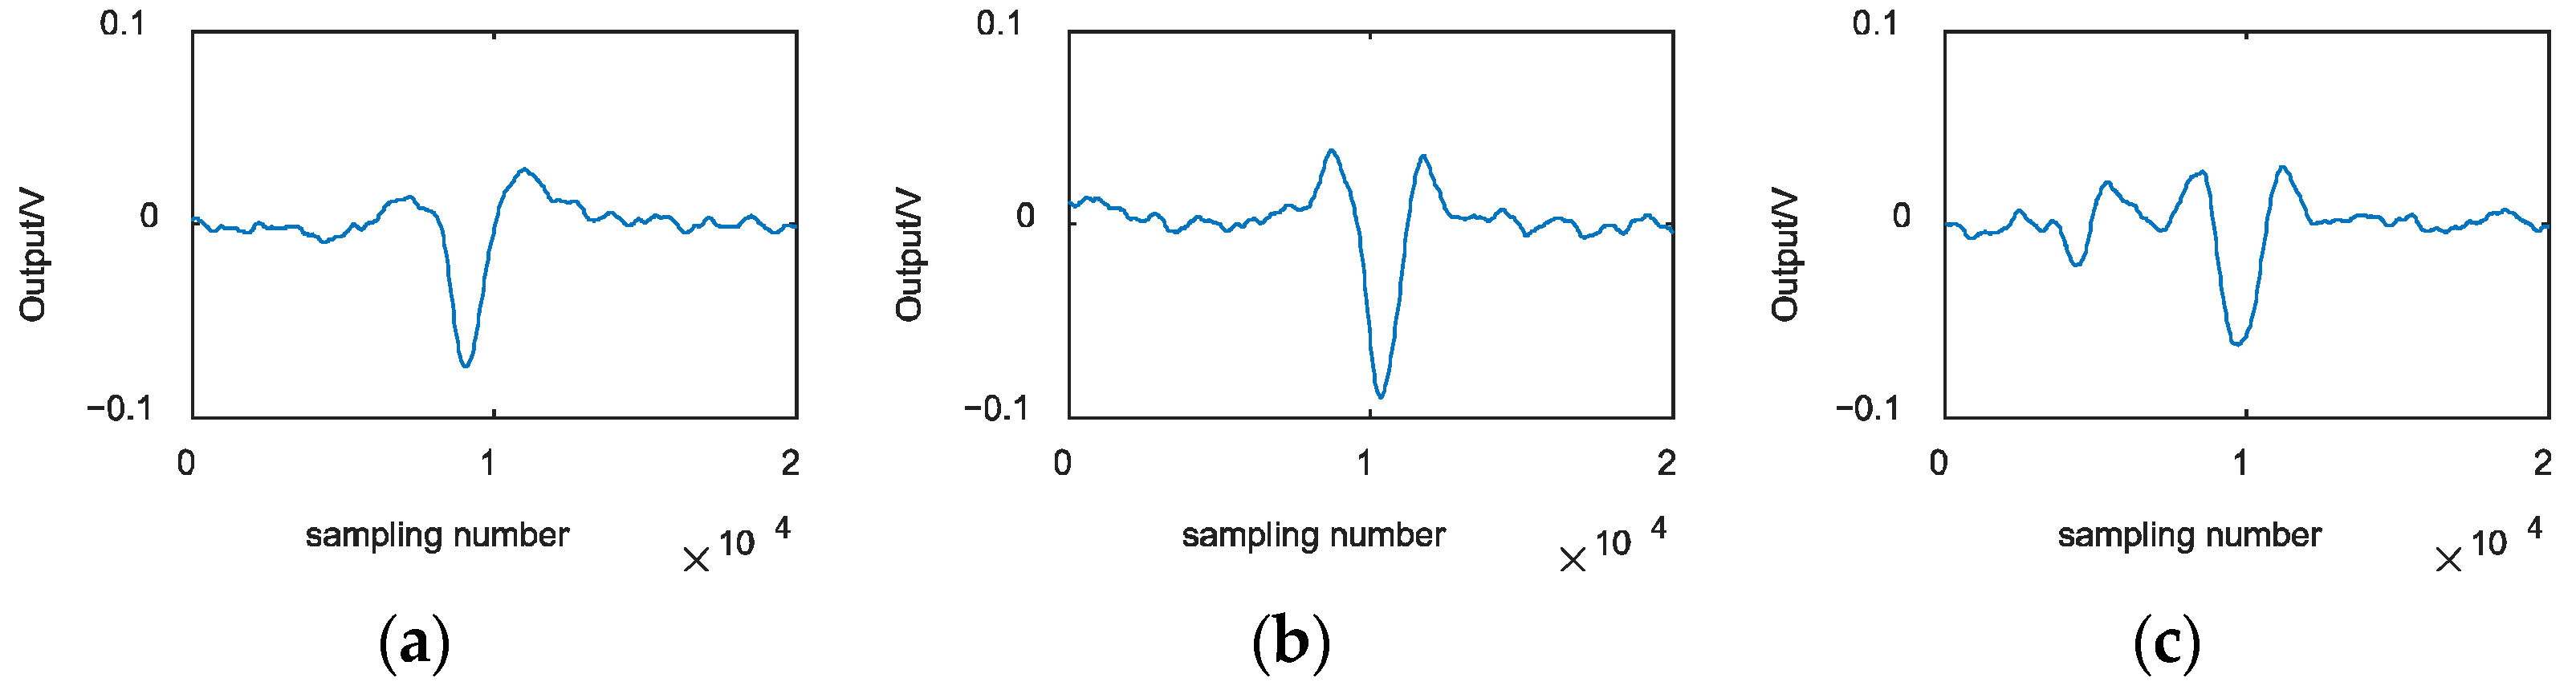
From the simulation results of transverse crack testing, the testing signal is dependent on the scan path. To obtain the Bn and Bt in the experiment, two coils were used. One coil had its axis along the normal direction to obtain Bn and the other had its axis along the tangential direction to obtain Bt. Similar to the simulation condition, three scan paths were set as comparisons. Path B was above the center of the crack. Path A and Path C were, on the other hand, both 2.5 mm away from Path B. The lift-off values of all paths were the same as 0.4 mm. The results are shown in Figure 13 and Figure 14. From the experiment results and simulation results, the signal features agree with each other. Through these features of the magnetic field, cracks can be quantitatively evaluated.
5. Conclusions
The principle of IAC-FM is analyzed in this paper. Based on Maxwell’s equations, a theoretical model was built that gives the distribution of a magnetic field and current when there is no crack in the piston rod. The results show that the magnetic field is along the circumferential direction and the current is along the axial direction. Most magnetic field and currents concentrate in the rod surface at 0.3 mm under the excitation frequencies from 10 kHz to 100 kHz. From the 3D FEM simulation results and the experiment results, it is shown that cracks with a depth of 0.5 mm can be easily detected, in which the longitudinal crack can be detected due to the perturbation of magnetic field, and transverse cracks can be detected due to the perturbation of current. The study of the influence of excitation frequency showed that the testing signal of longitudinal cracks decrease linearly with excitation while the signals of transverse cracks are almost independent of the excitation frequency. The results in the paper show that the proposed method has great potential for the inspection of piston rod of hydraulic cylinder.
Author Contributions
Conceptualization, J.Z., B.F. and Y.K.; methodology, Y.H. and J.T.; validation, F.Z.; writing—original draft preparation, J.Z.; writing—review and editing, B.F., Y.H. All authors have read and agreed to the published version of the manuscript.
Funding
The work is supported by National Natural Science Foundation of China [No. 52105551].
Data Availability Statement
Original date is available upon reasonable requests.
Conflicts of Interest
The authors declare no conflict of interest.
References
- Park, J.; Won, C.; Lee, H.-J.; Yoon, J. Integrated Machine Vision System for Evaluating Hole Expansion Ratio of Advanced High-Strength Steels. Materials 2022, 15, 553. [Google Scholar] [CrossRef] [PubMed]
- Choi, D.-C.; Jeon, Y.-J.; Lee, S.J.; Yun, J.P.; Kim, S.W. Algorithm for detecting seam cracks in steel plates using a Gabor filter combination method. Appl. Opt. 2014, 53, 4865–4872. [Google Scholar] [CrossRef] [PubMed]
- Feng, B.; Kang, Y.; Sun, Y.; Deng, Z. Magnetization time lag caused by eddy currents and its influence on high-speed MFL testing. Res. Nondestruct. Eval. 2019, 30, 189–204. [Google Scholar] [CrossRef]
- Feng, B.; Kang, Y.; Sun, Y.; Yang, Y.; Yan, X. Influence of motion induced eddy current on the magnetization of steel pipe and MFL signal. Int. J. Appl. Electromagn. Mech. 2016, 52, 357–362. [Google Scholar] [CrossRef]
- Jiang, X.; Sun, Y.; Feng, B.; Liu, M.; Jiang, X.; Li, R.; He, L.; Kang, Y. New On-Line MFL Testing Method and Apparatus for Winding Mine Hoist Wire Rope. Appl. Sci. 2022, 12, 6970. [Google Scholar] [CrossRef]
- Sun, Y.; Wu, J.; Feng, B.; Kang, Y. An Opening Electric-MFL Detector for the NDT of In-Service Mine Hoist Wire. IEEE Sens. J. 2014, 14, 2042–2047. [Google Scholar] [CrossRef]
- Ditchburn, R.J.; Burke, S.K.; Posada, M. Eddy-Current Nondestructive Inspection with Thin Spiral Coils: Long Cracks in Steel. J. Nondestruct. Eval. 2003, 22, 63–77. [Google Scholar] [CrossRef]
- Helifa, B.; Oulhadj, A.; Benbelghit, A.; Lefkaier, I.; Boubenider, F.; Boutassouna, D. Detection and measurement of surface cracks in ferromagnetic materials using eddy current testing. NDT E Int. 2006, 39, 384–390. [Google Scholar] [CrossRef]
- Xie, L.; Gao, B.; Tian, G.; Tan, J.; Feng, B.; Yin, Y. Coupling pulse eddy current sensor for deeper defects NDT. Sens. Actuators A Phys. 2019, 293, 189–199. [Google Scholar] [CrossRef]
- Bowler, N. Theory of Four-Point Direct-Current Potential Drop Measurements on a Metal Plate. Res. Nondestruct. Eval. 2006, 17, 29–48. [Google Scholar] [CrossRef]
- Bowler, N.; Huang, Y. Electrical conductivity measurement of metal plates using broadband eddy-current and four-point methods. Meas. Sci. Technol. 2005, 16, 2193–2200. [Google Scholar] [CrossRef]
- Bowler, N.; Huang, Y. Model-based characterization of homogeneous metal plates using four-point alternating current po-tential drop measurements. IEEE Trans. Magn. 2005, 41, 2102–2110. [Google Scholar] [CrossRef]
- Bowler, J.R.; Huang, Y.; Sun, H.; Brown, J.; Bowler, N. Alternating current potential-drop measurement of the depth of case-hardening in steel rods. Meas. Sci. Technol. 2008, 19, 075204. [Google Scholar] [CrossRef]
- Li, D.; Sun, Y.; Ye, Z.; Kang, Y. Electric field leakage nondestructive testing principle and its simulations. Mater. Eval. 2015, 11, 1438–1445. [Google Scholar]
- Li, D.; Kang, Y.; Sun, Y.; Ye, Z.; Ding, Y. Nondestructive Evaluation of Conducting Materials Using a Direct Current Perturbation Method. In Proceedings of the 19th International Workshop on Electromagnetic Non-Destructive Evaluation (ENDE), Xian, China, 25–28 June 2014. [Google Scholar] [CrossRef]
- Ye, Z.; Kang, Y.; Sun, Y.; Yang, G.; Feng, B.; Zhou, Q. Theoretical analyses of an alternating current electric flux leakage inspection method and ex-perimental verification. Insight 2015, 57, 78–84. [Google Scholar] [CrossRef]
- Desjardins, D.R.; Krause, T.W.; Clapham, L. Transient response of a driver coil in transient eddy current testing. NDT E Int. 2015, 73, 22–27. [Google Scholar] [CrossRef]
Figure 1.
Piston rod with injected current.

Figure 2.
Distribution of eddy current and magnetic flux density along radius in the analytical model: (a) variation of current density with radius; (b) variation of magnetic flux density with radius.
Figure 2.
Distribution of eddy current and magnetic flux density along radius in the analytical model: (a) variation of current density with radius; (b) variation of magnetic flux density with radius.

Figure 3.
Distribution of eddy current and magnetic flux density along radius in the finite element model: (a) variation of current density with radius; (b) variation of magnetic flux density with radius.
Figure 3.
Distribution of eddy current and magnetic flux density along radius in the finite element model: (a) variation of current density with radius; (b) variation of magnetic flux density with radius.

Figure 4.
The contour plot of the magnetic field: (a) steel bar; (b) one quarter of cross-section.

Figure 5.
Magnetic field over the longitudinal crack.

Figure 6.
Schematic diagram of current perturbation.

Figure 7.
Scan path of transverse crack.

Figure 8.
Simulation signal of Bn in three paths: (a) path No. 1; (b) path No. 2; (c) path No. 3.

Figure 9.
Simulation signal of Bt in three paths: (a) path No. 1; (b) path No. 2; (c) path No. 3.

Figure 10.
Experimental setup.

Figure 11.
Testing signals of longitudinal and transverse cracks: (a) longitudinal crack; (b) transverse crack.
Figure 11.
Testing signals of longitudinal and transverse cracks: (a) longitudinal crack; (b) transverse crack.

Figure 12.
Change of testing signal amplitude with frequencies: (a) longitudinal crack; (b) transverse crack.
Figure 12.
Change of testing signal amplitude with frequencies: (a) longitudinal crack; (b) transverse crack.

Figure 13.
Experimental testing signal of Bn for transverse cracks at different paths: (a) path A; (b) path B; (c) path C.
Figure 13.
Experimental testing signal of Bn for transverse cracks at different paths: (a) path A; (b) path B; (c) path C.

Figure 14.
Experimental testing signal of Bt for transverse cracks at different paths: (a) path A; (b) path B; (c) path C.
Figure 14.
Experimental testing signal of Bt for transverse cracks at different paths: (a) path A; (b) path B; (c) path C.

Publisher’s Note: MDPI stays neutral with regard to jurisdictional claims in published maps and institutional affiliations. |
© 2022 by the authors. Licensee MDPI, Basel, Switzerland. This article is an open access article distributed under the terms and conditions of the Creative Commons Attribution (CC BY) license (https://creativecommons.org/licenses/by/4.0/).
Share and Cite
MDPI and ACS Style
Zhang, J.; Huang, Y.; Tang, J.; Zhou, F.; Kang, Y.; Feng, B. Inspection of Cracks in the Piston Rod of a Hydraulic Cylinder Using Injected Alternating Current-Field Measurement. Water 2022, 14, 2736. https://doi.org/10.3390/w14172736
AMA Style
Zhang J, Huang Y, Tang J, Zhou F, Kang Y, Feng B. Inspection of Cracks in the Piston Rod of a Hydraulic Cylinder Using Injected Alternating Current-Field Measurement. Water. 2022; 14(17):2736. https://doi.org/10.3390/w14172736
Chicago/Turabian StyleZhang, Jikai, Yuewen Huang, Jian Tang, Fangfang Zhou, Yihua Kang, and Bo Feng. 2022. "Inspection of Cracks in the Piston Rod of a Hydraulic Cylinder Using Injected Alternating Current-Field Measurement" Water 14, no. 17: 2736. https://doi.org/10.3390/w14172736
Note that from the first issue of 2016, this journal uses article numbers instead of page numbers. See further details here.