

Effects of Specific Surface Area of Artificial Carriers on Carbon Metabolism Activity of Biofilm
Key Laboratory of Integrated Regulation and Resources Development on Shallow Lakes, Ministry of Education, College of Environment, Hohai University, Nanjing 210098, China
*
Author to whom correspondence should be addressed.
Water 2022, 14(17), 2735; https://doi.org/10.3390/w14172735
Submission received: 6 August 2022
/
Revised: 27 August 2022
/
Accepted: 30 August 2022
/
Published: 2 September 2022
(This article belongs to the Special Issue The Fate and Potential Impacts of Emerging Pollutants on the Freshwater Systems)
Abstract
:Biofilm technology has been applied to polluted water treatment. The functional characteristics of biofilm play key roles in the decontamination efficiency and are affected by the physicochemical properties of the carrier surface. Previous studies reported that the larger the specific surface area of the artificial carrier, the more biofilms there are attached to its surface. However, the coupling relationship between the metabolic activity of biofilm and the specific surface area of carrier remained limitedly studied. Herein, five carriers with a gradient of specific surface areas were selected to incubate biofilms in two low-pollution rivers for 44 days, and a BIOLOG ECO microplate was used to analyze the metabolic activity of biofilm. Results demonstrated that the carbon metabolic capacity of biofilm fluctuates with the increase in the specific surface area. In Xuanwu Lake, the carbon metabolism rate of biofilm demonstrated a linear correlation with a specific surface area. In Donghu Lake, there was a trend of a single hump because of mass transfer limitation. In different water bodies, the carbon metabolic activity of biofilm demonstrated different trends with the change of specific surface area, and mass transfer limitation should be considered. For the classified carbon sources, there was a threshold (with Xuanwu Lack of 7500 m2/m3 and Donghu Lack of 5000 m2/m3) to make the biofilm achieve the best utilization ability of classified carbon sources. Nevertheless, the change of carriers’ specific surface area had little effect on the community structure of biofilm.
1. Introduction
Biofilm technology has been applied to the polluted water treatment due to its low cost of ownership, high water purification efficiency, wide range of water pollutants, and friendliness to the environment and ecological restoration [1]. The process of removing pollutants by biofilm technology is due to the microbial metabolism of the attached biofilm, which is dependent on the activities of enzymes for the transformation of the pollutants [2]. Therefore, the formation of biofilm and its metabolic activity are the key to the decontamination effect of biofilm technology. Biofilm is a kind of microbial colony composed of bacteria, protozoa and fungi, which coexists and thrives on the solid surface, producing polymer extracellular substances (EPS) [3,4].
The microbial community of biofilm is sensitive to environmental heterogeneity [5]. Changes in the environment (such as light, temperature and nutrients) will transform the structure, function and purification activity of the community [6]. Blanco et al. [7] studied the characteristics of biofilm in different extreme environments and found that similar EPS compositions were secreted by distinct microbial communities. When comparing the metabolic characteristics of biofilm in biofilters at different temperatures, Kong et al. [8] found that high temperature and dry environment would inhibit the metabolism of microorganisms at an early stage and reduce the metabolic activity of biofilm. The functional characteristics of biofilm were also affected by the physicochemical properties of the carrier surface, except for the influence of environmental conditions on the structural diversity and microbial functions of biofilm [9,10].
As a hydrodynamic platform, the biofilm carrier could provide a stable surface area for microbial growth in the biological wastewater treatment process [11]. Therefore, the carrier type may influence the metabolic pathway of biofilm attached to the carrier to a certain extent [12]. For example, Xing et al. [13] found that the micro niche and nutrients on the surface of biological carriers and abiotic carriers potentially affect the community composition and structure of denitrifying bacteria and ammonia-oxidizing bacteria in the system, leading to the difference in the denitrification effect of the system. Recently, many studies focused on the influence of physical properties (electrostatic interaction), chemical properties (expected functional groups) and topographic properties (specific surface area, surface roughness) of the biofilm surface on microbial adhesion and biofilm formation [14,15,16]. Generally, carriers with positive charge as well as high special surface area, durability, porosity and roughness will be conducive to the initial adhesion of bacterial communities and provide strong anti-falling protection [17]. Among these influencing factors of the carrier, the specific surface area is a basic influencing factor, because the mechanism of changing the topographic characteristics such as roughness and porosity to optimize the carrier biofilm adhesion ability lies in improving the specific surface area of the carrier, so as to provide more fixation sites. Previous studies demonstrated that the larger the specific surface area of the carrier, the more biomass attached, and the stronger the purification capacity [18,19]. However, considering mass diffusion within biofilm, a large biomass may reduce the transfer rate of nutrients and oxygen entering the internal area, thereby reducing the degradation efficiency [20,21]. Therefore, the coupling relationship between the metabolic activity and specific surface area of the biofilm needs to be further studied.
Based on the discussion above, we speculate that the metabolic activity of biofilm does not necessarily have a linear relationship with specific surface area. There may be a threshold of specific surface area to maximize the biofilm activity. After that, the biofilm activity will decrease or maintain balance. We designed the following experiments to verify the correctness of this assumption and the speculation above. We selected five carriers with a certain specific surface area span and conducted a 44-day field incubation experiment in two low-pollution rivers, Donghu Lake and Xuanwu Lake. The metabolic activity of biofilm was determined by the BIOLOG ECO microplate.
2. Materials and Methods
2.1. Artificial Carriers with Different Specific Surface Areas
In order to explore the effects of the specific surface area of artificial carriers on the carbon metabolic activity of the biofilm, five artificial carriers with a certain difference in specific surface area were used in the experiment, which were a suspended ball with elastic packing (C1), suspended ball with polyurethane sponge (C2), combined elastic packing (C3), braided biological rope (C4) and Curtain biological rope (C5). The detailed information on the carriers’ specific surface area is available in Table 1.
2.2. Biofilm Incubation
In this experiment, biofilm was incubated in situ at two stations in Nanjing, Donghu Lake (31°54′59.0′′ N, 118°46′55.3′′ E) and Xuanwu Lake (32°04′19.7′′ N, 118°47′9.9′′ E). The biofilm incubation process was proceeded within cylindrical stainless steel cages (diameter 30 cm, depth 60 cm and mesh size < 100 μm) following our previous study [22]. The setup of the mesh size was chosen to ensure the free exchange of nutrients between the water body and prevent the entry of large suspended particles. There were three parallel samples of each artificial carrier in each lake. Using fishing lines, each device was fixed at 50 cm underwater to ensure the same light intensity [23]. During the incubation, the incubators were washed on site with special brushes every 2 weeks to avoid blocking the mesh. The biofilm in this experiment was incubated in situ in the field for 44 days (From 23 October 2021 to 6 December 2021) until the biofilm matured, and the biofilm was brought back to the laboratory for further analysis.
2.3. Determination of Physical and Chemical Indexes of Water Body
During the incubation process, 500 mL water samples in triplicate were retrieved from the in situ environment. A multiparameter probe (YSI ProDSS, Xylem analysis, Yellow Springs, OH, USA) was applied to measure Temperature, dissolved oxygen (DO), oxidation-reduction potential (ORP) and turbidity (NTU). Collected water samples (0.22 μm filtered) were further analyzed for total nitrogen (TN), ammonia nitrogen (NH4+-N), total carbon (TC), dissolved organic carbon (DOC), total phosphorus (TP) and chemical oxygen demand (CODMn) [24].
2.4. Biofilm Collection
After incubation, all the artificial carriers with biofilm were retrieved and transported to the laboratory for further processing. During transportation, the samples were kept wet with water collected from the in situ environment to maintain the biofilm’s properties. An ultrasonic oscilloscope (frequency 40 kHz; power 100 W; cycle 45 min) was used for the separation of biofilm. Then, after flushed with sterilized water, the biofilm samples were used for all biochemical determination.
2.5. Community-Level Physiological Profiling
2.5.1. BIOLOG ECO Microplate
The average well color development (AWCD) was measured using BIOLOG ECO microplates (Hayward, CA, USA) [25]. The details were given in our previous study [26]. Briefly, the quantitative biofilm sample (0.1 g) was weighed and put into a triangular flask, and sterilized physiological saline (0.85% NaCl, W/V) was added to suspend the sample. Then, the biofilm samples were subjected to ultrasonic processing. After that, the solution was gradually diluted until an optical density (OD) value reached 0.05 cm−1 at 590 nm. Next, the corresponding diluted suspension (150 μL) can be added into the wells (150 μL) of the BIOLOG ECO microplate, which was then placed into an incubator at 25 °C for 7 days under shading [27]. The absorbance value of each hole was measured at 590 nm every 12 h with a multifunctional enzyme label tester (Synergy H4, BioTek, Winooski, VT, USA) [26].
2.5.2. AWCD Values
AWCD was determined to measure the utilization ability of microorganisms to a single carbon source, and can be calculated as Equation (1):
where Ci is color production in each well (OD measurement at 590 nm), R is the absorbance value of the control well, and n is the number of reactive wells(ECO plates, n = 31) [14]. In addition, (Ci-R) values less than 0.06 were regarded as zero [28].
The dynamic curve of AWCD changes over time can be fitted by the logistic growth equation (Equation (2)).
where, a is the asymptote, representing the maximum AWCD value, k is the exponential rate of AWCD change, representing the highest carbon metabolism rate, s is the time when AWCD = a/2, and t is the incubation time, considered to be an independent value [22].
2.5.3. Metabolic Diversity Indices
Metabolic diversity indices can reflect the carbon source utilization heterogeneity of biofilm and clarify the community structure to a certain degree. The following two indexes are used in this experiment.
(1) Shannon-Wiener diversity index(H′):
where Pi is the ratio of the blanked absorbance value of each well to the sum of absorbance values of all wells.
(2) Simpson diversity index (D):
2.6. Date Analyses and Statistics
Biochemical analysis of all biofilm samples was performed in three replicates, and the data were expressed as mean ± standard deviation. When analyzing data, one-way ANOVA was used to express statistical differences between groups.
3. Results
3.1. Analysis of Physical and Chemical Indexes of Water Body
Under different in situ incubation environments, some of the water quality indicators in the two lakes showed a difference (Table S1). Compared with the Donghu Lake, the dissolved oxygen (DO) content and turbidity of Xuanwu Lake were higher. The average TN in the Donghu Lake was 1.734 ± 0.615 mg/L, which was higher than the average TN in the Xuanwu Lake of 0.546 ± 0.201 mg/L. The comparison of NH4+ in the two lakes was the same as that of TN. For TC, the TC concentration in the Donghu Lake (29.638 ± 1.570) was higher. However, compared with the average TP value of the Xuanwu Lake (0.119 ± 0.025 mg/L), the Donghu Lake of that (0.087 ± 0.014 mg/L) showed a little difference. Little differentiation was also found in the temperature, DOC and COD in the two sites. The details are summarized in Table 2.
3.2. AWCD of All Carbon Sources
The AWCD values has two meanings in this experiment. First, it represents the dynamic process of the microbial consumption of a carbon source over time in the BIOLOG ECO microplate. Second, the maximum AWCD value of the microbial consumption curve of the carbon source entering the stagnation period can represent the overall carbon source utilization level of the microbial community.
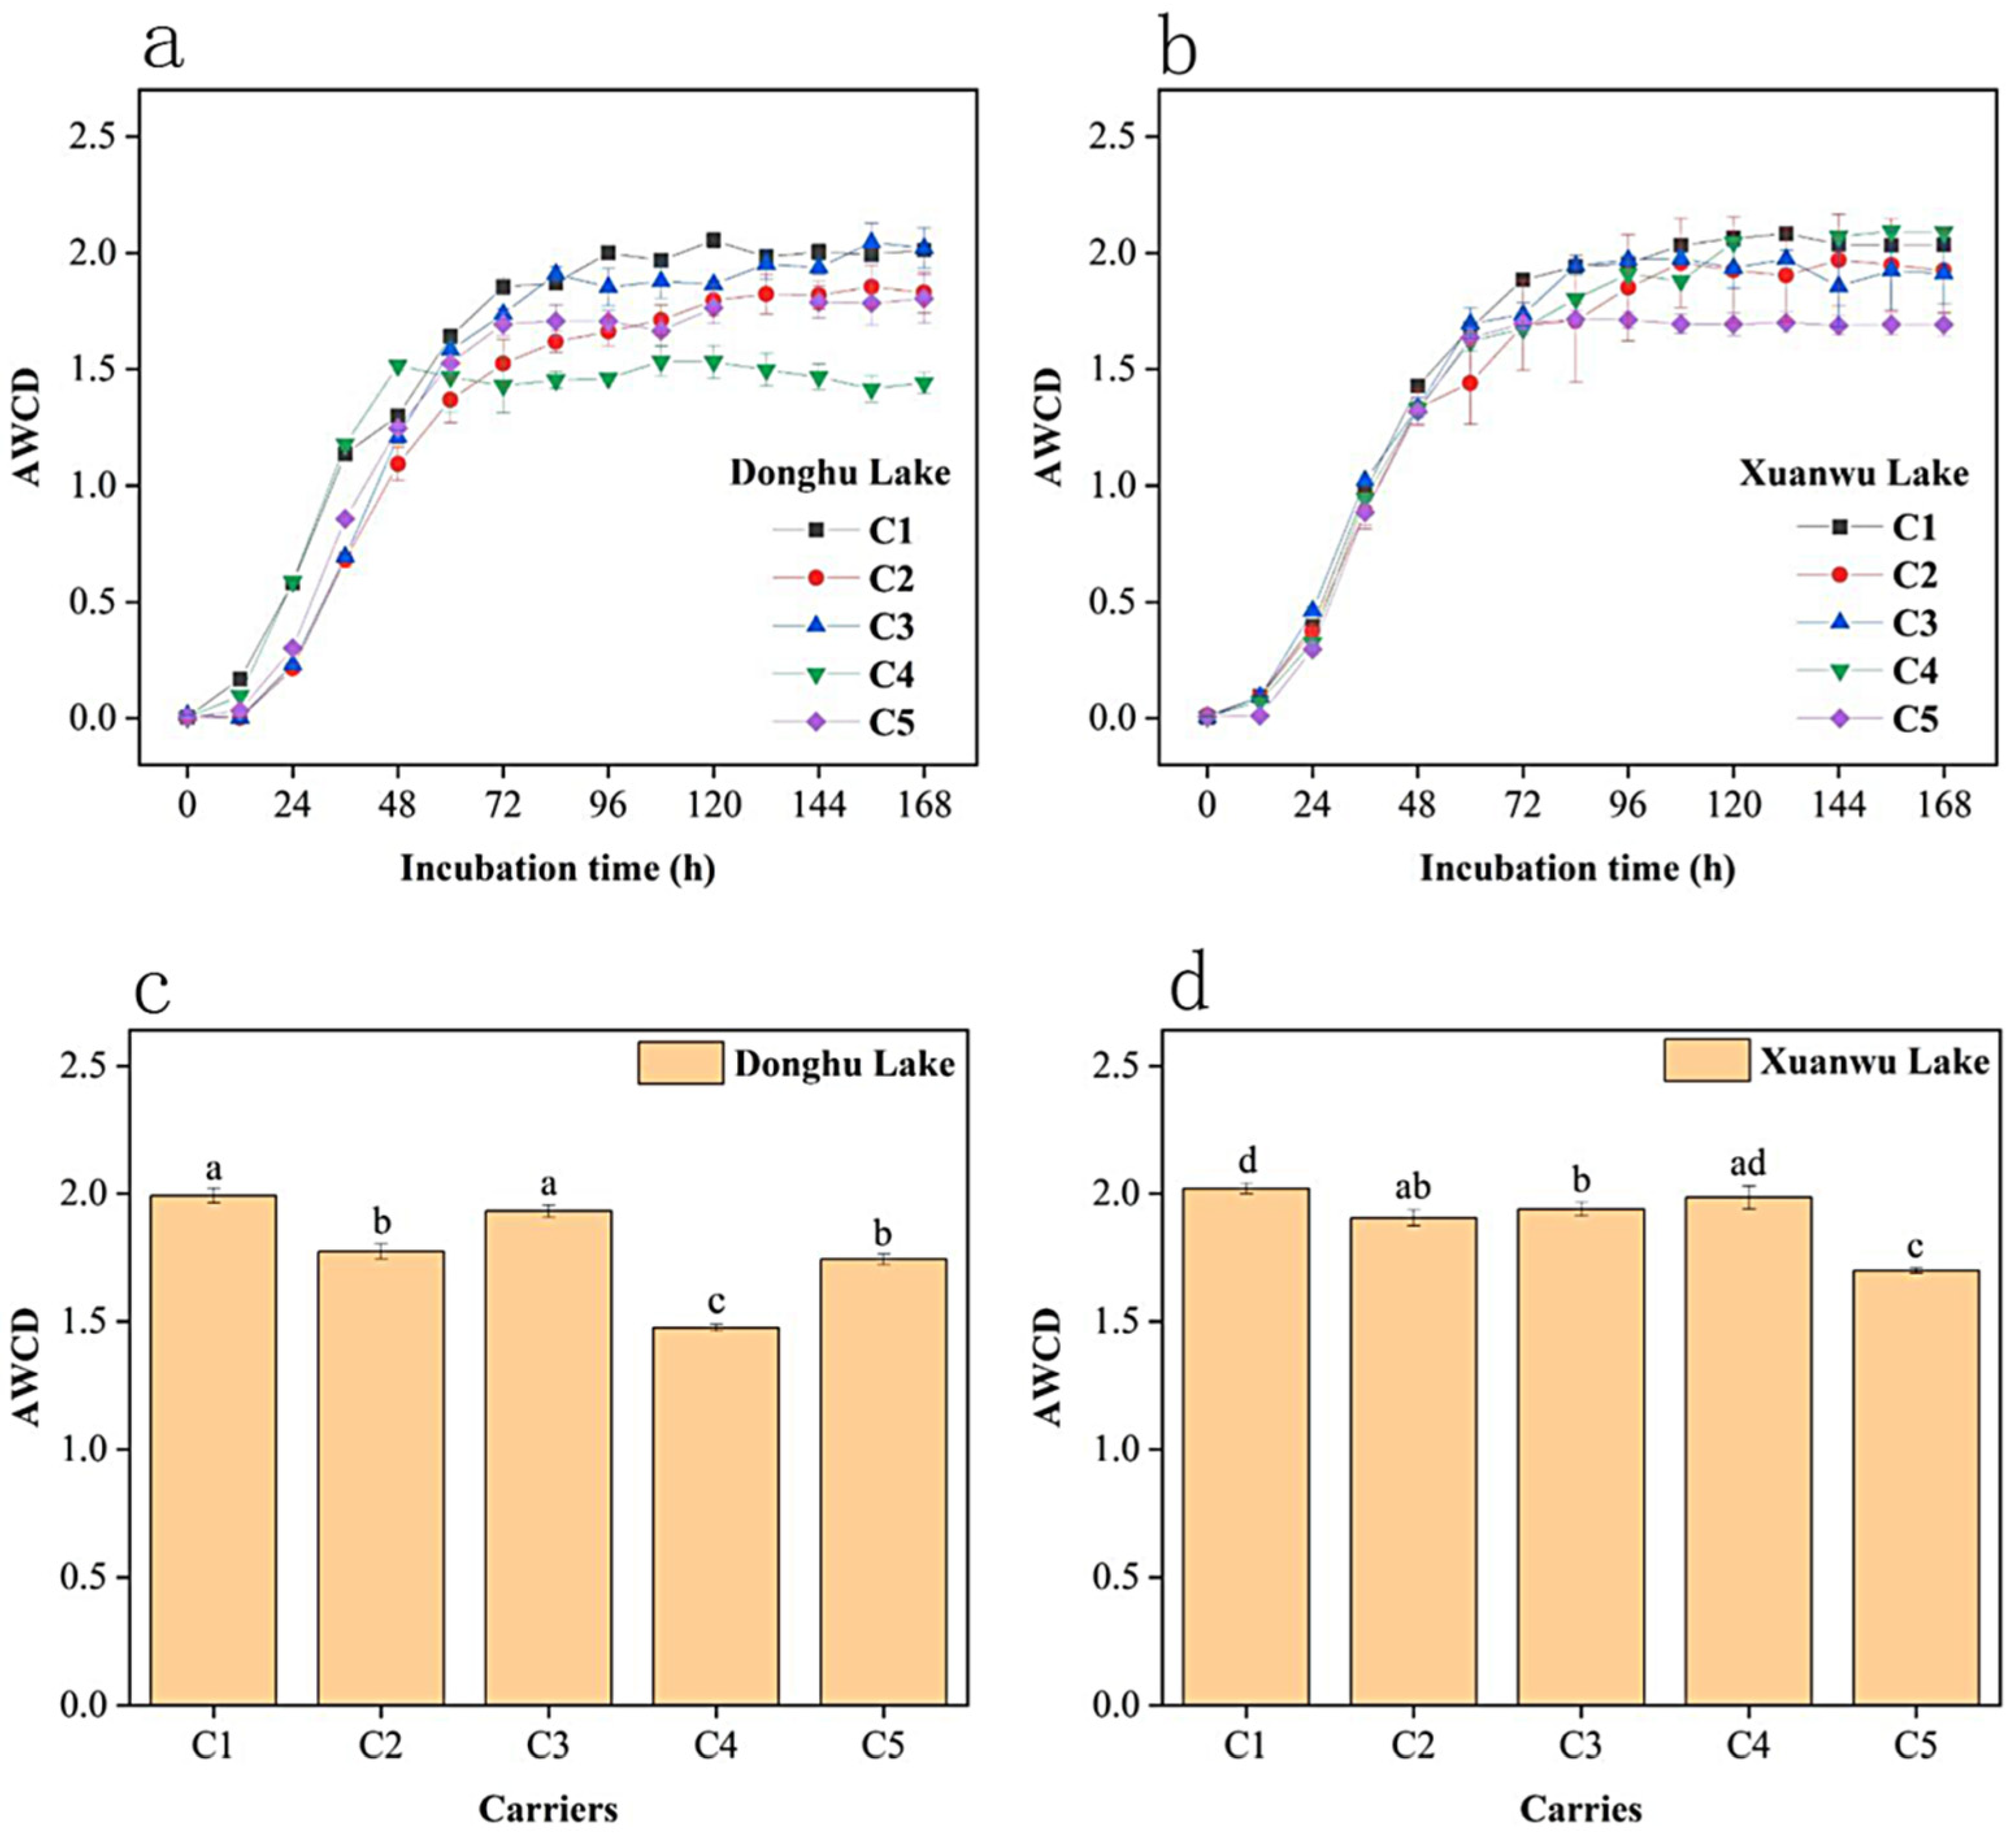
The AWCD values of biofilm microbial communities attached to five artificial carriers are presented in Figure 1a,b. In general, the grow pattern was similar to an S-shaped curve and highly fitted with Equation (2). For the biofilm cultured on day 1, due to the sufficient carbon source in the BIOLOG ECO microplate and the small number of microorganisms, the AWCD values had little difference within 24 h. With the passage of time, after microorganisms fully adapted to the environment, they entered the logarithmic growth period, and the AWCD value began to rise, indicating that the utilization rate of carbon by microorganisms gradually increased. The slope of the curve increased, showing that the carbon metabolism rate of biofilm cells accelerated. When the culture time reached 96 h, the growth and reproduction of microorganisms were limited, the number of newly bred individuals and dead tend to balance, and the consumption of carbon sources reached the peak and remain relatively steady.
Both the in situ culture environment and the specific surface area of the carrier affected the ability of microorganisms attached to the biofilm to utilize carbon sources (Figure 1c,d). In Donghu Lake, there was a significant difference between the AWCD asymptotic value of C4 and other carriers (p < 0.05), which can be summarized as C1≈C3 > C2≈C5 > C4. In Xuanwu Lake, with the gradual increase in the specific surface area of carriers, using one-way ANOVA comparative analysis, it was found that the asymptotic value of AWCD with C1 and C4 was the largest, and the asymptotic value of AWCD with C5 was the smallest. Based on the phenomenon above, it can be explained that the change of specific surface area affected the carbon metabolism ability of the biofilm. With the increase in the specific surface area, the carbon metabolism ability of the biofilm fluctuated. In addition, comparing AWCD asymptotic values of the same kind of artificial carriers in Donghu Lake and Xuanwu Lake (Table S2), it was found that the AWCD value of C4 in Donghu Lake was obviously lower than that in Xuanwu Lake, while the AWCD value of C2 in Donghu Lake was also slightly lower than that in Xuanwu Lake. On the contrary, C5 had a larger asymptotic value of AWCD in Donghu Lake. This reveals that the change of incubation environment also affects the carbon metabolism ability of the biofilm attached to the carrier.
3.3. Response of Carbon Metabolism Rate to the Specific Surface Area Changing
Different from AWCD of all carbon sources, the carbon metabolic rate of biofilm demonstrated a certain regularity with the increase in the carrier specific surface area.
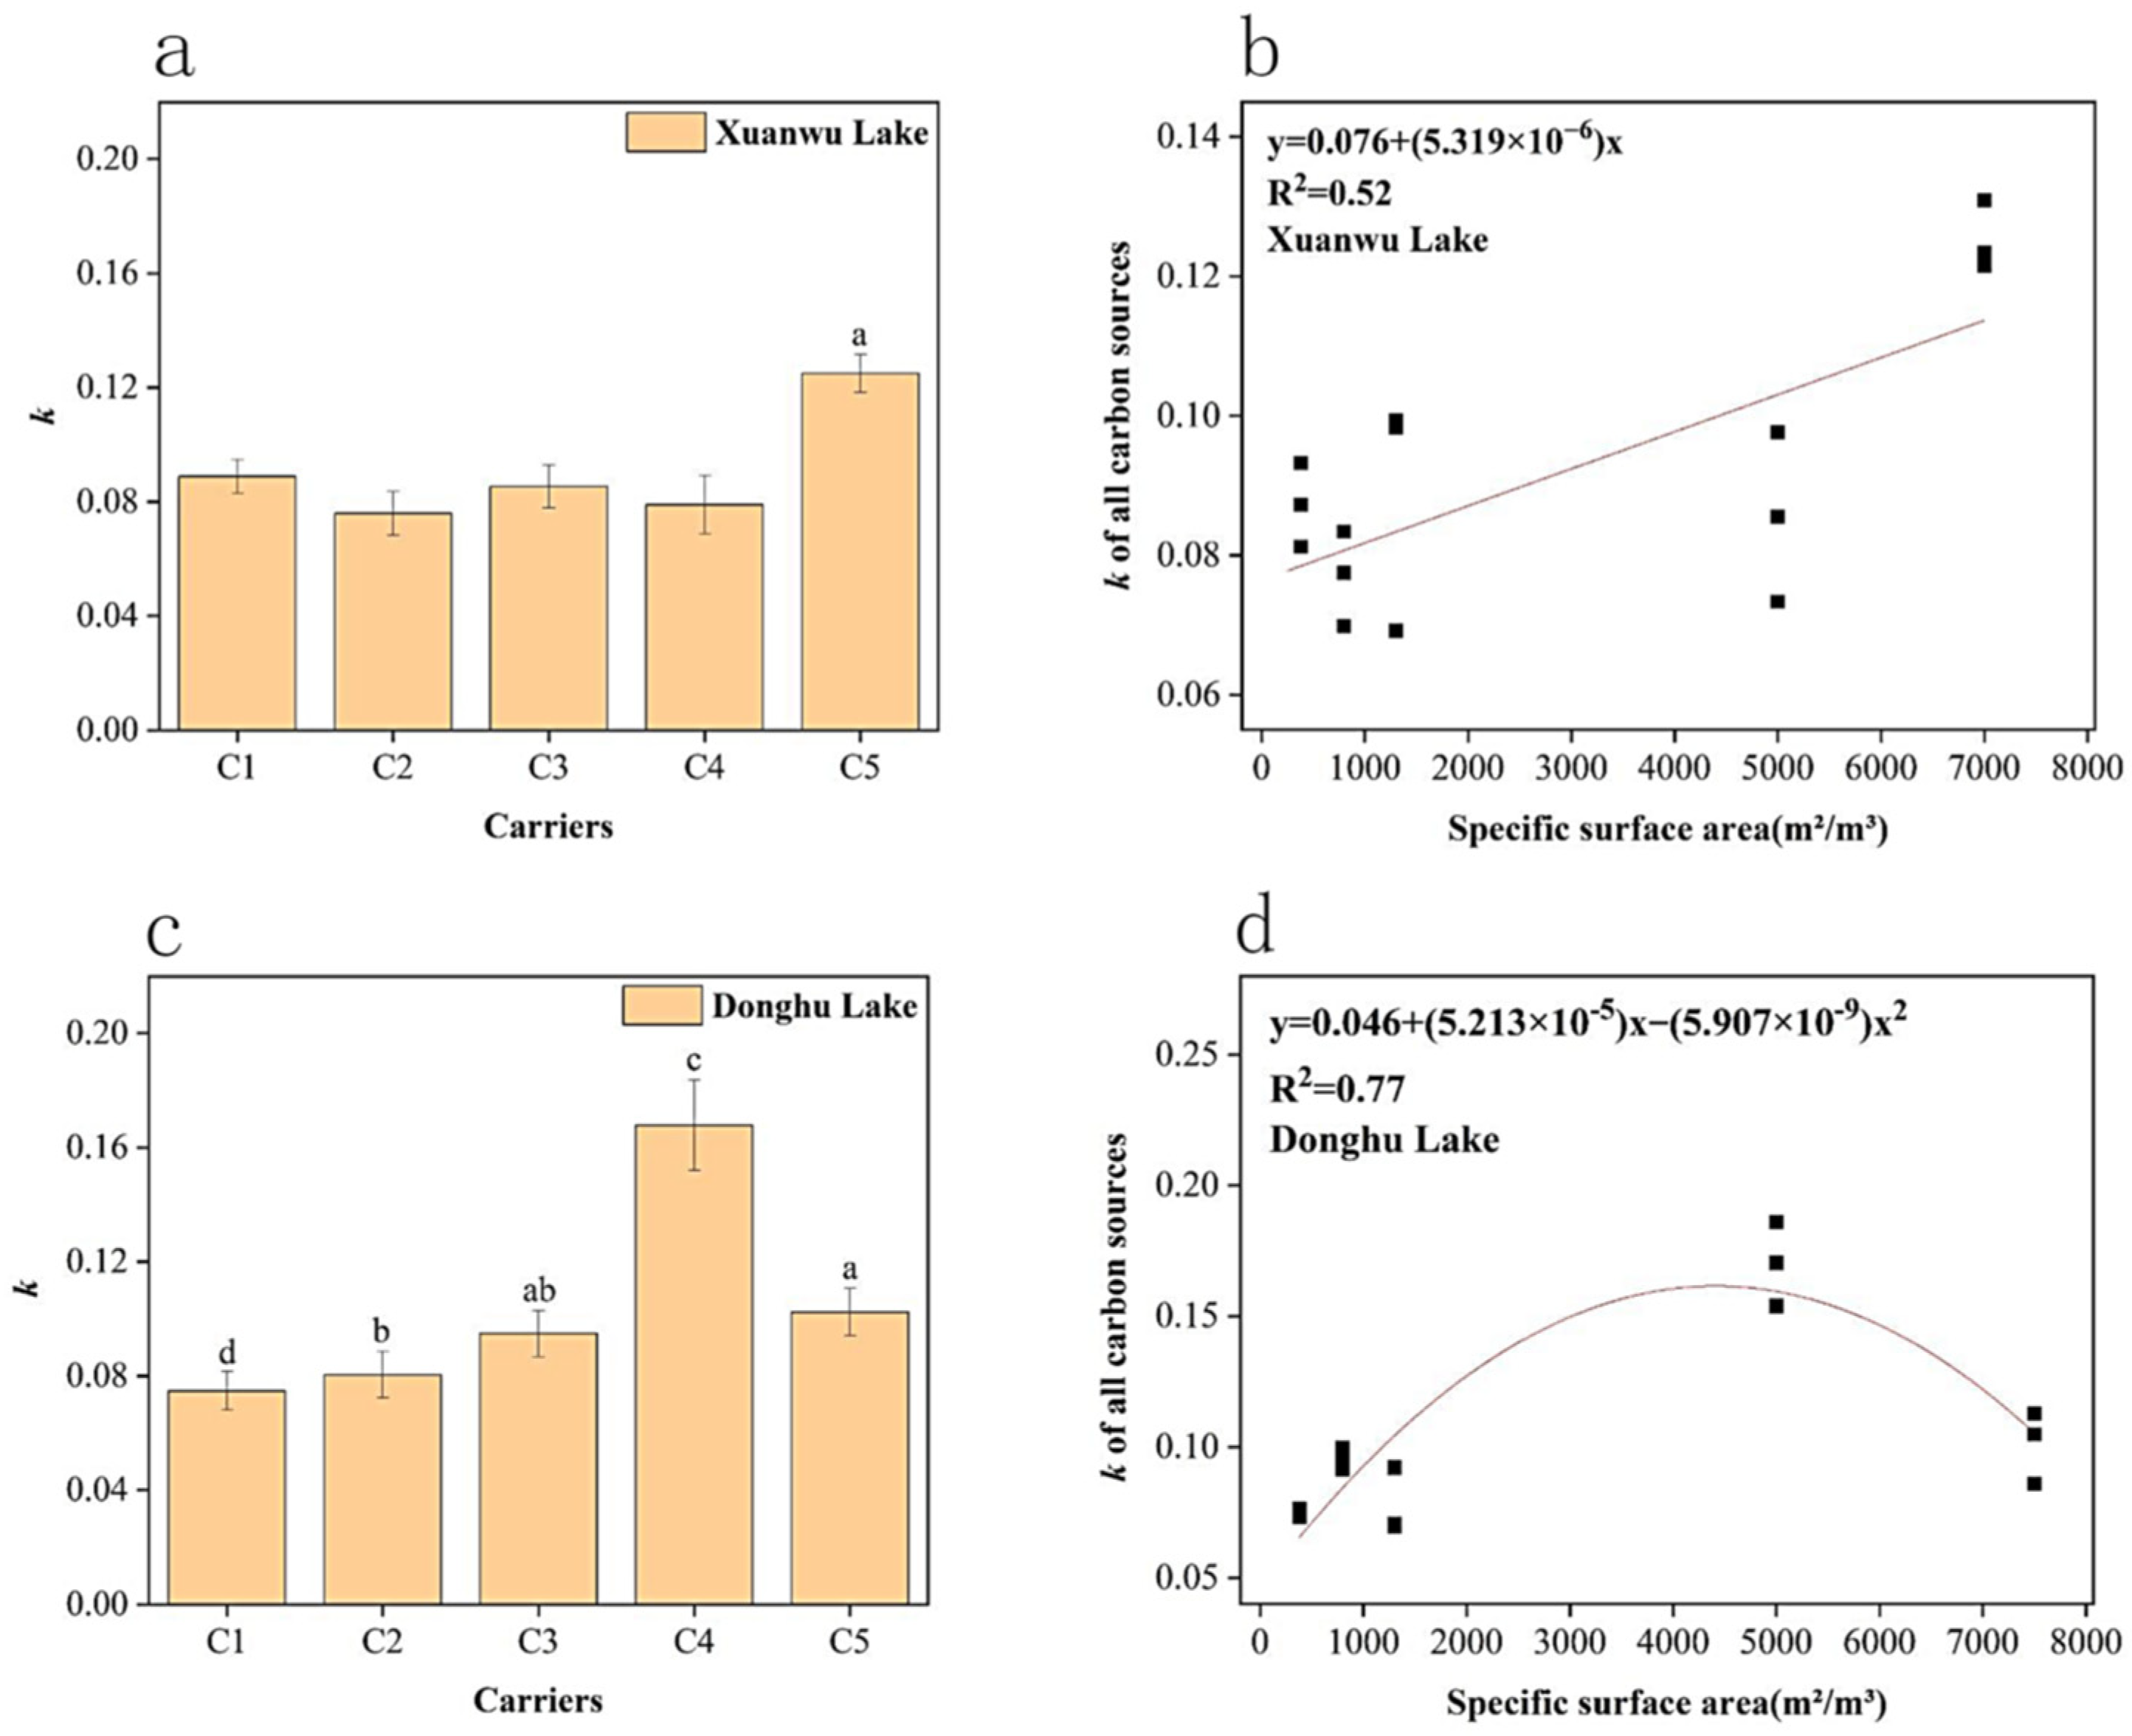
In Xuanwu Lake, when the specific surface area was 7500 m2/m3, the carbon metabolism rate of biofilm reaches the maximum (Figure 2a). After data fitting with origin, we found that the carbon metabolism rate of the biofilm increased linearly with the specific surface area of the carrier. The fitting results is y = 0.076 + (5.319 × 10⁻⁶)x, with R2 = 0.52 (Figure 2b). This shows that the specific surface area of the carrier can indeed have a positive impact on the carbon cycle function of the biofilm.
However, in Donghu Lake, the carbon metabolism rate increased first and then decreased with the increasing specific surface area, and reached the maximum near the specific surface area of 5000 m2/m3 (Figure 2c). We regard this relationship as a parabola-like trend and choose the quadratic polynomial function to fit it. The fitting result is y = 0.046 + (5.213 × 10⁻⁵) × −(5.907 × 10−9)x2, with R2 = 0.77 (Figure 2d). For this trend, it can be considered that there is a threshold in the process of increasing the specific surface area, which maximizes the carbon metabolism rate and the carbon metabolism activity of the biofilm.
3.4. Analysis of Carbon Metabolism by Biochemical Categories
3.4.1. AWCD by Biochemical Categories
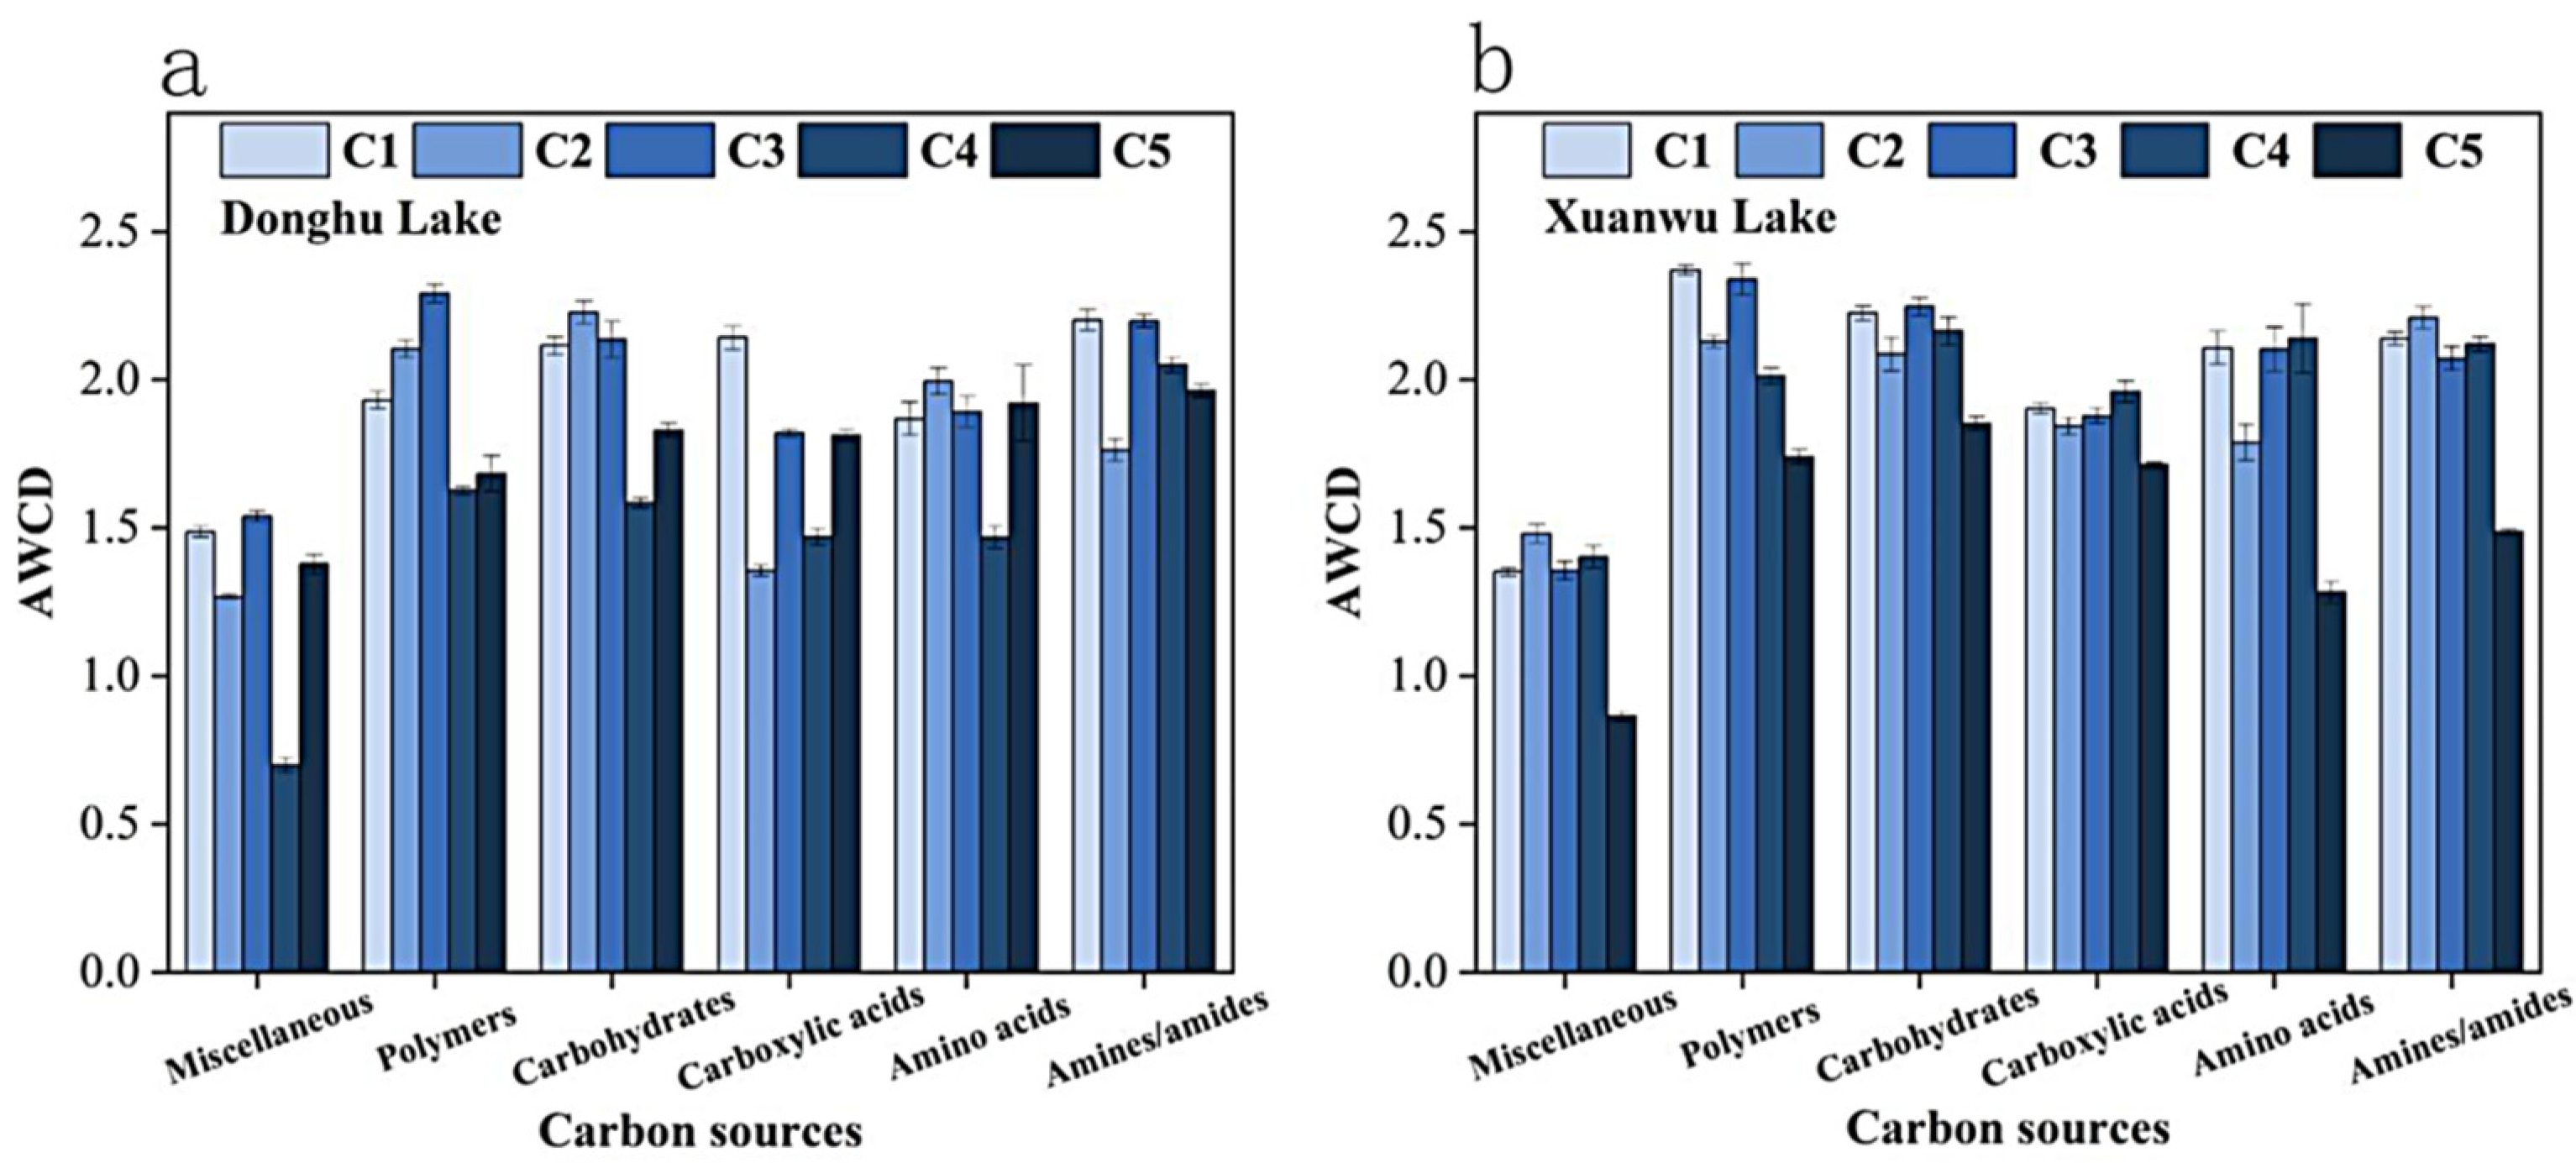
On the basis of biochemical categories of carbon sources, the 31 carriers can be divided into six categories: carboxylic acids, carbohydrates, amino acids, polymers, miscellaneous, and amines/amides [29]. The AWCD of each carbon sources category was statistically analyzed and is present in Figure 3. In the Donghu Lake, we found that with the change of specific surface area, although the carboxylic acids, carbohydrates, amino acids, polymers and miscellaneous demonstrated differences on the whole, the differences between other matrix groups were not obvious except for C4, which had a lower carbon metabolism capacity than others (p < 0.05). For amines/amides, there was no significant difference (p > 0.05). A similar situation occurred in Xuanwu Lake, with C5 having the lower value. This trend is similar to the trend of AWCD by all carbon sources, that is, the minimum value of AWCD on C4 and C5 is maintained, respectively. The phenomenon of the two lakes demonstrates that the change of the carriers’ specific surface area has a certain impact on the carbon source utilization pattern, but this impact is not significant. What is more, in terms of preference and selection of carbon sources, both lakes showed low selectivity for miscellaneous, indicating that the microbial communities attached to different carriers in the two lakes have a common feature, that is, they contain less quantity of microorganisms that can effectively use miscellaneous carbon sources, or their activity is low.
3.4.2. Carbon Metabolism Rate by Biochemical Categories
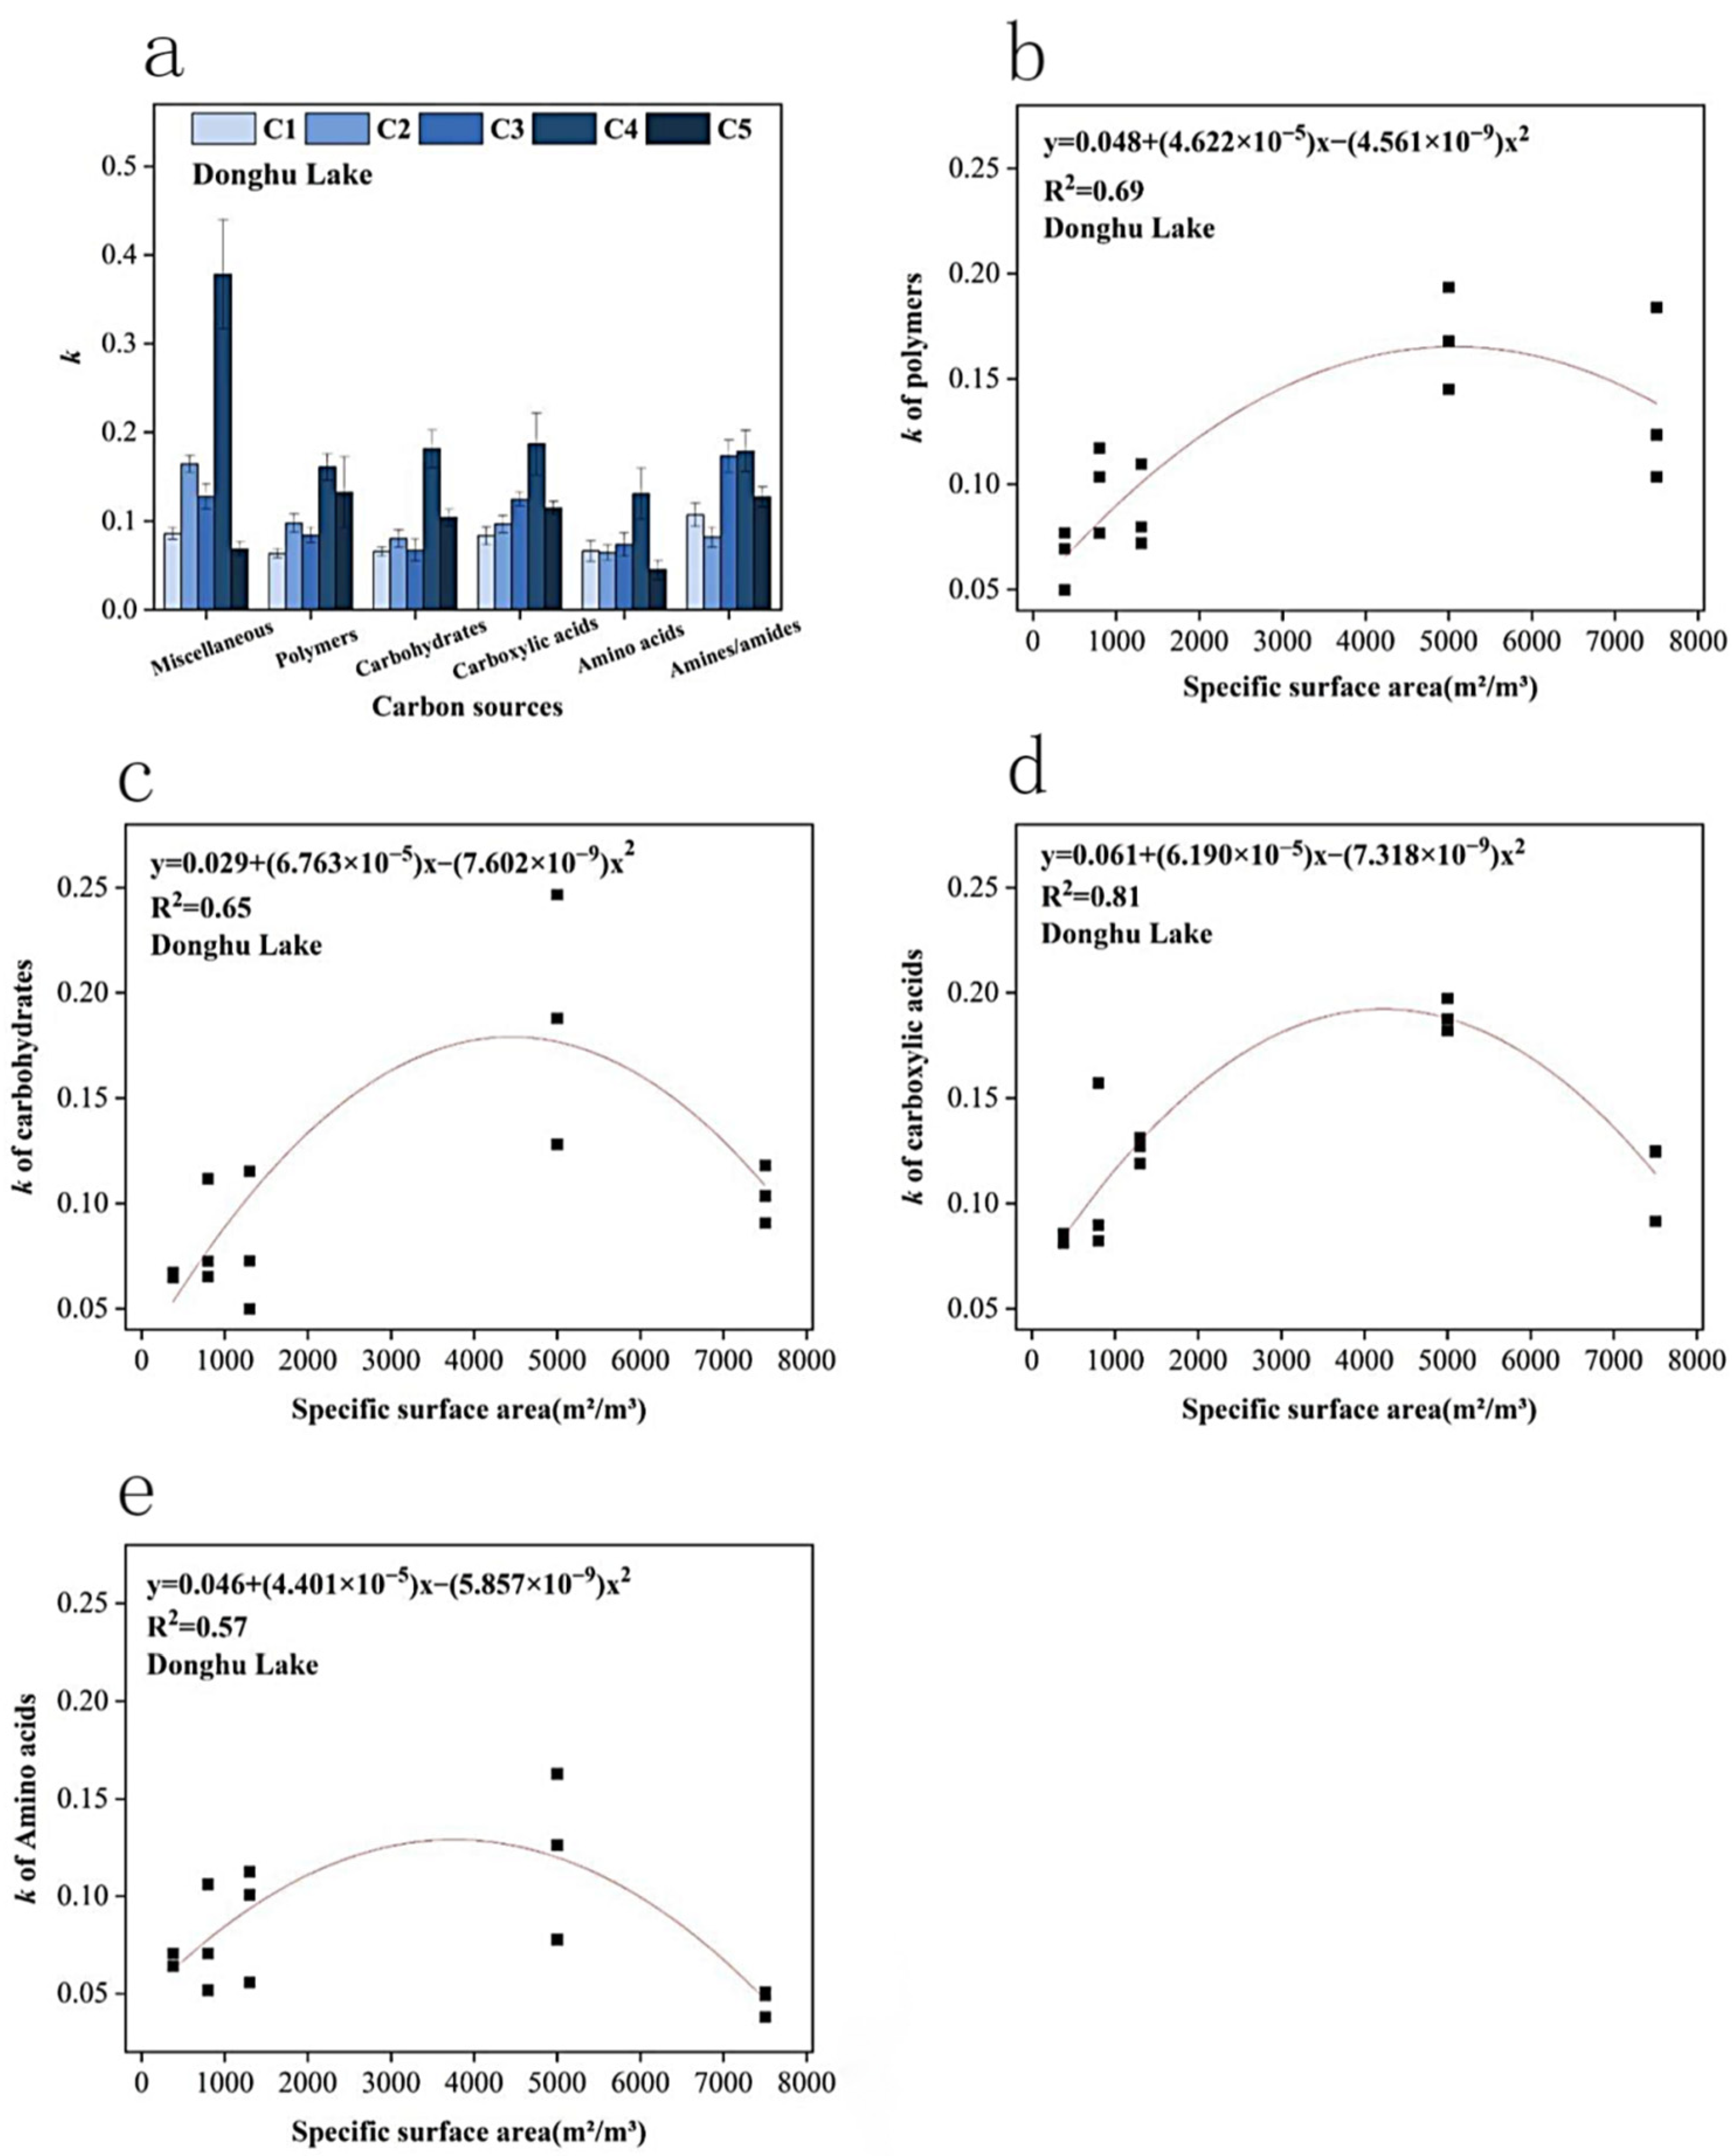
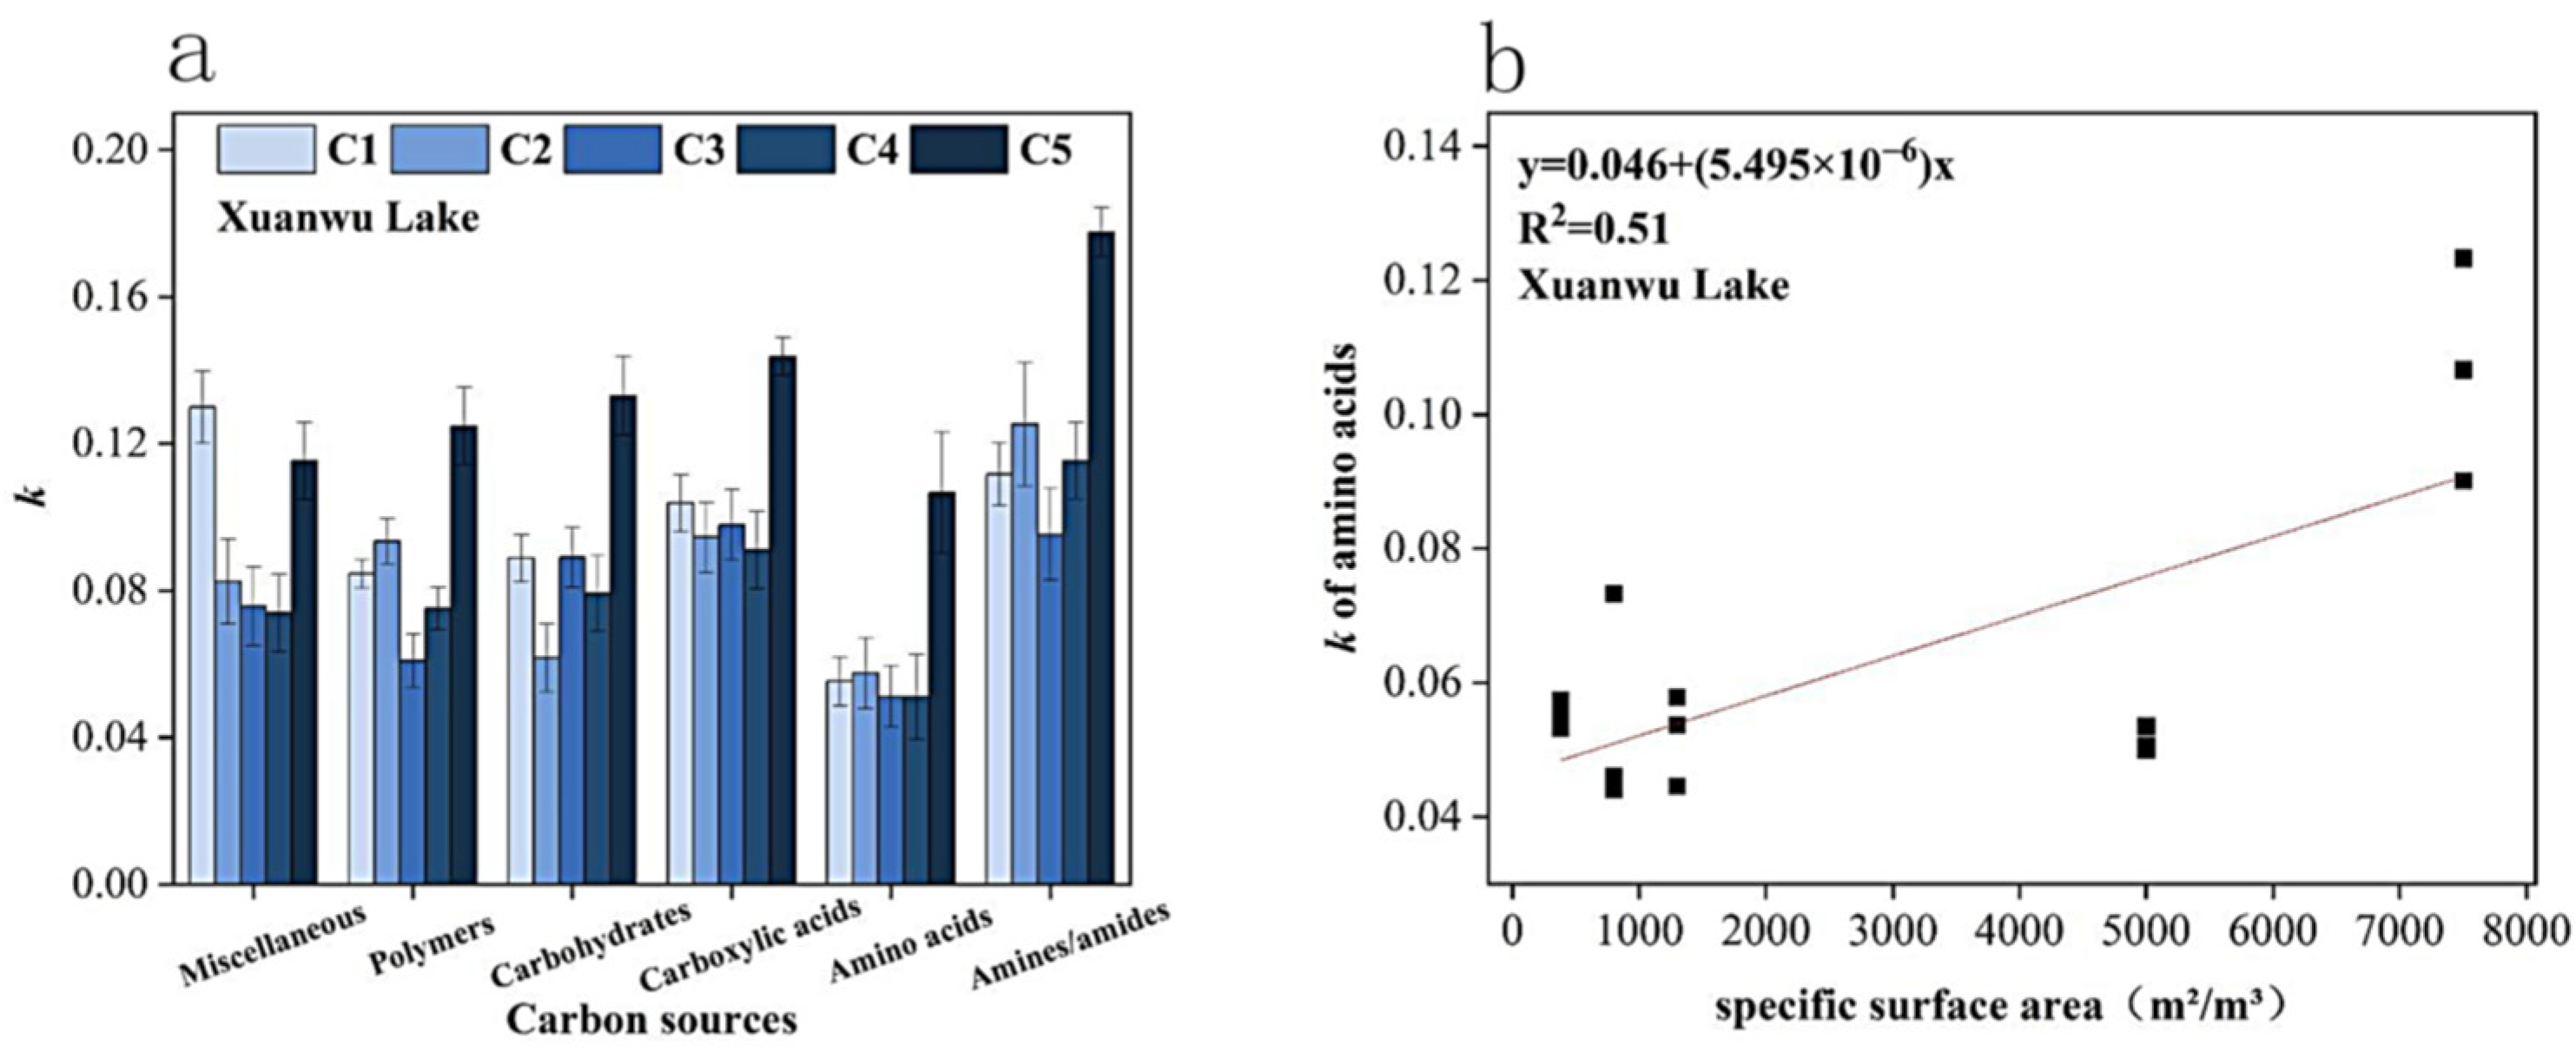
In the Donghu Lake, within a changing specific surface area, the carbon metabolism rate of some classified carbon sources demonstrated a similar law to that of the total carbon source, that is, it presented a parabolic trend of first increasing and then decreasing, especially for polymers, carbohydrates, carboxylic acids and amino acids (Figure 4a–e). For other carbon sources, although the applicability of this trend was not high, they all maintained the common ground that C4 has the maximum carbon metabolism rate. Therefore, we believe that the carbon metabolic activity of six types of carbon sources does not demonstrate a linear correlation with the increase in the specific surface area, but fluctuates with the existence of the threshold. Compared with the Donghu Lake, only the carbon metabolism rate of amino acids in Xuanwu Lake demonstrated a linear trend with the change of specific surface area (Figure 5a,b). For the other types of carbon sources in this lake, the high carbon metabolism rate of C5 was still maintained, but there was no obvious change rule.
3.4.3. Microbial Metabolic Functional Diversity
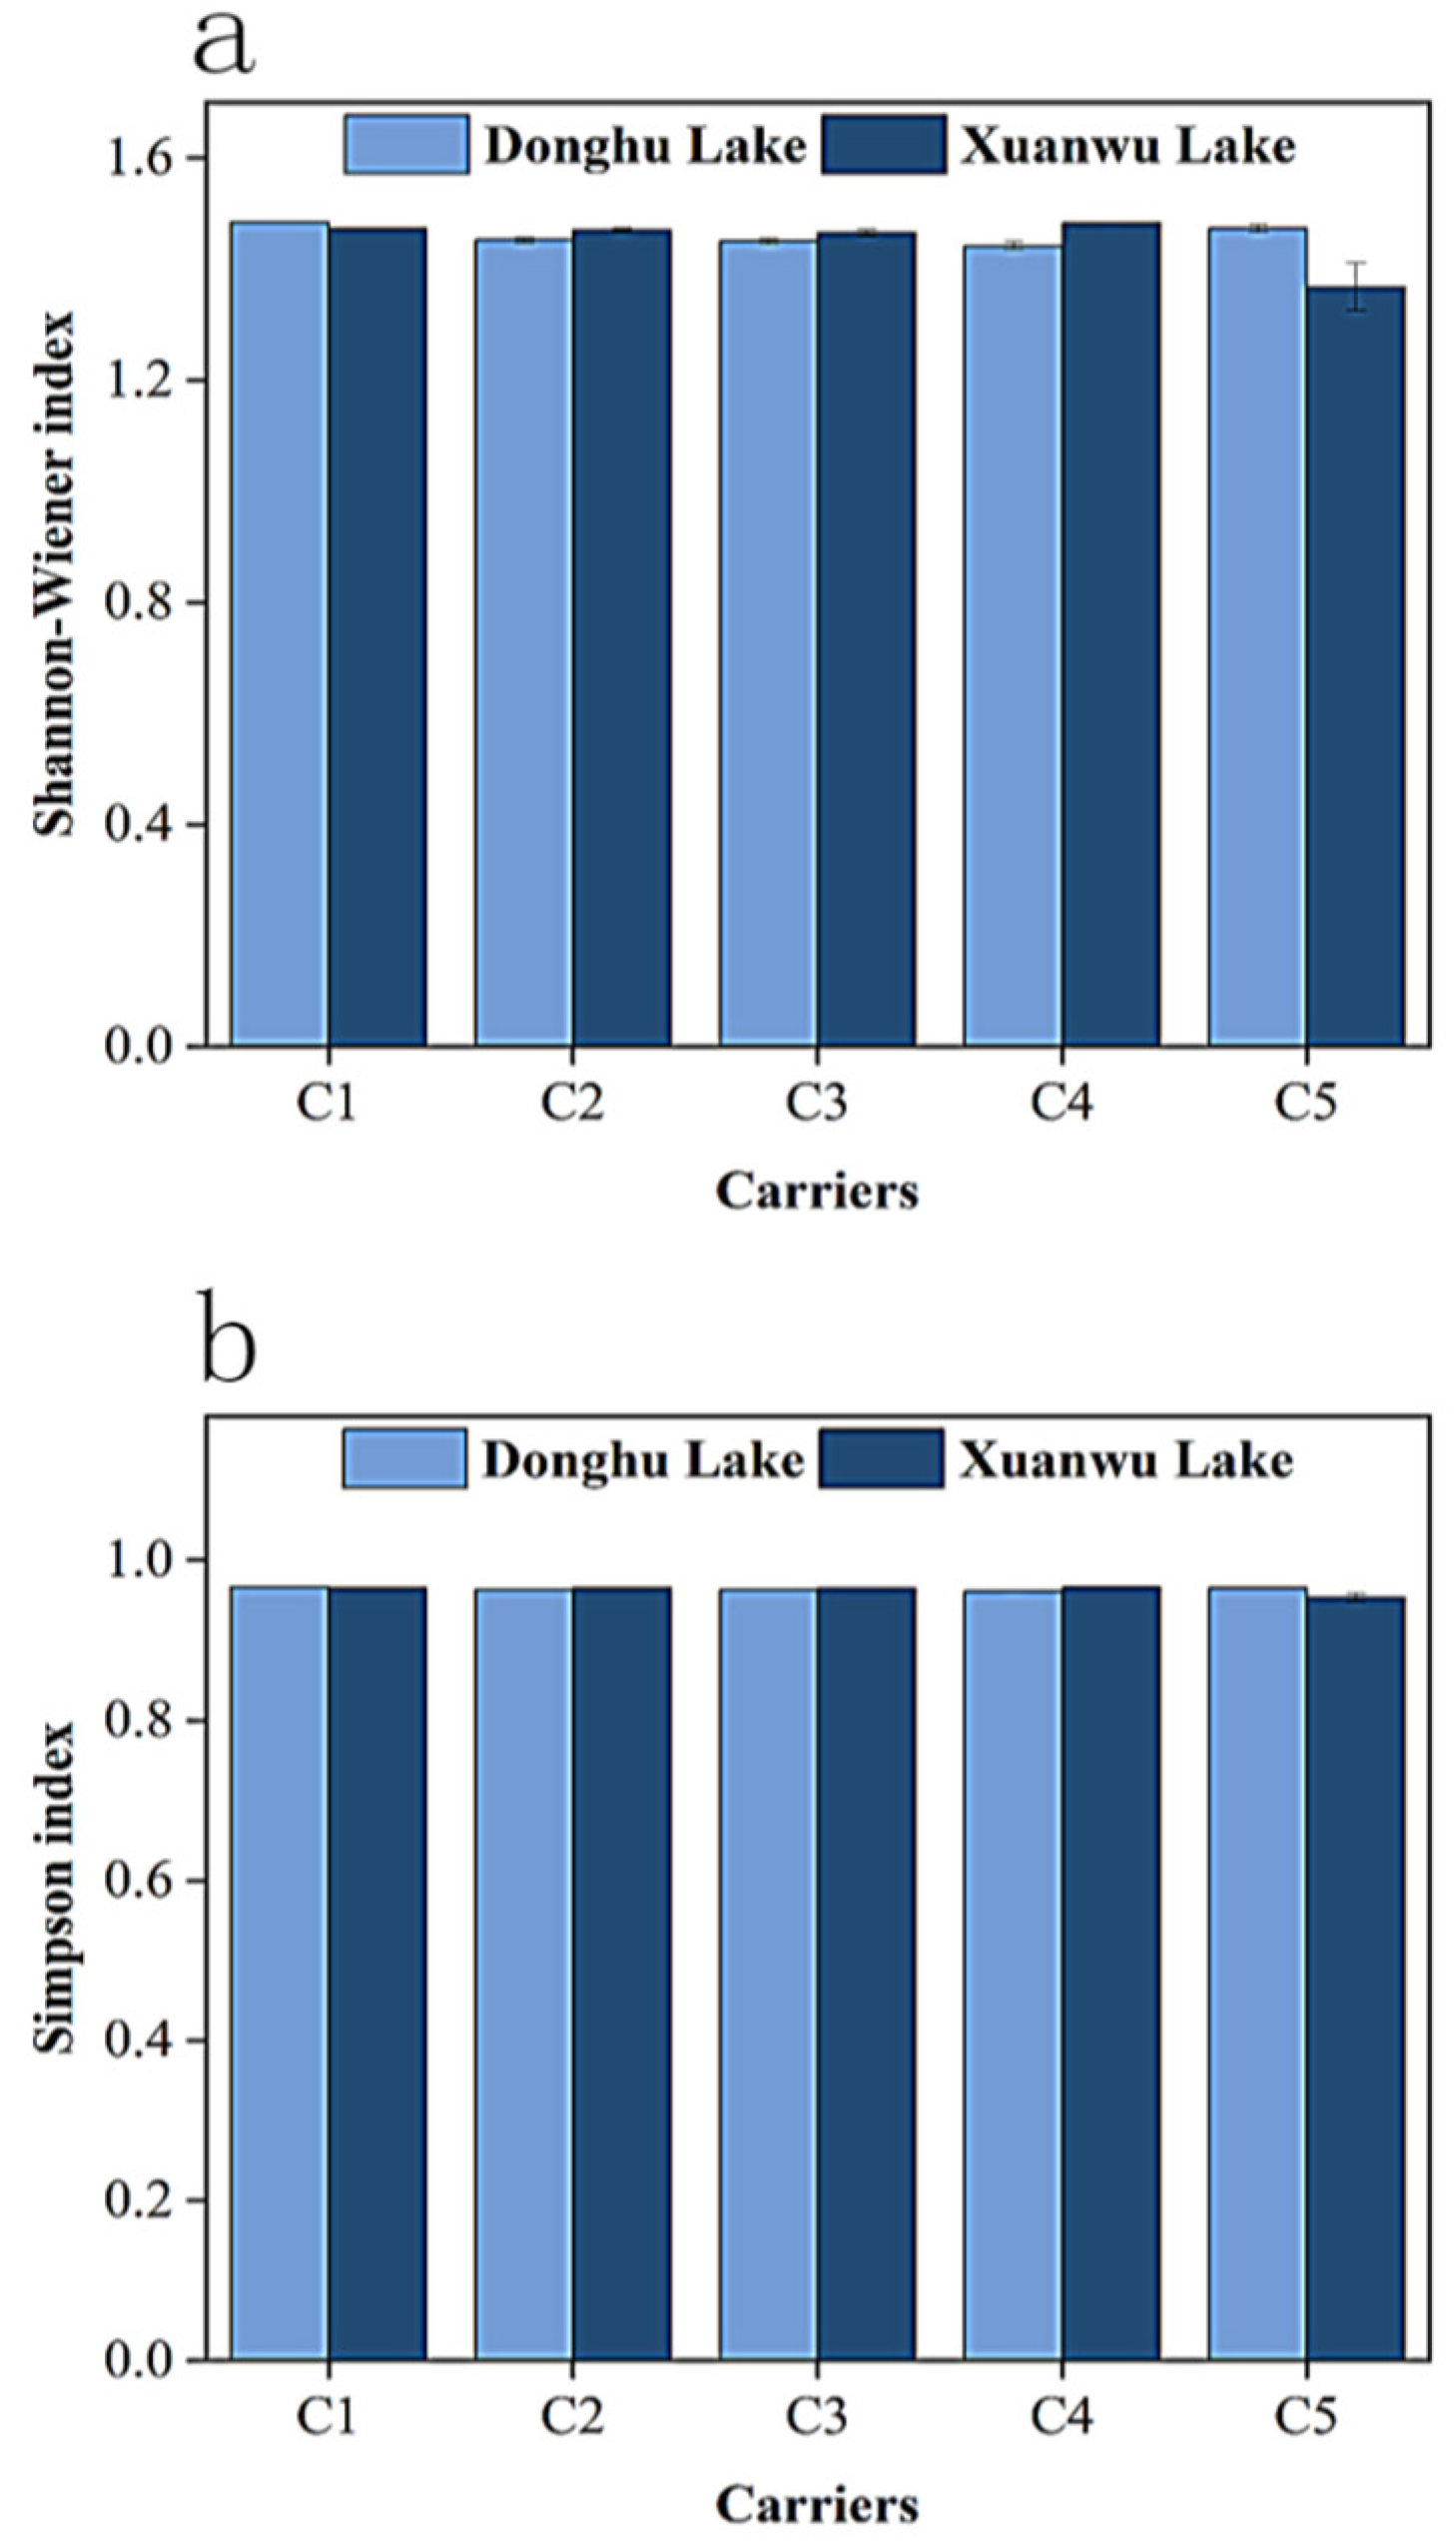
The Shannon-Wiener diversity and Simpson diversity index are linearly correlated with the relative abundance (evenness) of different carbon sources and log2 of the number of carbon sources used (richness) [30]. Therefore, the Shannon-Wiener diversity and Simpson diversity index can be used to characterize the richness and evenness of species in biofilm communities under different incubation conditions. According to the absorbance value of BIOLOG ECO microplate, the two indexes used in this experiment were calculated, as shown in Figure 6a,b.
The Shannon-Wiener index and Simpson index of Donghu Lake demonstrated no statistical difference (p > 0.05) with the increase in the specific surface area of the carrier, except that the Shannon-Wiener index and Simpson index of C1 were larger. In Xuanwu Lake, except for the Shannon-Wiener index of C5, there was no statistical difference between other groups (p > 0.05). For the Simpson index in this lake, there was no significant difference between the groups. The situation above shows that in the same water body, the change of carrier specific surface area has little effect on the Shannon-Wiener index and Simpson index of the biofilm.
Comparing the biofilm samples attached to the same carrier in the two lakes, we found that there were significant differences (p < 0.05) between the two lakes in the Shannon-Wiener index and Simpson index. For C2, C3 and C4, it could be summarized that the Shannon-Weir index and Simpson index in Xuanwu Lake were higher than those in Donghu Lake; For C1 and C5, the opposite was true. Thus, the environment influences the diversity of the community structure.
To sum up, in this experiment, compared with the specific surface area of the carrier, environmental factors have a greater impact on the biodiversity pattern of the biofilm, and the change of the specific surface area of the carrier has almost no influence on the richness and uniformity of microorganisms on the biofilm.
4. Discussion
In this paper, five kinds of artificial carriers were used for carbon metabolism analysis to explore the effect of specific surface area of carriers on carbon metabolism activity of biofilm. The results demonstrated that with the increase in the specific surface area, the carbon metabolism capacity of the biofilm would fluctuate. In Xuanwu Lake, the carbon metabolism rate of the biofilm demonstrated a linear correlation trend with a specific surface area, reaching the peak at the specific surface area of 7500 m2/m3, while in Donghu Lake, it demonstrated a parabolic trend that the carbon metabolism rate first increases and then decreases with the specific surface area, reaching the maximum at the specific surface area of 5000 m2/m3. After the carbon source classification, it can be found that with the change of carrier specific surface area, the carbon metabolism rate of some classified carbon sources in the two lakes was consistent with all carbon sources, that is, there was an optimal specific surface area to achieve the best utilization pattern of the classified carbon sources. In addition, by comparing the same carrier in the two lakes, it was found that the medium in the two lakes had an inactive utilization of miscellaneous carbon sources, and the environment also influenced the carbon metabolism capacity of the biofilm and had a greater impact on the diversity of the community structure.
The carrier properties, such as the specific surface area, surface roughness, hydrophobicity, and biocompatibility, are identified as selective factors of the biofilm community composition [31]. von Ammon et al. [32] found that when evaluating the impact of different matrix types on biofilm, compared with glass, the wood matrix was the preferred heterotrophic component because the surface of wood matrix can provide nutrients. Guo et al. [33] also found that in the biofilm formed on PP, PE and PET, the richness and diversity of prokaryotic and eukaryotic communities were significantly different, and the wettability was related to the richness of prokaryotic and eukaryotic microorganisms. The community composition of biofilm is an important determiner to the functional characteristics of microbial communities and plays an important role in the migration and transformation of pollution elements in water [34]. Relevant studies have confirmed that the characteristics of media will significantly change the function of biofilm, such as carbon cycle [13,22]. Among them, the selection of carrier specific surface area is one of the keys to the effective removal of organic matter in the biofilm system. A study on using coke and quartz sand as an artificial wetland substrate to incubate biofilm demonstrated that coke has a better COD removal effect, because the porous structure and large specific surface area of coke might be conducive to the growth and development of microorganisms and the adsorption of organic matter [35]. This can also verify the rationality of the linear correlation between carbon metabolic activity of biofilm and specific surface area in Xuanwu Lake. However, [36] compared the application of three biofilm carriers (sponge, zeolite and ceramsite) in urban sewage treatment. The research results demonstrated that due to the large specific surface area and excessive biomass attachment of the sponge, the biofilm dehydrogenase activity (DHA) attached to it was the lowest, indicating that its microbial activity was low and its ability to degrade organic pollutants was weak. In this paper, the research results of Donghu Lake are similar. Therefore, the specific surface area of the carrier is indeed related to the function of the biofilm, and the basic reason of its influence can be understood as the relationship between the specific surface area of the carrier and the activity of the biofilm. Generally speaking, the biomass of the biofilm is proportional to the specific surface area of the carrier [19]. With the increase in the biofilm biomass, carriers with higher surface area tend to form and maintain a thicker biofilm [37]. This promotes the carbon metabolic activity of biofilm due to the advantage of biomass to a certain extent. Hence, in Xuanwu Lake, the carbon metabolism rate grows with the increase in the specific surface area. However, the ability of biofilm to utilize external carbon sources is restricted by the matter transfer in water and biofilm [38]. We speculate that when a certain threshold is reached, excessive biofilm thickness can limit the mass transfer rate of biofilm, kill microorganisms in the inner layer, reduce the ability of biofilm to utilize carbon source, and then lead to the reduction in carbon metabolism rate and carbon metabolism activity. This is also the reason for the decrease in the carbon metabolism rate in the later stage of Donghu Lake.
Due to the limitations of the experimental design and methods, this paper only considers the effect of specific surface area conditions on the carbon metabolic activity of biofilm. However, other physical and chemical properties of the carrier, such as roughness, surface groups, hydrophobicity and so on, are not included in the scope of the study. In addition, this paper only selected two water bodies for the experiments, and the research on different water bodies needs to be strengthened. As a note, to measure metabolic activity with the BIOLOG plate, the biofilm is dispersed into a suspended mixture. This procedure may destroy the spatial arrangement of the biofilm and neighboring relationships between cells. The methods of dispersing biofilms into suspended mixtures prior to inoculation into BIOLOG plates have been used in many published papers [22,39].
5. Conclusions
(1) The carbon metabolic capacity of biofilm fluctuates with the increase in the specific surface area. In different water bodies, the carbon metabolic activity of biofilm shows different trends with the change of specific surface area. In Xuanwu Lake, the carbon metabolism rate of the biofilm shows a linear correlation with a specific surface area. In Donghu Lake, there is a trend of a single hump because of a mass transfer limitation. Therefore, the rule that the larger the specific surface area of the carrier, the higher the activity of the biofilm is not applicable to all lakes, and the mass transfer limitation should be considered.
(2) The carbon metabolic activity of specific classified carbon sources can maintain the regular pattern above, that is, there is a threshold (with Xunwu Lack of 7500 m2/m3 and Donghu Lack of 5000 m2/m3) to make the biofilm achieve the best utilization ability of classified carbon sources.
(3) The change of carriers’ specific surface area has little effect on the Shannon-Wiener index and Simpson index of the biofilm, indicating that there is little difference in the community structure of biofilm attached to carriers with different specific surface areas in this experiment.
(4) The carriers in the two lakes have low utilization of miscellaneous carbon sources, and the environment also influences the carbon metabolism capacity of biofilm and has a greater impact on the richness and evenness of species in biofilm communities.
Supplementary Materials
The following supporting information can be downloaded at: https://www.mdpi.com/article/10.3390/w14172735/s1. Table S1. Statistical difference analysis on environmental factors in the two lakes using one-way ANOVA. Table S2. Statistical difference analysis on AWCD asymptotic values of the same kind of artificial carrier in the two lakes using one-way ANOVA.
Author Contributions
Y.Z. and L.M. performed the experiments and wrote the manuscript. All authors have read and agreed to the published version of the manuscript.
Funding
We are grateful for the grants for the Project supported by the National Natural Science Foundation of China (No. 51979075, and No. 52039003), Key Research and Development Project of Tibet Autonomous Region Science and Technology Department (XZ202101ZY0016G).
Institutional Review Board Statement
Not applicable.
Informed Consent Statement
Not applicable.
Data Availability Statement
Data will be availability when requested.
Conflicts of Interest
The authors declare no conflict of interest.
References
- Zhang, W.; Wang, L.; Chen, L.; Shen, H.; Chen, J. Proliferation of filamentous green algae along with submerged macrophytes planting, and the role of microbe. Ecol. Eng. 2019, 139, 105570. [Google Scholar] [CrossRef]
- Karigar, C.S.; Rao, S.S. Role of Microbial Enzymes in the Bioremediation of Pollutants: A Review. Enzym. Res. 2011, 2011, 805187. [Google Scholar] [CrossRef] [PubMed]
- Tarjányi-Szikora, S.; Oláh, J.; Makó, M.; Palkó, G.; Barkács, K.; Záray, G. Comparison of different granular solids as biofilm carriers. Microchem. J. 2013, 107, 101–107. [Google Scholar] [CrossRef]
- Raj Deena, S.; Kumar, G.; Vickram, A.S.; Rani Singhania, R.; Dong, C.D.; Rohini, K.; Anbarasu, K.; Thanigaive, S.; Ponnusamy, V.K. Efficiency of various biofilm carriers and microbial interactions with substrate in moving bed-biofilm reactor for environmental wastewater treatment. Bioresour. Technol. 2022, 359, 127421. [Google Scholar] [CrossRef] [PubMed]
- Zhao, Y.; Liu, D.; Huang, W.; Yang, Y.; Ji, M.; Nghiem, L.D.; Trinh, Q.T.; Tran, N.H. Insights into biofilm carriers for biological wastewater treatment processes: Current state-of-the-art, challenges, and opportunities. Bioresour. Technol. 2019, 288, 121619. [Google Scholar] [CrossRef]
- Cross, W.F.; Wallace, J.B.; Rosemond, A.D. Nutrient enrichment reduces constraints on material flows in a detritus-based food web. Ecology 2007, 88, 2563–2575. [Google Scholar] [CrossRef]
- Blanco, Y.; Rivas, L.A.; González-Toril, E.; Ruiz-Bermejo, M.; Moreno-Paz, M.; Parro, V.; Palacín, A.; Aguilera, Á.; Puente-Sánchez, F. Environmental parameters, and not phylogeny, determine the composition of extracellular polymeric substances in microbial mats from extreme environments. Sci. Total Environ. 2019, 650, 384–393. [Google Scholar] [CrossRef]
- Kong, X.; Wang, C.; Ji, M. Analysis of microbial metabolic characteristics in mesophilic and thermophilic biofilters using Biolog plate technique. Chem. Eng. J. 2013, 230, 415–421. [Google Scholar] [CrossRef]
- Sooriyakumar, P.; Bolan, N.; Kumar, M.; Singh, L.; Yu, Y.; Li, Y.; Weralupitiya, C.; Vithanage, M.; Ramanayaka, S.; Sarkar, B.; et al. Biofilm formation and its implications on the properties and fate of microplastics in aquatic environments: A review. J. Hazard. Mater. Adv. 2022, 6, 100077. [Google Scholar] [CrossRef]
- Vincent, A.E.S.; Chaudhary, A.; Kelly, J.J.; Hoellein, T.J. Biofilm assemblage and activity on plastic in urban streams at a continental scale: Site characteristics are more important than substrate type. Sci. Total Environ. 2022, 835, 155398. [Google Scholar] [CrossRef]
- Al-Amshawee, S.; Yunus, M.Y.B.M.; Lynam, J.G.; Lee, W.H.; Dai, F.; Dakhil, I.H. Roughness and wettability of biofilm carriers: A systematic review. Environ. Technol. Innov. 2021, 21, 101233. [Google Scholar] [CrossRef]
- Miao, L.; Wang, C.; Adyel, T.M.; Zhao, J.; Yan, N.; Wu, J.; Hou, J. Periphytic Biofilm Formation on Natural and Artificial Substrates: Comparison of Microbial Compositions, Interactions, and Functions. Front. Microbiol. 2021, 12, 1917. [Google Scholar] [CrossRef] [PubMed]
- Xing, S.Y.; Wen, C.Z.; Yuan, L.B.; Liu, X.; Zhou, X.H.; Xiao, X.S.; Ma, Q.Q. Diversity and community composition of nirS-type denitrifying bacteria and ammonia-oxidizing archaea in biofilm samples attached to bio-substrate and abio-substrates in integrated ecological floating bed systems. Ecol. Eng. 2022, 180, 106641. [Google Scholar] [CrossRef]
- Gu, Q.Y.; Sun, T.C.; Wu, G.; Li, M.Y.; Qiu, W. Influence of carrier filling ratio on the performance of moving bed biofilm reactor in treating coking wastewater. Bioresour. Technol. 2014, 166, 72–78. [Google Scholar] [CrossRef] [PubMed]
- Tong, C.Y.; Derek, C.J.C. Membrane surface roughness promotes rapid initial cell adhesion and long term microalgal biofilm stability. Environ. Res. 2022, 206. [Google Scholar] [CrossRef]
- Lackner, S.; Holmberg, M.; Terada, A.; Kingshott, P.; Smets, B.F. Enhancing the formation and shear resistance of nitrifying biofilms on membranes by surface modification. Water Res. 2009, 43, 3469–3478. [Google Scholar] [CrossRef] [PubMed]
- Feng, Q.; Wang, Y.; Wang, T.; Zheng, H.; Chu, L.; Zhang, C.; Chen, H.; Kong, X.; Xing, X.-H. Effects of packing rates of cubic-shaped polyurethane foam carriers on the microbial community and the removal of organics and nitrogen in moving bed biofilm reactors. Bioresour. Technol. 2012, 117, 201–207. [Google Scholar] [CrossRef] [PubMed]
- Leiva-Aravena, E.; Vera, M.A.; Nerenberg, R.; Leiva, E.D.; Vargas, I.T. Biofilm formation of Ancylobacter sp. TS-1 on different granular materials and its ability for chemolithoautotrophic As(III)-oxidation at high concentrations. J. Hazard. Mater. 2022, 421, 126733. [Google Scholar] [CrossRef]
- Zhu, L.; Yuan, H.; Shi, Z.; Deng, L.; Yu, Z.; Li, Y.; He, Q. Metagenomic insights into the effects of various biocarriers on moving bed biofilm reactors for municipal wastewater treatment. Sci. Total Environ. 2022, 813, 151904. [Google Scholar] [CrossRef]
- Al-Amshawee, S.; Yunus, M.Y.B.M. Geometry of biofilm carriers: A systematic review deciding the best shape and pore size. Groundw. Sustain. Dev. 2021, 12, 100520. [Google Scholar] [CrossRef]
- Liu, Y.W.; Li, C.Y.; Lackner, S.; Wagner, M.; Horn, H. The role of interactions of effective biofilm surface area and mass transfer in nitrogen removal efficiency of an integrated fixed-film activated sludge system. Chem. Eng. J. 2018, 350, 992–999. [Google Scholar] [CrossRef]
- Miao, L.Z.; Yu, Y.; Adyel, T.M.; Wang, C.Q.; Liu, Z.L.; Liu, S.Q.; Huang, L.Y.; You, G.X.; Meng, M.; Qu, H.; et al. Distinct microbial metabolic activities of biofilms colonizing microplastics in three freshwater ecosystems. J. Hazard. Mater. 2021, 403, 123577. [Google Scholar] [CrossRef] [PubMed]
- Arias-Andres, M.; Kettner, M.T.; Miki, T.; Grossart, H.P. Microplastics: New substrates for heterotrophic activity contribute to altering organic matter cycles in aquatic ecosystems. Sci. Total Environ. 2018, 635, 1152–1159. [Google Scholar] [CrossRef] [PubMed]
- Miao, L.; Wang, C.; Adyel, T.M.; Wu, J.; Liu, Z.; You, G.; Meng, M.; Qu, H.; Huang, L.; Yu, Y.; et al. Microbial carbon metabolic functions of biofilms on plastic debris influenced by the substrate types and environmental factors. Environ. Int. 2020, 143, 106007. [Google Scholar] [CrossRef]
- Miki, T.; Yokokawa, T.; Ke, P.-J.; Hsieh, I.-F.; Hsieh, C.-H.; Kume, T.; Yoneya, K.; Matsui, K. Statistical recipe for quantifying microbial functional diversity from EcoPlate metabolic profiling. Ecol. Res. 2018, 33, 249–260. [Google Scholar] [CrossRef]
- Hou, J.; Li, T.F.; Miao, L.Z.; You, G.X.; Xu, Y.; Liu, S.Q. Dynamic responses of community structure and microbial functions of periphytic biofilms during chronic exposure to TiO2 NPs. Environ. Sci.-Nano 2020, 7, 665–675. [Google Scholar] [CrossRef]
- Button, M.; Nivala, J.; Weber, K.P.; Aubron, T.; Muller, R.A. Microbial community metabolic function in subsurface flow constructed wetlands of different designs. Ecol. Eng. 2015, 80, 162–171. [Google Scholar] [CrossRef]
- Liao, K.; Bai, Y.; Huo, Y.; Jian, Z.; Hu, W.; Zhao, C.; Qu, J. Integrating microbial biomass, composition and function to discern the level of anthropogenic activity in a river ecosystem. Environ. Int. 2018, 116, 147–155. [Google Scholar] [CrossRef]
- Ge, Z.W.; Du, H.J.; Gao, Y.L.; Qiu, W.F. Analysis on Metabolic Functions of Stored Rice Microbial Communities by BIOLOG ECO Microplates. Front. Microbiol. 2018, 9, 1375. [Google Scholar] [CrossRef]
- Miao, L.Z.; Guo, S.; Liu, Z.L.; Liu, S.Q.; You, G.X.; Qu, H.; Hou, J. Effects of Nanoplastics on Freshwater Biofilm Microbial Metabolic Functions as Determined by BIOLOG ECO Microplates. Int. J. Environ. Res. Public Health 2019, 16, 4639. [Google Scholar] [CrossRef] [Green Version]
- Dias, J.; Bellingham, M.; Hassan, J.; Barrett, M.; Stephenson, T.; Soares, A. Influence of carrier media physical properties on start-up of moving attached growth systems. Bioresour. Technol. 2018, 266, 463–471. [Google Scholar] [CrossRef] [PubMed]
- von Ammon, U.; Wood, S.A.; Laroche, O.; Zaiko, A.; Tait, L.; Lavery, S.; Inglis, G.; Pochon, X. The impact of artificial surfaces on marine bacterial and eukaryotic biofouling assemblages: A high-throughput sequencing analysis. Mar. Environ. Res. 2018, 133, 57–66. [Google Scholar] [CrossRef] [PubMed]
- Guo, X.P.; Chen, Y.R.; Sun, X.L.; Li, C.L.; Hou, L.J.; Liu, M.; Yang, Y. Plastic properties affect the composition of prokaryotic and eukaryotic communities and further regulate the ARGs in their surface biofilms. Sci. Total Environ. 2022, 839, 156362. [Google Scholar] [CrossRef] [PubMed]
- Brienza, M.; Sauvêtre, A.; Ait-Mouheb, N.; Bru-Adan, V.; Coviello, D.; Lequette, K.; Patureau, D.; Chiron, S.; Wéry, N. Reclaimed wastewater reuse in irrigation: Role of biofilms in the fate of antibiotics and spread of antimicrobial resistance. Water Res. 2022, 221, 118830. [Google Scholar] [CrossRef] [PubMed]
- Bai, S.Y.; Qin, L.Q.; Liu, L.H.; Gao, X.T.; Ding, Y.L.; Li, Y.H. Effect of substrate types on contaminant removals, electrochemical characteristics and microbial community in vertical flow constructed wetlands for treatment of urban sewage. J. Environ. Manag. 2021, 280, 111682. [Google Scholar] [CrossRef]
- Zhang, X.Y.; Li, J.; Yu, Y.B.; Xu, R.R.; Wu, Z.C. Biofilm characteristics in natural ventilation trickling filters (NVTFs) for municipal wastewater treatment: Comparison of three kinds of biofilm carriers. Biochem. Eng. J. 2016, 106, 87–96. [Google Scholar] [CrossRef]
- Young, B.; Banihashemi, B.; Forrest, D.; Kennedy, K.; Stintzi, A.; Delatolla, R. Meso and micro-scale response of post carbon removal nitrifying MBBR biofilm across carrier type and loading. Water Res. 2016, 91, 235–243. [Google Scholar] [CrossRef]
- Tang, B.; Song, H.L.; Bin, L.Y.; Huang, S.S.; Zhang, W.X.; Fu, F.L.; Zhao, Y.L.; Chen, Q.Y. Determination of the profile of DO and its mass transferring coefficient in a biofilm reactor packed with semi-suspended bio-carriers. Bioresour. Technol. 2017, 241, 54–62. [Google Scholar] [CrossRef]
- Lv, T.; Carvalho, P.N.; Zhang, L.; Zhang, Y.; Button, M.; Arias, C.A.; Weber, K.P.; Brix, H. Functionality of microbial communities in constructed wetlands used for pesticide remediation: Influence of system design and sampling strategy. Water Res. 2017, 110, 241–251. [Google Scholar] [CrossRef]
Figure 1.
Comparison of metabolic patterns between five carriers with different specific surface areas (C1–C5) in two incubation sites, including Donghu Lake (a) and Xuanwu Lake (b), and five curves with different shapes of dispersion points represent the fitting curves of five carriers, respectively. Comparison of carbon sources utilization of all carbon sources between five carriers with different specific surface areas (C1–C5) in two incubation sites, including Donghu Lake (c) and Xuanwu Lake (d), and different letters, represent a significant difference at p-value < 0.05 by using one-way ANOVA (comparison of biofilm samples from the same station).

Figure 2.
Comparison of carbon metabolism rate between five carriers with different specific surface areas (C1–C5) in Xuanwu Lake (a), and the fitting curve between carbon metabolism rate and carriers’ specific surface area in Xuanwu Lake (b). Comparison of carbon metabolism rate between five carriers with different specific surface areas (C1–C5) in Donghu Lake (c), and the fitting curve between carbon metabolism rate and carriers’ specific surface area in this lake (d). The letters represent a significant difference at p-value < 0.05 by using one-way ANOVA (comparison of biofilm samples from the same station).

Figure 3.
The carbon sources utilization of six carbon source groups between five carriers with different specific surface areas (C1–C5) in two incubation sites, including Donghu Lake (a) and Xuanwu Lake (b).
Figure 3.
The carbon sources utilization of six carbon source groups between five carriers with different specific surface areas (C1–C5) in two incubation sites, including Donghu Lake (a) and Xuanwu Lake (b).

Figure 4.
The carbon metabolism rate of biofilm attached to five carriers with different specific surface areas (C1–C5) in Donghu Lake (a), and the fitting curve between carbon metabolism rate of specific carbon sources (polymers, carbohydrates, carboxylic acids and amino acids) and carriers’ specific surface area in this lake (b–e).

Figure 5.
The carbon metabolism rate of biofilm attached to five carriers with different specific surface areas (C1–C5) in Xuanwu Lake (a), and the fitting curve between carbon metabolism rate of amino acids and carriers’ specific surface area in this lake (b).
Figure 5.
The carbon metabolism rate of biofilm attached to five carriers with different specific surface areas (C1–C5) in Xuanwu Lake (a), and the fitting curve between carbon metabolism rate of amino acids and carriers’ specific surface area in this lake (b).

Figure 6.
The Shannon-Wiener index (a) and Simpson index (b) of biofilm attached to five carriers with different specific surface areas (C1–C5) in two incubation sites, including Donghu Lake and Xuanwu Lake.
Figure 6.
The Shannon-Wiener index (a) and Simpson index (b) of biofilm attached to five carriers with different specific surface areas (C1–C5) in two incubation sites, including Donghu Lake and Xuanwu Lake.


Table 1.
Specific surface area data of different carriers.
| Number | Specific Surface Area (m²/m³) | Material Quality | Apparent Morphology |
|---|---|---|---|
| C1 | 380 | Polypropylene |  |
| C2 | 800 | Polypropylene + polyurethane |  |
| C3 | 1300 | Fiber + Polyester Yarn |  |
| C4 | 5000 | Polypropylene + vinylon aldehyde fiber |  |
| C5 | 7500 | Vinylon aldehyde fiber |  |
Table 2.
Physical and chemical index of water body.
| Index | DH | XWH |
|---|---|---|
| Temperature (°C) | 17.620 ± 0.069 | 17.740 ± 2.069 |
| Atmospheric pressure (mmHg) | 764.340 ± 0.195 | 764.480 ± 2.381 |
| DO (mg/L) | 7.874 ± 0.073 | 10.186 ± 2.633 |
| C (-us/cm) | 278.980 ± 33.557 | 252.860 ± 7.024 |
| ORP (mv) | 192.160 ± 23.528 | 182.780 ± 19.967 |
| Turbidity (NTU) | 15.738 ± 1.306 | 24.306 ± 4.622 |
| TN (mg/L) | 1.734 ± 0.615 | 0.546 ± 0.201 |
| NH4+-N (mg/L) | 0.778 ± 0.205 | 0.358 ± 0.117 |
| TC (mg/L) | 29.638 ± 1.570 | 25.340 ± 1.450 |
| DOC (mg/L) | 4.398 ± 0.874 | 3.782 ± 0.564 |
| TP (mg/L) | 0.087 ± 0.014 | 0.119 ± 0.025 |
| CODMn (mg/L) | 2.745 ± 0.469 | 3.700 ± 0.591 |
Publisher’s Note: MDPI stays neutral with regard to jurisdictional claims in published maps and institutional affiliations. |
© 2022 by the authors. Licensee MDPI, Basel, Switzerland. This article is an open access article distributed under the terms and conditions of the Creative Commons Attribution (CC BY) license (https://creativecommons.org/licenses/by/4.0/).
Share and Cite
MDPI and ACS Style
Zhu, Y.; Miao, L. Effects of Specific Surface Area of Artificial Carriers on Carbon Metabolism Activity of Biofilm. Water 2022, 14, 2735. https://doi.org/10.3390/w14172735
AMA Style
Zhu Y, Miao L. Effects of Specific Surface Area of Artificial Carriers on Carbon Metabolism Activity of Biofilm. Water. 2022; 14(17):2735. https://doi.org/10.3390/w14172735
Chicago/Turabian StyleZhu, Ye, and Lingzhan Miao. 2022. "Effects of Specific Surface Area of Artificial Carriers on Carbon Metabolism Activity of Biofilm" Water 14, no. 17: 2735. https://doi.org/10.3390/w14172735
Note that from the first issue of 2016, this journal uses article numbers instead of page numbers. See further details here.