
The Impacts of Climate Change on the Irrigation Water Demand, Grain Yield, and Biomass Yield of Wheat Crop in Nepal
by
 , , and
Santosh Kaini
1,2,* ,
,
Matthew Tom Harrison
3,
Ted Gardner
1,
Santosh Nepal
4,5 and
Ashok K. Sharma
1,* 1
Institute for Sustainable Industries & Liveable Cities, Victoria University, Footscray Park Campus, Melbourne, VIC 8001, Australia
2
Department of Water Resources and Irrigation, Government of Nepal, Kathmandu 44600, Nepal
3
Tasmanian Institute of Agriculture, University of Tasmania, Newnham Drive, Launceston, TAS 7248, Australia
4
International Water Management Institute, Kathmandu 44600, Nepal
5
International Centre for Integrated Mountain Development, Kathmandu 44600, Nepal
*
Authors to whom correspondence should be addressed.
Water 2022, 14(17), 2728; https://doi.org/10.3390/w14172728
Submission received: 2 August 2022
/
Revised: 27 August 2022
/
Accepted: 28 August 2022
/
Published: 1 September 2022
(This article belongs to the Special Issue How Does Agricultural Water Resources Management Adapt to Climate Change?)
Abstract
:The Nepalese Sunsari Morang Irrigation district is the lifeblood of millions of people in the Koshi River basin. Despite its fundamental importance to food security, little is known about the impacts of climate change on future irrigation demand and grain yields in this region. Here, we examined the impacts of climate change on the irrigation demand and grain yield of wheat crop. Climate change was simulated using Representative Concentration Pathways (RCPs) of 4.5 and 8.5 for three time horizons (2016–2045, 2036–2065, and 2071–2100) in the Agricultural Production Systems Simulator (APSIM). For the field data’s measured period (2018–2020), we showed that farmers applied only 25% of the irrigation water required to achieve the maximum potential grain yield. Actual yields were less than 50% of the potential yields. Projected irrigation water demand is likely to increase for RCP4.5 (3%) but likely to decrease under RCP8.5 (8%) due to the truncated crop duration and lower maturity biomass by the end of the 21st century. However, simulated yields declined by 20%, suggesting that even irrigation will not be enough to mitigate the severe and detrimental effects of climate change on crop production. While our results herald positive implications for irrigation demand in the region, the implications for regional food security may be dire.
1. Introduction
Food production systems must transform if they are to meet the future growth in food demand [1], given increasingly challenging climatic conditions and extreme climate events [2,3]. Increasing food production per unit of agricultural land (e.g., tonnes/hectare) as well as per unit of water use [4,5] will be required in the coming decades to satisfy the demands of a burgeoning global population in the face of climate change [6,7]. Sustainable intensification of food production must occur whilst ensuring greenhouse gas emissions are maintained or reduced [8,9,10], nitrogen use efficiencies are increased to minimise environmental nitrogen losses [11,12,13], and the global Sustainable Development Goals are met [14].
One form of sustainable intensification of food production is irrigation. Irrigated agricultural food production systems use 70% of global annual water consumption [15,16,17], and whilst irrigated land use comprises only 16% of global cropland, irrigated landscapes produce around 44% of the total food production [18]. The expansion of irrigated food systems thus comprises an opportunity for sustainable intensification, provided water use is (1) equitable and socially inclusive, (2) environmentally sustainable, and (3) economically viable [19,20,21,22].
Climatic variability and change have implications not only for crop water use and water availability for agriculture but also for crop development [23]. Lobell et al. [24] argue that climate change will adversely impact the agricultural sector in South Asia if adaptation measures are not urgently implemented. Marginalised communities, women, and children will be the most vulnerable groups in terms of food security under climate change [25]. Adaptation strategies for agricultural systems are required to cope with climate change impacts on water demands for irrigation [26].
The impacts of climate change on agricultural production are often negative, heralding a bleak future for consistent and sustainable food production from grain cereals. Mirgol et al. [27] modelled climate change impacts on the grain yields of winter wheat in Iran (2030s, 2050s, and 2080s) and showed that irrigation water requirements increased by 40-80% compared with the 1986–2015 period, resulting in a 60–100% reduction in crop yields. Mostafa et al. [28] reported that the irrigation water requirement is likely to increase by 6.2 and 11.8% in 2050 and 2100, respectively, and the yield is expected to decrease by 8.6 and 11.1% in 2050 and 2100, respectively, for wheat crops compared with the current conditions in Egypt. Poonia et al. [29] reported that the irrigation water requirement for wheat crops in west Sikkim India is likely to increase by around 50% in 2100 compared with the reference period (1998–2015). In Morocco, Bouras et al. [30] assessed climate change impacts on irrigation water requirements and wheat grain and found that future irrigation water demand and grain yields would decrease by 13–42% and 7–30%, respectively, during the 2050s and 2090s for RCP4.5 and RCP8.5, respectively. Studies have shown that agricultural production has been reduced due to climate change impacts in India [31,32]. Such yield declines were attributed to (1) reduced rainfall, (2) altered distribution of seasonal rainfall, particularly during critical crop growth stages, (3) severe heat stress events around anthesis, and (4) increased rates of crop development causing early maturity (e.g., [33,34]). Earlier maturity often penalises yields since the growing duration is truncated. This results in less above-ground biomass for retranslocation for developing grain ears after anthesis [35]. While the effects of climate change on rainfed agricultural systems have been well explored [6,33,34], there has been less work on the effects of climate change and extreme climatic events on irrigated cropping systems. This is particularly the case in Nepal, despite the fact that irrigated systems are the lifeblood of millions of people in the region.
In any cropping system, the actual yields are less than the potential yields due to cumulative exposure of crops to biotic and abiotic factors over the crops’ lifetime. Such factors may include pests, weeds or diseases, suboptimal nutrients, or a poor irrigation regime [33,34]. There is often a gap between crop irrigation water requirements and actual irrigation water application in many irrigation schemes around the world, especially in developing countries [15,36,37,38]. Consequently, the actual yields may be less than the potential yields due to poor irrigation management (e.g., scheduling), a lack of available water, competing commitments for a farmer’s time, inadequate irrigation infrastructure, financial limitations, and social barriers, such as a lack of understanding of best management practises [39]. Applying excessive water can result in waterlogging, anoxic conditions, and loss of a precious resource [40,41], while applying insufficient water can result in acute or chronic drought stress. Hence, either superfluous or suboptimal irrigation quanta inhibit the realisation of high water use efficiencies because the biomass production per unit of water use is generally reduced.
Here, we assess the impacts of climate change on the irrigation water requirements, phenology, and yields of wheat crop for the short (2016–2045), middle (2036–2065), and end-of-century (2071–2100) time horizons using middle (RCP4.5) and severe (RCP8.5) emissions scenarios. Future climate data were obtained at a high spatial resolution across the Nepal Eastern Terai region, an area predominated by cropping systems involving wheat crop in winter season. Downscaled data from ensembles of global circulation models (GCMs), representing the four corners of climatic extremes—cold and dry, warm and dry, cold and wet, and warm and wet—were used for each time horizon and climate change scenario in a contemporary farming system model. Through field experiments and farmer engagement, we also explored the amount of irrigation required to reach the potential grain yields under the current conditions and compared these with the existing irrigation practices applied by Nepalese farmers. Specifically, the objectives of this paper were to (1) develop a generalised, scalable methodology to assess the impacts of climate change on the crop irrigation water requirements, phenology, and yield in an irrigation scheme, (2) quantify the impacts of climate change on irrigation requirements, crop phenology, and the yield of wheat using high-resolution downscaled precipitation and temperature data, and (3) quantify the difference between the actual irrigation applied and the amount required to attain the potential yields in the Sunsari Morang Irrigation Scheme.
2. Materials and Methods
2.1. Study Area
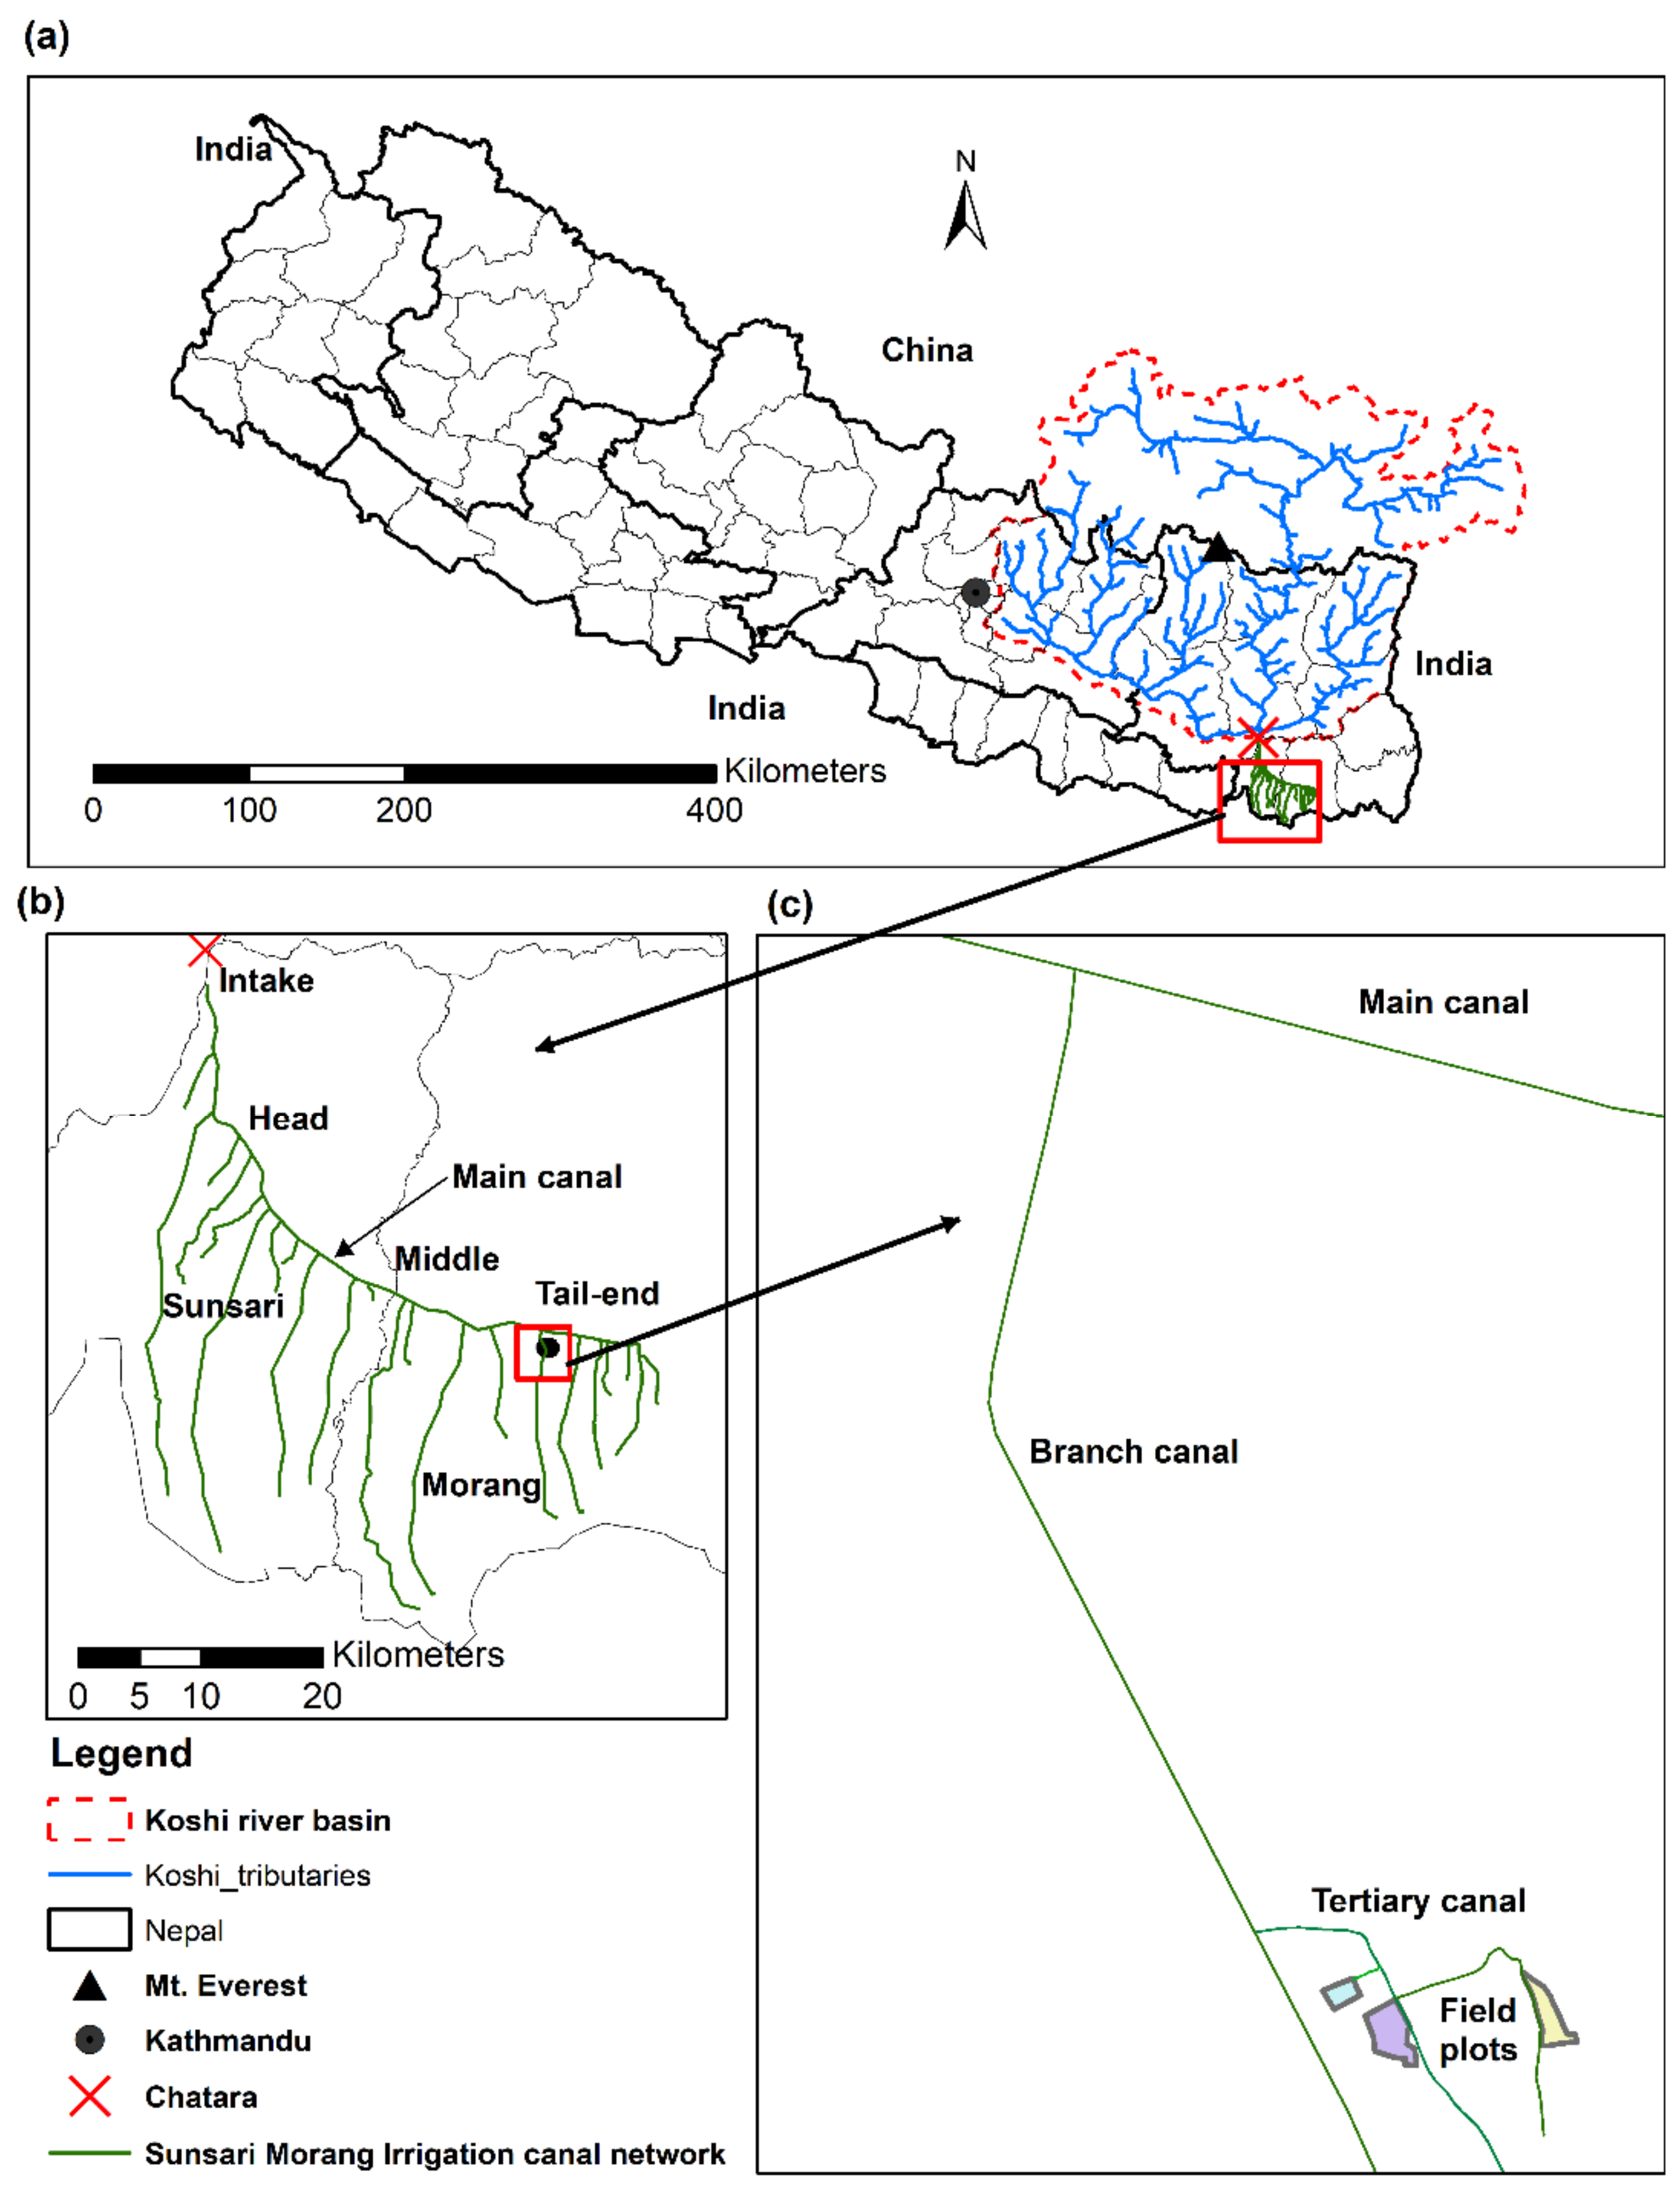
With a command area of 68,000 ha that supports more than a million people, the Sunsari Morang Irrigation Scheme is the largest and perhaps most important irrigation scheme in Nepal. The scheme lies in the southeastern region of Nepal (Figure 1a) and was constructed about 50 years ago. The Terai region in southern Nepal is characterised by a large colluvial plain abutting the base of the Himalayan mountain range, colloquially referred to as the ‘food basket of Nepal’. The Koshi River supplies water to the Sunsari Morang Irrigation Scheme. There is no permanent diversion structure (barrage or weir) in the headworks on the Koshi River, and the water is diverted from the side intakes. The river water overflows into the main irrigation canal via the side intake by gravity. To access water, farmers pay an annual access fee based on the potential irrigated area (USD 0.30/ha/year). At the time of writing, farmers do not have to pay for water per unit volume. Over the last 5 years, the average annual irrigation service fee collected was USD 20,800 from the entire farmland of the irrigation scheme (1 USD = 110 Nepalese Rupees (NPR)) [42]. Although water is generally available at the head of the canal, farmers at the tail often do not receive water during the critical water requirement stages of crop growth (Figure 1b). Wheat is one of the most common crops grown in the region, with around 43,900 ha typically sown each winter.
2.2. Study Overview
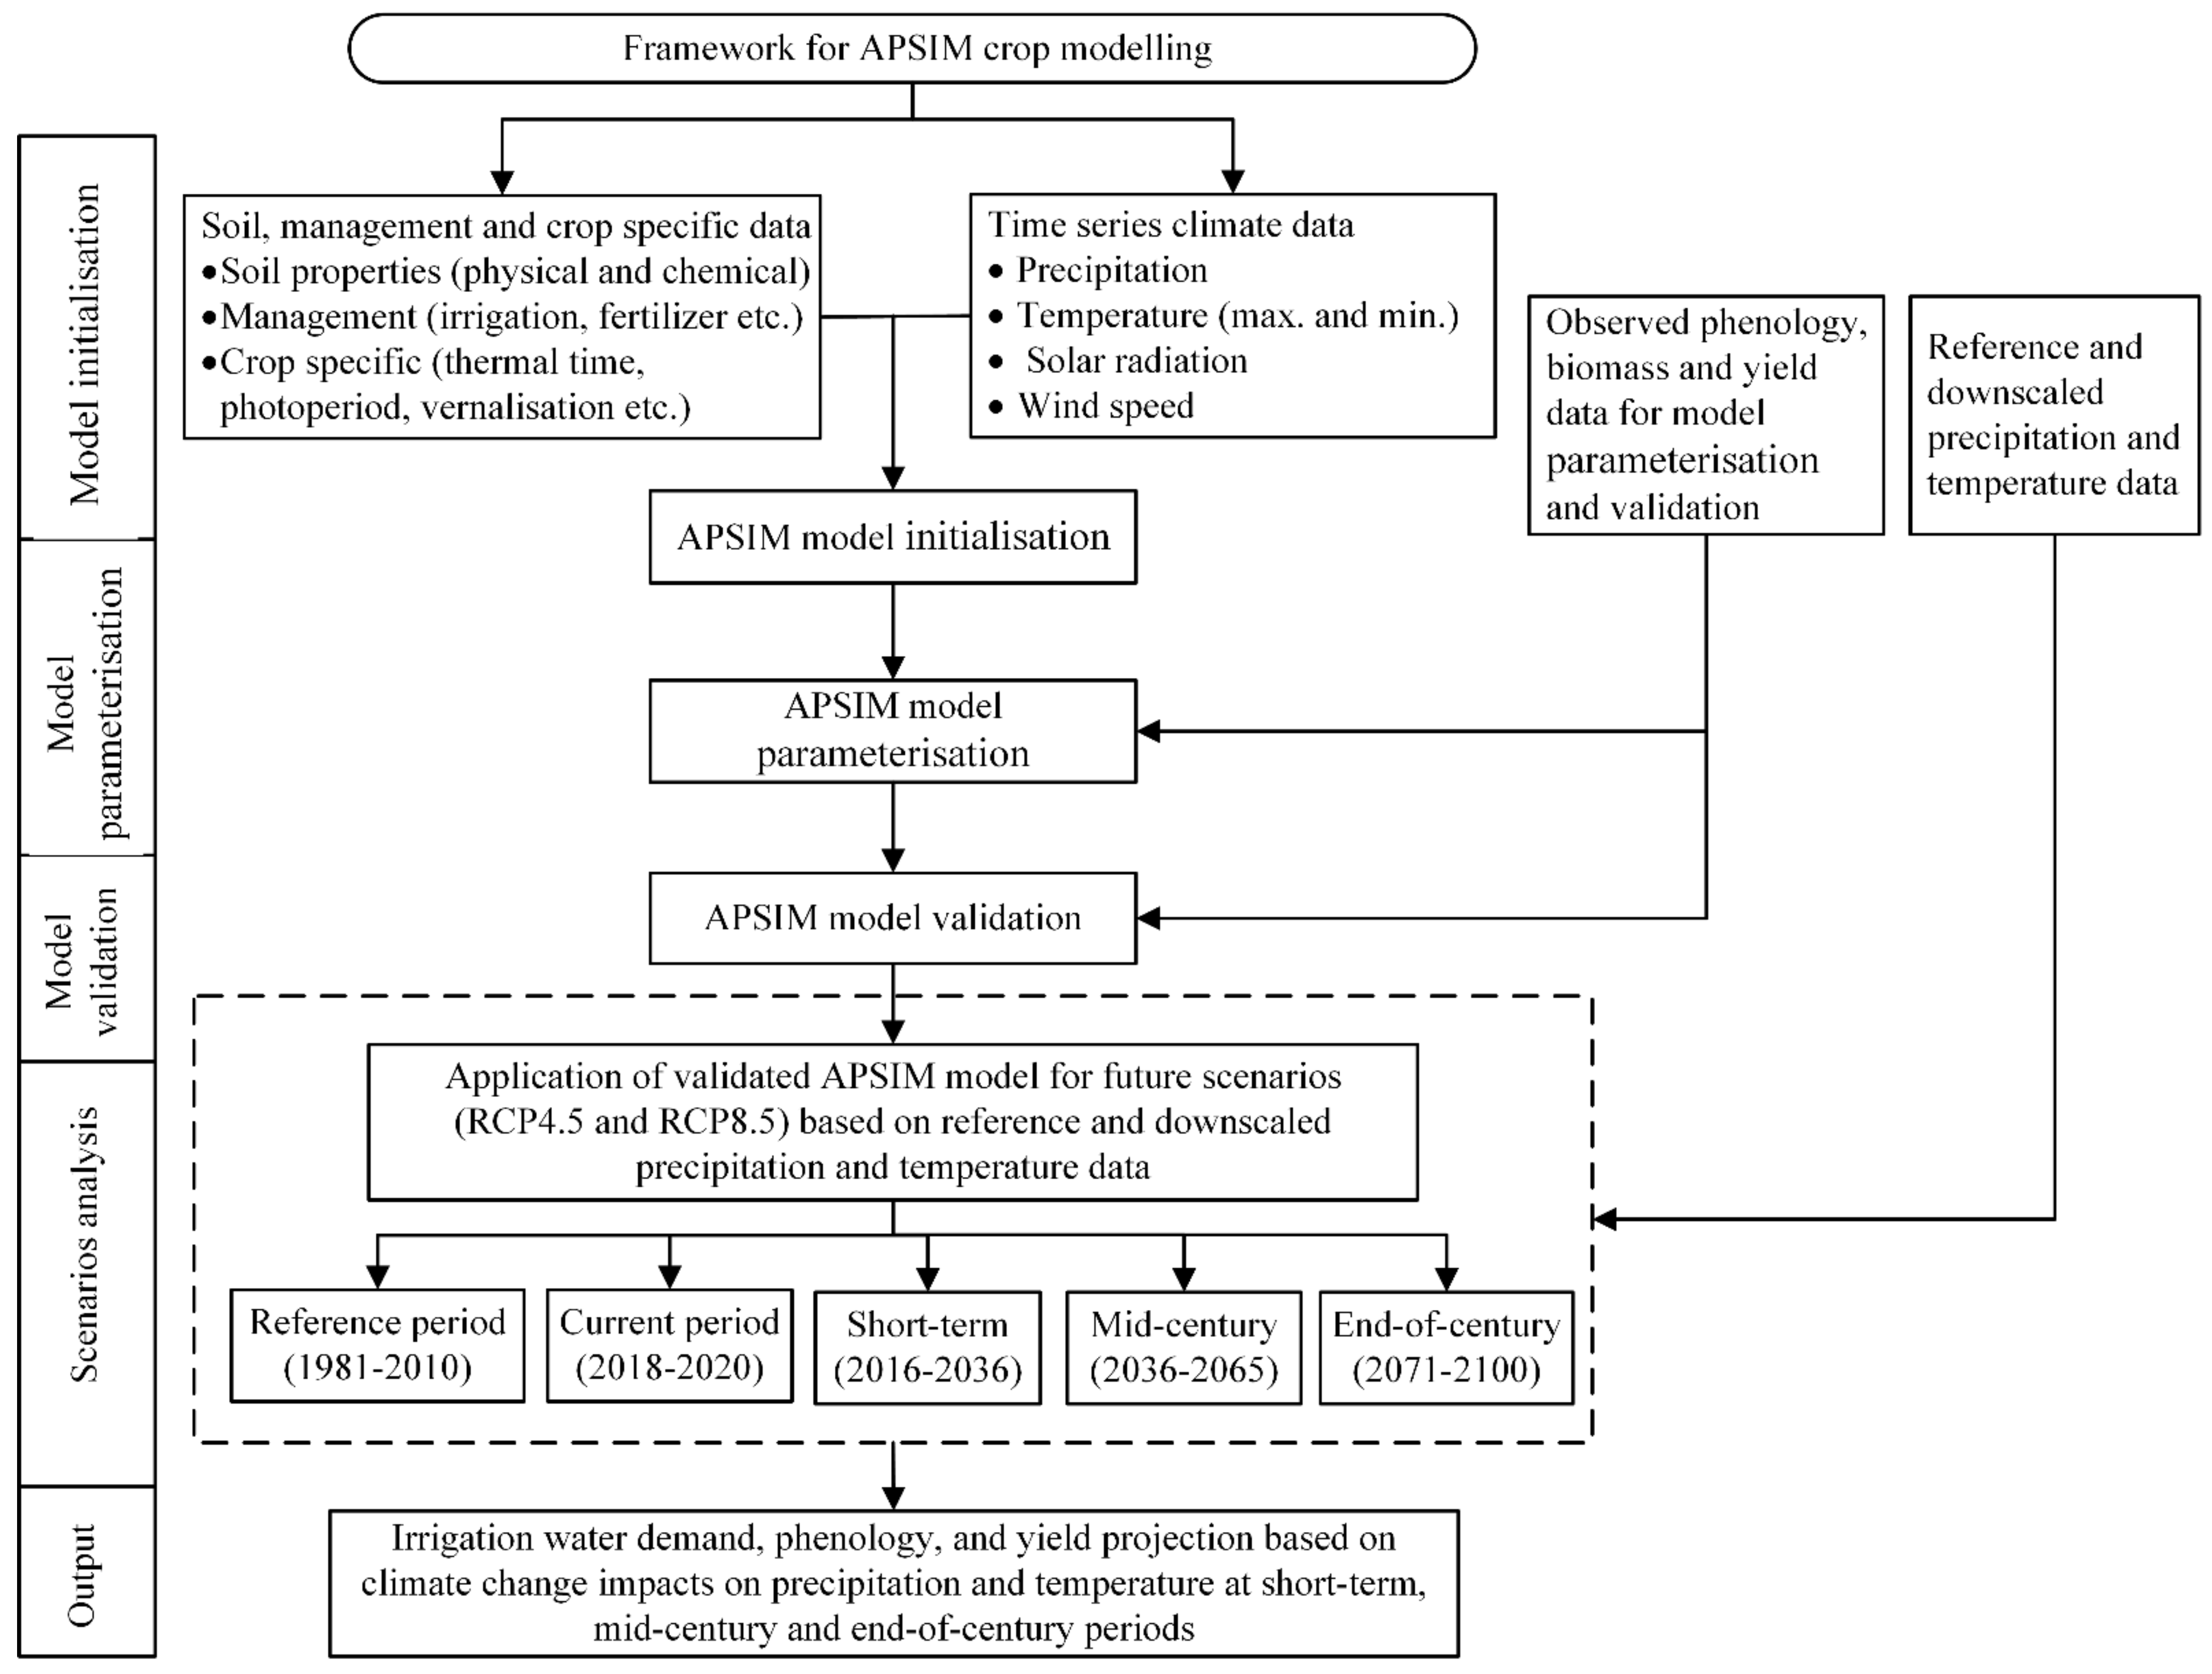
A schematic of the study design is shown in Figure 2. Key steps included model initialisation, parameterisation, validation, scenario analysis, and output. These steps are described in the following sections.
2.3. Cropping System Modelling with the Agricultural Productions Systems Simulator (APSIM)
APSIM is an international farming system model that allows customisable sub-models (biophysical, management, data input and output etc.) [43]. APSIM combines biophysical modules to simulate cropping systems at a daily time step, accounting for climate, surface and soil organic matter, management options, soil water, soil organic matter, and other biophysical and biochemical soil properties. Past work has shown that APSIM reliably simulates manifold cropping systems, including paddy rice, wheat, chickpea, canola, cotton, maize, millet, mung bean, sorghum, and sunflower [7,44,45,46,47]. The APSIM-Wheat model [48] has been successfully calibrated and validated in many parts of the world, including Australia [20,33,49,50,51,52,53,54,55], China [40,56,57,58,59,60], Ethiopia [61], Iran [62], and India [63]. APSIM-Wheat v7.10-r4158 was used to conduct all simulations in this study.
2.4. Model Initialisation
APSIM was initialised by following Harrison et al. [46], using soil data measured from the study area and management information from field experiments (Table 1 and Supplementary Table S1, detailed below). Daily climate data from 2016 to 2020 for the Sunsari Morang irrigation command area were downloaded from APSIM Next Generation [64]. Beginning with the parameters for the base genotype in the APSIM-Wheat XML, we developed a new genotype (‘Nepal 297’) by following the procedure described in the parameterisation section below.
2.4.1. Locations of Experimental Farm Plots
Three farm plots were selected from a command area within the Bariyati branch canal to monitor wheat crop during 2018–2019 and 2019–2020 (Figure 2). Plot locations were chosen on the basis of (1) farmers who were willing to conduct participatory research and (2) locations representing dominant soil groups, as shown by soil maps (government of Nepal). Such fragmented land use patterns and irregularly shaped farm plots are common in the Sunsari Morang Irrigation Scheme’s command area. The field plots varied from 1231 m2 to 3772 m2 in 2018–2019 and from 670 m2 to 2370 m2 in 2019–2020.
2.4.2. Historical and Future Climate Data
Daily climate data for precipitation, minimum temperature, maximum temperature, solar radiation, and wind speed for the Sunsari Morang area were obtained from APSIM Next Generation [64] from 1 January 2016 to 31 December 2020. Future climate scenarios were considered for the short term (2016–2045), middle of the century (2036–2065), and end of the century (2071–2100) for RCP4.5 and RCP8.5 using the downscaled daily precipitation, minimum temperature, and maximum temperature data. An advanced envelope-based selection approach was applied to select representative GCMs representing four corners of climatic extremes: cold and dry, warm and dry, cold and wet, and warm and wet. GCMs were selected considering an advanced envelope-based selection approach from a pool of 105 and 78 GCMs and ensembles for representative concentration pathways (RCPs) 4.5 and 8.5, respectively, from Coupled Model Intercomparison Project—Phase 5. The GCM and ensemble data were downloaded from the Royal Netherlands Meteorological Institute’s (KNMI) Climate Explorer (https://climexp.knmi.nl/start.cgi) in 15 July 2018. The GCM selection and downscaling were parts of the overall research project and reported in Kaini et al. [65]. Climate datasets for the reference period (1981–2010) were downloaded from the Regional Database System of The International Centre for Integrated Mountain Development (http://rds.icimod.org/clim, accessed on 15 July 2018). Lutz et al. [66] developed climate datasets for the Indus, Ganges, and Brahmaputra River basins using Watch Forcing based on the ERA-interim dataset, which were bias corrected using Global Precipitation Climatology Centre (GPCC) and glacier mass balance data. These datasets have been widely used in various other studies [65,67,68,69].
2.4.3. Soil Data
Soil samples were collected in 10-cm intervals from ground level to 30 cm in depth and in 20-cm intervals from 30 to 90 cm in depth, and laboratory tests were conducted in soil laboratories in Australia and Nepal (Table 1). The soil samples were taken from a hand-driven auger. The bulk density was measured using a cylindrical galvanised iron pipe with a 7-cm diameter and 7.5 cm in height. The saturated hydraulic conductivity (Ks) was estimated following the method used by Dingman [70]. The soil chemical properties are shown in Supplementary Table S1.
2.4.4. Crop Management
In 2018–2019, the sowing date, seedling density, sowing depth, fertilizer at sowing, and subsequent fertilizer application were 7 December 2018, 125 plants/m2, 15 mm, DAP: 87 kg/ha, and urea equivalent to 70 kg N/ha, respectively. In 2019–2020, the sowing date, seedling density, sowing depth, fertilizer applied at sowing, and subsequent fertilizer application were 12 December 2019, 130 plants/m2, 15 mm, DAP:110 kg/ha, and urea equivalent to 150 kg N/ha, respectively.
2.4.5. Irrigation Management
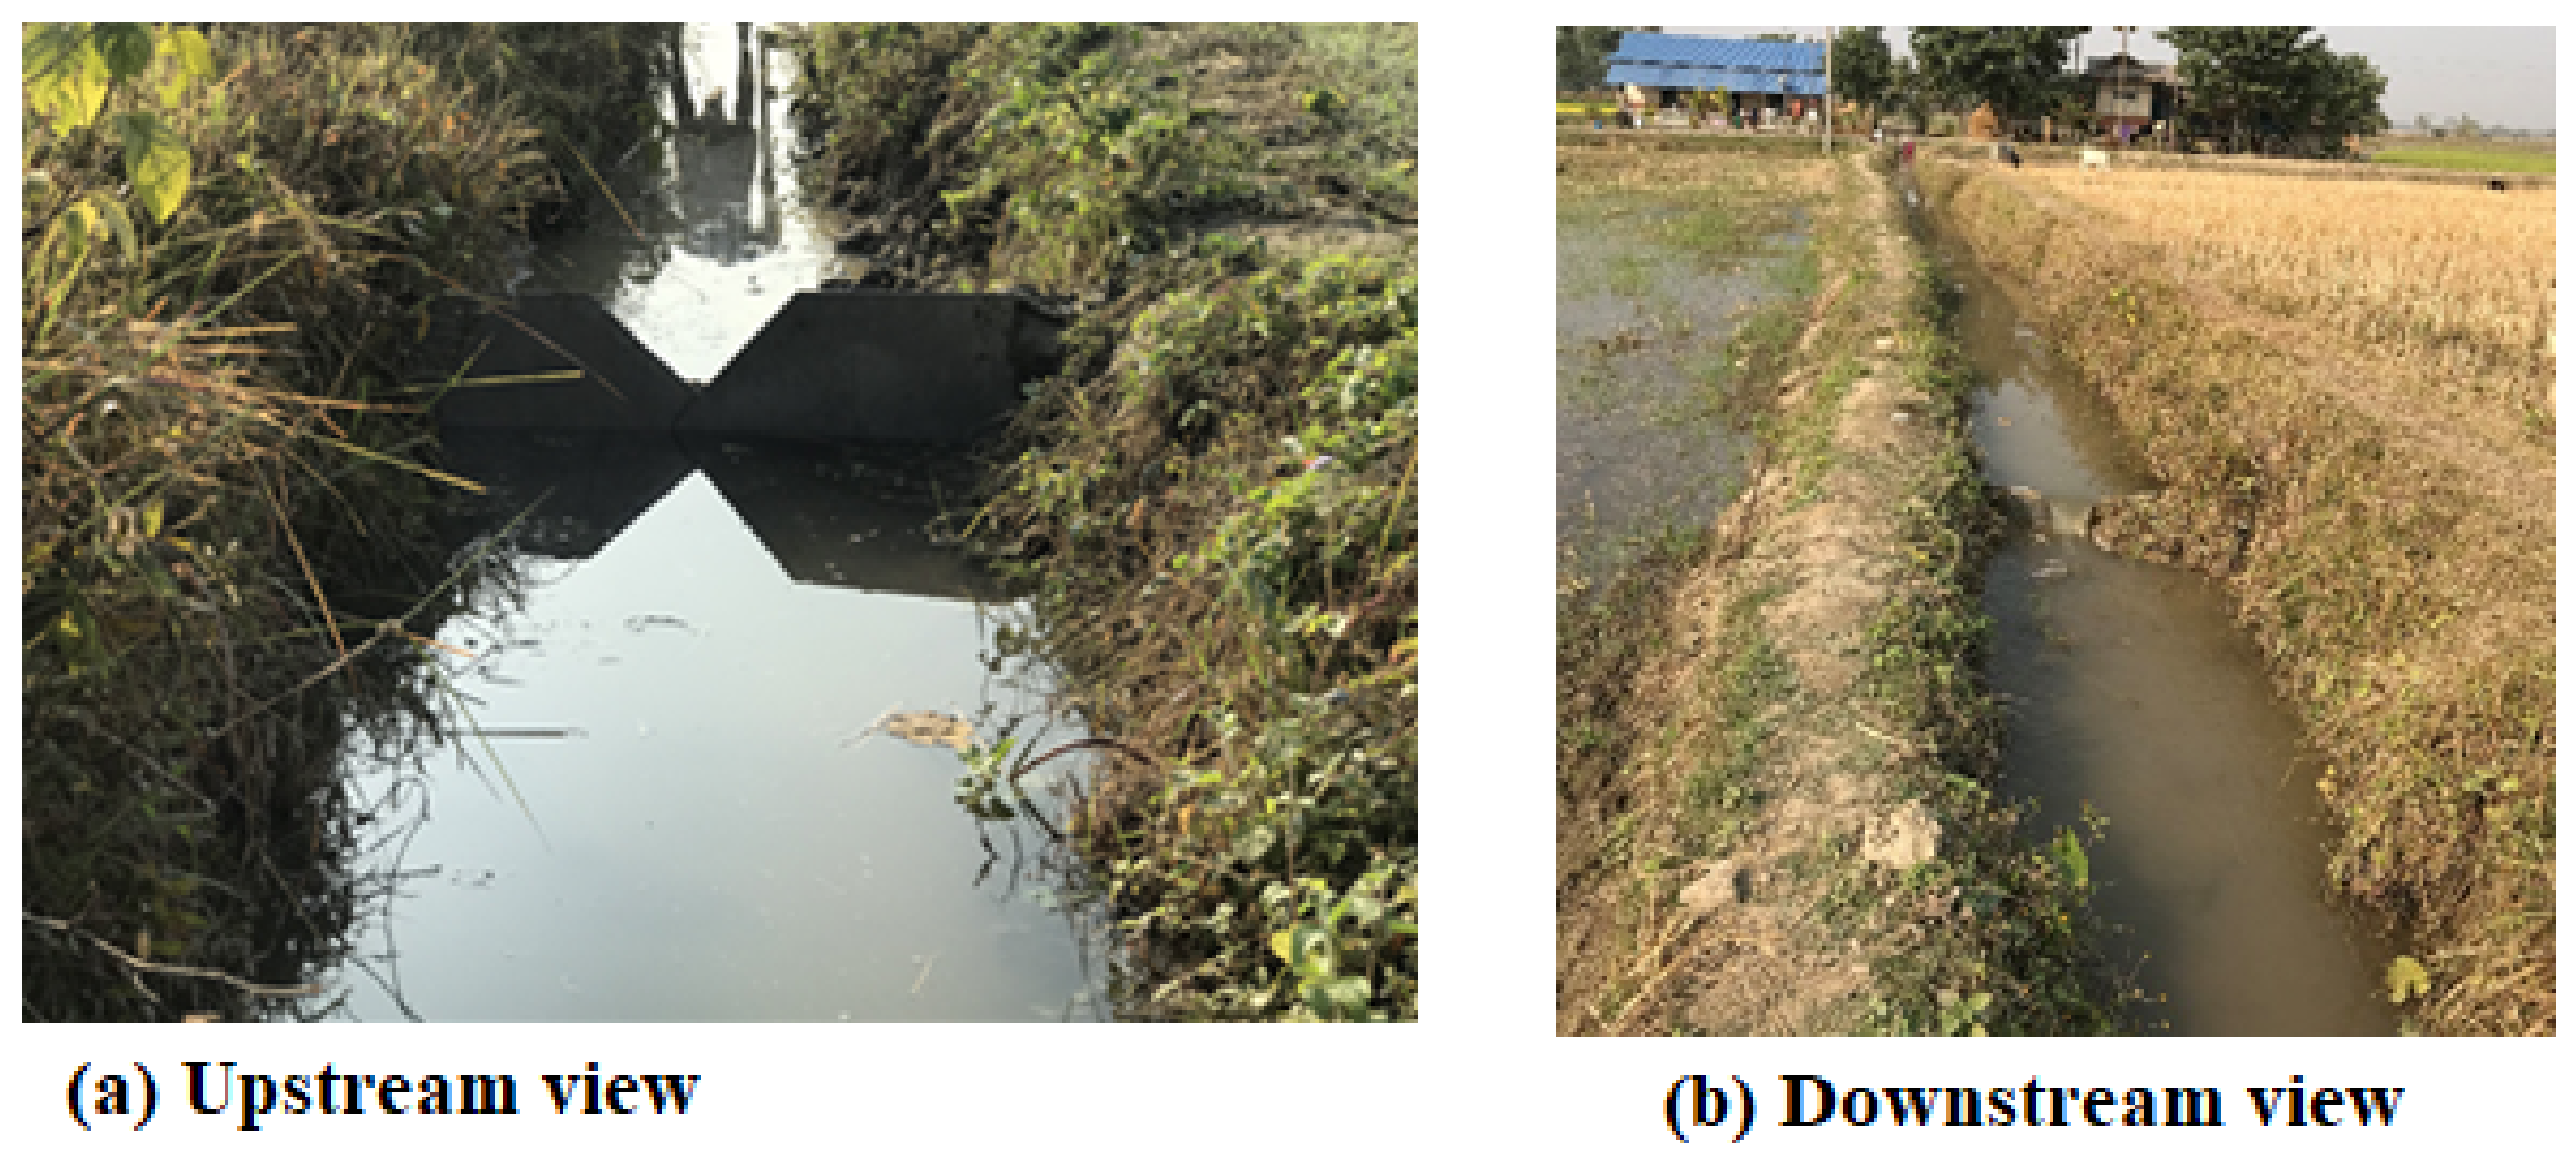
Irrigation applied in APSIM followed that applied in the field experiments. Irrigation scheduling was determined by the farmers by following traditional management for crops in the region. Irrigation was measured using a V-notch (90°) weir (Figure 3). The hydraulic head over the V-notch was measured temporally, and the water discharge passing through the V-notch was calculated using the equation given by Grant [71]. The average irrigation applied by the farmer on 3 field plots was 92 mm (on 28 December 2018) and 65 mm (on 8 January 2020), following standard farming practice in the Sunsari Morang Irrigation Scheme.
2.5. Model Parameterisation and Validation
Systematic parameterisation of the phenology parameters was conducted by iteratively changing the photoperiod, vernalisation, and thermal time period parameters for the base wheat genotype to minimise the sum of the squared residuals, as performed in [4,40,72]. The phenology parameters include sowing, emergence, floral initiation, the start of grain filling, and harvesting. To develop the new genotype Nepal 297, the APSIM parameters in the XML file representing photoperiod (photop_sens) and vernalisation (vern_sens) were adjusted to 4.0 and 2.4, respectively, while the thermal times stipulating the end of the juvenile period, floral initiation, and the start of grain filling were adjusted to 380° Cd, 395° Cd, and 660° Cd, respectively. Other parameters were maintained as they were for the base genotype.
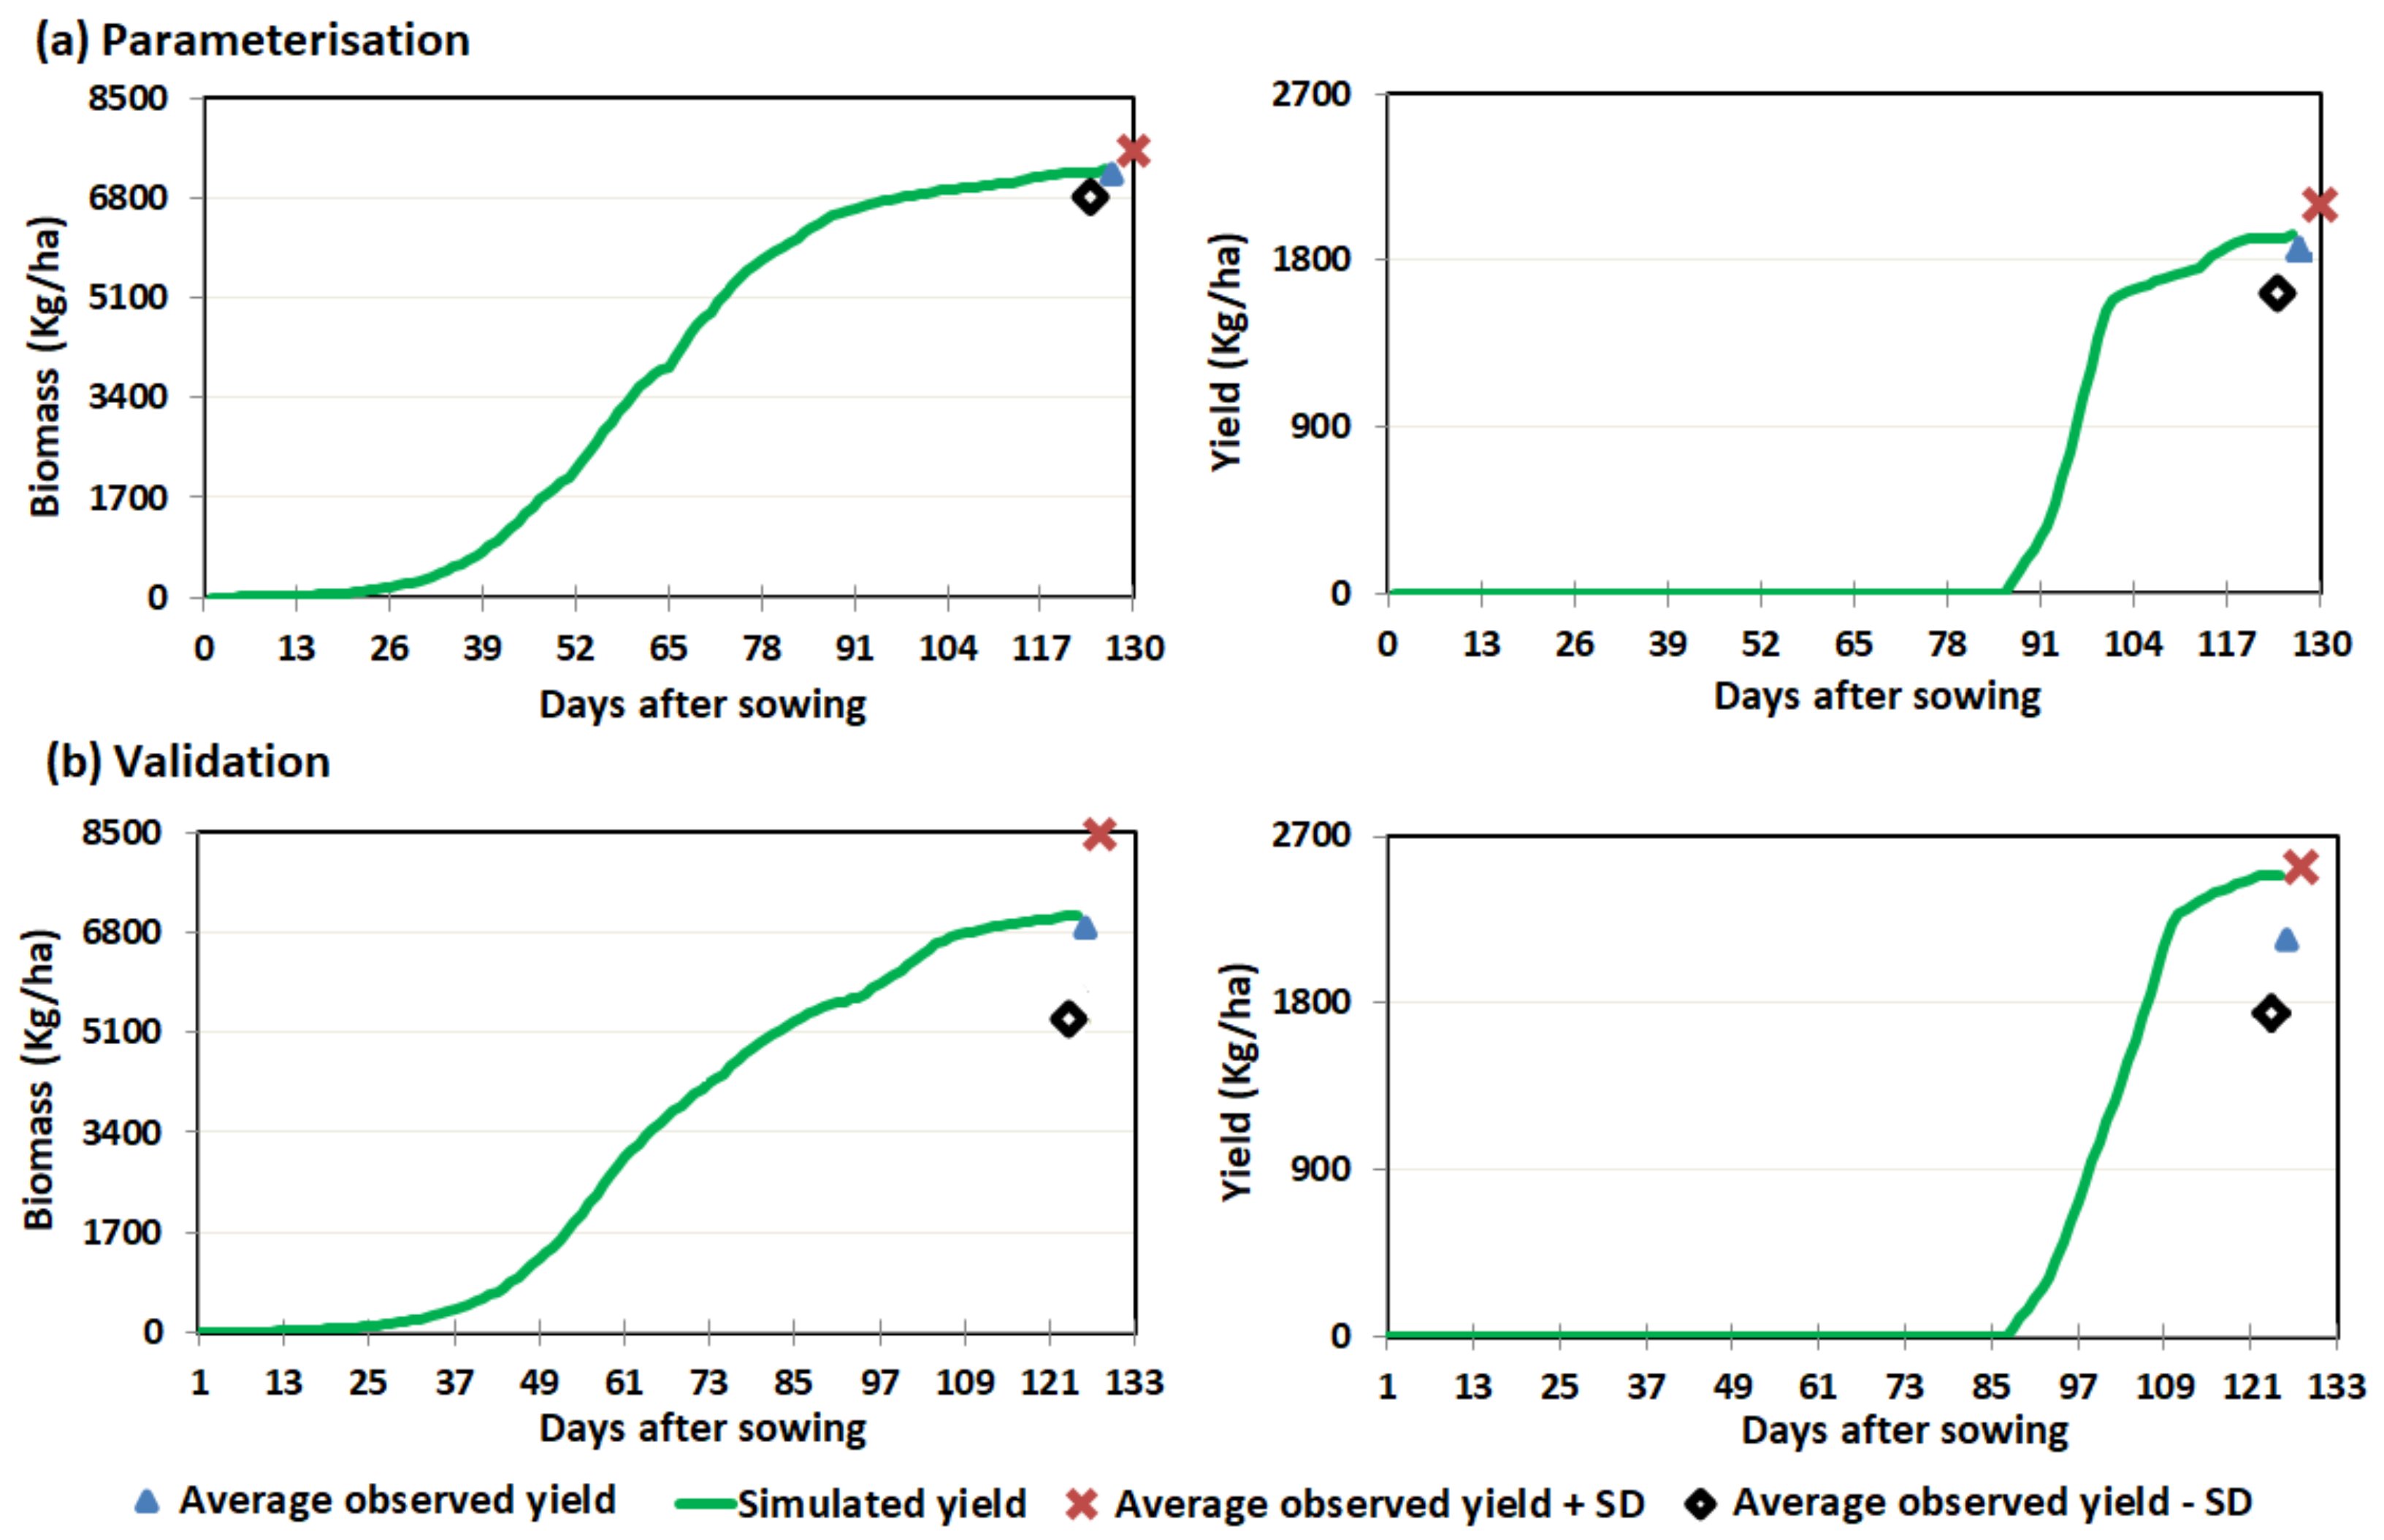
The observed and simulated phenology for the parameterisation and validation data-sets are shown in Table 2 (parameterisation and validation were conducted using 2018–2019 and 2019–2020 data, respectively). The minimum (mean minus standard deviation) and maximum (mean plus standard deviation) standard deviation ranges for the harvest days, based on three field plots, were 124 and 130 days after sowing for the parameterisation dataset, respectively. The simulated harvest days after sowing for the parameterisation period was within the standard deviation of the observed mean, indicating adequacy of the parameterisation. The minimum (mean minus standard deviation) and maximum (mean plus standard deviation) standard deviation ranges for the harvest days, based on three field plots, were 124 and 128 days after sowing for the validation period, respectively. The simulated harvest days after sowing for the validation period (125 days) was within the standard deviation of the mean. The simulated harvest days after sowing for the validation period was within the standard deviation of the mean, indicating the adequacy of the parameterisation approach.
The biomass and grain yield for the parameterisation and validation were obtained from the in-situ field level experiments. The observed and simulated biomass and grain yield for the parameterisation and validation are shown in Figure 4. In all cases, the simulated biomass and yield were within one standard deviation of the observed mean, indicating appropriateness of the parameterisation.
The observed and simulated phenology, biomass, and yield data for the validation period are shown in Figure 4b. The simulated biomass and yield for the validation period were within the standard deviation of the mean, indicating the adequacy of the validation.
2.6. Irrigated Yields and Water Use under Future Climates (Scenario Analysis)
The validated model was used to run simulations for the reference period (1981–2010) and again for each climate horizon for the four corners of climatic extremes, following Kaini et al. [65]. Details on the four corners of climatic extremes (i.e., cold and dry, cold and wet, warm and dry, and warm and wet) were explained by Kaini et al. [65]. The irrigation quanta necessary to achieve the potential grain yields under current farm conditions were also compared with the observed irrigation practice.
3. Results
3.1. Impacts of Climate Change on Irrigation Requirements, Crop Growth, and Yields
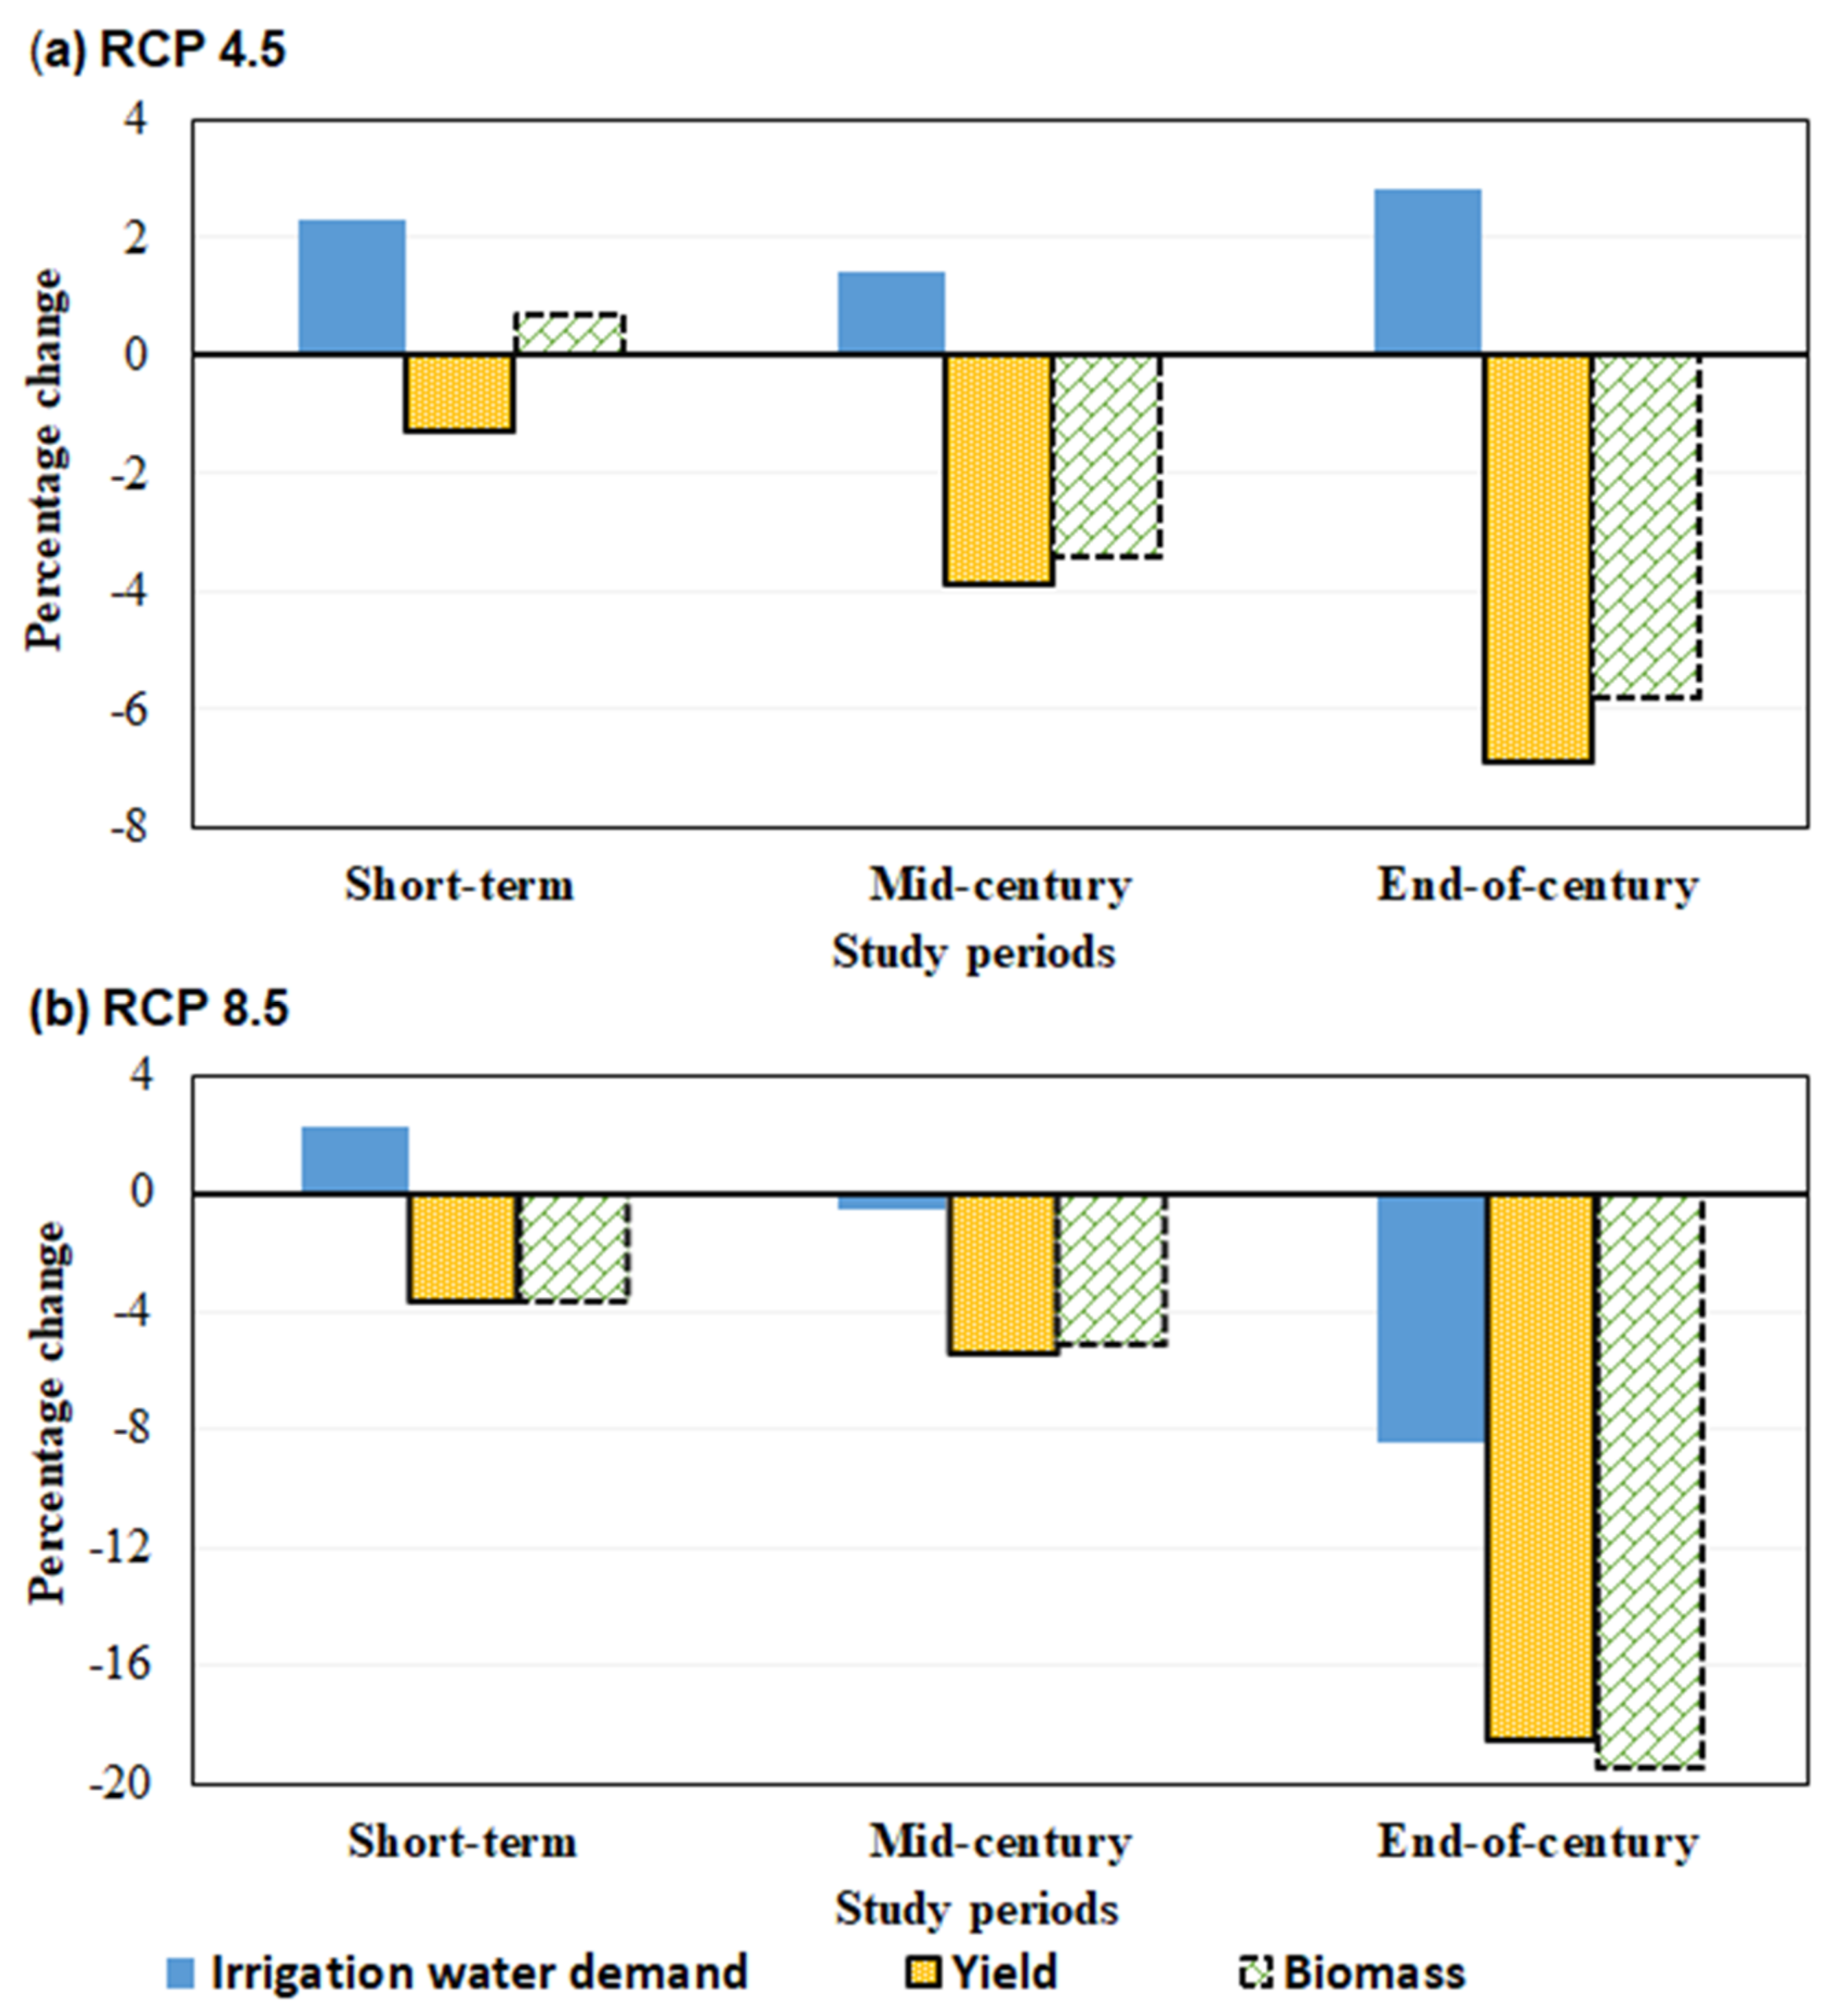
For the historical period of 1981–2010, 429 mm of irrigation water was required to reach a potential yield of 5800 kg/ha and biomass of 18,025 kg/ha (Figure 5). The projected mean irrigation water demand increased by 2%, 1%, and 3% in the short term, mid-century and end of century for RCP4.5. For RCP8.5, respectively, and the mean irrigation water demand increased by 2% in the short-term period but decreased by 1% and 8% for the mid-century and end of the century, respectively.
The crop growth period (duration from sowing to harvest) decreased under the future climate scenarios (Table 3), but in most cases, the impacts of climate change on phenology were small. For RCP8.5, by the end of the century, anthesis occurred seven days earlier on average.
Yields decreased by up to 7% and 19% for RCP4.5 and RCP8.5, respectively. The effects of climate change on the maturity of biomass were similar. Further results are shown in Table 4.
3.2. Variability in Projected Irrigation Water Demand, Biomass, and Grain Yield under Future Climates
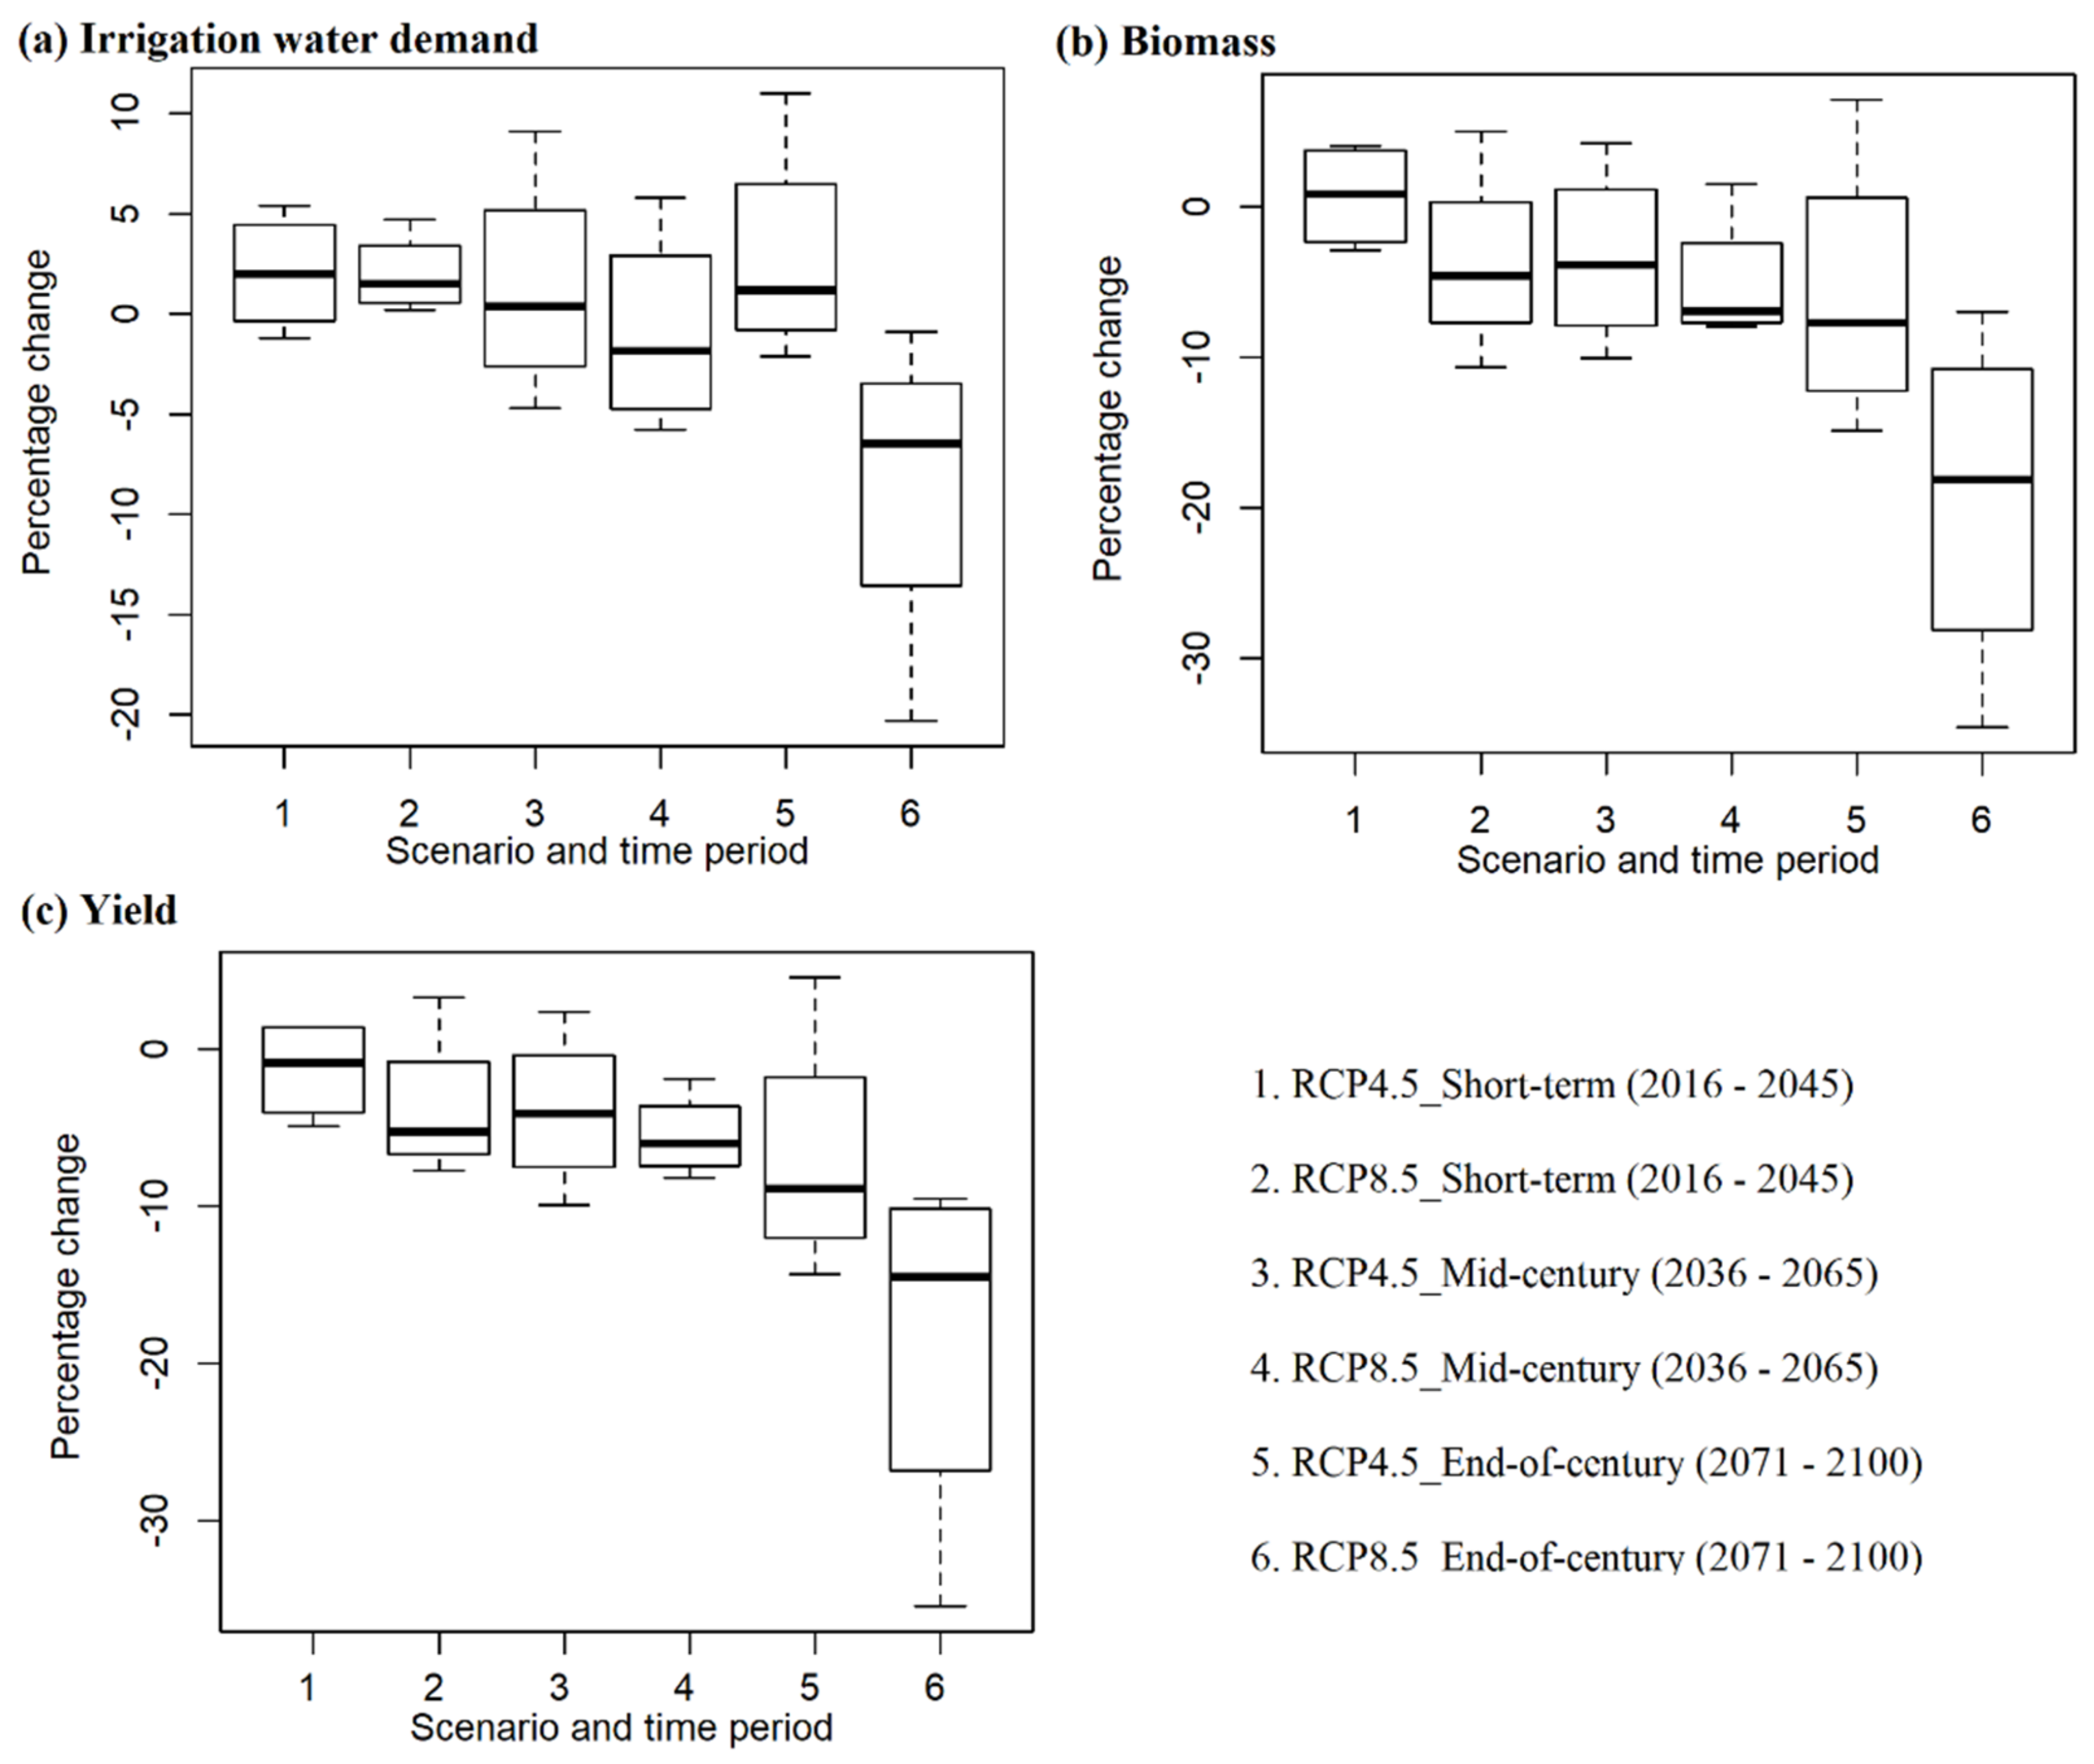
Based on the results from selected GCM ensembles representing the four climatic extremes (cold and dry, cold and wet, warm and dry, and warm and wet), high variability is projected in irrigation water demand, grain yield, and biomass yield, especially by the end of century (Figure 6). The variability in irrigation water demand, biomass, and grain yield was the highest for the end of the century period. Variabilities in irrigation water demand under RCP4.5 were from −1 to 5%, −5 to 9%, and −2 to 11% for the short term, mid-century, and end of the century, respectively. For RCP8.5, the corresponding values were from 0 to 5%, −6 to 6%, and −20 to −1%, respectively. All GCM ensembles predicted increased irrigation water demand in the short term and decreased irrigation water demand in the end of the century period for climate change scenario RCP8.5.
Variabilities in biomass generally increased with greater durations of climate projections and were higher for RCP8.5. All the GCM ensembles predicted decreased biomass in the end of the century period for RCP8.5. The variabilities in yield were similar to those of the biomass. The variabilities in yield under RCP4.5 were from −5 to 1%, −10 to 2%, and −14 to 5% for the short-term, mid-century, and end of the century, respectively. For RCP8.5, the corresponding values were from −8 to 3%, −8 to −2%, and −35 to −10%, respectively.
3.3. Irrigation Required to Achieve Potential Grain Yields under the Current Climates
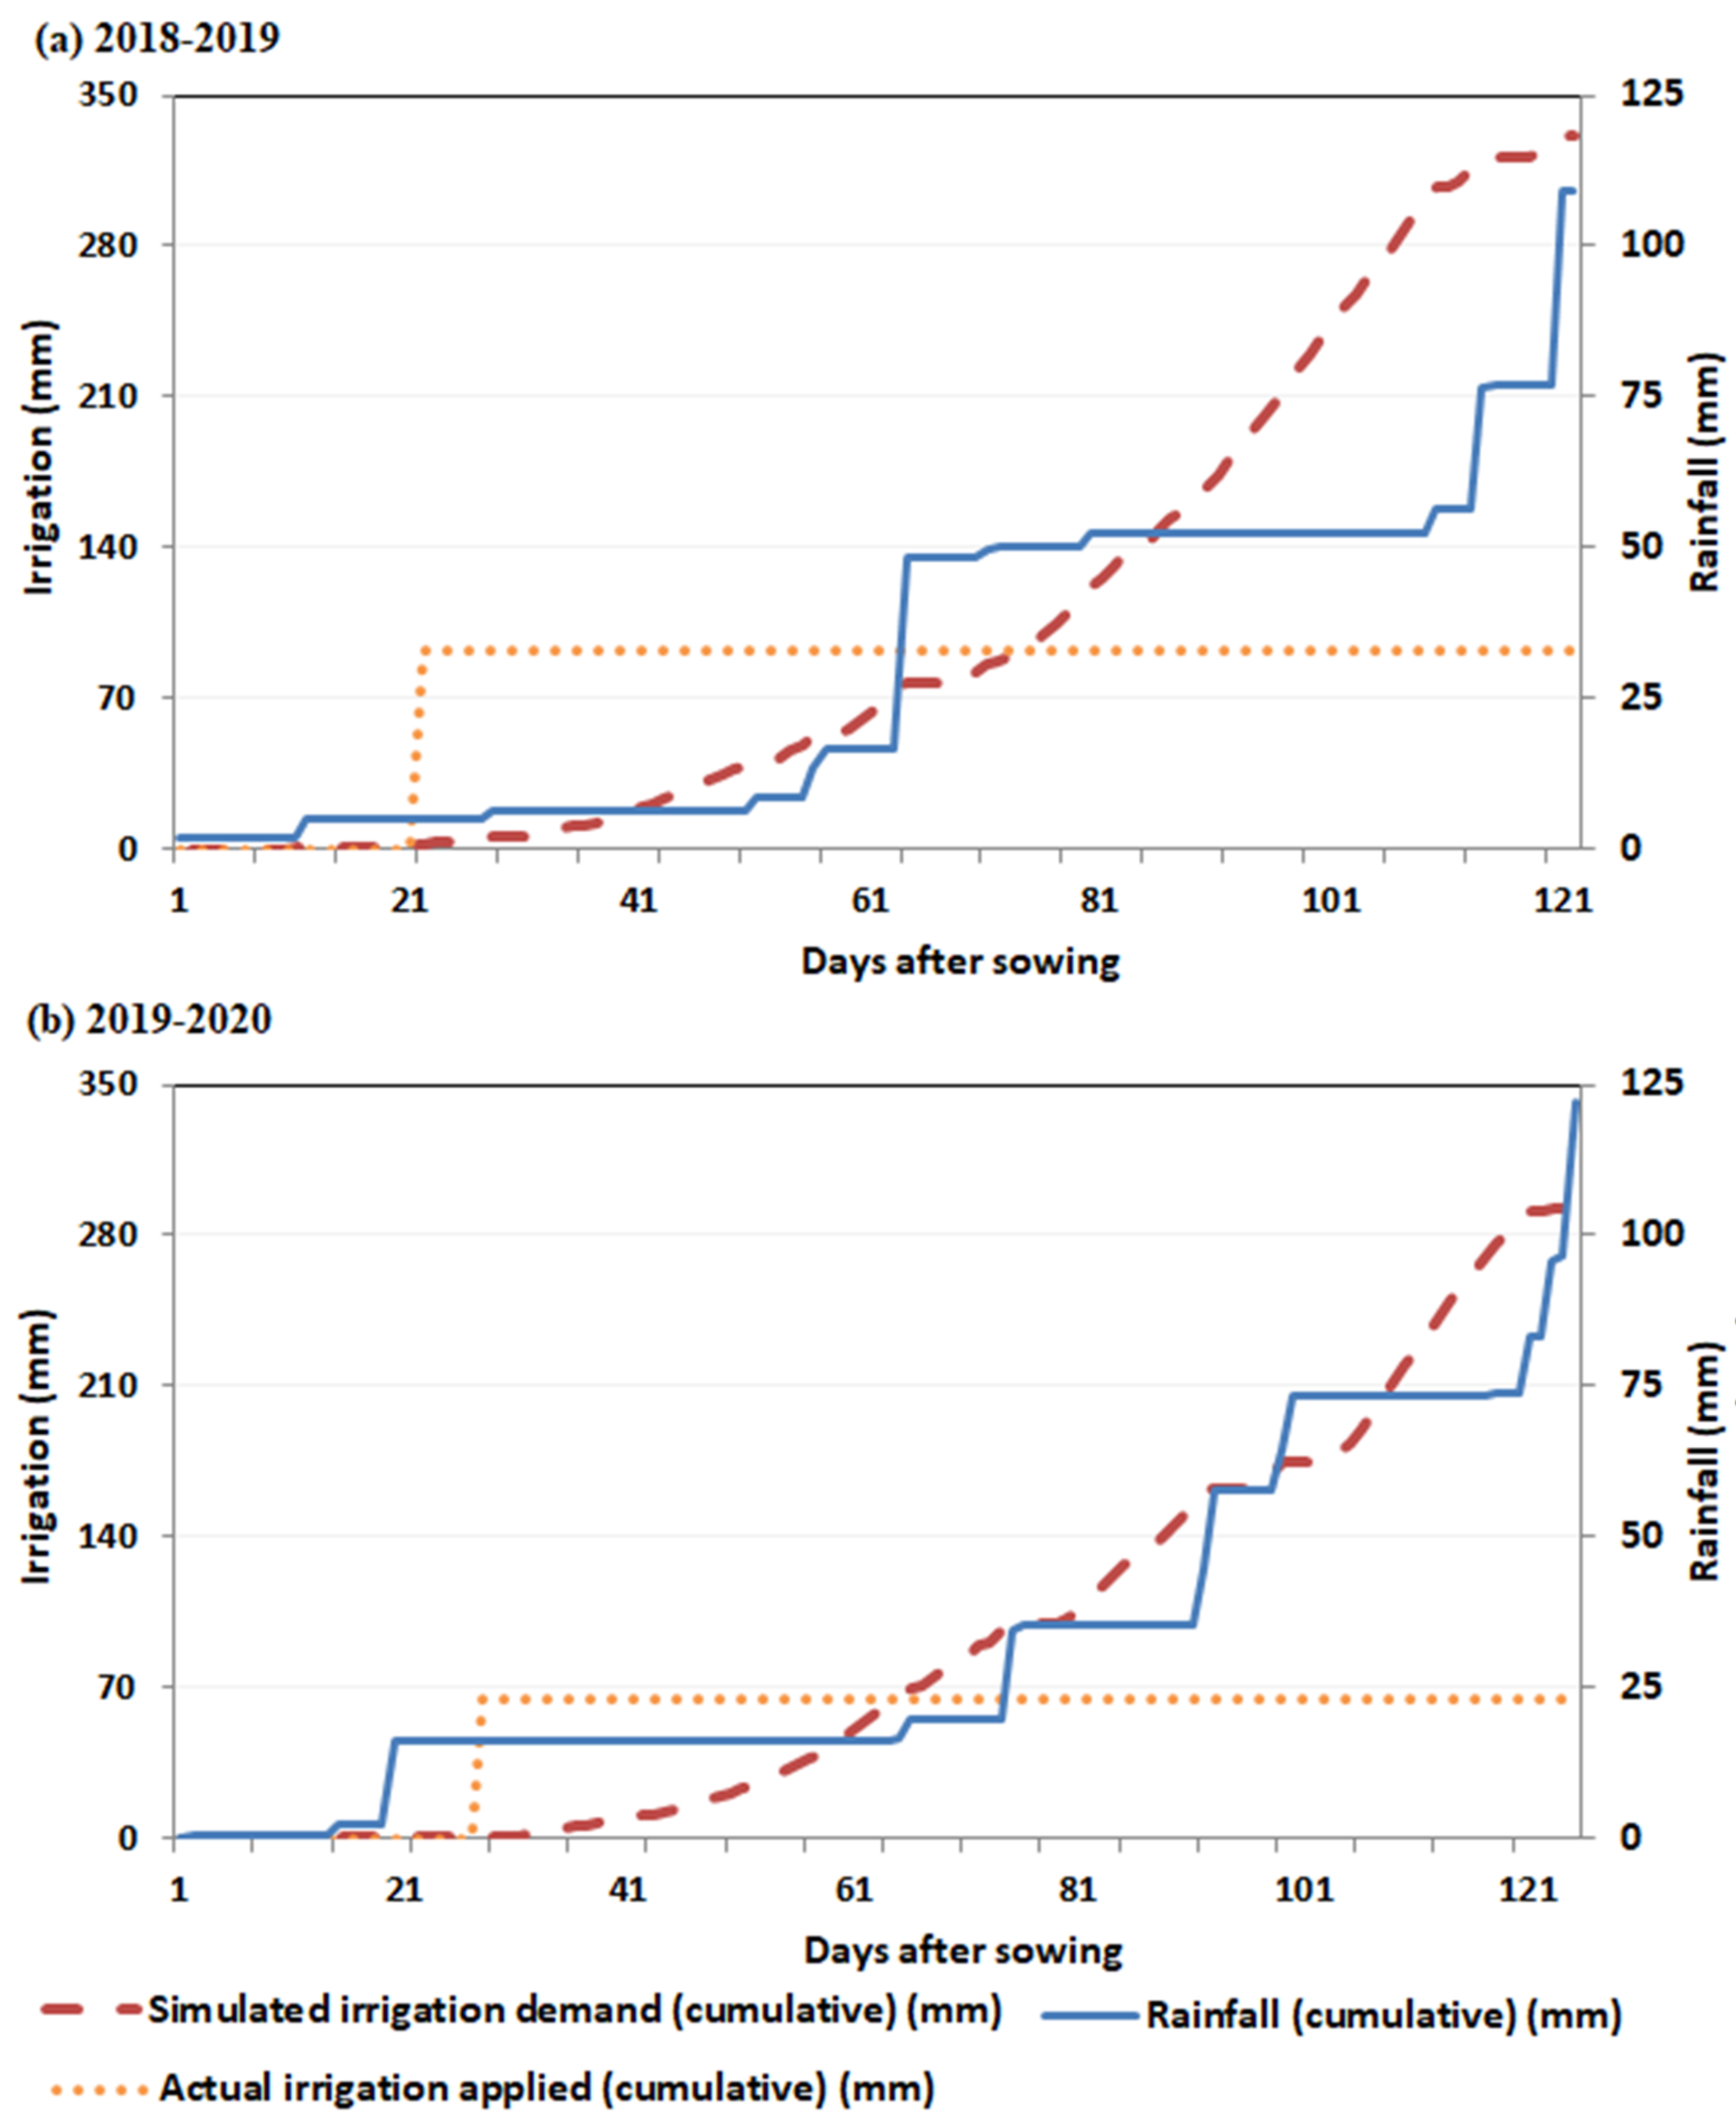
The irrigation required to achieve the potential yields was compared with the irrigation used in existing farmer practices (Figure 7). The actual irrigation and observed grain yield for 2018–2019 were 92 mm and 1862 kg/ha, respectively. In contrast, APSIM predicted that an irrigation application of 332 mm would be required to achieve the potential yield of 4312 kg/ha. In 2019–2020, the irrigation and yields were 65 mm and 2145 kg/ha, respectively, compared with an optimal irrigation of 292 mm and potential yield of 4604 kg/ha. These results suggest that the farms studied here were applying less than 30% of the total irrigation water required to achieve the optimal grain yield. This suggests a need for wider and more systematic change in irrigation practices used by farmers in this region, including the amounts applied, their timing relative to crop phenology, and elucidation of their reasons for either applying or not applying irrigation.
4. Discussion
Irrigation demand increased under RCP4.5 but decreased by the mid-century and end of the century under RCP8.5. Changes in total rainfall during the growing season (December to mid-April) were from −2 to −12 mm and temperatures of 0.6–3.7 °C across the scenarios, suggesting warming and drying will occur in the future. Irrigation demand under RCP4.5 increased in all future periods but decreased by the mid-century and end of the century under RCP8. The latter may be due to more rainfall being distributed throughout the growing season rather than more intense rainfall for a short period, thereby reducing irrigation water demand. The irrigation scheme’s rehabilitation projects in the region could be designed by considering future changes in irrigation water demand and multiple uses of irrigation water [73] while upgrading the existing irrigation infrastructure [74]. Higher temperatures reduced the duration of biomass accumulation, photosynthesis during grain filling, and the translocation of stem reserves to grain biomass (Table 3). Together, these factors inhibited the kernel filling duration and kernel size, thus reducing the yield. These results accord with observations from previous studies where, for example, Fischer [75] and Wang et al. [76] showed that longer growth periods resulted in higher wheat yields.
Other studies have similarly predicted high irrigation requirements and lower grain yields of wheat crop under future climates in various parts of the world. Mirgol et al. [27] projected a 60–100% yield reduction for winter wheat crops in the Qazvin Plateau of Iran during the 2030s, 2050s, and 2080s for RCPs 2.6, 4.5, and 8.5. Their study also showed an increase in future irrigation water requirements by 40–80% compared with 1986–2015. Goodarzi et al. [77] evaluated the climate change impacts on irrigation water requirements for multiple crops in Iran during 2017–2046 using RCP4.5 and RCP8.5 and showed an increase of 12–16% in irrigation water requirements for wheat relative to 1976–2005. Garcia-Garcia et al. [78] reported that recycled irrigated water could be used in agriculture to address water scarcity in the future. Zhang et al. [59] assessed the climate change impacts on wheat grain yields in the 2080s in north China and projected a yield reduction of 1–6% relative to 1961–1990.
Bouras et al. [30] assessed the climate change impacts on irrigation water requirements and grain yields of wheat crops in the Tensift region in Morocco for the 2050s and 2090s using climate change scenarios RCP4.5 and RCP8.5. Their study reported that both irrigation water demand and the wheat grain yields would decrease by 13–42% and 7–30% in the 2050s and 2090s, respectively. They argued that the decrease in irrigation demands were due to decreases in the length of the cropping period. Similarly, Yuan et al. [79] assessed the climate change impacts on irrigation requirements for winter wheat in China and concluded that a decreased crop growth period reduced irrigation water requirements. Similar results were observed by Chattaraj et al. [80] for irrigated wheat in India. They indicated that increased temperatures reduced the length of the growth phases, and the early maturity of wheat resulted in reduced irrigation water requirements. Taken together, these findings from these previous studies are in line with our results for the mid-century and end of the century for RCP8.5, wherein crop growth durations were diminished, and consequently, irrigation water demand also decreased. However, our results also show that changes in projected irrigation water demand under future climates were relatively minimal (for most climate scenarios and time horizons). This result is different from the larger effects of climate change on irrigation demand in other parts of the world mentioned above, suggesting that—except for RCP8.5 by the end of the century—the short-term effects of climate change on irrigation demand and yields will be relatively minimal in this region. However, a reduction in yields up to 19% is projected in Nepal by the end of the century for RCP8.5.
Farmers in the tail end portion of the Sunsari Morang area (the eastern portion of the command area, viz. Figure 2) generally irrigate their winter wheat two times between the sowing and harvest periods. The first irrigation is around 3–4 weeks after sowing, and the second is during floral initiation. While the first irrigation event is common, some farmers do not apply the second irrigation event if there is rainfall during the floral initiation period. However, the farmers often do not consider whether the current soil moisture and the quantity of rainfall are sufficient to meet future crop water requirements. In our study, rainfall during the floral initiation period in the 2018–2019 crop season was only 35 mm (Figure 7a), which is negligible compared with the 260 mm of irrigation required between floral initiation and maturity.
Similarly, farmers near the monitored field plots did not irrigate for a second time in the 2019–2020 crop period, considering a total of 38 mm of rainfall (16 mm during floral initiation and 22 mm during flowering) to be sufficient to maintain crop growth (Figure 7b). However, 38 mm of rainfall is much less than the 222 mm of irrigation required between floral initiation and maturity. Given the actual grain yields in both 2018–2019 and 2019–2020 were less than half of the potential grain yield, such under-irrigation has clearly contributed to a significant reduction in grain yields.
Factors other than crop phenology have shown that yields in Nepalese irrigation schemes could be increased by providing optimal irrigation water at the farm level after changing the conventional paradigm of subsistence farming into a market-oriented model and enabling the adoption of an appropriate land tenancy model (landowner–tenant) [81]. Kaini et al. [81] reported that crop yields could be increased by providing proper market facilities, ensuring the availability of machinery (e.g., thresher machines and mini-tractors), and increasing the availability of organic manure, farmer training, and farmers’ visits to exemplary farmlands where knowledge sharing is made available. This study also mentioned that coordination between water users’ associations, the district irrigation development office, and the district agriculture development office is crucial for increasing crop yields. For improving irrigation scheduling, seasonal climate forecasts may help farmers decide whether or not to apply irrigation [82]. Indeed, various irrigation scheduling tools are already available that irrigators can use with the support of water users’ associations and the district irrigation development office to improve irrigation management. Social, cultural, economic, and agronomic factors driving farmers’ decisions on irrigation could be explored in more detail for the Sunsari Morang irrigation area in the future.
5. Conclusions
It was found that the projected irrigation water demand for wheat crop in the Sunsari Morang Irrigation Scheme command area increased by up to 3% for moderate emissions scenarios (RCP4.5) but decreased by up to 8% under more severe (but realistic) emissions scenarios (RCP8.5) by the end of the century (2071–2100). Such a reduction in irrigation demand may be attributed to reduced crop durations and biomass accumulations, reducing yields (reductions of 7% and 19% by the end of century). Our results show that changes in future irrigation water demand are minimal for most climate scenarios, a result that contrasts with the crippling effects of climate change observed in other parts of the world. Nonetheless, the biomass and yields were significantly decreased by the end of the century under RCP8.5, indicating that not even irrigation will be able to alleviate climate change impacts on crops (assuming current trends continue).
The results show that the current irrigation applied by farmers in the Sunsari Morang Irrigation area may be suboptimal, leading to reduced yields. This suggests that education may be required to help improve landholder knowledge and attitudes towards irrigation scheduling and best management practices. Such upskilling could include advice on future climate change adaptation, including earlier sowing (as crops mature earlier), faster phenology genotypes (such as how genotypes flower earlier and avoid terminal water stress), implementing water use efficiency measures, the use of digital tools, and seasonal climate forecasting to better assess the implications of whether or not to irrigate. The findings of this study suggest that more seamless integration of extension and communication within existing research programmes may encourage the adoption of beneficial research outcomes. This study could be extended to investigate the impacts of different irrigation scheduling on the crop grain yield and biomass yield. The application part of the APSIM model could further be used to explore the effects of different sowing times on irrigation water requirements, grain yields, and biomass yields.
Supplementary Materials
The following supporting information can be downloaded at https://www.mdpi.com/article/10.3390/w14172728/s1. Table S1: Soil chemical properties, including electrical conductivity (EC), pH, chloride (CL), boron (B), cation exchange capacity (CEC), calcium (Ca), magnesium (Mg), sodium (Na), potassium (K), exchangeable sodium percentage (ESP), and manganese (Mn). Values are averages of three field plots.
Author Contributions
Conceptualization, S.K., M.T.H., T.G., S.N., and A.K.S.; methodology, S.K., M.T.H., T.G., and A.K.S.; software, S.K., M.T.H., T.G., and A.K.S.; validation, S.K., M.T.H., T.G., and A.K.S.; formal analysis, S.K., M.T.H., T.G., S.N., and A.K.S.; writing—original draft preparation, S.K.; writing—review and editing, S.K., M.T.H., T.G., S.N., and A.K.S. All authors have read and agreed to the published version of the manuscript.
Funding
The time of MTH was supported by the Grains Research and Development Corporation, project number UOT1906-002RTX.
Data Availability Statement
Not applicable.
Acknowledgments
The first author, Santosh Kaini, is thankful to the Australia Awards Scholarship (AusAid) Program for providing funds for the PhD research at Victoria University in Melbourne. We acknowledge the Regional Database System of ICIMOD in Kathmandu, Nepal for sharing precipitation and temperature data for the reference period for the Koshi basin. This study was also supported by ICIMOD’s Koshi Basin Programme. We acknowledge the soil labs in Nepal and Angus McElnea (Department of Environment and Science in Queensland, Australia) for their pro bono soil analyses. The views and interpretations in this publication are those of the authors and are not necessarily attributable to their organizations.
Conflicts of Interest
The authors declare no conflict of interest.
References
- Ramankutty, N.; Mehrabi, Z.; Waha, K.; Jarvis, L.; Kremen, C.; Herrero, M.; Rieseberg, L.H. Trends in Global Agricultural Land Use: Implications for Environmental Health and Food Security. Annu. Rev. Plant Biol. 2018, 69, 789–815. [Google Scholar] [CrossRef] [PubMed]
- Alcock, D.J.; Harrison, M.; Rawnsley, R.; Eckard, R.J. Can animal genetics and flock management be used to reduce greenhouse gas emissions but also maintain productivity of wool-producing enterprises? Agric. Syst. 2015, 132, 25–34. [Google Scholar] [CrossRef]
- Chang-Fung-Martel, J.; Harrison, M.T.; Rawnsley, R.; Smith, A.P.; Meinke, H. The impact of extreme climatic events on pasture-based dairy systems: A review. Crop Pasture Sci. 2017, 68, 1158. [Google Scholar] [CrossRef]
- Harrison, M.T.; Evans, J.R.; Dove, H.; Moore, A.D. Recovery dynamics of rainfed winter wheat after livestock grazing 2. Light interception, radiation-use efficiency and dry-matter partitioning. Crop Pasture Sci. 2011, 62, 960–971. [Google Scholar] [CrossRef]
- Phelan, D.C.; Harrison, M.T.; McLean, G.; Cox, H.; Pembleton, K.G.; Dean, G.J.; Parsons, D.; Richter, M.E.D.A.; Pengilley, G.; Hinton, S.J.; et al. Advancing a farmer decision support tool for agronomic decisions on rainfed and irrigated wheat cropping in Tasmania. Agric. Syst. 2018, 167, 113–124. [Google Scholar] [CrossRef]
- Bell, M.; Eckard, R.J.; Harrison, M.T.; Neal, J.S.; Cullen, B.R. Effect of warming on the productivity of perennial ryegrass and kikuyu pastures in south-eastern Australia. Crop Pasture Sci. 2013, 64, 61–70. [Google Scholar] [CrossRef]
- Pembleton, K.G.; Cullen, B.R.; Rawnsley, R.P.; Harrison, M.T.; Ramilan, T. Modelling the resilience of forage crop production to future climate change in the dairy regions of Southeastern Australia using APSIM. J. Agric. Sci. 2016, 154, 1131–1152. [Google Scholar] [CrossRef]
- Harrison, M.T.; Cullen, B.R.; Tomkins, N.W.; McSweeney, C.; Cohn, P.; Eckard, R.J. The concordance between greenhouse gas emissions, livestock production and profitability of extensive beef farming systems. Anim. Prod. Sci. 2016, 56, 370. [Google Scholar] [CrossRef]
- Harrison, M.T.; Jackson, T.; Cullen, B.R.; Rawnsley, R.P.; Ho, C.; Cummins, L.; Eckard, R.J. Increasing ewe genetic fecundity improves whole-farm production and reduces greenhouse gas emissions intensities. Agric. Syst. 2014, 131, 23–33. [Google Scholar] [CrossRef]
- Ho, C.K.M.; Jackson, T.; Harrison, M.T.; Eckard, R.J. Increasing ewe genetic fecundity improves whole-farm production and reduces greenhouse gas emissions intensities: 2. Economic performance. Anim. Prod. Sci. 2014, 54, 1248–1253. [Google Scholar] [CrossRef]
- Christie, K.; Smith, A.; Rawnsley, R.; Harrison, M.; Eckard, R. Simulated seasonal responses of grazed dairy pastures to nitrogen fertilizer in SE Australia: N loss and recovery. Agric. Syst. 2020, 182, 102847. [Google Scholar] [CrossRef]
- Christie, K.M.; Smith, A.P.; Rawnsley, R.P.; Harrison, M.T.; Eckard, R.J. Simulated seasonal responses of grazed dairy pastures to nitrogen fertilizer in SE Australia: Pasture production. Agric. Syst. 2018, 166, 36–47. [Google Scholar] [CrossRef]
- Rawnsley, R.P.; Smith, A.P.; Christie, K.; Harrison, M.T.; Eckard, R.J. Current and future direction of nitrogen fertiliser use in Australian grazing systems. Crop Pasture Sci. 2020, 70, 1034. [Google Scholar] [CrossRef]
- Cohen, B.; Cowie, A.; Babiker, M.; Leip, A.; Smith, P. Co-benefits and trade-offs of climate change mitigation actions and the Sustainable Development Goals. Sustain. Prod. Consum. 2021, 26, 805–813. [Google Scholar] [CrossRef]
- Moreno-Pérez, M.F.; Roldán-Cañas, J. Assessment of irrigation water management in the Genil-Cabra (Córdoba, Spain) irrigation district using irrigation indicators. Agric. Water Manag. 2013, 120, 98–106. [Google Scholar] [CrossRef]
- Schultz, B.; Tardieu, H.; Vidal, A. Role of water management for global food production and poverty alleviation. Irrig. Drain. 2009, 58, S3–S21. [Google Scholar] [CrossRef]
- FAO. Water Withdrawal by Sector, around 2010. Available online: http://www.fao.org/nr/Water/aquastat/tables/WorldData-Withdrawal_eng.pdf (accessed on 23 August 2017).
- Alexandratos, N.; Bruinsma, J. World Agriculture towards 2030/2050: The 2012 Revision; ESA Working Paper No. 12-03; FAO: Rome, Italy, 2012. [Google Scholar]
- Harrison, M.T.; Cullen, B.R.; Armstrong, D. Management options for dairy farms under climate change: Effects of intensification, adaptation and simplification on pastures, milk production and profitability. Agric. Syst. 2017, 155, 19–32. [Google Scholar] [CrossRef]
- Phelan, D.C.; Harrison, M.T.; Kemmerer, E.P.; Parsons, D. Management opportunities for boosting productivity of cool-temperate dairy farms under climate change. Agric. Syst. 2015, 138, 46–54. [Google Scholar] [CrossRef]
- Shahpari, S.; Allison, J.; Harrison, M.T.; Stanley, R. An Integrated Economic, Environmental and Social Approach to Agricultural Land-Use Planning. Land 2021, 10, 364. [Google Scholar] [CrossRef]
- Taylor, C.A.; Harrison, M.T.; Telfer, M.; Eckard, R. Modelled greenhouse gas emissions from beef cattle grazing irrigated leucaena in northern Australia. Anim. Prod. Sci. 2016, 56, 594–604. [Google Scholar] [CrossRef]
- Alcamo, J.; Dronin, N.; Endejan, M.; Golubev, G.; Kirilenko, A. A new assessment of climate change impacts on food production shortfalls and water availability in Russia. Glob. Environ. Change 2007, 17, 429–444. [Google Scholar] [CrossRef]
- Lobell, D.B.; Burke, M.B.; Tebaldi, C.; Mastrandrea, M.D.; Falcon, W.P.; Naylor, R.L. Prioritizing climate change adaptation needs for food security in 2030. Science 2008, 319, 607–610. [Google Scholar] [CrossRef] [PubMed]
- Douglas, I. Climate change, flooding and food security in south Asia. Food Secur. 2009, 1, 127–136. [Google Scholar] [CrossRef]
- Woznicki, S.A.; Nejadhashemi, A.P.; Parsinejad, M. Climate change and irrigation demand: Uncertainty and adaptation. J. Hydrol. Reg. Stud. 2015, 3, 247–264. [Google Scholar] [CrossRef]
- Mirgol, B.; Nazari, M.; Eteghadipour, M. Modelling climate change impact on irrigation water requirement and yield of winter wheat (Triticum aestivum L.), barley (Hordeum vulgare L.), and fodder maize (Zea mays L.) in the semi-arid Qazvin Plateau, Iran. Agriculture 2020, 10, 60. [Google Scholar] [CrossRef]
- Mostafa, S.M.; Wahed, O.; El-Nashar, W.Y.; El-Marsafawy, S.M.; Abd-Elhamid, H.F. Impact of climate change on water resources and crop yield in the Middle Egypt region. J. Water Supply Res. Technol. 2021, 70, 1066–1084. [Google Scholar] [CrossRef]
- Poonia, V.; Das, J.; Goyal, M.K. Impact of climate change on crop water and irrigation requirements over eastern Himalayan region. Stoch. Hydrol. Hydraul. 2021, 35, 1175–1188. [Google Scholar] [CrossRef]
- Bouras, E.; Jarlan, L.; Khabba, S.; Er-Raki, S.; Dezetter, A.; Sghir, F.; Tramblay, Y. Assessing the impact of global climate changes on irrigated wheat yields and water requirements in a semi-arid environment of Morocco. Sci. Rep. 2019, 9, 19142. [Google Scholar] [CrossRef]
- Sahu, N.; Saini, A.; Behera, S.; Sayama, T.; Nayak, S.; Sahu, L.; Duan, W.; Avtar, R.; Yamada, M.; Singh, R.; et al. Impact of Indo-Pacific Climate Variability on Rice Productivity in Bihar, India. Sustainability 2020, 12, 7023. [Google Scholar] [CrossRef]
- Sahu, N.; Saini, A.; Behera, S.K.; Sayama, T.; Sahu, L.; Nguyen, V.-T.; Takara, K. Why apple orchards are shifting to the higher altitudes of the Himalayas? PLoS ONE 2020, 15, e0235041. [Google Scholar]
- Harrison, M.T.; Evans, J.R.; Moore, A.D. Using a mathematical framework to examine physiological changes in winter wheat after livestock grazing: 1. Model derivation and coefficient calibration. Field Crop. Res. 2012, 136, 116–126. [Google Scholar] [CrossRef]
- Harrison, M.T.; Evans, J.R.; Moore, A.D. Using a mathematical framework to examine physiological changes in winter wheat after livestock grazing: 2. Model validation and effects of grazing management. Field Crop. Res. 2012, 136, 127–137. [Google Scholar] [CrossRef]
- Ibrahim, A.; Harrison, M.; Meinke, H.; Fan, Y.; Johnson, P.; Zhou, M. A regulator of early flowering in barley (Hordeum vulgare L.). PLoS ONE 2018, 13, e0200722. [Google Scholar] [CrossRef] [PubMed]
- Asres, S.B. Evaluating and enhancing irrigation water management in the upper Blue Nile basin, Ethiopia: The case of Koga large scale irrigation scheme. Agric. Water Manag. 2016, 170, 26–35. [Google Scholar] [CrossRef]
- Checkol, G.; Alamirew, T. Technical and Institutional Evaluation of Geray Irrigation Scheme in West Gojjam Zone, Amhara Region, Ethiopia. J. Spat. Hydrol. 2008, 8, 36–48. [Google Scholar]
- Nam, W.-H.; Hong, E.-M.; Choi, J.-Y. Assessment of water delivery efficiency in irrigation canals using performance indicators. Irrig. Sci. 2016, 34, 129–143. [Google Scholar] [CrossRef]
- Allen, R.G.; Pereira, L.S.; Raes, D.; Smith, M. Crop Evapotranspiration (Guidelines for Computing Crop Water Requirements); FAO Irrigation and Drainage Paper 56; Food and Agriculture Organization of the United Nations: Rome, Italy, 1998; p. 300. [Google Scholar]
- Liu, K.; Harrison, M.T.; Hunt, J.; Angessa, T.T.; Meinke, H.; Li, C.; Tian, X.; Zhou, M. Identifying optimal sowing and flowering periods for barley in Australia: A modelling approach. Agric. For. Meteorol. 2020, 282, 107871. [Google Scholar] [CrossRef]
- Liu, K.; Harrison, M.T.; Ibrahim, A.; Manik, S.M.N.; Johnson, P.; Tian, X.; Meinke, H.; Zhou, M. Genetic factors increasing barley grain yields under soil waterlogging. Food Energy Secur. 2020, 9, e238. [Google Scholar] [CrossRef]
- Department of Water Resources and Irrigation. Water Resources and Irrigation Annual Booklet; Department of Water Resources and Irrigation: Lalitpur, Nepal, 2019. [Google Scholar]
- Keating, B.A.; Carberry, P.S.; Hammer, G.L.; Probert, M.E.; Robertson, M.J.; Holzworth, D.; Huth, N.I.; Hargreaves, J.N.; Meinke, H.; Hochman, Z.; et al. An overview of APSIM, a model designed for farming systems simulation. Eur. J. Agron. 2003, 18, 267–288. [Google Scholar] [CrossRef]
- APSIM-Crop Module Documentation. Crop Module Documentation. Available online: https://www.apsim.info/documentation/model-documentation/crop-module-documentation/ (accessed on 18 October 2020).
- Bilotto, F.; Harrison, M.T.; Migliorati, M.D.A.; Christie, K.M.; Rowlings, D.W.; Grace, P.R.; Smith, A.P.; Rawnsley, R.P.; Thorburn, P.J.; Eckard, R.J. Can seasonal soil N mineralisation trends be leveraged to enhance pasture growth? Sci. Total Environ. 2021, 772, 145031. [Google Scholar] [CrossRef] [PubMed]
- Harrison, M.T.; Roggero, P.P.; Zavattaro, L. Simple, efficient and robust techniques for automatic multi-objective function parameterisation: Case studies of local and global optimisation using APSIM. Environ. Model. Softw. 2019, 117, 109–133. [Google Scholar] [CrossRef]
- Liu, H.L.; Yang, J.Y.; Drury, C.F.; Reynolds, W.D.; Tan, C.S.; Bai, Y.L.; He, P.; Jin, J.; Hoogenboom, G. Using the DSSAT-CERES-Maize model to simulate crop yield and nitrogen cycling in fields under long-term continuous maize production. Nutr. Cycl. Agroecosyst. 2011, 89, 313–328. [Google Scholar] [CrossRef]
- Zheng, B.; Chenu, K.; Doherty, A.; Chapman, S. The APSIM-Wheat Module (7.5 R3008); The Commonwealth Scientific and Industrial Research Organisation (CSIRO) and Queensland State Government Agencies: Brisbane, Australia, 2015. [Google Scholar]
- Asseng, S.; Keating, B.; Fillery, I.; Gregory, P.; Bowden, J.; Turner, N.; Palta, J.; Abrecht, D. Performance of the APSIM-wheat model in Western Australia. Field Crop. Res. 1998, 57, 163–179. [Google Scholar] [CrossRef]
- Dreccer, M.F.; Fainges, J.; Whish, J.; Ogbonnaya, F.C.; Sadras, V.O. Comparison of sensitive stages of wheat, barley, canola, chickpea and field pea to temperature and water stress across Australia. Agric. For. Meteorol. 2018, 248, 275–294. [Google Scholar] [CrossRef]
- Flohr, B.; Hunt, J.; Kirkegaard, J.; Evans, J. Water and temperature stress define the optimal flowering period for wheat in south-eastern Australia. Field Crop. Res. 2017, 209, 108–119. [Google Scholar] [CrossRef]
- Houshmandfar, A.; Fitzgerald, G.J.; O’Leary, G.; Tausz-Posch, S.; Fletcher, A.; Tausz, M. The relationship between transpiration and nutrient uptake in wheat changes under elevated atmospheric CO2. Physiol. Plant. 2018, 163, 516–529. [Google Scholar] [CrossRef]
- Luo, Q.; Kathuria, A. Modelling the response of wheat grain yield to climate change: A sensitivity analysis. Arch. Meteorol. Geophys. Bioclimatol. Ser. B 2013, 111, 173–182. [Google Scholar] [CrossRef]
- Peake, A.; Huth, N.; Carberry, P.; Raine, S.; Smith, R. Quantifying potential yield and lodging-related yield gaps for irrigated spring wheat in sub-tropical Australia. Field Crop. Res. 2014, 158, 1–14. [Google Scholar] [CrossRef]
- Zhao, G.; Bryan, B.A.; Song, X. Sensitivity and uncertainty analysis of the APSIM-wheat model: Interactions between cultivar, environmental, and management parameters. Ecol. Model. 2014, 279, 1–11. [Google Scholar] [CrossRef]
- Bai, H.; Wang, J.; Fang, Q.; Huang, B. Does a trade-off between yield and efficiency reduce water and nitrogen inputs of winter wheat in the North China Plain? Agric. Water Manag. 2020, 233, 106095. [Google Scholar] [CrossRef]
- Chen, C.; Wang, E.; Yu, Q. Modeling Wheat and Maize Productivity as Affected by Climate Variation and Irrigation Supply in North China Plain. Agron. J. 2010, 102, 1037–1049. [Google Scholar] [CrossRef]
- Chen, C.; Wang, E.; Yu, Q. Modelling the effects of climate variability and water management on crop water productivity and water balance in the North China Plain. Agric. Water Manag. 2010, 97, 1175–1184. [Google Scholar] [CrossRef]
- Zhang, Y.; Feng, L.P.; Wang, J.; Wang, E.L.; Xu, Y.L. Using APSIM to explore wheat yield response to climate change in the North China Plain: The predicted adaptation of wheat cultivar types to vernalization. J. Agric. Sci. 2013, 151, 836–848. [Google Scholar] [CrossRef]
- Zhao, Z.; Wang, E.; Wang, Z.; Zang, H.; Liu, Y.; Angus, J.F. A reappraisal of the critical nitrogen concentration of wheat and its implications on crop modeling. Field Crop. Res. 2014, 164, 65–73. [Google Scholar] [CrossRef]
- Sida, T.S.; Baudron, F.; Kim, H.; Giller, K.E. Climate-smart agroforestry: Faidherbia albida trees buffer wheat against climatic extremes in the Central Rift Valley of Ethiopia. Agric. For. Meteorol. 2018, 248, 339–347. [Google Scholar] [CrossRef]
- Deihimfard, R.; Mahallati, M.N.; Koocheki, A. Yield gap analysis in major wheat growing areas of Khorasan province, Iran, through crop modelling. Field Crop. Res. 2015, 184, 28–38. [Google Scholar] [CrossRef]
- Singh, B.; Humphreys, E.; Gaydon, D.; Eberbach, P. Evaluation of the effects of mulch on optimum sowing date and irrigation management of zero till wheat in central Punjab, India using APSIM. Field Crop. Res. 2016, 197, 83–96. [Google Scholar] [CrossRef] [PubMed]
- Holzworth, D.; Huth, N.; Fainges, J.; Brown, H.; Zurcher, E.; Cichota, R.; Verrall, S.; Herrmann, N.; Zheng, B.; Snow, V. APSIM Next Generation: Overcoming challenges in modernising a farming systems model. Environ. Model. Softw. 2018, 103, 43–51. [Google Scholar] [CrossRef]
- Kaini, S.; Nepal, S.; Pradhananga, S.; Gardner, T.; Sharma, A.K. Representative general circulation models selection and downscaling of climate data for the transboundary Koshi river basin in China and Nepal. Int. J. Clim. 2020, 40, 4131–4149. [Google Scholar] [CrossRef]
- Lutz, A.; Immerzeel, W. Reference Climate Dataset for the Indus, Ganges and Brahmaputra River Basins. In Report FutureWater, HI-AWARE Research Component 1; HI-AWARE/FutureWater: Wageningen, The Netherlands, 2015; p. 146. [Google Scholar]
- Kaini, S.; Nepal, S.; Pradhananga, S.; Gardner, T.; Sharma, A.K. Impacts of climate change on the flow of the transboundary Koshi River, with implications for local irrigation. Int. J. Water Resour. Dev. 2021, 37, 929–954. [Google Scholar] [CrossRef]
- MOFE. Climate Change Scenarios for Nepal for National Adaptation Plan (NAP); Ministry of Forests and Environment: Kathmandu, Malaysia, 2019. [Google Scholar]
- Wijngaard, R.R.; Lutz, A.F.; Nepal, S.; Khanal, S.; Pradhananga, S.; Shrestha, A.B.; Immerzeel, W.W. Future changes in hydro-climatic extremes in the Upper Indus, Ganges, and Brahmaputra River basins. PLoS ONE 2017, 12, e0190224. [Google Scholar] [CrossRef] [PubMed]
- Dingman, S.L. Physical Hydrology, 3rd ed.; Waveland Press, Inc.: Long Grove, IL, USA, 2015. [Google Scholar]
- Grant, D.M. ISCO Open Channel Flow Measurement Handbook, 3rd ed.; ICVO Inc.: Omaha, NE, USA, 1989. [Google Scholar]
- Ibrahim, A.; Harrison, M.T.; Meinke, H.; Zhou, M. Examining the yield potential of barley near-isogenic lines using a genotype by environment by management analysis. Eur. J. Agron. 2019, 105, 41–51. [Google Scholar] [CrossRef]
- Kaini, S. Multiple use of irrigation water: Way towards sustainable irrigation management. In Proceedings of the National Irrigation Seminar on Irrigation Development and Management: Learning from the Past and Planning for the Future, Kavrepalanchok, Nepal, 10–11 June 2016; Department of Irrigation: Lalitpur, Nepal, 2016; p. 11. [Google Scholar]
- Kaini, S.; Hayde, L.G.; Schultz, B.; Marence, M. Seepage analysis underneath the headwork of Chanda Mohana Irrigation Scheme, Sunsari, Nepal. In Proceedings of the National Irrigation Seminar on Micro to Mega: Irrigation for Prosperous Nepal, Kathmandu, Nepal, 13–14 July 2011; Department of Irrigation: Lalitpur, Nepal, 2011; p. 21. [Google Scholar]
- Fischer, R. The effect of duration of the vegetative phase in irrigated semi-dwarf spring wheat on phenology, growth and potential yield across sowing dates at low latitude. Field Crop. Res. 2016, 198, 188–199. [Google Scholar] [CrossRef]
- Wang, B.; Lu, D.L.; O’Leary, G.J.; Asseng, S.; Macadam, I.; Lines-Kelly, R.; Yang, X.; Clark, A.; Crean, J.; Sides, T.; et al. Australian wheat production expected to decrease by the late 21st century. Glob. Change Biol. 2018, 24, 2403–2415. [Google Scholar] [CrossRef] [PubMed]
- Goodarzi, M.; Abedi-Koupai, J.; Heidarpour, M. Investigating impacts of climate change on irrigation water demands and its resulting consequences on groundwater using CMIP5 models. Groundwater 2019, 57, 259–268. [Google Scholar] [CrossRef]
- Garcia-Garcia, G.; Jagtap, S. Enhancement of a spent irrigation water recycling process: A case study in a food business. Appl. Sci. 2021, 11, 10355. [Google Scholar] [CrossRef]
- Yuan, Z.; Yan, D.; Yang, Z.; Yin, J.; Breach, P.; Wang, D. Impacts of climate change on winter wheat water requirement in Haihe River Basin. Mitig. Adapt. Strat. Glob. Change 2016, 21, 677–697. [Google Scholar] [CrossRef]
- Chattaraj, S.; Chakraborty, D.; Sehgal, V.; Paul, R.; Singh, S.; Daripa, A.; Pathak, H. Predicting the impact of climate change on water requirement of wheat in the semi-arid Indo-Gangetic Plains of India. Agric. Ecosyst. Environ. 2014, 197, 174–183. [Google Scholar] [CrossRef]
- Kaini, S.; Gardner, T.; Sharma, A.K. Assessment of Socio-Economic Factors Impacting on the Cropping Intensity of an Irrigation Scheme in Developing Countries. Irrig. Drain. 2020, 69, 363–375. [Google Scholar] [CrossRef]
- Harrison, M.T.; Christie, K.M.; Rawnsley, R.P. Assessing the reliability of dynamical and historical climate forecasts in simulating hindcast pasture growth rates. Anim. Prod. Sci. 2017, 57, 1525. [Google Scholar] [CrossRef] [Green Version]
Figure 1.
(a) The Sunsari Morang Irrigation Scheme. (b) Sunsari Morang irrigation canal network. (c) The locations of experimental field plots used in this study. Green lines represent the Sunsari Morang irrigation canal network, the blue lines represent tributaries of the Koshi River, and the red dotted line represents the boundary of the Koshi River basin down to the irrigation headwork, marked by a red X.

Figure 2.
Overview of the study, including soil and climate information used in the modelling, future climate data, model parameterisation, validation, and output.
Figure 2.
Overview of the study, including soil and climate information used in the modelling, future climate data, model parameterisation, validation, and output.

Figure 3.
Photographs of the V-notch (90°) and irrigation canals used to conduct this study.

Figure 4.
Observed (points) and simulated (lines) biomass and grain yield for the parameterisation and validation. SD = standard deviation.
Figure 4.
Observed (points) and simulated (lines) biomass and grain yield for the parameterisation and validation. SD = standard deviation.

Figure 5.
Impacts of climate change on future irrigation water demand, biomass, and yield of wheat grown in the Sunsari Morang Irrigation Scheme command area. Changes were calculated relative to the baseline period of 1981–2010.
Figure 5.
Impacts of climate change on future irrigation water demand, biomass, and yield of wheat grown in the Sunsari Morang Irrigation Scheme command area. Changes were calculated relative to the baseline period of 1981–2010.

Figure 6.
Variability in projected irrigation water demand, biomass, and yield compared with the reference period of 1981–2010. Boxplots show minimum, 25th percentile, median, 75th percentile, and the maximum.
Figure 6.
Variability in projected irrigation water demand, biomass, and yield compared with the reference period of 1981–2010. Boxplots show minimum, 25th percentile, median, 75th percentile, and the maximum.

Figure 7.
Simulated irrigation required to reach potential yields (red dashed line) compared with actual irrigation (orange dashed line) applied to wheat crop in the Sunsari Morang Irrigation Scheme command area in 2018–2019 and 2019–2020.
Figure 7.
Simulated irrigation required to reach potential yields (red dashed line) compared with actual irrigation (orange dashed line) applied to wheat crop in the Sunsari Morang Irrigation Scheme command area in 2018–2019 and 2019–2020.


Table 1.
Measured soil physical properties: bulk density (BD), air (dry) (AD), lower limit (LL15) (wilting point), drained upper limit (DUL) (field capacity), saturated volumetric water contents (Sat), saturated hydraulic conductivity (Ks), plant available water capacity (PAWC), and soil texture. Values are bulked averages taken from three field plots. The total PAWC was 139 mm.
| Depth (cm) | BD (g/cc) | AD (mm/mm) | LL15 (mm/mm) | DUL (mm/mm) | Sat (mm/mm) | Ks (mm/day) | Wheat PAWC (mm) |
|---|---|---|---|---|---|---|---|
| 0–10 | 1.35 | 0.01 | 0.157 | 0.374 | 0.414 | 600 | 21.7 |
| 10–20 | 1.4 | 0.01 | 0.169 | 0.38 | 0.443 | 600 | 21.1 |
| 20–30 | 1.35 | 0.01 | 0.137 | 0.319 | 0.356 | 600 | 18.2 |
| 30–50 | 1.38 | 0.01 | 0.171 | 0.312 | 0.349 | 600 | 28.2 |
| 50–70 | 1.5 | 0.011 | 0.186 | 0.315 | 0.331 | 600 | 25.8 |
| 70–90 | 1.49 | 0.011 | 0.184 | 0.302 | 0.359 | 600 | 23.6 |
Table 2.
Observed and simulated phenology (days after sowing) for the parameterisation (2018–2019) and validation (2019–2020).
Table 2.
Observed and simulated phenology (days after sowing) for the parameterisation (2018–2019) and validation (2019–2020).
| Phenological Stage | Parameterisation | Validation | ||
|---|---|---|---|---|
| Observed | Simulated | Observed | Simulated | |
| Sowing | 1 | 1 | 1 | 1 |
| Emergence | 7 | 5 | 7 | 5 |
| Floral initiation | 65 | 65 | 65 | 67 |
| Start grain filling | 91 | 93 | 91 | 94 |
| Harvest | 127 | 124 | 126 | 125 |
Table 3.
Average number of days to change in phenology of wheat, averaged from four GCMs relative to the reference period of 1981–2010.
Table 3.
Average number of days to change in phenology of wheat, averaged from four GCMs relative to the reference period of 1981–2010.
| Average Change | Short Term (2016–2045) | Mid-Century (2036–2065) | End of Century (2071–2100) | |||
|---|---|---|---|---|---|---|
| RCP4.5 | RCP8.5 | RCP4.5 | RCP8.5 | RCP4.5 | RCP8.5 | |
| Emergence | 0 | 0 | 0 | 0 | 0 | −1 |
| Floral initiation | 0 | −1 | −1 | −1 | −1 | −4 |
| Anthesis | 0 | −1 | −1 | −2 | −2 | −7 |
| Maturity | 0 | −1 | −1 | −2 | −2 | −5 |
Table 4.
Absolute and relative change in irrigation water demand, biomass, and grain yield for wheat based on average values from four GCMs relative to the reference period (1981–2010). Absolute values for irrigation water demand, grain yield, and biomass yield are in mm, kg/ha, and kg/ha, respectively. Relative values are expressed as percentages.
| Change | Short Term (2016–2045) | Mid-Century (2036–2065) | End of Century (2071–2100) | |||||||||
|---|---|---|---|---|---|---|---|---|---|---|---|---|
| RCP4.5 | RCP8.5 | RCP4.5 | RCP8.5 | RCP4.5 | RCP8.5 | |||||||
| Absolute Change Values | Relative Change (%) | Absolute Change Values | Relative Change (%) | Absolute Change Values | Relative Change (%) | Absolute Change Values | Relative Change (%) | Absolute Change Values | Relative Change (%) | Absolute Change Values | Relative Change (%) | |
| Irrigation water demand (mm) | 10 | 2.3 | 10 | 2.3 | 6 | 1.4 | −2 | −0.5 | 12 | 2.8 | −36 | −8.4 |
| Grain yield (kg/ha) | −76 | −1.3 | −215 | −3.7 | −228 | −3.9 | −320 | −5.5 | −399 | −6.9 | −1072 | −18.5 |
| Biomass (kg/ha) | 120 | 0.7 | −671 | −3.7 | −613 | −3.4 | −919 | −5.1 | −1049 | −5.8 | −3509 | −19.5 |
Publisher’s Note: MDPI stays neutral with regard to jurisdictional claims in published maps and institutional affiliations. |
© 2022 by the authors. Licensee MDPI, Basel, Switzerland. This article is an open access article distributed under the terms and conditions of the Creative Commons Attribution (CC BY) license (https://creativecommons.org/licenses/by/4.0/).
Share and Cite
MDPI and ACS Style
Kaini, S.; Harrison, M.T.; Gardner, T.; Nepal, S.; Sharma, A.K. The Impacts of Climate Change on the Irrigation Water Demand, Grain Yield, and Biomass Yield of Wheat Crop in Nepal. Water 2022, 14, 2728. https://doi.org/10.3390/w14172728
AMA Style
Kaini S, Harrison MT, Gardner T, Nepal S, Sharma AK. The Impacts of Climate Change on the Irrigation Water Demand, Grain Yield, and Biomass Yield of Wheat Crop in Nepal. Water. 2022; 14(17):2728. https://doi.org/10.3390/w14172728
Chicago/Turabian StyleKaini, Santosh, Matthew Tom Harrison, Ted Gardner, Santosh Nepal, and Ashok K. Sharma. 2022. "The Impacts of Climate Change on the Irrigation Water Demand, Grain Yield, and Biomass Yield of Wheat Crop in Nepal" Water 14, no. 17: 2728. https://doi.org/10.3390/w14172728
Note that from the first issue of 2016, this journal uses article numbers instead of page numbers. See further details here.