
Optimizing Urban Green Space Layouts for Stormwater Runoff Treatment in Residential Areas: A Case Study in Tianjin, China
1
School of Architecture, Tianjin University, Tianjin 300072, China
2
Tianjin Urban Planning and Design Institute Co., Ltd., Tianjin 300072, China
*
Authors to whom correspondence should be addressed.
Water 2022, 14(17), 2719; https://doi.org/10.3390/w14172719
Submission received: 18 June 2022
/
Revised: 23 August 2022
/
Accepted: 27 August 2022
/
Published: 1 September 2022
(This article belongs to the Section Urban Water Management)
Abstract
:Residential areas comprise more than 30% of the urban built-up zones of China. High-density residential areas and high proportions of impervious surfaces make residential areas prone to severe flooding. Low-impact development practices are broadly applied to solve these problems, and as a main component of low-impact development practices, green spaces have also drawn attention because of their capacity to control rainwater. However, the effects of green space spatial characteristics on hydrological processes have been overlooked. In this study, to determine how to optimize the layout of the green space system to improve the capacity of stormwater management, data from Tianjin were analyzed using a FRAGSTATs model and a SWMM model to identify how the layout of green spaces affects the process of rainwater generation and concentration in terms of three typical residential area layouts. The results show that (1) when it is possible to increase the amount of green space, maintaining a high patch density is the best way to achieve runoff treatment; (2) when newly built green space is limited, increasing connectivity between existing green spaces is the best way to control rainwater, especially in enclosed and axial modes; (3) when comparing the efficiency of the three modes, the axial mode presents the best performance in terms of promotion rate. These results will provide those developing urban residential areas with more economical, practical, and suitable layout strategies for green space systems in terms of planning, design, and optimization aimed at stormwater management.
1. Introduction
Climate change and rapid urbanization are the two main challenges of stormwater management [1,2]. Expansion of impervious surfaces in cities has become the immediate cause of excessive runoff generation. Urban residential areas (URAs) are the most population-centered locations and are the main source of impervious areas that generate surface runoff, while high-density settlements generate even more [3]. As the frequency and intensity of heavy rainstorms increase because of climate change [4], traditional solutions, such as gray drainage infrastructure are insufficient to control the phenomena of waterlogging and flooding [5], especially in the URAs of developing countries, which are characterized by high populations and extensive impervious areas. According to statistics, URAs can account for 30% of a built-up area [6]. Hence, it is necessary to seek alternative ways to achieve sustainable urban stormwater management (USM). Strategies, policies, and programs (e.g., WUSD, SUDS, LID, etc.) for USM have been implemented by different countries through utilizing urban green space (UGS) to reduce the probability of urban flooding over the past few decades [7], revealing many advantages compared to old treatment systems. In the Chinese USM system, low-impact development (LID) practices have been introduced and applied as significant measures in the Chinese sponge city program [8]; LID facilities, such as bio-retention, rain gardens, and green roofs, have also been applied as basic stormwater control units for sponge cities [9].
Scholars have studied the LID-based implementation strategy for urban stormwater management in URAs. Sadeghi [10] used LID facilities, such as permeable asphalt surfaces, dry-well chamber stormwater storage, and infiltration in high-density neighborhood blocks in Los Angeles. However, some studies have demonstrated the deficiency of LID facilities in respect of stormwater management. As Wang [11] pointed out, LID facilities are easily overestimated, resulting in uncertain performance in highly impervious areas or during extreme rainfall events. Jingming [12] provided similar conclusions through hydrological simulation; the results showed that LID facilities could have a negative impact on drainage systems when heavy rainfall events occurred. To address these problems, researchers are seeking systematic strategies on the basis of LID applications. UGSs have been the main carriers of LID facilities, and have also been shown to be useful for urban stormwater control [13,14,15]. Astebol [16] designed an integrated open stormwater drainage system with a vegetation structure to manage stormwater, saving 30% of costs compared to conventional solutions. A coupled system of low-impact development and gray infrastructure has proved to be cost-effective in stormwater management in urban high-density areas [17,18] when facing heavy rainfall events. Yao [19] presented a multi-objective decision-making system to optimize the layout of coupled gray-green stormwater infrastructure; layouts were abstracted as percentages and evaluated through a monetization method. Seo [20] simulated the runoff process in high-density, medium-density, and low-density areas to determine which was the most vulnerable area in respect of stormwater management, and preliminarily provided advice regarding the spatial distribution and the hydrological process. These studies have provided possible pathways for more effective stormwater treatment methods based on LID facilities, as well as highlighting the importance of infrastructure optimization, but the significance of the UGS layout has been overlooked, particularly in high-density URAs where construction is restricted due to a lack of space.
UGS has proved efficacious in controlling surface runoff. Berland, A. [21] observed that trees and woody plants contribute to hydrological cycles through precipitation intercepting, transportation, and infiltration, enhancing the control of stormwater. Hoover, F.A. and M.E., Hopton [22] demonstrated that UGS is valuable as a measure of stormwater control and includes many ancillary benefits. Nature-based processes have already been utilized to help manage stormwater [23]. GI, LIDs, BMPs, and other interchangeable terms have been defined as approaches using vegetation, soil, and technological applications to realize stormwater management based on UGS [7]. The problems mentioned above can be addressed by optimizing the layout of green space according to local conditions to promote the efficiency of stormwater management and decrease the risk of flooding. However, most research in this field is aimed at macro-scales [24,25] and only a few researchers have focused on what happens in URAs.
Chinese URAs are facing severe challenges and show distinctive characteristics [26]. There are three key points to consider: (1) old buildings, high-density construction styles, and gated and enclosed community management modes are problems that have not been addressed [27,28]. As a result, the construction of LID measures is limited in URAs [29]. (2) Many residential areas were built before the 2000s, following old construction modes: public spaces are in poor repair and public infrastructure is in need of updating. (3) Unlike countries dominated by a temperate marine climate, where rainfall is evenly distributed throughout the year, in the north plain of China, most rainfall is concentrated in the summer season because of its temperate continental climate, and extreme rainfall events cause more significant problems [23]. In addition, many old URAs only have sewage systems for sanitary waste and do not have drainage systems specifically for surface runoff [30]. Thus, the discharge of precipitation relies on combined sewer overflow systems, and there is more pressure on USM in Chinese URAs.
The spatial distribution of UGS should match the layout patterns of URAs. Due to the limitations of the construction of new facilities, existing resources like green space should be developed further by optimizing spatial layout patterns. Studies also indicate that a significant way to achieve this is through UGS. Yang, B. and D. Lee [31] investigated a small green space and tree layout and found that dispersed green space distribution is good for runoff reduction. Gao, J., et al. [32] evaluated different USM facility distribution modes and put forward a relative method in terms of USM facility selection. Although these studies have been performed on the layouts of UGS in residential areas, the relationship between green space layout and the process of runoff control has not been brought to the forefront, especially in the event of extremely uneven rainfall and the presence of a high-density spatial layout. Liu, W., W. Chen, and C. Peng built a simulation model and verified that LID facilities’ capacities are limited, especially for more significant rainfall events, while changing the configuration of the UGS showed more favorable effects [33]. He J, Valeo C, Chu A, Neumann NF [6] provided support for the effectiveness of UGS (taking trees and green roofs as examples) at the microscale in Munich. Maragno, D. [34] presented a new high-resolution digital model analysis method to evaluate flood reduction capacity by distinguishing impervious areas and UGS areas. Only a few studies have shown the structural relationship between UGS layouts and USM. Revealing this relationship may help to solve the practical problems in respect of USM in the presence of many restrictions.
URAs in Tianjin city are typical cases with which to examine the impact of UGS layout modes on the process of runoff control, and 1751 residential areas in Tianjin were investigated in this study. The objectives of this study are as follows: (1) compare stormwater runoff generated in different UGS planning and optimizing approaches; (2) establish the correlation between spatial features and the process of runoff generation and concentration. To achieve this goal, fifteen “what-if” scenarios for three typical URA layout types were created for the process of runoff simulation. Scenarios were compared using a stormwater management model. We addressed the following research questions: (1) How does UGS function in the stormwater runoff process in residential areas? (2) What are the most important spatial factors of UGS that can help to realize stormwater control? The results of this study will be helpful in providing a reference for the promotion and application of UGS planning in URAs.
2. Materials and Methods
2.1. Study Area Description
Tianjin city lies in the North China Plain and the city center is located at 117°10′ E 39°10′ N. Tianjin has a sub-humid warm-temperate monsoon climate, which is characterized by an uneven rainfall event distribution during the whole year. Rainfall events mainly occur from June to August, with almost 60% of rainfall occurring in these three months, and the total rainfall being approximately 600 mm every year. The heaviest rainstorms always occur in summer (the average value is higher than 60 mm and rainfall has reached 117 mm in the most recent 3 years), while only a few rainfall events occur in other seasons. Tianjin City is seeking USM measures that are different to traditional LID construction styles.
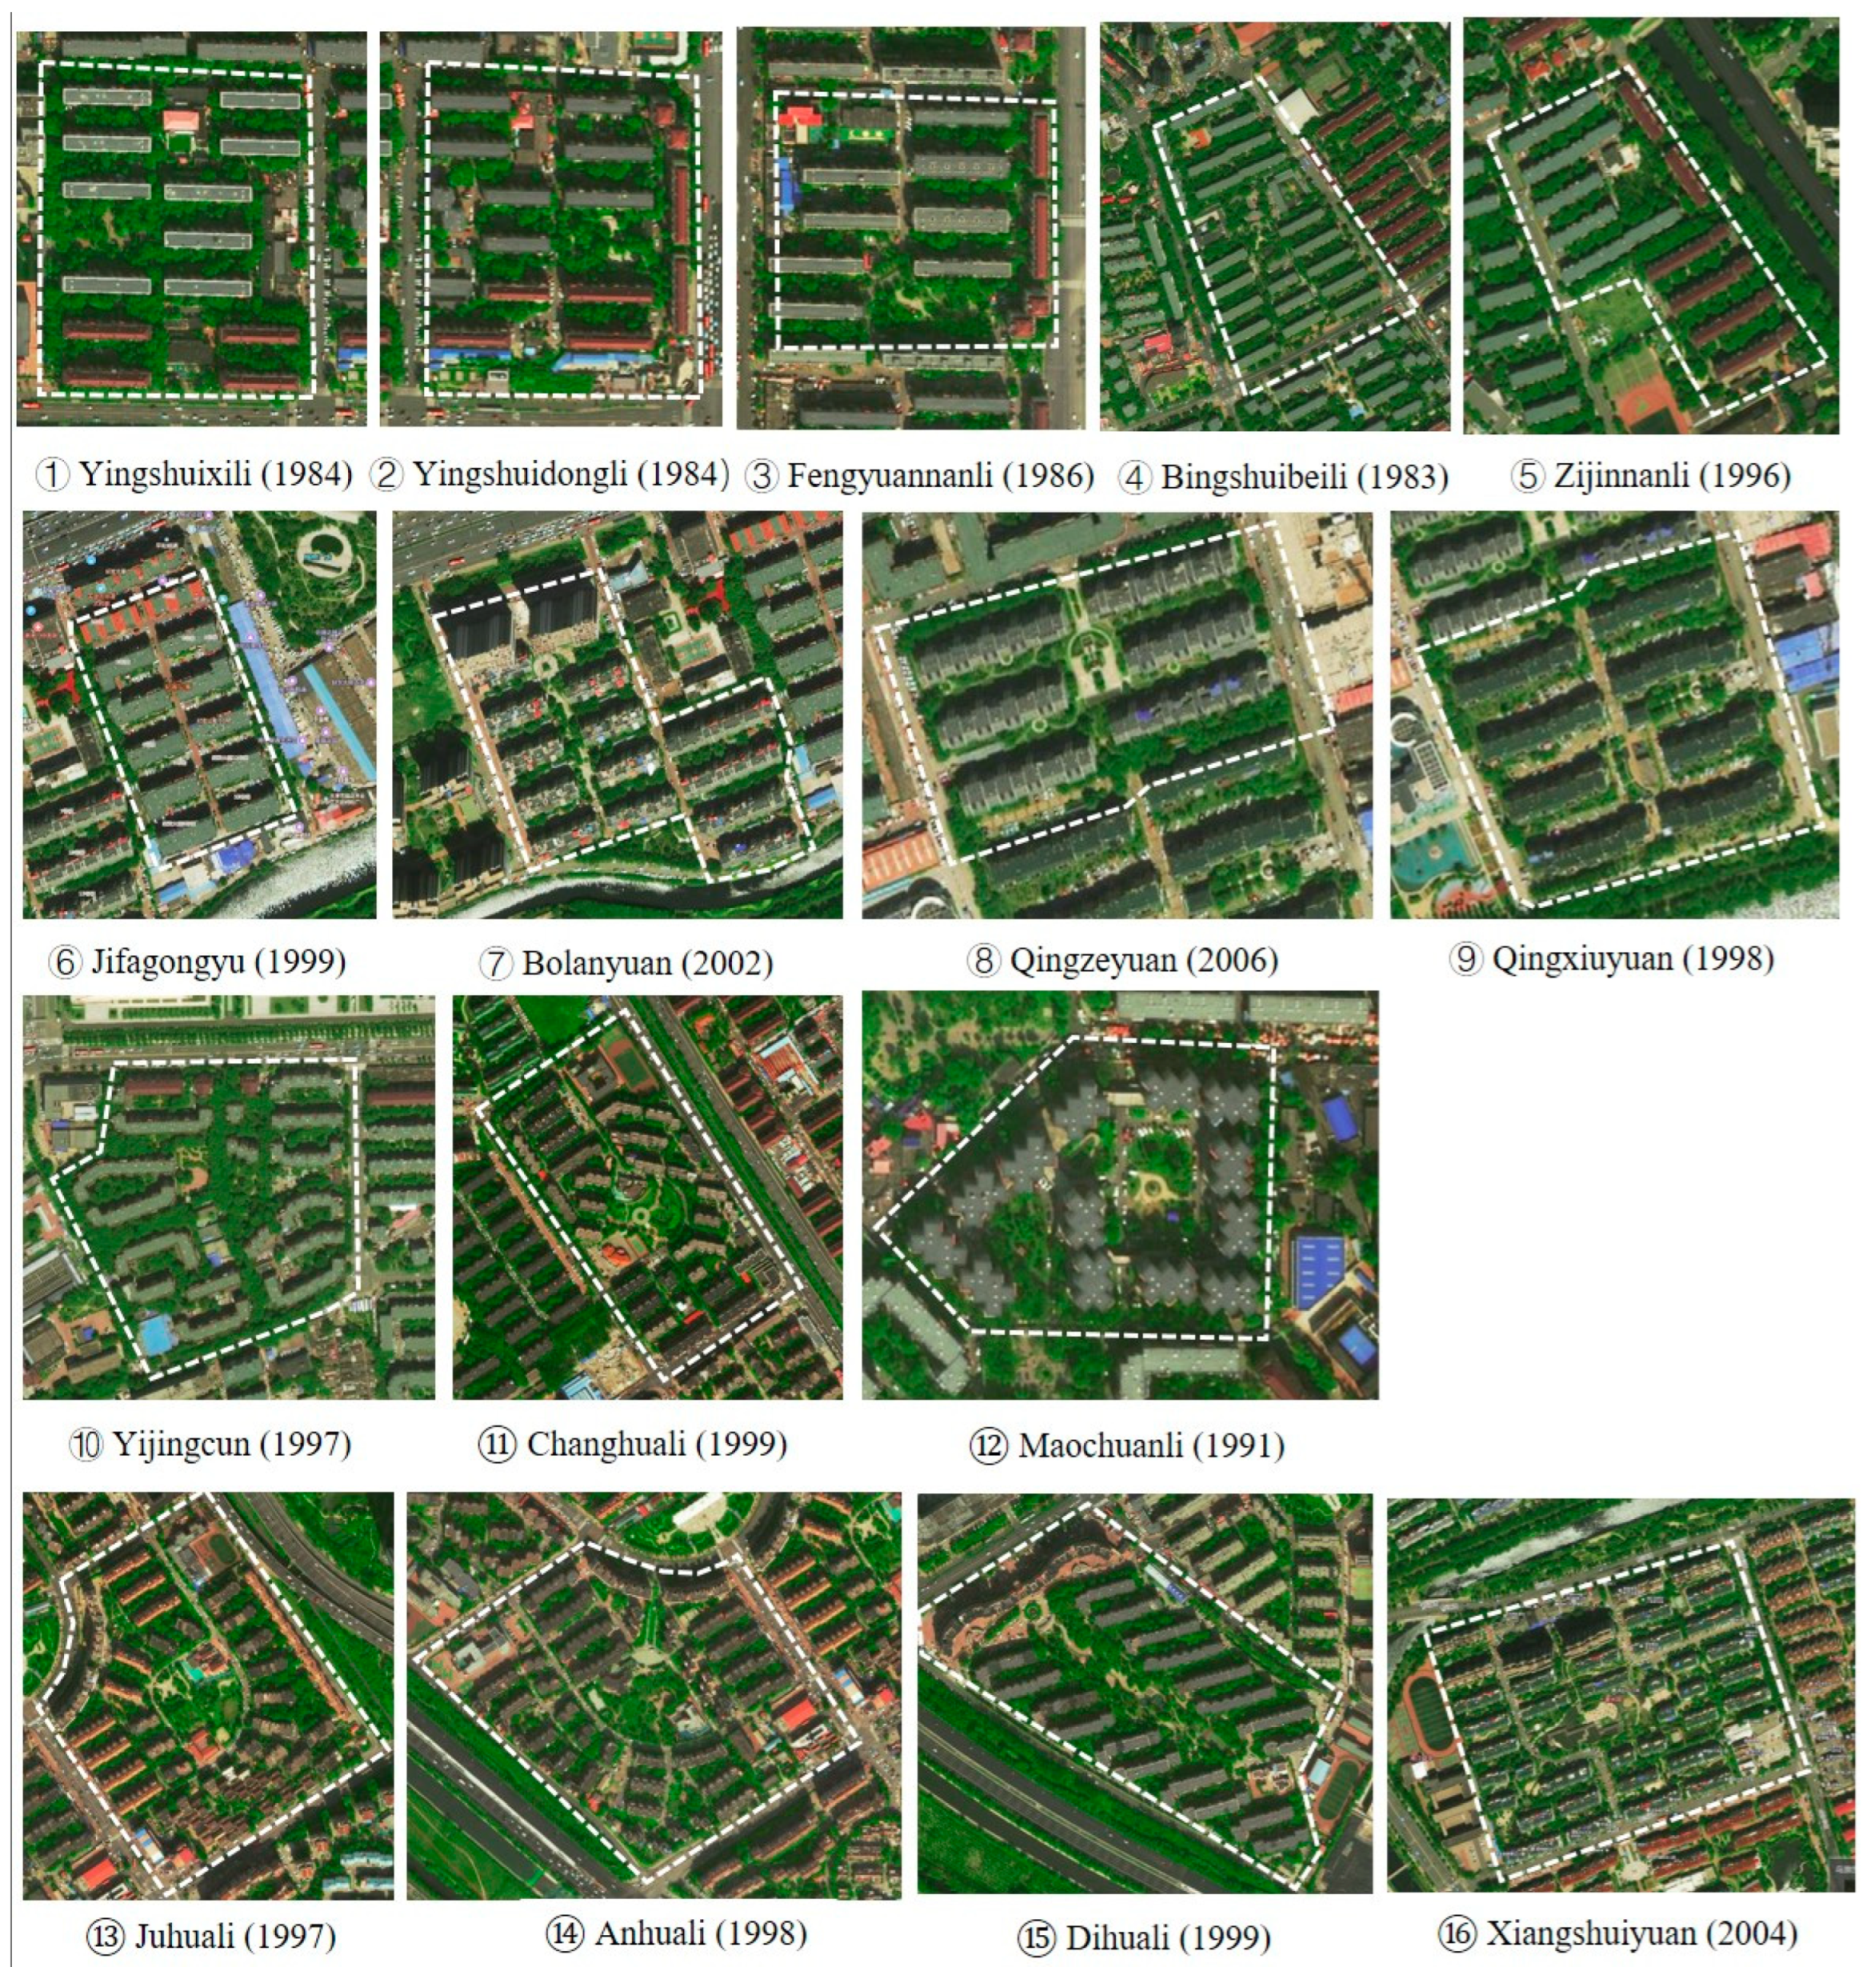
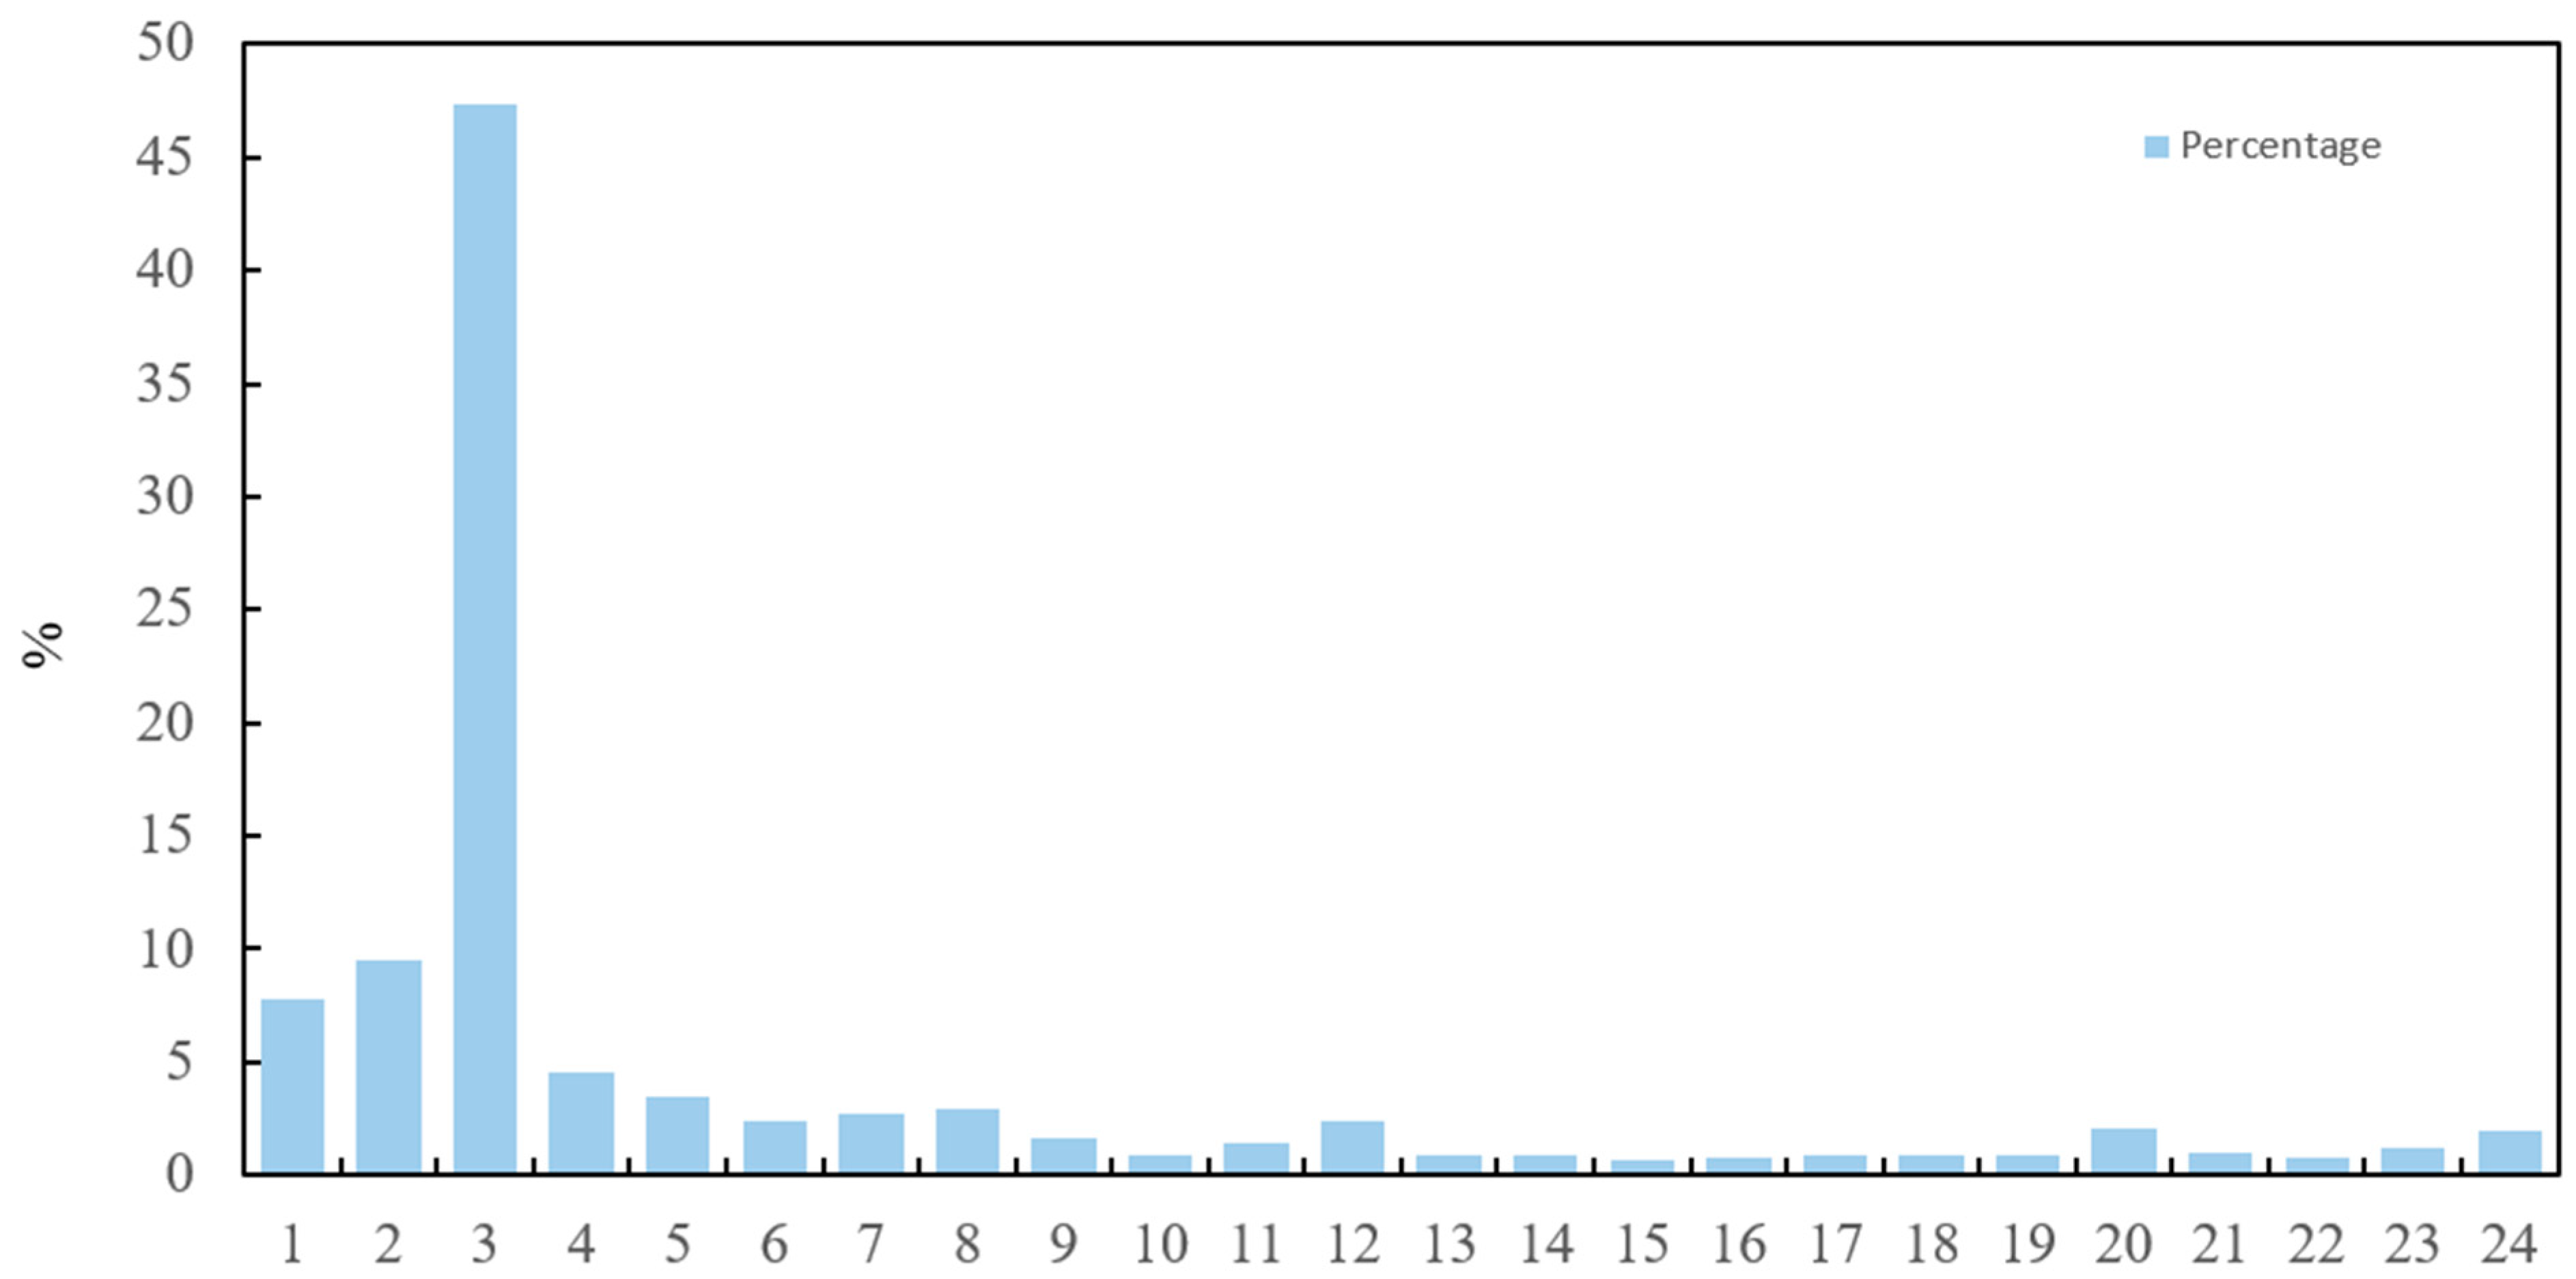
An urban residential area (URA) is a centralized planning area of residential buildings comprised of residential building land and green space in a city. Residential building land and green space are adjacent in the space, similar in form, and highly consistent with each other (Figure 1). Therefore, the layout mode of the residential area hereinafter refers to the layout mode of the green space system in the residential area. Most of the 1751 residential areas in the central urban area of Tianjin were built after 1990, and these account for 83.35% of the residential areas (Figure 2). In this paper, taking these residential areas as samples, according to the classification standards of the layout modes in the Planning and Design of Residential Areas written by Zhu Jiajin [35], the layout modes of the residential areas were classified into block mode, axial mode, enclosed mode, centripetal mode, and comprehensive mode. Block mode accounts for the highest proportion at 81.44%. Enclosed mode and axial mode layouts take second place, accounting for 11.15% and 5.04%, respectively. Comprehensive mode accounts for only 1.54%, and the other two modes are very rare.
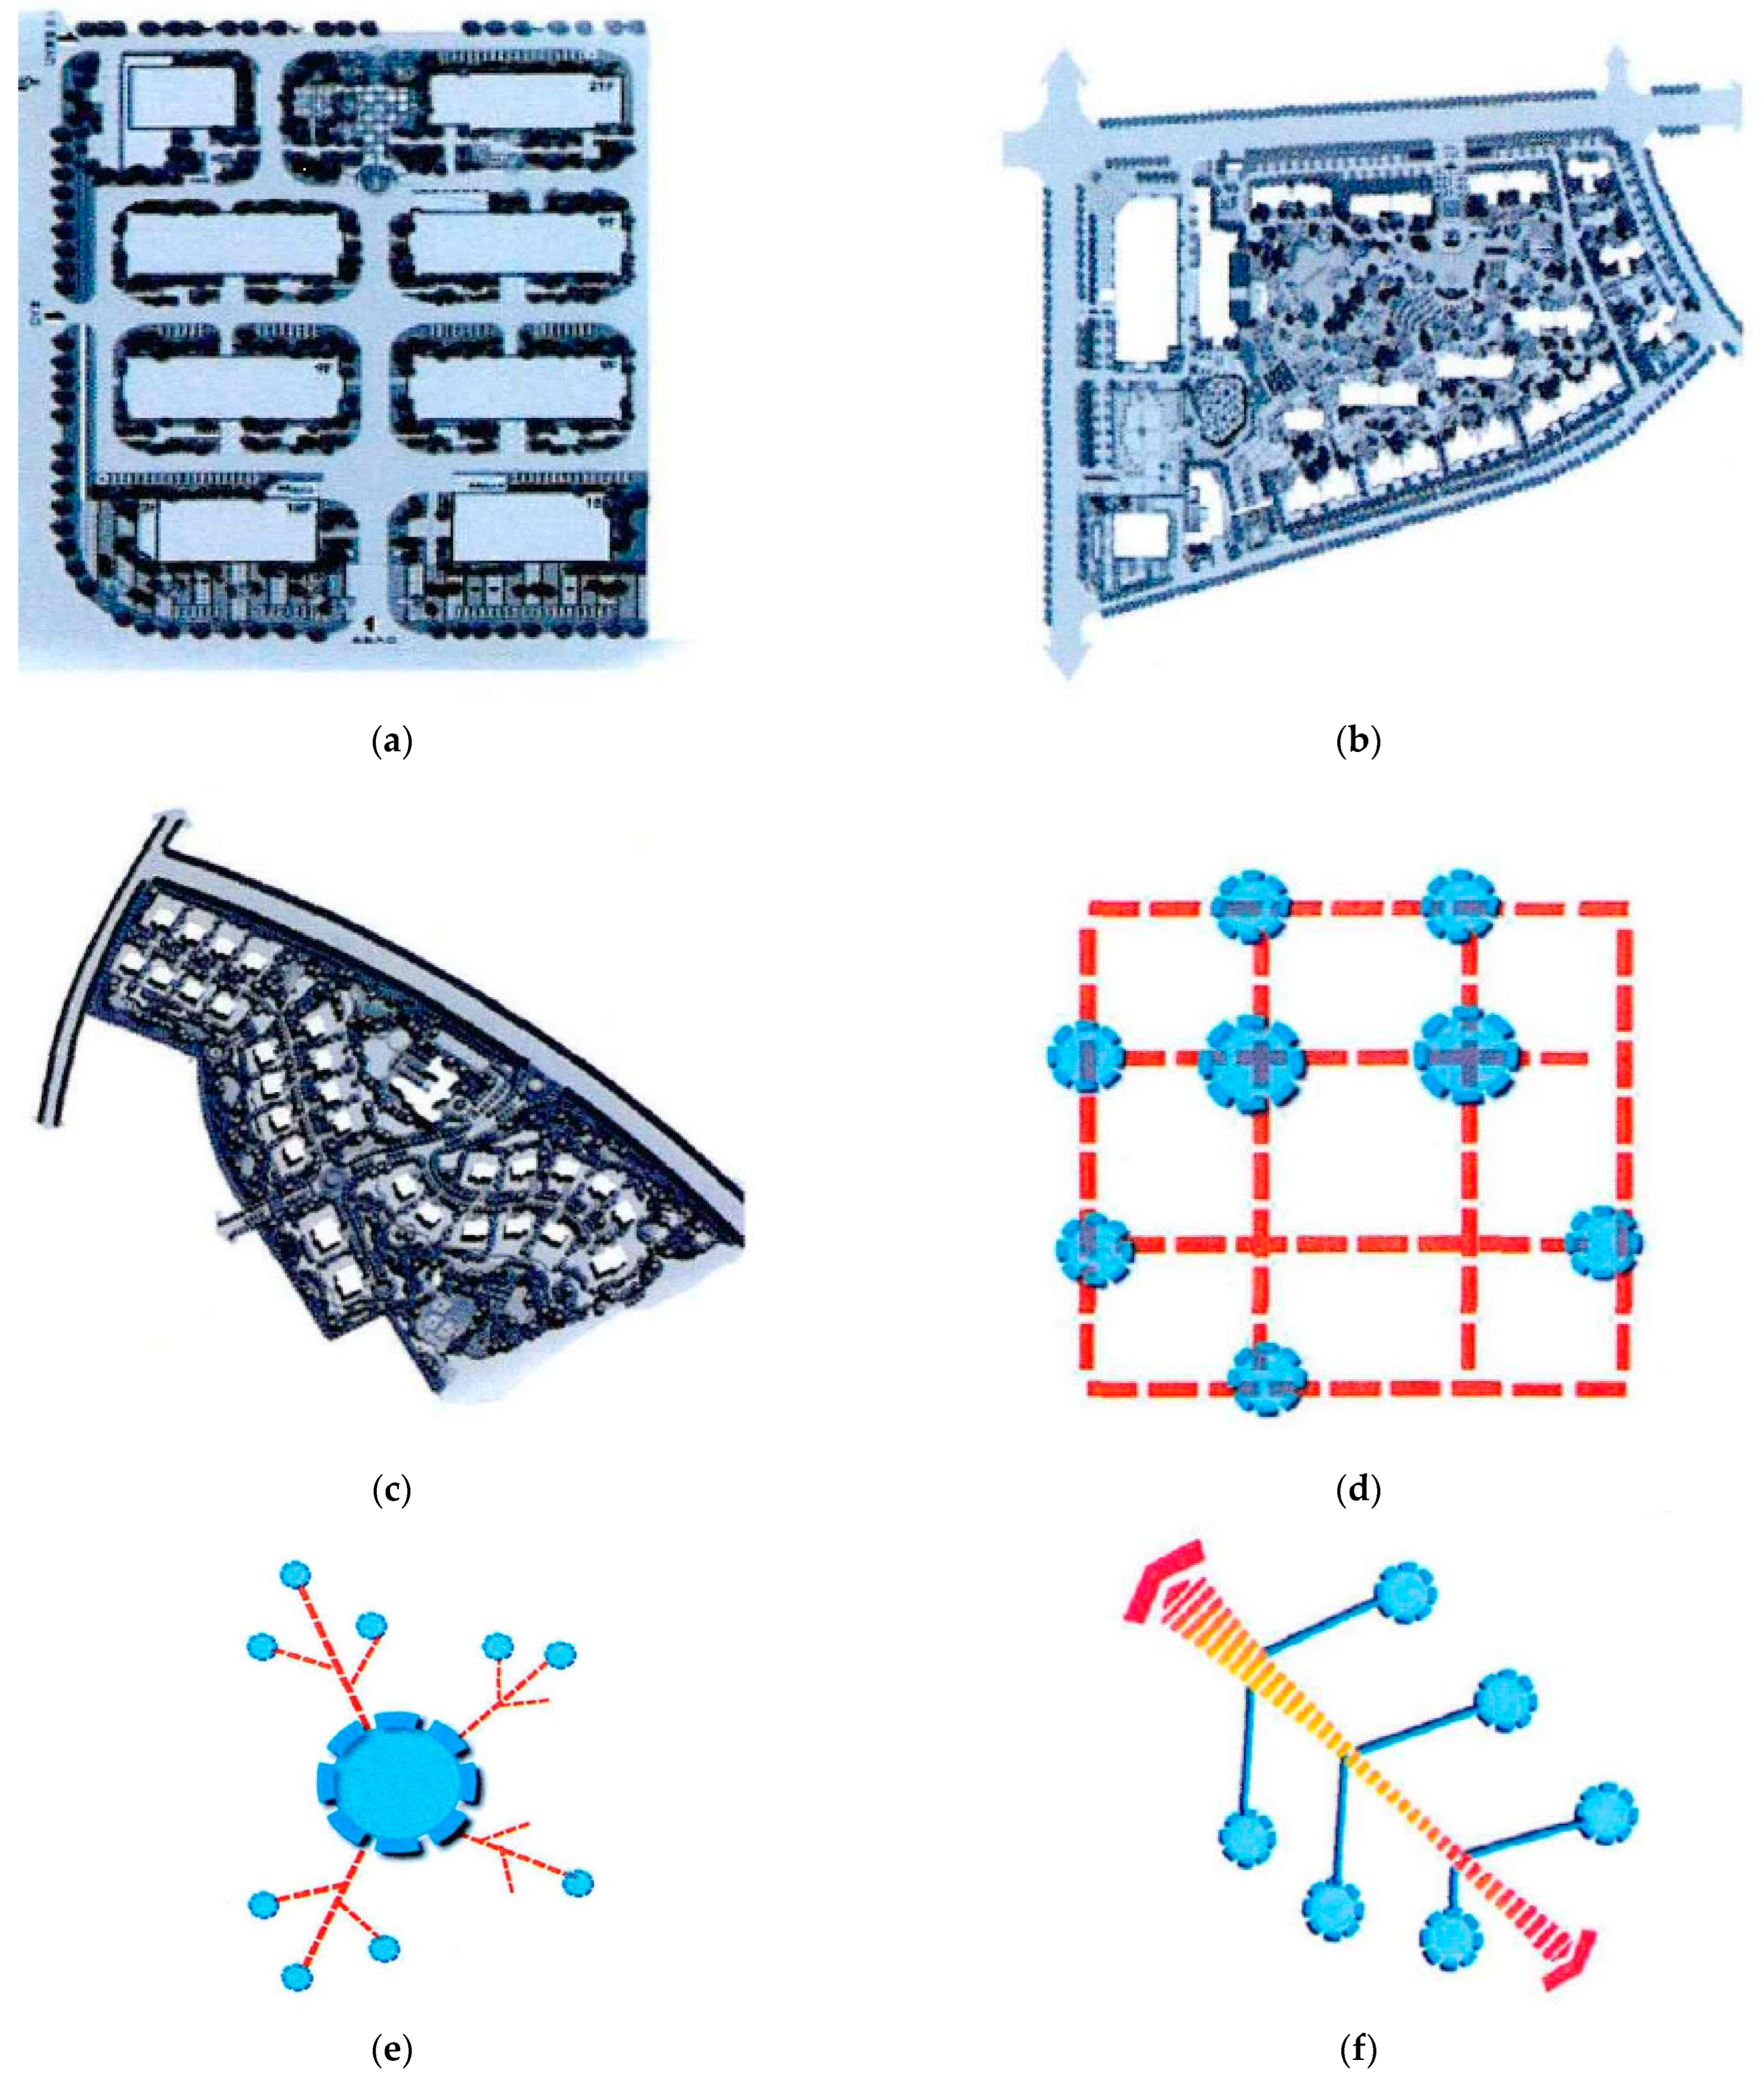
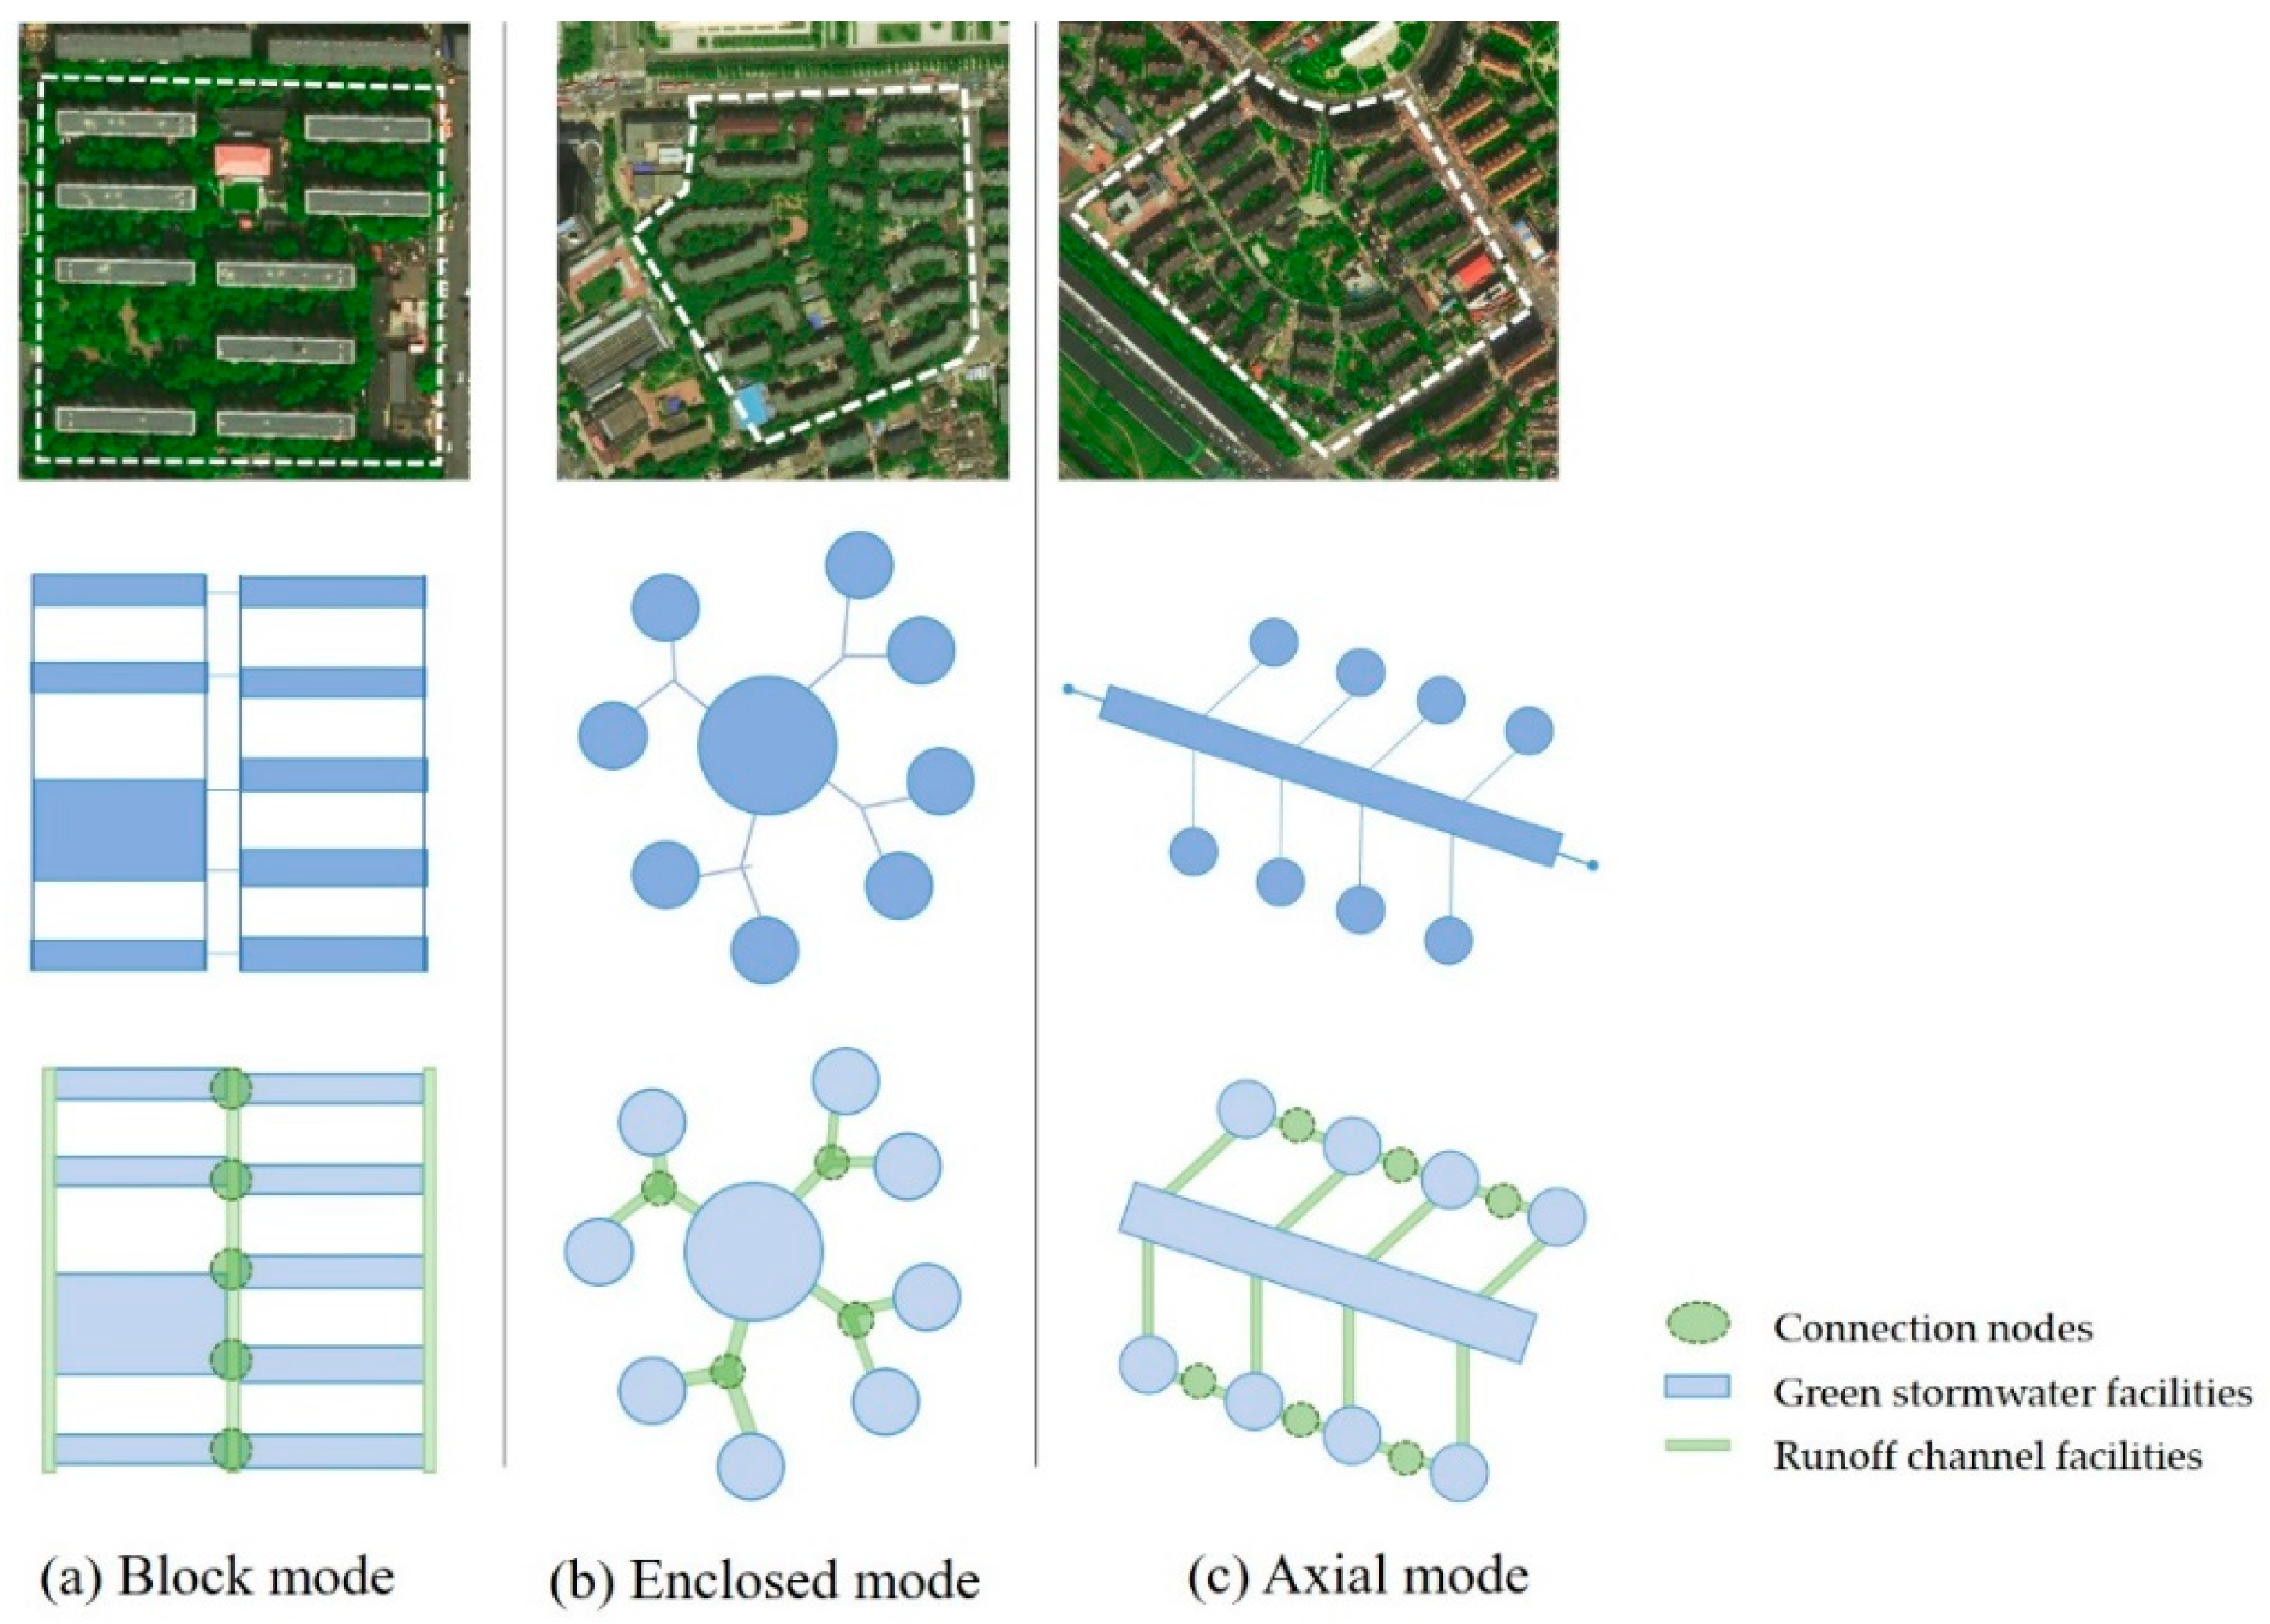
Figure 1 presents a small part of the URAs in Tianjin City showing three of the layout modes listed above. The residential areas in block mode, enclosed mode, and axial mode, which account for large proportions, were selected as samples with which to carry out simulation evaluation and optimization research on the rainwater and flood control capacity of the green space layout. Three representative URAs were selected as objects; they are Yinshuidongli (②), Yijingcun (⑩), and Anhuali (⑭). As shown in Figure 3, different URA layout modes have different relationships with rainwater collection modes.
(1) Residential areas in block mode: Residential buildings are mainly in the form of slab buildings with multiple floors; they are arranged in rows and are characterized by a compact layout and simple form. The layout of the green space is fragmented. This type of URA is characterized by small-scale green space and large areas of hard ground (Figure 2, ①–⑨).
(2) Residential areas in enclosed mode: Buildings are enclosed outside the base, and a concentrated green space is arranged in the secondary space formed by the enclosure, such as in Yijingcun, Changhuali, Maochuanli, etc. (Figure 2, ⑩–⑫).
(3) Residential areas in axial mode: Green space, water bodies, and main roads in the residential areas act as the axial guidance of the base and provide associations between building groups; the axis is successive and the layouts of URAs are characterized by intense aggregation and guidance, such as in Juhuali, Anhuali, Tiandihuayuan, etc. (Figure 2, ⑬–⑯).
2.2. Storm Rainfall Design
We aimed to find the relationship between UGS and the hydrological process through the method of evaluating runoff reduction efficiency in different scenarios under heavy storm events. In recent years, Tianjin has been frequently plagued by summer rainstorms, and URAs have been greatly affected by waterlogging. This research uses the storm rainfall profile that is described by the Technical Guideline for the Construction of Tianjin Sponge City (2016) [36], where the rainfall profile provided is derived from statistics according to local rainfall data. Due to climate change, the intensity of rainfall events is increasing synchronously. Intensive storm events are universal in Tianjin and need to be addressed. The rainfall pattern selected is representative of actual rainfall events. In addition, due to data access restrictions, 24-h rainfall patterns (Figure 4) are currently the only official data available. For the reasons above, the return period was designated as two years (P = 50%), and the simulation was performed under the condition of total rainwater of 89.0 mm for 24 h. The rainstorm intensity formula can be written as Equation (1):
where q is the designated rainstorm intensity [L/(s * hm2)]; t is the duration of the rainfall; and P is the designated return period (year).
Scope of application: 5 min ≤ t ≤ 180 min. P = 2~100 years.
2.3. Workflow
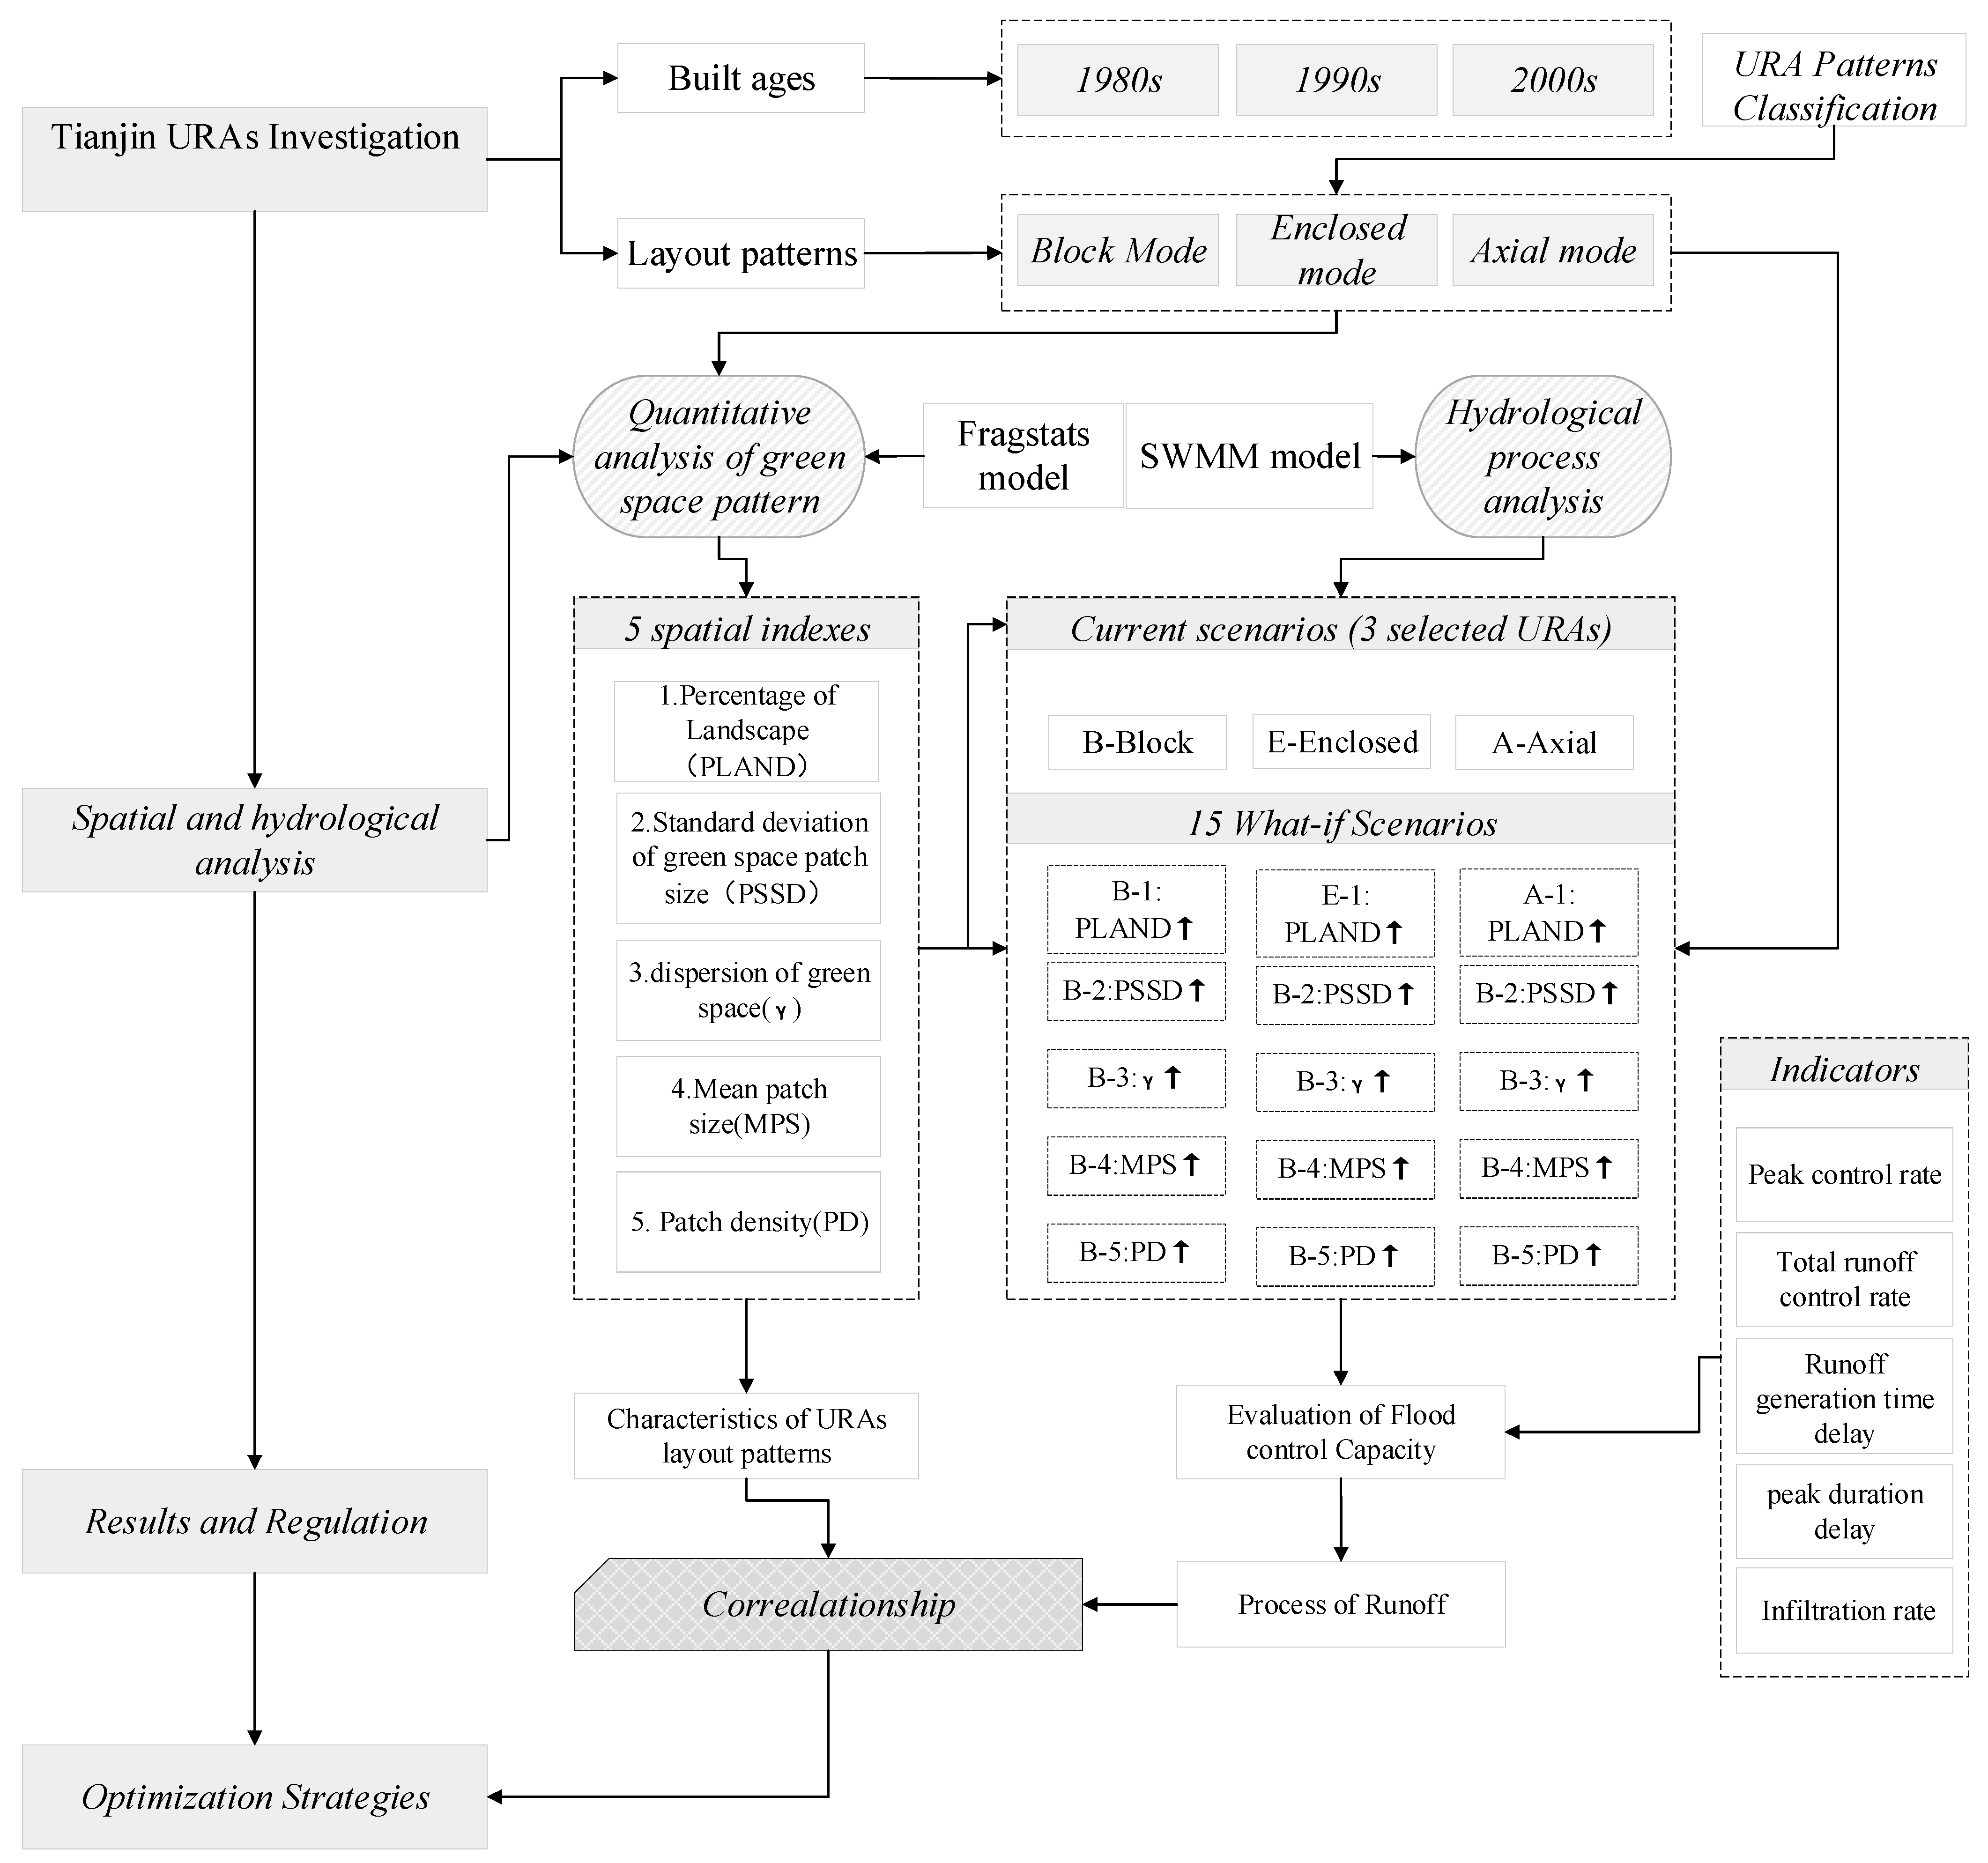
Figure 5 shows the overall research flow of this study. The research consists of three main parts: Tianjin URA investigation, spatial analysis and hydrological analysis, and results analysis. The spatial and hydrological analysis for URAs is the focus of the research. In this part, a quantitative analysis of green space patterns and a hydrological process analysis were carried using Fragstats 4.0 and SWMM 5.0 models, respectively; five spatial indexes were selected to indicate the characteristics of the URA spatial layout, while 15 what-if scenarios were built based on changing the five spatial indexes in three URA green space modes.
2.4. Models
2.4.1. Fragstats
Fragstats is a model used to quantify the green space pattern by using landscape metrics in the local area [37]. It has been used to analyze the distribution of green space in many studies, especially in studies regarding ecological networks that mainly consist of green spaces [38,39]. Fragstats can also be applied to research on urban areas [40]. Fragstats 4.0 is the version used in this study. Structural metrics measure the physical composition and configuration of the patch mosaic without explicit reference to an ecological process, which is different from functional metrics. There are three types of metrics in Fragstats, i.e., patch metrics, class metrics, and landscape metrics, which are used to describe landscapes on a single patch; a group of patches with the same properties, and all patches with different properties in a total landscape, respectively [41]. In this research, structural metrics at the class level were used to reflect the distribution and configuration of green space in URAs. Five indexes were selected to represent UGS spatial patterns; they are percentage of landscape (PLAND), patch size standard deviation (PSSD), (connectivity), mean patch size (MPS), and patch density (PD). The calculating formulas can be described as follows:
where is the type of landscape (in this study, landscape is equal to UGS), is the number of patches in a landscape type, denotes the area of the patch ij, and denotes the total area of UGS. The percentage of landscape (PLAND) indicates the ratio of green space in URAs; a higher value of PLAND means a higher pervious area in the URA, and shows the potential for rainwater control.
In Equation (2), is the average area of the UGS, and is the number of green space patches. The standard deviation of the green space’s patch size (PSSD) reflects the degree of variation in the patch size of the green space.
Mean patch size (MPS) reflects the average value of the patch size. In Equation (4), represents areas of UGSs, while denotes the number of green space patches. The higher the value of the MPS, the larger the area for every patch.
The unit of patch density (PD) is the number of patches per square kilometer.
is the number of nodes in the UGS network, is the number of connections between green space patches, and is the maximum number of connections between patches. Dispersion of green space () indicates the connection between the green corridor and all green space nodes and is called the network connection degree. The larger this index is, the better the network connection degree is, which means that rainwater can be carried more easily in the green space network through the patches’ synergetic effects. For the 5 selected green space spatial indexes, Table 1 lists the distribution characteristics for the 16 Tianjin URAs, shown in Figure 2.
2.4.2. SWMM
As a stormwater management model with a dynamic simulation function developed by the U.S. Environmental Protection Agency, SWMM can simulate a single rainwater event and long-term water quantity and quality in cities [42]. For the hydrological analysis in this study, SWMM 5.0 was applied to simulate the processes of runoff generation and confluence on the surface of residential areas. According to the CAD construction drawings, planning specifications, and on-site surface survey results for the residential areas, the parameters of the sub-catchment area in the SWMM model were selected. In the residential areas, the overall slope of the terrain is small, the average slope of the surface is 0.05%, and the type of soil is cohesive soil. The depression storage depth of the impervious surface is 0.38 mm, and that of the permeable surface is 1.52 mm. The Manning coefficients of the impervious surface and permeable surface are 0.015 and 0.030, respectively.
2.5. Scenario Design
2.5.1. Impact of the UGS Layout
The capacity of green space systems to control rainwater and flooding from the source has been widely recognized both at home and abroad. However, for many residential areas not involved in sponge reconstruction or construction, since the surface runoff directly flows into the pipe network after formation, green space is not truly integrated into the rainwater and flood management process. Therefore, there is a lack of measurement and evaluation data in respect of the rainwater and flood control capacity of green space in residential areas. Based on SWMM, the rainwater and flood management capacity of green space in the three residential areas that we selected and that can represent three typical layout modes was simulated under two scenarios. The first refers to the current situation: the green space system is not integrated into the process of controlling rainwater and flooding in the residential areas from the source, and the rainwater runoff directly flows into the nearby municipal pipe network; the second refers to the ideal situation: the green space system is used to manage rainwater and flooding from the source, and control rain and floods ahead of the pipe network.
After clarifying that the way the green space system in the residential area manages the surface runoff from the source ahead of the pipe network can have a better effect on rainwater and flood management, PLAND, PSSD, MPS, PD, and γ were selected as the quantitative characterization indexes of the green space system. Based on SWMM, by adjusting a single characterization index each time, the layout optimization mode of green space systems in residential areas with all typical layout modes under the goal of rainwater and flood management was discussed.
2.5.2. Simulation Scenario Design
Research was carried out on the response relation between the layout mode of a green space system and its rainwater and flood management capacity in residential areas. In addition to 42 URAs, which belong to the comprehensive mode or centripetal mode, 1709 residential areas in Tianjin with the characteristics of the block mode, enclosed mode, and axial mode were taken as samples. Their numbers are 1426, 195, and 88, respectively. Based on the spatial pattern indexes of Fragstats, calculations were carried out. The results show that the residential areas in the above three typical layout modes have a certain regularity and a typical value range in terms of the pattern index of green space (Table 2). In order to facilitate a comparative analysis of all existing residential areas that complied with the above values, Fengyuan Nanli was selected to represent the residential areas in block mode, Yijingcun was selected to represent the residential areas in enclosed mode, and Anhuali was selected to represent the residential areas in axial mode.
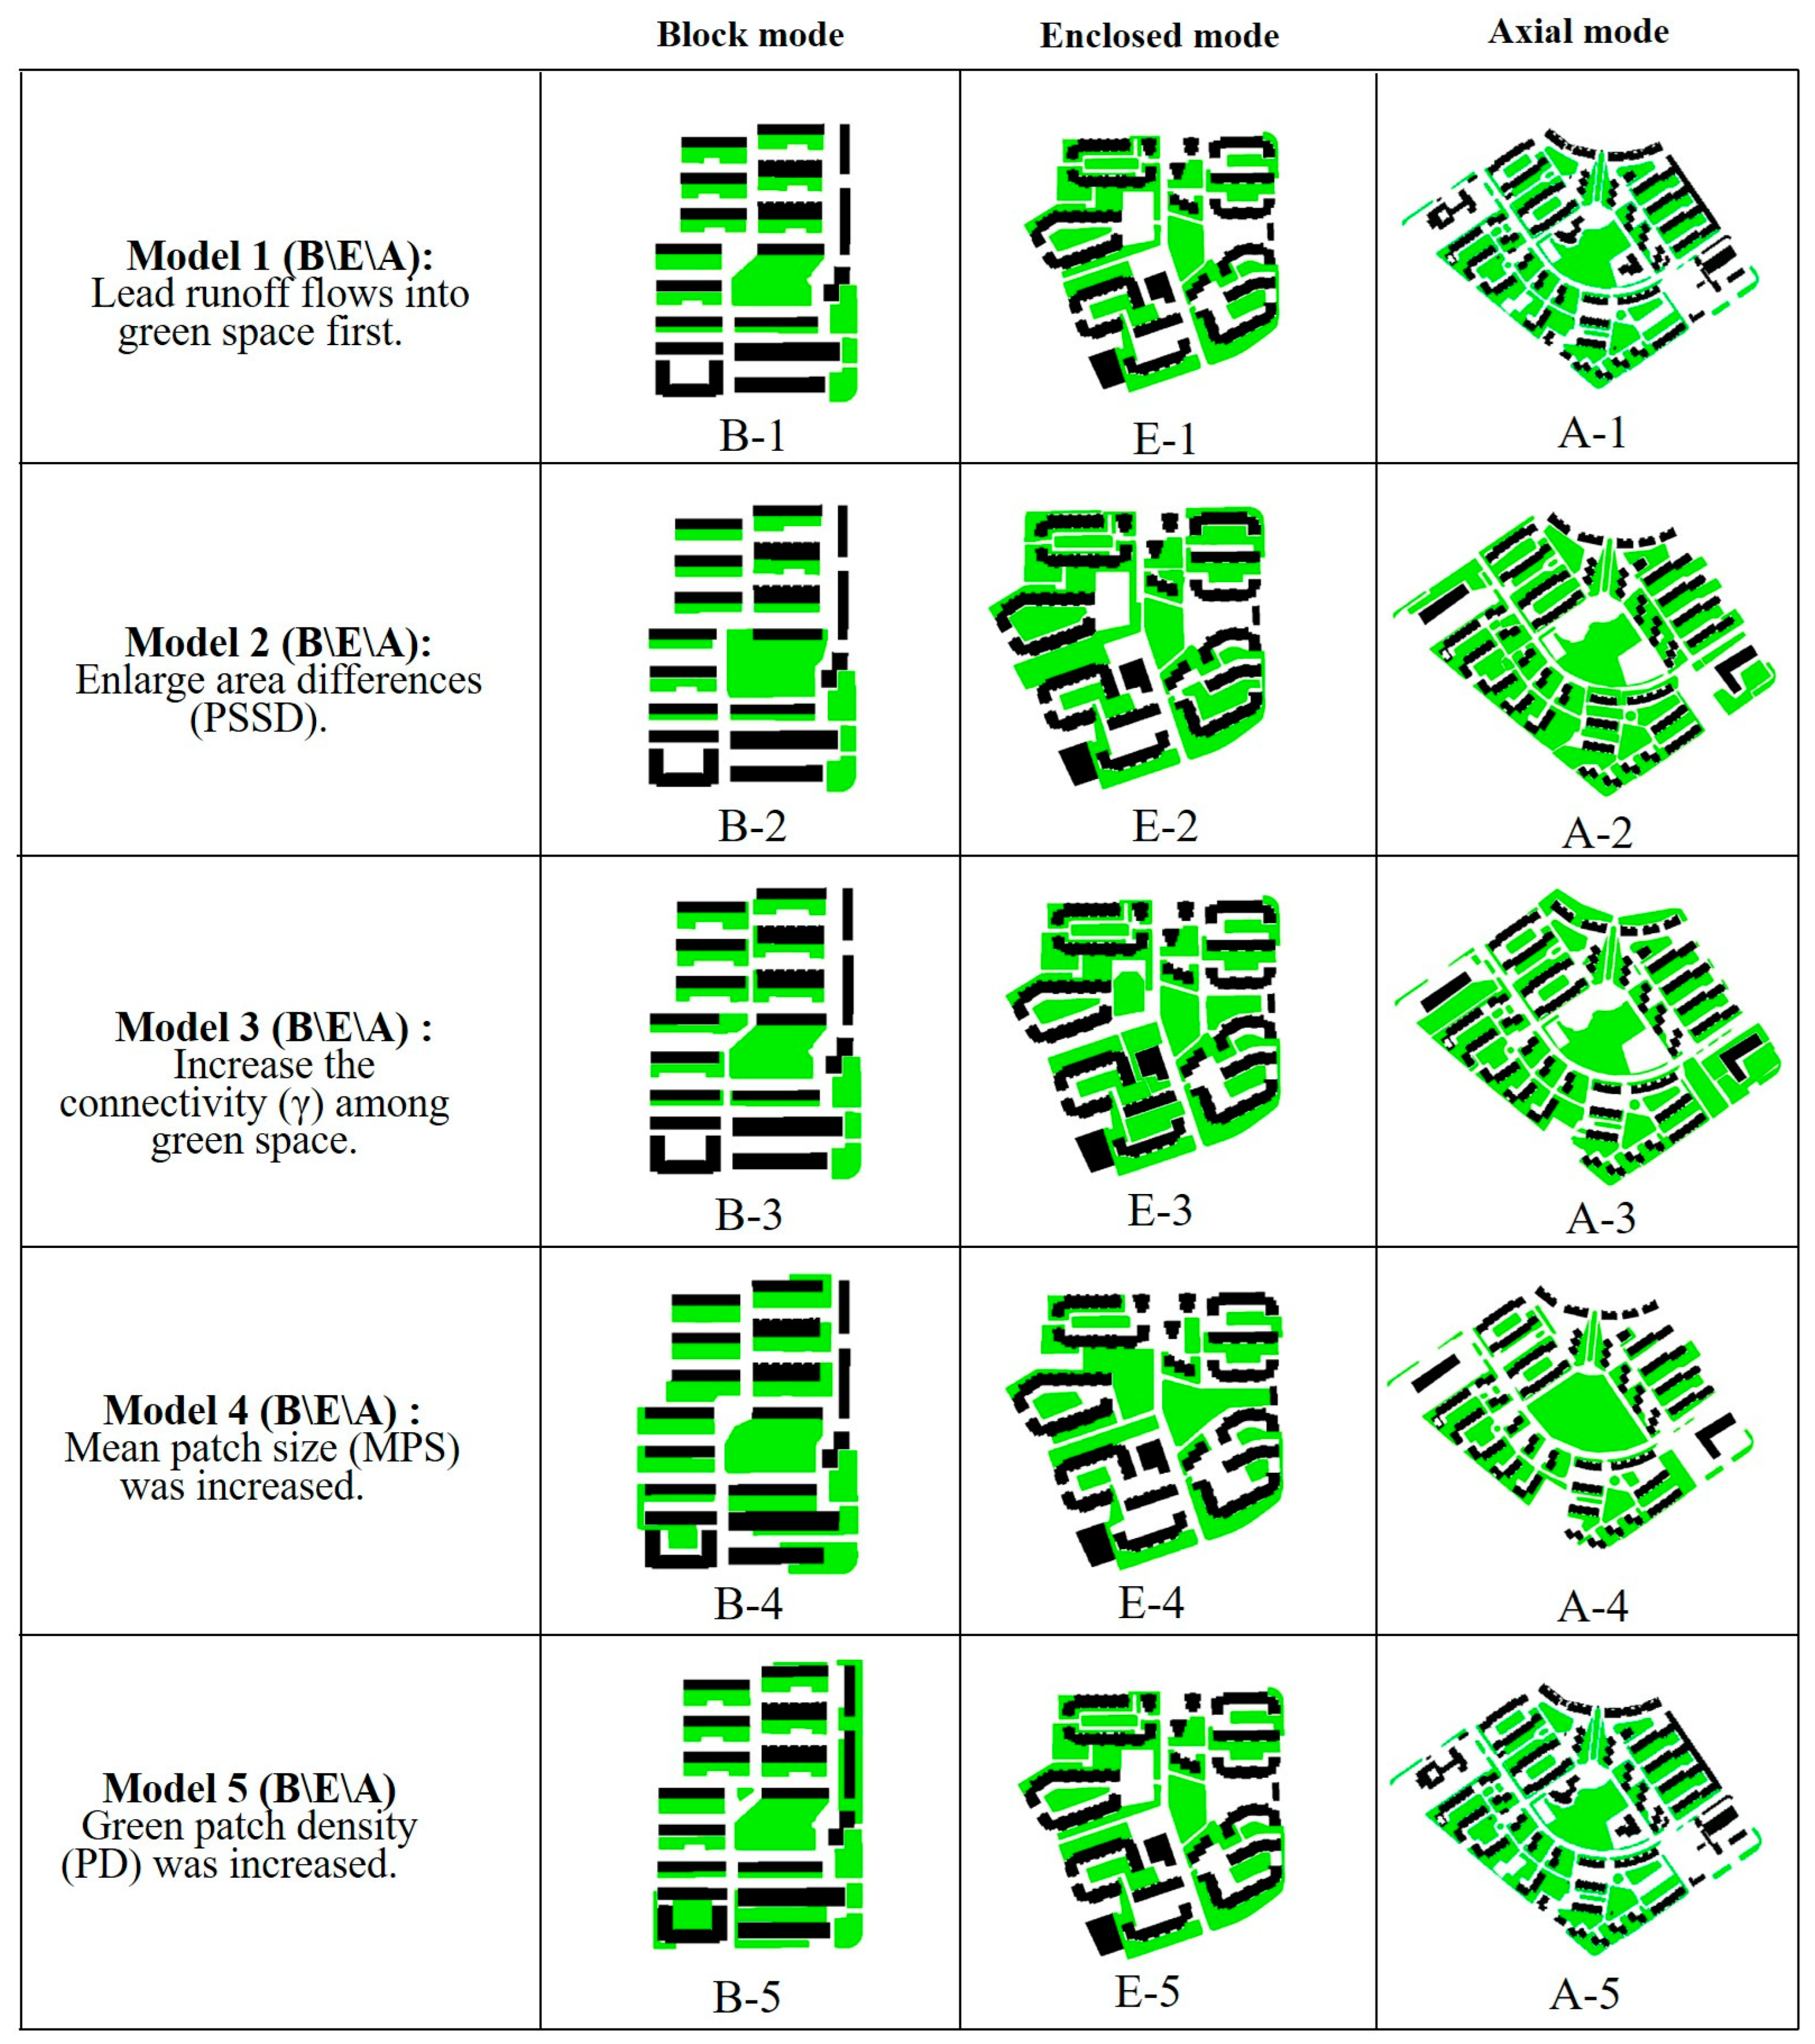
Firstly, for URAs with three typical layout modes, a model group of runoff and confluence processes, adjusting a single characterization index of green space each time, was constructed. Each layout mode includes one initial model (the green space system in the residential area manages runoff from the source ahead of the pipe network) and the following five green space adjustment models (each model adjusts only one green space index).
Model 1 (runoff flows into green space): The current indexes of green space layout in the residential area remained unchanged. Rainwater was first guided into the nearby green space for infiltration, and then drained into the underground pipe network.
Model 2: On the premise that the green space ratio remained unchanged, the PSSD of green space in the residential area was doubled. In actual reconstructions, by increasing the area of the central green space of the residential area and reducing the area of the green space around the residential area, the PSSD of green space in the residential area can be expanded.
Model 3: On the premise that the green space ratio remained unchanged, the connectivity among green patches in the catchment area in the residential area was doubled. In actual reconstructions, if the original green space area in the residential area remains unchanged, underground concealed pipes, open ditches, and other connecting facilities can be designed between the green space to establish a connection between green space and connection between impervious land and green space.
Model 4: On the premise that the green space ratio had been increased by 10%, the average patch size was increased, and the green patch density remained unchanged. In other words, on the premise that the number of existing green space plots had not been increased, the area of each green space was expanded according to the proportion of the area of increased green space to the area of existing green space.
Model 5: On the premise that the green space ratio had been increased by 10%, the green patch density was increased, and the average patch size remained unchanged. In this paper, the original green space remained unchanged and new green space was added; in other words, the number of green plots was increased. The average area of the newly added green space was approximately equal to that of the existing green space.
The three layout modes each have five models according to the spatial indexes selected in this study; hence, 3 basic models and 15 “what-if” scenarios (Figure 6) for 3 modes were designed. The differences between models with 5 distribution indexes are shown in Table 3. Based on these 15 scenarios, the SWMM model was established to simulate hydrological processes.
3. Results
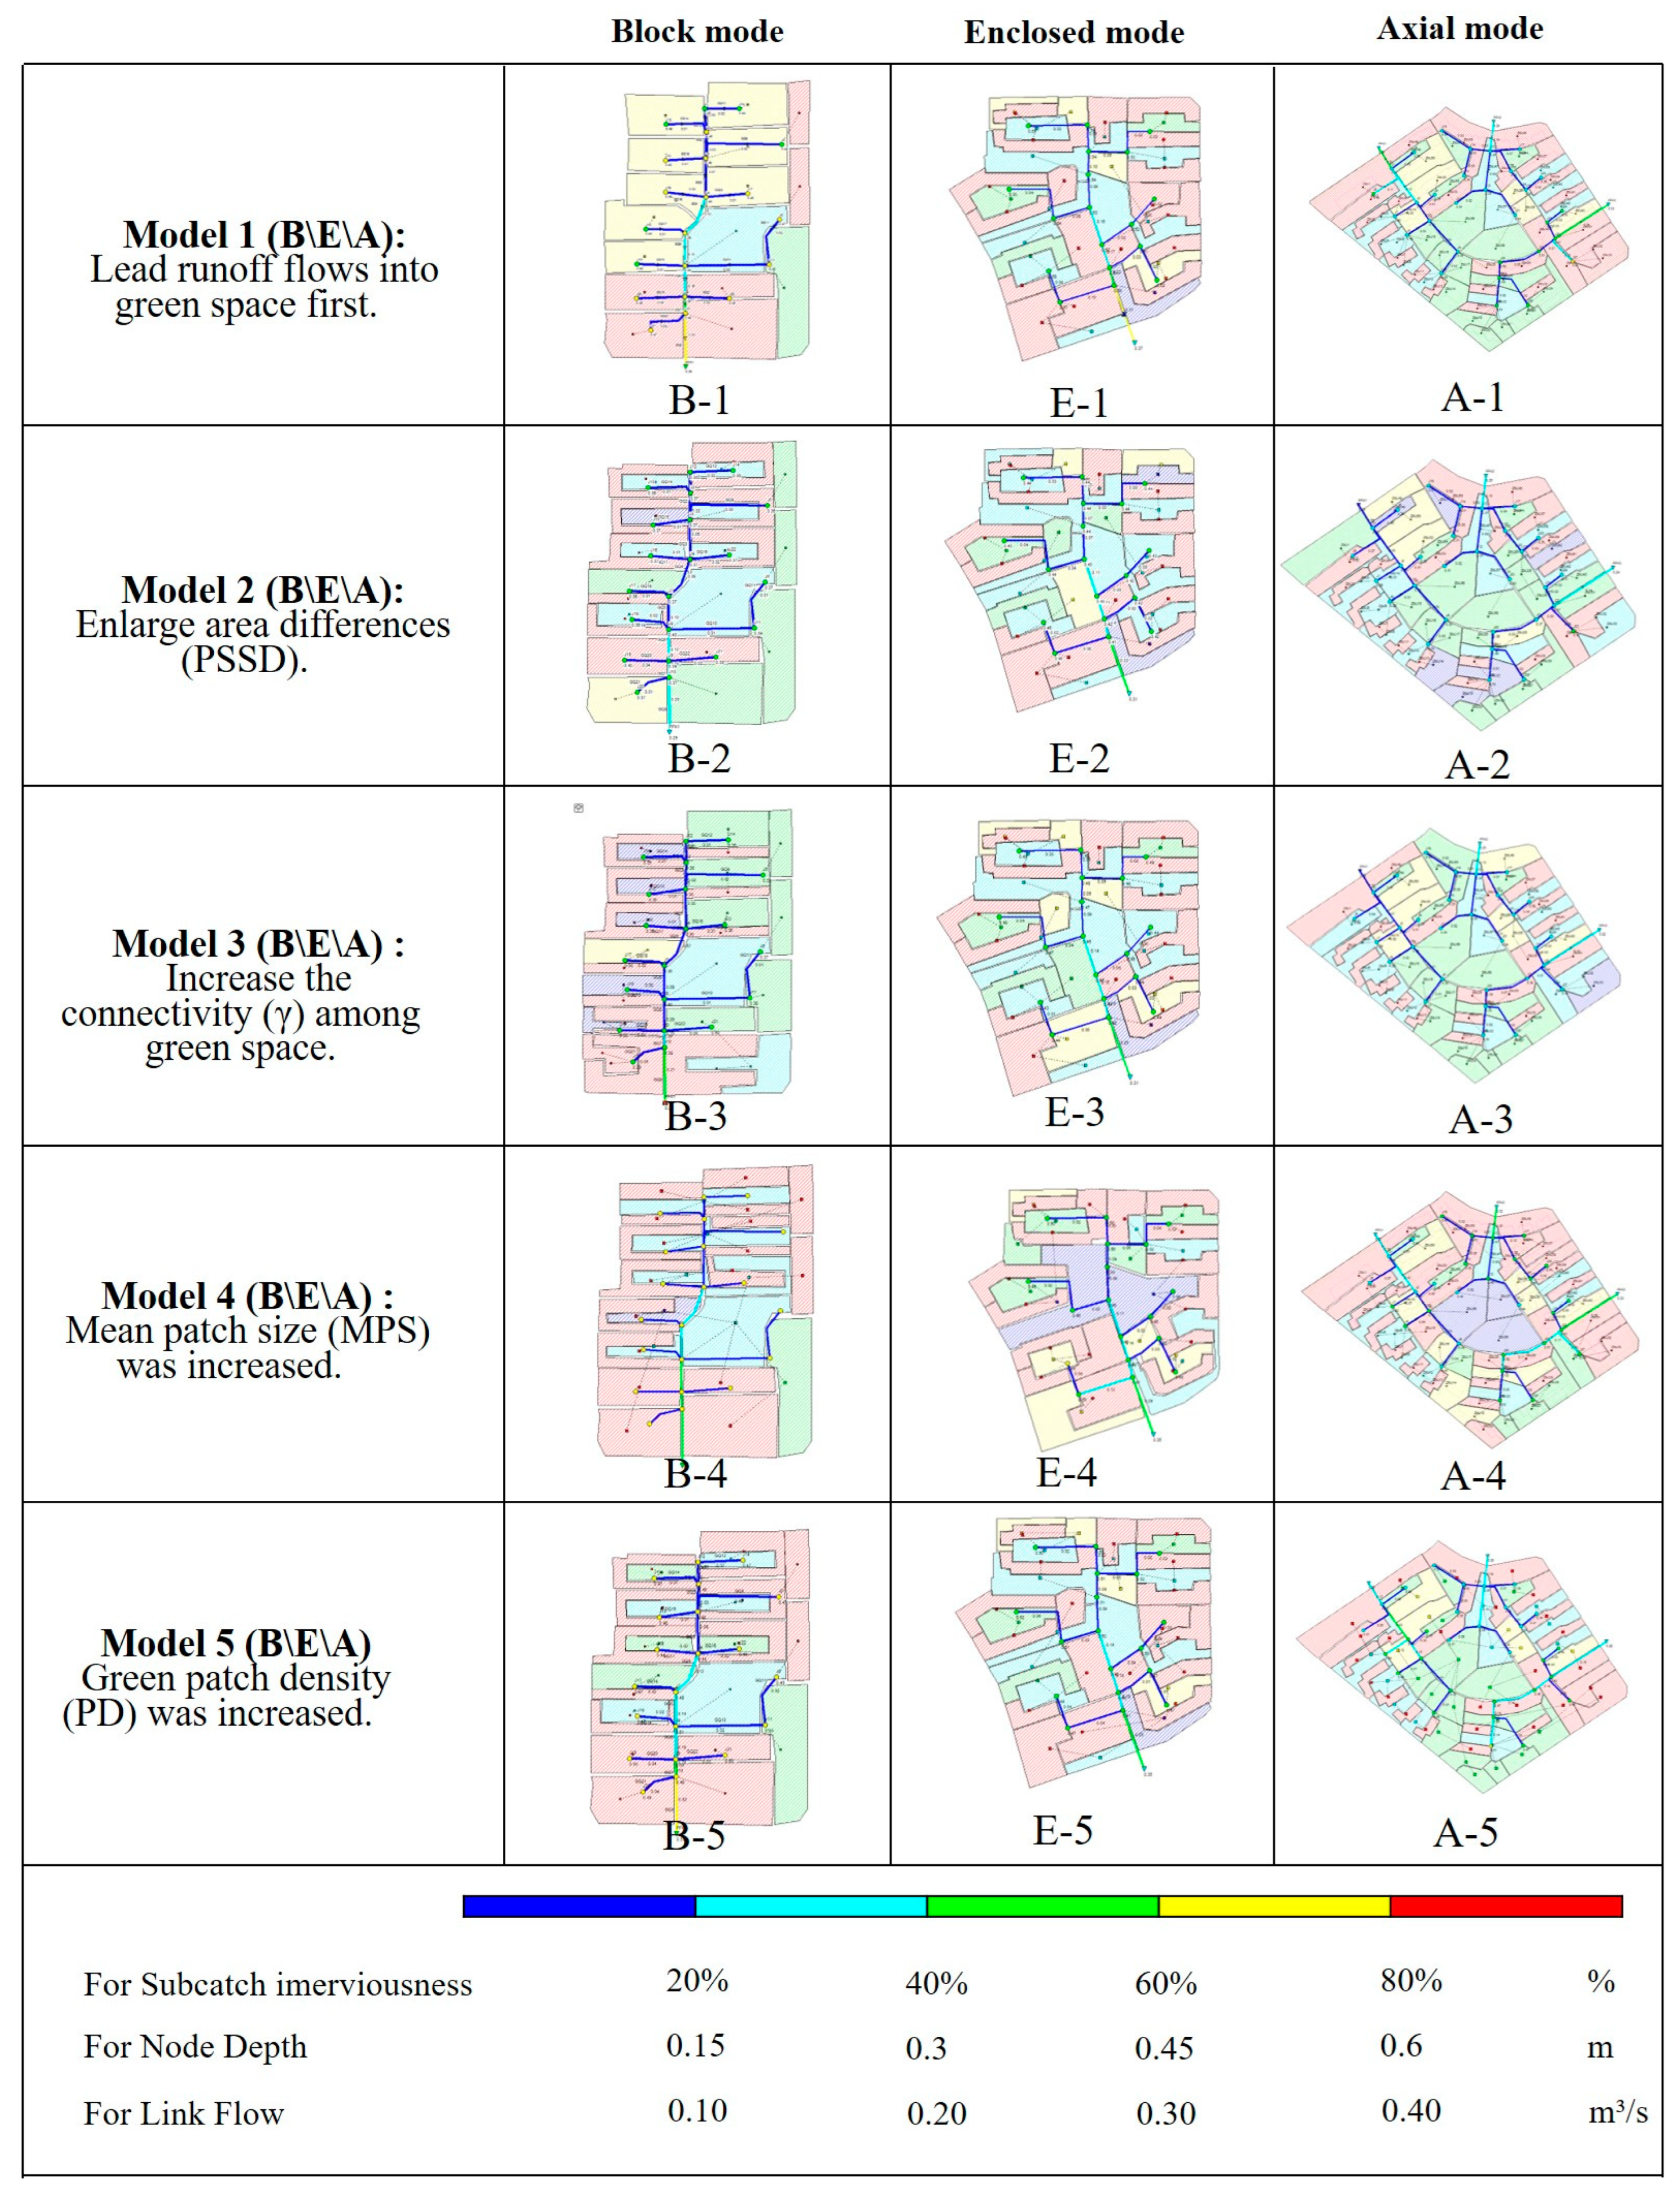
Focusing on the goal of determining what is the most significant factor affecting the process of hydrology in URAs, we compared these models using groups classified with PLAND; Model 1 is the basic scenario, which is to lead runoff into green space, Model 2 and Model 3 have the same value of PLAND, and Model 4 and Model 5 attempted to increase the value of PLAND to improve the capacity of stormwater management in the three modes. From the comparison of Model 1 with Models 2 and 3, the results show what is the most important spatial factor when green space construction is limited. From the comparison of Model 1 with Models 4 and 5, the results show what is the most important factor when we have enough space for green space extension. In every group, the number indexes and distribution indexes can be compared to see which factors have a larger impact on the runoff process. The performance of hydrological process with three modes also shows significant difference on spatial distribution (Figure 7).
3.1. Impact of Green Space System Layout on Hydrological Process in Block Mode URAs
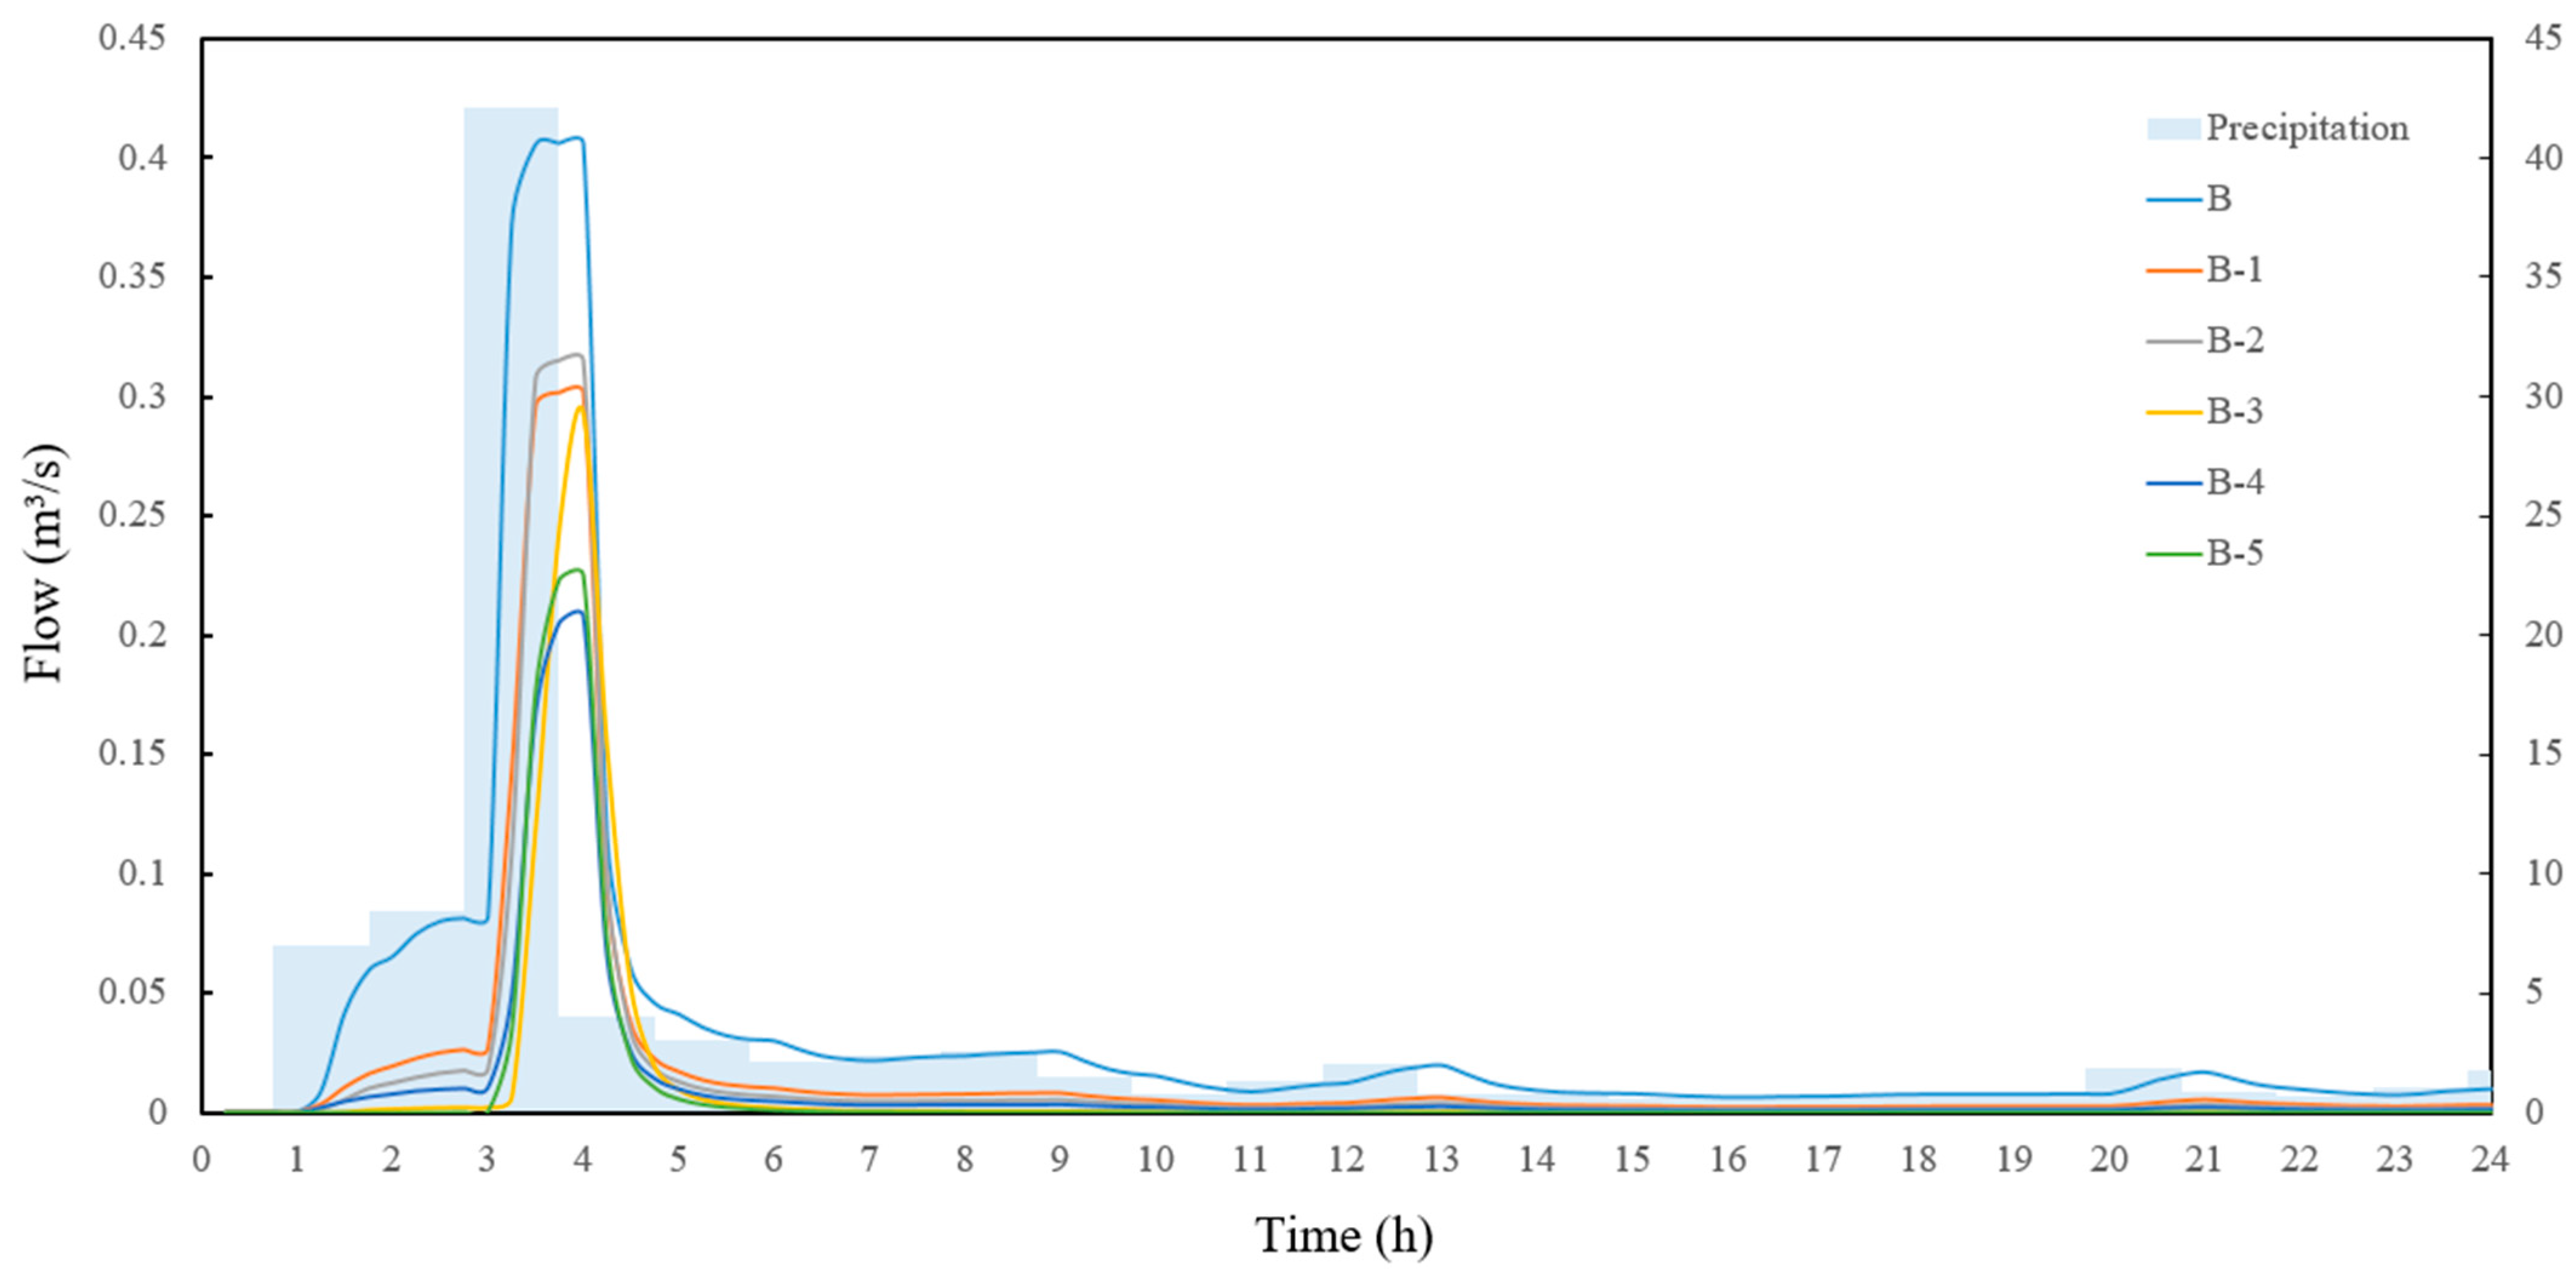
For the block mode, comparing B-1 with the current situation, the reduction rate of peak flow and total runoff volume in the residential areas are 25.82% and 49.51%, respectively (Table 4; Figure 8). By comparing B-1, B-2, and B-3, it was found that it is more effective to increase connectivity (γ) among green spaces than to reduce the PSSD. In B-3, the peak runoff control rate increases by 32.66%, the total runoff control rate increases by 72.49% (Table 3), the runoff generation time decreases by 0.25 h and the peak duration decreases by 0.5 h, which are better results than those for Model 1 and Model 2 (Table 3). Therefore, on the premise that the green space ratio remains unchanged, increasing connectivity (γ) among current green space is more effective for residential areas in block mode to improve the rainwater and flood management effect. By comparing B-1, B-4, and B-5, it was found that B-4 and B-5 can reduce peak flow and total runoff volume, and increase infiltration capacity when the green space ratio increases by 10% (Table 4). For residential areas in block mode, if the main goal is to control the total runoff and delay the runoff time, the method of increasing the patch density (PD) should be used; if the main goal is to reduce the peak flow, the method of increasing the mean patch size (MPS) should be used.
3.2. Impact of Green Space System Layout on Hydrological Process in Enclosed Mode URAs
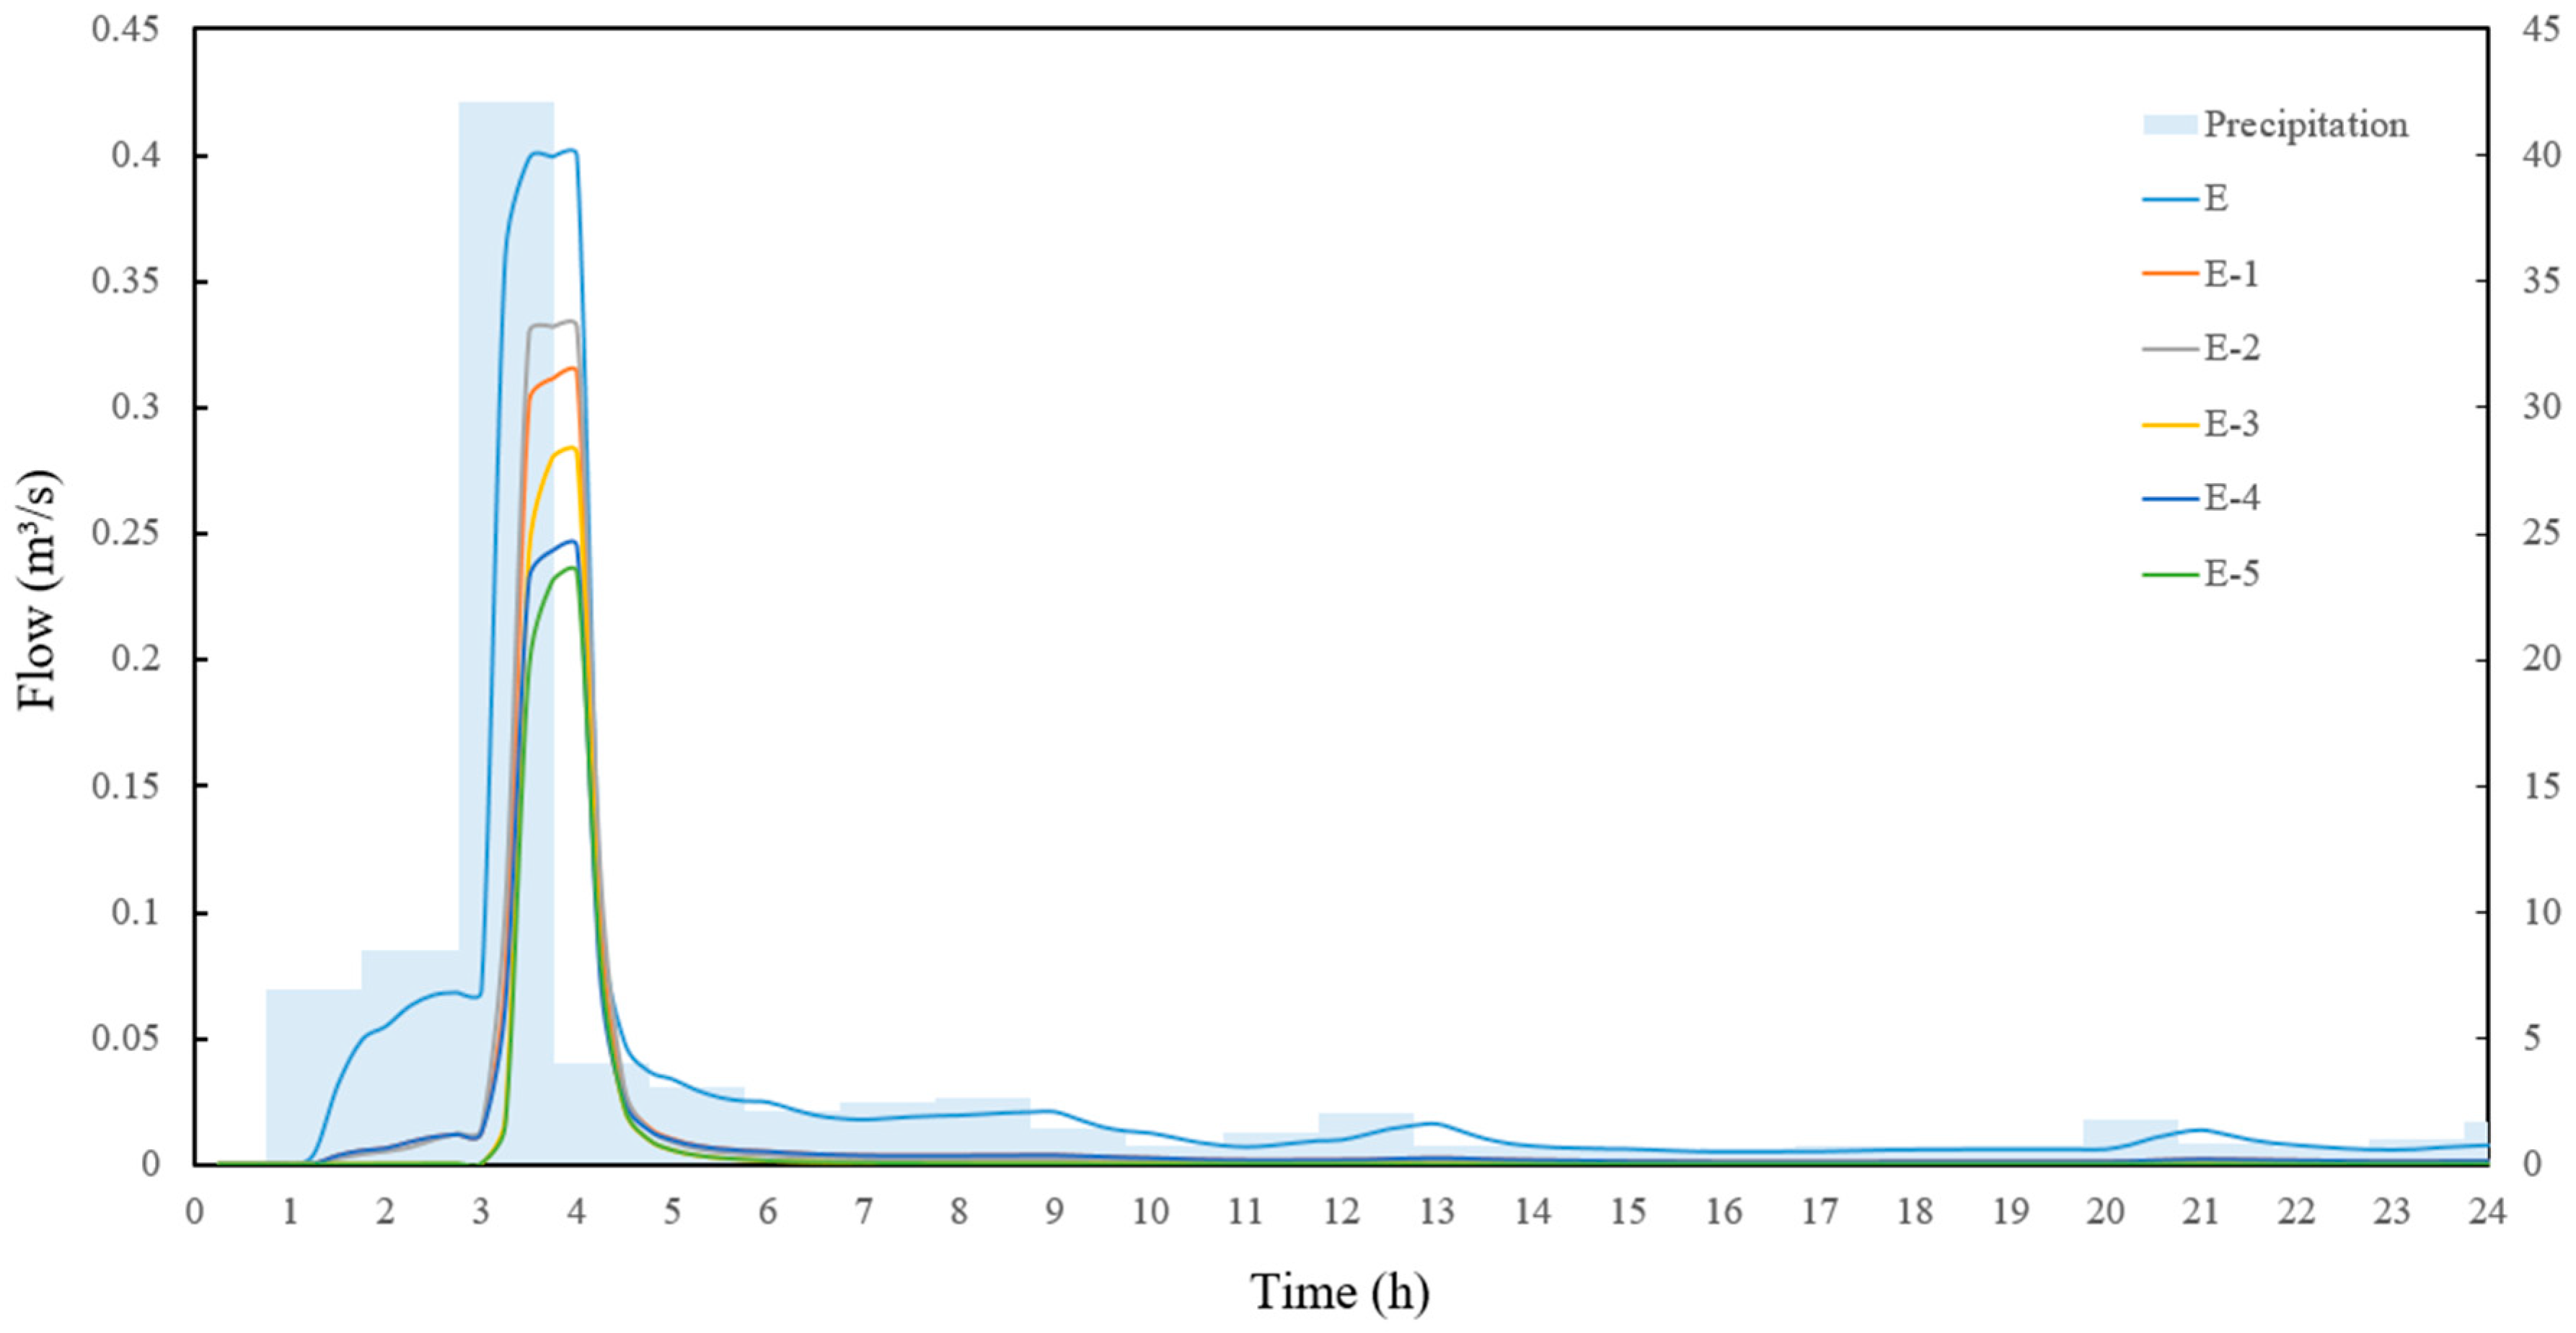
For the enclosed mode, comparing E-1 with the current situation (E), the reduction rates of peak flow and total runoff in the residential areas are 21.42% and 54.51%, respectively (Table 5; Figure 9). By comparing E-1 with Models E-2 and E-3, it was found that E-3 has the best effect on reducing the peak flow value and total runoff volume. It also has the best effect on increasing infiltration capacity, and can decrease the runoff generation time by 2 h on the premise that the green space ratio of the residential area remains unchanged (Table 5). In comparison, a couple of indexes indicate that the effect is slightly improved in E-2. Improving green space connectivity (E-3) is the most effective method. By comparing E-1, E-4, and E-5, it was found that E-4 and E-5 can reduce the peak flow and total runoff volume, and increase infiltration capacity. Compared with E-1, the peak control rate and total runoff control rate of E-5 with the strategy of increasing green space density (PD) are 41.19% and 73.90%, respectively (Table 5). The runoff generation time is decreased by 0.75 h and the peak duration is decreased by 0.25 h (Table 5). The peak control rate and total runoff control rate of E-4 with the strategy of increasing the average patch density (PD) are 38.61% and 62.82%, respectively (Table 5), while the runoff generation time is not decreased. Therefore, the method of increasing green space density (PD) is more effective than the method of increasing the mean patch size (MPS) of green space in the existing residential areas with the enclosed mode.
3.3. Impact of Green Space System Layout on Hydrological Process in Axial Mode URAs
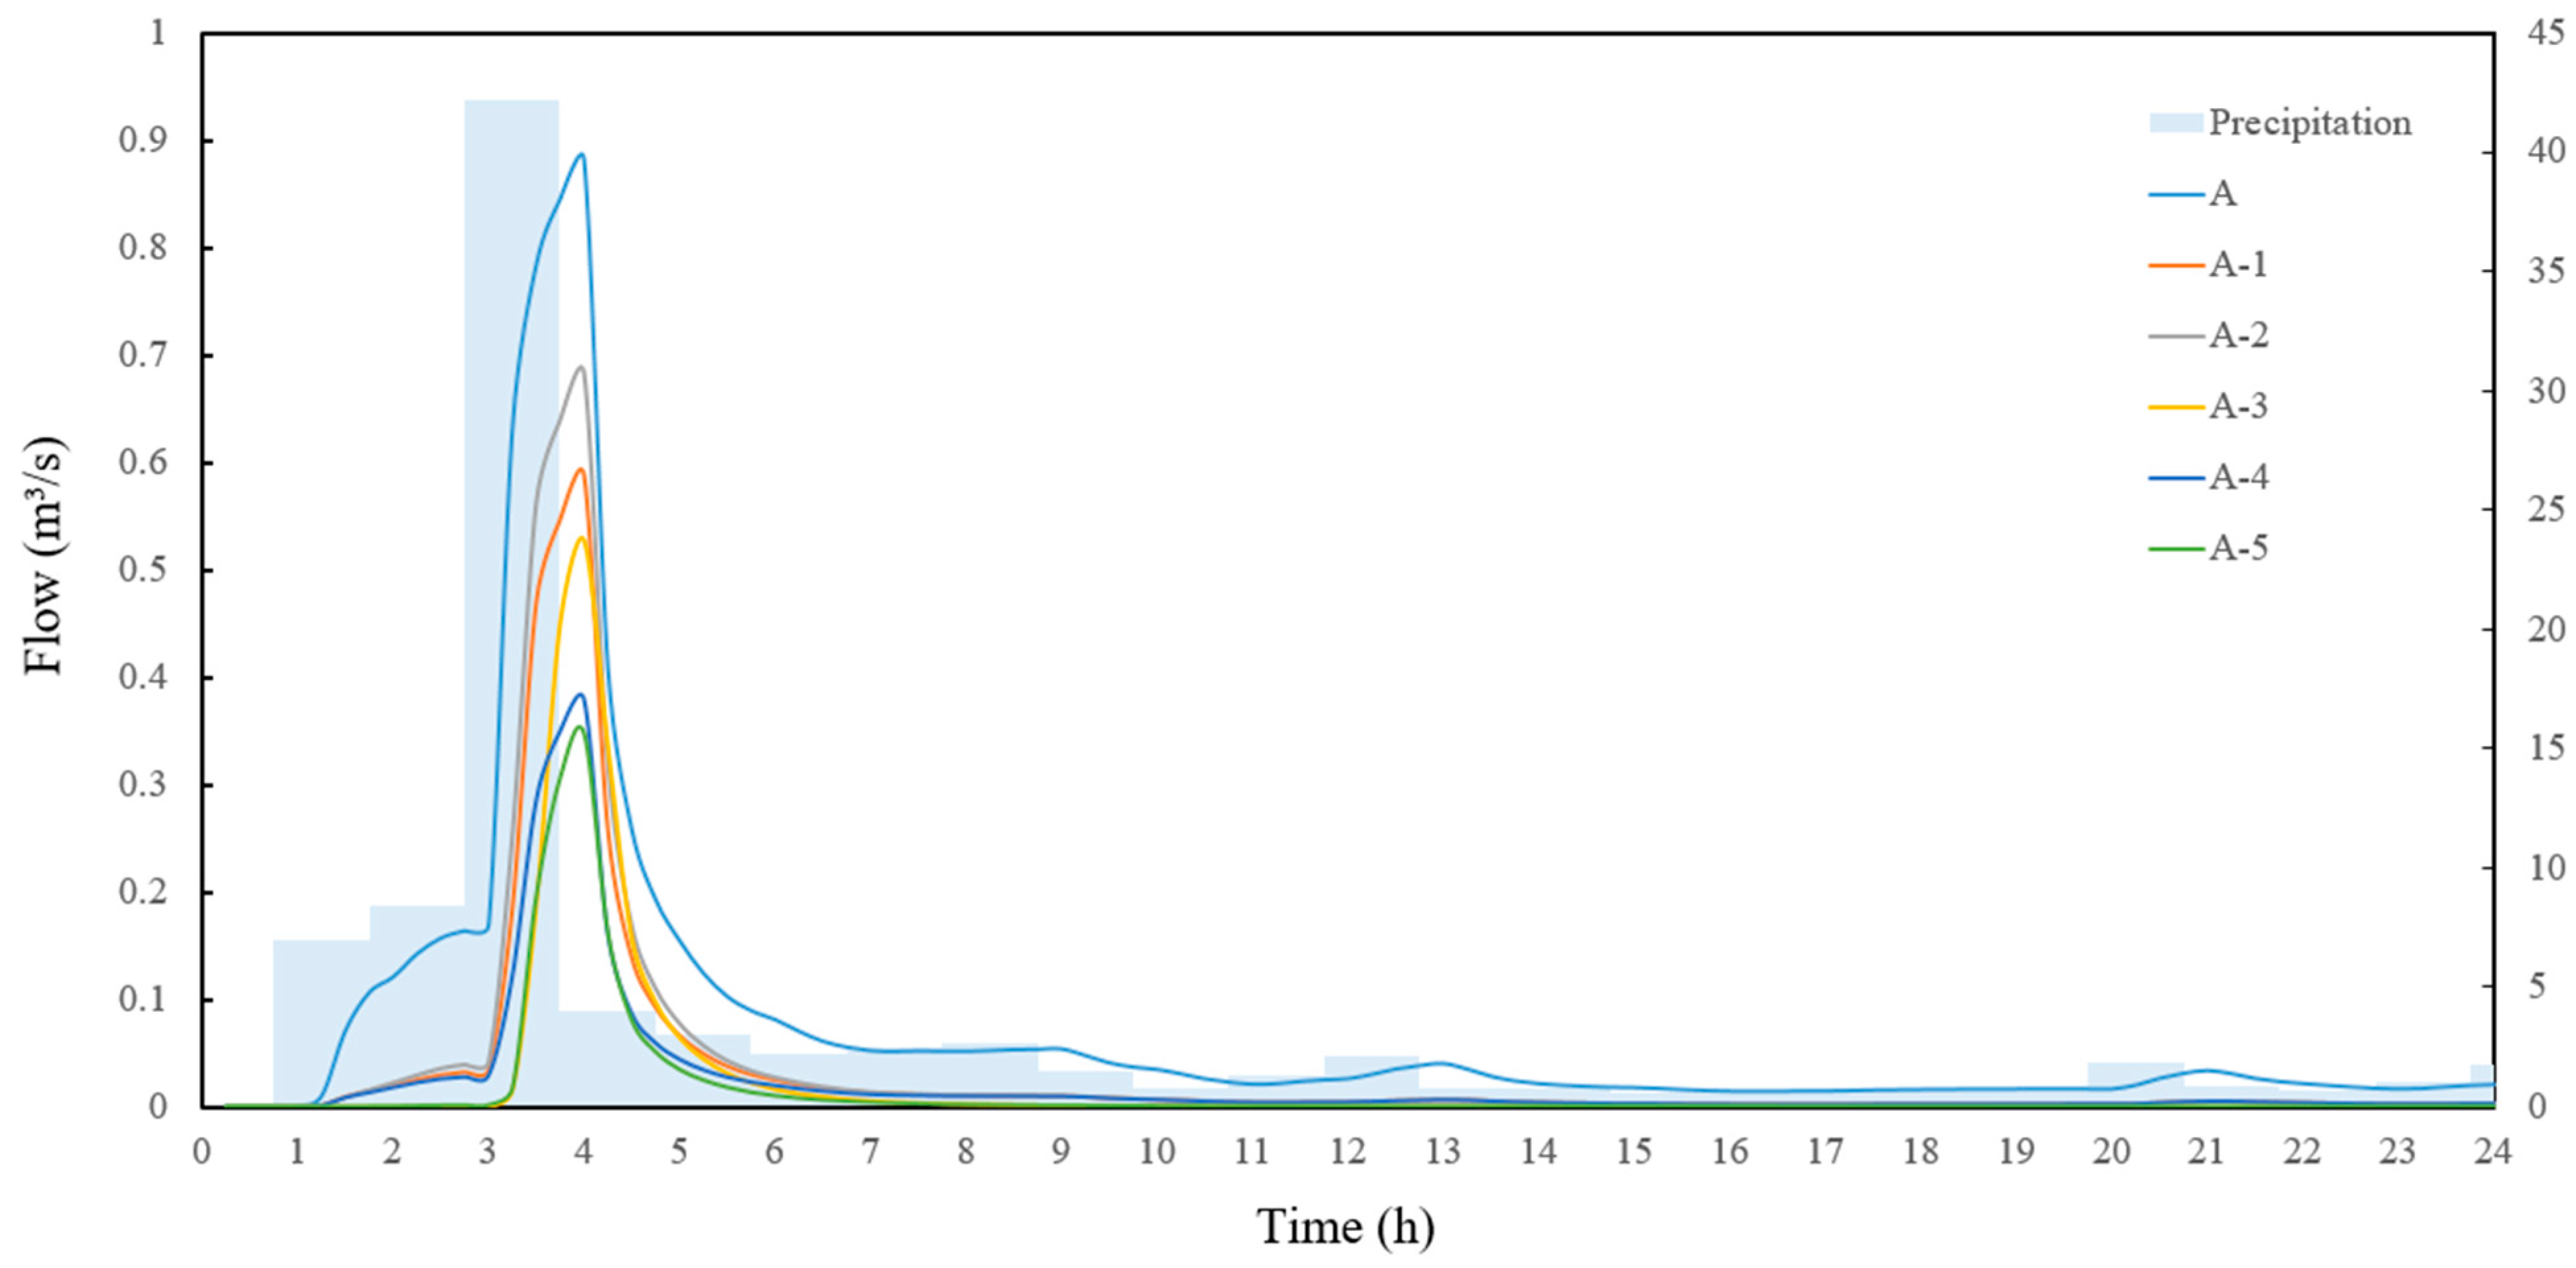
For the axial mode, comparing A-1 with the current situation (A), the reduction rates of peak flow and total runoff in the residential areas are 33.30% and 59.23%, respectively (Table 6; Figure 10). By comparing A-1, A-2, and A-3, it was found that A-3 has the best effect on reducing peak value, total runoff, and increasing infiltration capacity when the green space ratio remains unchanged. Compared with A-1, the peak control rate and total runoff control rate of A-3 were 40.12% and 73.79%, respectively (Table 6). These results are the same as those for the residential areas in block mode and enclosed mode. In comparison, the effect of rainwater and flood management in A-2 is slightly improved. A-4 and A-5 can reduce the peak and total runoff, and increase the infiltration capacity on the premise that the green space ratio increases by 10%. However, the effect of Model 5 on the above three indicators is better than that of Model 4. The runoff generation time and peak duration were reduced by Model 5 to 0.75 h and 0.25 h, respectively; the reductions were greater than those in Model 4 (Table 6).
In conclusion, increasing the green space ratio is the most effective method to achieve runoff control of residential areas in enclosed mode and axial mode. On the premise of increasing PLAND, the method of increasing green patch density (PD) has a better performance in terms of indexes, such as peak control rate, total control rate, runoff generation time delay, and peak duration delay. In addition, Model 3 and Model 4 in these two modes have their own advantages and can be selected as appropriate.
4. Discussion
4.1. Impact of the Spatial Layout of Green Space on the Rainfall-Runoff Process
By analyzing the correlations between the three typical residential green space layout modes, comprising block mode, enclosed mode, and axial mode, and their rainwater and flood management capacities, the following conclusions were drawn for the optimization of green space systems in residential areas under the goal of rain and flood management.
(1) According to the above information, no matter which layout mode is adopted in the residential area, as long as the green space system manages the rainwater and flooding in the residential area from the source (first guiding the rainwater into the flood detention area of the green space for infiltration, and then draining the excess runoff into the gray pipe network), it will have obvious rainwater and flood control effects conducive to the reduction in peak value and total runoff. However, since there are obvious differences among the green space distribution modes in the residential areas with the three layout modes, the rain and flood management performances of the green space systems are different. Specifically, under the same rainwater conditions, if the green space system in the residential area manages rainwater and flooding from the source, the reduction capacity of the block mode and enclosed mode to the peak flow and total runoff is significantly lower than that of the axial mode, and the axial mode can better delay the peak duration (by 0.5–1 h).
(2) For the three green space layout modes of residential areas, the method of increasing the green space is the best way to improve the rainwater and flood management capacity, and is conducive to the uniform distribution of green space in residential areas, thereby managing rainwater from the source. In addition, improving the green patch density is also advisable for these three modes.
(3) For residential areas in block mode, the methods of increasing patch density and the average area of green patches are good ways to improve the rainwater and flood management capacity. Specific strategies should be selected based on the main goal. Increasing patch density could be more suitable for the goal of runoff volume control and runoff generation time reduction, while increasing the mean patch size could be applied to achieve the reduction in peak flow. However, for residential areas in enclosed modes and axial modes, a better rainwater and flood management effect can be achieved by improving connectivity among green spaces on the premise that the green area is not increased.
(4) From the “peak duration rate” evaluation index, the rainwater and flood management of residential areas in the axial mode has the best effect. Specifically, compared with the residential green space in the other two modes, the improvement of the peak control rate in axial mode is better, the rainwater and flood management effect of the reconstructed green space (by taking the reconstruction measures in model 1–5) is better, and the optimization potential is higher.
4.2. Optimization Strategies
4.2.1. Stormwater Management System in URAs
Tianjin is a mature city that has numerous old URAs and faces more serious urban flooding problems; the potential for reconstruction is also limited. Optimization should be centered on utilizing existing green space or maximizing the benefits when we need to construct new green space in URAs. As shown in Figure 11, green space should be set in response to residential areas’ specific composition. Block mode features include green space size and network-like roads, and strategies should reinforce the connection between the center and border areas occupied by green space to accelerate runoff conveyance. For the enclosed mode, transparent major space and subordinate space are the main features, and the target of optimization is to form contacts in these spaces through green newly built space nodes and channel facilities. For the axial mode, the layout of central green space and green space beside buildings can be connected in series; all the rainwater on the roof enters the green space beside the house through the rain pipe for initial rainwater purification and stagnation. The overflow rainwater can be drained to the group green space or the central green space for further infiltration.
4.2.2. Reorganizing the Runoff Route and Redesigning the Green Space Layout
From the above analysis, the optimization of green space systems in residential areas to achieve the goal of rain and flood management should follow the paths and steps set out below.
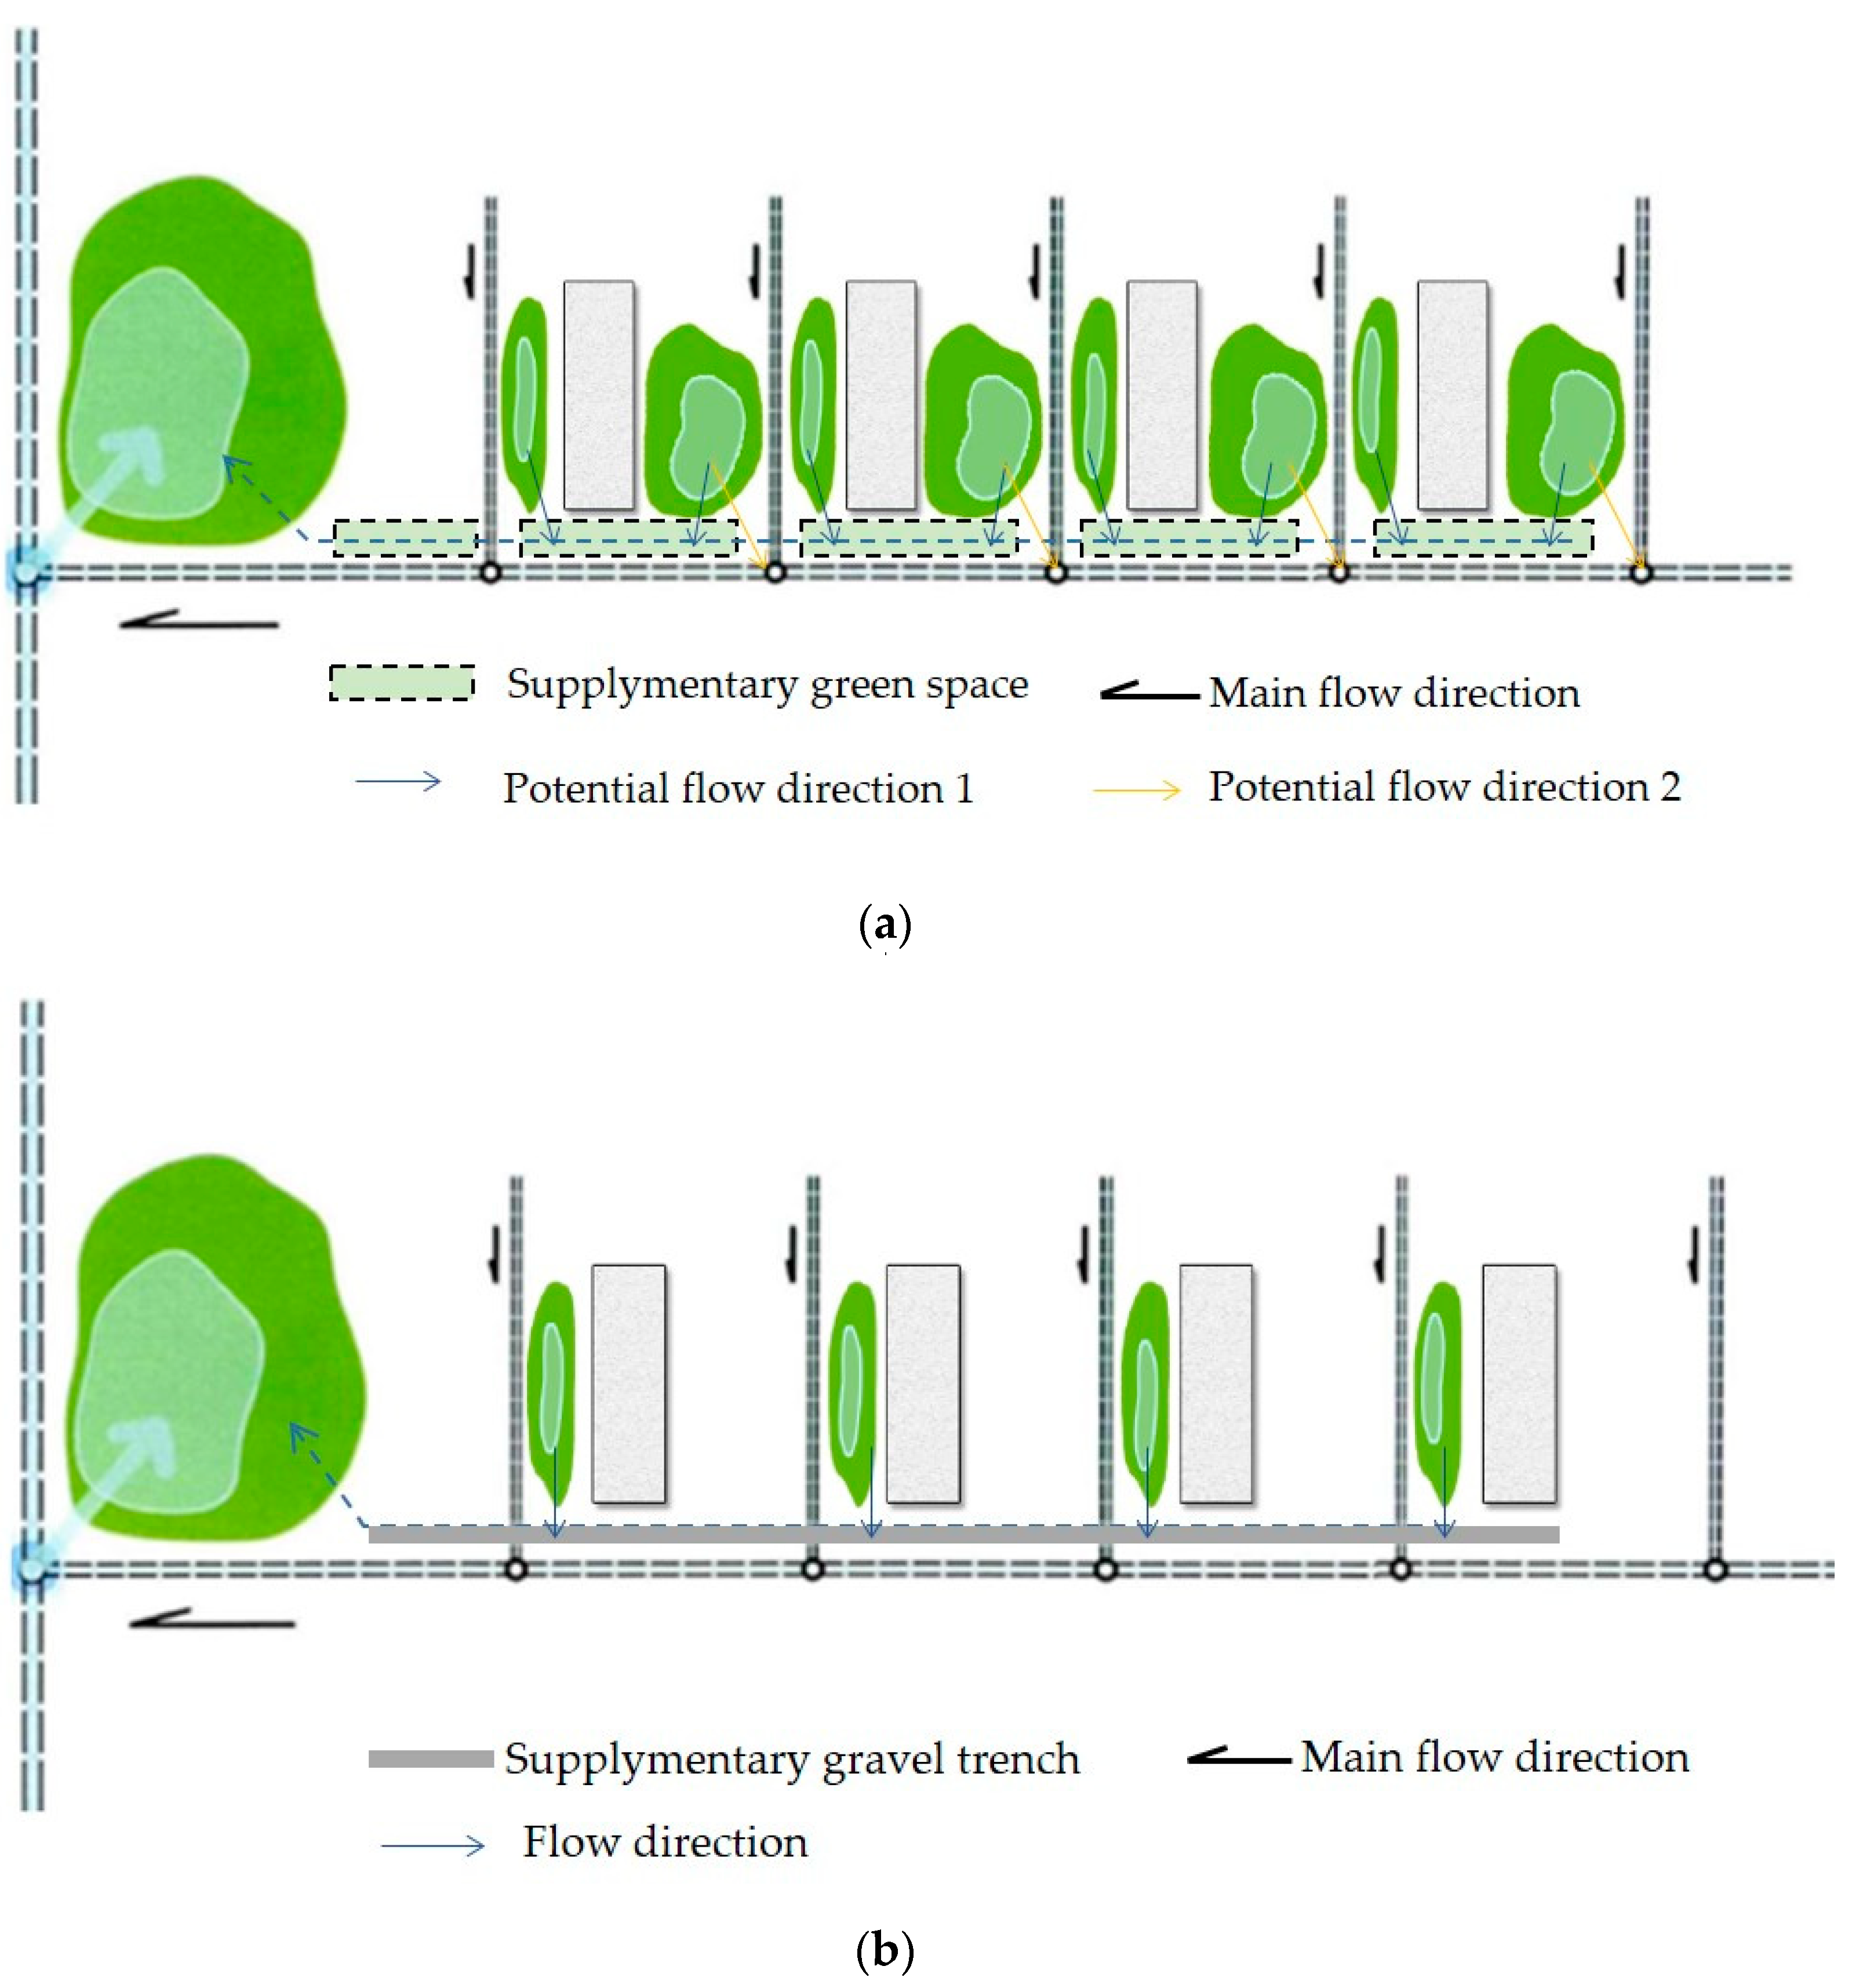
(1) Disconnect the runoff on the roof and land surface from the municipal pipe network based on the green space (Figure 11); (2) in residential areas where the area of green space can be increased, increase the area of green space and improve the green patch density, thereby managing the rainwater from the source (Figure 12a); (3) in residential areas where the green space area cannot be increased, improve connectivity among the existing green space to delay the storage and infiltration duration of green space (Figure 12b).
4.3. Uncertainty and Limitations
Five spatial layouts of residential areas were mentioned above, while only three main types were simulated. The other two types of URAs are less common, which is not representative enough. In addition, acquiring data regarding these kinds of residential areas is difficult. Furthermore, the simulation was limited by the rainfall situation setting. We chose a two-year period to derive the rainfall pattern (89 mm), which is typical and universal in Tianjin every summer. In this way, the results apply in respect of UGS layout and will be accurate when the real rainfall is lower than 89 mm.
5. Conclusions
To achieve the goal of managing stormwater in high-density residential areas, green space plays a significant role in the ecological treatment of runoff, and optimizing green space spatial layouts is a promising pathway under the limitations of buildable space, heavy rainfall events, and extensive impervious areas. Hence, practical strategies for UGS spatial organization are needed. This research focused on the effects of green space spatial characteristics on the hydrological process in residential areas. Through the investigation in Tianjin’s residential areas, 1591 residential areas were divided into three main spatial layout modes: block mode, enclosed mode, and axial mode. Based on three representative URAs, 15 “what if” scenarios were designed for quantitative assessment of the residential green space system, and we discussed how to optimize the layout of the green space systems in residential areas to improve the capacity of stormwater management.
The findings show that: (1) when it is possible to increase the ratio of green space, maintaining a high patch density (PD) is the best way to control rainwater; (2) when newly built green space is limited, increasing connectivity between green patches is the best way to control rainwater, especially in enclosed mode and axial mode; (3) comparing the efficiency of the promotion of the three modes, the axial mode presents the best performance when different green space optimization strategies are applied, which means that more improvements can be observed through indicators, such as the total runoff volume and peak flow, among others.
Although this study was limited by the rainfall situation setting, it still provides a feasible pathway for improving the efficiency of runoff control in URAs. Research will continue on extending the simulating ranges by changing various rainfall events. In addition, research will be carried out on the relationship between green space layout and runoff processes in other similar cities, and the results will provide urban residential areas with more economical, practical, and suitable layout strategies in respect of green space systems in terms of planning, design, and optimization aimed at stormwater management.
Author Contributions
Conceptualization, D.Y., L.C. and Y.H.; methodology, Y.H., Y.Z. and D.Y.; software, Y.Z.; validation, Y.H.; formal analysis, Y.H., Y.Z. and D.Y.; investigation, Y.H. and Y.Z.; resources, Y.Z.; data curation, Y.H.; writing—original draft preparation, Y.H.; writing—review and editing, D.Y. and L.C.; visualization, Y.H.; supervision, D.Y. and L.C.; project administration, D.Y. and L.C.; funding acquisition, D.Y. All authors have read and agreed to the published version of the manuscript.
Funding
This research was funded by the National Natural Science Foundation of China, grant number 51838003; Social Science Foundation of the Ministry of Education of China, grant number 18YJCZH215.
Institutional Review Board Statement
Not applicable.
Informed Consent Statement
Not applicable.
Data Availability Statement
Not applicable.
Acknowledgments
The authors are grateful to the editor and reviewers for their valuable comments and suggestions.
Conflicts of Interest
The authors declare no conflict of interest.
References
- Qin, H.-P.; Li, Z.-X.; Fu, G. The effects of low impact development on urban flooding under different rainfall characteristics. J. Environ. Manag. 2013, 129, 577–585. [Google Scholar] [CrossRef]
- Miller, J.D.; Hutchins, M. The impacts of urbanisation and climate change on urban flooding and urban water quality: A review of the evidence concerning the United Kingdom. J. Hydrol. Reg. Stud. 2017, 12, 345–362. [Google Scholar] [CrossRef]
- Xu, C.; Rahman, M.; Haase, D.; Wu, Y.; Su, M.; Pauleit, S. Surface runoff in urban areas: The role of residential cover and urban growth form. J. Clean. Prod. 2020, 262, 121421. [Google Scholar] [CrossRef]
- Bonebrake, T.C.; Mastrandrea, M.D. Tolerance adaptation and precipitation changes complicate latitudinal patterns of climate change impacts. Proc. Natl. Acad. Sci. USA 2010, 107, 12581–12586. [Google Scholar] [CrossRef]
- Hood, M.J.; Clausen, J.C.; Warner, G.S. Comparison of Stormwater lag times for low impact and traditional residential development 1. JAWRA J. Am. Water Resour. Assoc. 2007, 43, 1036–1046. [Google Scholar] [CrossRef]
- He, J.; Valeo, C.; Chu, A.; Neumann, N.F. Characteristics of suspended solids, microorganisms, and chemical water quality in event-based stormwater runoff from an urban residential area. Water Environ. Res. 2010, 82, 2333–2345. [Google Scholar] [CrossRef] [PubMed]
- Fletcher, T.D.; Shuster, W.; Hunt, W.F.; Ashley, R.; Butler, D.; Arthur, S.; Trowsdale, S.; Barraud, S.; Semadeni-Davies, A.; Bertrand-Krajewski, J.-L.; et al. SUDS, LID, BMPs, WSUD and more–The evolution and application of terminology surrounding urban drainage. Urb. Water J. 2014, 12, 525–542. [Google Scholar] [CrossRef]
- General Office of the State Council (GOSC). Guideline to Promote Building Sponge Cities. Available online: http://www.gov.cn/zhengce/content/2015-10/16/content_10228.htm (accessed on 16 October 2015).
- Li, H.; Ding, L.; Ren, M.; Li, C.; Wang, H. Sponge City Construction in China: A Survey of the Challenges and Opportunities. Water 2017, 9, 594. [Google Scholar] [CrossRef]
- Sadeghi, K.M.; Kharaghani, S.; Tam, W.; Gaerlan, N.; Loáiciga, H. Avalon green alley network: Low impact development (LID) demonstration project in Los Angeles, California. In Proceedings of the World Environmental and Water Resources Congress, West Palm Beach, FL, USA, 22–26 May 2016. [Google Scholar]
- Wang, M.; Zhang, D.; Wang, Z.; Zhou, S.; Tan, S.K. Long-term performance of bioretention systems in storm runoff management under climate change and life-cycle condition. Sustain. Cities Soc. 2021, 65, 102598. [Google Scholar] [CrossRef]
- Jingming, H.; Donglai, L.; Xiaojun, W.; Kaihua, G.; Yu, T.; Yue, M. Effects of initial conditions of LID measures on runoff control at residential community scale. Adv. Water Sci. 2019, 30, 45–55. [Google Scholar]
- Shan, J.; Huang, Z.; Chen, S.; Li, Y.; Ji, W.; Lv, Z. Green Space Planning and Landscape Sustainable Design in Smart Cities considering Public Green Space Demands of Different Formats. Complexity 2021, 2021, 5086636. [Google Scholar] [CrossRef]
- Zhang, B.; Li, N.; Wang, S. Effect of urban green space changes on the role of rainwater runoff reduction in Beijing, China. Landsc. Urb. Plan. 2015, 140, 8–16. [Google Scholar] [CrossRef]
- Eaton, T.T. Approach and case-study of green infrastructure screening analysis for urban stormwater control. J. Environ. Manag. 2018, 209, 495–504. [Google Scholar] [CrossRef] [PubMed]
- Astebol, S.O.; Hvitved-Jacobsen, T.; Simonsen, O. Sustainable stormwater management at Fornebu--from an airport to an industrial and residential area of the city of Oslo, Norway. Sci. Total Environ. 2004, 334–335, 239–249. [Google Scholar] [CrossRef]
- Wang, M.; Zhang, Y.; Zhang, D.; Li, S.; Tan, S.K. Life-cycle cost analysis and resilience consideration for coupled grey infrastructure and low-impact development practices. Sustain. Cities Soc. 2021, 75, 103358. [Google Scholar] [CrossRef]
- Wang, M.; Zhang, Y.; Bakhshipour, A.E.; Liu, M.; Rao, Q.; Lu, Z. Designing coupled LID–GREI urban drainage systems: Resilience assessment and decision-making framework. Sci. Total Environ. 2022, 834, 155267. [Google Scholar] [CrossRef]
- Yao, Y.; Li, J.; Li, N.; Jiang, C. Optimizing the layout of coupled grey-green stormwater infrastructure with multi-objective oriented decision making. J. Clean. Prod. 2022, 367, 133061. [Google Scholar] [CrossRef]
- Seo, M.; Jaber, F.; Srinivasan, R.; Jeong, J. Evaluating the Impact of Low Impact Development (LID) Practices on Water Quantity and Quality under Different Development Designs Using SWAT. Water 2017, 9, 193. [Google Scholar] [CrossRef]
- Berland, A.; Shiflett, S.A.; Shuster, W.D.; Garmestani, A.S.; Goddard, H.C.; Herrmann, D.L.; Hopton, M.E. The role of trees in urban stormwater management. Landsc. Urb. Plan. 2017, 162, 167–177. [Google Scholar] [CrossRef]
- Hoover, F.-A.; Hopton, M.E. Developing a framework for stormwater management: Leveraging ancillary benefits from urban greenspace. Urb. Ecosyst. 2019, 22, 1139–1148. [Google Scholar] [CrossRef]
- Burian, S.J.; Nix, S.J.; Durrans, S.R.; Pitt, R.E.; Fan, C.-Y.; Field, R. Historical development of wet-weather flow management. J. Water Resour. Plan. Manag. 1999, 125, 3–13. [Google Scholar] [CrossRef]
- Alberti, M.; Marzluff, J.M. Ecological resilience in urban ecosystems: Linking urban patterns to human and ecological functions. Urb. Ecosyst. 2004, 7, 241–265. [Google Scholar] [CrossRef]
- Alberti, M.; Booth, D.; Hill, K.; Coburn, B.; Avolio, C.; Coe, S.; Spirandelli, D. The impact of urban patterns on aquatic ecosystems: An empirical analysis in Puget lowland sub-basins. Landsc. Urb. Plan. 2007, 80, 345–361. [Google Scholar] [CrossRef]
- Yan, J.; Zhou, W.; Zheng, Z.; Wang, J.; Tian, Y. Characterizing variations of greenspace landscapes in relation to neighborhood characteristics in urban residential area of Beijing, China. Landsc. Ecol. 2020, 35, 203–222. [Google Scholar] [CrossRef]
- Wang, Y.; Peng, Z.; Chen, Q. The choice of residential layout in urban China: A comparison of transportation and land use in Changsha (China) and Leeds (UK). Habitat Int. 2018, 75, 50–58. [Google Scholar] [CrossRef]
- Zhou, D.; Li, Z.; Wang, S.; Tian, Y.; Zhang, Y.; Jiang, G. How does the newly urban residential built-up density differ across Chinese cities under rapid urban expansion? Evidence from residential FAR and statistical data from 2007 to 2016. Land Use Policy 2021, 104, 105365. [Google Scholar] [CrossRef]
- Xia, J.; Zhang, Y.; Xiong, L.; He, S.; Wang, L.; Yu, Z. Opportunities and challenges of the Sponge City construction related to urban water issues in China. Sci. China Earth Sci. 2017, 60, 652–658. [Google Scholar] [CrossRef]
- Liao, Z.; Zhang, G.; Wu, Z.; He, Y.; Chen, H. Combined sewer overflow control with LID based on SWMM: An example in Shanghai, China. Water Sci. Technol. 2015, 71, 1136–1142. [Google Scholar] [CrossRef]
- Yang, B.; Lee, D. Urban Green Space Arrangement for an Optimal Landscape Planning Strategy for Runoff Reduction. Land 2021, 10, 897. [Google Scholar] [CrossRef]
- Gao, J.; Li, J.; Li, Y.; Xia, J.; Lv, P. A distribution optimization method of typical LID facilities for sponge city construction. Ecohydrol. Hydrobiol. 2021, 21, 13–22. [Google Scholar] [CrossRef]
- Liu, W.; Chen, W.; Peng, C. Assessing the effectiveness of green infrastructures on urban flooding reduction: A community scale study. Ecol. Model. 2014, 291, 6–14. [Google Scholar] [CrossRef]
- Maragno, D.; Gaglio, M.; Robbi, M.; Appiotti, F.; Fano, E.A.; Gissi, E. Fine-scale analysis of urban flooding reduction from green infrastructure: An ecosystem services approach for the management of water flows. Ecol. Model. 2018, 386, 1–10. [Google Scholar] [CrossRef]
- Jiajin, Z. Residential Area Planning and Design, 2nd ed.; China Architecture & Building Press: Beijing, China, 2009; pp. 56–57. [Google Scholar]
- Tianjin Municipal Commission of Urban and Rural Development. Technical Guideline for the Construction of Tianjin Sponge City; Tianjin Housing and Urban-Rural Construction Commission: Tianjin, China, 2016; pp. 5–10. [Google Scholar]
- Kong, F.; Nakagoshi, N. Spatial-temporal gradient analysis of urban green spaces in Jinan, China. Landsc. Urb. Plan. 2006, 78, 147–164. [Google Scholar] [CrossRef]
- Li, H.; Chen, W.; He, W. Planning of green space ecological network in urban areas: An example of Nanchang, China. Int. J. Environ. Res. Public Health 2015, 12, 12889–12904. [Google Scholar] [CrossRef]
- Kang, J.-E.; Choi, H.-S.; Hwang, H.-S.; Lee, S. Analysis of ecological network according to invalidation of decision on urban parks: Focused on Busan. J. Environ. Impact Assess. 2018, 27, 618–634. [Google Scholar]
- Liang, H.; Chen, D.; Zhang, Q. Assessing Urban Green Space distribution in a compact megacity by landscape metrics. J. Eng. Landsc. Manag. 2017, 25, 64–74. [Google Scholar] [CrossRef]
- McGarigal, K. FRAGSTATS: Spatial Pattern Analysis Program. for Quantifying Landscape Structure; US Department of Agriculture, Forest Service, Pacific Northwest Research Station: Portland, OR, USA, 1995; Volume 351.
- Rossman, L.A.; Dickinson, R.E.; Schade, T.; Chan, C.C.; Burgess, E.; Sullivan, D.; Lai, F.-H. SWMM 5-the next generation of EPA’s storm water management model. J. Water Manag. Model. 2004, 22, 339–358. [Google Scholar] [CrossRef]
Figure 1.
Distribution of Tianjin’s URAs according to building ages.

Figure 2.
Representative URA layout patterns in Tianjin City.

Figure 3.
Main layout mode and rainwater collection mode of Tianjin residential area: (a) Block mode; (b) enclosed mode; (c) axial mode; (d) rainwater collection mode in URAs of block mode; (e) rainwater collection mode in URAs of enclosed mode; (f) rainwater collection mode in URAs of axial mode.
Figure 3.
Main layout mode and rainwater collection mode of Tianjin residential area: (a) Block mode; (b) enclosed mode; (c) axial mode; (d) rainwater collection mode in URAs of block mode; (e) rainwater collection mode in URAs of enclosed mode; (f) rainwater collection mode in URAs of axial mode.

Figure 4.
24 h rainfall event pattern in Tianjin.

Figure 5.
Workflow for this study.

Figure 6.
UGS layout design of 15 “what-if” scenarios in block mode, enclosed mode, and axial mode in URAs.
Figure 6.
UGS layout design of 15 “what-if” scenarios in block mode, enclosed mode, and axial mode in URAs.

Figure 7.
Performance of hydrological process in residential areas with different modes in “runoff peak time” situation.
Figure 7.
Performance of hydrological process in residential areas with different modes in “runoff peak time” situation.

Figure 8.
Runoff process in block mode residential areas under rainfall with a return period of 2 years.
Figure 8.
Runoff process in block mode residential areas under rainfall with a return period of 2 years.

Figure 9.
Runoff process in enclosed mode residential areas under rainfall with a return period of 2 years.
Figure 9.
Runoff process in enclosed mode residential areas under rainfall with a return period of 2 years.

Figure 10.
Runoff process in axial mode residential areas under rainfall with a return period of 2 years.
Figure 10.
Runoff process in axial mode residential areas under rainfall with a return period of 2 years.

Figure 11.
Optimization strategies for green space placement for block mode, enclosed mode, and axial mode.
Figure 11.
Optimization strategies for green space placement for block mode, enclosed mode, and axial mode.

Figure 12.
Optimization strategies for different preconditions of residential areas: (a) schematic diagram of the strategy focusing on guiding runoff and centralized regulation and storage; (b) schematic diagram of the strategy based on dispersion infiltration and source treatment.
Figure 12.
Optimization strategies for different preconditions of residential areas: (a) schematic diagram of the strategy focusing on guiding runoff and centralized regulation and storage; (b) schematic diagram of the strategy based on dispersion infiltration and source treatment.


Table 1.
Distribution characteristics for 16 Tianjin URAs.
| Number | Ratio of Green Space (PLAND) | (PSSD) | Connectivity (γ) | MPS (m2) | Patch Density (PD) |
|---|---|---|---|---|---|
| ① | 13.50% | 0.09 | 0.17 | 870 | 189.15 |
| ② | 14.90% | 0.09 | 0.20 | 1177 | 182.58 |
| ③ * | 17.98% | 0.03 | 0.10 | 393 | 466.08 |
| ④ | 24.44% | 0.08 | 0.36 | 924 | 264.40 |
| ⑤ | 17.63% | 0.05 | 0.13 | 362 | 386.64 |
| ⑥ | 29.51% | 0.02 | 0.50 | 242 | 1157.72 |
| ⑦ | 31.40% | 0.08 | 0.39 | 874 | 342.78 |
| ⑧ | 39.60% | 0.16 | 0.33 | 1768 | 377.68 |
| ⑨ | 28.55% | 0.10 | 0.38 | 875 | 362.35 |
| ⑩ * | 35.57% | 0.02 | 0.36 | 202 | 1485.97 |
| ⑪ | 38.31% | 0.12 | 0.36 | 1106 | 322.99 |
| ⑫ | 31.86% | 0.05 | 0.28 | 578 | 549.05 |
| ⑬ | 29.70% | 0.14 | 0.39 | 790 | 413.45 |
| ⑭ * | 31.77% | 0.13 | 0.30 | 881 | 446.31 |
| ⑮ | 38% | 0.26 | 0.56 | 1184 | 236.84 |
| ⑯ * | 39.10% | 0.19 | 0.52 | 1305 | 403.86 |
URAs tagged * were selected as specific research objects to represent three layout modes for following simulation.
Table 2.
Typical values of green space pattern indexes.
| Index | Typical Value |
|---|---|
| PLAND | 30% |
| PSSD | 0.01–0.1; 0.1–0.2; 0.01–0.2 |
| Connectivity | 3.5–7 m |
| MPS | 800–1200 m2 |
| PD | 300–500 patches/km2 |
Table 3.
Distribution characteristics for 3 basic modes and 15 “what-if” scenarios.
| Mode | Scenario Code | Ratio of Green Space (PLAND) % | Standard Deviation of Green Space Patch Size (PSSD) m2 | Dispersion of Green Space (γ) 0–1 | Mean Patch Size (MPS) m2 | Density of Green Space (PD) Number/km2 |
|---|---|---|---|---|---|---|
| Block Mode | B | 25.00% | 0.0772 | 0.4 | 930 | 264.4 |
| B-1 | 25.00% | 0.0772 | 0.4 | 930 | 264.4 | |
| B-2 | 25.00% | 0.1800 | 0.4 | 930 | 264.4 | |
| B-3 | 25.00% | 0.0772 | 0.8 | 930 | 264.4 | |
| B-4 | 35.00% | 0.0772 | 0.4 | 1331 | 264.4 | |
| B-5 | 35.00% | 0.0772 | 0.4 | 930 | 377.7 | |
| Enclosed Mode | E | 32.00% | 0.0485 | 0.28 | 1126 | 284.5 |
| E-1 | 32.00% | 0.0485 | 0.28 | 1126 | 284.5 | |
| E-2 | 32.00% | 0.1637 | 0.28 | 1126 | 284.5 | |
| E-3 | 32.00% | 0.0485 | 0.66 | 1126 | 284.5 | |
| E-4 | 42.00% | 0.0485 | 0.28 | 1406 | 284.5 | |
| E-5 | 42.00% | 0.0485 | 0.28 | 1126 | 385.0 | |
| Axial Mode | A | 32.00% | 0.1257 | 0.29 | 869 | 354.4 |
| A-1 | 32.00% | 0.1257 | 0.29 | 869 | 354.4 | |
| A-2 | 32.00% | 0.2000 | 0.29 | 869 | 354.4 | |
| A-3 | 32.00% | 0.1257 | 0.75 | 869 | 354.4 | |
| A-4 | 42.00% | 0.1257 | 0.29 | 1141 | 354.4 | |
| A-5 | 42.00% | 0.1257 | 0.29 | 869 | 484.0 |
Table 4.
Degree of performance improvement for 5 “what-if” scenarios in block mode compared to the current situation.
Table 4.
Degree of performance improvement for 5 “what-if” scenarios in block mode compared to the current situation.
| Indicators | B | B-1 | B-2 | B-3 | B-4 | B-5 |
|---|---|---|---|---|---|---|
| Runoff generation time (h) | 1.25 | 1.25 | 1.25 | 1.5 | 1.25 | 3 |
| Peak flow (CMS) | 0.4066 | 0.3016 | 0.3151 | 0.2929 | 0.2076 | 0.2249 |
| Time of peak flow (h) | 3.5 | 3.5 | 3.5 | 4 | 3.75 | 3.75 |
| Runoff volume (m3) | 3090 | 1560 | 1402 | 850 | 798 | 697 |
| Peak control rate | - | 25.82% | 22.50% | 32.66% | 48.94% | 44.69% |
| Total runoff control rate | - | 49.51% | 54.63% | 72.49% | 74.17% | 77.44% |
| Runoff generation time delay | - | 0 | 0 | 0.25 | 0 | 1.75 |
| Peak duration delay | - | 0 | 0 | 0.5 | 0.25 | 0.25 |
| Infiltration rate | 95.82 | 214.82 | 227.18 | 269.69 | 207.83 | 203.44 |
Table 5.
Degree of performance improvement for 5 “what-if” scenarios in enclosed mode compared to the current situation.
Table 5.
Degree of performance improvement for 5 “what-if” scenarios in enclosed mode compared to the current situation.
| Indicators | E | E-1 | E-2 | E-3 | E-4 | E-5 |
|---|---|---|---|---|---|---|
| Runoff generation time (h) | 1.25 | 1.25 | 1.25 | 3.25 | 1.25 | 2 |
| Peak flow (CMS) | 0.3996 | 0.314 | 0.3319 | 0.282 | 0.2453 | 0.235 |
| Time of peak flow (h) | 3 | 3 | 3 | 3.25 | 3 | 3.25 |
| Runoff volume (m3) | 2770 | 1260 | 1320 | 839 | 1030 | 723 |
| Peak control rate | - | 21.42% | 16.94% | 29.43% | 38.61% | 41.19% |
| Total runoff control rate | - | 54.51% | 52.35% | 69.71% | 62.82% | 73.90% |
| Runoff generation time delay | - | 0 | 0 | 2 | 0 | 0.75 |
| Peak duration delay | - | 0 | 0 | 0 | 0 | 0.25 |
| Infiltration rate | 131.6 | 211 | 205 | 234 | 179 | 191.62 |
Table 6.
Degree of performance improvement for 5 “what-if” scenarios in axial mode compared to the current situation.
Table 6.
Degree of performance improvement for 5 “what-if” scenarios in axial mode compared to the current situation.
| Indicators | B | B-1 | B-2 | B-3 | B-4 | B-5 |
|---|---|---|---|---|---|---|
| Runoff generation time (h) | 1.25 | 1.25 | 1.25 | 1.5 | 1.25 | 3 |
| Peak flow (CMS) | 0.4066 | 0.3016 | 0.3151 | 0.2929 | 0.2076 | 0.2249 |
| Time of peak flow (h) | 3.5 | 3.5 | 3.5 | 4 | 3.75 | 3.75 |
| Runoff volume (m3) | 3090 | 1560 | 1402 | 850 | 798 | 697 |
| Peak control rate | - | 33.30% | 22.59% | 40.12% | 57.00% | 60.61% |
| Total runoff control rate | - | 59.23% | 52.32% | 73.79% | 71.34% | 82.95% |
| Runoff generation time delay | - | 0 | 0 | 2.0 | 0 | 1.75 |
| Peak duration delay | - | 0 | 0 | 0 | 0 | 0 |
| Infiltration rate | 120.78 | 214.88 | 204 | 238.57 | 177.69 | 191.65 |
Publisher’s Note: MDPI stays neutral with regard to jurisdictional claims in published maps and institutional affiliations. |
© 2022 by the authors. Licensee MDPI, Basel, Switzerland. This article is an open access article distributed under the terms and conditions of the Creative Commons Attribution (CC BY) license (https://creativecommons.org/licenses/by/4.0/).
Share and Cite
MDPI and ACS Style
Han, Y.; Yang, D.; Zhang, Y.; Cao, L. Optimizing Urban Green Space Layouts for Stormwater Runoff Treatment in Residential Areas: A Case Study in Tianjin, China. Water 2022, 14, 2719. https://doi.org/10.3390/w14172719
AMA Style
Han Y, Yang D, Zhang Y, Cao L. Optimizing Urban Green Space Layouts for Stormwater Runoff Treatment in Residential Areas: A Case Study in Tianjin, China. Water. 2022; 14(17):2719. https://doi.org/10.3390/w14172719
Chicago/Turabian StyleHan, Yiqun, Dongdong Yang, Yueming Zhang, and Lei Cao. 2022. "Optimizing Urban Green Space Layouts for Stormwater Runoff Treatment in Residential Areas: A Case Study in Tianjin, China" Water 14, no. 17: 2719. https://doi.org/10.3390/w14172719
Note that from the first issue of 2016, this journal uses article numbers instead of page numbers. See further details here.