
(Un)Affordability of Informal Water Systems: Disparities in a Comparative Case Study in Beirut, Lebanon

1
Geography Graduate Group, University of California, Davis, CA 95616, USA
2
Department of Civil & Environmental Engineering, University of California, Davis, CA 95616, USA
3
Department of Human Ecology, University of California, Davis, CA 95616, USA
4
Department of Food Science & Technology, University of California, Davis, CA 95616, USA
*
Author to whom correspondence should be addressed.
Water 2022, 14(17), 2713; https://doi.org/10.3390/w14172713
Submission received: 7 July 2022
/
Revised: 17 August 2022
/
Accepted: 22 August 2022
/
Published: 31 August 2022
(This article belongs to the Special Issue Water Resilience: Water Justice)
Abstract
:Achieving affordable and equitable access to water for all remains a challenge worldwide. In areas suffering from chronic water shortages, communities pay high costs for alternative informal water sources (such as tanker trucks, bottled water, and wells) to meet their daily water needs. This study examines water costs of informal sources and overall affordability disparities for two communities of different socioeconomic status in Beirut, Lebanon. Water is often unaffordable for both of these communities. Overall, 6% of household income is spent on purchasing water (compared to an average global percentages of 3% to 5%). There are also significant disparities between the communities: lower income residents pay 2.2 times more of their income to secure water, and more than half of these residents (55% of households) spend more than 5% of their income on water. To overcome water shortages, these residents turn to informal water sources, but at significant additional cost. These costs and impacts on lower income residents are high and inequitable. We propose strategies to address cost, quality and quantity issues for informal sources.
1. Introduction
The affordability of water supply systems has been an issue for communities and water managers for centuries. Different affordability frameworks have evolved to assess water quality, availability, and overall equity of water systems using components of volume, cost, household expenditure, and household income. Most affordability frameworks neglect the additional costs of informal water sources and how communities with varying socio-economic resources cope with these additional costs. This section highlights emerging notions of water affordability and identifies some major gaps in existing frameworks that neglect alternative informal sources.
Affordability frameworks generally look at the cost of accessing water sources relative to households’ economic resources or total expenditures [1,2,3] (p. 19). These ratios are then compared to a threshold to estimate the relative affordability of water in relation to income or wealth [4].
An early and well-documented use of the term “water affordability”, is found in the 2002 United Nations’ General Comment No. 15 on the right to water [5]. While this document helped to catalyze discussion on this topic, it ultimately lacked a clear method to calculate water affordability. Ten years later, the United Nations’ Sustainable Development Goal (SDG) #6 established the Joint Monitoring Programme (JMP) to measure access and coverage of rates of “improved” drinking water (i.e., households with physical connection to a water system [6,7]) without considering the quality, availability, and affordability of water supply [6,8,9]. Various affordability frameworks have emerged to include components of water volume, cost, income, and thresholds. Each of these components is introduced below.
To measure water consumption in households, studies have looked at average household water consumption [2,10,11], basic household water needs [12,13,14], or general household water activity needs [15,16]. Average water consumption might include higher water consumption for amenities (such as irrigation and swimming pools) or under-consumption by “water-poor” households [11,13,14,17] (p. 13). There is no consensus on basic need volumes, which can range from 15 to 100 L per person per day [17] (p. 13), [18,19,20].
To measure water costs, affordability frameworks typically consider water bills from formal sources only [2,12,14,21]. However, communities that suffer from unsafe, unreliable, and/or polluted water [6,16] must rely on alternative sources. As such, many frameworks have attempted to account for the cost of multiple alternative water sources and the coping behavior of residents (e.g., the social and labor costs associated with collecting, treating, and storing water). While some studies have considered the financial costs of a range of alternative water sources [16,17], others have focused on bottled water specifically [22,23,24]. In terms of coping behavior, several studies have looked at the time needed for women and other household members to acquire water [15,25,26,27].
From the scholars that have looked at alternative water sources, some have specifically looked at the socio-economic implications of informal water sources. Informality can refer to economic activities that fall outside the direct functioning of the state [28]. However, more recent definitions highlight how informal systems are complex and often intertwine with formal systems and can have ever-shifting characteristics [29,30,31,32,33,34,35]. Typical water affordability studies that consider alternative informal water sources tend to focus on people’s access to bottled potable water only [22,23,24]. Some studies show the psychological and physical impact of water shortages on lower income areas by focusing on psychological indicators (e.g., worries of water security), physical health, nutrition, livelihoods, household economy and agriculture [34,35,36,37]. Few studies analyze simultaneous affordability disparities of informal water sources across different income groups.
Affordability frameworks can be divided into income-based measures and expenditure-based measures. The former methods compare water expenditures relative to household income and the latter methods compare water expenditures to total household expenditure [1,2]. While household income data is generally easier to collect, it may obscure the real impact of water expenditures by overestimating or underestimating income availability [2,3,11,13,38]. Within income-based methods, income has been measured in different ways. Studies have compared income groups by looking at differences in water expenditure [15,16,25], median incomes [22], or average incomes [24]. Some studies consider the median income of different racial and ethnic groups [2]. Other studies focus solely on lower income communities [23,39]. Finally, additional research has specifically investigated disposable income available for water [1], [17] (p. 13), [20].
Once affordability ratios between water costs and household income (or expenditure) are computed (which might include monetizing household time costs for water acquisition and use), their results are compared to a threshold that classifies whether the household is considered to have affordable water or not. There is not yet a consensus on affordability thresholds, which range from 1.4% to 10%, usually between 3% and 5% [4,40].
The affordability frameworks reviewed above can be divided in two categories: those that evaluate the cost and affordability of accessing multiple water sources and activities, and others that capture water affordability of different income groups by focusing on lower-income communities. In this article, we focus on alternative informal water sources that residents rely on in response to water shortages and inadequacies in the formal (piped) water supply. Informal water sources include bottles, tanker trucks, and wells.
This study seeks to answer the following research question: how does accessing multiple (formal and informal) water sources affect water affordability for communities of differing socioeconomic status? To answer the research question and fill gaps in the literature, the study combines both frameworks mentioned above. We assess the water affordability of Lebanese households by comparing costs of formal and informal water sources with median income levels for two communities (high and low-income). We also develop a detailed per household income analysis. Our focus on affordability disparities of informal water sources for different income groups allows us to address knowledge gaps in the field of informality.
The study accounts for water demand volumes, including temporal and seasonal variations. It calculates the financial cost as well as the coping costs for each water source by identifying total water use, temporal delivery of sources (i.e., frequency of delivery), and water cost by source. The combination of these data shows the total cost of water services for households in two Lebanese communities of different socio-economic levels. To measure levels of water affordability for both communities, the cost-to-income ratios are compared to income-based affordability thresholds of 3%, 5% and 10%. The results highlight informal water cost implications, affordability ratios of both income groups, and overall affordability disparities. This approach shows refined affordability levels of the total sample population and affordability disparities among different income groups and helps support water policy recommendations on water reliability, affordability and quality.
2. Materials and Methods
2.1. Case Study Area
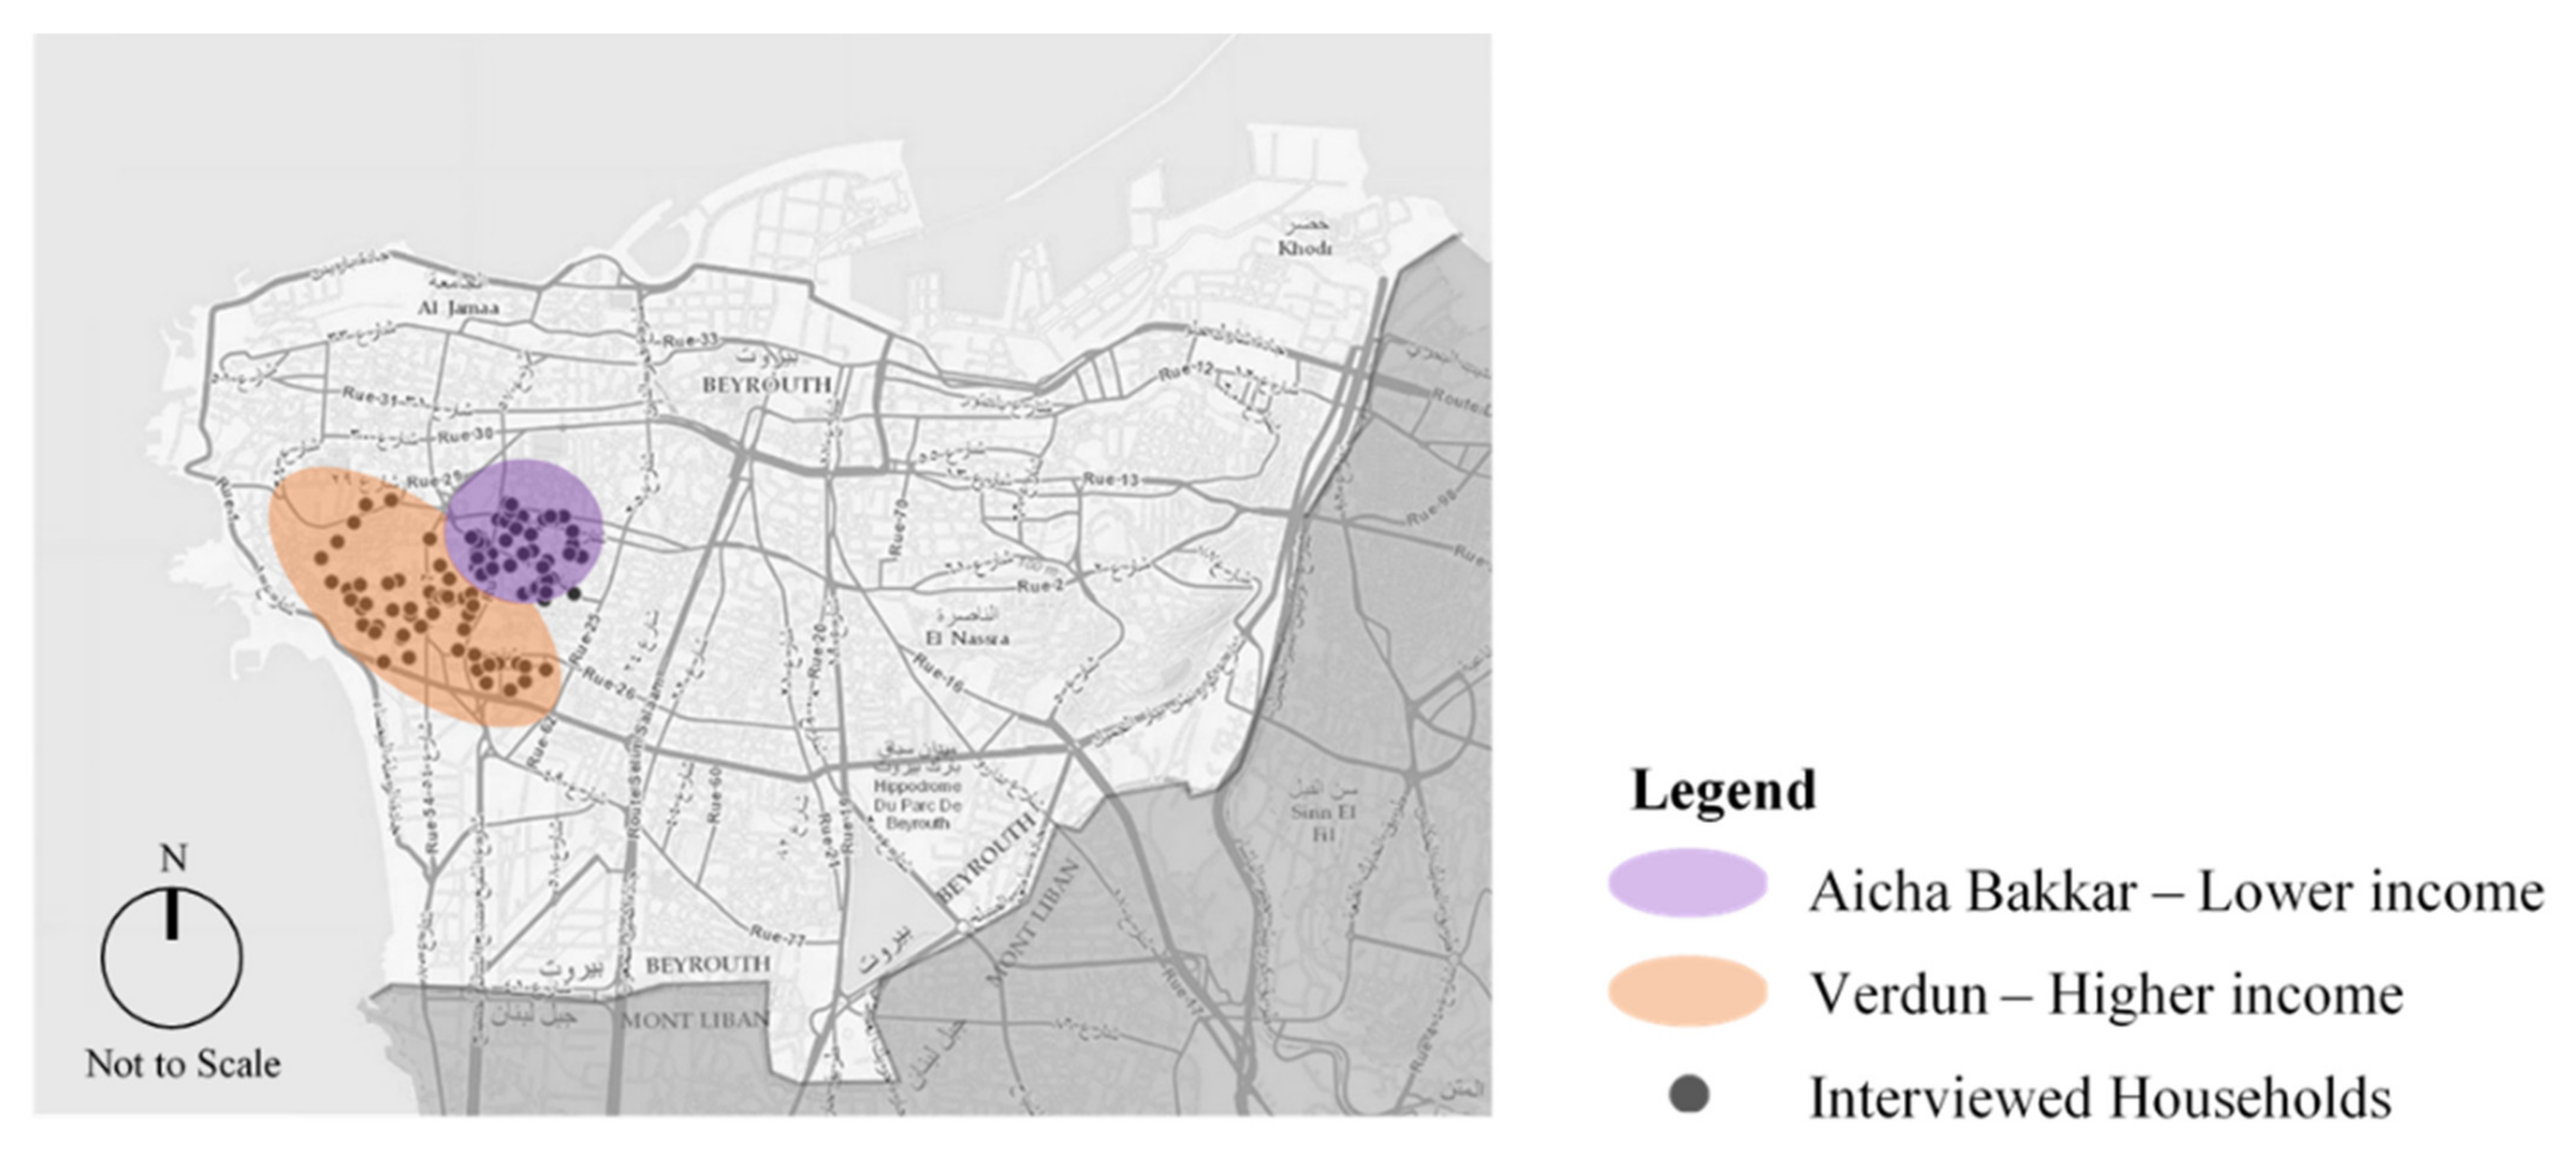
This study evaluates water affordability for two communities in Beirut, Lebanon with different incomes. We sought adjacent communities with different socio-economic and sectarian characteristics. The selected communities in Beirut: Aicha Bakkar (lower income) and Verdun (higher income), are shown in Figure 1. Census data do not exist in Lebanon, so the selection of the income groups was based on the researcher’s local knowledge of the urban neighborhoods, cross-validated by local academicians and urban planners (such as the Urban Lab at American University of Beirut).
The two selected communities are physically adjacent; however, they have different urban typologies and socio-economic levels [41]. Based on the surveyed buildings, Aicha Bakkar has shorter buildings, with 70% of buildings’ height between 21 to 40 m high and an average buildings’ footprint of 220 m2. Verdun has taller buildings, with 70% of buildings’ height between 31 and 50 m and an average buildings’ footprint of 320 m2. These differences are linked to the development period of each area. Aicha Bakkar’s urban development, that started in the 1920s, was unplanned and evolved organically leading to a dense physical form with smaller building footprints and streets. In contrast, Verdun’s development started 40 years later in the 1960s. The later development is related to a landownership dispute, of four main land parcels, which halted any land selling. Once the lands were foreclosed by the court, the municipality was able to subdivide the lands following a grid-like typology which led to today’s large homogenous-shaped lots and large buildings footprints [41]. This late development encouraged larger construction firms to develop the area, which allowed wealthier families to settle in. Both areas have socio-economic and sectarian differences. While the majority of residents in both areas share a similar religious background of Sunni Muslim, Aicha Bakkar is predominantly a low-middle income Lebanese Sunni Muslim community while Verdun is an upper income relatively mixed community of Lebanese and Syrian Sunni Muslims [41]. Despite these social and economic differences, being located adjacent to each other, the communities share a similar quality of access to piped water infrastructure.
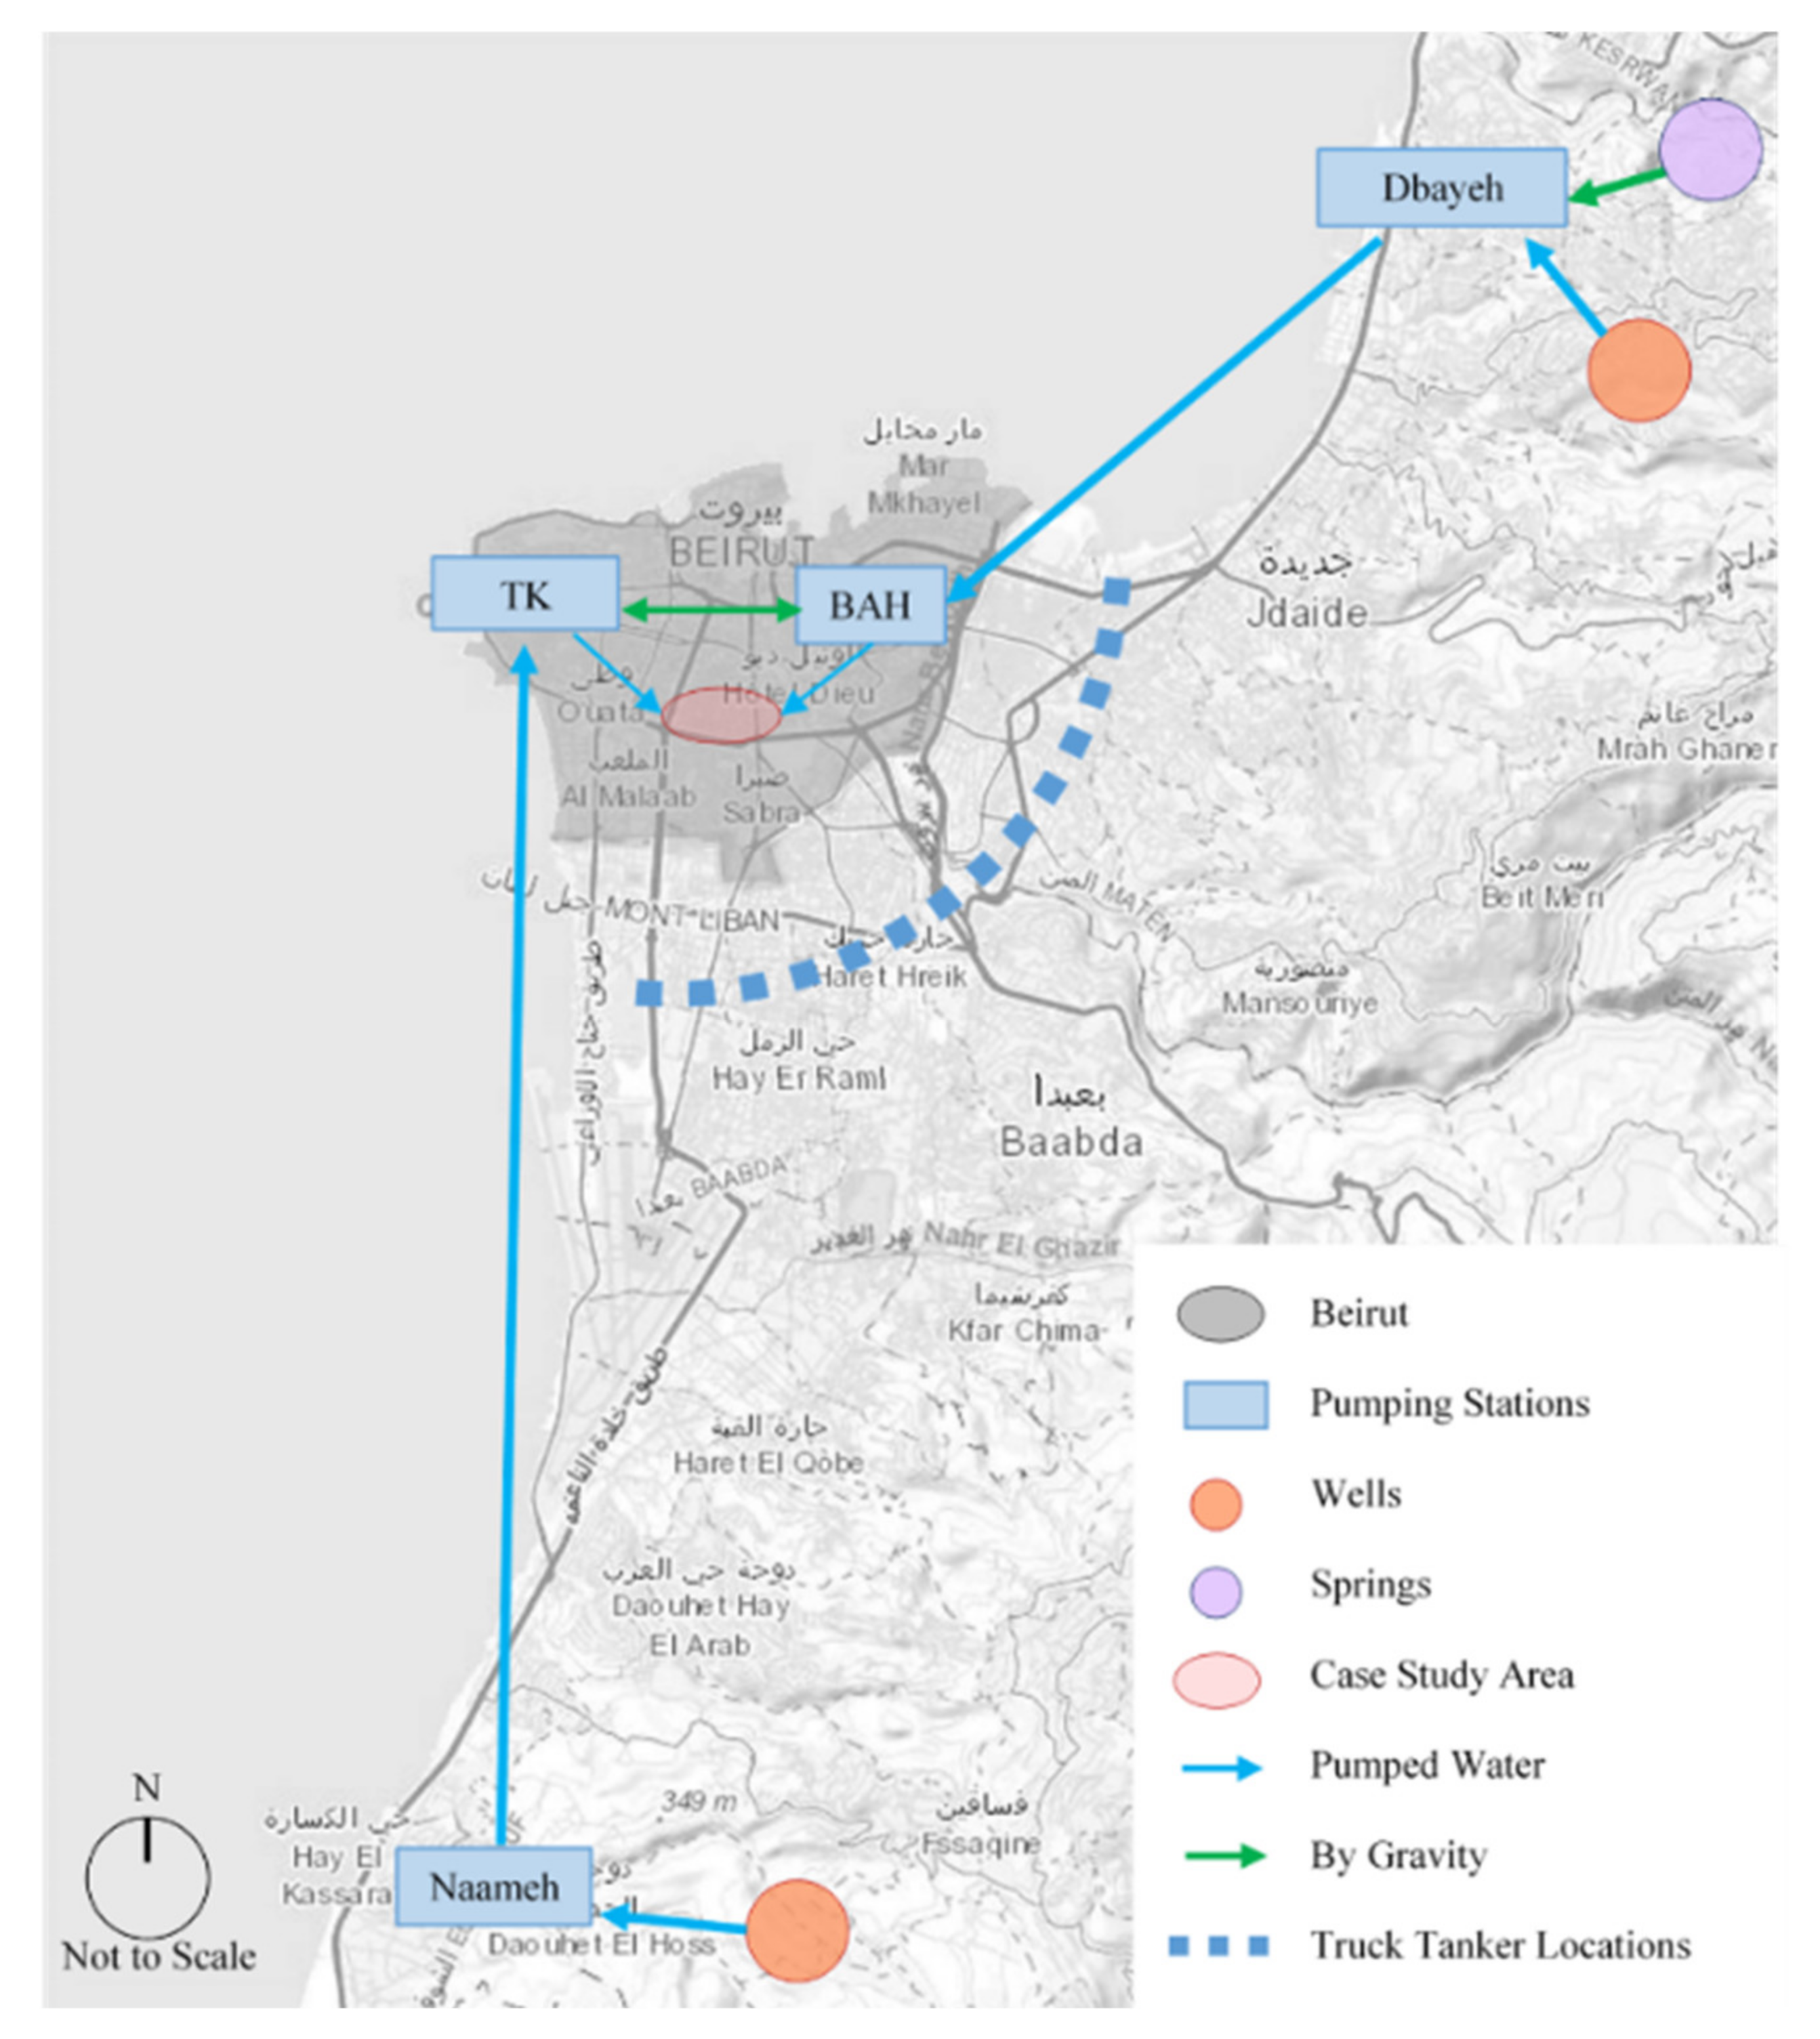
Beirut receives water from two main sources, shown on Figure 2. The largest source is a northern water treatment plant in Dbayeh, which supplies about 80% of the city’s piped water. Another source is groundwater wells in the south in Naameh area. Water from these locations is usually pumped to reservoirs in Beirut for storage before delivery. The reservoirs cannot supply water on a consistent daily or weekly basis, so they release water to different water distribution areas (“zones”) every 48 h. The selected communities are in the same water distribution zone, so they have the same intermittent piped water delivery schedule. On average, residents receive water for a continuous period of about 3 h per day in summer and around 7 h per day in winter.
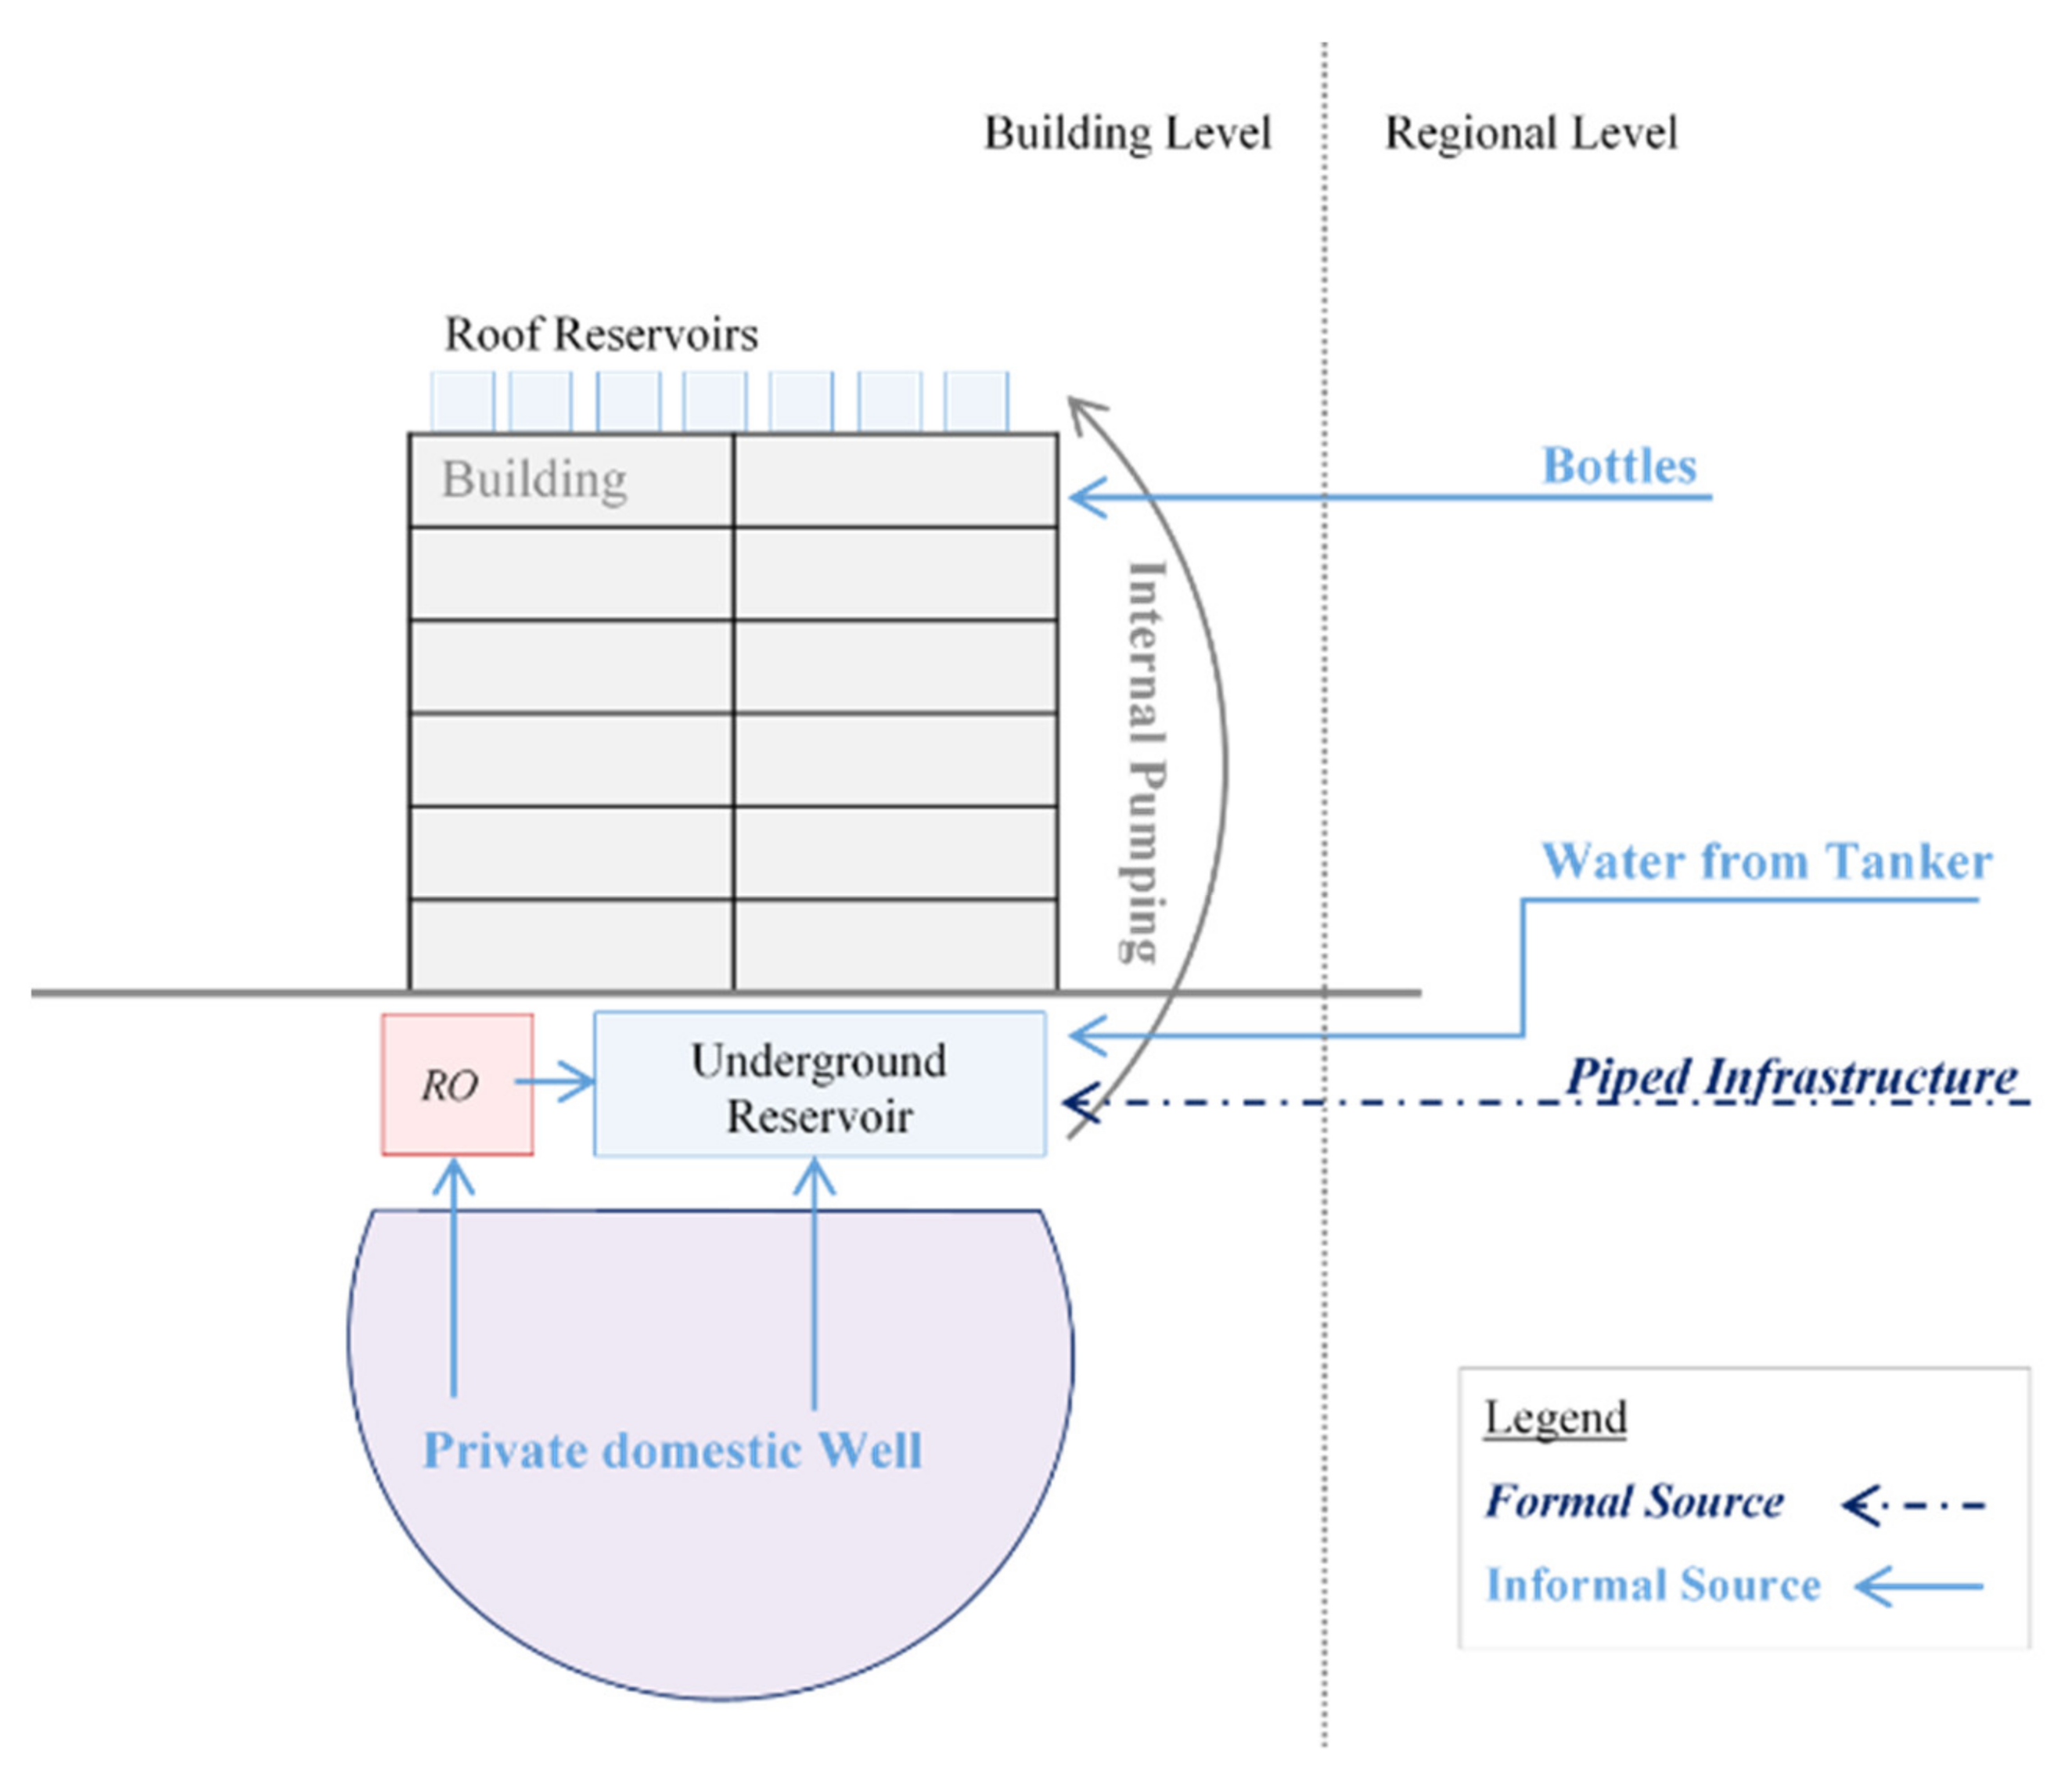
To cope with the intermittence of the piped infrastructure, residents leverage various solutions at the building and household scales. Figure 3 shows typical paths for different water sources. Residents mostly rely on bottled water for drinking (and sometimes for cooking) because of mistrust in the quality of delivered water [6,42]. Bottled water is typically delivered directly to households. For ‘non-potable’ water use (i.e., shower, toilets, cleaning), it is common to maintain on-site storage in underground and roof reservoirs to capture intermittent piped water. The formal piped water is first collected in underground tanks, which are usually large reservoirs shared by residents of a building. Once the large reservoir is full, the water is pumped to smaller, individual roof reservoirs assigned to each apartment or household. As both underground and roof reservoirs are completely consumed before additional piped water becomes available, buildings and households seek other water sources, either pumping water from private wells (sometimes with additional treatment, such as reverse osmosis) or buying water from water tanker trucks.
2.2. Data Collection
Data on household water consumption were collected by in-person household interviews in Aicha Bakkar and Verdun over two months from October and November 2019 by the first author. Interviewees were recruited with a convenience sampling process. This was based on interviewees’ ease of accessibility, willingness to participate, and geographic location in the two communities [43]. The sampling process started with one main contact in each community. At the end of each interview, the interviewees would share the contact information of their friends in the same community, including their neighbors. The researcher would then contact by phone the new list of names to make appointments. The process was repeated until a sample size of about 50 households in each community was reached (52 in Aicha Bakkar and 53 in Verdun). The sample size was based on similar studies in the field of water insecurity and informal water systems [24,37,44] and meets the minimum standards for statistical analyses given the political and financial constraints in the region [24]. The interviews were conducted in multiple languages: the questions were asked mainly in Arabic and when necessary (especially when using some technical terms), the interviewer asked the questions in French and/or English. Answers were collected using the Survey123 phone application from ESRI ArcGIS. The interviews followed an interview guide of topic areas including urban typology (location and age of building, number of floors, and number of apartments), socio-economic details (occupation, age, and educational level of household owners), cost, volume and temporal delivery of water deliveries for formal piped infrastructure, tanker trucks, bottled water, groundwater pumping, and the scale of deliveries (water delivered buildings or single households), and seasonal variation.
2.3. Data Analysis
Analysis starts with household income levels. It then identifies volume and cost of each water source (piped infrastructure, bottled water, domestic wells, and internal water pumping). Total delivered volumes and costs per sources are mainly based on interview answers. The cost rates are all converted from Lebanese Lira (LBP) to dollars (USD) (during the time of analysis the rate of 1 USD was equal to 1500 LBP). For each source, the unit of analysis is liter per person per day (l/person/day) and dollar per person per year (USD/person/day). Affordability ratios are then calculated by dividing income levels by total water costs.
2.3.1. Income Levels
Income estimates are based on household surveys due to the absence of census data on income. Survey answers indicate occupation, age, and level of education of the interviewees. Based on these data, we first estimate years of experience per occupation and then estimate income levels using two databases that show income level per occupation per years of experience. The first database gathers income data per occupation and per years of experience for 11 sectors: advertising, banking, construction, fast moving consumer goods, hotel, insurance, IT, manufacturing, restaurant, retail, and the travel and tourism sector [45]. The second database shows lump sum Lebanese salaries by career and field [46]. Both sources complement each other. The first has a more refined division of income, for each sector, as it shows the different salaries of multiple positions per years of experience. However, it does not cover a wide range of sectors. The second database covers more sectors without detailing income levels. Using both databases we identify 22 occupation categories and estimate their corresponding incomes. This combination of methods allowed a better estimate of household income.
2.3.2. Cost and Volume per Source
Piped infrastructure water cost is based on the official subscription fees. Lebanese households pay a flat rate of 200 USD per year for one cubic meter (m3) per day. Since piped infrastructure supply is not metered, estimated final delivered volumes are based on initial average supply values from the water utility. The volumes are then adjusted based on leakage percentages and estimations of reductions in summer supply (a result of higher intermittence and lower flow). Unit conversion calculations provide total liters of piped infrastructure per person per year. Initial average supply by the water utility is 180 L/person/day [47]. We account for water losses of up to 45% in the regional distribution due to leakages [48,49,50]. Meanwhile, Beirut experiences significant seasonal fluctuations in water availability and use. Based on household interviews, 50% of the sample population experienced lower flows from August until November. Thus, the dry period is considered to be four months, and the wet period to be eight months. It is estimated that water production drops in dry months by approximately 40% [50].
Bottled water cost and volume measurements are based on household surveys, which provide the number, cost, and volume of bottled water purchased per household per week. Unit conversion calculations (from household per week to person per day) provide total liters and dollars of bottled water per person per day.
Water tanker cost and volume were also based on household surveys which provide the quantity, cost, and volume of water tanker deliveries purchased per household (or building) per week. Unit conversion calculations allowed estimation of the cost and volume of water delivered by tankers to households (or buildings) per week and to total liters and dollars per person per day.
The volume delivered from domestic wells is calculated by multiplying total hours of operation of pumps per day by pump flow rates. Unit conversion calculations provide total liters pumped per person per year. The total hours of operation of pumps are estimated from interviews. Not all interviewees reported using their wells (32 of the 105 interviews reported pumping water from their wells). Those who did use a well, pumped for approximately 5 min per day at an average flow rate of about 18 L/min. Thus, the volume of water consumed from domestic wells in terms of liters per person per year (Q) is computed by averaging all flow rates of households based on Equation (1):
where:
Q = p (6116 103 μ)/h d,
- p = power (kW), 0.7457 kW. The typical household pump sizes are around 1 horsepower (HP), based on the water utility [50].
- 6116 × 103 = constant for conversion.
- μ = pump efficiency (0.70).
- h = differential head, depth of the wells (m). Intake depth is usually less than the well depth. However, since intake depth was not available, it was assumed that the pumps are at the ground level and residents pump water from the bottom of the pumps which was considered as the pumping height. The interviewees provided the depth of the well, however for the missing depths an average of 70 m was taken into account, based on the average well depth from the interviews.
- d = density (1000 kg/m3).
The cost of domestic wells (C) is based on the cost of drilling, pumping, and treatment. Drilling cost is based on the Lebanese market drilling rate (100 USD per meter of depth) and on the assumption that wells have a lifespan of 25 years. Unit conversion calculations provide total drilling cost per person per day. Pumping cost is based on multiplying the pumping costs with pumping operation hours (obtained from household survey answer) as per Equation (2) below. Treatment costs are based on reverse osmosis (RO) unit costs, estimated by summing initial investment costs, monthly maintenance costs, and pumping costs which were provided by the household survey answers.
where:
C = Q ρ g h c/(3.6 × 106 μp μm),
- Q = volume flow (m3/h) = 1.284 m3/h.
- ρ = density (1000 kg/m3).
- g = acceleration of gravity (9.81 m/s2).
- h = differential head, depth of the wells (m). As noted above, pumping height was based on the well depth since depth intake data was not available.
- c = cost in kW per minute (USD/kW). It was based on the Lebanese cost of kW of 0.0958 USD/kW/min.
- 3.6 × 106 = constant for conversion.
- μp = pump efficiency = 0.7.
- μm= motor efficiency =0.7.
The total cost and volume of internal pumped water are calculated by multiplying total hours of operation of pumps by the pump flow rate. Unit conversion calculations provide total volume pumped per person per year. The hours of pump operation are based on interviews, which indicate that on average a building pumps water internally for about 20 h per week. Average flow rate from lower to upper reservoirs, which pumps a mixture of three sources (formal piped infrastructure, tanker trucks, and wells illustrated in Figure 1 was estimated to be 8 m3/h. Similar to domestic well volumes, internal pumped volumes are computed by averaging all flow rates of households based on Equation (1), with a differential head (h) based on building heights (pumping water from ground level to roof reservoirs) of about 32 m compared to well depths of about 70 m.
2.3.3. Affordability
To assess water affordability, water sourcing costs are compared to median income in different ways. First, we analyze the overall affordability ratio for the entire population by comparing total water costs to median income of the total sample population across both communities. We then analyze each community’s affordability ratios by comparing average water costs with average median income per community. Finally, we analyze per household affordability ratios by comparing water costs and median income for each household. To validate our results, we develop an affordability sensitivity analysis.
3. Results
The results start with establishing income distributions for both communities followed by estimations of the volumes consumed and costs of all water sources. Then, water affordability thresholds are explored for both communities, accompanied by a sensitivity analysis. Finally, disparities in income between communities and their statistical significance are presented.
3.1. Income Distribution of Both Communities
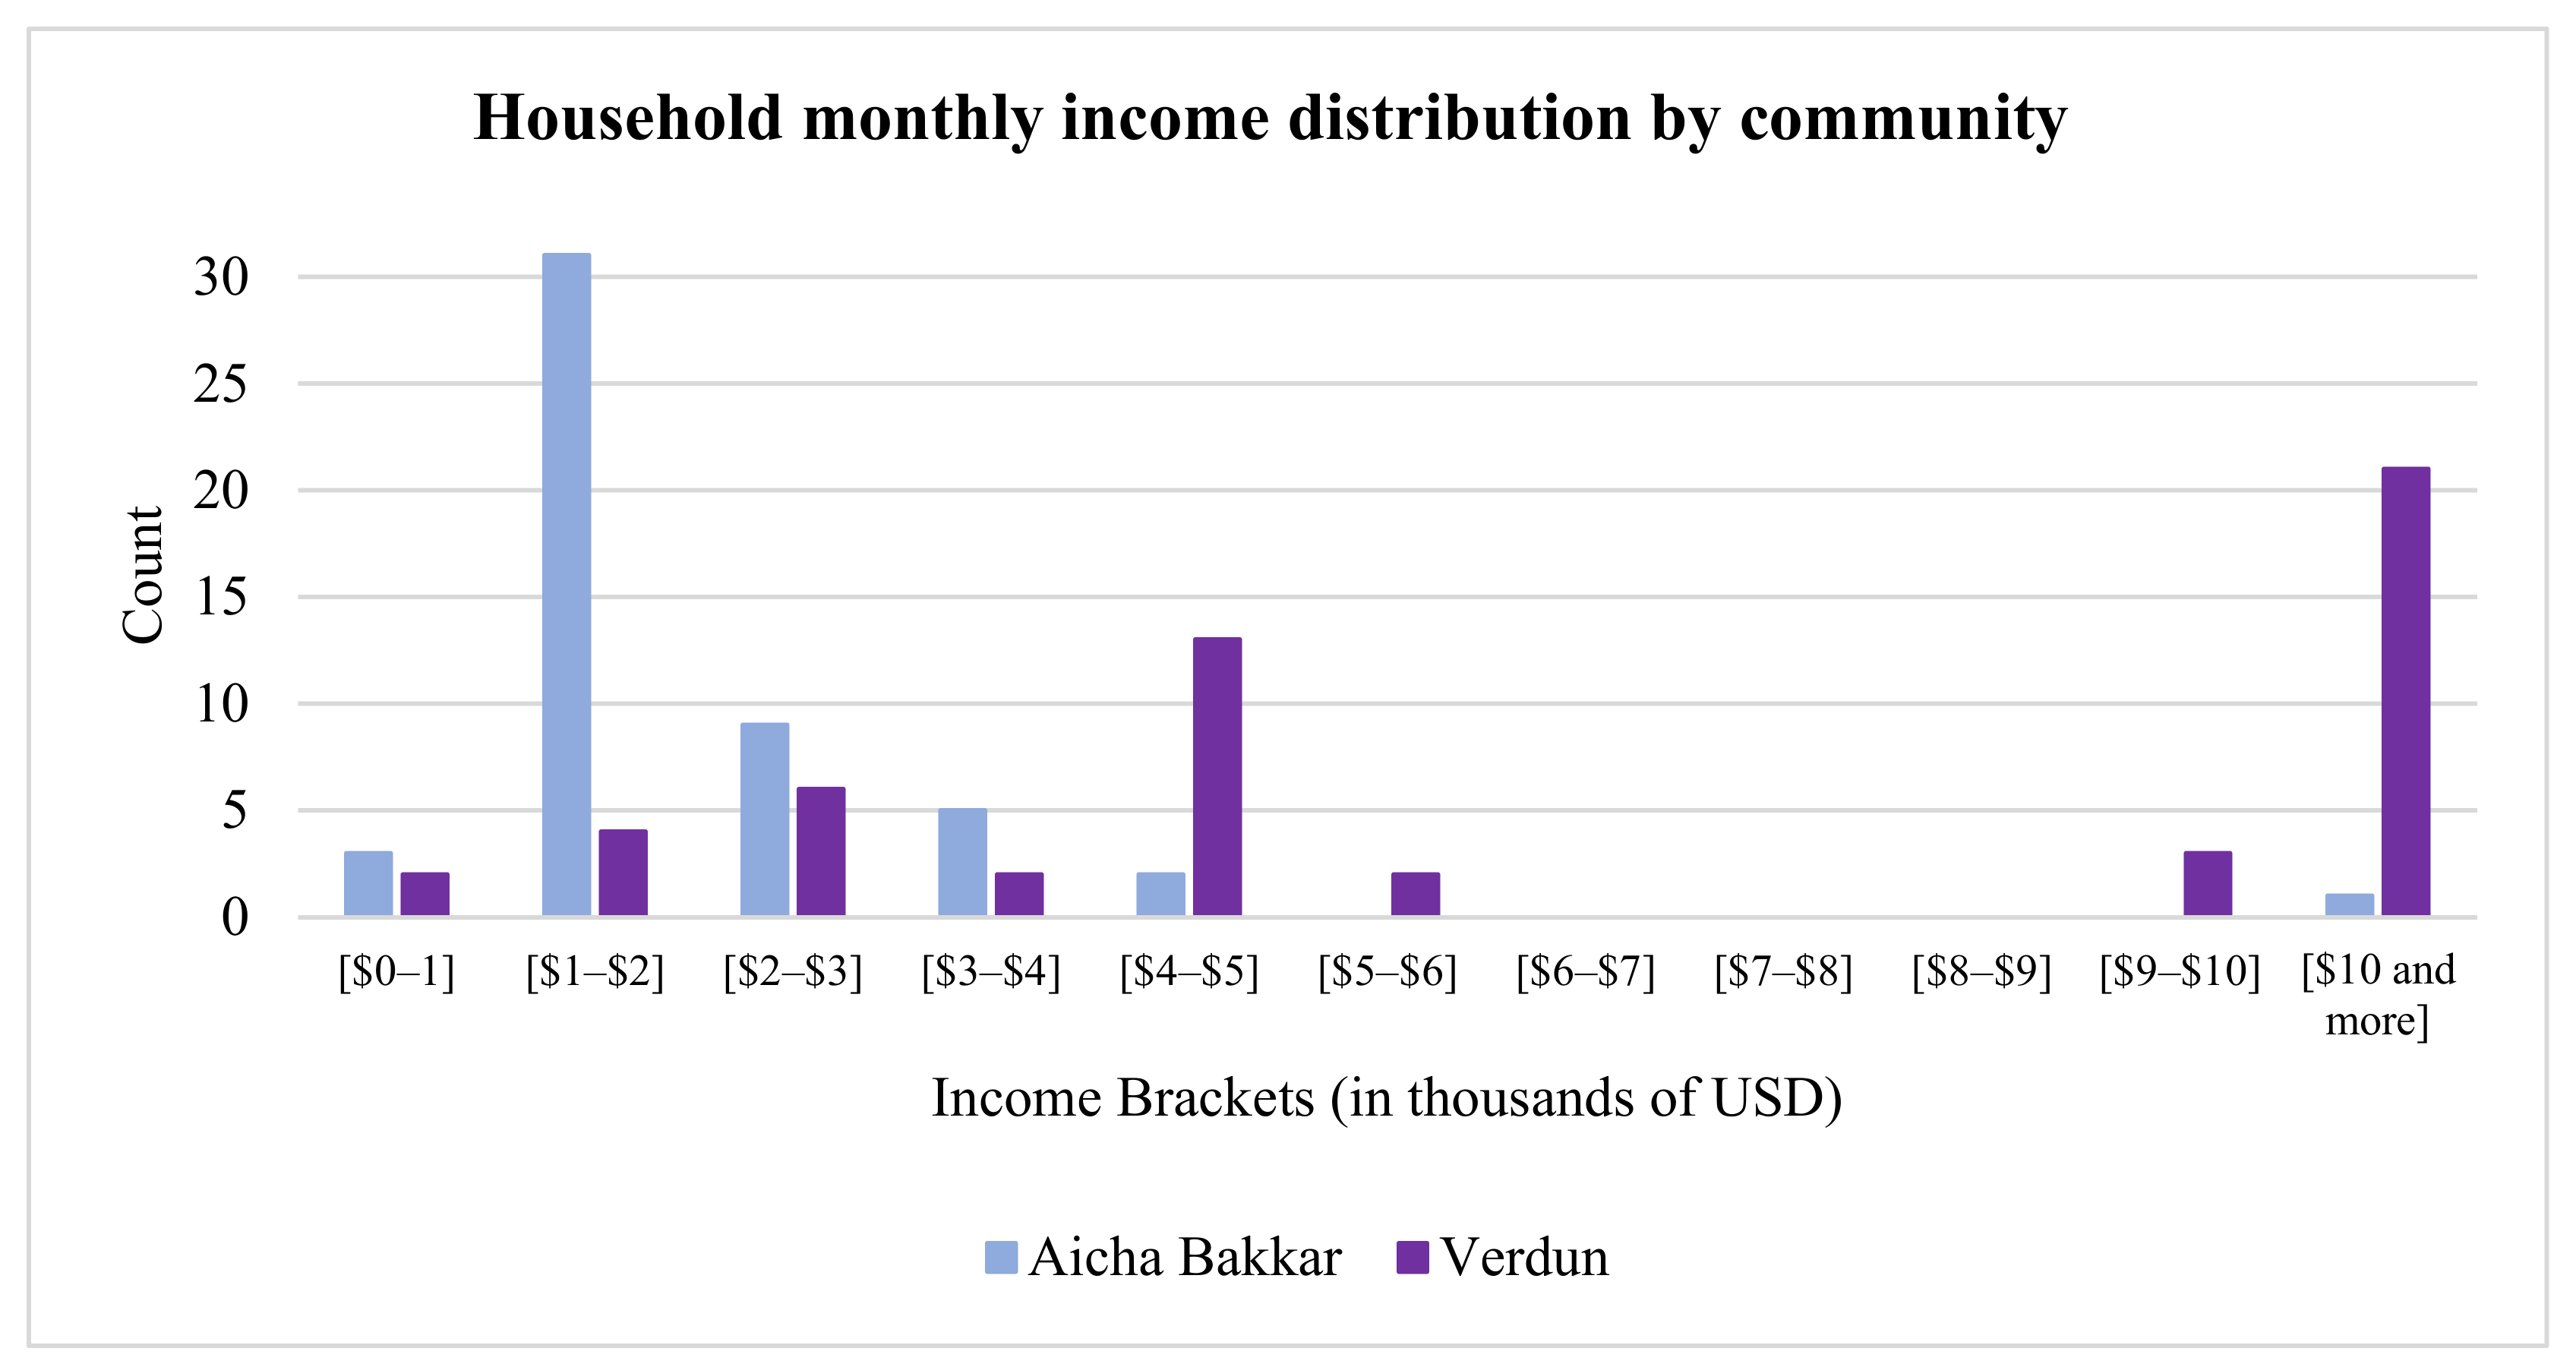
Average monthly income for the entire sample population is around 2792 USD. For Aicha Bakkar community, 60% of salaries are 1000–2000 USD/month, and for Verdun community, 64% of salaries are at or above 4000–5000 USD/month (Figure 4). Median monthly income for households in Aicha Bakkar is about 1400 USD, and for households in Verdun, about 4700 USD. These income levels are similar to those found in databases on Lebanese household income levels [45,46,51]. However, these differences appear to increase at the highest and lowest values. Based on Lebanese incomes databases, lowest income values can reach 355 USD/month [45,46,51], which is one quarter of the average of the lower income community of this study. This income is lower than the Lebanese minimum wage of about 450 USD/month [52]. The highest income values can reach 11,600 USD/month [45,46,51], around 2.5 times more than the average of the higher income community of this study. Income differences of lowest and highest values show that Aicha Bakkar is a lower income community, but does not fall into extreme poverty. Meanwhile, Verdun is a higher income community, but not extremely affluent relative to the country as a whole. These differences are also reflected in the sensitivity analysis of the water affordability estimates.
3.2. Volume Use by Source and Their Seasonal Variation
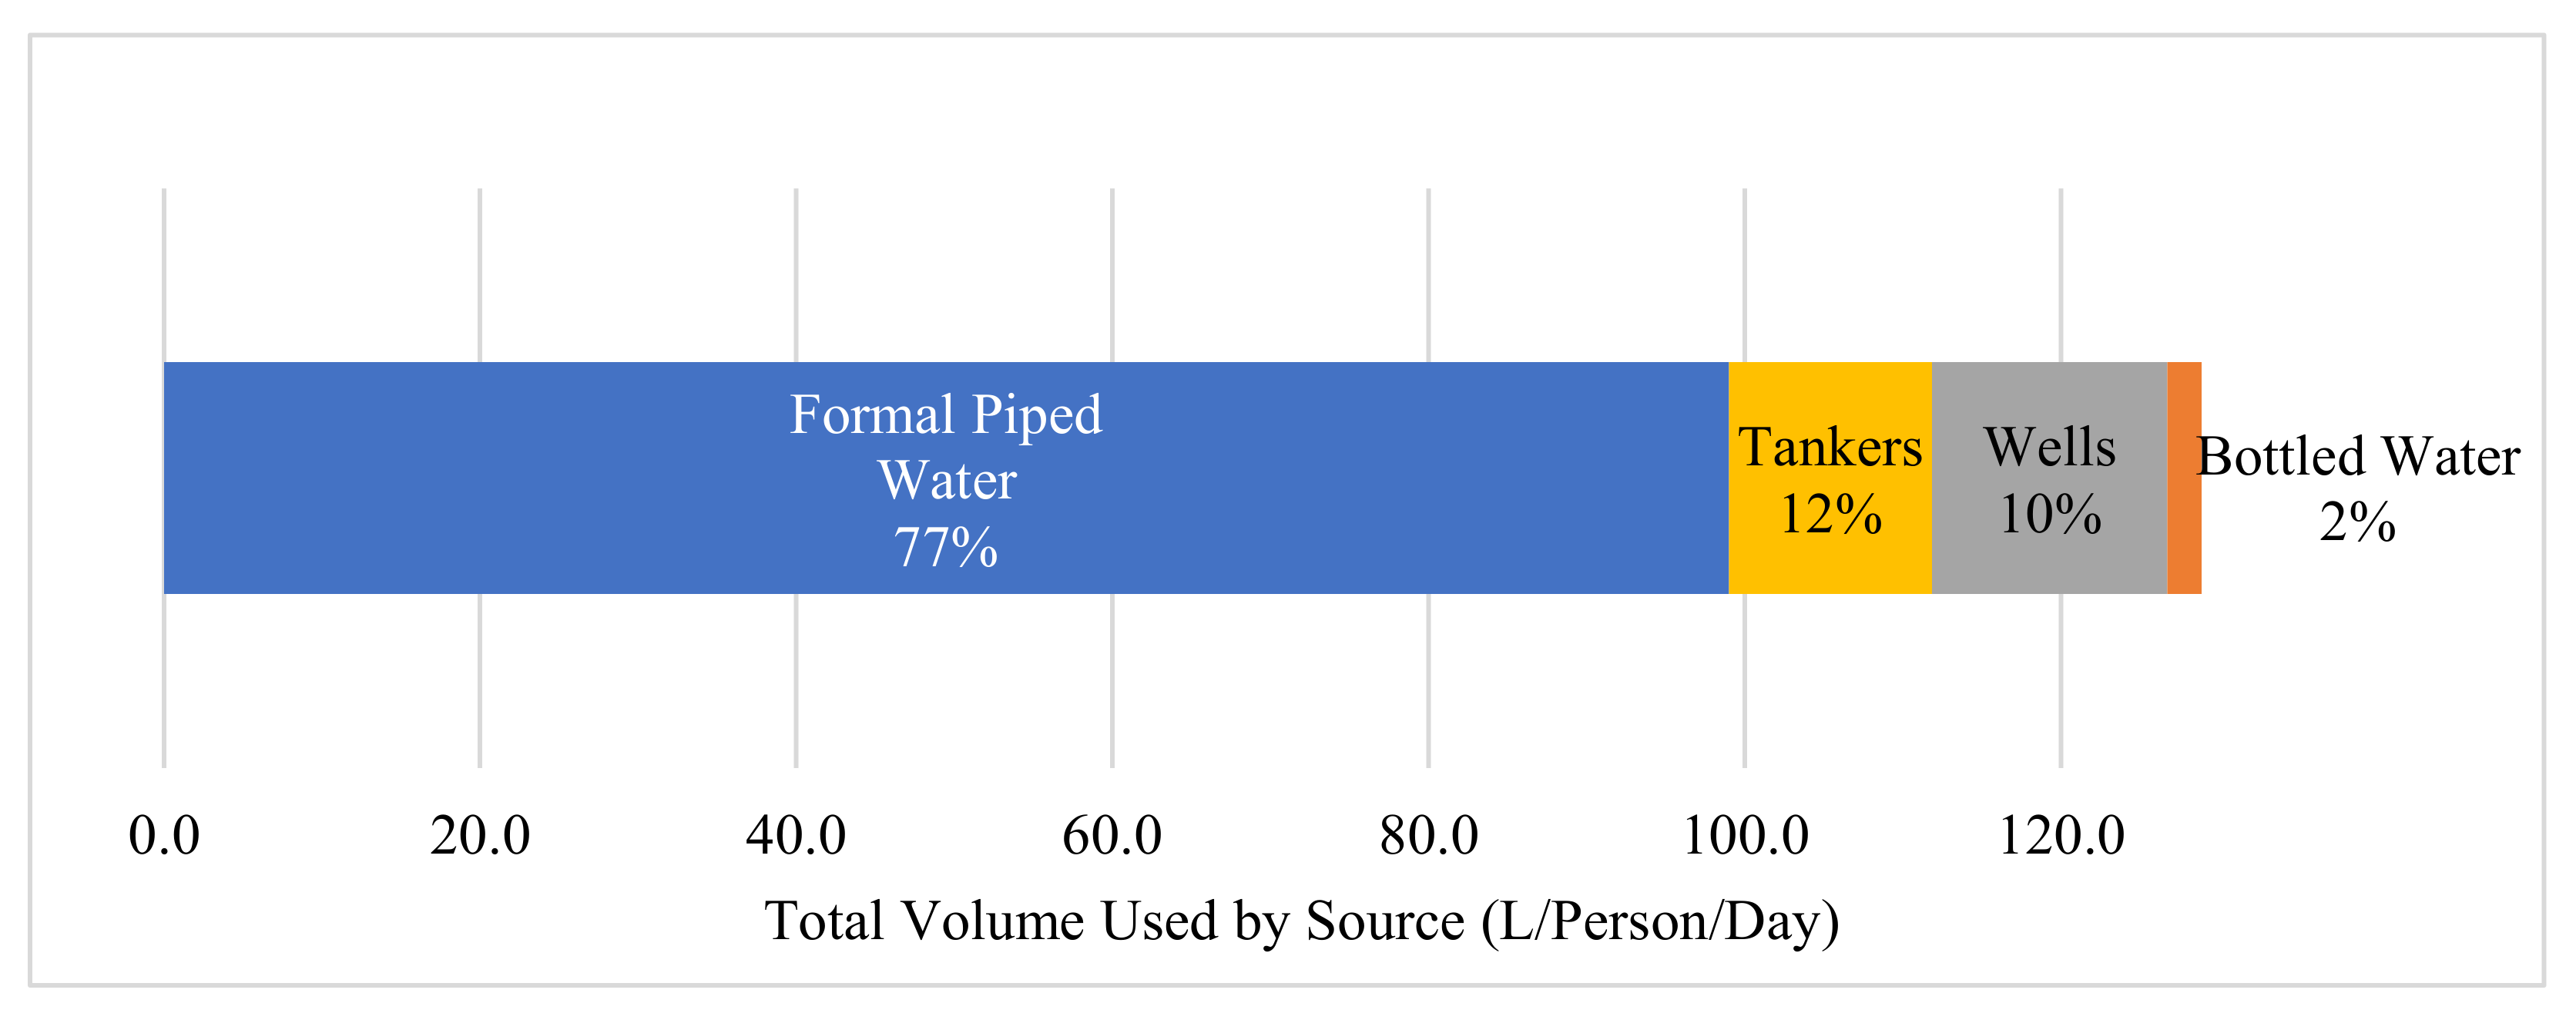
Figure 5 shows total water volume supplied per day by multiple sources. Roughly 77% comes from the formal piped system, followed by tankers (12%), wells (10%) and lastly bottled water (2%).
Total water volume and volume by source varies per season in response to decreased summer deliveries in the formal piped supply and increased summer use by residents. Formal piped water supply decreases in summer by 40% (from 114 L/person/day to 69 L/person/day). This is mainly a result of an increase in intermittence and reduced flow in summer, as reported by interviewees and water utility engineers [50]. Residents also increase summer water use by 10% [53]. To compensate for the reduced supply and increased use, people increase their use of informal water sources. Table 1 shows tanker water use increases in summer almost 20-fold and well water use increases almost 6-fold. Drinking water use does not change; people drink about 2 L/day year-round. These additional sources result in a total increase of 10% in total supply between summer and winter, 143 L/person/day compared to 129 L/person/day, respectively. These values also account for 45% of losses from leakage in the distribution network.
Volume Comparison between Communities
Table 2 shows overall water use volumes by source for Aicha Bakkar and Verdun. Since these communities are adjacent, they share similar schedules of water intermittence from the piped infrastructure and also have similar piped water use of 99 L/person/day. The main differences are that Aicha Bakkar has more informal water supply from tankers, whereas Verdun has more supply from wells. Moreover, 10% of Aicha Bakkar households reported being very careful in how they consume water, which also might reduce overall volumes.
3.3. Cost Comparison per Source between Communities
Figure 6 shows total cost per source by total delivered volume, and Table 3 shows cost per liter. These results show that informal sources have much greater cost, despite their generally lower volume of consumption relative to the piped water supply. Bottled water has the largest share of total cost because it is by far the most expensive per liter at 0.52 USD/L.
Promised and Actual Costs
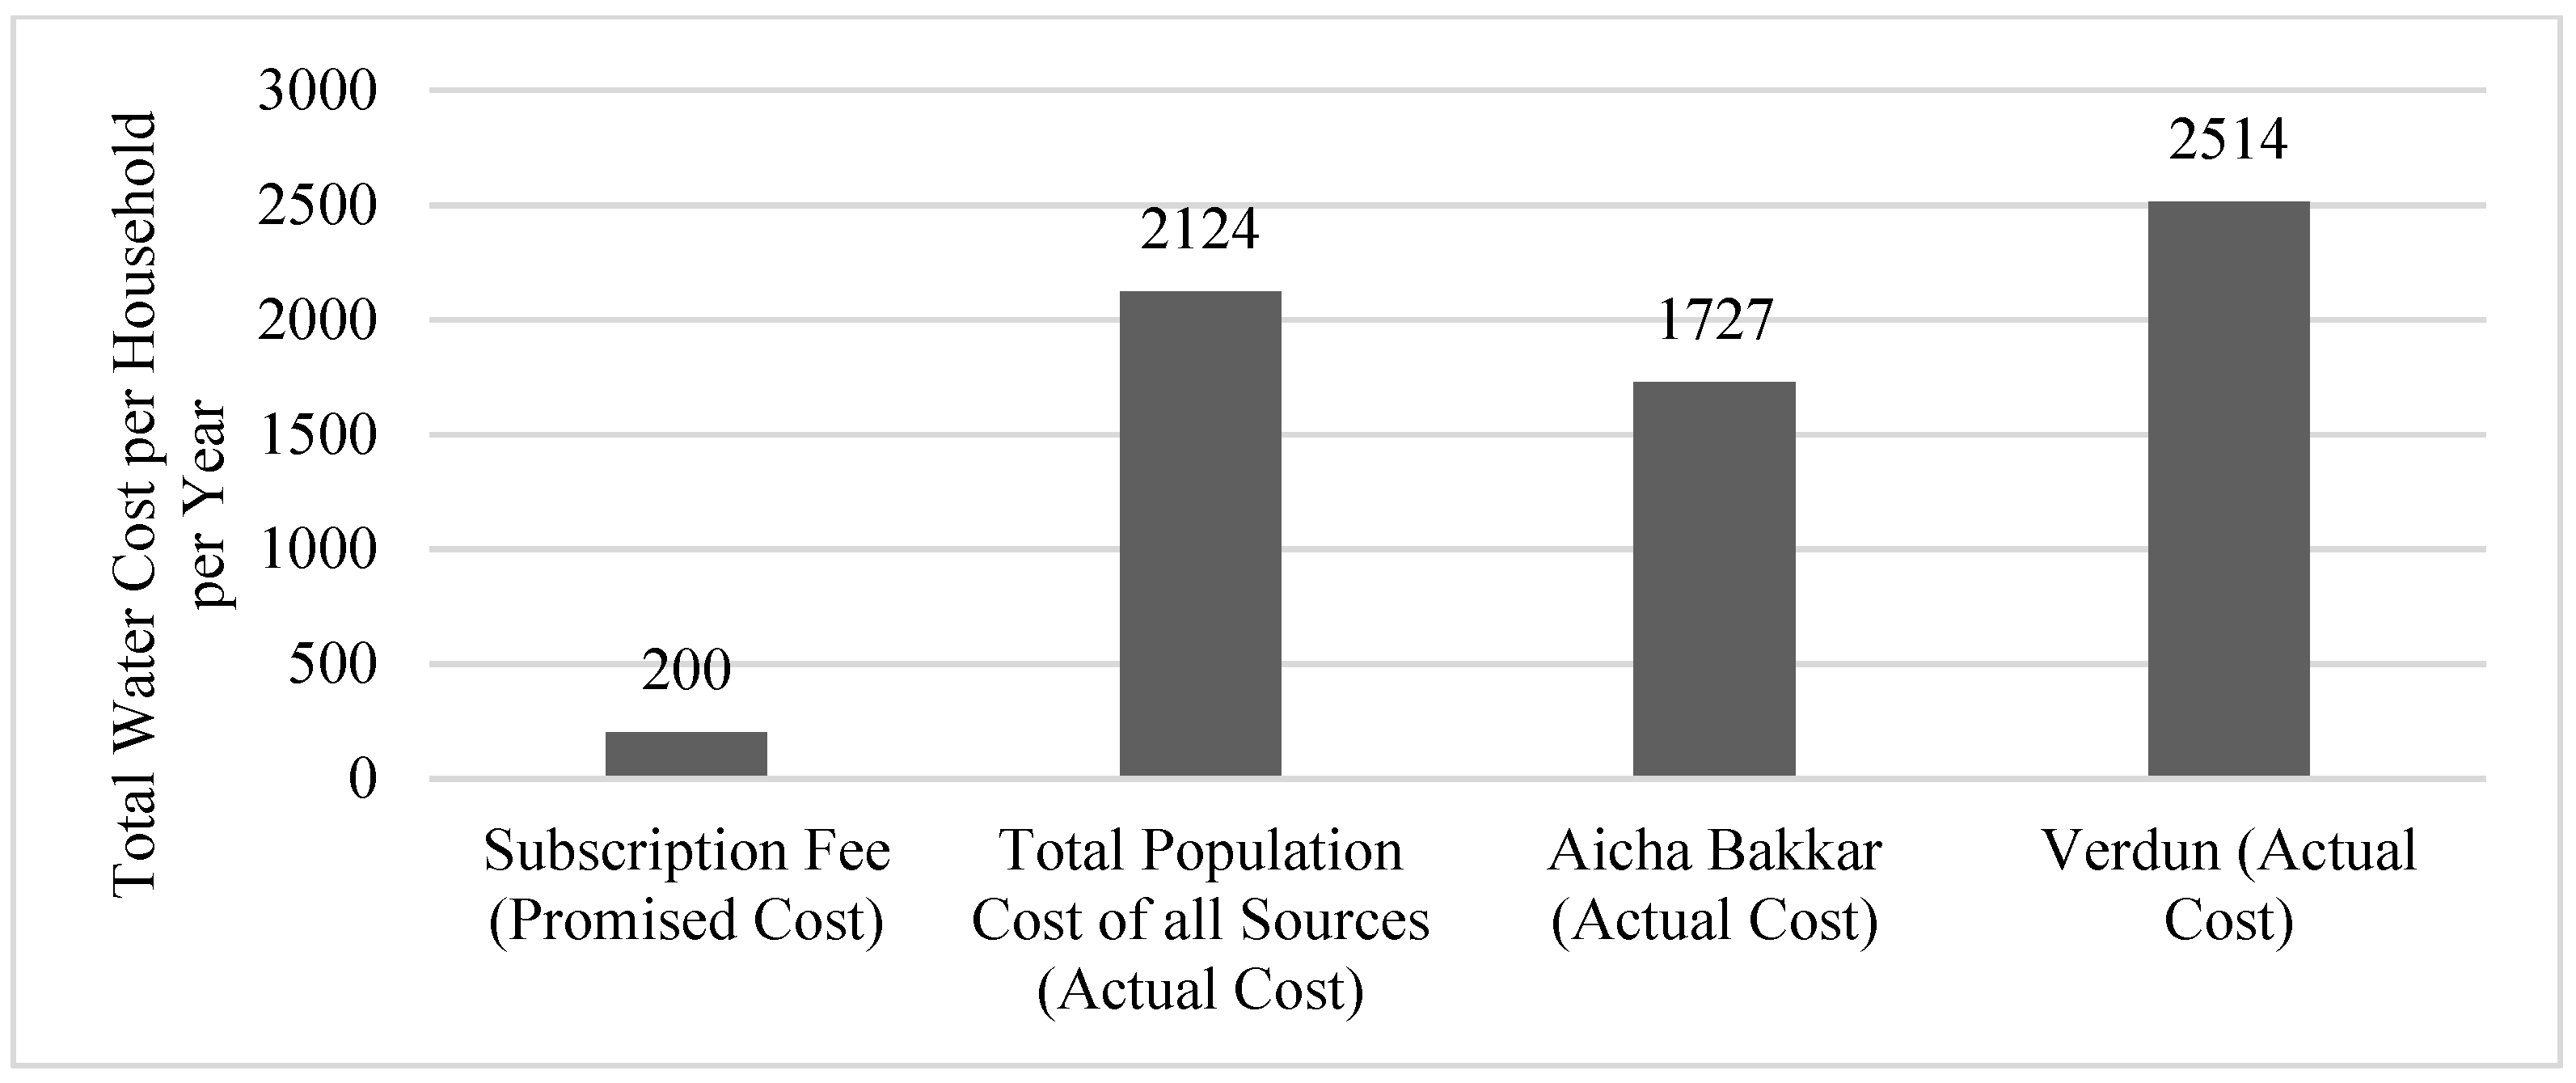
The additional costs from informal sources increase total water costs to households in each community The piped water subscription fee for households is around 200 USD per year for a “promised” volume of a 1 m3 per day, but this is not delivered reliably. In reality, Aicha Bakkar and Verdun households pay an overall average of 2124 USD per year for water, around 10 times more than the subscription fee for formal piped water (Figure 7). As a total cost, households in Verdun pay an average of 2514 USD/year/household, or 50% more than households in Aicha Bakkar (1727 USD/year/household). The additional costs are mostly from the increased costs of bottled water and local well supplies (including extra pumping and treatment costs). Furthermore, there are additional costs to maintain underground and roof reservoirs (such as yearly cleaning from sand and other debris that settle in reservoirs) that are not covered in this study.
3.4. Water (Un)Affordability
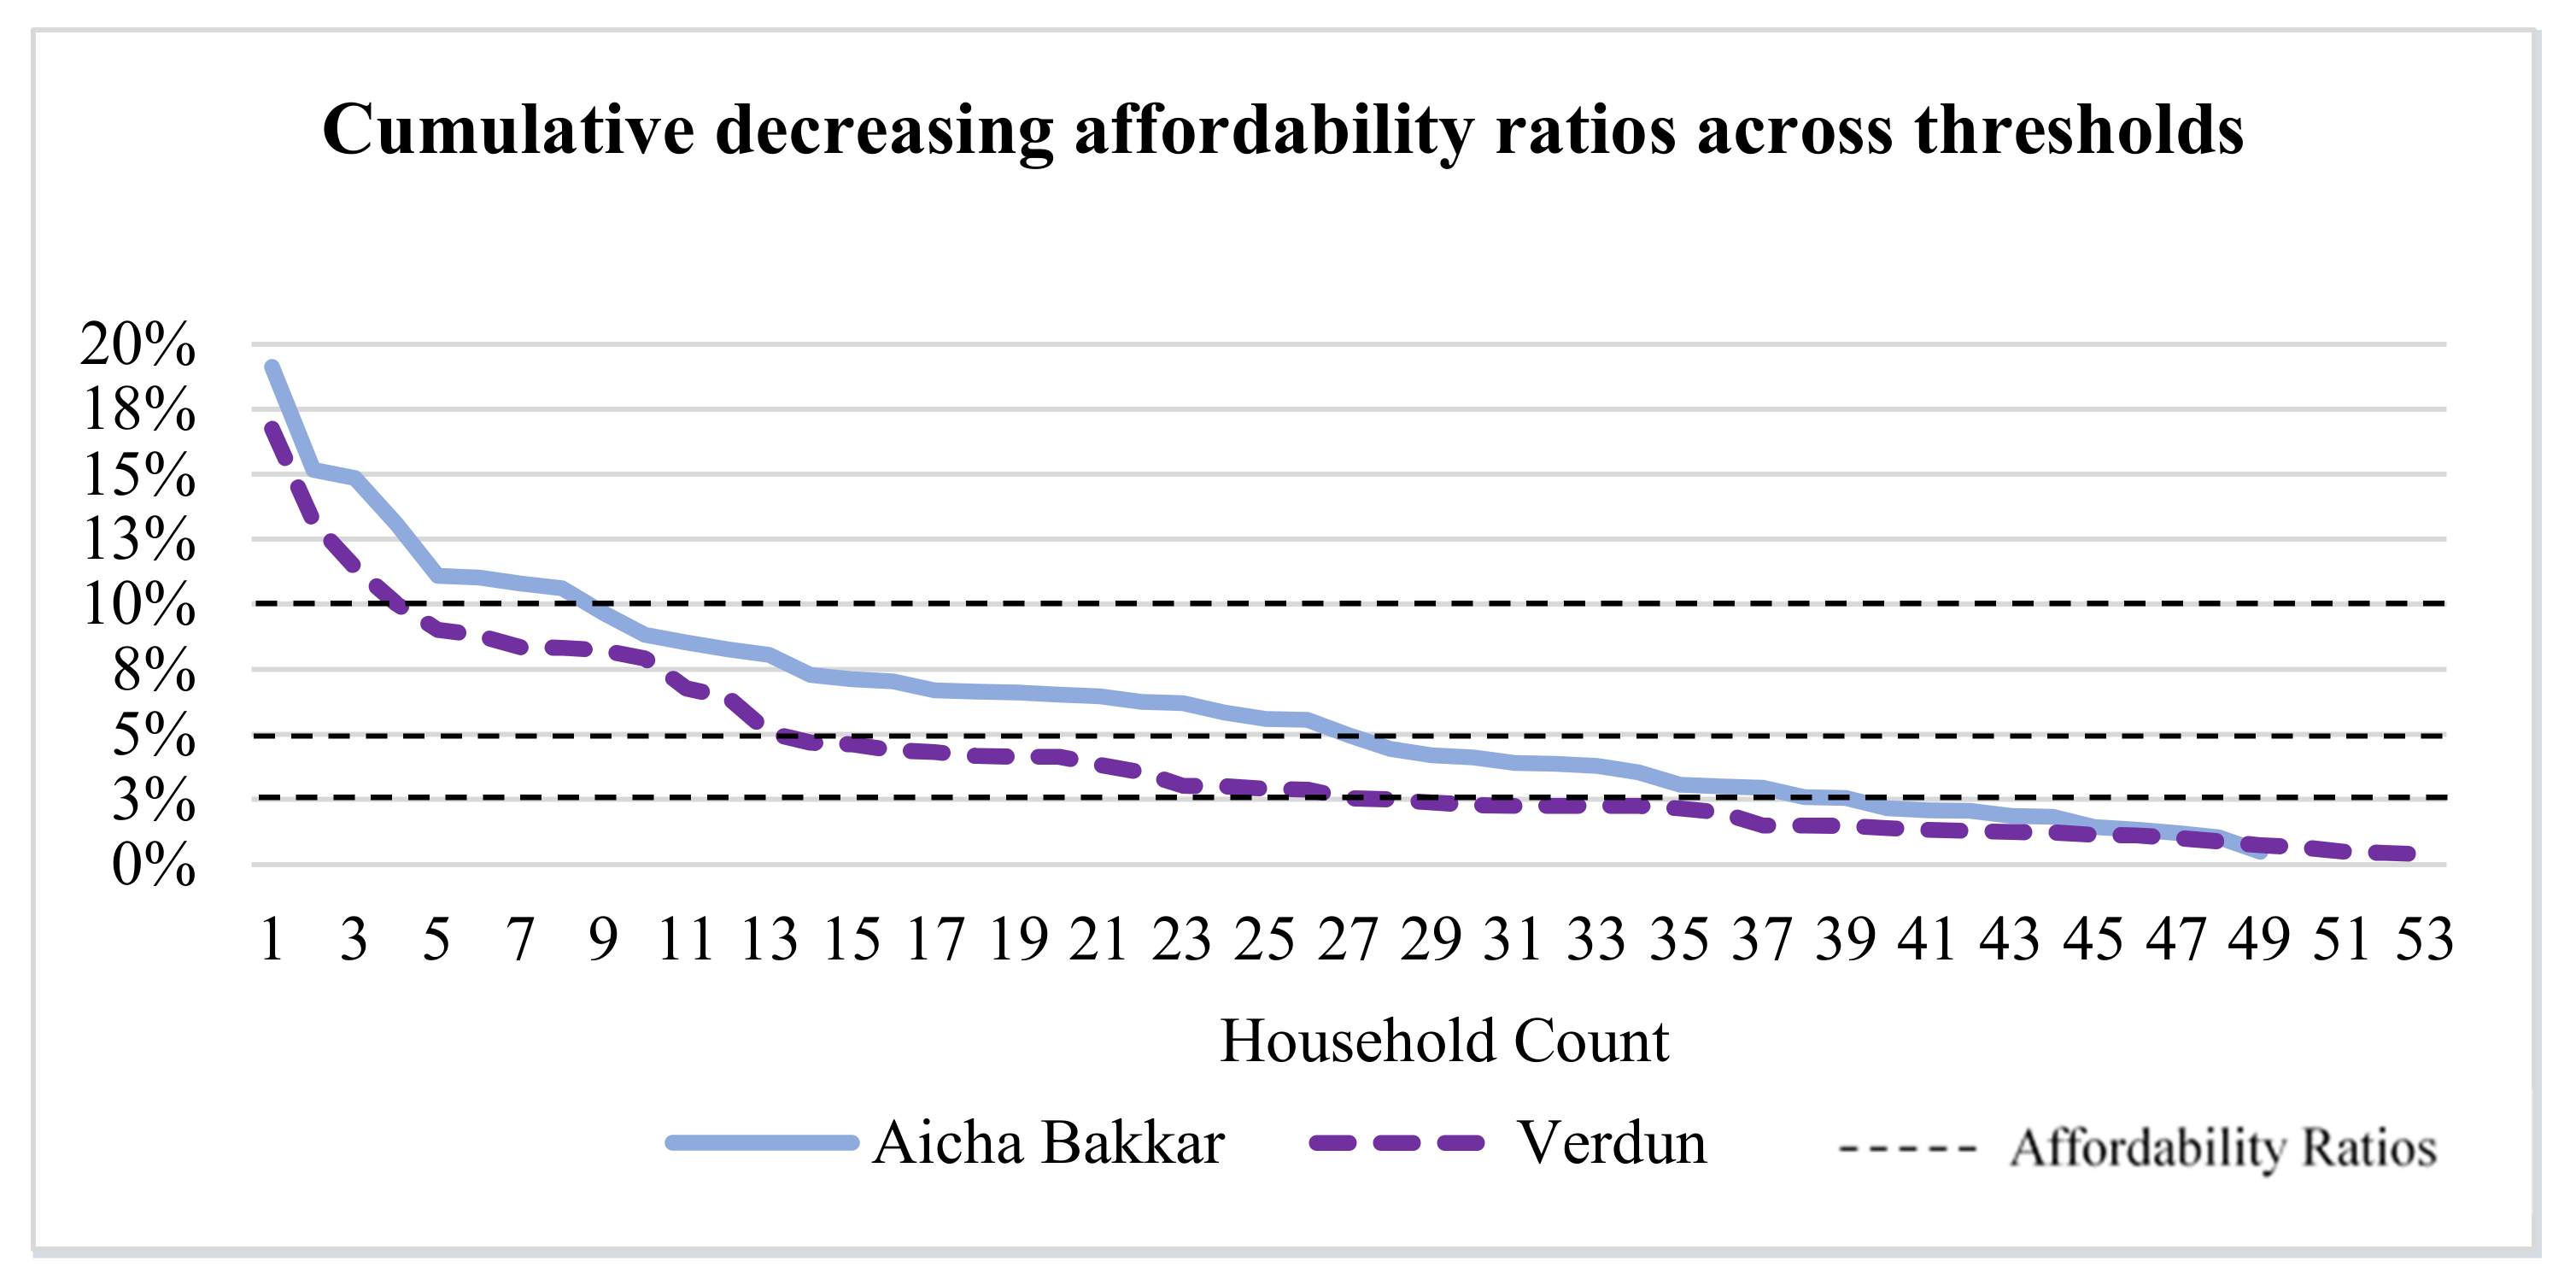
The average overall affordability ratio for both communities is 6%. With affordability thresholds in the literature generally ranging between 3% and 5%, it is clear that water is comparatively less affordable in the study region. The average water cost to median income ratio is around 10% in Aicha Bakkar and 4% in Verdun, so even though the Aicha Bakkar average household water bill is lower (1727 USD versus 2514 USD for Verdun, see Figure 7), the (un)affordability ratio is 2.2 times higher than that of Verdun. This is because the median income in Aicha Bakkar is one fourth that of Verdun. Figure 8 shows a more detailed analysis with a per household water cost-to-income ratio distribution, by taking the cumulative percentage of each household, ranked in decreasing order [11]. The far left of the graph shows Aicha Bakkar households with a higher water cost-to-income ratio than Verdun households. This indicates that water is generally less affordable for lower income households. This is elaborated further in Table 4. Nevertheless, on the far right, a small percentage of households in Aicha Bakkar have a lower percentage of water costs than Verdun households. This can be explained by the lower income households reducing their water consumption: a pattern that can have other negative effects including psychological and physical impacts [37]. Further, it indicates that water is, at times, more affordable but inadequate in supply for lower income communities.
Based on threshold ranges from the literature, four threshold brackets are defined: less than 3%, 3% to 5%, 5% to 10%, and more than 10%, as summarized in Table 4. In Aicha Bakkar, 45% of households allocate less than 5% of their income for water, and 18% of households pay less than 3% of their income for water. However, most of this population (around 55%) pay above 5% of their income for water, and 18% of households have highly unaffordable water, paying more than 10% of their income for water. In Verdun, most of households’ access affordable water services. A total of 72% of households use less than 5% of their income for water and 45% of households pay less than 3% of their income for water. Meanwhile, only 8% of this population pays more than 10% of their income to water.
Sensitivity Affordability Analysis
To address potential uncertainty in our estimation of household income (and thus, the water affordability ratio), we performed a sensitivity analysis that leveraged existing databases on Lebanese incomes [45,46,51]. The lowest income levels are estimated at 25% of our results (the lowest income in Lebanon can be as low as 355 USD, compared to our results of 1453 USD), whereas highest income estimates can be 2.5 times higher than our results (around 11,600 USD compared to our results of 4775 USD, Figure 4). For these income extremes (lowest and highest values), affordability disparities are much higher.
The cost to median income ratios for lowest incomes increases up to 40% (compared to the base result of 10%). Our per household analysis (Figure 8), indicates that no lower income household is paying more than 19% their income for water. Thus, 40% is an extreme unaffordability ratio; taking the example of a person earning less than the minimum wage (450 USD/month). The cost to median income ratios decreases for the highest income down to 1.7% (compared to our base results of 4%). However, our per-household analysis (Table 4) shows that 45% of higher income communities have an affordability ratio less than 3%, hence many households in higher income communities have lower affordability ratios, with some households approaching 1.7%.
3.5. Disparities between Communities and Their Statistical Significance
Table 5 shows total costs per person per year (accounting for the volumes consumed per source) and cost per liter for different sources for both communities. Differences in yearly cost per source are mainly based on the sources’ costs per liter and supplied volume as detailed below. We use a t-test to calculate the statistical significance of the differences in the estimations for the two communities.
In both communities, bottled water is the most expensive source per liter and the smallest source by volume. However, the total per capita cost difference between the two communities is around 188 USD, a 46% of difference (412 USD for lower-income Aicha Bakkar and 600 USD for higher-income Verdun). The costs per liter of bottled water for Verdun is around 0.6 USD/L and for Aicha Bakkar it is around 0.4 USD/L. Even though both communities have an average household size of about 4 people, Aicha Bakkar residents buy around 10 water bottles on average during a summer week, whereas Verdun residents buy up to 4 times this quantity, or up to 41 bottled water per summer week. Moreover, 96% of Verdun residents tend to buy bottled water that are registered on the website of Ministry of Public Health [54], whereas 39% of Aicha Bakkar residents compromise on the quality of bottled water by buying unregistered brands that are often cheaper but have more dubious quality. These large differences are elaborated in the discussion section.
The second most expensive source is the formal piped water system, up to 53 USD per capita yearly in Aicha Bakkar and 71 USD per capita in Verdun. Even though the cost per liter for both communities is the lowest with 0.0015 USD/L and 0.0020 USD/L, respectively, the formal piped water system is by far the largest in volume.
For tanker truck water supply, residents of Aicha Bakkar spend 8% of their income, while the wealthier households in Verdun spend only 2%. This might be related to costs per liter where Aicha Bakkar residents pay around 0.0048 USD/L versus Verdun residents who pay around 0.0036 USD/L for tanker water. The difference in cost of tanker water results mainly from economies of scale, as Verdun residents can employ larger tankers that are cheaper per liter of water, as further explained in the discussion section.
As for wells, Verdun residents spend around 2% of their total water supply cost on wells. Differences in well costs could be linked to the higher-income households in Verdun having more wells. The total number of wells used in Verdun (24) is 50% more than Aicha Bakkar (17). Moreover, in Verdun, 17% of buildings use reverse osmosis units to treat well water, but no evidence was found of any RO units in Aicha Bakkar households.
Additional internal pumping cost differences are due to building height differences. Aicha Bakkar tends to have shorter buildings with an average height of 27 m whereas buildings in Verdun have an average height of 38 m requiring greater pumping capacities.
To identify statistically significant differences between the communities, t-tests were applied to evaluate differences in informal source volumes and unit costs for the two communities. Differences in volume consumed between the communities were not statistically significant. However, as indicated in Table 5 the cost difference per liter for bottled water is statistically significant. This might be related to Verdun residents purchasing more bottled water that is more expensive per liter. Moreover, Table 5 also shows that tanker truck and well water cost differences are statistically significant for these communities. Tanker truck cost differences might be related to economies of scale where Verdun residents can access cheaper water from larger tankers; whereas for wells this might be related to Verdun residents accessing more wells and using expensive RO treatment units.
4. Discussion
In areas where formal piped water supply is insufficient in quantity, quality, or reliability, informal water sources usually supply the remaining daily household water demands. This study shows that most household water costs come from informal sources (even though they provide the smallest volumes), with bottled water being the most expensive source. To answer our main research question, the study shows that informal water sources increase total cost of water and create stark disparities between communities of different economic levels. Based on affordability thresholds found in the literature [4,30], water is rather unaffordable for the entire sample population but affects lower income communities more. This study proposes some recommendations to address these disparities in water unaffordability.
Water for the entire sample population is comparatively unaffordable, with some households in both communities paying more than 10% of their income for water. This is far more common in the lower income community of Aicha Bakkar than in the higher income community of Verdun. Even though Aicha Bakkar has lower total water costs, water is less affordable as residents pay 2.2 times more (relative to their income) for water. Per household analysis highlights disparities further and shows that more than half of Aicha Bakkar residents (55% of households), spend more than 5% of their income on water. Sensitivity analysis shows that households with the lowest Lebanese income values might pay 40% of their income for water. The greater purchasing capacity of higher income households helps them secure enough daily volume, making them less vulnerable to the current and future water insecurity issues.
A major statistically significant difference was the cost of bottled water related to differences in the quantity and cost of water bottles purchased in these communities. These differences are mainly from disparities in access to bottled water. Verdun residents can afford more expensive brands and tend to buy more bottled water as they often use it for cooking as well as for drinking. In contrast, Aicha Bakkar residents tend to buy cheaper brands and generally boil tap water for cooking.
We also found statistically significant differences in total costs for tankers and wells. These differences are not only related to the purchasing power of Verdun residents but also can be explained by factors linked to the community’s urban form and economies of scale. Aicha Bakkar has smaller streets (due to its earlier and informal settlement pattern), so only smaller tankers, which are more expensive to operate per unit delivered, can enter the area. Moreover, Verdun residents have larger storage capacities in their larger building footprint. We did not measure storage capacity per community since the reservoirs are usually stored under and above the buildings; however, it is most likely that water storage capacity increases with the building’s footprint. Thus, Verdun residents may have more capacity to refill and store more water at each cycle by purchasing water from larger tankers (cheaper per unit delivered). They are also able to store more water from the piped infrastructure (the cheapest source).
The study also calculates added coping costs related to increased pumping and treatment of water within individual buildings. Generally, for both communities, cost differences between summer and winter can be explained by costs per source, where people increase use of cheaper sources (e.g., the tanker trucks) to backfill from inconsistent formal sources. Moreover, for lower income communities, households change their consumption by being conservative in their water consumption as they cannot afford greater costs of informal sources. They schedule their most intensive water activities (i.e., washing clothes) when cheaper municipal piped water is available. Changing behavior to adapt to a certain supply schedule or worrying about having enough water for household activities are important psychological stressors of water insecurity [40]. For higher income communities, coping costs come from accessing improved technologies, such as treating water through expensive reverse osmosis treatment, accessing more expensive bottled drinking water [54], and increased pumping costs for taller buildings. Thus, higher income households become less impacted by overall municipal water shortages, as they can buy and pump larger volumes of water as well as purchase expensive bottled water to secure access to good water quality.
A major problem driving these water access and affordability disparities is that formal water subscription fees constitute a minimal share of total water cost. The low cost of formal service affects overall water utility revenue and budget, which becomes limited in its capacity to upgrade and maintain the water infrastructure system. The piped infrastructure currently has up to 45% of water losses in its distribution systems [48,49]. This results in a vicious cycle where the piped water system’s reduced fees and budget result in high supply intermittence, pushing households to rely even more on alternative informal water sources. This translates into affordability disparities between low- and high-income neighborhoods and overall higher costs and inconvenience to all including psychological and physical impacts from water shortages [37].
In many settings globally, relying on informal sources often is a necessity rather than a choice. As such, it is critical to understand the role of informality in producing costs to all and disparities between populations and communities. While informality initially had a negative connotation in the literature, referring to sub-optimal activities of the urban poor [31,55,56], scholars now recognize that informal activities have the ability to adapt and can sometimes be more suitable (in terms of water quantity and quality) than formal piped infrastructure [57,58]. This case study shows that in terms of quantities, informal sources deliver up to 23% of total volume, and can help residents access better water quality with bottled water. However, we need to be critical when associating resilience [57] with informality. While informal sources provide needed volumes and quality, they often come at a higher cost, especially for low-income communities. As seen in this study, both Aicha Bakkar and Verdun households pay about 10 times the total subscription fee to access informal sources, but the additional costs impose inequitable and extreme burdens on Aicha Bakkar residents.
Formal and informal water systems work in tandem [36,59]. While informal sources can fill the gap in the needed volumes and quality, formal piped infrastructure generally provides an affordable service. Thus, perhaps there are opportunities to consider supporting hybrid strategies to balance the objectives of improved water quantity, quality and affordability, all with an emphasis on increasing social equity.
A first strategy should target upgrading piped infrastructure to reduce losses. This strategy is being developed by the Lebanese water utility as an indirect method to eliminate the dependency on informal tankers [55]. To upgrade the piped infrastructure, the water utility could try to increase its budget by increasing service rates. This approach is aligned with the water utility’s current effort to install household water meters [60,61], which will help monitor losses and reduce leakage. People are clearly paying added costs for other sources, so they might be willing to pay for more expensive piped service that ultimately reduces their overall water costs.
To estimate the increase in service rates, the water utility can calculate whether the additional costs that people are already paying would be sufficient to upgrade the infrastructure. However, this might be politically challenging. Public institutions are often poorly managed [62,63,64], leading to a lack of trust in public institutions. This sentiment might result in an unwillingness to pay more, knowing that residents might never receive the promised volumes. One way to move forward is to start with a pilot project, where water institutions could begin building public trust by satisfying the household needs in providing safe and reliable water quantity and quality at a smaller scale.
Other strategies could target interventions that improve quality and cost. Bottled water is currently the most expensive source and there are many dangers of commodifying water [65]. However, in areas where people do not trust the quality of tap water [6,42], bottled water becomes a necessity [24]. Financial strategies and subsidies could reduce the price of bottled water, making it more affordable for both high- and low-income communities. Other public health strategies should be developed to control the distribution of unregistered bottled water of dubious quality. From our survey, of the 26 drinking bottle brands mentioned by households, only 8 (31%) were registered with the Ministry of Public Health [54]. Another strategy could focus on monitoring the quality and cost of informal water tankers [60]. Some scholars suggest formalizing informal tankers [54] through management frameworks that target water tanker quality standards and tariffs [66]. However, this might lead to in a monopoly by larger water tanker companies that already dominate the market, as they might be the only ones capable to engage and negotiate with public institutions. Furthermore, larger companies might be the only ones able to afford the added costs of formalization, e.g., registration fees, licenses and taxes [59]. The inequitable impact of this type of policy could threaten smaller tanker companies that cannot afford these costs. Moreover, reduced competition between water tanker truck operators could reduce access to these informal water resources resulting in higher costs for residents.
As seen in this study, understanding and analyzing affordability disparities in informal systems is complex. Informality is inherently less regulated and has hidden characteristics (e.g., unknown total number of distributors, their locations, and aspects of their water quality) [67]. Therefore, to calculate the cost of water systems, we cannot rely simply on water bills. We also need to account for the costs of different water sources including variabilities in their supply volume and schedule. Based on this analysis, we uncovered problems of water unaffordability for all households with particularly harsh consequences for lower-income residents. We also showed how effective solutions to water affordability problems require careful attention to issues of informality. Moving forward, it is important for engineers and planners to be aware of the difficulties of analyzing and accounting for informal sources and to develop more holistic methods to better assess disparities in affordability. These considerations become important for regions with geopolitical uncertainty, such as in Lebanon and the Middle East, especially as rising numbers of refugees add pressure on water sources [68] and increase impacts on accessibility and affordability of water sources.
Beirut is not an isolated case. Around 30% to 60% of the urban population in the global south relies on such informal water systems [59]. Beirut’s case study fits in the larger field of water justice that highlights how water struggles tend to affect lower income communities disproportionally, and how they tend to result in disparities in water access, affordability, and quality [69,70]. Informal sources also cross geographic borders leading to challenges in governance and oversight. While most case studies have focused on lower income counties, communities in higher income countries, such as in California or across the USA–Mexico border, also rely on informal sources such as bottled water and water trucks [37,71,72]. Thus, developing more holistic tools to measure affordability disparities of informal source will help to better understand, and ultimately intervene to improve, water justice across geographic areas.
5. Conclusions
This study shows the financial impact of informal sources on two communities of different income levels in Beirut, Lebanon. It compares their income-based water affordability ratios and highlights their affordability disparities. In both communities, informal water sources are responsible for 88% of total water cost but provide only 22% of average water use. Water affordability is an issue for both communities, as they both pay almost 10 times more for total water services than the cost of water from the formal piped water system. The study also highlights water affordability conditions and disparities between those communities. The lower income community of Aicha Bakkar has lower total water costs, but the water is less affordable as residents pay 2.2 times more for water relative to their income. Per household analysis highlights disparities further and shows that more than half of these residents (55% of households), spend more than 5% of their income on water. Higher income communities have more purchasing capacity, so they can afford more expensive bottled water and reverse osmosis units and thus avoid consumption of lower quality water. Furthermore, they generally have greater cistern capacity to refill and store water from cheaper sources, such as the formal water systems and tanker trucks. As a result, higher income communities are less vulnerable to water insecurity issues in both quality and quantity.
The study also analyzes coping behaviors and costs. Lower income communities are more likely to change their consumption patterns relative to water availability, i.e., conducting water intensive activities when municipal water is supplied. Meanwhile, coping costs, from treatment technologies and increased water pumping, are higher for higher income communities because they can afford domestic reverse osmosis treatment.
Many areas in both the global north and south rely on informal water sources as a necessity rather than a choice. It is critical to understand the complexities of informal water sources and their role in producing overall societal costs, including the disparities they create among populations and communities. More specifically, it is important to develop affordability assessment methods that consider the complexities of informal water systems. This will allow the development of holistic policy strategies that improve overall water justice.
Author Contributions
Conceptualization, Y.C., J.L., J.K.L. and E.S.S.; methodology and formal analysis, Y.C.; writing—original draft preparation, Y.C.; writing—review and editing, J.L., J.K.L. and E.S.S. All authors have read and agreed to the published version of the manuscript.
Funding
This research was partially funded by Diamond Developers grant number 1.
Institutional Review Board Statement
The study was conducted in accordance with the Declaration of Helsinki, and approved by the Institutional Review Board (or Ethics Committee) of University of California Davis (protocol code 1292073-1, approved on July 26, 2018).
Informed Consent Statement
Verbal informed consent was obtained from all subjects involved in the study.
Data Availability Statement
The data presented in this study are available on request from the corresponding author. The data are not publicly available due to Internal Research Board agreement of not sharing any personal data about the participants of the research’s survey.
Acknowledgments
We thank the Urban Lab at the American University of Beirut for their local knowledge and guidance during the data collection: Mona Fawaz, Ibrahim Alameddine Abir Zaatari and Shareef Tarhini. We also thank Diamond Developers for funding the research and Yasmina Choueiri.
Conflicts of Interest
The authors declare no conflict of interest.
References
- Sawkins, J.W.; Dickie, V.A. Affordability of Household Water and Sewerage Services in Great Britain. Fisc. Stud. 2005, 26, 225–244. [Google Scholar] [CrossRef]
- Mack, E.A.; Wrase, S. A Burgeoning Crisis? A Nationwide Assessment of the Geography of Water Affordability in the United States. PLoS ONE 2017, 12, e0169488. [Google Scholar] [CrossRef]
- Goddard, J.J. Measuring Drinking Water Affordability and Sustainability; University of California: Berkeley, CA, USA, 2019; pp. 4–42. [Google Scholar]
- Hutton, G. Monitoring “Affordability” of Water and Sanitation Services after 2015: Review of Global Indicator Options; The UN Office of the High Commissioner for Human Rights: New York, NY, USA, 2012. [Google Scholar]
- United Nations. Sustainable Development Goals 6. 2020. Available online: https://sustainabledevelopment.un.org/sdg6 (accessed on 10 April 2020).
- Zawahri, N.; Sowers, J.; Weinthal, E. The Politics of Assessment: Water and Sanitation MDGs in the Middle East: Water and Sanitation MDGs in the Middle East. Dev. Chang. 2011, 42, 1153–1178. [Google Scholar] [CrossRef] [PubMed]
- WHO/UNICEF JMP. Progress on Drinking Water, Sanitation and Hygiene. 2020. Available online: http://www.who.int/iris/handle/10665/258617 (accessed on 10 April 2020).
- Onda, K.; LoBuglio, J.; Bartram, J. Global Access to Safe Water: Accounting for Water Quality and the Resulting Impact on MDG Progress. Int. J. Environ. Res. Public Health 2012, 9, 880–894. [Google Scholar] [CrossRef]
- Satterthwaite, D. Missing the Millennium Development Goal targets for water and sanitation in urban areas. Environ. Urban. 2016, 28, 99–118. [Google Scholar] [CrossRef]
- White, G.F.; Bradley, D.J.; White, A.U. Drawers of water: Domestic water use in East Africa. Bulletin of the World. Bull. World Health Organ. 2002, 80, 63–73. [Google Scholar]
- Martins, R.; Quintal, C.; Antunes, M. Making ends meet: Actual versus potential joint affordability of utility services. Util. Policy 2019, 56, 120–126. [Google Scholar] [CrossRef]
- García-Valiñas, M.D.L.Á.; Martínez-Espiñeira, R.; González-Gómez, F. Measuring Water Affordability: A Proposal for Urban Centres in Developed Countries. Int. J. Water Resour. Dev. 2010, 26, 441–458. [Google Scholar] [CrossRef]
- García-Valiñas, M.A.; Martínez-Espiñeira, R.; González-Gómez, F. Affordability of residential water tariffs: Alternative measurement and explanatory factors in southern Spain. J. Environ. Manag. 2010, 91, 2696–2706. [Google Scholar] [CrossRef]
- Vanhille, J.; Goedemé, T.; Penne, T.; Van Thielen, L.; Storms, B. Measuring water affordability in developed economies. The added value of a needs-based approach. J. Environ. Manag. 2018, 217, 611–620. [Google Scholar] [CrossRef]
- Pattanayak, S.K.; Yang, J.-C.; Whittington, D.; Bal Kumar, K.C. Coping with unreliable public water supplies: Averting expenditures by households in Kathmandu, Nepal. Water Resour. Res. 2005, 41, W02012. [Google Scholar] [CrossRef] [Green Version]
- Nastiti, A.; Sudradjat, A.; Geerling, G.W.; Smits, A.J.M.; Roosmini, D.; Muntalif, B.S. The effect of physical accessibility and service level of water supply on economic accessibility: A case study of Bandung City, Indonesia. Water Int. 2017, 42, 831–851. [Google Scholar] [CrossRef]
- Komarulzaman, A. Water Affordability, Water Quality and Their Consequences for Health and Education in Indonesia. Ph.D. Dissertation, Radboud Repository of the Radboud University, Nijmegen, The Netherlands, 2017. [Google Scholar]
- Thompson, J. Drawers of Water II: 30 Years of Change in Domestic Water Use & Environmental Health in East Africa; International Institute for Environment and Development: London, UK, 2001; Volume 3. [Google Scholar]
- Gleick, P.H. Basic Water Requirements for Human Activities: Meeting Basic Needs. Water Int. 1996, 21, 83–92. [Google Scholar] [CrossRef]
- Sebri, M. Water affordability and social equity in Tunisian governorates: A distributive approach. Water Policy 2015, 17, 26–45. [Google Scholar] [CrossRef]
- Goedemé, T.; Vanhille, J. Water expenses by households living in Flanders: Data availability in the Belgian EU-SILC. Data Brief 2018, 20, 1568–1572. [Google Scholar] [CrossRef]
- Gleick, P.H. Water: The Potential Consequences of Climate Variability and Change for the Water Resources of the United States; Pacific Institute for Studies in Development, Environment, and Security: Oakland, CA, USA, 2000. [Google Scholar]
- Moore, E.; Matalon, E.; Balazs, C.; Clary, J.; Firestone, L.; de Anda, S.; Guzman, M. The Human Costs of Nitrate-Contaminated Drinking Water in the San Joaquin Valley; Pacific Institute: Oakland, CA, USA, 2011. [Google Scholar]
- Walter, C.T.; Kooy, M.; Prabaharyaka, I. The role of bottled drinking water in achieving SDG 6.1: An analysis of affordability and equity from Jakarta, Indonesia. J. Water Sanit. Hyg. Dev. 2017, 7, 642–650. [Google Scholar] [CrossRef]
- Amit, R.K.; Sasidharan, S. Measuring affordability of access to clean water: A coping cost approach. Resour. Conserv. Recycl. 2019, 141, 410–417. [Google Scholar] [CrossRef]
- Baquero, O.F.; Gallego-Ayala, J.; Giné-Garriga, R.; de Palencia, A.J.-F.; Pérez-Foguet, A. The Influence of the Human Rights to Water and Sanitation Normative Content in Measuring the Level of Service. Soc. Indic. Res. 2017, 133, 763–786. [Google Scholar] [CrossRef]
- Nganyanyuka, K.; Martinez, J.; Wesselink, A.; Lungo, J.H.; Georgiadou, Y. Accessing water services in Dar es Salaam: Are we counting what counts? Habitat Int. 2014, 44, 358–366. [Google Scholar] [CrossRef]
- Hart, K. Informal income opportunities and urban employment in Ghana. J. Mod. Afr. Stud. 1973, 11, 61–89. [Google Scholar] [CrossRef]
- Roy, A. Urban Informality: Toward and Epistemology of Planning. J. Am. Plan. Assoc. 2005, 71, 147–158. [Google Scholar] [CrossRef]
- Schwartz, K.; Tutusaus Luque, M.; Rusca, M.; Ahlers, R. (In) formality: The meshwork of water service provisioning. Wiley Interdiscip. Rev. Water 2015, 2, 31–36. [Google Scholar] [CrossRef]
- Bakker, K.J. A political ecology of water privatization. Stud. Political Econ. 2003, 70, 35–58. [Google Scholar] [CrossRef]
- Misra, K. From Formal-Informal to Emergent Formalisation: Fluidities in the Production of Urban Waterscapes. Water Altern. 2014, 7, 14–34. [Google Scholar] [CrossRef]
- Peloso, M.; Morinville, C. “Chasing for Water”: Everyday Practices of Water Access in Peri-Urban Ashaiman, Ghana. Water Altern. 2014, 7, 121–139. [Google Scholar]
- Jepson, W.; Vandewalle, E. Household Water Insecurity in the Global North: A Study of Rural and Periurban Settlements on the Texas–Mexico Border. Prof. Geogr. 2016, 68, 66–81. [Google Scholar] [CrossRef]
- Wutich, A.; Beresford, M.; Carvajal, C. Can Informal Water Vendors Deliver on the Promise of a Human Right to Water? Results from Cochabamba, Bolivia. World Dev. 2016, 79, 14–24. [Google Scholar] [CrossRef]
- Jepson, W.; Budds, J.; Eichelberger, L.; Harris, L.; Norman, E.; O’Reilly, K.; Pearson, A.; Shah, S.; Shinn, J.; Staddon, C.; et al. Advancing human capabilities for water security: A relational approach. Water Secur. 2017, 1, 46–52. [Google Scholar] [CrossRef]
- Young, S.L.; Collins, S.M.; Boateng, G.O.; Neilands, T.B.; Jamaluddine, Z.; Miller, J.D.; Brewis, A.A.; Frongillo, E.A.; Jepson, W.E.; Melgar-Quiñonez, H.; et al. Development and validation protocol for an instrument to measure household water insecurity across cultures and ecologies: The Household Water InSecurity Experiences (HWISE) Scale. BMJ Open 2019, 9, e023558. [Google Scholar] [CrossRef]
- Teodoro, M.P. Measuring Fairness: Assessing the equity of municipal water rates. J. Am. Water Work. Assoc. 2005, 97, 111–124. [Google Scholar] [CrossRef]
- Teodoro, M.P. Measuring Household Affordability for Water and Sewer Utilities: Measuring Household Affordability for Water and Sewer Utilities. J. Am. Water Work. Assoc. 2018, 110, 13–24. [Google Scholar] [CrossRef]
- Smets, H. Access to drinking water at an affordable price in developing countries. Options Méditerranéennes 2009, 88, 57–68. [Google Scholar]
- Zaatari, A. Housing Production in Uneven Urban Quarters: Two Case Studies from Beirut (Lebanon) Aicha Bakkar and Tallet El Khayyat. Master’s Thesis, American University of Beirut, Beirut, Lebanon, 2019. [Google Scholar]
- Haddad, S. The relevance of political trust in postwar Lebanon. Citizsh. Stud. 2002, 6, 201–218. [Google Scholar] [CrossRef]
- Etikan, I.; Musa, S.A.; Alkassim, R.S. Comparison of Convenience Sampling and Purposive Sampling. Am. J. Theor. Appl. Stat. 2016, 5, 1. [Google Scholar] [CrossRef]
- Rosenberg, D.E.; Tarawneh, T.; Abdel-Khaleq, R.; Lund, J.R. Modeling integrated water user decisions in intermittent supply systems: Integrated Water User Decisions. Water Resour. Res. 2007, 43, W07425. [Google Scholar] [CrossRef]
- InfoPro Research & Lebanon Opportunities. Median Range of Salaries—By Sector. 2020. Available online: http://www.opportunities.com.lb/Lebanon/Employment/EmplymentCenter_SALARIES.asp (accessed on 5 March 2020).
- Lebanon Salary: Average Salary Survey. 2020. Available online: https://www.averagesalarysurvey.com/lebanon (accessed on 5 March 2020).
- Jaafar, H.; Ahmad, F.; Holtmeier, L.; King-Okumu, C. Refugees, water balance, and water stress: Lessons learned from Lebanon. Ambio 2020, 49, 1179–1193. [Google Scholar] [CrossRef]
- Shaban, A. Water Resources of Lebanon; Springer: Berlin/Heidelberg, Germany, 2020. [Google Scholar]
- LA Times. Climate Change and Corruption Endanger an Ancient Valley in Lebanon. 2021. Available online: https://www.latimes.com/world-nation/story/2021-02-21/bisri-valley-water (accessed on 2 April 2021).
- El Asmar, H.; Beirut and Mount Lebanon Water Establishment, Beirut, Lebanon. Personal communication, 2021.
- Salary Explorer. Average Salary in Lebanon 2020. 2020. Available online: http://www.salaryexplorer.com/salary-survey.php?loc=119&loctype=1 (accessed on 5 March 2020).
- Maison des Français de l’Etranger. Marché du Travail. Available online: http://www.mfe.org/index.php/Portails-Pays/Liban/Emploi-stage/Marche-du-travail (accessed on 30 July 2021).
- Wada, Y.; van Beek, L.P.H.; Viviroli, D.; Dürr, H.H.; Weingartner, R.; Bierkens, M.F.P. Global monthly water stress: 2. Water demand and severity of water stress: Global Monthly Water Stress, 2. Water Resour. Res. 2011, 47, W07518. [Google Scholar] [CrossRef]
- Ministry of Public Health (MOPH). List of Bottled Water Permitted by MOPH. 2020. Available online: https://www.moph.gov.lb/en/Pages/4/3365/list-of-bottled-water-permitted-by-moph (accessed on 13 May 2020).
- Moser, C.O. Informal sector or petty commodity production: Dualism or dependence in urban development? World Dev. 1978, 6, 1041–1064. [Google Scholar] [CrossRef]
- AlSayyad, N. Urban Informality as a ‘New’ Way of Life. Urban Informality: Transnational Perspectives from the Middle East, Latin America, and South Asia; Lexington Books: Lanham, MD, USA, 2004; pp. 7–30. [Google Scholar]
- Revell, K. Working with informality: Increasing resilience in cities of the Global South. In Proceedings of the 46th ISOCARP Congress, Nairobi, Kenya, 19–23 September 2010. [Google Scholar]
- Ranganathan, M. “Mafias” in the Waterscape: Urban Informality and Everyday Public Authority in Bangalore. Water Altern. 2014, 7, 89–105. [Google Scholar]
- Ahlers, R.; Perez Güida, V.; Rusca, M.; Schwartz, K. Unleashing Entrepreneurs or Controlling Unruly Providers? The Formalisation of Small-scale Water Providers in Greater Maputo, Mozambique. J. Dev. Stud. 2013, 49, 470–482. [Google Scholar] [CrossRef]
- Hoayek, S.; Ministry of Energy and Water, Beirut, Lebanon. Personal communication, 2019.
- Eaux de Beyrouth et du Mont-Liban (EBML). 2021. Available online: https://ebml.gov.lb/projects.php?lang=en (accessed on 1 March 2021).
- El-Fadel, M.; Maroun, R.; Semerjian, L.; Harajli, H. A health-based socio-economic assessment of drinking water quality: The case of Lebanon. Manag. Env Qual. 2003, 14, 353–368. [Google Scholar] [CrossRef]
- Alameddine, I.; Tarhini, R.; El-Fadel, M. Household economic burden from seawater intrusion in coastal urban areas. Water Int. 2018, 43, 217–236. [Google Scholar] [CrossRef]
- Riachi, R. The Private Modes of Water Capture in Lebanon; International Alert: London, UK, 2015; pp. 39–45. [Google Scholar]
- Bond, P. Water commodification and decommodification narratives: Pricing and policy debates from Johannesburg to Kyoto to Cancun and back. Capital. Nat. Soc. 2004, 15, 7–25. [Google Scholar] [CrossRef]
- Constantine, K.; Massoud, M.; Alameddine, I.; El-Fadel, M. The role of the water tankers market in water stressed semi-arid urban areas: Implications on water quality and economic burden. J. Environ. Manag. 2017, 188, 85–94. [Google Scholar] [CrossRef] [PubMed]
- Bakker, K.; Kooy, M.; Shofiani, N.E.; Martijn, E.J. Governance failure: Rethinking the institutional dimensions of urban water supply to poor households. World Dev. 2008, 36, 1891–1915. [Google Scholar] [CrossRef]
- Hussein, H.; Natta, A.; Yehya, A.A.K.; Hamadna, B. Syrian refugees, water scarcity, and dynamic policies: How do the new refugee discourses impact water governance debates in Lebanon and Jordan? Water 2020, 12, 325. [Google Scholar] [CrossRef]
- Vanderwarker, A. Water and environmental justice. In A Twenty-First Century US Water Policy; Christian-Smith, J., Gleick, P.H., Cooley, H., Allen, L., Vanderwarker, A., Berry, K.A., Eds.; Oxford University Press: New York, NY, USA, 2012; pp. 52–90. [Google Scholar]
- Palaniappan, M.; Lee, E.; Samulon, A. Environmental justice and water. In The World’s Water, 2006–2007 the Biennial Report on Freshwater Resources; Gleick, P.H., Wolff, G.H., Cooley, H., Palaniappan, M., Samulon, A., Lee, E., Morrison, J., Katz, D., Eds.; Island Press: Washington, DC, USA, 2006; pp. 117–144. [Google Scholar]
- London, J.K.; Fencl, A.L.; Watterson, S.; Choueiri, Y.; Seaton, P.; Jarin, J.; Dawson, M.; Aranda, A.; King, A.; Nguyen, P.; et al. Disadvantaged unincorporated communities and the struggle for water justice in California. Water Altern. 2021, 14, 520–545. [Google Scholar]
- Balazs, C.L.; Ray, I. The drinking water disparities framework: On the origins and persistence of inequities in exposure. Am. J. Public Health 2014, 104, 603–611. [Google Scholar] [CrossRef]
Figure 1.
Location of two income communities. Source: first author.

Figure 2.
Schematic water distribution system in Beirut, Lebanon. Source: first author.

Figure 3.
Water supply at different scales: building and household scales. Source: first author.

Figure 4.
Household monthly income distribution by community (in thousands of USD).

Figure 5.
Volume by water source (L/Person/Day).

Figure 6.
Household water costs by source, including delivered volume (USD/Person/Day).

Figure 7.
Formal piped system and actual water costs for total sample population and individual communities (USD/Household/Year).
Figure 7.
Formal piped system and actual water costs for total sample population and individual communities (USD/Household/Year).

Figure 8.
Ordered distribution of affordability ratios crossing four affordability levels.


Table 1.
Average supply volumes (L/Person/Day).
| Winter Volume | Summer Volume | |
|---|---|---|
| Formal Piped Water | 114 | 69 |
| Bottled Water | 2 | 2 |
| Tankers | 2 | 48 |
| Wells | 11 | 24 |
| Total Volume | 129 | 143 |
Table 2.
Water supply differences by source for Aicha Bakkar and Verdun communities (L/Person/Day).
| Aicha Bakkar | Verdun | |
|---|---|---|
| Formal Piped Water | 99 | 99 |
| Bottled Water | 2 | 2 |
| Tankers | 19 | 7 |
| Wells | 8 | 21 |
| Total Volume | 128 | 130 |
Table 3.
Cost breakdown per source of 1 L of water (USD/L).
| Average Unit Cost (USD/L) | |
|---|---|
| Formal Piped Water | 0.0017 |
| Bottled Water | 0.5238 |
| Tankers | 0.0045 |
| Wells | 0.0010 |
Table 4.
Percentage of households within each (un)affordability bracket threshold.
| Affordability Threshold: Income-to-Cost Ratios | Aicha Bakkar Percentage of Households | Verdun Percentage of Households |
|---|---|---|
| Water is Highly Unaffordable Above 10% | 18% | 8% |
| Water is Unaffordable Between 10% and 5% | 37% | 21% |
| Water is Moderately Affordable Between 5% and 3% | 27% | 26% |
| Water is Affordable Less than 3% | 18% | 45% |
Table 5.
Differences of supply costs per sources for both communities.
| Aicha Bakkar | Verdun | |||||
|---|---|---|---|---|---|---|
| Total Cost of per Person * USD/person/year | % of Cost per Source | Cost per Liter USD/L | Total Cost of per Person * USD/person/year | % of Cost per Source | Cost per Liter USD/L | |
| Formal Piped Water | 53 | 13% | 0.0015 | 71 | 12% | 0.0020 |
| Bottled Water | 324 | 79% | 0.4352 ** | 507 | 84% | 0.6004 ** |
| Tankers | 33 ** | 8% | 0.0048 | 9 ** | 2% | 0.0036 |
| Wells | 1 ** | 0.2% | 0.0002 | 10 ** | 2% | 0.0047 |
| Additional Pumping Costs | 2 | 0.4% | 0.0000 | 3 | 1% | 0.0000 |
| Total | 412 | 600 | ||||
* Taking into account yearly supply. ** statistical significance difference between communities (p = 0.05, t-test results).
Publisher’s Note: MDPI stays neutral with regard to jurisdictional claims in published maps and institutional affiliations. |
© 2022 by the authors. Licensee MDPI, Basel, Switzerland. This article is an open access article distributed under the terms and conditions of the Creative Commons Attribution (CC BY) license (https://creativecommons.org/licenses/by/4.0/).
Share and Cite
MDPI and ACS Style
Choueiri, Y.; Lund, J.; London, J.K.; Spang, E.S. (Un)Affordability of Informal Water Systems: Disparities in a Comparative Case Study in Beirut, Lebanon. Water 2022, 14, 2713. https://doi.org/10.3390/w14172713
AMA Style
Choueiri Y, Lund J, London JK, Spang ES. (Un)Affordability of Informal Water Systems: Disparities in a Comparative Case Study in Beirut, Lebanon. Water. 2022; 14(17):2713. https://doi.org/10.3390/w14172713
Chicago/Turabian StyleChoueiri, Yasmina, Jay Lund, Jonathan K. London, and Edward S. Spang. 2022. "(Un)Affordability of Informal Water Systems: Disparities in a Comparative Case Study in Beirut, Lebanon" Water 14, no. 17: 2713. https://doi.org/10.3390/w14172713
Note that from the first issue of 2016, this journal uses article numbers instead of page numbers. See further details here.