
Thermal Sensitivity of High Mountain Lakes: The Role of Morphometry and Topography (The Tatra Mts., Poland)

Institute of Earth Sciences, University of Silesia in Katowice, Będzińska Str. 60, 41-200 Sosnowiec, Poland
*
Author to whom correspondence should be addressed.
Water 2022, 14(17), 2704; https://doi.org/10.3390/w14172704
Submission received: 12 July 2022
/
Revised: 19 August 2022
/
Accepted: 24 August 2022
/
Published: 30 August 2022
(This article belongs to the Special Issue Lakes Function in Climate Change: Sentinels, Ecological Responses, and Integrators)
Abstract
:This study presents the results of a 5-year monitoring program of ice cover, water temperature, and local meteorological conditions carried out in three reference lakes in the periglacial zone of the Polish Tatra Mountains. On the basis of this information, the relationships between the weighted mean water temperature of each of these lakes and the air temperature, wind speed, precipitation, and ice–snow cover in the summer, spring, and autumn seasons, as well as year-round, were described, and the roles of the morphometry of lakes and the topography of their catchments were determined. It was found that the sensitivity of the lakes to climate warming increased with a decrease in their area/depth and shade, and with an increase in altitude and the share of wind-blown snow in the formation of the ice–snow cover. An increase in the mean annual air temperature does not necessarily translate into the warming of lakes, but, paradoxically, may result in their cooling. The current climate may not be best reflected by the most sensitive lakes, but rather by the largest ones located in the subalpine zone.
1. Introduction
Glacial lakes are common in high mountains. Being open, complex, and dynamic systems characterised by the circulation of mass and the energy inherent in it, they both respond to external stimuli and impact the environment (e.g., water conditions and local climate). Most high-mountain lakes in the temperate zone freeze seasonally [1]. Even slight changes in air temperatures in the annual cycle are likely to result in changes in the thickness and duration of the ice cover [2,3]. Ice cover, in turn, by preventing the mixing of water by wind, changing the oxygen and lighting conditions, and limiting the exchange of heat between the atmosphere and the lake, influences the physical, chemical, and biological processes that shape the ecosystems of lakes [4,5,6,7,8,9,10,11,12,13].
Modern climate change (IPCC, 2021) leads to changes in the water temperature in lakes, causing lakes to freeze later, reduces the maximum thickness of ice cover, and causes ice to melt earlier [2,14,15,16,17,18,19,20,21,22]. While the ice-off timing depends primarily on weather conditions, the freezing process is largely determined by the lake morphometry [23], with the duration of ice cover also dependent on the topography of the catchment area [24,25]. This translates into highly ‘individualised’ ice phenomena on high-mountain lakes [2,26,27,28,29,30,31,32,33,34]. In this context, the climate–snow and ice cover–lake thermals relationship during extraordinarily wet and dry seasons may be significant [35,36].
The earliest water temperature measurements and observations of lake ice formation in the Tatra Mountains were carried out in 1804 [37]. The earliest thermal classifications of all lakes were proposed in the first half of the 20th century [38,39]. The local conditions behind the intra-annual lake oxygenation processes were also identified [40]. In the shore area of the lake with the largest area (Morskie Oko), where a permanent post of the Institute of Meteorology and Water Management operates, daily measurements of surface water temperature and the ice cover thickness have been systematically taken since 1971 [41]. During 2006–2010, the monitoring of water temperature profiles [42,43], and during 2006–2012, areal monitoring of ice thickness [44] and its internal structure [45] were carried out. However, year-round and simultaneous temperature measurements for a larger group of lakes were only taken in the years of 2000–2001 [24] and 2010–2011 [25]. They took into account the morphometry of the features investigated, and in the latter case, the potential irradiation controlled by the topography. However, the monitoring of water temperature was limited to the surface layer. Over the above timespans, no measurements of ice–snow cover and no local meteorological measurements were carried out. Therefore, during 2014–2019, we conducted comprehensive research into the variability and conditions of the thermal dynamics of three lakes in the Dolina Pięciu Stawów Polskich valley. According to the latest classification in terms of the duration of their ice cover, the lakes represent different classes [33]: medium–large, insolated lakes situated in the upper section of the subalpine zone and in the lower section of the alpine zone, and unclassified lakes (not similar to other ones).
Owing to the difficult terrain, climate conditions, and the risk of snow avalanches, the availability of a multi-year continuous data series of thermal processes and ice formation in high-mountain lakes is still limited. Meanwhile, such data are essential for understanding how mountain lakes respond to climate warming. In order to garner such an understanding, it is necessary to determine how lake size and morphology mediate the relations between climate variation and thermal dynamics in lakes [35,36]. The aim of our research was to evaluate (a) the multiannual variability in the thermal dynamics and (b) the ice cover of the lakes in the periglacial zone of the Tatra Mountains in combination with (c) the local meteorological factors, and to determine (d) the role of the morphometry of lakes and (e) the topography of their catchment areas in the shaping of the thermal sensitivity of lakes. The observed regularities may be helpful in projecting the impact of further climate change on high-mountain lake ecosystems.
2. Study Area
The Dolina Pięciu Stawów Polskich valley is located in the High Tatras, which is the highest mountain range of the Carpathians (Central Europe). The Tatras cover an area of approximately 790 km2 [46], about 22% of which lies in Poland, and the rest in Slovakia (Figure 1).
The contemporary climate of the Tatra Mountains is transitional between maritime and continental [47]. The mean annual air temperature decreases with the altitude from about 6 °C at an altitude of 850 m a.s.l. on the northern side of the Tatra Mountains, to <−2 °C on the highest reaches of the mountains [48]. The average annual precipitation ranges from 1000 mm at the foot of the northern slopes to 2000 mm in the peak areas, and the number of days with snow ranges from 80 to >210 [49,50]. Since the mid-twentieth century, the Tatra Mountains have observed an increase in air temperature, mainly in winter, with a simultaneous decrease in the annual snowfall totals [51,52]. The maximum thickness and duration of the snow cover [53] and the ice cover of the lakes [33,54] have also decreased. In 2015–2017, the Tatra lakes, with an area of >1 ha, were ice-covered for 122 to 235 days. In those years, the average number of days with the lakes covered by ice was 174 [33].
The lakes in the Dolina Pięciu Stawów Polskich valley are of glacial origin (tarn lakes). They are located above the upper tree line, where the environment has periglacial features [55]. This research involved activity on three lakes: Przedni Staw, Wielki Staw, and Zadni Staw (Figure 1). The first and last of the lakes have similar areas (7.8 and 7.1 ha, respectively) and volumes (1,130,000 and 918,400 m3, respectively). However, they are located at different altitudes (1668 and 1890 m a.s.l.) and they differ significantly in terms of the insolation of the catchment area. In contrast, Wielki Staw is situated in the immediate vicinity of Przedni Staw. However, its area is approx. 34.5 ha and its volume is as much as 12,967,000 m3 (Figure 1 and Table 1).
3. Data and Methods
3.1. Meteorological Data
The meteorological data were downloaded from the online database of the Institute of Meteorology and Water Management (IMGW): https://danepubliczne.imgw.pl (accessed on 12 July 2022). They comprised the mean daily air temperatures, wind speed and direction, and the daily amount of precipitation and cloud cover from December 2014 to November 2019 at the weather station in the Dolina Pięciu Stawów Polskich valley. The station is located near Przedni Staw (Figure 1), at an altitude of 1674 m a.s.l. Its horizontal distance from the lakes under investigation ranged from 100 m (Przedni Staw) to 2500 m (Zadni Staw), with altitudinal differences from 6 m to 216 m, respectively. Based on the data retrieved, the mean monthly and seasonal air temperatures, wind speed, as well as monthly precipitation totals and positive degree days were calculated.
3.2. Cartometric Methods
In the study, a digital elevation model (DEM) of the Tatras with a resolution of 1 × 1 m and the vector layer of lakes (shapefile) of the digital map of the hydrographic division of Poland were used [56]. On this basis, using the ArcGIS v. 10.5 software, the following were determined: the area, volume, maximum and average depth, length and width, altitude at the lake surface, and daily values of potential incoming solar radiation (PISR)—solar energy expressed in Watt-hours per square meter that could reach the areas from each sky direction in a given time [57]. Moreover, the areas of all the catchments were measured, including their highest and lowest elevations of terrain features and the exposure of their slopes. On the basis of cartometric data, the lake openness index (Lo), mean effective length (Le), mean inclination of the lake catchment (Binc), and Schindler’s ratio (RSchindler) were calculated [58,59,60]:
where Hmean—mean lake depth and Al—lake area.
where L—lake length (fetch) and W—lake width (maximum distance perpendicular to L).
where ΔH—altitude difference of lake catchment and Ac—lake catchment area.
where Al—lake area, Ac—lake catchment area, and V—lake volume.
Lo = Al/Hmean
Le = (L + W)/2
Binc = ΔH/√Ac
RSchindler = (Al + Ac)/V
3.3. Measurements and Processing of Field Data
Each month in the period from January 2015 to November 2019, the water temperature was measured across the vertical profiles of the studies lakes (Figure 1), and in the seasons with ice cover, the thickness of the latter was measured, separately for the snow, ice, and slush layers. The measurements were taken at fixed locations determined using a GPS receiver.
The water temperature was measured every 1 m to a depth of 10 m, then every 2 m to a depth of 20 m, and then every 5 m. In each case, the water temperature at the bottom was measured. The measurements were performed with the use of an 80 m-long temperature probe with a PP-100-80000 (RS401) resistance sensor and a Delta OHM (type HD 2107.1) meter. The instrument accuracy as determined through calibration by Czak Sp. J. (Katowice, Poland) was 0.2 °C and the instrument resolution was 0.01 °C. In the winter, holes in the ice cover were created with a MORA ICE Pro 120.8” hand drill, and a snow gauge with a 1 cm scale was used to measure the ice and snow thickness.
The results of the water temperature measurements for the individual lakes were visualised in two-dimensional profiles. In addition, on their basis, the values of the weighted mean temperature of water in the vertical measurement profiles and the index of thermal stratification of water (μ) were calculated [61]. The μ index is a numerical parameter that determines the degree of thermal stratification of lake water during the year:
where MWT—weighted mean temperature of water along the vertical profile and LSWT—lake surface water temperature to a depth of 1 m.
μ = MWT/LSWT
Values of μ equal to, lower, or greater than 1 indicate homeothermy, or summer or winter thermal stratification, respectively.
3.4. Remote Sensing Methods
The ice-on and ice-off timing of the study lakes in the successive seasons of 2014–2017 were taken from the work of Gądek et al. [33]. They were determined based on the analysis of Sentinel-2 and Landsat-8 satellite imagery, the colour compositions of which, with a resolution of 10 to 30 m, were retrieved from: https://apps.sentinel-hub.com (accessed on 12 July 2022) and https://earthexplorer.usgs.gov (accessed on 12 July 2022), and the analysis of footage recorded by the camera of the Tatra Mountains National Park located in the immediate vicinity of Przedni Staw was also helpful. Analogous data for 2018–2019 were collected based on direct field observations.
3.5. Statistical Methods
In order to identify the climatic sensitivity of the lakes being investigated, the statistical relationships between the temperature of their water, the ice–snow cover thickness on the measurement day, and the air temperature, wind speed, PISR and precipitation in the preceding monthly periods were examined. Using the Statistica 13 software, the normality assumption of the collected data (the normal distribution) was checked, and their maximum, minimum, and arithmetic mean values were determined. Following this, the values of Pearson’s correlation coefficients along with their statistical significances were calculated. On this basis, the variables that best explained the weighted mean temperature of the lakes (significance α ≤ 0.05) were selected, and multiple linear regression equations were developed using the least-squares method. In each case, the level of statistical significance (p), the correlation coefficient (r), the standard error (σ), and the adjusted R-squared (adj R2) were calculated. The latter parameter provides information about the extent to which the statistical model explains the variability in the dependent variable adjusted for the number of independent variables used. Selected regression models were distinguished by: (i) high statistical significance and adj R2, (ii) simplicity, and (iii) the possibility of their explanation by physical processes.
4. Results
4.1. Meteorological Conditions
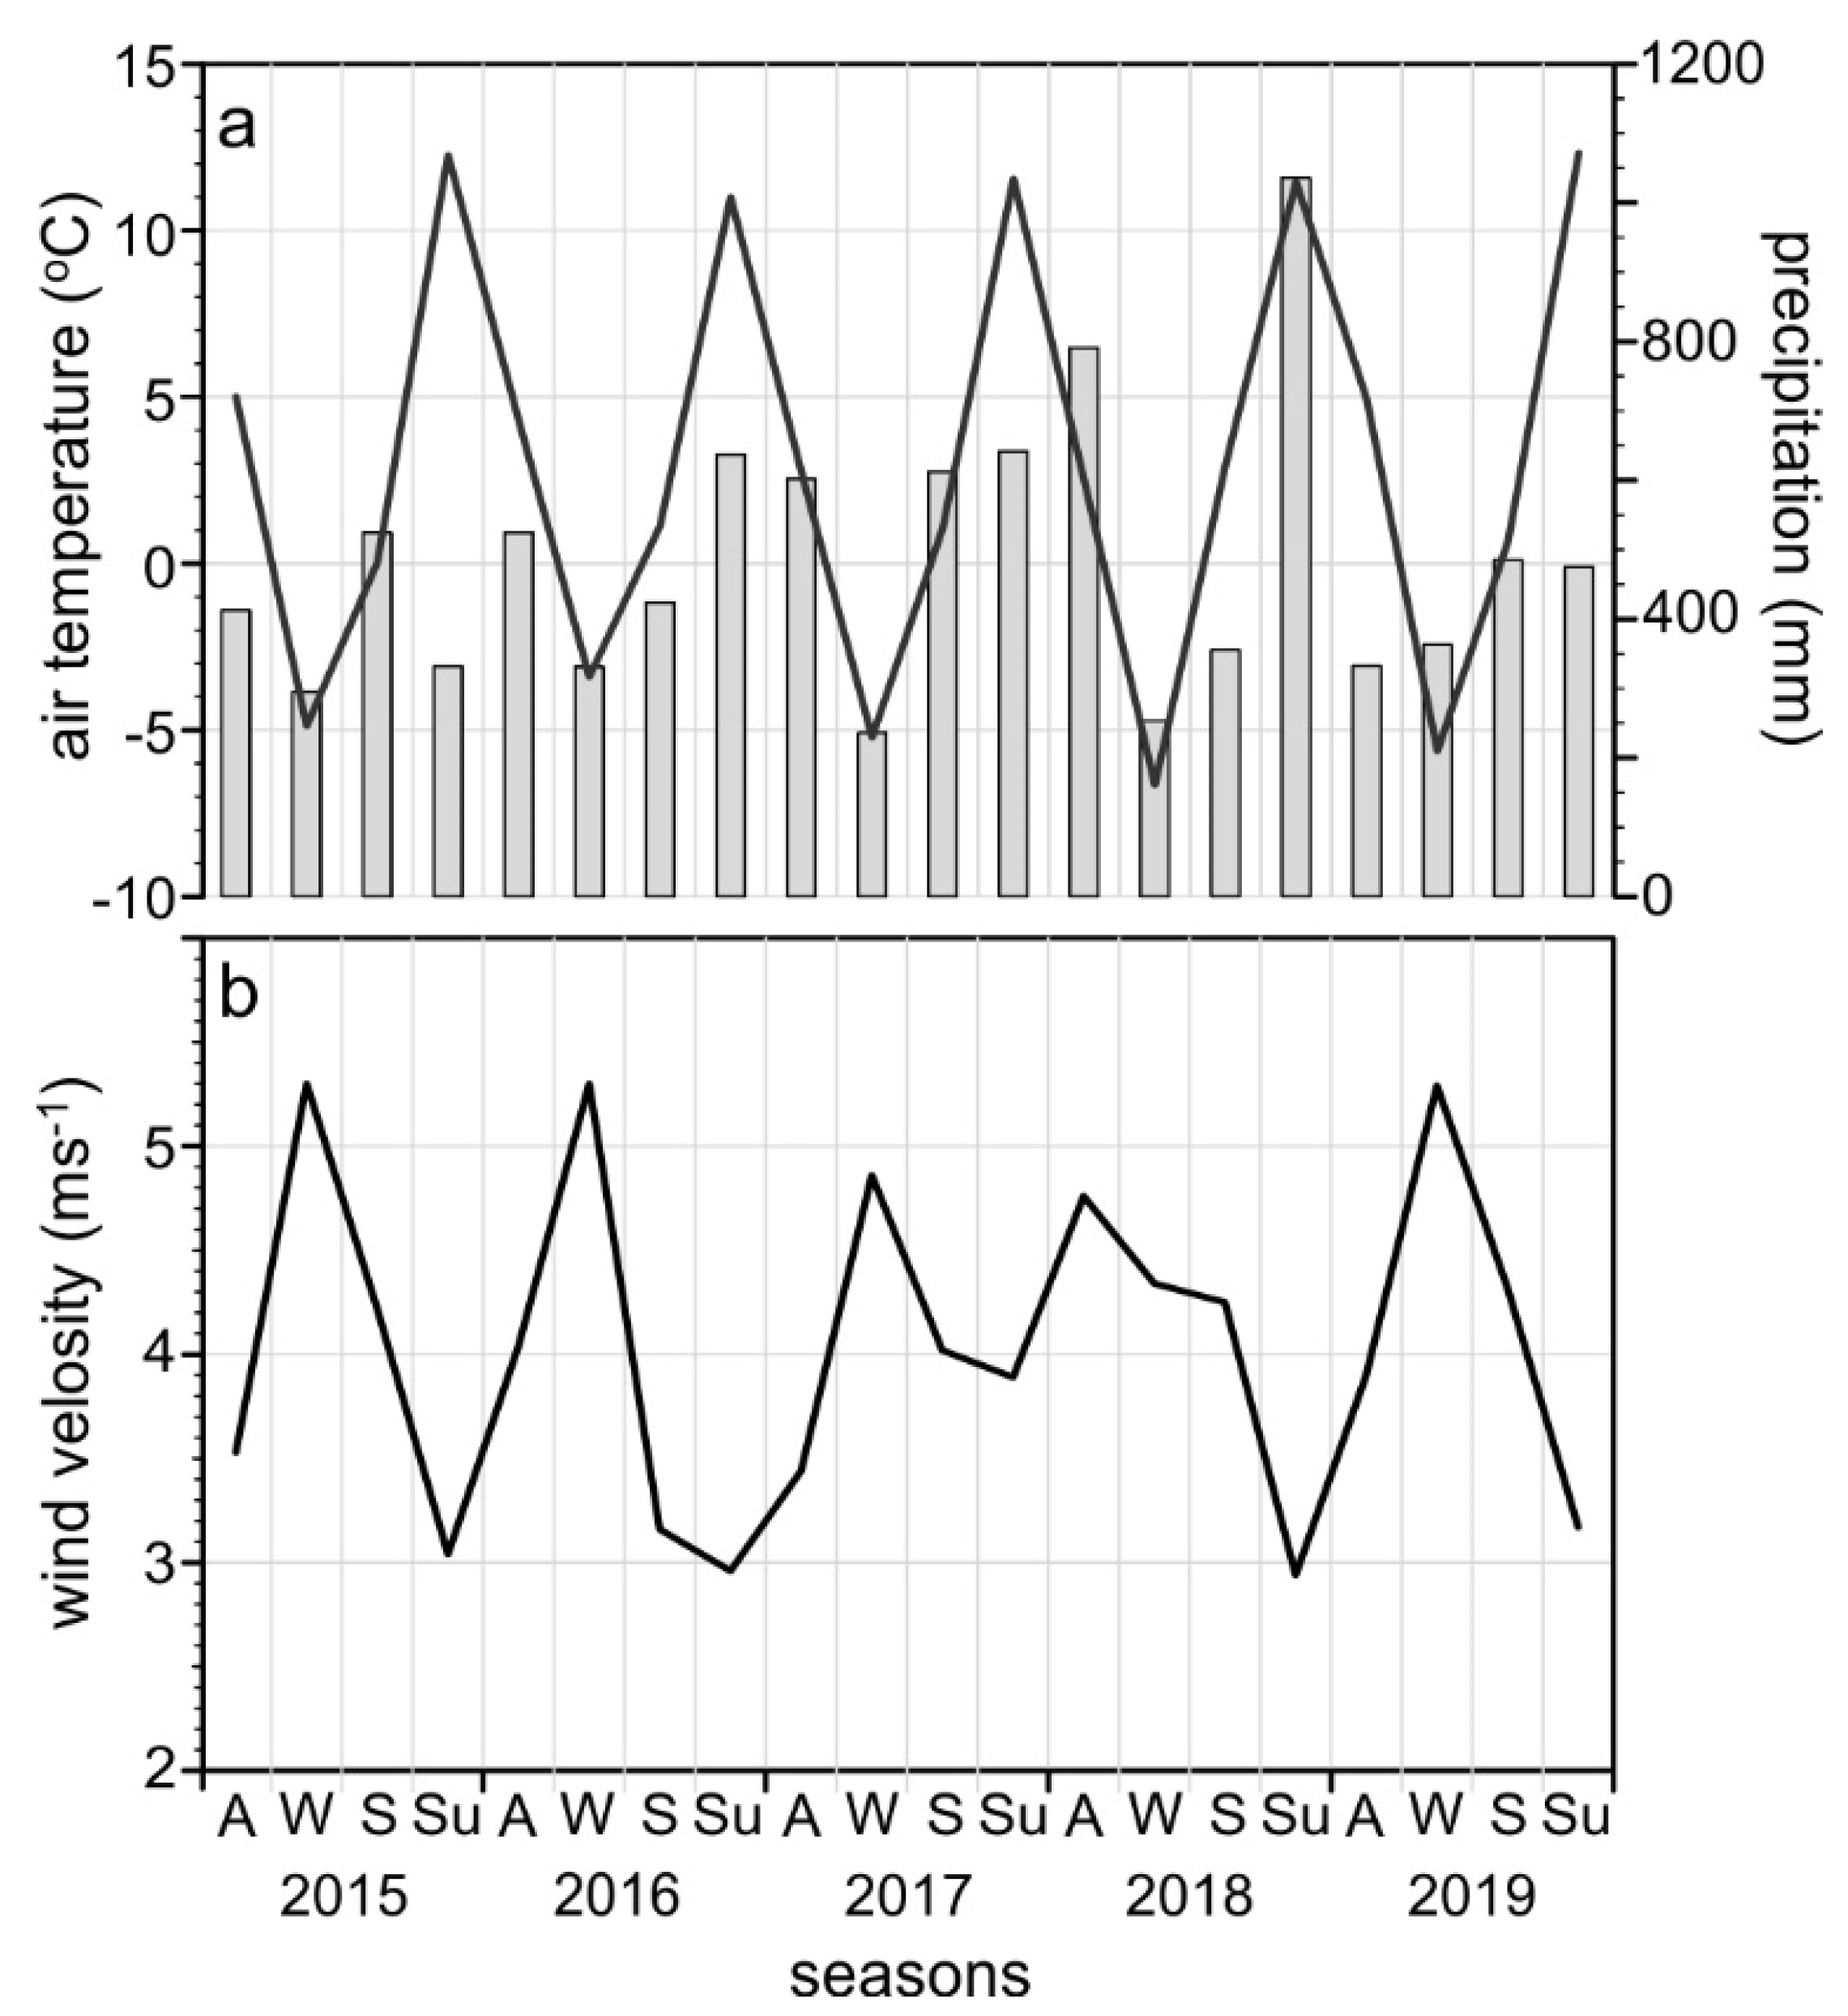
The variability in the mean air temperature, total precipitation, and mean wind speed in the autumns (September–November), winters (December–February), springs (March–May), and summers (June–August) of 2014–2019 in the Dolina Pięciu Stawów Polskich valley are shown in Figure 2.
In the seasons preceding the formation of continuous ice cover on the lakes, the coldest conditions were observable in the autumns of 2017 and 2016, where the mean air temperatures were 2.5 °C and 2.8 °C, respectively. Meanwhile, the warmest conditions were recorded in the autumn of 2014 (5.0 °C). In the winter seasons, the mean air temperatures ranged from −6.7 °C (2017/2018) to −3.4 °C (2015/2016). In the remaining seasons, it varied from 0.04 °C (2015) to 2.9 °C (2018) in the spring and from 11.0 °C (2016) to 12.3 °C (2019) in the summer.
The total autumn precipitation ranged from 332.5 mm (2018) to 790.8 mm (2017). The winter season of 2016/2017 (236.2 mm) had the least snow, while the highest snowfall total was recorded in the winter of 2018/2019 (363 mm). Meanwhile, in spring, the lowest amounts of precipitation were observed in 2018 (355.4 mm), and the highest in 2017 (612.3 mm). In the summer seasons, the precipitation totals varied from 331.9 mm (2015) to 1036.0 mm (2018).
During 2014–2019, there was a prevalence of southerly winds, most often from the south-west and south, and less frequently from the south-east. The average wind speed in the autumn and winter seasons ranged from 3.4 m s−1 (autumn of 2016) to 5.3 m s−1 (winter 2014/2015). In the spring and summer, the wind speed ranged from 2.9 m s−1 to 4.3 m s−1.
4.2. Morphometry of the Lakes and of Their Catchments
The morphometric features of the investigated lakes and their catchments are presented in Table 1. Wielki Staw stands out among the lakes included in the research, since its area and volume are many times greater, and its depth, the openness index (Lo), and the effective length (Le) are twice as large as those of Przedni Staw and Zadni Staw. In turn, Zadni Staw is situated about 200 m higher than the other two lakes.
The studied lakes clearly differed in terms of the characteristics of their catchment areas. The catchment area of Wielki Staw is the largest and the least inclined of all. Przedni Staw has the steepest and most shaded catchment area, which has the greatest impact on the reservoir (the highest RSchindler value). In contrast, the catchment area of Zadni Staw is the smallest and most irradiated one.
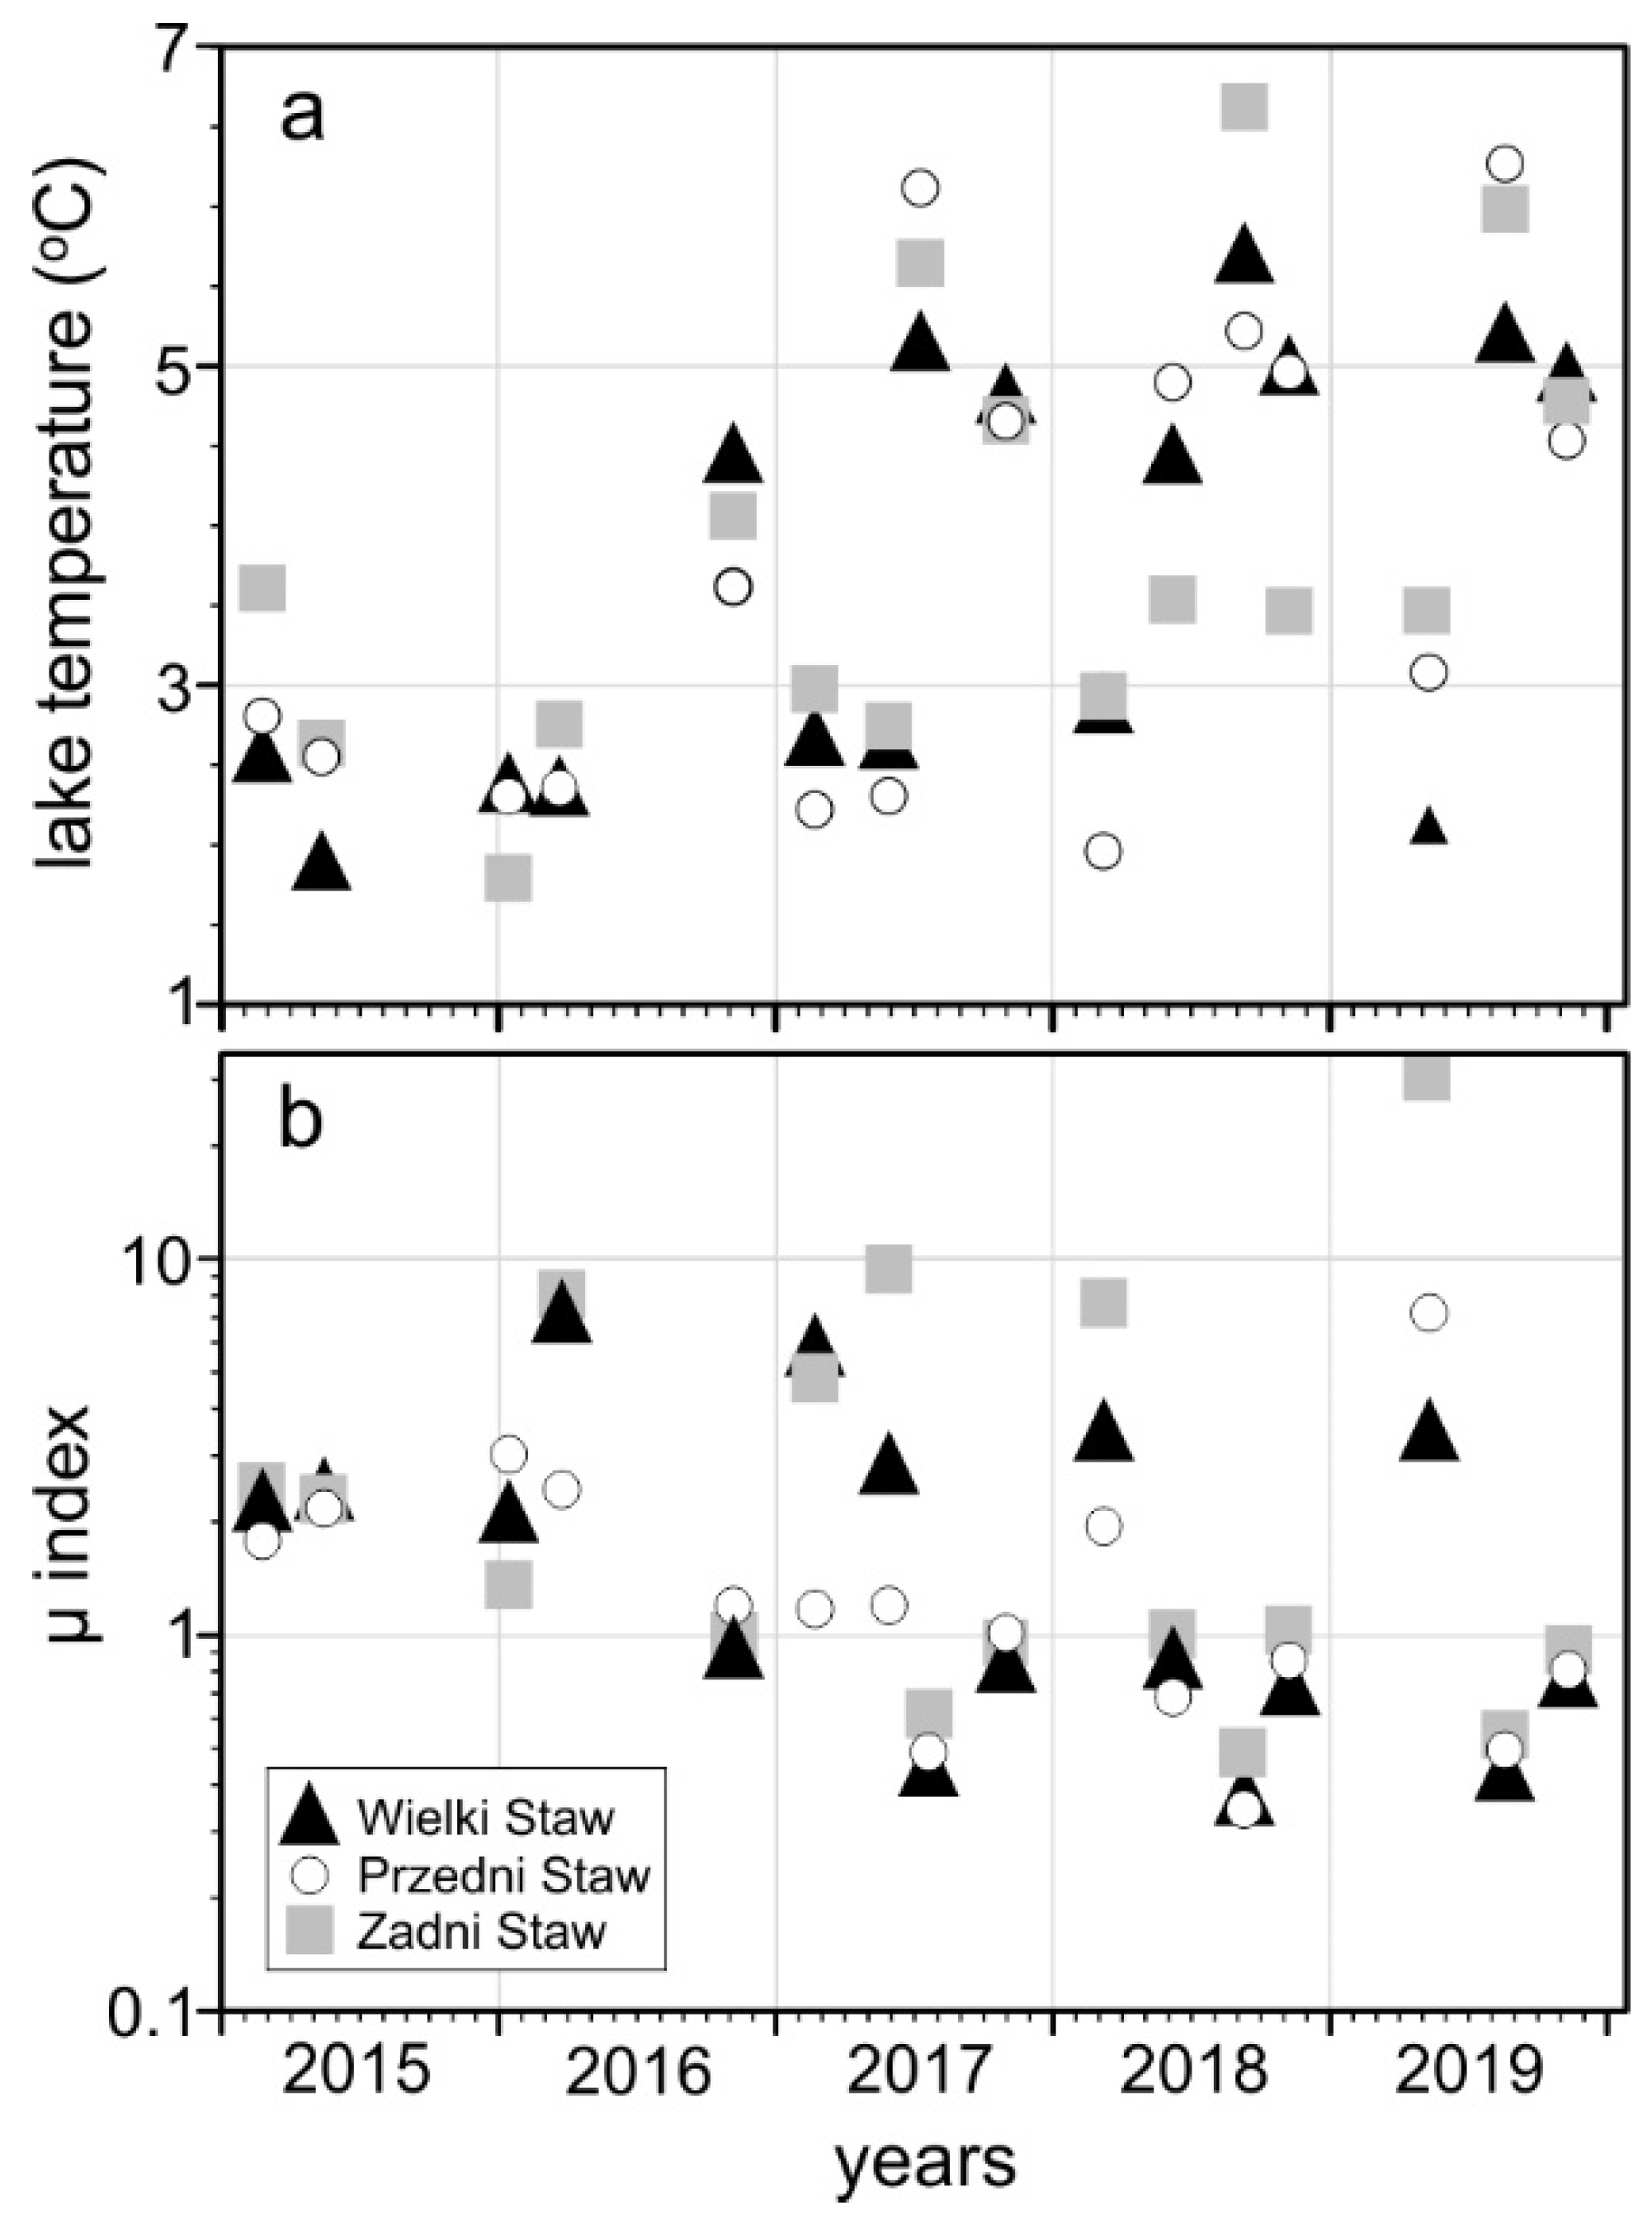
4.3. The Thermal Dynamics of the Lakes
The key results of the monitoring of the thermal dynamics of the lakes in the Dolina Pięciu Stawów Polskich valley are presented in Figure 3. The waters of the studied reservoirs were only heated for 3–3.5 months a year. The waters were the warmest in the last week of August or the first week of September. The maximum values of the weighted mean temperature of the water were 5.7 °C in Wielki Staw (August 2018), 6.4 °C in Przedni Staw (September 2019), and 6.9 °C in Zadni Staw (September 2019). The lowest values of the weighted mean temperature of their water were recorded at the turn of March and April, and were 1.9 °C in Wielki Staw (April 2015), 2.0 °C in Przedni Staw (March 2018), and 2.5 °C (March 2017) in Zadni Staw (Figure 3a).
The maximum differences in the weighted mean temperature of the water in successive autumn and spring seasons were as follows: 2.6 °C in Wielki Staw, 2.6 °C in Przedni Staw, and 0.9 °C in Zadni Staw.
Over the study period, an increase in the weighted mean temperature of the water was recorded, both in the autumn and spring seasons
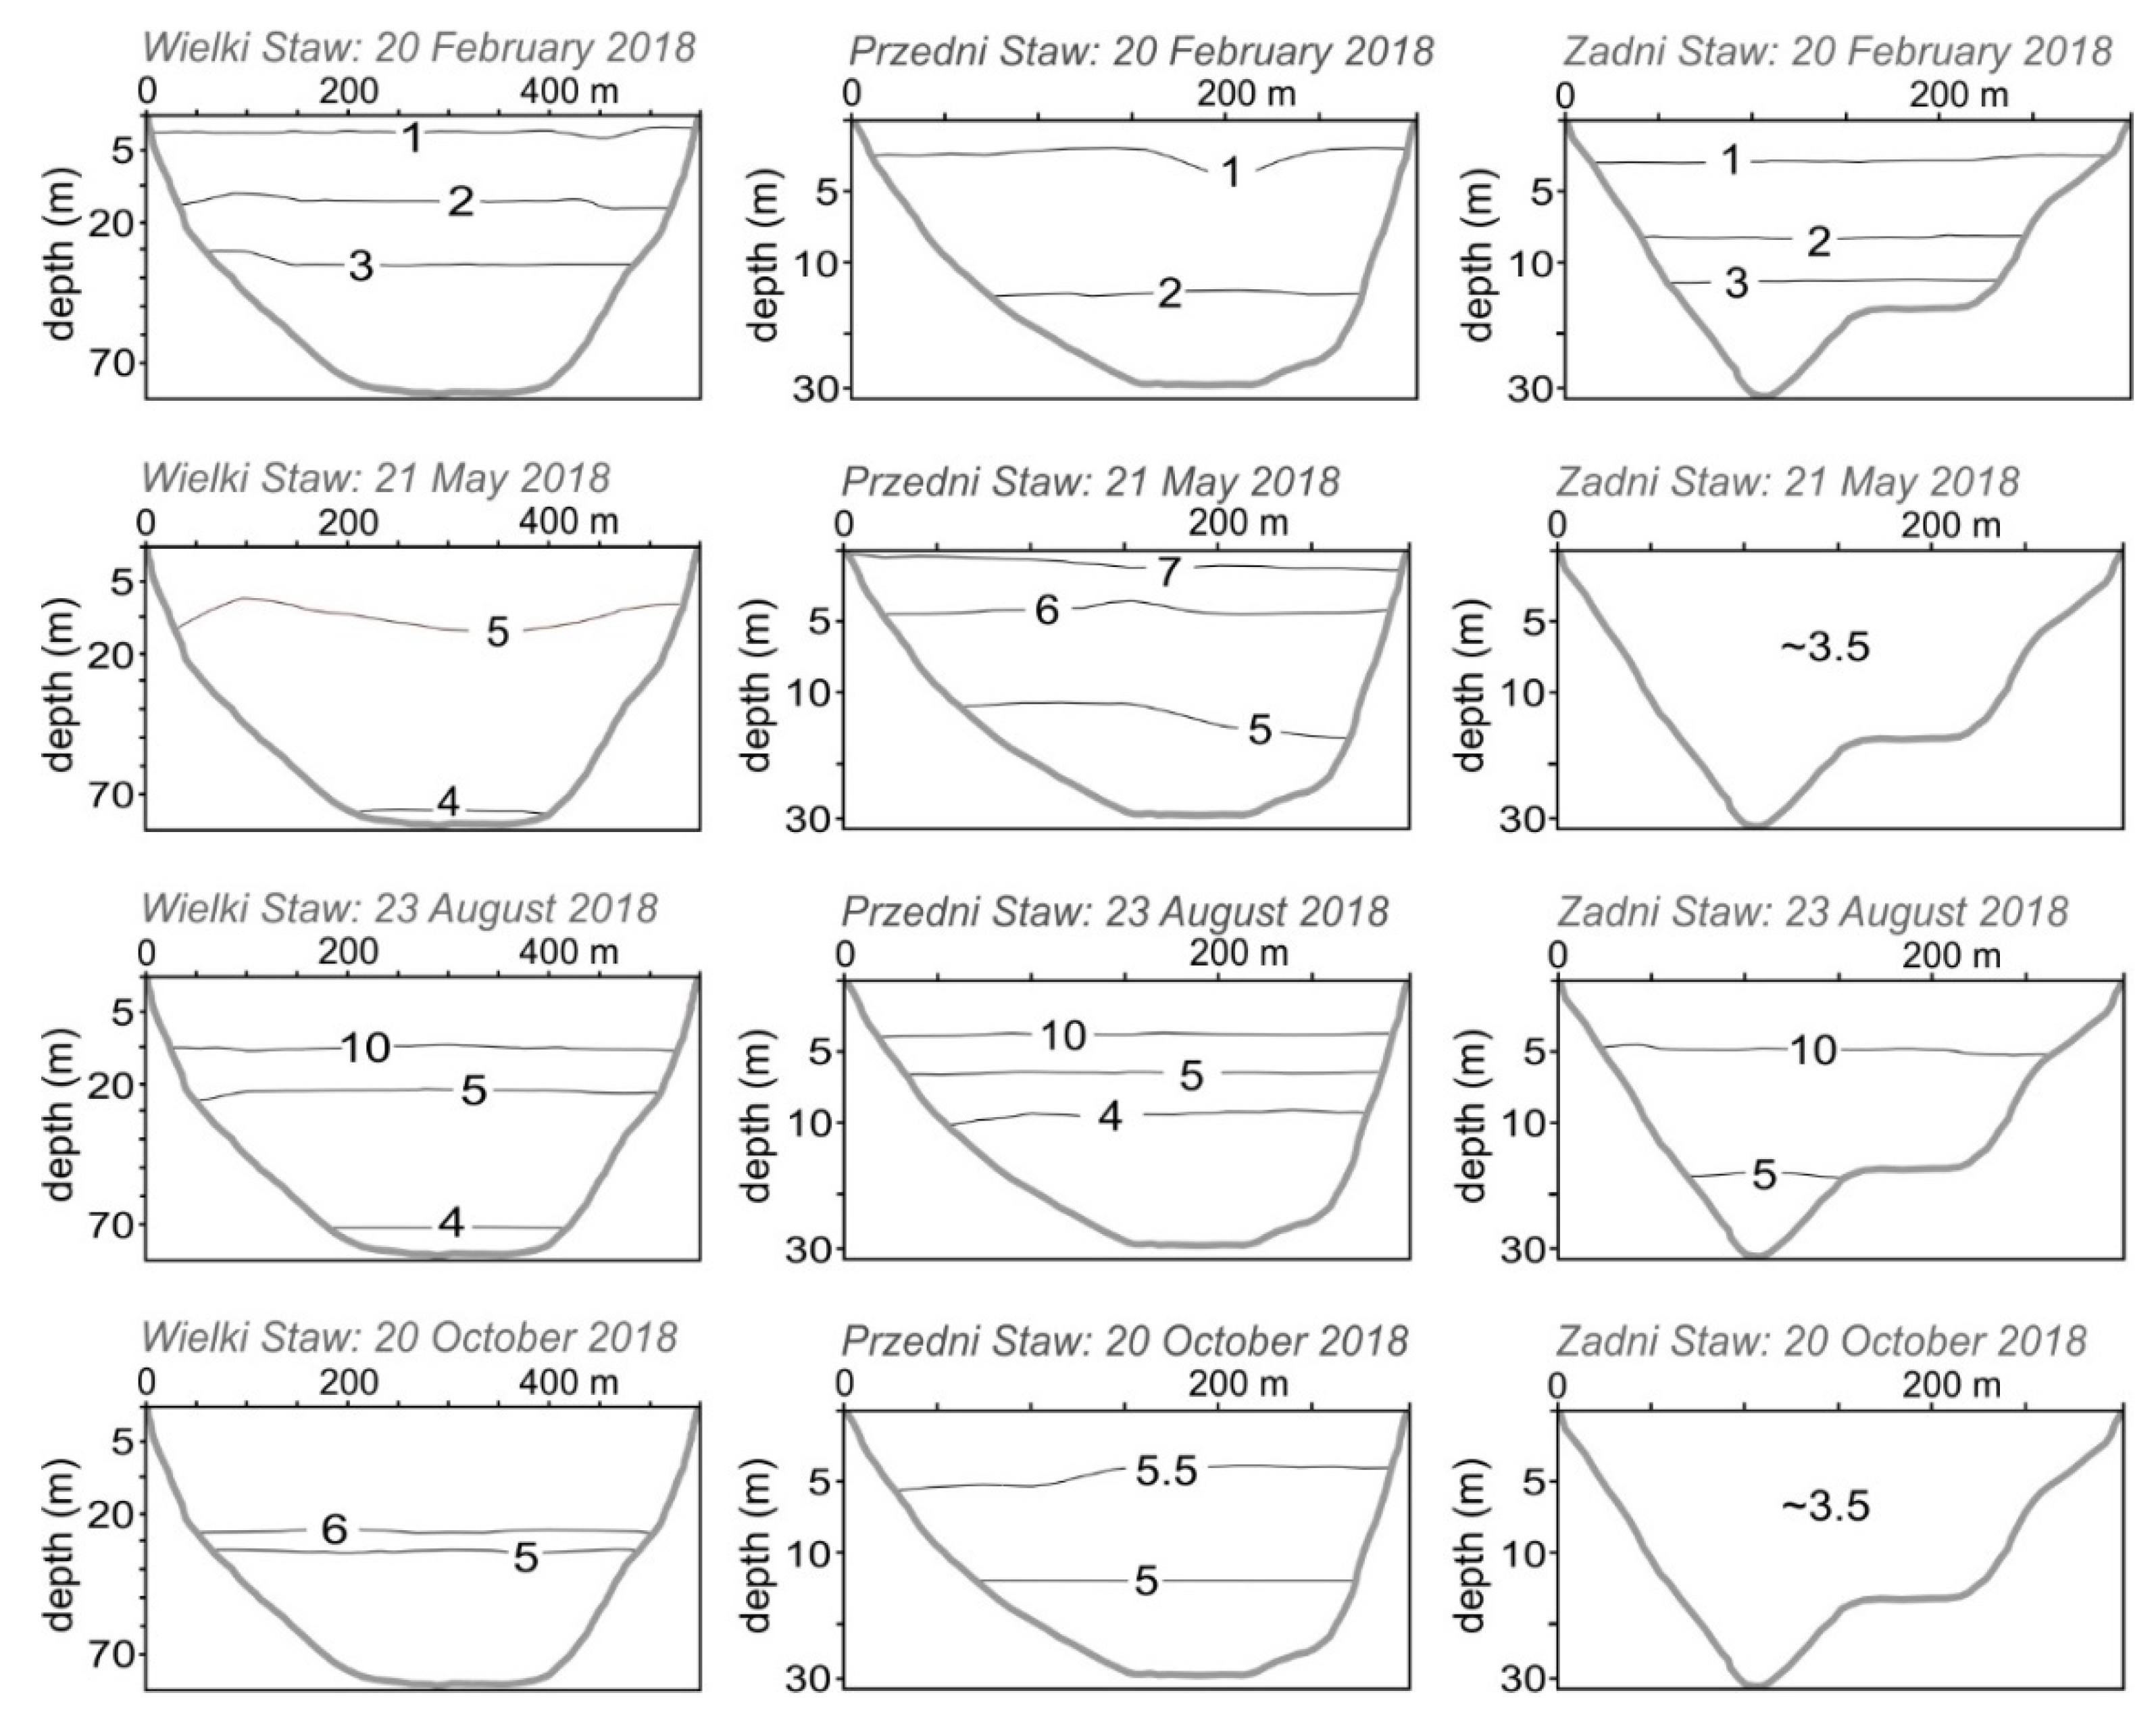
The degree of thermal stratification of the water (μ) of the lakes in 2015–2019 is shown in Figure 3b. The values of this index ranged from 0.35 to 34.61. In the periods of winter stratification, the greatest thermal stratification was linked to the supply of cold meltwater, while in the periods of summer stratification, the greatest thermal stratification was observable at the turn of August and September. In the summer and winter months, Zadni Staw was the warmest of all the lakes under investigation, despite the fact that it was usually the last to reach the state of spring homeothermy, and the first to develop it in autumn (Figure 4). In the summer and winter, Przedni Staw was usually cooler than Wielki Staw, but it reached the state of spring homeothermy the earliest.
4.4. Ice Cover Formation
4.4.1. Ice-On and Ice-Off Timing
The ice-on and ice-off dates, the duration of ice cover, and changes in its thickness and internal structure over the years of 2014–2019 for the lakes under study are presented in Figure 5 and Figure 6.
Over the timespan under study, the ice cover on Zadni Staw and Przedni Staw formed at the turn of November and December, and in the second half of December on Wielki Staw, with the ice-on timing on these three lakes falling on different days—the differences ranged from 3 days (2015/2016) to 37 days (2014/2015). The date when the individual lakes froze changed in the following years—the maximum differences ranged from 28 days in Wielki Staw to 33 days in Przedni Staw and 40 days in Zadni Staw. In each season, the ice cover formed first on Zadni Staw, and last on Wielki Staw.
The ice-off days fell in May–June. The ice-off timing differed from one lake to another, with the differences ranging from 12 days (2014/2015) to 23 days (2017/2018). The differences in ice-off timing in the individual years were as follows: 54 days on Wielki Staw, 40 days on Przedni Staw, and 47 days on Zadni Staw. Ice cover disappeared the earliest on Wielki Staw, and the latest on Zadni Staw.
The duration of continuous ice cover ranged from 122 days on Wielki Staw (2018) to 206 days on Zadni Staw (2019). The average duration of ice cover on the study lakes was 143 days on Wielki Staw, 165 days on Przedni Staw, and 177 days on Zadni Staw. The differences in the duration of ice cover on the lakes under investigation from one season to another ranged from 1 day (2016) to 54 days (2018). Meanwhile, the maximum differences in the number of days with ice cover on the individual lakes throughout the timespan under study were 47 days for Wielki Staw, 33 days for Przedni Staw, and 50 days for Zadni Staw. On average, the ice cover on Zadni Staw lasted 11 days longer than that on Przedni Staw, which in turn lasted by an average of 22 days longer than that on Wielki Staw.
4.4.2. Thickness of the Ice Cover
During the period when monitoring took place, the maximum thickness of ice cover on the survey lakes on the days when measurements were taken varied from 1.16 m (March 2018) to 1.55 m (March 2015) on Wielki Staw, from 1.12 m (March 2016 and April 2019) to 2.20 m (March 2018) on Przedni Staw, and from 1.45 m (April 2019) to 2.80 m (April 2017) on Zadni Staw. On each of these lakes, the locations with the thickest and thinnest ice cover did not change. The smallest variations in the maximum ice thickness in the corresponding months of the successive seasons were recorded on Wielki Staw (0.10 m on average), while the largest were on Zadni Staw (1.28 m on average). The greatest difference in the maximum thickness of the ice cover of Wielki Staw and Przedni Staw was 1.14 m (March 2018), while that of Wielki Staw and Zadni Staw was 2.67 m (April 2018). In the years 2015–2019, only on Wielki Staw lake did the variability in the maximum thickness of ice cover tend to decrease.
4.4.3. Internal Structure of the Ice Cover
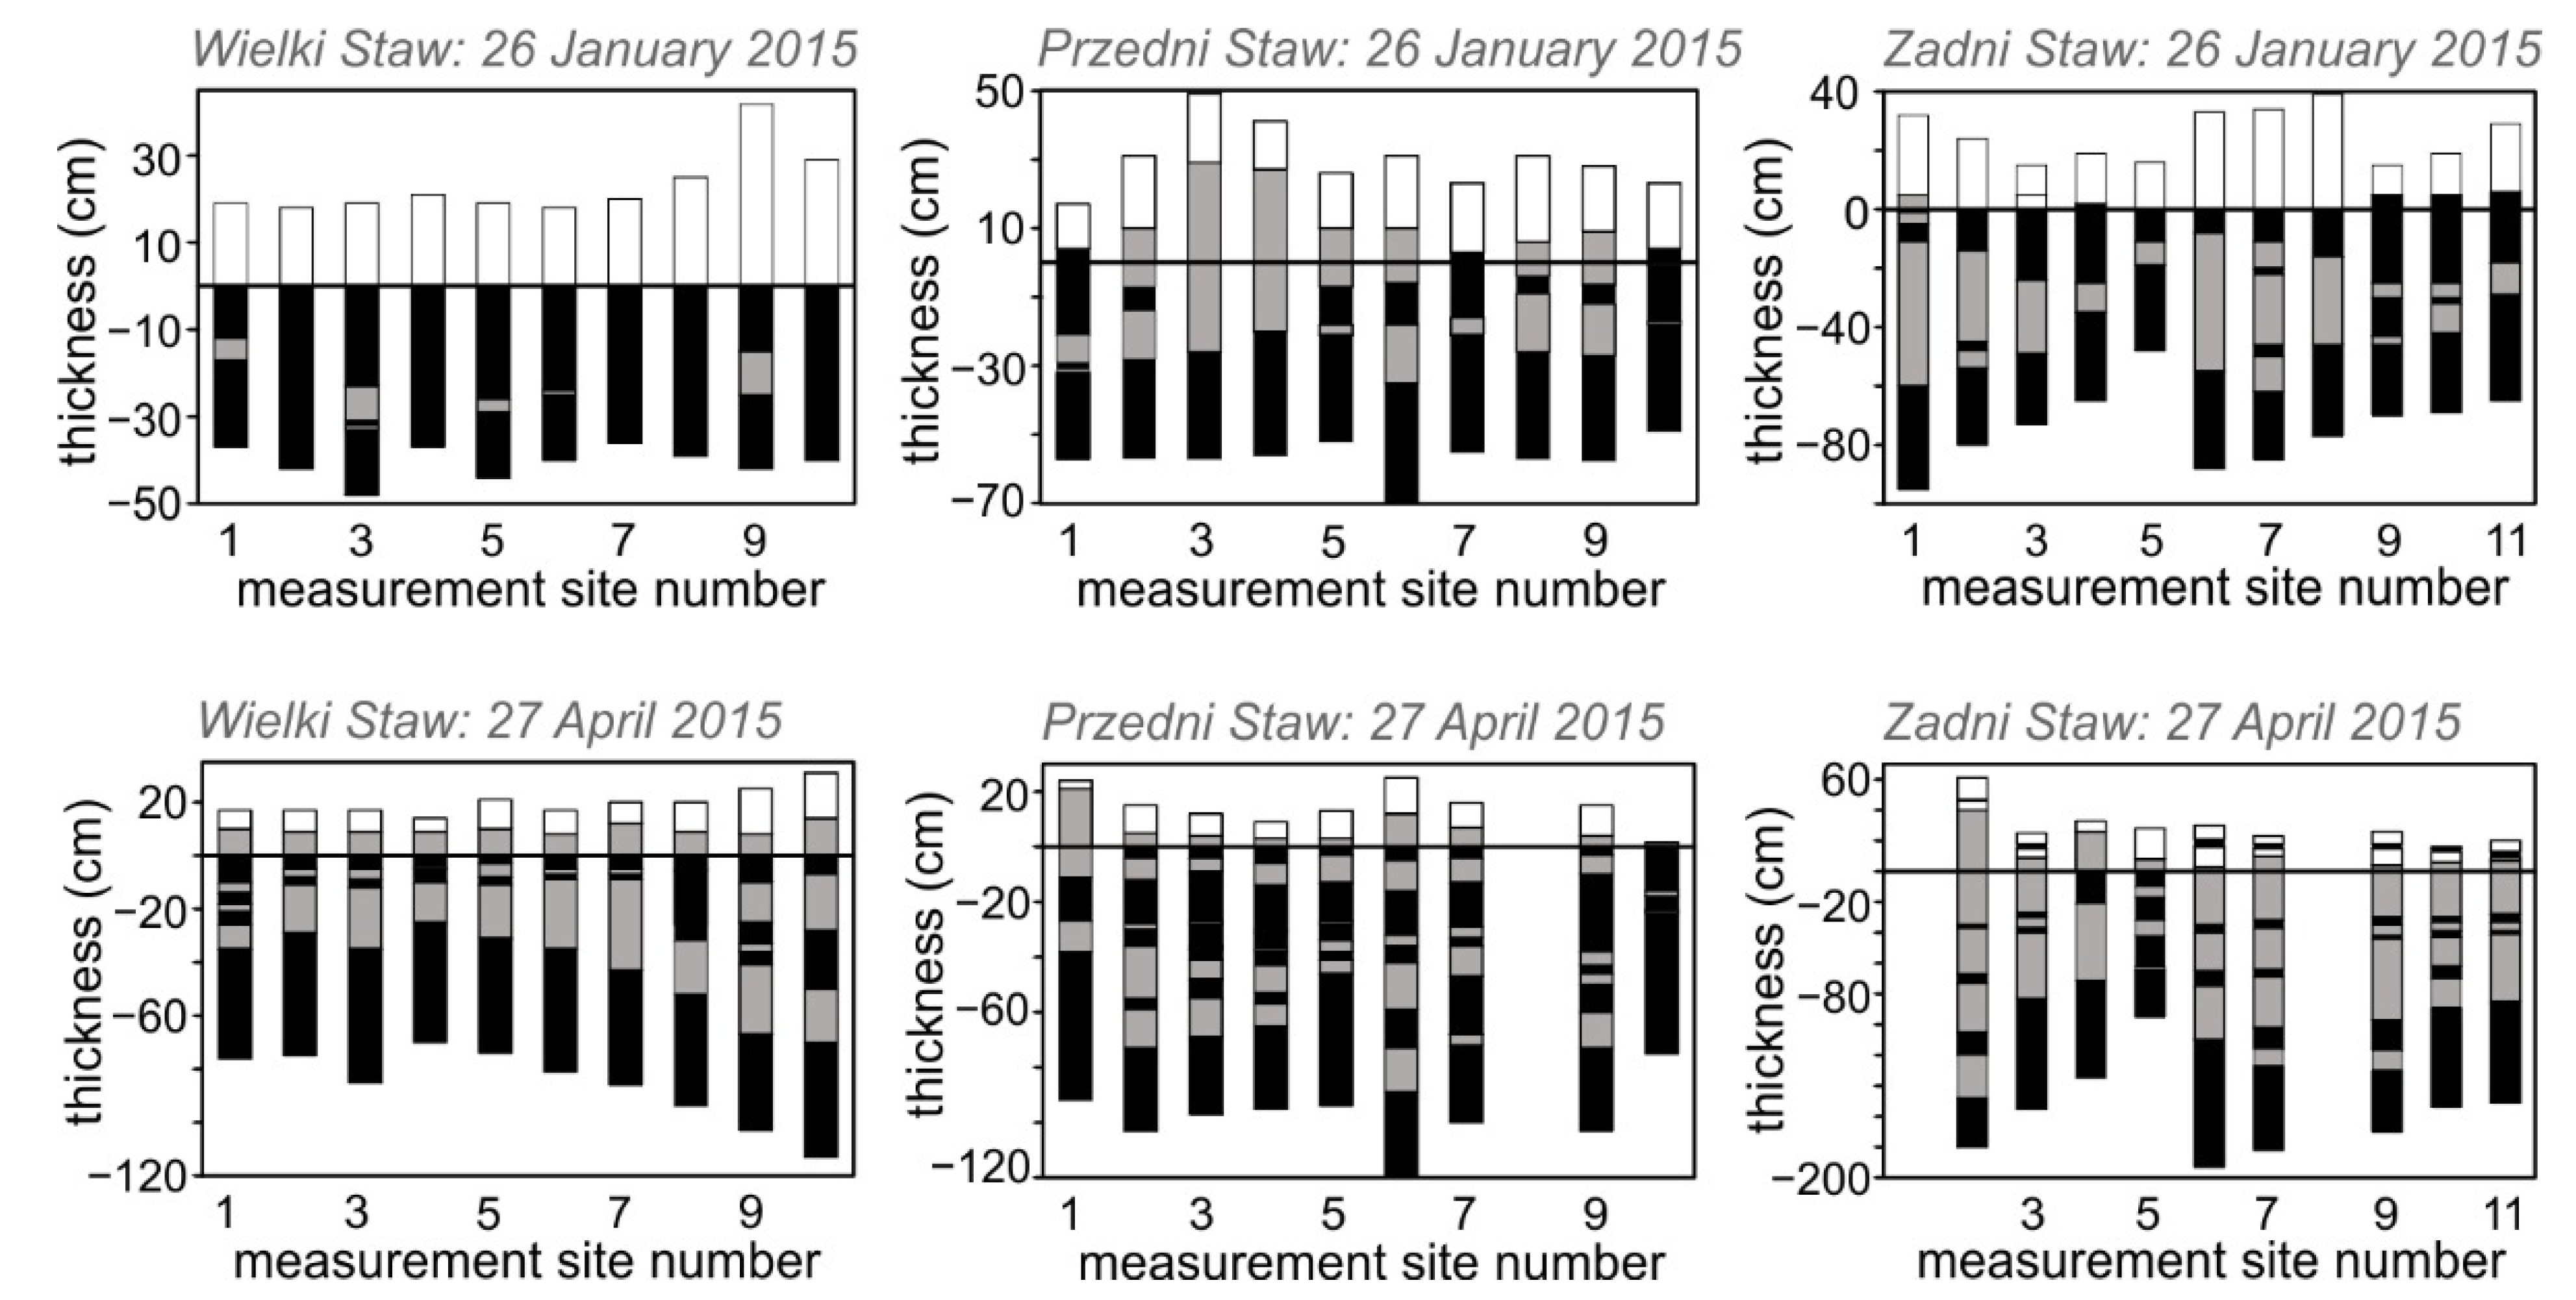
During each measuring session, the ice cover on the studied lakes had a layered structure, with the thickness and number of layers varying in time and space (Figure 6). The share of slush in the structure of the internal ice cover ranged from 13.8% (January 2015) to 61.7% (April 2019) on Wielki Staw, from 10.9% (January 2018) to 47.8% (April 2017) on Przedni Staw, and from 32.3% (February 2016) to 63.2% (April 2017) on Zadni Staw. The average value of this share was close to 30% on Przedni Staw and Wielki Staw, and to 50% on Zadni Staw, with the interannual variability in the share of slush in the structure of the ice cover of the study lakes showing an upward trend.
4.4.4. Thickness of Snow Cover on the Lakes
During the study period, the maximum seasonal thickness of snow cover on the study lakes varied from 0.46 m (March 2016) to 0.80 m (April 2019) on Wielki Staw, from 0.33 m (March 2015) to 0.81 m (April 2019) on Przedni Staw, and from 0.61 m (April 2015) to 1.30 m (April 2017) on Zadni Staw. The spots where the snow had the greatest and smallest depths on each of these lakes did not change. The largest seasonal difference in the maximum thickness of snow cover on Wielki Staw and Przedni Staw was 0.33 m (March 2018), and that on Wielki Staw and Zadni Staw—0.79 m (April 2017).
In the years 2014–2019, the thickness of snow cover on Wielki Staw was increasing towards the SE shore (slopes of Miedziane). In contrast, on Przedni Staw, the snow cover grew thicker towards the NE shore (slopes of Niżnia Kopa), and on Zadni Staw towards the W shore (slopes of Walentkowy Wierch and Świnica) (Figure 1 and Figure 5).
4.5. Meteorological and Snow–Ice Controls of the Lake Temperature
The influence of meteorological factors on the thermal dynamics of the studied lakes changed both in space and time. In summer, in addition to being under the influence of air temperature, the temperature of all of the lakes was mainly impacted by wind speed and precipitation:
where MWTVI-VIII—weighted mean temperature of the water in June–August, Vw—mean wind speed in the month preceding water temperature measurement, and ∑P—precipitation total in the preceding month.
MWTVI-VIII_Wielki = 0.265 T + 0.275 Vw + 0.0009 ∑P + 1.11
p < 0.03; r = 0.99; σ = ±0.15 °C
MWTVI-VIII_Przedni = 0.119 T + 1.214 Vw + 0.0011 ∑P +0.65
p < 0.025; r = 0.99; σ = ±0.029 °C
MWTVI-VIII_Zadni = 0.466 T + 1.004 Vw − 0.0005 ∑P − 2.59
p < 0.02; r = 0.99; σ = ±0.22 °C
The above equations are statistically significant and explain from 94% to 99% (adj. R2) of the recorded variability in water temperature (Figure 7).
The variability in the water temperature of the studied lakes in autumn was primarily related to the variability in air temperature, irradiation, wind speed and precipitation:
where MWTIX-XI—weighted mean temperature of the water in September–November, T—mean air temperature in the month preceding the water temperature measurement, PISR—mean potential incoming solar radiation in the preceding month, Vw—mean wind speed in the preceding month, and ∑P—total precipitation in the preceding month.
MWTIX-XI_Wielki = −0.026 T + 0.00001 PISR + 0.0408 Vw − 0.0012 ∑P + 4.07
p < 0.00004; r = 0.99; σ = ±0.116 °C
MWTIX-XI_Przedni = − 0.156 T + 0.00004 PISR + 0.0818 Vw − 0.0015 ∑P + 3.17
p < 0.003; r = 0.97; σ = ±0.364 °C
MWTIX-XI_Zadni = −0.04 T + 0.00004 PISR − 0.0156 Vw − 0.0001 ∑P + 2.02
p < 0.004; r = 0.97; σ = ±0.548 °C
The above equations are statistically significant and explain from 88% to 95% (adj. R2) of the variability in MWTIX-XI (Figure 7).
In the periods when the lakes were ice-covered, the relations between the weighted mean temperature of the water and meteorological factors were only statistically significant in the spring seasons:
where MWTIII-V—weighted mean temperature of the water in March–May, PDD—sum of positive degree days in the month preceding the water temperature measurement, T—mean air temperature in the preceding month, Vw—mean wind speed in the preceding month, and Dsnow—thickness of the snow cover in the middle of the lake on the day of measurement.
MWTIII-V_Wielki = 0.153 T − 0.431 Vw + 0.0264 Dsnow + 3.88
p < 0.0003; r = 0.94; σ = ±0.302 °C
MWTIII-V_Przedni = 0.211 T − 0.323 Vw + 0.0277 Dsnow +3.57
p < 0.002; r = 0.92; σ = ±0.406 °C
MWTIII-V_Zadni = 0.076 T − 0.139 Vw + 0.0147 Dsnow + 3.17
p < 0.016; r = 0.84; σ = ±0.211 °C
The above equations explain from 60% to 85% (adj. R2) of the variability in MWTIII-V (Figure 7).
In general, over the study period, the thermal dynamics of the study lakes were most influenced by the air temperature and the thickness of ice–snow cover:
where MWT—weighted mean temperature of the water, PDD—sum of positive degree days in the month preceding the water temperature measurement, Dice—thickness of ice cover in the middle of the lake, and Dsnow—thickness of snow cover in the middle of the lake.
MWTI-XII_Wielki = 0.0068 PDD − 0.0127 Dice + 0.0076 Dsnow + 2.94
p < 0.00000; r = 0.93; σ = ±0.533 °C
MWTI-XII_Przedni = 0.0087 PDD − 0.0059 Dice + 0.0129 Dsnow + 2.46
p < 0.00000; r = 0.90; σ = ±0.669 °C
MWT I-XII_Zadni = 0.0087 PDD − 0.0093 Dice + 0.0373 Dsnow + 2.76
p < 0.00000; r = 0.87; σ = ±0.759 °C
The above equations are statistically significant and explain from 73% to 84% (adj. R2) of the recorded variability in water temperature (Figure 7).
5. Discussion
5.1. Influence of Air Temperature and Snowfall on the Thermal Dynamics of the Lakes
In the Tatras, thermal conditions and snowfall in autumn and spring play a crucial role in shaping the thermal dynamics of lakes. For example, in the 2014/2015 season, despite the cold and snowy winter and spring, the duration of ice cover on the lakes under investigation was short because the autumn was warm with little snow. However, the ice cover duration was shortest in the 2017/2018 season, when the autumn and winter were cold and snowy, but the spring was very warm. On the other hand, the exceptionally cold and snowy spring of 2019 caused the ice on the lakes to last the longest in the entire multi-year research period. The weighted mean annual water temperature of Wielki Staw in the hydrological year 2019 was lower, while that of the other lakes was higher than that in the year before, with the mean annual air temperature in 2019 being higher than that in 2018 (Figure 2). In both seasons, Przedni Staw was the coldest lake. Meanwhile, Zadni Staw was warmer than Wielki Staw in the season when the ice cover lasted shortest and cooler when the ice cover persisted for a long time. The differences in the duration of the ice–snow cover on the individual lakes changed from year to year. A similar importance of the lake ice–snow cover in the Sierra Nevada and Klamath Mountains of California (USA) was reported by Smits et al. [35,36].
5.1.1. Role of Ice–Snow Cover
The thickness and duration of ice–snow cover are interrelated and influence the thermal dynamics of the lakes. Snow deposited on lake ice, creating a layer with low thermal conductivity and high albedo, effectively limits heat exchange between the atmosphere and the lake. The circulation of water is then associated with gravitational currents and the heat released from the sediments [23]. Snow cover also influences the temperature of the lake by extending the presence of the ice cover. Moreover, ice cover bends down below the hydrostatic water level under the weight of snow, which in turn leads to the build-up of layers of slush/snow ice on congelation ice [62,63,64]. Melting ice–snow cover is, in turn, a source of cold water, which effectively cools the lake in the spring and may control the interannual variability in the lake’s thermal dynamics [65]. Thus, the decrease in the duration and thickness of snow cover in the Tatra Mountains along with the warming of the climate may reinforce the impact of climate warming on the thickness and duration of the lake ice cover [52]. In the last few decades, this has been observable on Morskie Oko lake [41,54,66].
In the years of 2014–2019, the duration of the ice covers on Wielki Staw and Przedni Staw depended on air temperature in the autumn and spring months, but they were most strongly associated with the maximum ice thickness, which, in turn, increased with the total amount of snowfall. As the duration and maximum thickness of ice cover increased, the number of slush layers it comprised increased and the maximum thickness of snow cover on its surface declined. The longer the ice cover lasted, the lower the temperature of the lakes in the summer months. On Zadni Staw, which is located at the highest altitude, the influence of snowfall on the formation of ice cover was ‘masked’ by aeolian processes. A large proportion of the snow deposited on the lake surface was blown in from the side of the main ridge (Walentkowy Wierch) on which snow cornices formed each winter.
5.1.2. Role of Lake Morphometry and Their Catchment Topography
In ice-free periods, in addition to the air temperature, the factors that disturbed synchronous fluctuations in the temperature of the water in the studied lakes included, first of all, their morphometry, altitude, and sun and wind exposure [2,24,25]. The importance of the morphometry of the lakes and the topography of their catchment areas was reflected, inter alia, in the intra-annual variability in the weighted mean temperature of the water in Wielki Staw, Przedni Staw, and Zadni Staw. Among the lakes under study, Zadni Staw, which lies at the highest altitude and is the one with the highest levels of irradiation, was warmest in the summer and winter months. In the latter case, the rapid development and considerable thickness of the ice–snow cover fed by wind-blown snow must have been the key factor (see Section 5.1.1). In contrast, in the summer, Przedni Staw was usually cooler than Wielki Staw, which lies at a similar height, but is much larger, deeper, and receives more sunlight. Obviously, the differences in the size of lakes translate into differences in their heat resources [67] and the thickness/duration of the ice cover [33,34]. Meanwhile, a long duration and large thickness of snow cover on lakes related to the elevation and topography of their catchment areas may cause lakes located higher to be warmer throughout the year than lakes situated at much lower altitudes, even if their size and geometry are similar. In the Dolina Pięciu Stawów Polskich valley, this effect was enhanced by: (a) intensified aeolian water mixing (faster cooling in autumn), (b) the fastest response to rainfall (high RSchindler value = faster cooling in autumn), (c) the blowing of snow away from the ice cover of Przedni Staw, (d) more favourable exposure to the sun for Zadni Staw, and (e) unfavourable exposure to the sun for Przedni Staw (Table 1). Moreover, the impact of a winter temperature inversion [25] between Zadni Staw and Wielki/Przedni Staw may have played a role.
5.2. Thermal Sensitivity of High Mountain Lakes
The increase in air temperature observable in the entire periglacial zone of the Polish Tatra Mountains [48,68] translates into a decrease in the annual number of days with snow cover and its maximum thickness [53,69]. This may further complicate the response of lakes characterised by different morphometric features and different topographies of the catchment area to climate warming.
In summer, Zadni Staw, which is well irradiated, heated up faster than Wielki Staw, which is larger and shaded, with the latter lake was distinguishable for its high sensitivity to wind speed and precipitation changes (Equations (6)–(8)). However, rainfall did not play a significant role in shaping the thermal dynamics of the lakes, and in the case of Zadni Staw, the heat supplied by rain was reduced during summer snowfall (Equation (8)). Meanwhile, in the autumn, both rainfall and snowfall accelerated the cooling of water heated in summer in all of the lakes, with the greatest amounts of precipitation recorded in the warmer spells of those seasons. Przedni Staw was the lake that was most sensitive to changes in the meteorological conditions at such times (Equations (9)–(11)). Additionally, in the spring, this lake responded fastest to changes in air temperature. The greater the amount of meltwater supplied to the lake (i.e., the thinner the snow cover) and the stronger the wind, the lower the lake water temperature (Equations (12)–(14)). In general, small lakes (Przedni Staw and Zadni Staw) are most sensitive to changes in air temperature throughout the year, but the relationships between the air and lake temperatures are most strongly associated with the formation of ice–snow cover (Equations (15)–(17)). Therefore, it can be assumed that, in the Tatras, small, high-altitude reservoirs with high irradiation, systematically supplied with wind-blown snow, are most sensitive to climate warming. Owing to the progressive reduction in the size of these lakes under the influence of slope processes [70], their sensitivity is bound to increase gradually. These observations are consistent with the results of the classification of the Tatra lakes in terms of the duration of their ice cover based on their similarities in terms of altitude, morphometry, and topographical conditions [33]. However, the increase in air temperature, the decrease in the thickness of ice–snow cover, and its duration need not result in growth in the mean annual temperature of lakes, and the lakes located at the highest altitudes and with the longest ice cover do not have to be the coolest ones.
6. Conclusions
- The intra-annual variability in the thermal dynamics of lakes is primarily related to the variability in air temperature, solar irradiation, wind, and precipitation. The Tatra lakes usually heat up in June–August. Autumn rain/snowfall and winter snowfall enhance and limit water cooling, respectively. Wind, both in the summer and autumn, amplifies the influence of changes in air temperature, solar irradiation, and precipitation. Meanwhile, in the winter, by influencing snow distribution (blowing snow in/away), it can control/differentiate the cooling rate of ice-covered lakes more than other meteorological factors.
- The interannual variability in the thermal conditions of lakes in the Tatras is primarily associated with the variability in air temperature and ice cover. Notably, the duration of ice–snow cover mainly depends on the thermal and precipitation conditions in autumn and spring.
- Although melting snow and ice are sources of cold water, the annual heat losses of lakes in the periglacial zone of the Tatra Mountains are inversely proportional to the thickness of seasonal ice–snow cover. Therefore, both in winter and summer, lakes situated at high altitudes and with high solar irradiation can be warmer than lakes that are located much lower, but shaded, even if their shapes and sizes are similar. Thus, climate warming and the accompanying decrease in the thickness and duration of lake ice need not give rise to an increase in the mean annual water temperature, but may instead sometimes even cause the lake to cool.
- The sensitivity of the Tatra lakes to a rise in air temperature increases with a decrease in their surface/depth and shading, as well as with an increase in the altitude and share of wind-blown snow in the formation of ice–snow cover. Given the many possible combinations of these features, lakes exhibit great spatial and temporal variability in thermal dynamics and ice cover. Small reservoirs, situated at high altitudes, with high solar irradiation and receiving wind-blown snow, are most sensitive to climate warming, which involves a decrease in snowfall. However, considering the complex interactions between the thermal dynamics and ice formation on lakes, and the rate of heat exchange, it seems that the present-day climate change in the Polish Tatras may be best reflected not by these most sensitive lakes, but by the largest ones located in the subalpine zone.
Author Contributions
Conceptualization, M.S. and B.G.; methodology, M.S. and B.G.; investigation, M.S., B.G., M.L. and M.C.; writing—original draft, M.S. and B.G.; writing—review and editing M.S., B.G. and M.L.; visualization, M.S., B.G., M.C. and M.L.; supervision, B.G. All authors have read and agreed to the published version of the manuscript.
Funding
This research was funded by the Centre for Polar Studies—Leading National Research Centre (KNOW), and by the University of Silesia in Katowice.
Institutional Review Board Statement
Not applicable.
Informed Consent Statement
Not applicable.
Data Availability Statement
The meteorological data and digital elevation model used in this research are available on the websites https://danepubliczne.imgw.pl (accessed on 12 July 2022) and https://mapy.geoportal.gov.pl (accessed on 12 July 2022), respectively.
Acknowledgments
The studies were carried out as part of the scientific activity of the Centre for Polar Studies (University of Silesia in Katowice) with the use of research and logistic equipment of the Polar Laboratory of the University of Silesia in Katowice. We thank all of the research assistants for providing field support, especially Kamil Kachniarz, Wiktoria Czuchraj, Dariusz Ignatiuk, and Krzysztof Senderak. We would also like to thank the shelter staff in the Dolina Pięciu Stawów Polskich for providing up-to-date information about the ice-on and ice-of on the lakes and Tadeusz Molenda for consultations in the field of limnology.
Conflicts of Interest
The authors declare no conflict of interest.
References
- Hutchinson, G.E.; Löffler, H. The thermal classification of lakes. Proc. Natl. Acad. Sci. USA 1956, 42, 84–86. [Google Scholar] [CrossRef]
- Thompson, R.; Kamenik, C.; Schmidt, R. Ultrasensitive alpine lakes and climate change. J. Limnol. 2005, 64, 139–152. [Google Scholar] [CrossRef]
- Thompson, R.; Ventura, M.; Camarero, L. On the climate and weather of mountain and sub-arctic lakes in Europe and their susceptibility to future climate change. Freshw. Biol. 2009, 54, 2433–2451. [Google Scholar] [CrossRef]
- Gao, S.B.; Stefan, H.G. Multiple linear regression for lake ice and lake temperature characteristics. J. Cold Reg. Eng. 1999, 13, 59–77. [Google Scholar] [CrossRef]
- Stefan, H.G.; Fang, X.; Eaton, J.G. Simulated fish habitat changes in North American lakes in response to projected climate warming. Trans. Am. Fish. Soc. 2001, 130, 459–477. [Google Scholar] [CrossRef]
- Lei, R.; Leppäranta, M.; Erm, A.; Kari, E.; Parn, O. Field investigations of apparent optical properties of ice cover in Finnish and Estonian lakes in winter 2009. Est. J. Earth Sci. 2011, 60, 50–64. [Google Scholar] [CrossRef]
- Mishra, V.; Cherkauer, K.A.; Bowling, L.C.; Huber, M. Lake ice phenology of small lakes: Impacts of climate variability in the Great Lakes region. Glob. Planet Chang. 2011, 76, 166–185. [Google Scholar] [CrossRef]
- Hampton, S.E.; Galloway, A.W.E.; Powers, S.M.; Ozersky, T.; Woo, K.H.; Batt, R.D.; Labou, S.; O’Reilly, C.M.; Sharma, S.; Lottig, N.R.; et al. Ecology under lake ice. Ecol. Lett. 2017, 20, 98–111. [Google Scholar] [CrossRef]
- Wang, W.; Lee, X.; Xio, W.; Liu, S.; Schultz, N.; Wang, Y.; Zhang, M.; Zhao, L. Global lake evaporation accelerated by changes in surface energy allocation in a warmer climate. Nat. Geosci. 2018, 11, 410–414. [Google Scholar] [CrossRef]
- Granados, I.; Toro, M.; Giralt, S.; Camacho, A.; Montes, C. Water column changes under ice during different winters in a midlatitude Mediterranean high mountain lake. Aquat. Sci. 2020, 82, 30. [Google Scholar] [CrossRef]
- Maier, D.B.; Diehl, S.; Bigler, C. Interannual variation in seasonal diatom sedimentation reveals the importance of late winter processes and their timing for sediment signal formation. Limnol. Oceanogr. 2019, 64, 1186–1199. [Google Scholar] [CrossRef]
- Rue, G.P.; Darling, J.P.; Graham, E.; Tfaily, M.M.; McKnight, D.M. Dynamic changes in dissolved organic matter composition in a mountain lake under ice cover and relationships to changes in nutrient cycling and phytoplankton community composition. Aquat. Sci. 2020, 82, 15. [Google Scholar] [CrossRef]
- Moser, K.A.; Baron, J.S.; Brahney, J.; Oleksy, I.A.; Saros, J.E.; Hundey, E.J.; Sadro, S.; Kopáček, J.; Sommaruga, R.; Kainz, M.J.; et al. Mountain lakes: Eyes global environmental change. Glob. Planet Chang. 2019, 178, 77–95. [Google Scholar] [CrossRef]
- Palecki, M.A.; Barry, R.G. Freeze-up and break-up of lakes as an index of temperature changes during the transition sasons: A case study for Finland. J. Appl. Meteorol. 1985, 25, 893–902. [Google Scholar] [CrossRef]
- Jaagus, J. The impact of climate change on the snow cover pattern in Estonia. Clim. Chang. 1997, 36, 65–77. [Google Scholar] [CrossRef]
- Magnuson, J.J.; Robertson, D.M.; Benson, B.J.; Wynne, R.H.; Livingstone, D.M.; Arai, T.; Assel, R.A.; Barry, R.G.; Card, V.V.; Kuusisto, E.; et al. Historical trends in lake and river ice cover in the Northern Hemisphere. Science 2000, 289, 1743–1746. [Google Scholar] [CrossRef]
- Hodgkins, G.A.; James, I.C.; Huntington, T.G. Historical changes in lake ice-out dates as indicators of climate change in New England. Int. J. Climatol. 2002, 22, 1819–1827. [Google Scholar] [CrossRef]
- Leppäranta, M. Modelling the Formation and Decay of Lake Ice. In The Impact of Climatechange on European Lakes; George, D.G., Ed.; Springer: Dordrecht, The Netherlands, 2010; pp. 63–83. [Google Scholar]
- Benson, B.J.; Magnuson, J.J.; Jensen, O.P.; Card, V.M.; Hodgkins, G.; Korhonen, J.; Livingstone, D.M.; Stewart, K.M.; Weyhenmeyer, G.A.; Granin, N.G. Extreme events, trends, and variability in Northern Hemisphere lake-ice phenology (1855–2005). Clim. Chang. 2012, 112, 299–323. [Google Scholar] [CrossRef]
- Choiński, A.; Ptak, M.; Skowron, R.; Strzelczak, A. Changes in ice phenology on Polish lakes from 1961–2010 related to location and morphometry. Limnologica 2015, 53, 42–49. [Google Scholar] [CrossRef]
- Czernecki, B.; Ptak, M. The impact of global warming on lake surface water temperature in Poland—The application of empirical-statistical downscaling, 1971–2100. J. Limnol. 2018, 77, 330–348. [Google Scholar] [CrossRef] [Green Version]
- Sharma, S.; Blagrave, K.; Magnuson, J.J.; O’Reilly, C.M.; Ryan, D.B.; Magee, M.R.; Straile, D.; Weyhenmeyer, G.A.; Winslow, L.; Woolway, R.I. Widespread loss of lake ice around the Northern Hemisphere in a warming world. Nat. Clim. Chang. 2019, 9, 227–231. [Google Scholar] [CrossRef]
- Kirillin, G.; Leppäranta, M.; Terzhevik, A.; Granin, N.; Bernhardt, J.; Engelhardt, C.; Efremova, T.; Golosov, S.; Palshin, N.; Sherstyankin, P.; et al. Physics of seasonally ice-covered lakes: A review. Aquat. Sci. 2012, 74, 659–682. [Google Scholar] [CrossRef]
- Šporka, F.; Livingstone, D.M.; Stuchlík, E.; Turek, J.; Galas, J. Water temperatures and ice cover in lakes of the Tatra Mountains. Biologia 2006, 61, 77–90. [Google Scholar] [CrossRef]
- Novikmec, M.; Svitok, M.; Kočický, D.; Šporka, F.; Bitušík, P. Surface water temperature and ice cover of Tatra Mountains lakes depend on altitude, topographic shading, and bathymetry. Arct. Antarct. Alp. Res. 2013, 45, 77–87. [Google Scholar] [CrossRef]
- Livingstone, D.M. Break-up dates of alpine lakes as proxy data for local and regional mean surface air temperatures. Clim. Chang. 1997, 37, 407–439. [Google Scholar] [CrossRef]
- Livingstone, D.M.; Lotter, A.F. The relationship between air and water tenmperatures in lakes of the Swiss Plateau: A case study with palaeolimnological implications. J. Paleolimnol. 1998, 19, 181–198. [Google Scholar] [CrossRef]
- Livingstone, D.M.; Jankowski, T.; Lotter, A.F. Patterns of deviation from linearity in the relationship between lake surface temperature and altitude above sea level in the Swiss Alps. Verh. Int. Verei. Limnol. 2005, 29, 300–305. [Google Scholar] [CrossRef]
- Livingstone, D.M.; Lotter, A.F.; Kettle, E.H. Altitu-dedependent differences in the primary physical response of mountain lakes to climatic forcing. Limnol. Oceanogr. 2005, 50, 1313–1325. [Google Scholar] [CrossRef]
- Vuglinsky, V.S.; Gronskaya, T.P.; Lemeshko, N.A. Long-term Characteristics of Ice Events and Ice Thickness on the Largest Lakes and Reservoirs of Russia. In Ice in the Environment, Proceedings of the 16th International Symposium on Ice, Dunedin, New Zealand, 2–6 December 2002; Squire, V., Langhorne, P.J., Eds.; University of Otago: Dunedin, New Zealand, 2002; pp. 80–86. [Google Scholar]
- Williams, G.; Layman, K.L.; Stefan, H.G. Dependence of lake ice on climate, geographic and bathymetric variables. Cold Reg. Sci. Technol. 2004, 40, 145–164. [Google Scholar] [CrossRef]
- Blenckner, T. A conceptual model of climate-related effects on lake ecosystems. Hydrobiologia 2005, 533, 1–14. [Google Scholar] [CrossRef]
- Gądek, B.; Szumny, M.; Szypuła, B. Classification of the Tatra Mountain lakes in terms of the duration of their ice cover (Poland and Slovakia). J. Limnol. 2020, 79, 70–81. [Google Scholar] [CrossRef]
- Solarski, M.; Szumny, M. Conditions of spatiotemporal variability of the thickness of the ice cover on lakes in the Tatra Mountains. J. Mt. Sci. 2020, 17, 2369–2386. [Google Scholar] [CrossRef]
- Smits, A.P.; MacIntyre, S.; Sadro, S. Snowpack determines relative importance of climate factors driving summer lake warming. Limnol. Oceanogr. Lett. 2020, 5, 271–279. [Google Scholar] [CrossRef]
- Smits, A.; Gomez, N.W.; Dozier, J.; Sadro, S. Winter climate and lake morphology control ice phenology and under-ice temperature and oxygen regimes in mountain lakes. J. Geophys. Res. Biogs. 2021, 126, 1–20. [Google Scholar] [CrossRef]
- Staszic, S. O Ziemiorództwie Karpatów i Innych gór i Równin Polski; Drukarnia Rządowa: Warszawa, Poland, 1815. (In Polish) [Google Scholar]
- Lityński, A. Jeziora tatrzańskie i zamieszkująca je fauna wioślarek. Spraw. Kom. Fizjogr. PAU 1917, 51, 1–88. (In Polish) [Google Scholar]
- Szaflarski, J. Nouvelles études sur le régime thermique des lacs de la Haute-Tatra. Rev. Geogr. Alp. 1936, 24, 369–380. (In French) [Google Scholar] [CrossRef]
- Olszewski, P. Zimowe stosunki tlenowe większych jezior tatrzańskich (Oxygen conditions in winter in the largest lakes in the Tatra Mountains). Rozpr. Wydz. Mat. Przyr. PAU 1948, 72A, 1–80, (In Polish, English Summary). [Google Scholar]
- Ptak, M.; Wrzesiński, D.; Choiński, A. Long-term changes in the hydrological regime of high mountain lake Morskie Oko (Tatra Mountains, Central Europe). J. Hydrol. Hydromech. 2017, 65, 146–153. [Google Scholar] [CrossRef]
- Choiński, A. Thermal characterisation of lake Morskie Oko water in 2007 based on measurements by a gradient thermal probe. Limnol. Rev. 2010, 10, 117–126. [Google Scholar] [CrossRef]
- Choiński, A.; Strzelczak, A. Variability of short-term diel water temperature amplitudes in a mountain lake. Water 2018, 10, 795. [Google Scholar] [CrossRef]
- Choiński, A.; Ptak, M.; Strzelczak, A. Areal variation in ice cover thickness on lake Morskie Oko (Tatra Mountains). Carpath. J. Earth Environ. Sci. 2013, 8, 97–102. [Google Scholar]
- Kurzyca, I.; Choiński, A.; Pociask-Karteczka, J.; Ławniczak, A.E.; Frankowski, M. Terms and conditions of high-mountain lake ice-cover chemistry (Carpathians, Poland). J. Glaciol. 2015, 61, 1207–1212. [Google Scholar] [CrossRef]
- Balon, J.; Jodłowski, M.; Krąż, P. Tatra Mountains—Topography. In Atlas of the Tatra Mountains. Abiotic Nature, Sheet, I.3; Tatra National Park: Zakopane, Poland, 2015. [Google Scholar]
- Niedźwiedź, T. Climate of the Tatra Mountais. Mt. Res. Dev. 1992, 12, 131–146. [Google Scholar] [CrossRef]
- Łupikasza, E.; Szypuła, B. Vertical climatic belts in the Tatra Mountains in the light of current climate change. Theor. Appl. Clim. 2019, 136, 249–264. [Google Scholar] [CrossRef]
- Gądek, B.; Szypuła, B. Contemporary Cryosphere. In Atlas of the Tatra Mountains. Abiotic Nature, Sheet, V.1; Tatrzański Park Narodowy: Zakopane, Poland, 2015. [Google Scholar]
- Ustrnul, Z.; Walawender, E.; Czekierda, D.; Šta’stny’, P.; Lapin, M.; Mikulova’, K. Precipitation and Snow Cover. In Atlas of the Tatra Mountains. Abiotic Nature, Sheet, II.3; Tatrzański Park Narodowy: Zakopane, Poland, 2015. [Google Scholar]
- Żmudzka, E. Contemporary climate changes in the high mountain part of the Tatras. Misc. Geogr. 2011, 15, 93–102. [Google Scholar] [CrossRef]
- Gądek, B. Climatic sensitivity of the non-glaciated mountains cryosphere (Tatra Mts., Poland and Slovakia). Glob. Planet Chang. 2014, 121, 1–8. [Google Scholar] [CrossRef]
- Kędzia., S.; Chrustek, P.; Kubacka, D.; Pyrc, R. Variability and changes of the height and duration of snow cover on the Gąsienicowa Glade (Tatra Mts). Int. J. Climatol. 2022, in print. [Google Scholar]
- Pociask-Karteczka, J.; Choiński, A. Recent trends in ice cover duration for Lake Morskie Oko (Tatra Mountains, East-Central Europe). Hydrol. Res. 2012, 43, 500–506. [Google Scholar] [CrossRef]
- Rączkowska, Z. Periglacial Landforms. In Atlas of the Tatra Mountains. Abiotic Nature, Sheet, V.1; Tatrzański Park Narodowy: Zakopane, Poland, 2015. [Google Scholar]
- MPHP. Map of Hydrological Division of Poland 1:10,000. Państwowe Gospodarstwo Wodne Wody Polskie; WMS Service: Warsaw, Poland, 2022. Available online: https://dane.gov.pl/pl/dataset/2167 (accessed on 20 June 2022).
- Fu, P.; Rich, P.M. A geometric solar radiation model with applications in agriculture and forestry. Comput. Electron. Agric. 2002, 37, 25–35. [Google Scholar] [CrossRef]
- Hutchinson, G.E. A Treatise on limnology. Geograph, Physics and Chemistry; Johny Wiley and Sons, Inc.: New York, NY, USA, 1957; Volume 1, pp. 164–194. [Google Scholar]
- Nõges, T. Relationships between morphometry, geographic location and water quality parameters of European lakes. Hydrobiologia 2009, 633, 33–43. [Google Scholar] [CrossRef]
- Wetzel, R.G. Limnology Lake and River Ecosystems; Academic Press: San Diego, CA, USA, 2011; pp. 34–42. [Google Scholar]
- Niesina, L.W. O parametre termiczeskoj stratyfikacji wody. Tr. G.G.O. Meteorol. Reżim Wodojemow 1970, 271, 86–89. (In Russian) [Google Scholar]
- Adams, W.P.; Roulet, N.T. Illustration of the roles of snow in the evolution of the winter cover of a lake. Arctic 1980, 33, 100–116. [Google Scholar] [CrossRef]
- Leppäranta, M. A growth model for black ice, snow ice and snow thickness in subarctic basins. Nord. Hydrol. 1983, 14, 59–70. [Google Scholar] [CrossRef]
- Leppäranta, M. Freezing of Lakes and the Evolution of Their Ice Cover, 1st ed.; Springer: Berlin/Heidelberg, Germany, 2015; pp. 137–173. [Google Scholar] [CrossRef]
- Sadro, S.; Melack, J.M.; Sickman, J.O.; Skeen, K. Climate warming response of mountain lakes affected by variations in snow. Limnol. Oceanogr. Lett. 2018, 4, 9–17. [Google Scholar] [CrossRef] [Green Version]
- Kolendowicz, L.; Choiński, A.; Sobkowiak, L.; Pociask-Karteczka, J. Changes in lake ice cover on the Morskie Oko Lake in Poland (1971–2007). Adv. Clim. Chang. Res. 2013, 1, 71–75. [Google Scholar] [CrossRef]
- Choiński, A.; Ptak, M.; Strzelczak, A. Changeability of accumulated heat content in alpine-type lakes. Pol. J. Environ. Stud. 2015, 24, 2363–2369. [Google Scholar] [CrossRef]
- Żmudzka, E.; Najedlik, P.; Mikulová, K. Temperature, Thermal Indices. In Atlas of the Tatra Mountains. Abiotic Nature, Sheet, II.2; Tatrzański Park Narodowy: Zakopane, Poland, 2015. [Google Scholar]
- Gądek, B.; Grabiec, M.; Rączkowska, Z.; Maciata, A. Variability of the snow avalanche danger in the Tatra Mountains during the past nine decades. Geogr. Pol. 2016, 89, 65–77. [Google Scholar] [CrossRef]
- Kapusta, J.; Petrovič, F.; Hreško, J.; Rączkowska, Z. Shrinkage of the tarns in the High Tatras (Slovakia, Poland). Geogr. Cassoviensis 2021, 15, 5–26. [Google Scholar] [CrossRef]
Figure 1.
Location of the study area and measuring sites on the lakes: Przedni Staw, Wielki Staw, and Zadni Staw.
Figure 1.
Location of the study area and measuring sites on the lakes: Przedni Staw, Wielki Staw, and Zadni Staw.

Figure 2.
Variability in the mean air temperature (line), precipitation totals (bars) (a), and average wind speed (b) in the autumn (A), winter (W), spring (S), and summer (Su) seasons in 2014–2019 in the Dolina Pięciu Stawów Polskich valley.
Figure 2.
Variability in the mean air temperature (line), precipitation totals (bars) (a), and average wind speed (b) in the autumn (A), winter (W), spring (S), and summer (Su) seasons in 2014–2019 in the Dolina Pięciu Stawów Polskich valley.

Figure 3.
Variability in the weighted mean water temperature along the vertical profile (a) and the index of thermal stratification (b) in the lakes of the Dolina Pięciu Stawów Polskich valley in 2015–2019.
Figure 3.
Variability in the weighted mean water temperature along the vertical profile (a) and the index of thermal stratification (b) in the lakes of the Dolina Pięciu Stawów Polskich valley in 2015–2019.

Figure 4.
Variability in the thermal stratification of the lakes in the Dolina Pięciu Stawów Polskich valley: an example from 2018 (values of isotherms/water temperature in degrees Celsius).
Figure 4.
Variability in the thermal stratification of the lakes in the Dolina Pięciu Stawów Polskich valley: an example from 2018 (values of isotherms/water temperature in degrees Celsius).

Figure 5.
Duration of the ice cover (a) and the maximum thickness of snow and ice with the number of slush layers (b) on the lakes in the Dolina Pięciu Stawów Polskich valley in 2014–2019.
Figure 5.
Duration of the ice cover (a) and the maximum thickness of snow and ice with the number of slush layers (b) on the lakes in the Dolina Pięciu Stawów Polskich valley in 2014–2019.

Figure 6.
Variability in the thickness and internal structure of the ice and snow cover of the lakes in the Dolina Pięciu Stawów Polskich valley: an example from 2015. White, grey and black colours: snow, slush, and ice, respectively. The numbered measuring sites are shown in Figure 1.
Figure 6.
Variability in the thickness and internal structure of the ice and snow cover of the lakes in the Dolina Pięciu Stawów Polskich valley: an example from 2015. White, grey and black colours: snow, slush, and ice, respectively. The numbered measuring sites are shown in Figure 1.

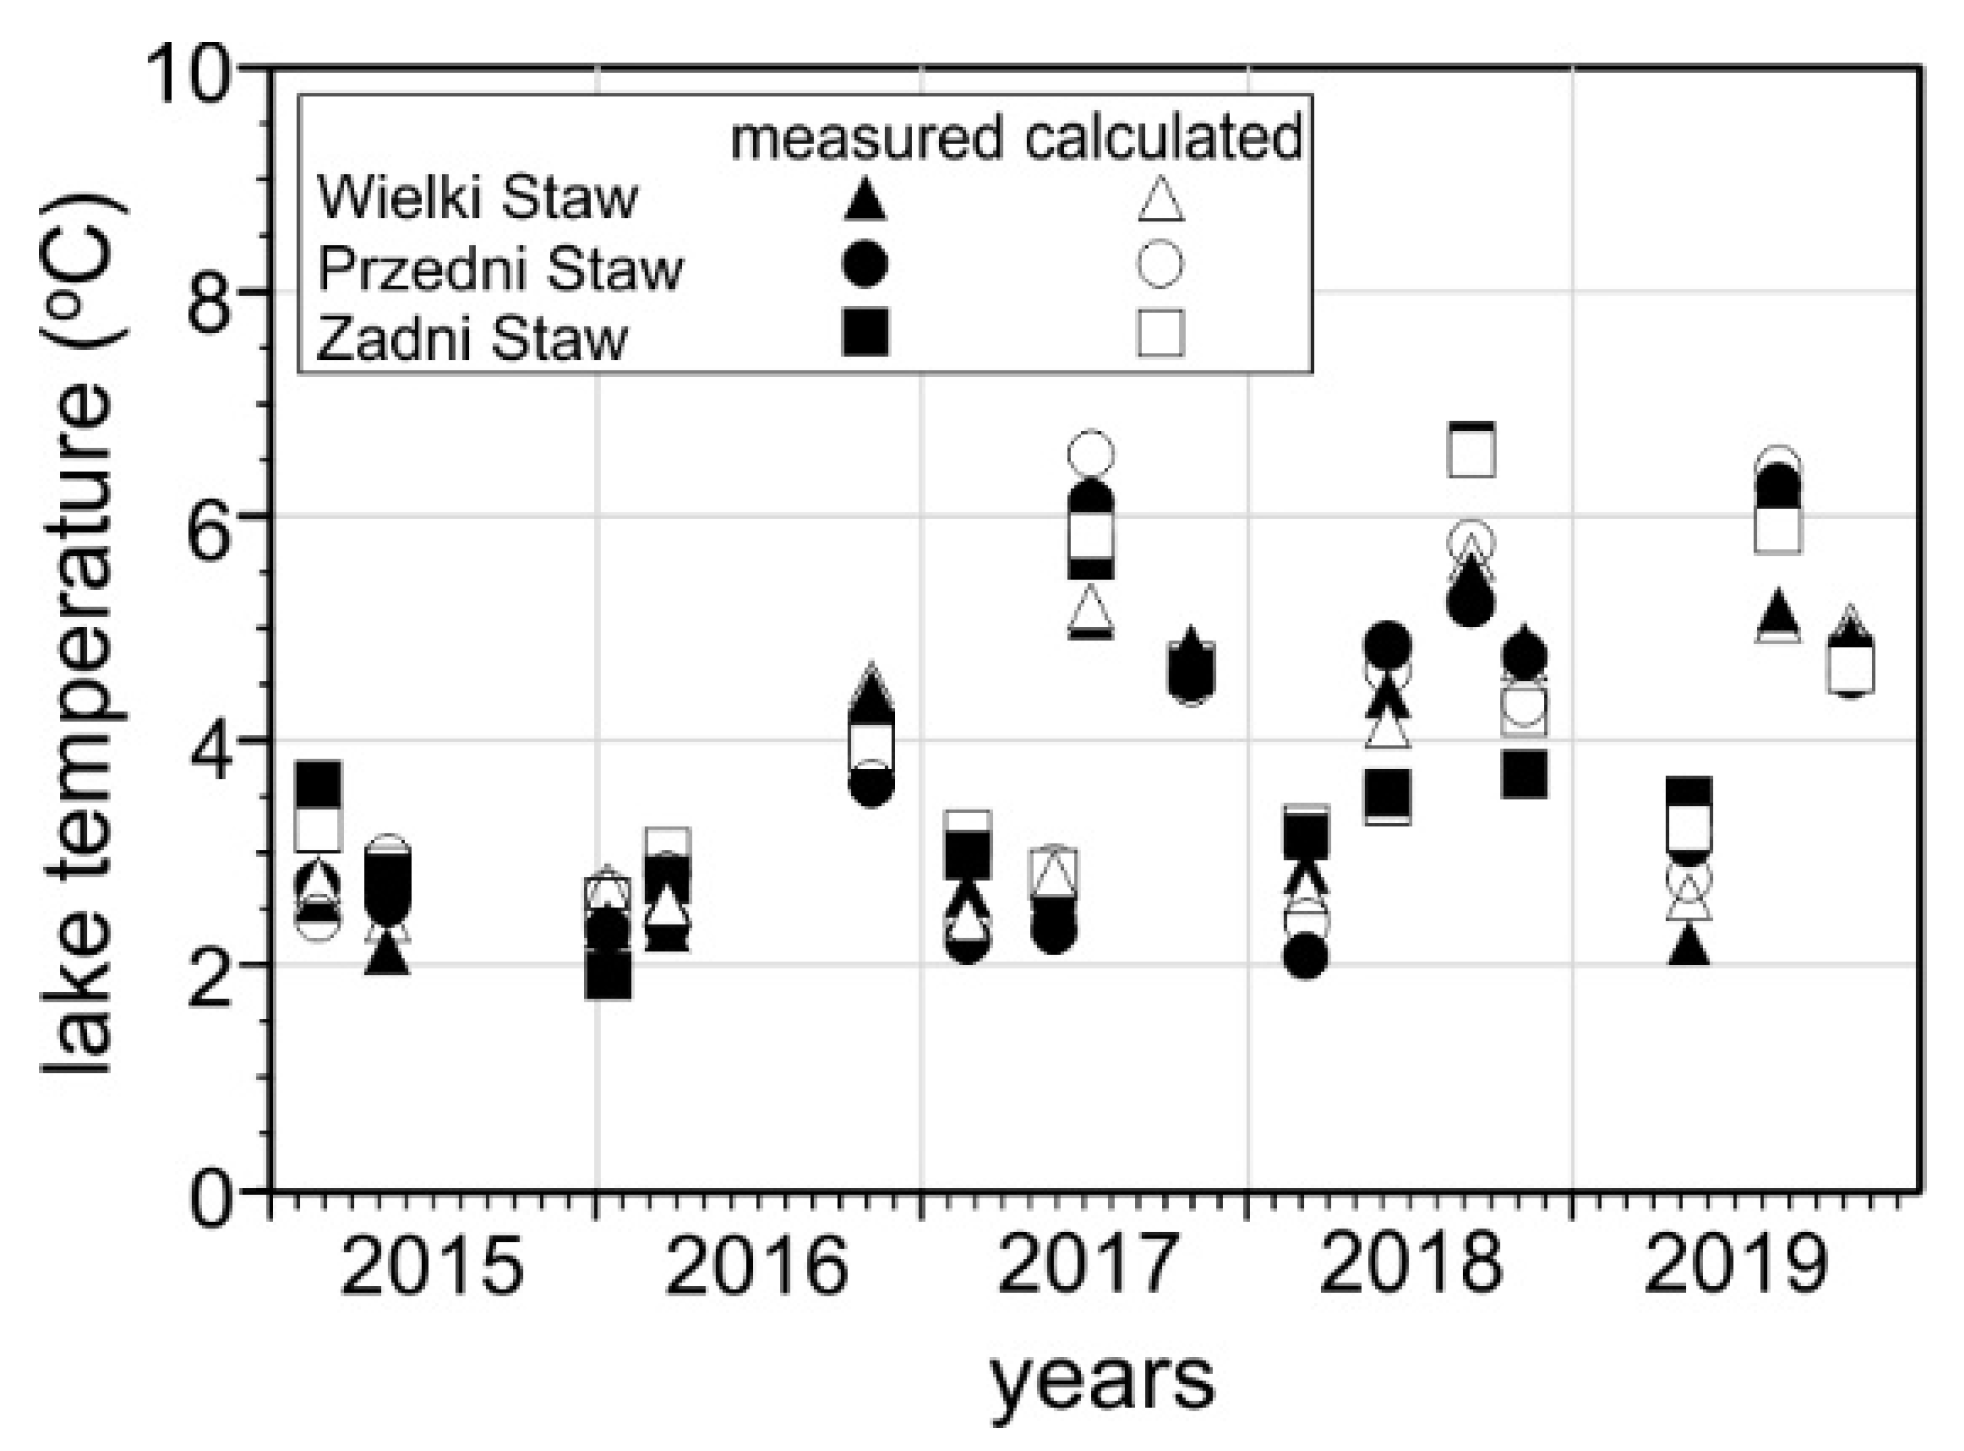
Figure 7.
Weighted mean water temperature of the lakes of the Dolina Pięciu Stawów Polskich valley in 2015–2019 determined on the basis of measurement data (black signatures) and Equations (6)–(17) (white signatures).
Figure 7.
Weighted mean water temperature of the lakes of the Dolina Pięciu Stawów Polskich valley in 2015–2019 determined on the basis of measurement data (black signatures) and Equations (6)–(17) (white signatures).


Table 1.
Morphometry of the lakes and their catchments in the Dolina Pięciu Stawów Polskich valley.
| Properties | Wielki Staw | Przedni Staw | Zadni Staw | |
|---|---|---|---|---|
| Lakes | ||||
| Al—Lake area (ha) | 34.5 | 7.8 | 7.1 | |
| V—Volume (m3) | 12,967,000 | 1,130,000 | 918,400 | |
| Hmax—Max. depth (m) | 79.3 | 34.6 | 31.6 | |
| Hmean—Mean depth (m) | 37.98 | 14.68 | 14.19 | |
| Lo—Lake openness index | 9083.73 | 5313.35 | 5003.53 | |
| Le—Mean effective length (m) | 725.0 | 349 | 308.5 | |
| Lake catchments | ||||
| Ac—Catchment area (ha) | 373.45 | 93.67 | 63.7 | |
| ΔH—Altitude difference (m) | 637 | 518 | 411 | |
| Binc—Mean inclination (‰) | 329.63 | 535.22 | 514.96 | |
| RSchindler—Schindler’s ratio | 0.32 | 0.9 | 0.77 | |
| Exposure (%) | N | 21.42 | 60.4 | 4.26 |
| E | 26.46 | 1.84 | 14.42 | |
| S | 34.56 | 1.97 | 56.65 | |
| W | 17.56 | 35.78 | 24.67 | |
| PISR—Potential incoming solar radiation (Wh/m2/a) | 12,787.74 | 10,975.38 | 12,977.43 | |
Publisher’s Note: MDPI stays neutral with regard to jurisdictional claims in published maps and institutional affiliations. |
© 2022 by the authors. Licensee MDPI, Basel, Switzerland. This article is an open access article distributed under the terms and conditions of the Creative Commons Attribution (CC BY) license (https://creativecommons.org/licenses/by/4.0/).
Share and Cite
MDPI and ACS Style
Szumny, M.; Gądek, B.; Laska, M.; Ciepły, M. Thermal Sensitivity of High Mountain Lakes: The Role of Morphometry and Topography (The Tatra Mts., Poland). Water 2022, 14, 2704. https://doi.org/10.3390/w14172704
AMA Style
Szumny M, Gądek B, Laska M, Ciepły M. Thermal Sensitivity of High Mountain Lakes: The Role of Morphometry and Topography (The Tatra Mts., Poland). Water. 2022; 14(17):2704. https://doi.org/10.3390/w14172704
Chicago/Turabian StyleSzumny, Mirosław, Bogdan Gądek, Michał Laska, and Michał Ciepły. 2022. "Thermal Sensitivity of High Mountain Lakes: The Role of Morphometry and Topography (The Tatra Mts., Poland)" Water 14, no. 17: 2704. https://doi.org/10.3390/w14172704
Note that from the first issue of 2016, this journal uses article numbers instead of page numbers. See further details here.