
Influence of Sub-Cloud Secondary Evaporation and Moisture Sources on Stable Isotopes of Precipitation in Shiyang River Basin, Northwest China
 ,
,
Abstract
:1. Introduction
2. Data and Methods
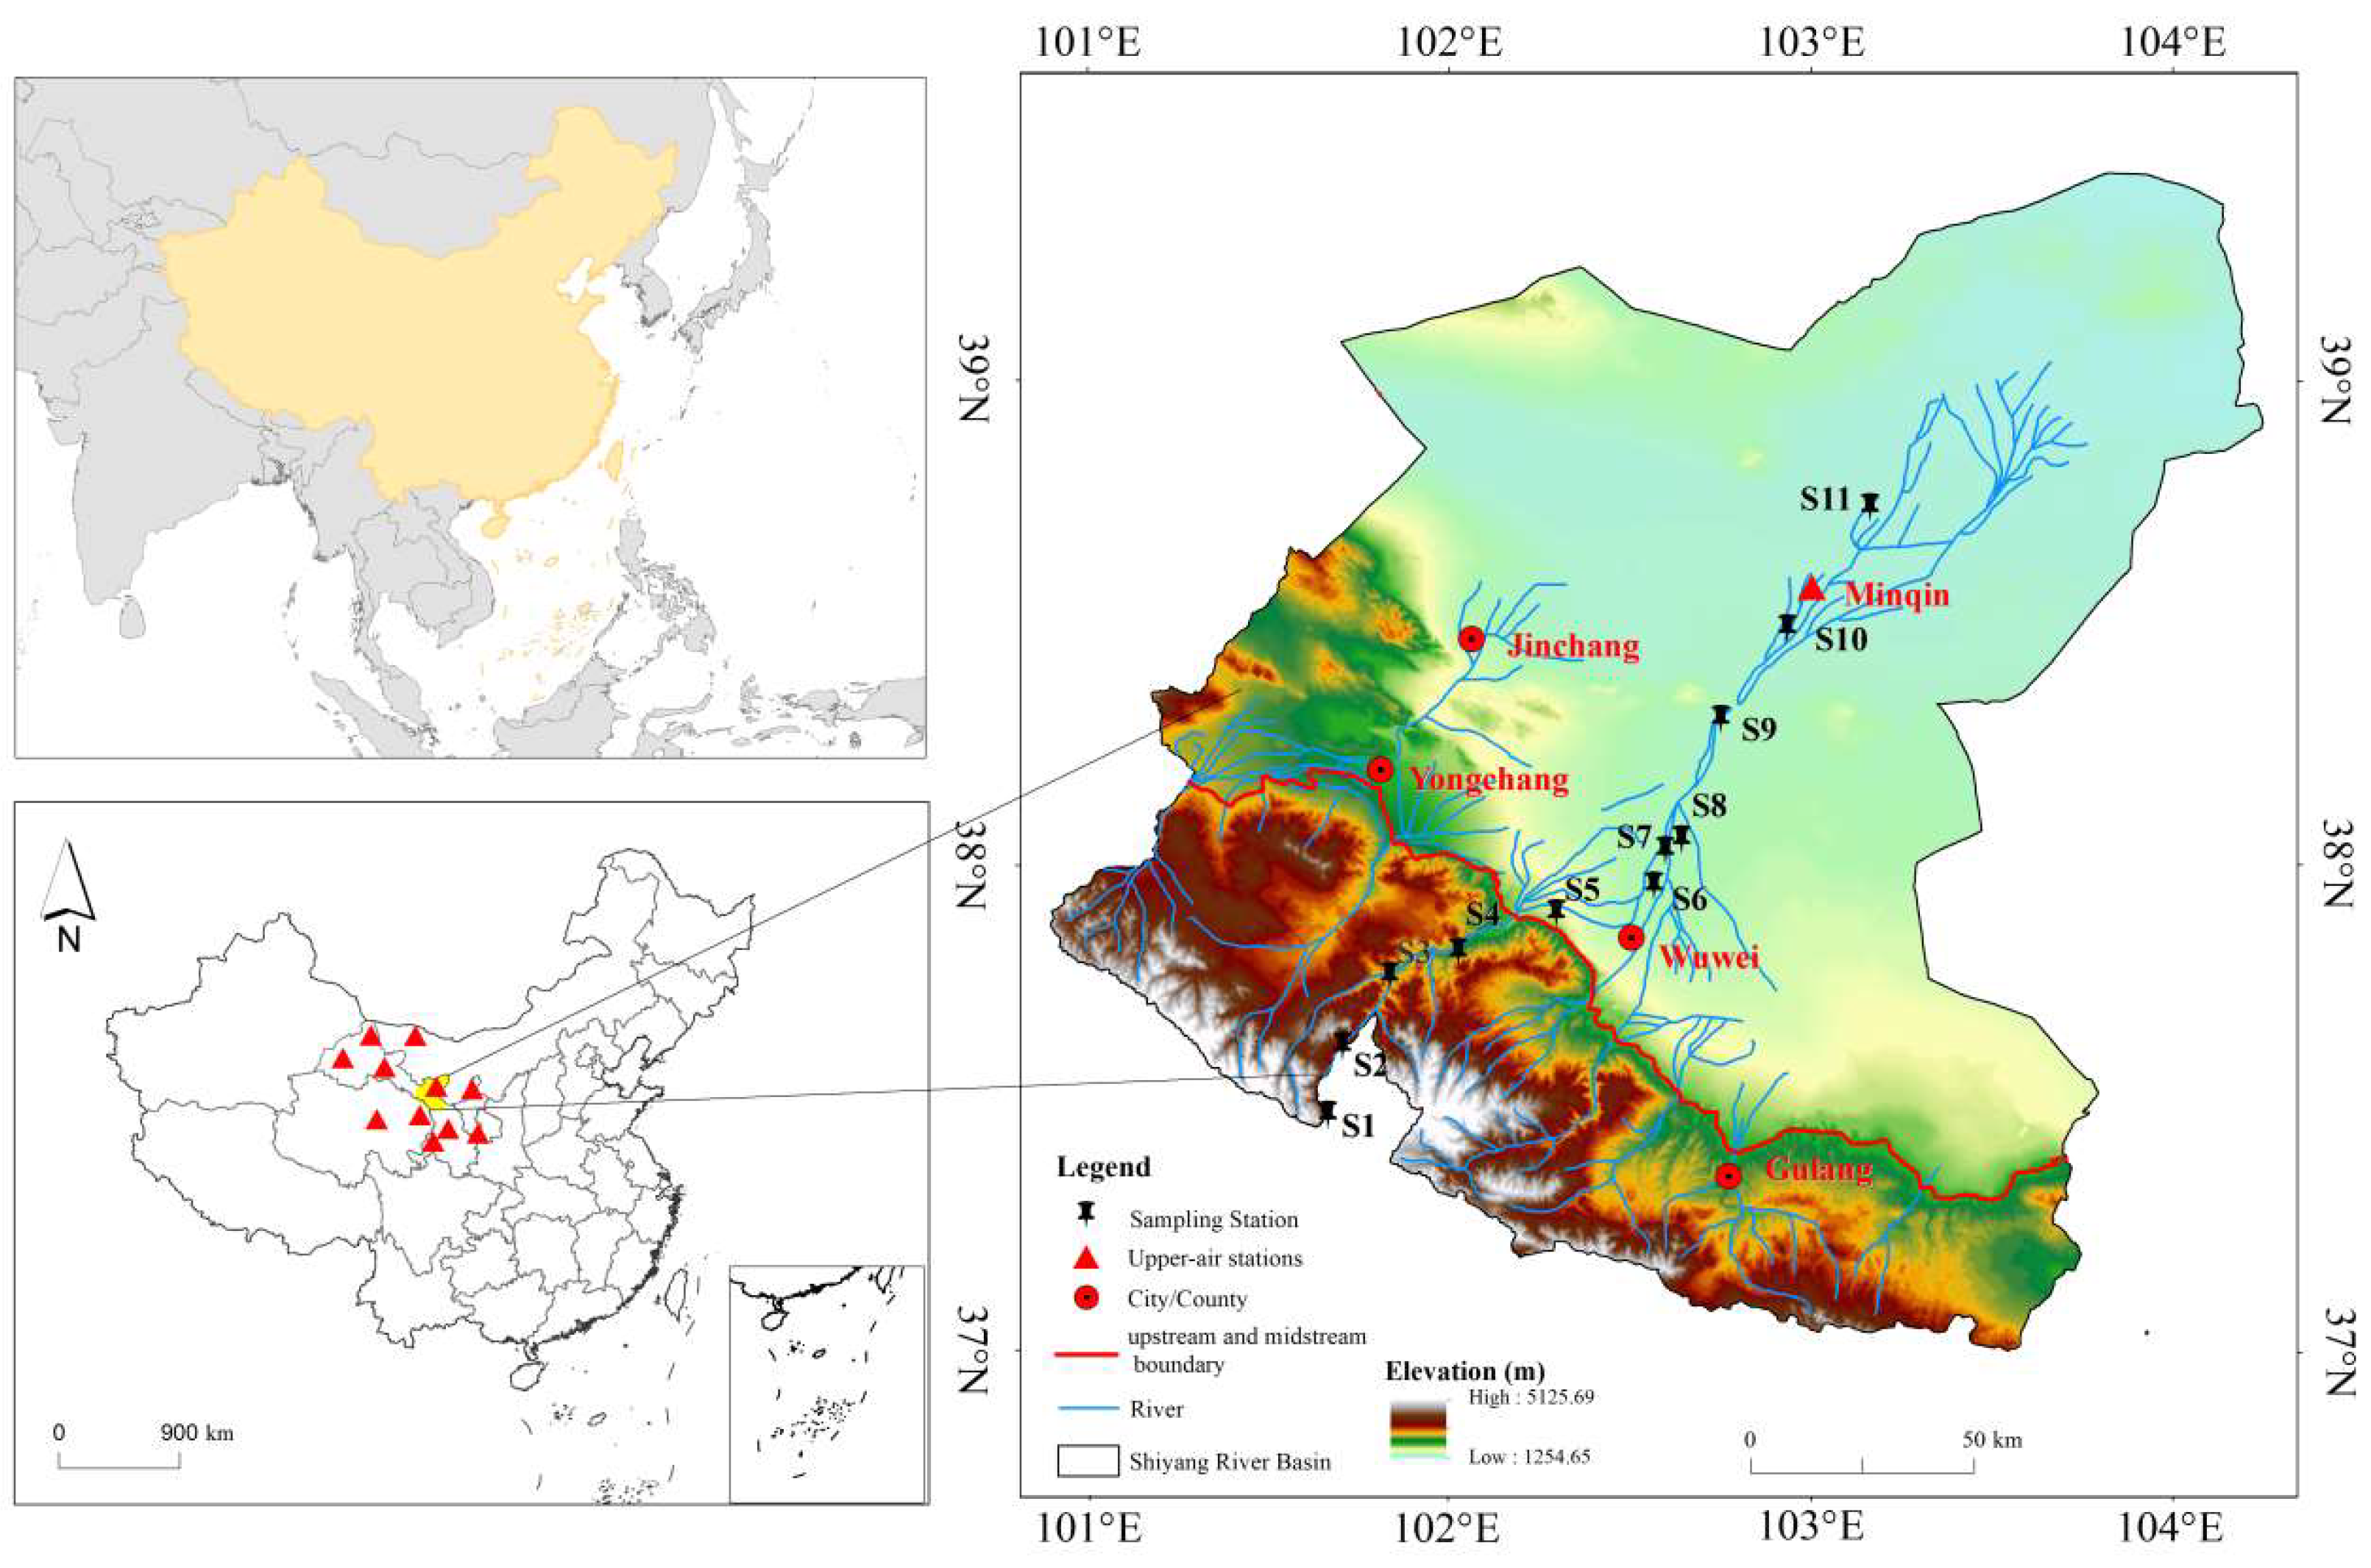
2.1. Study Area
2.2. Sample Collection and Data Sources
2.2.1. Collection and Processing of Precipitation Sample
2.2.2. Other Data Sources
2.3. Method
2.3.1. Local Meteoric Water Line
2.3.2. Raindrop Evaporation Model of Improved STEWART
2.3.3. Calculation of Atmospheric Vapor Flux and Contribution Rate of Water Vapor Transportation
2.3.4. Backward Trajectory Adjusted Using Specific Humidity
3. Results
3.1. Local Meteoric Water Line
3.2. Sub-Cloud Secondary Evaporation
3.2.1. The Sub-Cloud Secondary Evaporation Based on Homogeneous Assumptions
3.2.2. The Sub-Cloud Secondary Evaporation Based on Stratification Assumption
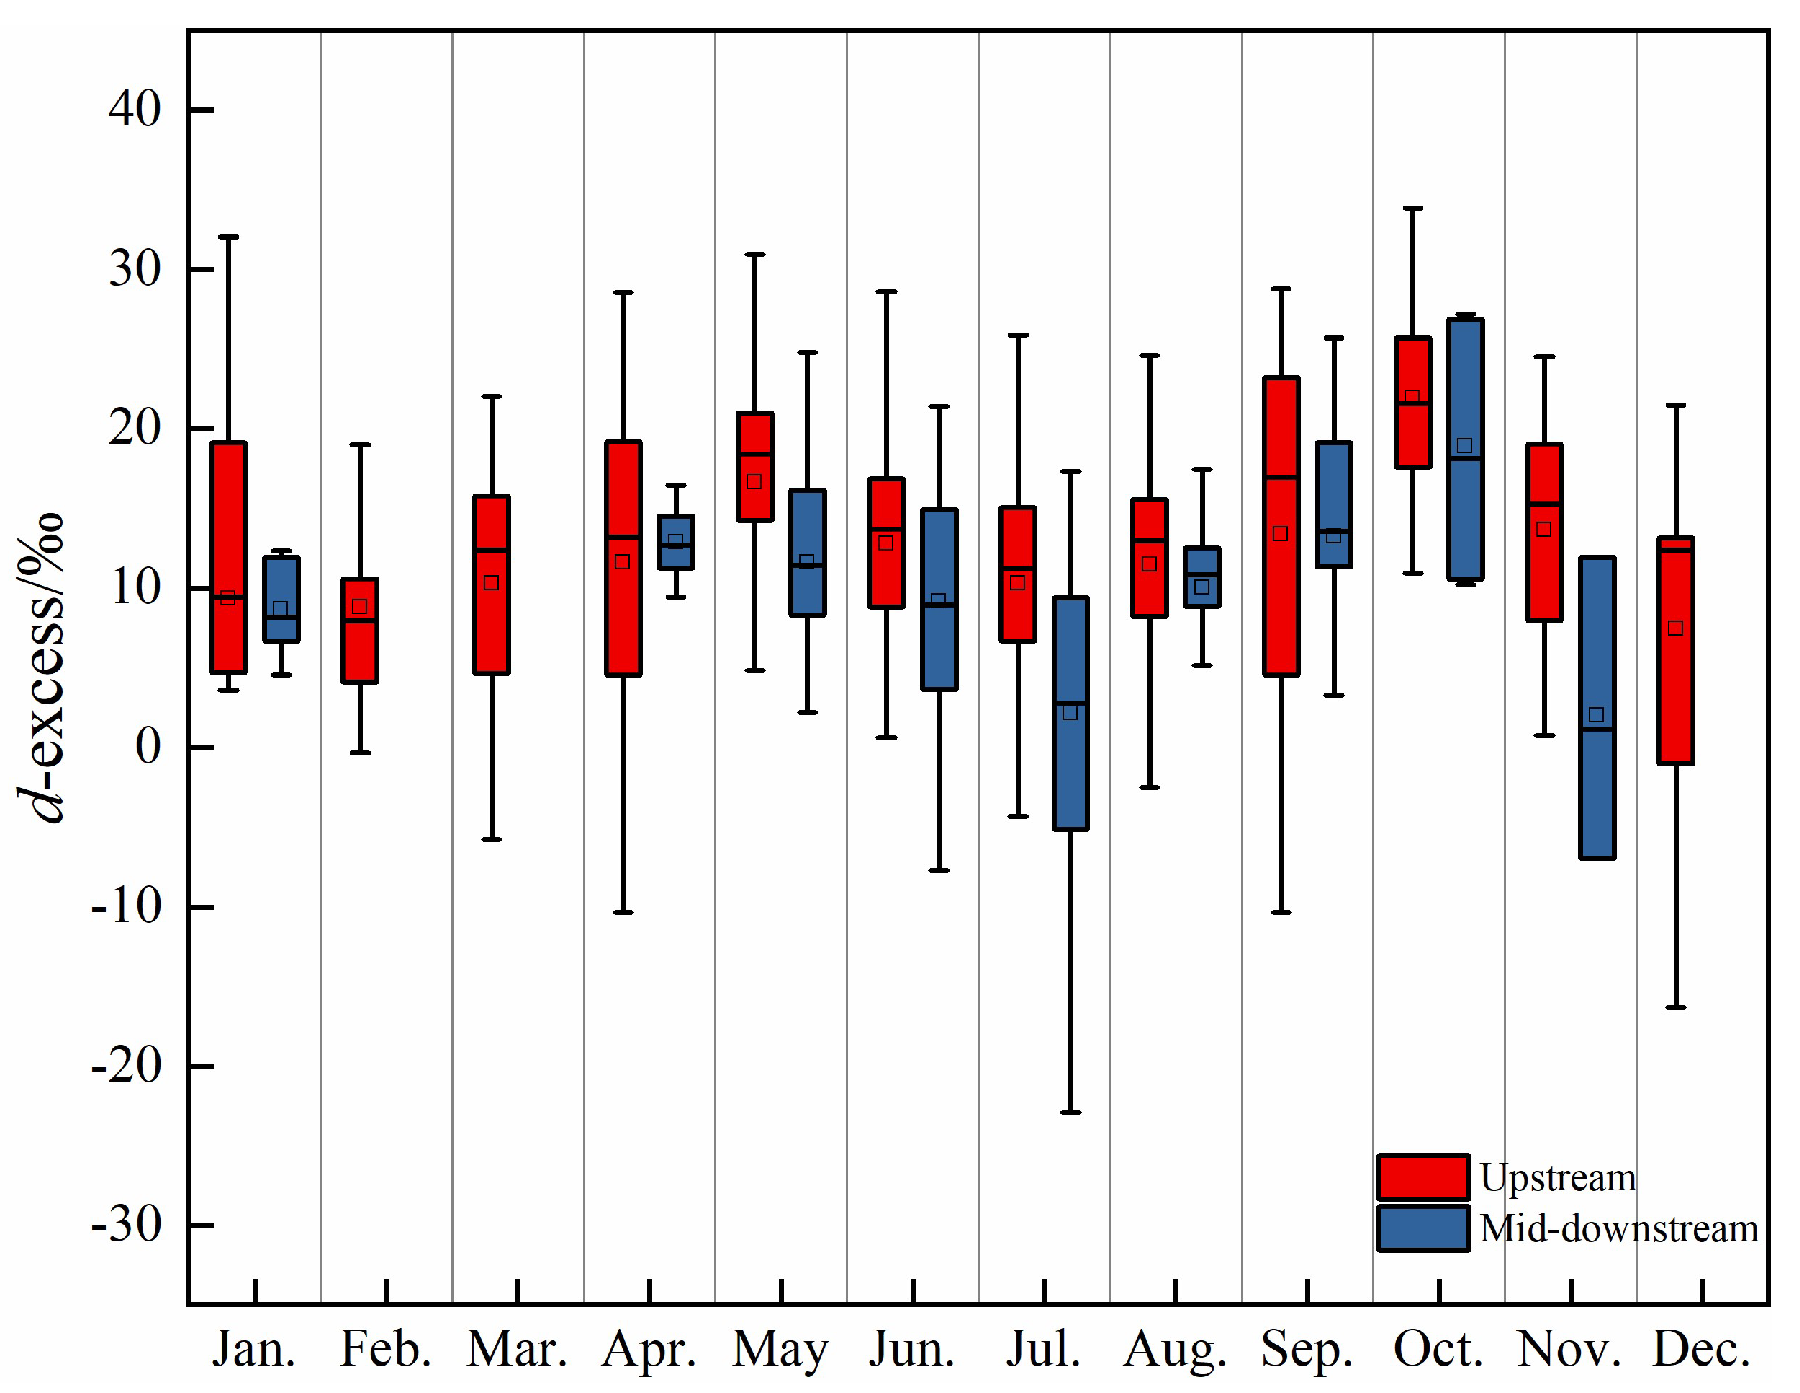
3.3. Temporal and Spatial Changes of d-Excess
3.4. The Influence of Moisture Source on Stable Isotope of Precipitation
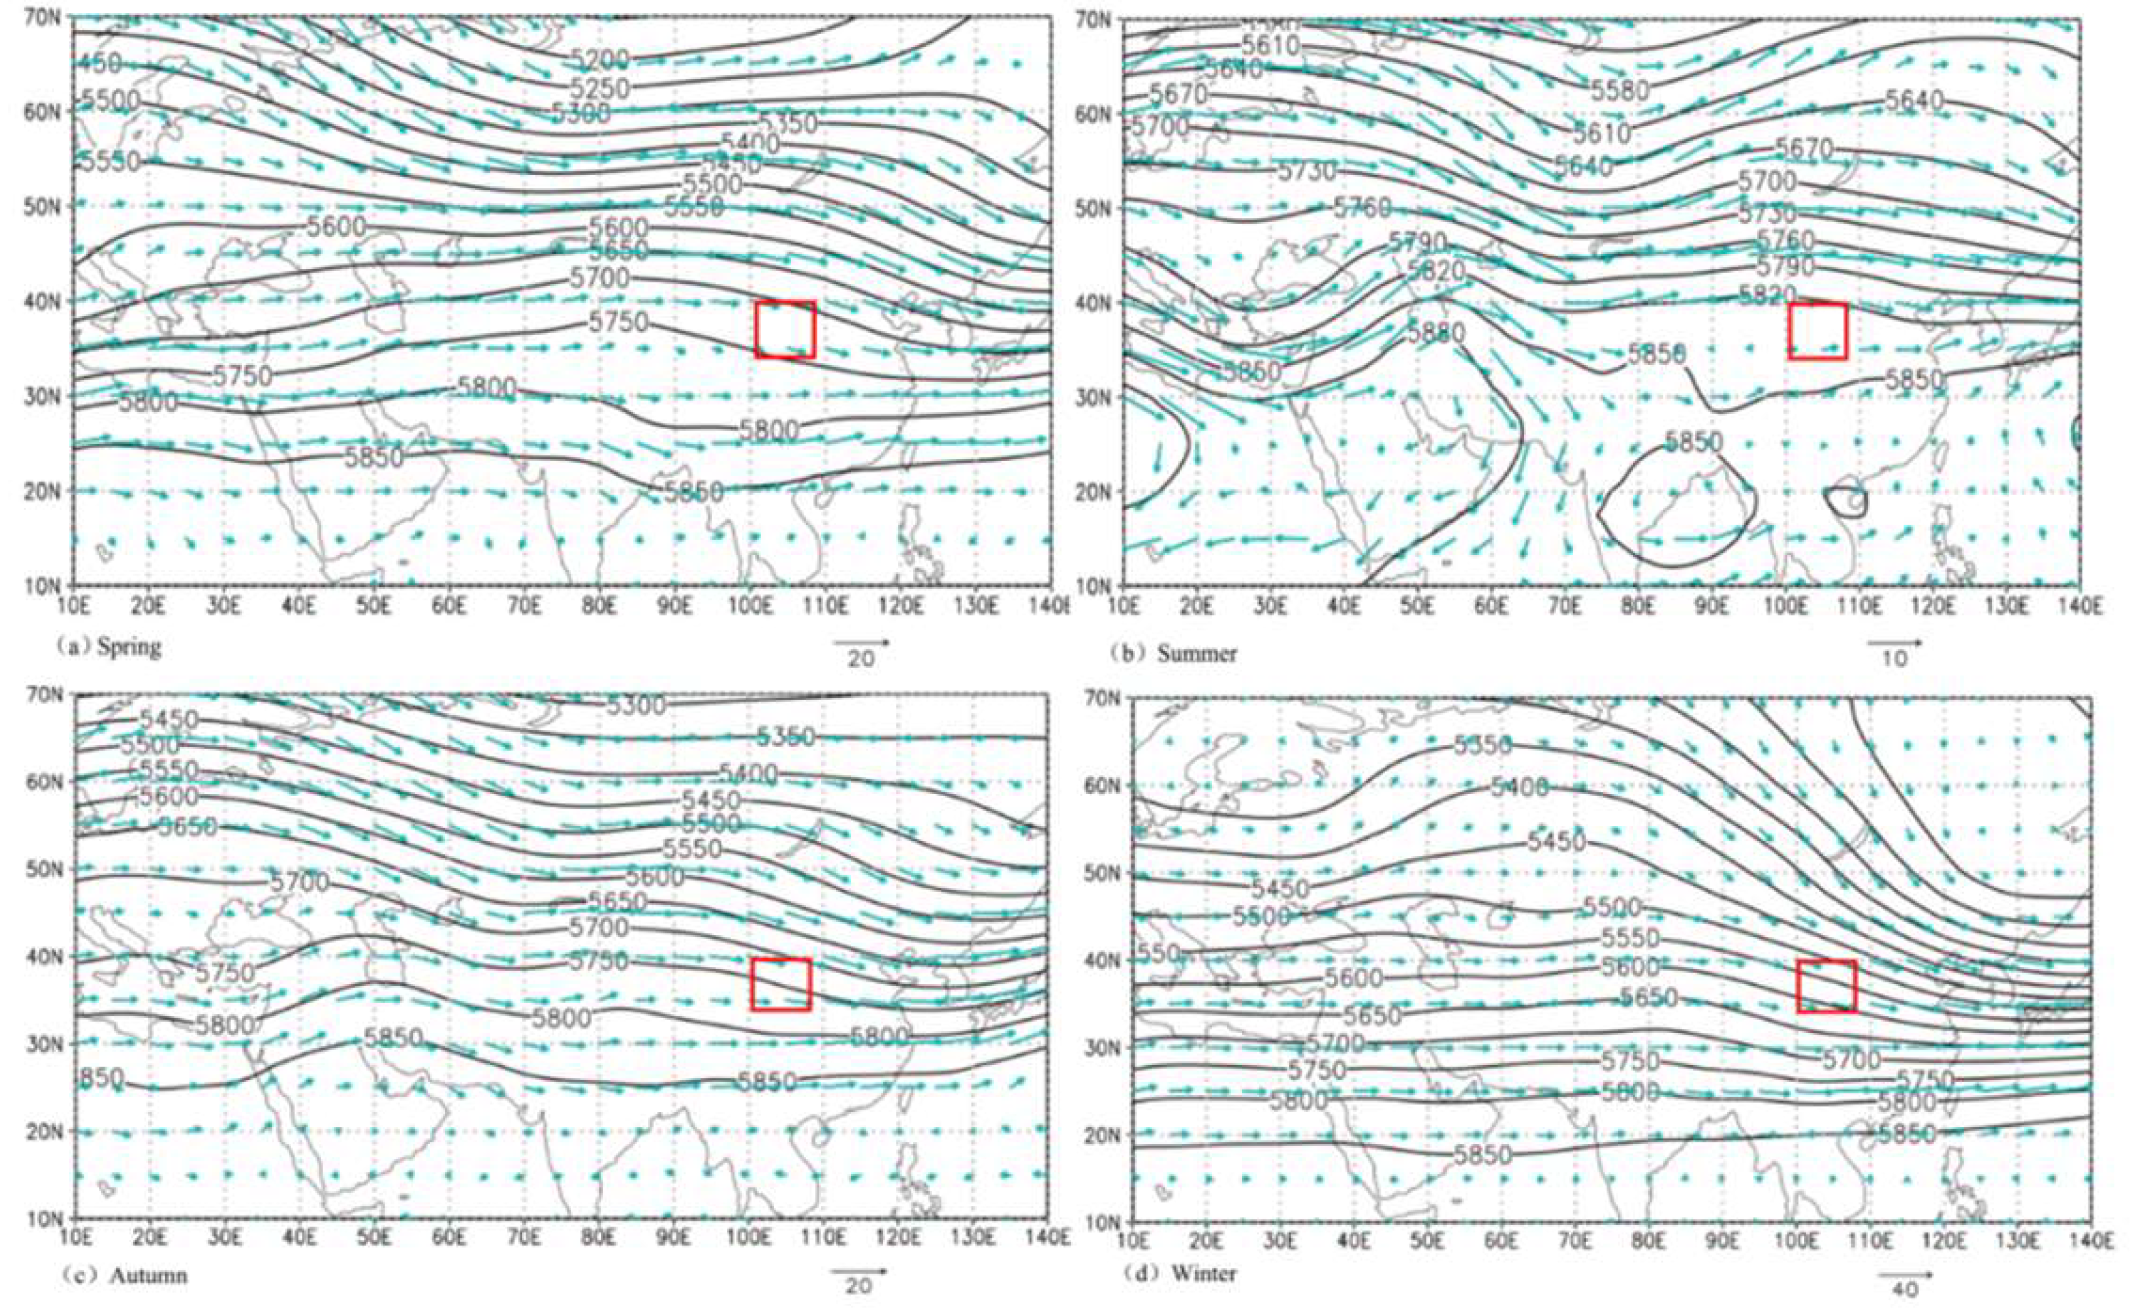
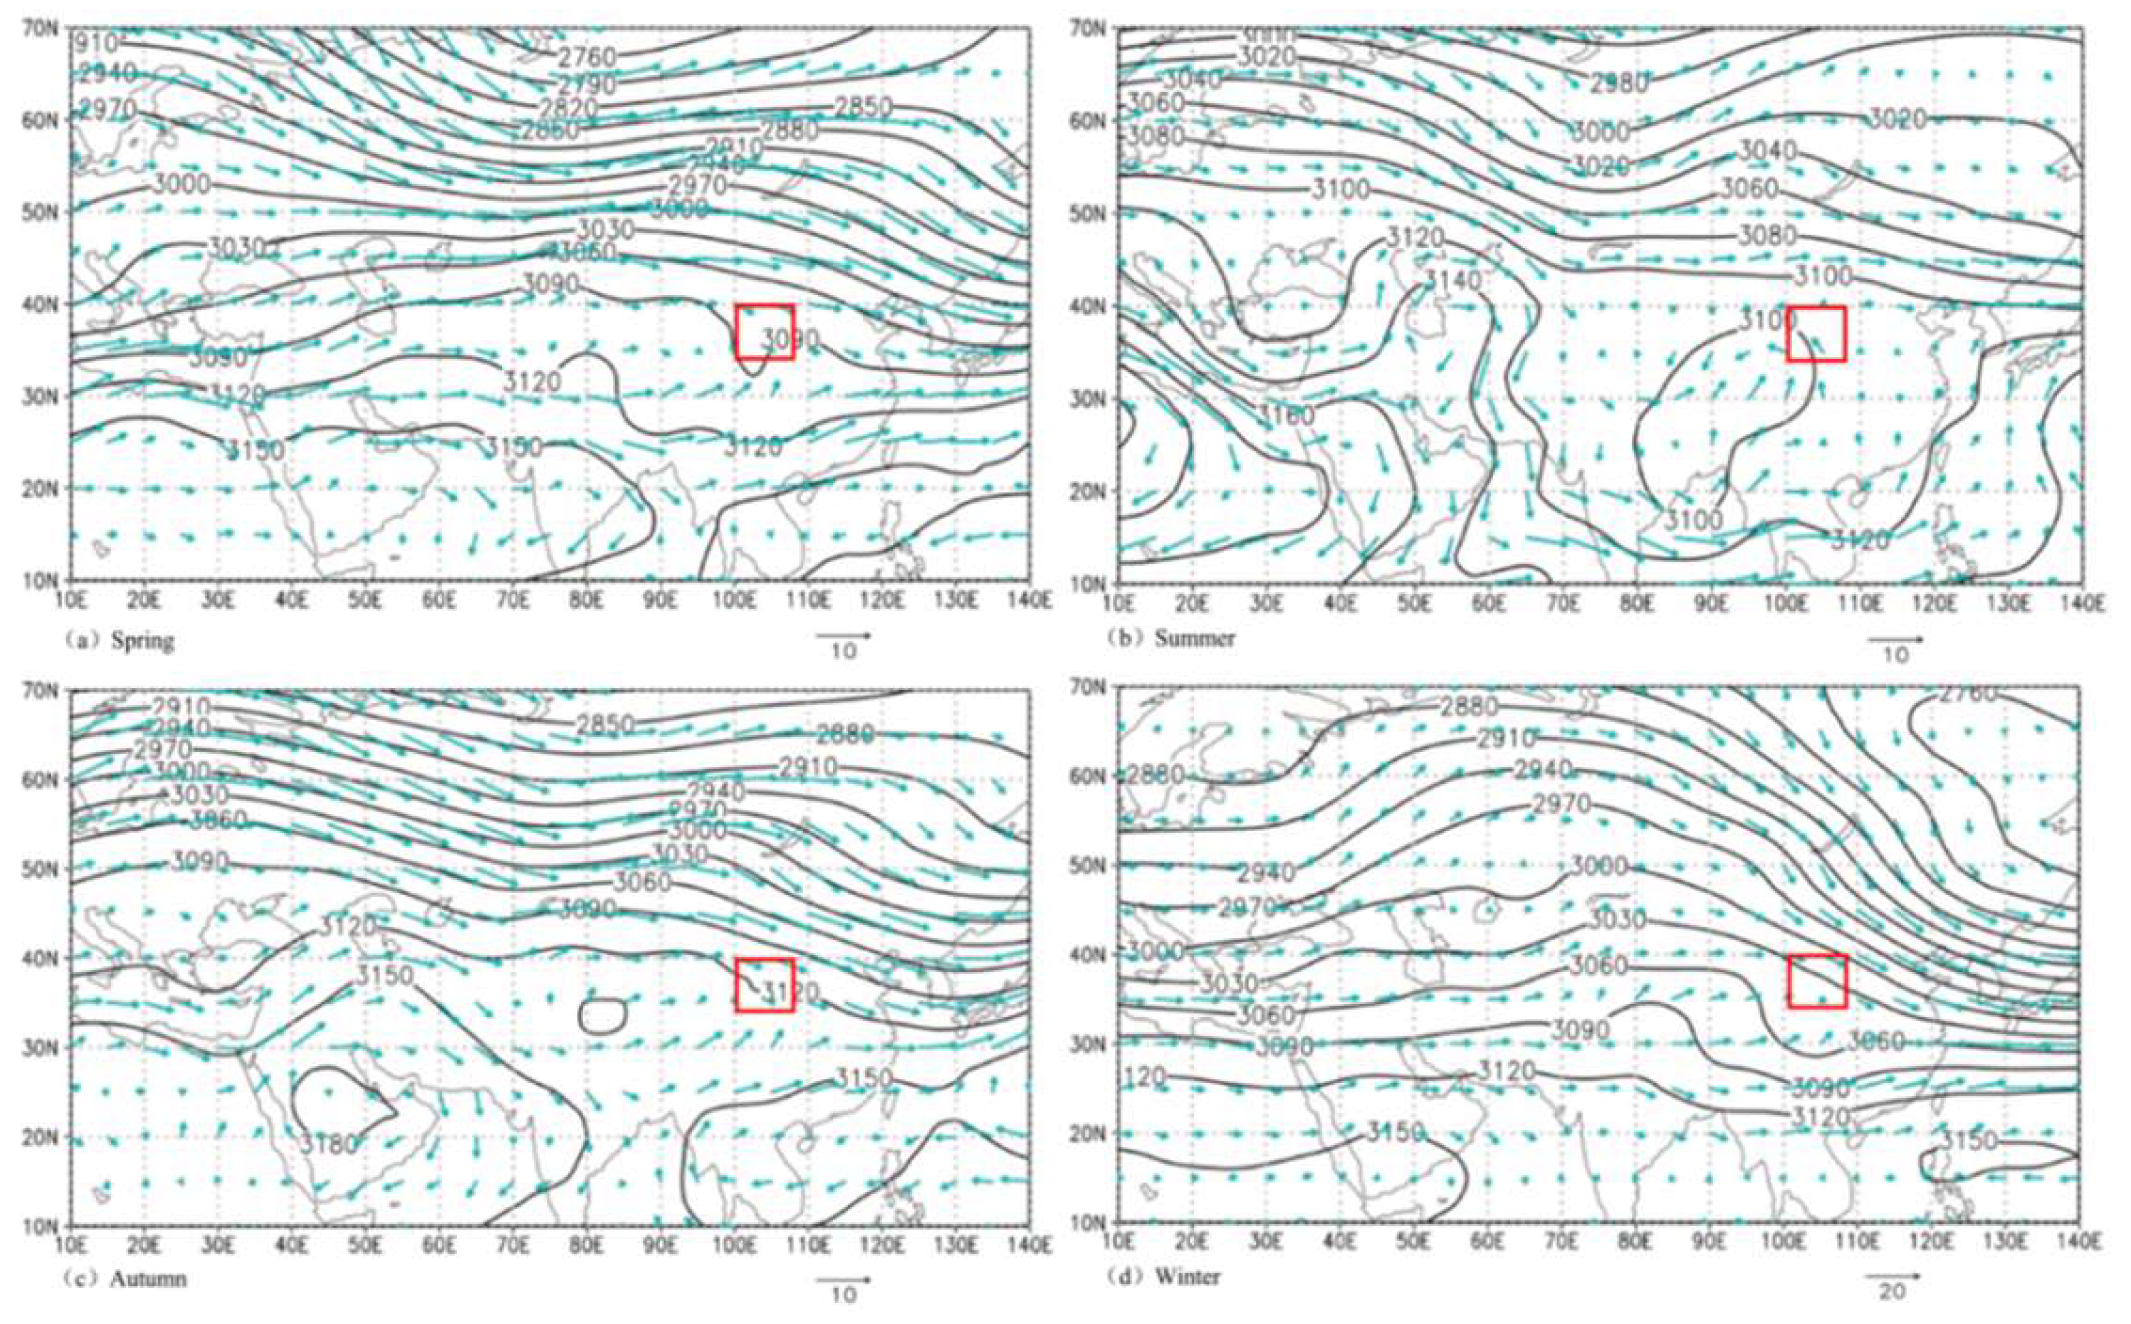
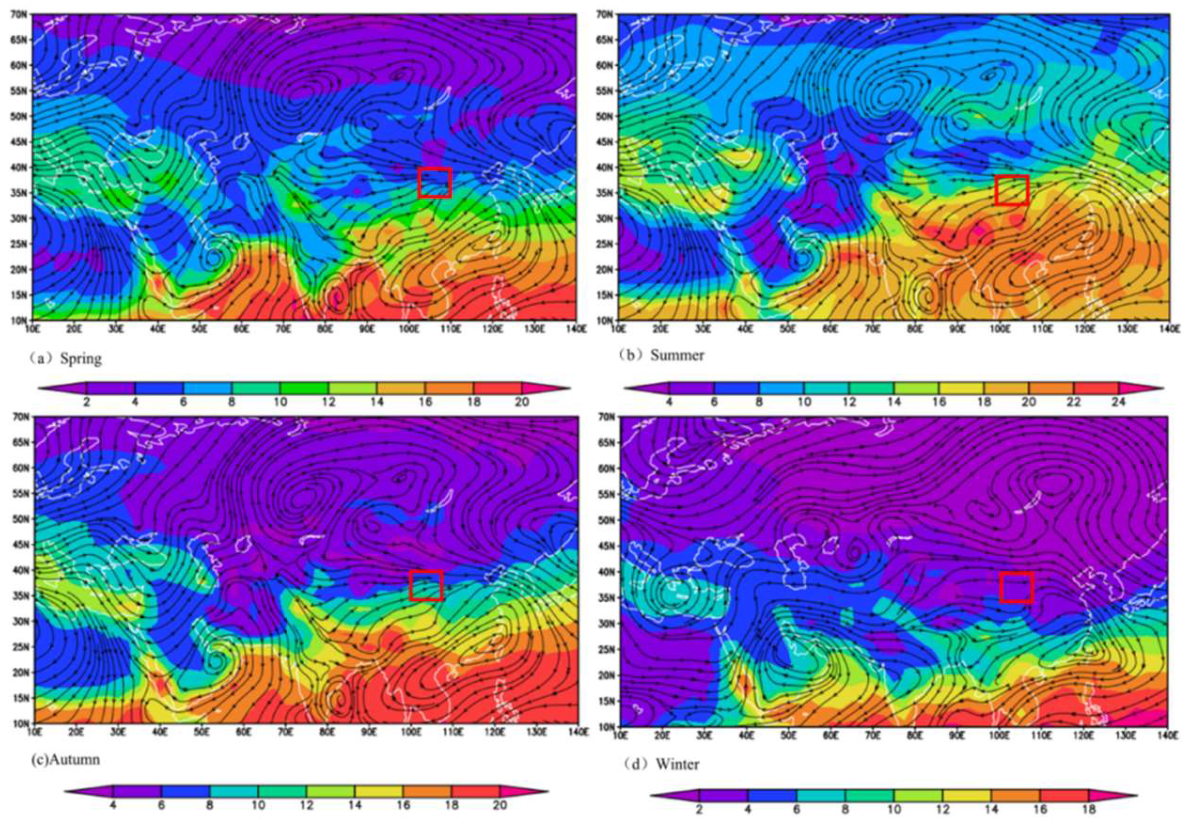
3.4.1. Analysis of the Moisture Source Based on Wind Field and Vapor Flux
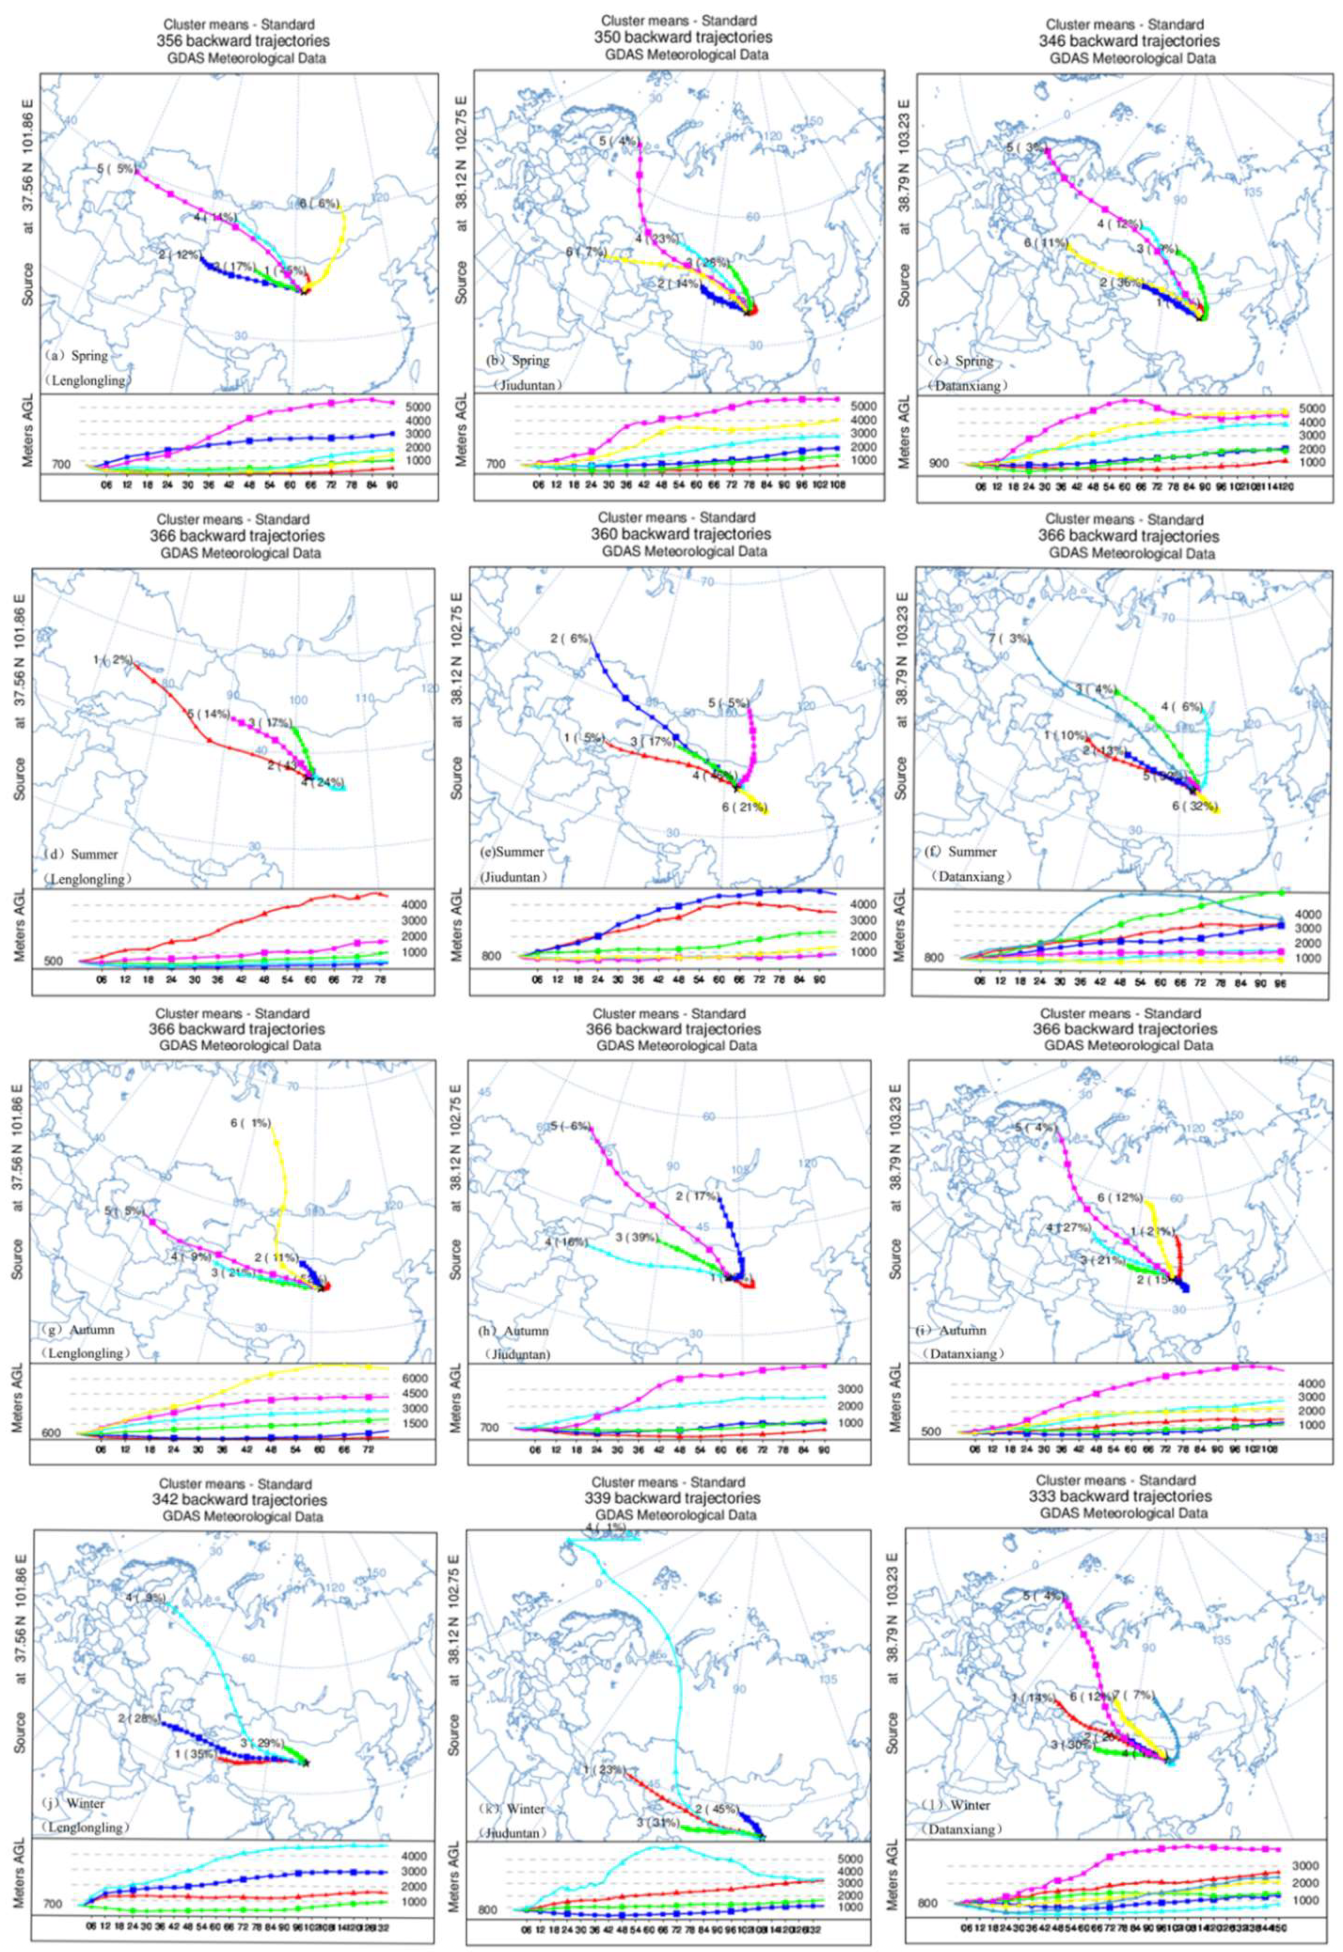
3.4.2. Analysis of the Moisture Source Based on the Lagrangian Model with the Correction of Specific Humidity
4. Discussion
5. Conclusions
Author Contributions
Funding
Institutional Review Board Statement
Informed Consent Statement
Data Availability Statement
Conflicts of Interest
References
- Aemisegger, F.; Pfahl, F.; Sodemann, H. Deuterium excess as a proxy for continental moisture recycling and plant transpiration. Atmos. Chem. Phys. 2014, 14, 4029–4054. [Google Scholar] [CrossRef]
- Araguás-Araguás, L.; Froehlich, K.; Rozanski, K. Stable isotope composition of precipitation over southeast Asia. J. Geophys. Res. Atmos. 1998, 103, 28721–28742. [Google Scholar] [CrossRef]
- Schotterer, U.; Oldfield, F.; Fröhlich, K. GNIP: Global Network for Isotopes in Precipitation; Druckerei Läderach: Bern, Switzerland, 1996; pp. 1–47. [Google Scholar]
- Zhang, Y.H.; Xu, Y.Q.; Wen, X.H. Application of environmental isotopes in water cycle. Adv. Water Sci. 2006, 17, 738–747. [Google Scholar]
- Gat, J.R. Oxygen and hydrogen isotopes in the hydroligic cycle. Annu. Rev. Earth Planet. Sci. 1996, 24, 225–262. [Google Scholar] [CrossRef]
- Dansgaard, W. Stable isotope in precipitation. Tellus 1964, 14, 436–468. [Google Scholar] [CrossRef]
- Friedman, I. Deuterium content of natural waters and other substance. Geochim. Cosmochim. Acta 1953, 4, 89–103. [Google Scholar] [CrossRef]
- Craig, H. Isotopic Variations in Meteoric Waters. Science 1961, 133, 1702–1703. [Google Scholar] [CrossRef]
- Jia, G.D.; Yu, X.X.; Fan, D.X. Study on Hydrogen and Oxygen Stable Isotopes in Precipitation in Both Sides Along Taihang Mountain. Yellow River 2011, 33, 34–36. (In Chinese) [Google Scholar]
- Wei, K.Q.; Lin, R.F. The influence of the monsoon climate on the isotopic composition of precipition in China. Geochimica 1993, 4, 33–41. [Google Scholar]
- Salamalikis, V.; Argiriou, A.A.; Dotsika, E. Isotopic modeling of the sub-cloud evaporation effect in precipitation. Sci. Total Environ. 2016, 544, 1059–1072. [Google Scholar] [CrossRef]
- Hideaki, M.; Naohiko, H.; Kazuhide, S. Seasonal variations in oxygen isotope ratios of daily collected precipitation and wind drift samples and in the final snow cover at Dome Fuji Station, Antarctica. J. Geophys. Res. Atmos. 2005, 110, D11106. [Google Scholar] [CrossRef]
- Liu, Z.; Tian, L.; Yao, T. Seasonal deuterium excess in Nagqu precipitation: Influence of moisture transport and recycling in the middle of Tibetan Plateau. Environ. Geol. 2008, 55, 1501–1506. [Google Scholar] [CrossRef]
- Zhang, Y.N.; Zhang, M.J.; Wang, S.J. Moisture Source for Short-Time Heavy Rainfall in Xinjiang Based on Specific Humidity-Adjusted Lagrangian Model. Arid. Zone Res. 2019, 36, 173–186. [Google Scholar] [CrossRef]
- Huang, M.H. Study on Precipitation Process in Monsoon Edge Region Based on Stable Isotope Technology—A Case Study of Binggou River Basin in the Eastern Qilian Mountains; Northwest Normal University: Lanzhou, China, 2020. (In Chinese) [Google Scholar]
- Kress, A.; Saurer, M.; Siegwolf, R.T. A 350 year drought reconstruction from Alpine tree ring stable isotopes. Glob. Biogeochem. Cycles 2010, 24, 1–16. [Google Scholar] [CrossRef]
- Wang, S.J. Stable Hydrogen and Oxygen Isotopes in Precipitation of the Tianshan Mountains and Their Significance in Hydrological Cycle; Northwest Normal University: Lanzhou, China, 2015. (In Chinese) [Google Scholar]
- Ma, X.G. Stable Isotopes in Precipitation of the Qilian Mountains and Their Significance in Sub-Cloud Evaporation; Northwest Normal University: Lanzhou, China, 2019. (In Chinese) [Google Scholar]
- Gu, W.Z. Isotope Hydrology; Science Press: Beijing, China, 2011. [Google Scholar]
- Zhou, P.P. Effects of Below-Cloud Secondary Evaporation for Stable Hydrogen and Oxygen Isotopes in Urumqi River Basin; Northwest Normal University: Lanzhou, China, 2017. (In Chinese) [Google Scholar]
- Wang, S.J.; Zhang, M.J. Spatio-temporal characteristics and influencing factors of stable isotopes in precipitation across the chinese tianshan mountains. Quat. Res. 2017, 37, 1119–1130. [Google Scholar] [CrossRef]
- Stewart, M.K. Stable isotope fractionation due to evaporation and isotopic exchange of falling waterdrops: Applications to atmospheric processes and evaporation of lakes. J. Geophys. Res. 1975, 80, 1133–1146. [Google Scholar] [CrossRef]
- Froehlich, K.; Gibson, J.J.; Aggarwal, P. Deuterium Excess in Precipitation and Its Climatological Significance; International Atomic Energy Agency: Vienna, Austria, 2002. [Google Scholar]
- Froehlich, K.; Kralik, M.; Papesch, W. Deuterium excess in precipitation of Alpine regions-moisture recycling. Isot. Environ. Health Stud. 2008, 44, 61–70. [Google Scholar] [CrossRef]
- Guan, H.; Zhang, X.; Skrzypek, G. Deuterium excess variations of rainfall events in a coastal area of South Australia and its relationship with synoptic weather systems and atmospheric moisture sources. J. Geophys. Res. Atmos. 2013, 118, 1123–1138. [Google Scholar] [CrossRef]
- Wang, S.J.; Zhang, M.J.; Che, C.Y. Influence of Below-Cloud Evaporation on Deuterium Excess in Precipitation of Arid Central Asia and Its Meteorological Controls. J. Hydrometeorol. 2016, 17, 1973–1984. [Google Scholar] [CrossRef]
- Crawford, J.; Hollins, S.E.; Meredith, K.T. Precipitation stable isotope variability and sub-cloud evaporation processes in a semi-arid region. Hydrol. Process. 2017, 31, 20–34. [Google Scholar] [CrossRef]
- Zhou, S.E.; Zhang, M.J.; Wang, S.J. A comparison of sub-cloud secondary evaporation effect of precipitation isotope in Xinjiang based on the Stewart model improvement scheme. J. Glaciol. Geocryol. 2019, 41, 304–315. [Google Scholar]
- Jiang, Z.H.; Ren, W.; Liu, Z.Y. Analysis of water vapor transport Characteristics during the Meiyu over the yangtze-huaihe River valley using the Lagrangian method. Acta Meteorologica. Sin. 2013, 71, 295–304. [Google Scholar] [CrossRef]
- Yao, T.; Masson-Delmotte, V.; Gao, J. A review of climatic controls on δ18O in precipitation over the Tibetan Plateau: Observations and simulations. Rev. Geophys. 2013, 51, 525–548. [Google Scholar] [CrossRef]
- Draxler, R.R.; Hess, G.D. An overview of HYSPLIT_4 modelling system for trajectories, dispersion and deposition. Aust. Meteorol. Mag. 1998, 47, 295–308. [Google Scholar]
- Sodemann, H.; Schwierz, C.; Wernli, H. Interannual variability of Greenland winter precipitation sources: Lagrangian moisture diagnostic and North Atlantic Oscillation influence. J. Geophys. Res. 2008, 113, 1–17. [Google Scholar] [CrossRef] [Green Version]
- Crawford, J.; Hughes, C.E.; Parkes, S.D. Is the isotopic composition of event based precipitation driven by moisture source or synoptic scale weather in the Sydney Basin, Australia? J. Hydrol. 2013, 507, 213–226. [Google Scholar] [CrossRef]
- Zhang, B.X. Study on Stable Isotope Characteristics of Meteoric Precipitation and Water Vapor Source in Shijiazhuang; Hebei Normal University: Shijiazhuang, China, 2020. (In Chinese) [Google Scholar]
- Wei, X.M.; Kang, S.Z.; Su, X.L. Impact of oasis agricultural development on the transforming relationship between surface water and and groundwater in the Shiyang River Basin. Trans. Chin. Soc. Agric. Eng. 2005, 21, 38–41. [Google Scholar]
- Zhong, H.P.; Liu, H.; Gu, Y. On water resources and environment protection of downstream Shiyang river in Minqin down stream. J. Water Resour. Water Eng. 2002, 13, 10–13. [Google Scholar]
- Wang, H.P.; Ning, B.S.; Zhang, S.H. Reasons for the deterioration of ecological environment in Shiyang River Basin and its remedial measures. Gansu Sci. Technol. 2016, 32, 10–12+90. (In Chinese) [Google Scholar]
- Zhang, L.L.; Zhou, J.J.; Zhang, H.W. Temporal and spatial patterns of climate drought-wet and drought event based on Standard Precipitation Index in Shiyang River Basin. Acta Ecol. Sin. 2017, 37, 996–1007. [Google Scholar] [CrossRef]
- Zhang, Y. Dynamics of Vegetation Cover and Desertification in Shiyang River Basin. Master’s Thesis, Gansu Agricultural University, Lanzhou, China, 2018. (In Chinese). [Google Scholar]
- Wang, X.M.; Zhang, B.; Wang, H.J. Maximum and minimum temperature changes in Shiyang River Basin in the last 50 years. Arid Land Geogr. 2010, 33, 879–888. [Google Scholar]
- Zhu, F.S.; Xiong, W.; Wang, K.H. Water Resources in Shiyang River Basin; Gansu People’s Publishing House: Lanzhou, China, 2010. (In Chinese) [Google Scholar]
- Sun, J. Analyzing Climate Cange Trends and Abrupts in Shiyangriver Basin for 47 Years; Lanzhou University: Lanzhou, China, 2008. (In Chinese) [Google Scholar]
- Kang, S.Z.; Su, X.L.; Du, T.S. Water Resources Transformation Law and Water-Saving Regulation Mode at Basin Scale in Arid Regions of Northwest China: A Case Study of Shiyang River Basin in Gansu; China Water & Power Press: Beijing, China, 2009. (In Chinese) [Google Scholar]
- Zhong, X.L. Analysis on Runoff Characteristics of Shiyang River Basin. Gansu Water Resour. Hydropower Technol. 2011, 47, 8–10. [Google Scholar]
- IAEA (International Atomic Energy Agency). Statistical Treatment of Data on Environmental Isotopes in Precipitation; Technical Reports Series No. 331; IAEA: Vienna, Austria, 1992. [Google Scholar]
- Criss, R.E. Principles of Stable Isotope Distribution; Oxford University: New York, NY, USA, 1999. [Google Scholar]
- Friedman, I.; O’Neil, J.R. Compilation of Stable Isotope Fractionation Factors of Geochemical Interest; Data of Geochemistry; US Government Printing Office: Washington, DC, USA, 1977. [Google Scholar]
- Berberan-Santos, M.N. On the barometric formula. Am. J. Phys. 1997, 65, 404–412. [Google Scholar] [CrossRef]
- Kinzer, G.D.; Gunn, R. The Evaporation, Temperature and Thermal Relaxation-Time of Freely Falling Waterdrops. J. Atmos. Sci. 1951, 8, 71–83. [Google Scholar] [CrossRef]
- Best, A.C. Empirical formulae for the terminal velocity of water drops falling through the atmosphere. Q. J. R. Meteorol. Soc. 1950, 76, 302–311. [Google Scholar] [CrossRef]
- Liu, G.W. Atmospheric Process of Hydrological Cycle; Beijing Science Press: Beijing, China, 1997. [Google Scholar]
- Huang, Y.; Liu, T.; Zhang, Y.H. Features of a Regional Rainstorm in Midsummer of 2010 in Western Xinjiang. J. Arid Meteorol. 2012, 30, 615–622. (In Chinese) [Google Scholar]
- Sun, L.; Ma, L.C.; Shen, B.Z.; Dong, W.; Sui, B. Analysis of the characteristics of water vapor transport during the heavy rain in Northeast China from July to August 2010. Chin. J. Atmos. Sci. 2016, 40, 630–646. [Google Scholar] [CrossRef]
- Rozanski, K. Isotope Patterns in Modern Global Precipitation. In Climate Change in Continental Isotope Records; Geophysical Monograph 78; American Geophysical Union: Washington, DC, USA, 1993. [Google Scholar]
- Peng, H.; Mayer, B.; Harris, S. The influence of below-cloud secondary effects on the stable isotope composition of hydrogen and oxygen in precipitation at Calgary, Alberta, Canada. Tellus B 2007, 59, 698–704. [Google Scholar] [CrossRef]
- Wu, H.; Zhang, X.; Li, X. Seasonal variations of deuterium and oxygen-18 isotopes and their response to moisture source for precipitation events in the subtropical monsoon region. Hydrol. Process. 2015, 29, 90–102. [Google Scholar] [CrossRef]
- Shi, M. Intra-Event Variability of Stable Hydrogen and Oxygen Isotopes in Precipitation and the Relationship with Water Vapor Isotopes in the Upper Reaches of the Urumqi River; Northwest Normal University: Lanzhou, China, 2020. (In Chinese) [Google Scholar]
- Yuan, R.F.; Jia, W.X.; Li, Z.X. Precipitation stable isotope regional difference in Shiyang River basin. China Environ. Sci. 2020, 40, 4945–4956. [Google Scholar]
- Gu, X.Q. Effects of Water Vapor Transport of Meiyu on Stable Isotopes in Atmospheric Wapor in the Typical Area of the Middle and Lower Reachers of the Yangtze River—A Case Study in Nanjing; Nanjing University: Nanjing, China, 2018. (In Chinese) [Google Scholar]
- Merlivat, L.; Jouzel, J. Global climatic interpretation of the deuterium-oxygen 18 relationship for precipitation. J. Geophys. Res. Ocean. 1979, 84, 5029–5033. [Google Scholar] [CrossRef]
- Xu, X.T. Analyses of Regional Differences of Hydrogen and Oxcegen Isotopes in Precipitation and Vapor Sources in Shiyang River Basin; Northwest Normal University: Lanzhou, China, 2020. (In Chinese) [Google Scholar]
- Yuan, R.F. Study on Stable Isotope Characteristics and Sources of Precipitation and River Water of Shiyang River Basin; Northwest Normal University: Lanzhou, China, 2020. (In Chinese) [Google Scholar]
- Ye, D.Z.; Fu, Z.B. Major issues of global change sciences. Chin. J. Atmos. Sci. 1994, 18, 498–512. [Google Scholar]
- Galewsky, J.; Steen-Larsen, C.H.; Field, R.D. Stable isotopes in atmospheric water vapor and applications to the hydrologic cycle. Rev. Geophys. 2016, 54, 809–865. [Google Scholar] [CrossRef] [PubMed]


| Station | Longtitude (E) | Latitude (N) | Altitude (m) | Number of Samples | Research Period | Mean δD (‰) | Mean δ18O (‰) | Intercept (‰) | Slope | r2 | Theoretical Slope (ST) |
|---|---|---|---|---|---|---|---|---|---|---|---|
| Lenglongling | 101.86° | 37.56° | 3653 | 188 | January 2018–August 2019 | −68.19 | −10.26 | 12.70 | 7.88 | 0.98 | 8.87 |
| Hulinzhan | 101.86° | 37.69° | 2720 | 65 | March 2018–August 2019 | −43.62 | −7.16 | 11.65 | 7.69 | 0.97 | 8.78 |
| Huajianxiang | 102.01° | 37.84° | 2324 | 150 | January 2018–September 2019 | −52.54 | −7.80 | 7.70 | 7.72 | 0.99 | 8.61 |
| Xiyingwugou | 102.18° | 37.89° | 2096 | 72 | January 2018–October 2019 | −78.40 | −11.29 | 11.15 | 7.93 | 0.99 | 8.58 |
| Xiyingzhen | 102.43° | 37.97° | 1748 | 43 | May 2018–April 2019 | −46.30 | −6.77 | 3.64 | 7.38 | 0.98 | 8.52 |
| Yangxiaba | 102.69° | 38.03° | 1489 | 23 | May 2018–January 2019 | −29.57 | −4.49 | 1.10 | 6.82 | 0.97 | 8.41 |
| Dengjiazhuang | 102.71° | 38.10° | 1468 | 15 | July 2019–October 2019 | −60.15 | −8.89 | 11.25 | 8.04 | 0.98 | 8.38 |
| Jiuduantan | 102.75° | 38.12° | 1464 | 25 | May 2018–September 2019 | −31.77 | −5.42 | 3.68 | 5.18 | 0.75 | 8.48 |
| Hongqigu | 102.85° | 38.36° | 1421 | 19 | April 2019–October 2019 | −34.28 | −5.53 | 0.77 | 6.34 | 0.89 | 8.43 |
| Xuebaizhen | 103.02° | 38.55° | 1387 | 13 | May 2018–October 2018 | −37.54 | −6.14 | 1.99 | 6.44 | 0.96 | 8.36 |
| Datanxiang | 103.23° | 38.79° | 1348 | 57 | April 2018–September 2019 | −47.08 | −7.03 | 4.22 | 7.29 | 0.96 | 8.19 |
| Station | T (°C) | RH (%) | D (mm) | H (m) | F (%) | Δd (‰) |
|---|---|---|---|---|---|---|
| Lenglongling | 3.23 | 71.77 | 0.85 | 577.77 | 76.97 | −3.03 |
| Hulinzhan | 10.12 | 73.74 | 0.94 | 568.88 | 78.72 | −2.39 |
| Huajianxiang | 12.22 | 60.07 | 1.11 | 968.38 | 68.71 | −4.14 |
| Xiyingwugou | 7.81 | 69.88 | 0.94 | 649.54 | 73.74 | −3.69 |
| Xiyingzhen | 15.3 | 60.73 | 0.84 | 980.65 | 51.36 | −12.39 |
| Yangxiaba | 16.07 | 58.71 | 0.93 | 1038.14 | 53.33 | −9.89 |
| Dengjiazhuang | 19.27 | 69.57 | 1.26 | 713.94 | 79.12 | −1.73 |
| Jiuduntan | 21.34 | 69.71 | 1.18 | 762.26 | 72.12 | −2.83 |
| Xuebaizhen | 21.12 | 69.19 | 1.01 | 773.20 | 67.00 | −4.71 |
| Hongqigu | 20.02 | 62.6 | 1.32 | 1006.48 | 70.42 | −3.88 |
| Datanxiang | 23.36 | 68.44 | 0.94 | 818.85 | 60.82 | −4.21 |
| Group | Station | Stratification | T (°C) | RH (%) | H (m) | D (mm) | f (%) | Δδ18O (‰) | Δδ2H (‰) | Δd (‰) |
|---|---|---|---|---|---|---|---|---|---|---|
| ① | Lenglongling | Ground–500 hPa | 1.14 | 69.58 | 576.47 | 0.81 | 76.47 | 5.94 | 25.31 | −22.18 |
| ② | Hulinzhan | Ground–700 hPa | 8.65 | 68.47 | 306.21 | 0.93 | 84.42 | 3.36 | 13.06 | −13.78 |
| 700 hPa–500 hPa | 5.92 | 63.94 | 369.68 | 0.99 | 85.37 | 2.71 | 10.79 | −10.92 | ||
| Huajianxiang | Ground–700 hPa | 9.19 | 60.12 | 670.57 | 0.81 | 62.32 | 9.66 | 38.64 | −38.65 | |
| 700 hPa–500 hPa | 2.28 | 53.34 | 469.49 | 0.96 | 85.57 | 4.09 | 16.91 | −15.82 | ||
| Xiyingwugou | Ground–700 hPa | 5.87 | 67.07 | 601.64 | 0.77 | 69.79 | 7.16 | 29.05 | −28.20 | |
| 700 hPa–500 hPa | 3.05 | 49.52 | 344.94 | 0.93 | 86.49 | 3.92 | 15.49 | −15.84 | ||
| Xiyingzhen | Ground–700 hPa | 11.52 | 62.32 | 902.58 | 0.84 | 55.32 | 11.2 | 44.44 | −45.18 | |
| 700 hPa–500 hPa | 3.86 | 54.34 | 335.70 | 1.10 | 92.46 | 2.03 | 7.80 | −8.42 | ||
| ③ | Yangxiaba | Ground–850 hPa | 15.85 | 58.84 | 44.49 | 0.82 | 94.38 | 1.55 | 6.11 | −6.31 |
| 850 hPa–700 hPa | 11.27 | 52.67 | 1027.23 | 0.94 | 47.55 | 14.46 | 57.58 | −58.12 | ||
| 700 hPa–500 hPa | 0.58 | 49.04 | 84.55 | 1.28 | 98.31 | 0.46 | 1.78 | −1.90 | ||
| Dengjiazhuang | Ground–850 hPa | 18.49 | 69.96 | 36.86 | 0.79 | 94.30 | 1.46 | 5.38 | −6.28 | |
| 850 hPa–700 hPa | 14.62 | 60.26 | 701.51 | 0.83 | 57.95 | 10.64 | 40.53 | −44.58 | ||
| Jiuduntan | Ground–850 hPa | 21.52 | 71.72 | 23.59 | 0.88 | 98.48 | 0.40 | 1.40 | −1.78 | |
| 850 hPa–700 hPa | 18.3 | 54.65 | 754.43 | 0.93 | 55.63 | 11.72 | 43.47 | −50.27 | ||
| 700 hPa–500 hPa | 5.14 | 41.82 | 278.40 | 1.35 | 93.40 | 1.76 | 6.01 | −7.50 | ||
| Xuebaizhen | Ground–850 hPa | 20.21 | 67.07 | 71.51 | 0.90 | 92.44 | 1.96 | 6.91 | −8.81 | |
| 850 hPa–700 hPa | 17.4 | 55.11 | 694.53 | 1.26 | 64.15 | 9.04 | 33.58 | −38.77 | ||
| 700 hPa–500 hPa | 0.57 | 58.57 | 93.88 | 1.36 | 98.25 | 0.47 | 1.85 | −1.95 | ||
| Hongqigu | Ground–850 hPa | 19.23 | 58.11 | 58.96 | 0.81 | 92.64 | 1.89 | 6.85 | −8.27 | |
| 850 hPa–700 hPa | 14.80 | 55.34 | 808.64 | 0.84 | 55.54 | 12.43 | 47.25 | −52.19 | ||
| 700 hPa–500 hPa | 2.23 | 34.2 | 890.68 | 1.42 | 81.88 | 5.17 | 20.08 | −21.30 | ||
| Datanxiang | Ground–850 hPa | 21.35 | 66.73 | 114.04 | 0.89 | 89.61 | 2.60 | 8.10 | −11.66 | |
| 850 hPa–700 hPa | 17.05 | 64.67 | 701.88 | 0.92 | 66.68 | 7.49 | 27.99 | −31.91 | ||
| 700 hPa–500 hPa | 6.10 | 50.88 | 434.34 | 1.04 | 90.74 | 2.47 | 9.28 | −10.46 |
Publisher’s Note: MDPI stays neutral with regard to jurisdictional claims in published maps and institutional affiliations. |
© 2022 by the authors. Licensee MDPI, Basel, Switzerland. This article is an open access article distributed under the terms and conditions of the Creative Commons Attribution (CC BY) license (https://creativecommons.org/licenses/by/4.0/).
Share and Cite
Jia, W.; Xiong, H.; Zhu, G.; Shi, Y.; Zhang, Z.; Yang, L.; Zhang, M.; Zhang, F. Influence of Sub-Cloud Secondary Evaporation and Moisture Sources on Stable Isotopes of Precipitation in Shiyang River Basin, Northwest China. Water 2022, 14, 2700. https://doi.org/10.3390/w14172700
Jia W, Xiong H, Zhu G, Shi Y, Zhang Z, Yang L, Zhang M, Zhang F. Influence of Sub-Cloud Secondary Evaporation and Moisture Sources on Stable Isotopes of Precipitation in Shiyang River Basin, Northwest China. Water. 2022; 14(17):2700. https://doi.org/10.3390/w14172700
Chicago/Turabian StyleJia, Wenxiong, Hui Xiong, Guofeng Zhu, Yang Shi, Zhiyuan Zhang, Le Yang, Miaomiao Zhang, and Fuhua Zhang. 2022. "Influence of Sub-Cloud Secondary Evaporation and Moisture Sources on Stable Isotopes of Precipitation in Shiyang River Basin, Northwest China" Water 14, no. 17: 2700. https://doi.org/10.3390/w14172700