Article

Fish Diversity and Abundance Patterns in Small Watercourses of the Central European Plain Ecoregion in Relation to Environmental Factors

by
Adam Brysiewicz
1,*,
Przemysław Czerniejewski
2,
Jarosław Dąbrowski
1,
Krzysztof Formicki
3 and
Beata Więcaszek
3
1
Institute of Technology and Life Sciences–National Research Institute, Falenty, 3 Hrabska Avenue, 05-090 Raszyn, Poland
2
Department of Commodity, Quality Assessment, Process Engineering and Human Nutrition, West Pomeranian University of Technology in Szczecin, Kazimierza Królewicza 4 Street, 71-550 Szczecin, Poland
3
Department of Hydrobiology, Ichthyology and Biotechnology of Reproduction, West Pomeranian University of Technology in Szczecin, Kazimierza Królewicza 4 Street, 71-550 Szczecin, Poland
*
Author to whom correspondence should be addressed.
Water 2022, 14(17), 2697; https://doi.org/10.3390/w14172697
Submission received: 4 August 2022 / Revised: 19 August 2022 / Accepted: 24 August 2022 / Published: 30 August 2022
(This article belongs to the Section Biodiversity and Functionality of Aquatic Ecosystems)

Abstract

:
Because of their size, small depth, periodic drying out, and often lack of buffer zone, small watercourses are especially sensitive to environmental changes, anthropopressure, and biodegradation which makes them extremely prone to decline in biodiversity. Small watercourses can harbor many species of fish, including alien and invasive species. The objectives of this study were the assessment of environmental conditions, the determination of the number of fish species, their density and diversity in 10 small water courses of the European ecoregion ‘Central Plains’, and to estimate the effect of individual habitat parameters on the ichthyofauna. The total number of fish caught during the study was 9339, representing 33 species. Statistical analyses showed that the density of rheophilous fish was under the effect of flow velocity, discharge, width, depth, oxygen content, and pH; for the limnophilous species, the decisive factors were: discharge, depth, width, and P-PO4. The density of the euryoecious species was affected by depth, pH, electric conductivity (EC), oxygen, as well as N-NO3. All the species were significantly influenced by sandy substratum and the development of aquatic vegetation. Each guild, and even individual species, had their preferred habitat conditions, which is important for water management, renaturisation, and restitution.

1. Introduction

Rivers and their valleys worldwide are among the richest ecosystems in terms of biodiversity; at the same time, their character and varied geographical location make them extremely susceptible to environmental changes [1,2]. The greatest threats include water pollution with nutrient compounds and harmful substances from their catchment areas, canalising of river beds, and excessively developed hydrotechnical infrastructure [3]. Often, rivers provide water to lakes and other water bodies in river-lake systems, which have a significant effect on the quality and spatial distribution of pollutants in the bottom deposits, which may accumulate many substances used in agriculture [4,5]. Rivers, especially in agricultural areas, ensure access to water for animals and may serve irrigation purposes [6].
Small watercourses are especially sensitive to environmental changes; because of their small size, small depth, and lack of buffer zones that would alleviate anthropopressure effects, they are the most prone to biodegradation and decreased biodiversity [7]. Sometimes, especially in areas with inadequate waste management, they are connected with local networks of communal discharge, which may simply not only cause deterioration in water quality but even periodic poisoning [8]. The deterioration of habitat conditions in small watercourses is accelerated by climate changes which, combined with direct effects of human interference (partitioning of rivers with hydrotechnical devices, canalising of river beds) and speed up the gradual disappearance of small watercourses [9,10]. An additional threat to the diversity of native species in such waters is posed by invasive species of plants and animals and by floodplain and habitat alteration resulting from development activities [11,12].
Ecologically, ichthyofauna forms an important group of animals in small watercourses [13] and is affected by environmental conditions [14,15]. Additionally, as pointed out by [16], small watercourses provide important habitats for numerous protected and threatened fish species. The occurrence of individual species may depend on many hydrometrical (e.g., size, flow velocity and discharge, streambed substrate composition), physico-chemical (e.g., water temperature, dissolved oxygen content, contents of nutrients, heavy metals, pesticides) as well as ecological (e.g., kind and availability of food) factors [17]. Unfortunately, small watercourses, especially those in agricultural areas, are highly variable in terms of environmental conditions; this has an effect on the distribution and spatial and temporal variation in the structure of their ichthyofauna [9,18].
The objectives of this study were (i) the assessment of environmental conditions and (ii) determining the number of fish species, their density, and diversity in small watercourses of the European ecoregion ‘Central Plains’, and (iii) to estimate the effect of individual habitat parameters on the ichthyofauna.

2. Materials and Methods

2.1. Study Area

Two areas within the European ecoregion ‘Central Plains’ were selected for the studies: north-western Poland (NW PL) and central Poland (CE PL); 10 small watercourses were studied in NW Poland (Płonia (Plo), Myśla (Mys), Tywa (Tyw), Rurzyca (Rur), and Wardynka (War)) and central Poland (Kanał Habdziński (KHb), Zielona (Zie), Czarna Cedron (CCd), Kraska (Kra), and Molnica (Mln)) (Figure 1).
The selected watercourses were characterised by catchment areas of varied agricultural use (arable land, permanent cultivations, meadows, pastures, and orchards); the Wardynka catchment area, with dominating forests (classified in the category of semi-natural areas, together with semi-natural ecosystems and shrub communities) was the exception. The environmental conditions of the catchment areas were determined with software QGIS 3.24 based on the database Corine Land Cover 2018 [19,20] and presented in Table 1.

2.2. Sampling

Fish catches in each site were conducted three times a year (spring, summer, and autumn) over the period 2017–2020. Electrofishing equipment Electro Fishing Device ELT 60 II GI produced by AGK Kronawitter GmbH (Wallersdorf, Germany) was used while wading over a section 100 m long, fishing the whole width of the watercourse, according to the standards of CEN EN 14011 2003 and PN-EN 14011 2006. All the fish, except invasive species, were released after species identification collected ichthyofauna were classified by three ecological guild groups: limnophilic, rheophilic, and eurytopic. The fish density was determined by calculating the number of fish per 1 m2 of water surface area. Along with the catches, temperature, electric conductivity (EC), and oxygenation were measured directly in the field using a multi-parameter gauge HQD30 produced by Hach (Düsseldorf, Germany), and water samples were taken in order to determine the concentration of N-NO3, N-NH4, and P-PO4 according to the current standards (PN-EN ISO 5667-6:2016-12, PN-EN ISO 5667-3:2018-08). Concentrations of forms of nitrogen and phosphates were colourimetrically determined with an automatic flow velocity analyser produced by Skalar (Breda, The Netherlands). Flow velocity was measured using electromagnetic gauge SENSA RC2 with RV2 probe (Quantum Dynamics Ltd. Aqua Data Services Division, Oxfordshire, United Kindom). Granulometric composition of bottom deposits was determined with the method proposed by Wetzel and Likens [21] with some modifications: the substrate was dried for 24 h at 105 °C and passed through differential sieves, mesh size 0.063, 0.1215, 0.5, 1, 2, and 4 mm. Blair and McPherson’s [22] nomenclature was used to assign the deposit to the simplified classification. Macrophytes were determined by marking the streams covered with rush vegetation in the field, taking pictures and then the macrophyte coverage area was calculated via the Geoportal online programme. Plants were identified to species. The number of species (spc.) and vegetation coverage (in %) were estimated.

2.3. Application of Ecological Indices and Data Analyses

Taxonomic similarity between the sites was estimated with the Jaccard index according to the formula of Shtovba and Petrychko [23]:
J = C/(A + B − C)
where A—number of species in set x, B—number of species in set y, C—number of common species for x and y.
The following ecological indices were calculated with software PAST 4.05 [24]: dominance (D), Simpson, Shannon, and Evenness [25,26].
One of the statistical tests, the Shapiro–Wilk test, was carried out using the R software [27] to check the normality of the distribution of fish abundance and of physico-chemical and hydrometrical parameters [28]. Kruskal–Wallis test was used to test the significance of differences between physico-chemical parameters [28]; Dunn’s test with Bonferroni correction [29] was used as a post-hoc test. The significance level of each test was equal to 0.05.
Interdependences between hydrometrical and physico-chemical parameters and fish density in the sites were presented using stepwise regression, which removes the variables which are the least correlated with the explained variable from the basic model, which includes all the available variables [30]. These analyses were done with the package MASS ver. 7.3-58.1, GGally ver. 2.12, and dunn.test ver. 1.3.5 for R 4.0.5 [29,31].
In addition, cluster analysis was performed with the UPGMA (Unweighted Pair Group Method With Arithmetic) algorithm, and the similarity Index was used as Euclidean distance. This analysis and CCA (Canonical Correlation Analysis) analysis were performed in PAST 4.05 software [24,32]. In CCA analysis, the explained variables were density of all fish species or separately of rheophilous, limnophilous, and euryoecious species, as well as ecological indices; the explaining variables were physico-chemical and hydrometrical parameters of the water in each site. Type 2 scaling was used for graphic interpretation of the results of these analyses [33].

3. Results

3.1. Environmental Characteristics

The studied watercourses were characterised by varied physico-chemical and hydrometrical conditions (Figure 2). The most varied among the studied parameters (CV > 100%) were discharge (186.7%), ammonia nitrogen content N-NH4 (149.8%) and flow velocity (112.7%); the smallest variation (CV < 10%) was recorded for pH (3.6%) (Table 2). The high contents of nutrients (N-NO3, N-NH4, and P-PO4), especially in the Molnica, Kraska, and Zielona, and high electrolytic conductivity in the Kraska, Myśla, and Rurzyca, indicate their high trophic level (Table 2). The catchment areas of these rivers are dominated by arable land and orchards, constituting a total of 58.0% to 87% of the area. The investigated wastewater lacks buffer zones to protect against the run-off of nutrients, and intensive agricultural production is carried out directly at the banks of the watercourses. The smallest concentrations of nutrients were recorded for Wardynka, whose catchment area is mainly forested (51%), thus providing a buffer zone, while the proportion of agricultural land is small (36%).
In watercourses where 50% or more of the catchment area was arable land, as compared to watercourses with more than 30% forests, higher values of N-NH4, P-PO4, and EC were recorded, while lower O2 content (Table 2).
The smallest oxygen content was recorded in those watercourses in which ammonia content was the highest (Table 2, Figure 3), which is generally known since dissolved oxygen is used to oxidise ammonia to nitrites and nitrates.
Additional statistical analyses were performed to clarify the interactions between the studied variables. For this purpose, the results were correlated, and those with the highest statistical significance were briefly described. For the significant variables indicating the watercourse condition, there were several statistically significant differences. In the case of vegetation coverage, there was a correlation between flow velocity (−0.689 (***)), temperature (0.494 (**)), and pH (−0.451 (*)), as well as when analysing the number of plant sp. Significant correlations with pH (−0.403 (*)) were observed and flow velocity (−0.327 (.)). Correlations with width (−0.428 (*)) and deep (−0.334 (.)) were noted for the EC. The oxygen content in the water, which was significant for the existence of fish, was correlated with vegetation coverage (−0.348 (.)), and flow velocity with pH (0.487 (. **)), discharge [cm3/s] (0.533 (**)), temperature [‘C] (−0.520 (**)), and vegetation coverage (−0.689 (***)). In the case of discharge [cm3/s], this dependence is obvious because the flow velocity, depending on the width and depth of the watercourse in a given place, gives the flow. Correlation analysis showed that the use of the catchment area had the strongest impact on flow velocity [cm/s] and discharge [cm3/s], deep [m] as well as on pH.
Additional statistical analysis showed that the level of ammonium ions was most influenced by EC, depth, and the degree of forest cover, and nitrate ions were most influenced by the amount of oxygen in and flow velocity. The most important for the concentration of phosphate ions are: EC, as well as the share of arable land (A) and the share of forests (FO) in the catchment area.

3.2. Fish Diversity and Abundance Patterns

The total number of fish caught during the studies was 9339, representing 33 species. The number of species at two sites did not exceed 10 (Molnica and Wardynka); it exceeded 15 in Tywa and Płonia. The greatest density (ca. 1 indiv./m2) was recorded in Myśla and Molnica, the smallest (below 0.3 indv./m2) in Płonia (Plo) and Kanał Habdziński (KHb) (Figure 4).
The most common species in each group include: Rheophilous fish: Gudgeon Gobio gobio, European brook lamprey Lampetra planeri, Ide Leuciscus idus, Dace Leuciscus leuciscus, River lamprey Lampetra fluviatilis, Chub Squalius cephalus (=Leuciscus cephalus), Stone loach Barbatula barbatula and Stone moroco Pseudorasbora parva; Limnephilous fish: Weatherfish Misgurnus fossilis, Tench Tinca tinca, Crucian carp Carassius carassius, Belica Leucaspius delineatus, Blue bream Ballerus ballerus (=Abramis ballerus), and Chinese sleeper Percottus glenii; Euryoecious fish: Spined loach Cobitis taenia, Roach Rutilus rutilus, Freshwater bream Abramis brama, Bitterling Rhodeus sericeus, Prussian carp Carassius gibelio, Pike Esox lucius, White bream Blicca bjoerkna, Bleak Alburnus alburnus, Rudd Scardinius erythrophtalmus, and European eel Anguilla anguilla.

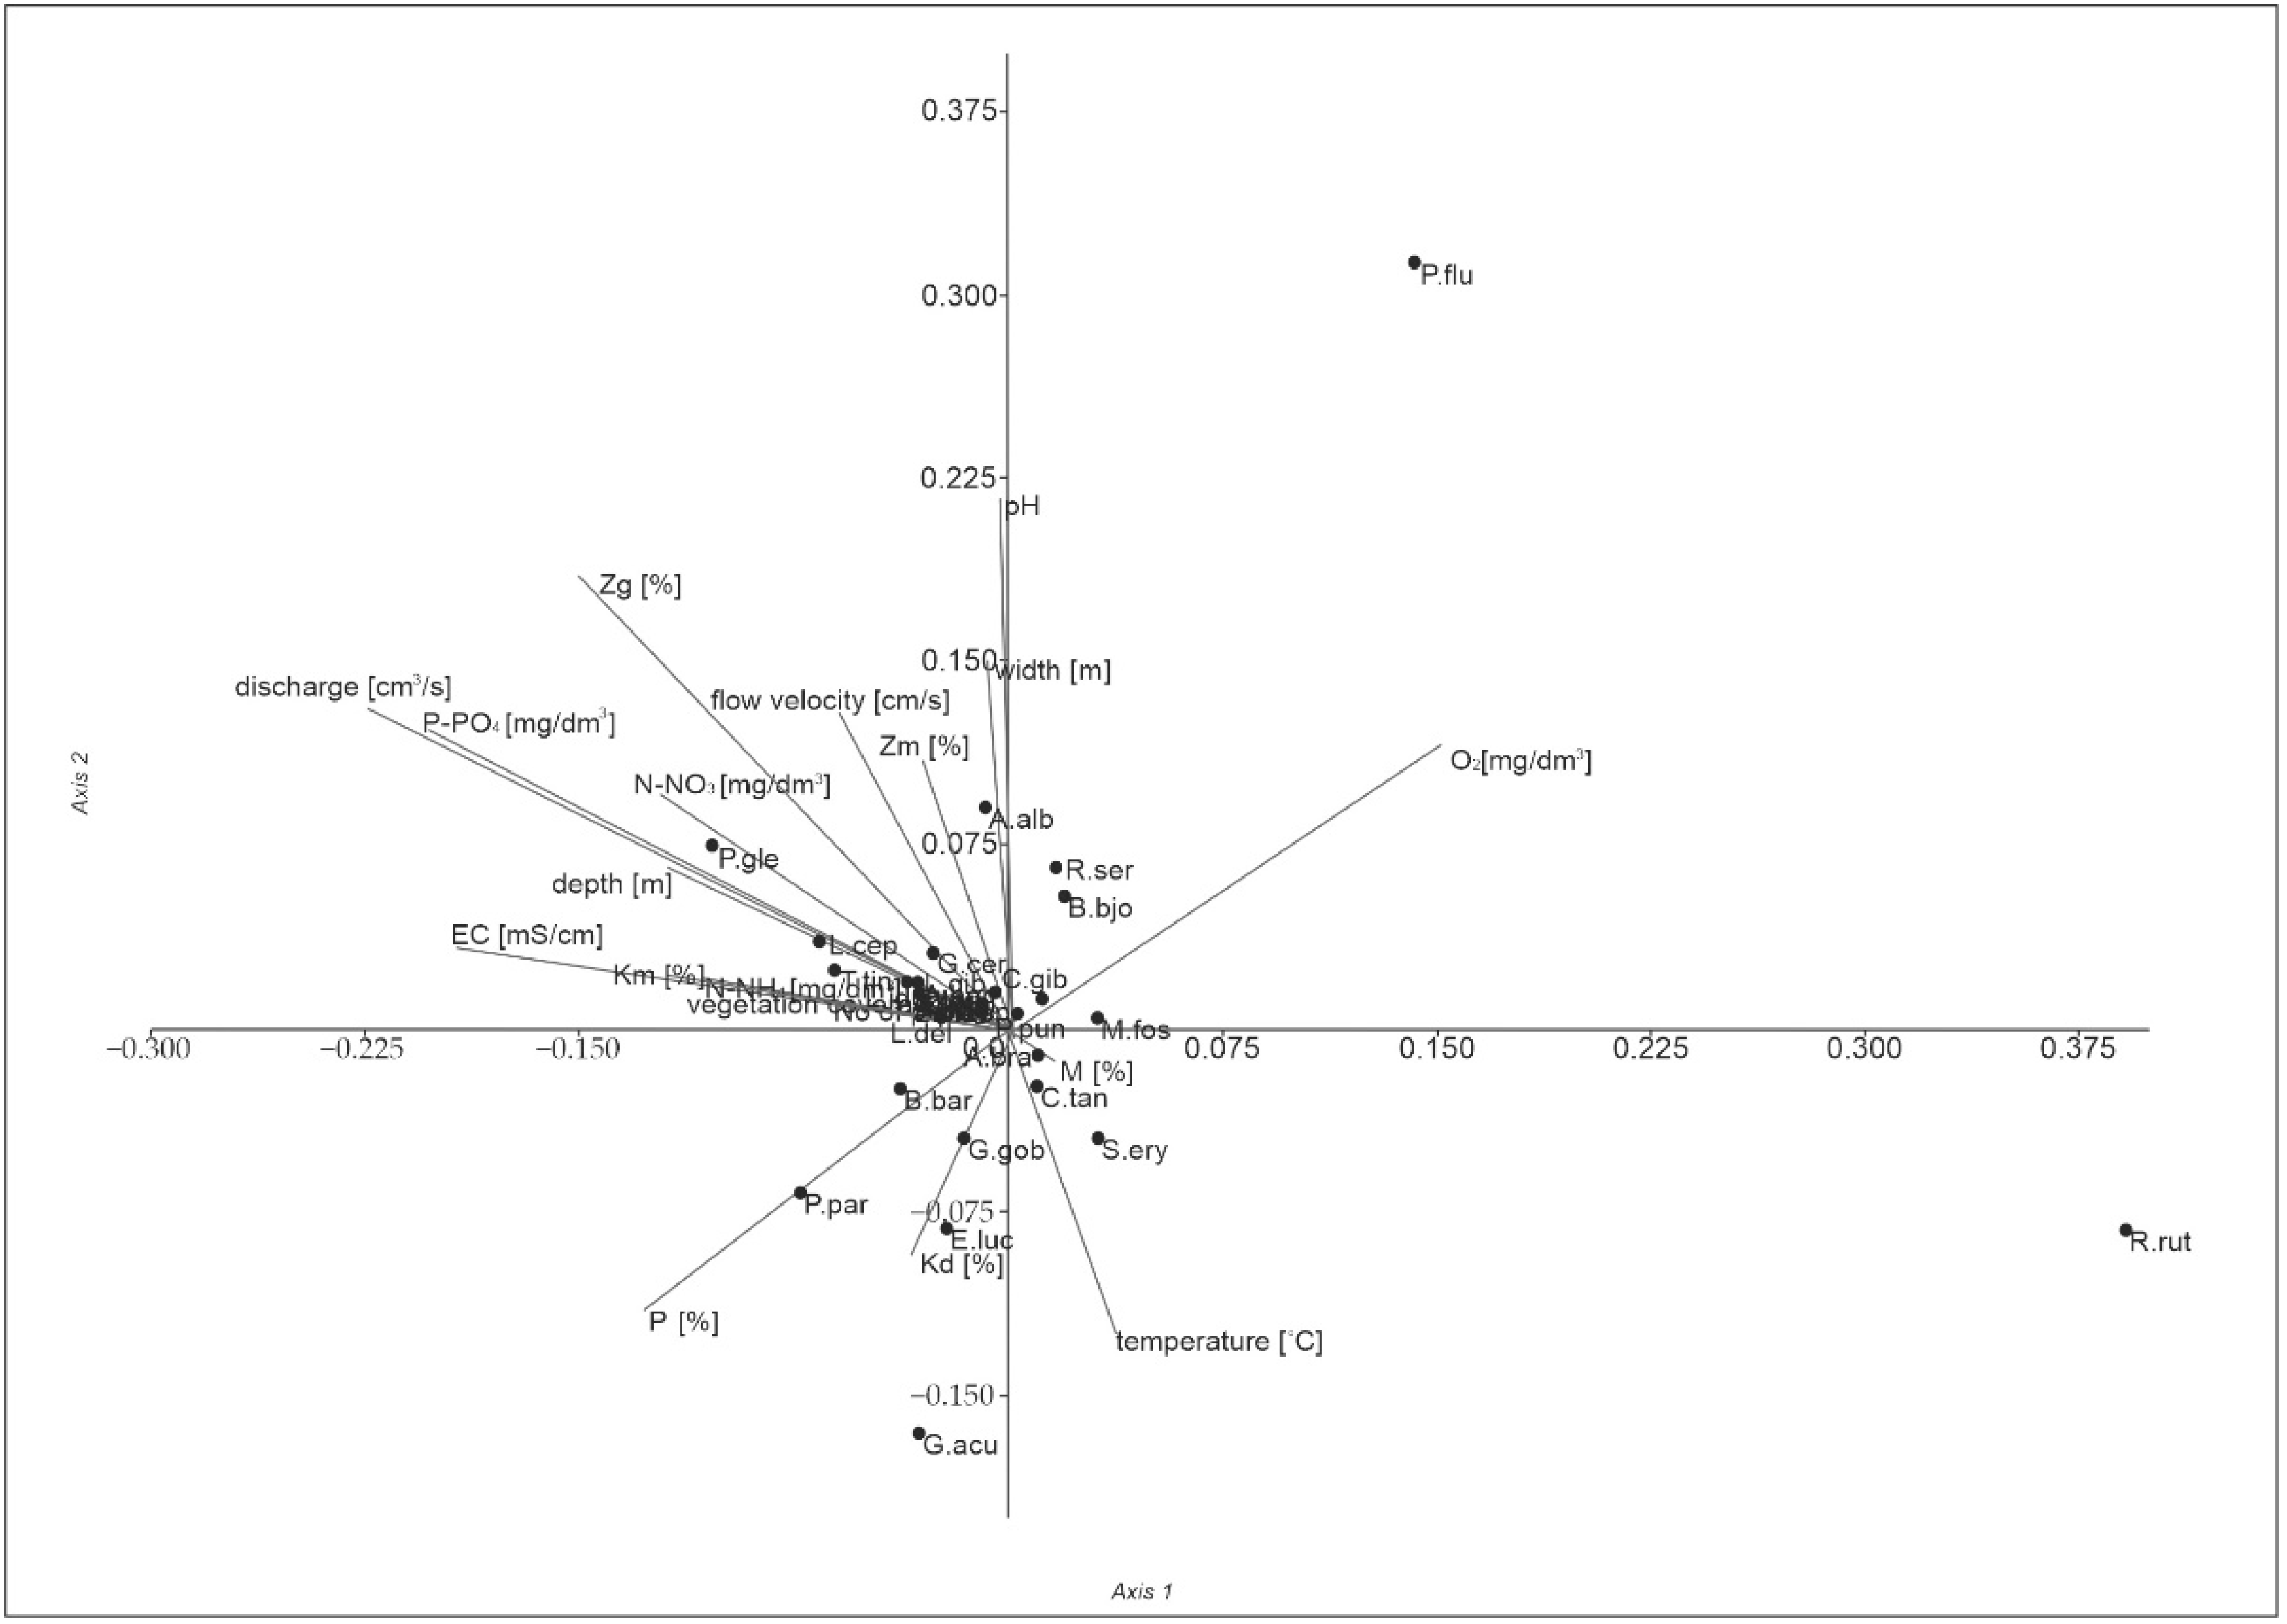
3.3. Effects of Environmental Gradients
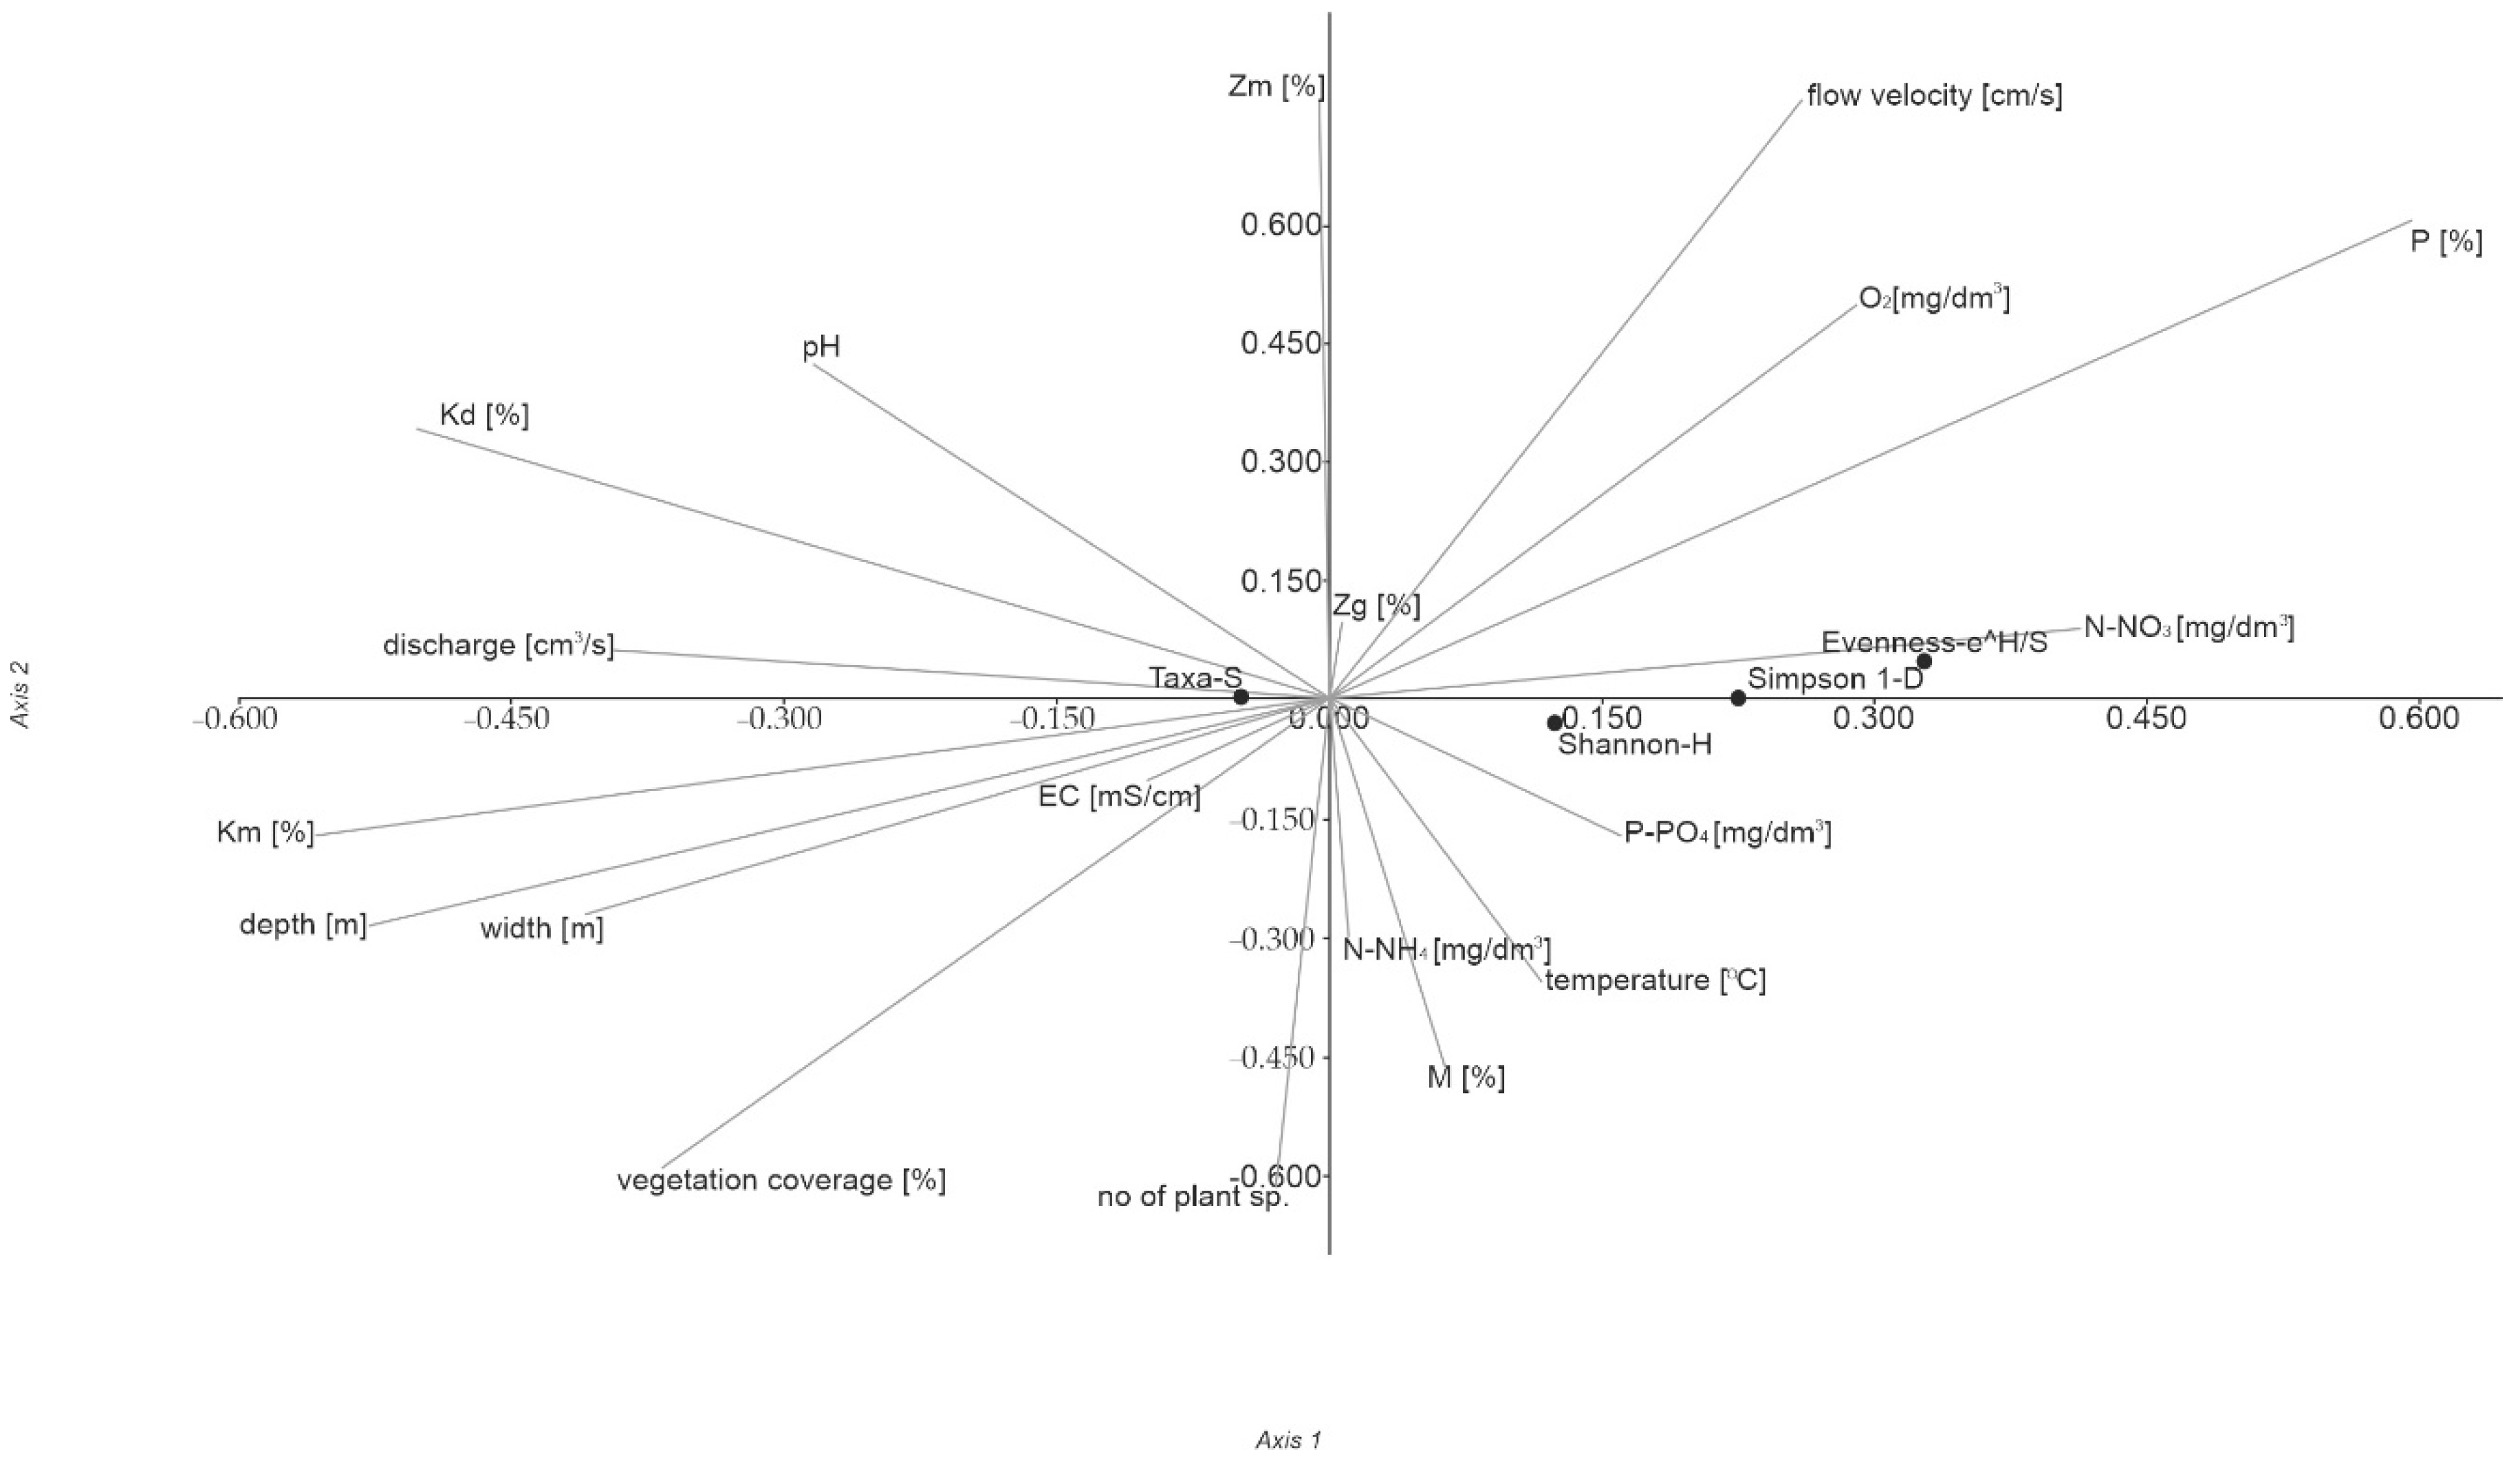
The analysis with stepwise regression and correlation analysis (Table 3) (ca. 1 indiv./m2) showed that the density of rheophilous species was statistically significantly influenced by flow velocity, discharge, width, depth, oxygen content as well as pH. For limnophilous species, the major factors were discharge, depth, width, and P-PO4. In the case of the euryoecious species, a significant effect on the density was exerted by depth, pH, EC, oxygen, and N-NO3. Rheophilous and limnophilous species were statistically significantly affected by sandy substratum, and coarse gravel had a negative effect on limnophilous species. All the guilds were significantly influenced by the degree of coverage with vegetation, especially limnophilous species for which the abundance of macrophytes was also significant (Table 3).
CCA analysis for species of particular guilds depending on environmental conditions is presented in Table 4 and Figure 5. The first and second axes, which together explain more than 84% of the total variation (Table 4), were selected for further analyses.
In the CCA graph in Figure 5, the effect of sand (P) and N-NO3 on the density of all species are visible, as well as the effect of flow velocity cm/s on the density of rheophilous species.
Following analysis of the dependence between the density of particular fish species and environmental variables, we selected axes 1 and 2, which together explained nearly 50% of the total variation in density (Table 5).
In the CCA graph in Figure 6, many taxa are located in the central part of the graph, making it difficult to estimate the effect of environmental variables on these taxa. Among the species under a greater effect of these variables is the Chinese sleeper Perccottus glenii, which is influenced by N-NO3, and to the least extent, by P-PO4 and flow velocity. The quantity of sand on the bottom affected the density of stone moroco Pseudorasbora parva and stone loach Barbatula barbatula.

3.4. Biotic Indices

Table 6 presents values of the Jaccard index for the studied sites. The greatest values (>0.500) were recorded for the rivers Zielona (Zie) and Kraska (Kra) (0.625) as well as Myśla (Mys) and Kraska (0.611). The smallest values were those for Wardynka (War) and Tywa (Tyw) (0.154), and Molnica (Mln) and Tywa (0.192).
Among the studied biotic indices (Table 7) the values of Simpson’s 1-D index and Evenness indicate that the species-poorest fauna is that of Wardynka (War), Kanał Habdziński (KHb), Molnica (Mln), Zielona (Zie), and Rurzyca (Rur), the richest community is found in Tywa (Tyw), Płonia (Pln), Kraska (Kra), and Czarna Cedron (CCd). An asterisk could be added in agricultural localities (Table 7) (* means agricultural land use over 55%—data taken from Table 1).
In the case of CCA analysis for biotic indices, we selected axes 1 and 2, which explained nearly 99% of variation (Table 8, Figure 7).
The CCA plot for the influence of four biotic indices of H Shannon, 1-D Simpson, Evenness, and the number of taxa, it can be concluded that for H Shannon, 1-D Simpson, and Evenness, the vector of nitrate ions N-NO3 is significant, and for the number of taxa to a small extent, it is influenced by the discharge as well as the depth and width of the watercourse. It can also be concluded that the H Shannon index is also influenced by the concentration of P-PO4 phosphate ions.
From the CCA plot for the influence of four biotic indices of H Shannon, 1-D Simpson, Evenness, and the number of taxa, it can be concluded that for H Shannon, 1-D Simpson, and Evenness, the vector of nitrate ions N-NO3 is significant, and for the number of taxa to a small extent, it is influenced by the discharge as well as the depth and width of the watercourse. It can be concluded that the H Shannon index is also influenced by the concentration of P-PO4 phosphate ions.

4. Discussion

Agriculture is one of the most important contributors to the human effect on watercourses [34]. A worldwide intensification of agriculture, as well as its disadvantageous effects on the biodiversity and function of freshwater ecosystems, were observed, especially in recent years [35]. Agricultural practices exert a direct influence on watercourse ecosystems, bringing about changes in the contents of nutrients (especially nitrogen and phosphorus compounds) and of organic matter [36,37,38], hydrometrical modifications (e.g., flow velocity regime, quantity of water), and erosion processes, including sedimentation of organic and mineral substances on the bottom [39,40]. Additionally, habitat degradation in the watercourse and the resulting decrease in spatial heterogeneity lead to the destruction of aquatic ecosystems [41,42]. These changes follow the increase in agriculturally used areas in catchment areas [43,44]. Moreover, our studies in the small watercourses show that in catchment areas of predominantly agricultural character (Table 2), the contents of nutrients (N-NH4, P-PO4) and conductivity (Table 3) are greater than in forest-dominated catchment areas. These differences in environmental conditions among the watercourses are the effect of the long-term influence of agriculture on the watercourses and the resulting changes in environmental conditions. Indirectly, this causes changes in aquatic animal communities [45], including fish [14] and a consequent decrease in density and species richness, thus resulting in low biotic indices (Table 7). Changes in ichthyofauna have been observed both in large rivers [46] and in small watercourses with catchment areas under intensive agricultural use or anthropopressure [47]. In small watercourses, the species richness is, as a rule, smaller than in large rivers, though the overall density may be higher [48]. Moreover, studies by Sutela et al. [49] in nearly 12,000 sites in watercourses of different sizes indicate that species richness of ichthyofauna increases with the watercourse size [50]. Thus, it is not surprising that the number of species recorded in small watercourses is small. In addition to the considerable human influence and the position in the catchment area, changes in water level and periodic drying out may affect the number of species and the values of biotic indices [51].
Among the recorded fish species, eyroecious species, roach, and perch dominated quantitatively in as many as seven watercourses; they are typical of waters under anthropressure [47,52,53]. This indicates a considerable degradation of habitats of river fish specialists, mainly rheophiles, which are regarded as competitors to generalists (among others, roach, and perch), with a wide food spectrum [54]. It is the probable reason for the increase in the abundance of roach and perch in European rivers [46,47]. The two species seem to be indicators of habitat degradation, especially that, as demonstrated by our studies and also by those of Wolter [55] and Kruk and Penczak [56], there is a positive correlation between the degree of environmental degradation and abundance of roach and perch.
Hydrometrical and physico-chemical features of watercourses have a great effect on the occurrence and diversity of fish species. In the studied watercourses, we found a positive correlation between the fish density and the studied hydrometric features: depth, flow velocity and volume, width, and also the content of sand in bottom sediments. Additionally, the fish density was influenced by hydrochemical conditions, especially oxygen content, N-NO3, P-PO4, and N-NH4.
Depth has a significant effect on fish. As claimed by Lozarich and Quinn [57] and Penaluna et al. [58], fish choose deep places in the river when they are threatened by predation. Authors of numerous papers emphasise that water discharge may play the part of a major factor in the shaping of physico-chemical and hydrometrical conditions in watercourses [59], and it may influence the species composition of hydrobionts [60,61]. Especially assemblages of stream-dwelling fish are often associated with flow velocity regimes and hydrometrical total variation [60,62]. For example, the assemblage of rheophiles in our watercourses included only 10 species; also, 19 limnophiles species were significantly correlated with the discharge, though the limnophiles were also affected by the vegetation coverage and the number of fish species.
Discharge may have an indirect effect on fish through its effect on the thermal regime and the inflow of nutrients from the catchment area [63]. Water temperature has a direct effect on the fish metabolic rate, general physiology, and life history, as well as on the rate of important ecological processes, such as circulation of nutrients and watercourse productivity [64]. Additionally, the solubility of gases, including oxygen, decreases with increasing water temperature [65]; watercourses with lower oxygen content hold fewer fish species at lower densities compared to those with higher oxygen content. This is associated with the fact that oxygen content is among the most important factors limiting fish occurrence [65,66]. The smallest oxygen content was recorded in those watercourses in which ammonia content was the highest. The resulting decrease in the content of dissolved oxygen may decrease species diversity or even cause the death of fish [67]. Fish exposure to pollution by inorganic nitrogen compounds (NH4+, NH3, NO2, HNO2, and NO3) has effects on the reproduction, growth, and survival of freshwater fish. Excess ammonia may also cause growth inhibition and tissue degeneration, immunosuppression, and mortality of hydrobionts [68,69,70]. The limits of tolerance to N-NH4 are variable depending on each fish species, but Lemarié et al. [68] stated that N-NH4 is 300–400 times less toxic than NH4+ to fish.
Fish exposure to pollution by inorganic nitrogen compounds (NH4+, NH3, NO2, HNO2, and NO3) has effects on the reproduction, growth, and survival of freshwater fish [67,69]. The studies also demonstrated a significant effect of the content of N-NO3 on fish density. As shown by Camargo et al. [71], the concentration of these ions may have a negative influence on sensitive hydrobionts during long-lasting exposure. The main toxic effect of nitrates on fish consists in the conversion of oxygen-carrying pigments (hemoglobin, hemocyanin) into forms which are incapable of transporting oxygen (methemoglobin, methemocyanin) [72,73]. According to Camargo et al. [71], for sensitive invertebrates and fish, already the level of 10 mg N-NO3, recorded in one of the studied rivers (Mln), can be toxic. Probably to avoid this threat in small watercourses, some fish (e.g., the most sensitive rheophilous fish) migrate, leaving the places with the highest concentration of nitrogen compounds, hence their smaller density.
Phosphorus is another important factor which regulates the biological productivity of waters [74]; it affects fish density and richness [72,75]. As shown by Gorman et al. [76], fish biomass in lakes increases with total phosphorus concentration. However, after reaching the value of ca. 140 μg total phosphorus, it may decrease [75]. The phenomenon may be responsible for the small number of fish species and decrease in density of all species in the studied watercourses with increasing concentration of P-PO4, as a result of the high content of P-PO4 in these watercourses (0.61–1.46 mg P-PO4).

5. Conclusions

In catchment areas which are intensively used for agriculture, agricultural practices have an effect on fish density and diversity in small watercourses through indirect influence on the chemical composition of water and on hydrometrical conditions. Among hydrochemical characters, the most important are oxygen content, N-NO3, P-PO4, and N-NH4; among hydrommetric features the major factors are width, depth, discharge, and streambed substrate composition. Each ecological group and even individual species have their preferred habitat conditions. For example, water discharge, depth, and width had the greatest effect on the rheophilous species, but they were of less significance for limnophiles. In this context, in the management of fish populations in small watercourses (e.g., restitution through stocking), their habitat requirements and physico-chemical features of the water should be considered to adjust the management practices to the current ecological state of the waters. Any attempts at introducing changes in the fish population structure and introducing native species of higher habitat requirements should be preceded by renaturisation of the watercourse and, most of all, by limiting the supply of nutrients. Reconstruction of fish habitats should involve an increase in heterogeneity which plays an important part in maintaining and increasing fish diversity. This is why maintaining diverse habitats in watercourses or restoring them is crucial to the conservation of fish diversity and balanced management.
Additionally, as demonstrated by our studies, small watercourses constitute habitats of not only native ichthyofauna but also invasive species, which often have less strict requirements regarding water quality, while the lack of monitoring of small watercourses often results in their later invasion of greater rivers and lakes.

Author Contributions

Conceptualization, A.B. and P.C.; methodology, A.B., P.C. and J.D.; software, A.B. and J.D.; validation, A.B., P.C., J.D., K.F. and B.W.; formal analysis, A.B., P.C., J.D. and K.F.; investigation, J.D.; resources, P.C.; data curation, A.B. and J.D.; writing—original draft preparation, A.B., P.C. and J.D.; review and editing, K.F. and B.W.; visualization, J.D. and A.B.; supervision, P.C. and K.F.; project administration, A.B.; funding acquisition, K.F. All authors have read and agreed to the published version of the manuscript.

Funding

The research financed under the multiannual program by the Institute of Technology and Life Sciences and titled “Engineering and landscaping projects for innovative, resource-efficient and low-carbon economy in rural areas”, Activity 5 “Information support for preparation, completion and acceptance of land improvement equipment” (154/2016_RM-111-156-16).

Institutional Review Board Statement

Conducting electrofishing and determining the number and species composition of fish do not require the consent of the ethical committee. The consent for electrofishing was obtained from those eligible for fishing during the multiannual program (154/2016_RM-111-156-16).

Informed Consent Statement

Not applicable.

Data Availability Statement

Not applicable.

Acknowledgments

We would like to thank Ewa Sitko for performing hydrochemical analyzes of water in Laboratory of Chemistry and Environmental Protection ITP-PIB in Falenty and fishing users (Polish Fisheries Association and private persons) for the possibility of conducting electrofishing in watercourses.

Conflicts of Interest

The authors declare no conflict of interest.

References

  1. Oglęcki, P.; Ostrowski, P.S.; Utratna-Żukowska, M. Natural and Geomorphological Response of the Small Lowland River Valley for Anthropogenic Transformation. Resources 2021, 10, 97. [Google Scholar] [CrossRef]
  2. Gheoca, V. The River Valleys As Biodiversity Reservoirs For Land Snails In Highly Anthropic Areas—The Case Of Cisnădie River (Romania). Transylv. Rev. Syst. Ecol. Res. 2016, 18, 83–90. [Google Scholar] [CrossRef]
  3. Štefunková, Z.; Macura, V.; Doláková, G.; Majorošová, M. Evaluation of the hydro-ecological quality of the aquatic habitat of the Váh River. J. Water Land Dev. 2020, 46, 209–215. [Google Scholar]
  4. Kaletova, T.; Arifjanov, A.; Samiev, L.; Babajanov, F. Importance of river sediments in soil fertility. J. Water Land Dev. 2022, 52, 21–26. [Google Scholar]
  5. Kuriata-Potasznik, A.; Szymczyk, S.; Skwierawski, A. Influence of Cascading River–Lake Systems on the Dynamics of Nutrient Circulation in Catchment Areas. Water 2020, 12, 1144. [Google Scholar] [CrossRef]
  6. Abou Zaki, N.; Torabi Haghighi, A.; Rossi, P.M.; Tourian, M.J.; Bakhshaee, A.; Kløve, B. Evaluating Impacts of Irrigation and Drought on River, Groundwater and a Terminal Wetland in the Zayanderud Basin, Iran. Water 2020, 12, 1302. [Google Scholar] [CrossRef]
  7. Kelly-Quinn, M.; Bruen, M.; Carlsson, J.; Gurnell, A.; Jarvie, H.; Piggott, J. Managing the small stream network for improved water quality, biodiversity and ecosystem services protection (SSNet). Res. Ideas Outcomes 2019, 5, e33400. [Google Scholar] [CrossRef]
  8. Okafor, U.P.; Obeta, M.C.; Ayadiuno, R.U.; Onyekwelu, A.C.; Asuoha, G.C.; Eze, E.J.; Orji-Okafor, C.E.; Igboeli, E.E. Health implications of stream water contamination by industrial effluents in the Onitsha urban area of Southeastern Nigeria. J. Water Land Dev. 2021, 48, 105–114. [Google Scholar]
  9. Bănăduc, D.; Sas, A.; Cianfaglione, K.; Barinova, S.; Curtean-Bănăduc, A. The Role of Aquatic Refuge Habitats for Fish, and Threats in the Context of Climate Change and Human Impact, during Seasonal Hydrological Drought in the Saxon Villages Area (Transylvania, Romania). Atmosphere 2021, 12, 1209. [Google Scholar] [CrossRef]
  10. Malinowski, Ł.; Skoczko, I. Impacts of Climate Change on Hydrological Regime and Water Resources Management of the Narew River in Poland. J. Ecol. Eng. 2018, 19, 167–175. [Google Scholar] [CrossRef]
  11. Jakubčinová, K.; Harustiakova, D.; Števove, B.; Švolíková, K.; Makovinská, J.; Kováč, V. Distribution patterns and potential for further spread of three invasive fish species (Neogobius melanostomus, Lepomis gibbosus and Pseudorasbora parva) in Slovakia. Aquat. Invasions 2018, 13, 513–524. [Google Scholar] [CrossRef]
  12. Loucks, D.P.; van Beek, E. Water Resources Planning and Management: An Overview. In Water Resource Systems Planning and Management; Stedinger, J.R., Dijkman, J.P.M., Villars, M.T., Eds.; Springer: Cham, Switzerland, 2017; pp. 1–49. [Google Scholar]
  13. Rechulicz, J.; Płaska, W.; Pęczuła, W.; Tarkowska-Kukuryk, M.; Mieczan, T. The structure of ichthyofauna and angling pressure on fish in upper section of Bystrzyca River. Teka Kom. Ochr. Kszt. Środ. Przyr.—OL PAN 2016, 13, 69–79. [Google Scholar]
  14. Fraker, M.E.; Keitzer, S.C.; Sinclair, J.S.; Aloysius, N.R.; Dippold, D.A.; Haw, Y.; Arnold, G.A.; Daggupati, P.; Johnson, M.-V.V.; Martin, J.F.; et al. Projecting the effects of agricultural conservation practices on stream fish communities in a changing climate. Sci. Total Environ. 2020, 747, 141112. [Google Scholar] [CrossRef] [PubMed]
  15. Vander Vorste, R.; McElmurray, P.; Bell, S.; Eliason, K.M.; Brown, B.L. Does Stream Size Really Explain Biodiversity Patterns in Lotic Systems? A Call for Mechanistic Explanations. Diversity 2017, 9, 26. [Google Scholar] [CrossRef] [Green Version]
  16. Montgomery, F.A.; Reid, S.M.; Mandrak, N.E. A habitat-based framework to predict the effects of agricultural drain maintenance on imperilled fishes. J. Environ. Manag. 2018, 206, 1104–1114. [Google Scholar] [CrossRef] [PubMed]
  17. Gomolka, Z.; Twarog, B.; Zeslawska, E. State Analysis of the Water Quality in Rivers in Consideration of Diffusion Phenomenon. Appl. Sci. 2022, 12, 1549. [Google Scholar] [CrossRef]
  18. Brysiewicz, A.; Czerniejewski, P. The Effect of Maintenance Works on Ichthyofauna in the Context of Hydrochemical Conditions of Small Watercourses of Central and North-Western Poland. J. Ecol. Eng. 2019, 20, 82–89. [Google Scholar] [CrossRef]
  19. Menke, K.; Smith, R.; Pirelli, L.; Van Hoesen, J. Mastering QGIS, 1st ed.; Pack Publishing: Birmingham, UK, 2015; p. 391. [Google Scholar]
  20. Corine Land Cover 2018. Available online: https://clc.gios.gov.pl/index.php/clc-2018/metadane (accessed on 15 July 2021).
  21. Wetzel, R.G.; Likens, G.E. Limnological Analysis, 3rd ed.; Springer: New York, NY, USA, 2000; p. 430. [Google Scholar]
  22. Blair, T.C.; McPherson, J.G. Grain-size and textural classification of coarse sedimentary particles. J. Sediment. Res. 1999, 69, 6–19. [Google Scholar] [CrossRef]
  23. Shtovba, S.; Petrychko, M. Jaccard index-Based Assessing the Similarity of Research Fields in Dimensions. In Proceedings of the 1st International Workshop on Digital Content & Smart Multimedia (DCSMart 2019), Lviv, Ukraine, 23–25 December 2019; Kryvinska, N., Izonin, I., Greguš, M., Poniszewska-Marańda, A., Dronyuk, I., Eds.; Lviv Polytechnic National University: Lviv, Ukraine, 2019. [Google Scholar]
  24. Hammer, Ø.; Harper, D.A.T.; Ryan, P.D. PAST: Paleontological statistics software package for education and data analysis. Palaeontol. Electron. 2001, 4, 9–18. [Google Scholar]
  25. Pawar, P.R.; Al-Tawaha, A.R.M.S. Diversity indices of macrobenthos for assessment of coastal pollution along Uran coast, Navi Mumbai. Adv. Environ. Biol. 2017, 11, 34–50. [Google Scholar]
  26. Dorić, S.; Čučuković, A. Community Structure and Diversity of Macrozoobenthos in Quarry Ribnica’s Creek as Indicator of Surface Water Management. Genet. Appl. 2018, 1, 29–35. [Google Scholar] [CrossRef]
  27. R Core Team. R: A Language and Environment for Statistical Computing; R Foundation for Statistical Computing: Vienna, Austria, 2018; Available online: https://www.gbif.org/tool/81287/r-a-language-and-environment-for-statistical-computing (accessed on 15 October 2021).
  28. Crawley, M.J. The R Book, 2nd ed.; Wiley: Chichester, UK, 2013; p. 1051. [Google Scholar]
  29. Zar, J.D. Biostatistical Analysis, 5th ed.; Pearson: Hoboken, NJ, USA, 2010; p. 944. [Google Scholar]
  30. Fox, J. Applied Regression Analysis and Generalized Linear Models, 3rd ed.; Sage Publications, Inc.: Los Angeles, CA, USA, 2016; p. 791. [Google Scholar]
  31. Lander, J.P. R for Everyone. Advanced Analytics and Graphic, 2nd ed.; Pearson: Boston, MA, USA, 2017; p. 531. [Google Scholar]
  32. Ter Braak, C.J.F.; Verdonschot, P.F.M. Canonical correspondence analysis and related multivariate methods in aquatic ecology. Aquat. Sci. 1995, 57, 256–289. [Google Scholar] [CrossRef]
  33. Bonanno, A.; Zgozi, S.; Basilone, G.; Hamza, M.; Barra, M.; Genovese, S.; Rumolo, P.; Nfate, A.; Elsger, M.; Goncharov, S.; et al. Acoustically detected pelagic fish community in relation to environmental conditions observed in the Central Mediterranean sea: A comparison of Libyan and Sicilian-Maltese coastal areas. Hydrobiologia 2015, 755, 209–224. [Google Scholar] [CrossRef]
  34. Allan, J.D. Influence of land use and landscape setting on the ecological status of rivers. Limnetica 2004, 23, 187–198. [Google Scholar] [CrossRef]
  35. Fu, L.; Jiang, Y.; Ding, J.; Liu, Q.; Peng, Q.Z.; Kang, M.Y. Impacts of land use and environmental factors on macroinvertebrate functional feeding groups in the Dongjiang River basin, southeast China. J. Freshw. Ecol. 2016, 31, 21–35. [Google Scholar] [CrossRef]
  36. Riley, R.H.; Townsend, C.R.; Niyogi, D.K.; Arbuckle, C.A.; Peacock, K.A. Headwater stream response to grassland agricultural development in New Zealand. N. Z. J. Mar. Freshw. Res. 2003, 37, 389–403. [Google Scholar] [CrossRef]
  37. Degerman, E.; Beier, U.; Breine, J.; Melcher, A.; Quataert, P.; Rogers, C.; Roset, N.; Simoens, I. Classification and Assessment of Degradation in European Running Waters. Fish. Manag. Ecol. 2007, 14, 417–426. [Google Scholar] [CrossRef]
  38. Murphy, P.N.C.; Mellander, P.E.; Melland, A.R.; Buckley, C.; Shore, M.; Shortle, G.; Wall, D.P.; Treacy, M.; Shine, O.; Mechan, S.; et al. Variable response to phosphorus mitigation measures across the nutrient transfer continuum in a dairy grassland catchment. Agric. Ecosyst. Environ. 2015, 207, 192–202. [Google Scholar] [CrossRef]
  39. Cavaille, P.; Dumont, B.; Van Looy, K.; Floury, M.; Tabacchi, E.; Evette, A. Influence of riverbank stabilization techniques on taxonomic and functional macrobenthic communities. Hydrobiologia 2018, 807, 19–35. [Google Scholar] [CrossRef]
  40. Merchan, D.; Casalı, J.; Del Valle de Lersundi, J.; Campo-Bescós, M.A.; Giménez, R.; Preciado, B.; Lafarga, A. Runoff, nutrients, sediment and salt yields in an irrigated watershed in southern Navarre (Spain). Agric. Water Manag. 2018, 195, 120–132. [Google Scholar] [CrossRef]
  41. Rasmussen, J.J.; McKnight, U.S.; Loinaz, M.C.; Thomsen, N.I.; Olsson, M.E.; Bjerg, P.L.; Binning, P.J.; Kronvang, B. A catchment scale evaluation of multiple stressor effects in headwater streams. Sci. Total Environ. 2013, 442, 420–431. [Google Scholar] [CrossRef]
  42. Effert-Fanta, E.L.; Fischer, R.U.; Wahl, D.H. Effects of riparian forest buffers and agricultural land use on macroinvertebrate and fish community structure. Hydrobiologia 2019, 841, 45–64. [Google Scholar] [CrossRef]
  43. Gerth, W.J.; Li, J.; Giannico, G.R. Agricultural land use and macroinvertebrate assemblages in lowland temporary streams of the Willamette Valley, Oregon, USA. Agric. Ecosyst. Environ. 2017, 236, 154–165. [Google Scholar] [CrossRef]
  44. Fierro, P.; Valdovinos, C.; Arismendi, I.; Díaz, G.; Jara-Flores, A.; Habit, E.; Vargas-Chacoff, L. Examining the influence of human stressors on benthic algae, macroinvertebrate, and fish assemblages in Mediterranean streams of Chile. Sci. Total Environ. 2019, 686, 26–37. [Google Scholar] [CrossRef]
  45. Tockner, K.; Robinson, C.T.; Uehlinger, U. Rivers of Europe, 1st ed.; Academic Press/Elsevier: London, UK, 2009; p. 728. [Google Scholar]
  46. Penczak, T.; Galicka, W.; Głowacki, Ł.; Koszaliński, H.; Kruk, A.; Zięba, G.; Grabowska, J.; Marszał, L. Fish assemblage changes relative to environmental factors and time in the Warta River, Poland, and its oxbow lakes. J. Fish Biol. 2003, 64, 483–501. [Google Scholar] [CrossRef]
  47. Penczak, T. Fish assemblages composition in a natural, then regulated, stream: A quantitative long-term study. Ecol. Modell. 2011, 222, 2103–2118. [Google Scholar] [CrossRef]
  48. Cheng, S.T.; Herricks, E.E.; Tsai, W.P.; Chang, F.J. Assessing the natural and anthropogenic influences on basin-wide fish species richness. Sci. Total Environ. 2016, 572, 825–836. [Google Scholar] [CrossRef]
  49. Sutela, T.; Vehanen, T.; Jounela, P. Longitudinal patterns of fish assemblages in European boreal streams. Hydrobiologia 2020, 847, 3277–3290. [Google Scholar] [CrossRef]
  50. Sutela, T.; Vehanen, T.; Jounela, P.; Aroviita, J. Species–environment relationships of fish and map-based variables in small boreal streams: Linkages with climate change and bioassessment. Ecol. Evol. 2021, 11, 10457–10467. [Google Scholar] [CrossRef]
  51. Matthews, W.J.; Marsh-Matthews, E. Effects of drought on fish across axes of space, time, and ecological complexity. Freshw. Biol. 2003, 48, 1232–1253. [Google Scholar] [CrossRef]
  52. Kruk, A. Long-term changes in fish assemblages of the Widawka and Grabia Rivers (Poland): Pattern recognition with a Kohonen artificial neural network. Ann. Limnol.—Int. J. Lim. 2007, 43, 253–269. [Google Scholar] [CrossRef]
  53. Kruk, A.; Lek, S.; Park, Y.-S.; Penczak, T. Fish assemblages in the large lowland Narew River system (Poland): Application of the self-organizing map algorithm. Ecol. Model. 2007, 203, 45–61. [Google Scholar] [CrossRef]
  54. Czerniejewski, P.; Czerniawski, R. Marine and Freshwater Fish of Poland, 1st ed.; FREL Scientific Publishing: Warsaw, Poland, 2016; p. 331. [Google Scholar]
  55. Wolter, C. Conservation of fish species diversity in navigable waterways. Landsc. Urban Plan. 2001, 53, 135–144. [Google Scholar] [CrossRef]
  56. Kruk, A.; Penczak, T. Impoundment impact on populations of facultative riverine fish. Ann. Limnol.—Int. J. Limnol. 2003, 39, 197–210. [Google Scholar] [CrossRef]
  57. Lonzarich, D.G.; Quinn, T.P. Experimental evidence for the effect of depth and structure on the distribution, growth, and survival of stream fishes. Can. J. Zool. 1995, 73, 2223–2230. [Google Scholar] [CrossRef]
  58. Penaluna, B.E.; Dunham, J.; Andersen, H.V. Nowhere to hide: The importance of in stream cover for stream-living Coastal Cutthroat Trout during seasonal low flow. Ecol. Freshw. Fish 2020, 30, 256–269. [Google Scholar] [CrossRef]
  59. Arthington, A.H.; Bunn, S.E.; Poff, N.L.; Naiman, R.J. The challenge of providing environmental flow rules to sustain river ecosystems. Ecol. Appl. 2016, 16, 1311–1318. [Google Scholar] [CrossRef]
  60. Bunn, S.E.; Arthington, A.H. Basic principles and ecological consequences of altered flow regimes for aquatic biodiversity. Environ. Manag. 2002, 30, 492–507. [Google Scholar] [CrossRef]
  61. Dewson, Z.S.; James, A.B.W.; Death, R.G. A review of the consequences of decreased flow for instream habitat and macroinvertebrates. J. N. Am. Benthol. Soc. 2007, 26, 401–415. [Google Scholar] [CrossRef]
  62. Welcomme, R.L.; Winemiller, K.O.; Cowx, I.G. Fish environmental guilds as a tool for assessment of ecological condition of rivers. River Res. Appl. 2005, 22, 377–396. [Google Scholar] [CrossRef]
  63. Meixner, T.; Huth, A.K.; Brooks, P.D.; Conklin, M.H.; Grimm, N.B.; Bales, R.C.; Haas, P.A.; Petti, J.R. Influence of shifting flow paths on nitrogen concentrations during monsoon floods, San Pedro River, Arizona. J. Geophys. Res. Atmos. 2007, 112, G03S03. [Google Scholar]
  64. Evans, D.H.; Claiborne, J.B.; Currie, S. (Eds.) The Physiology of Fishes, 4th ed.; CRC Press: Boca Raton, FL, USA, 2014; p. 482. [Google Scholar]
  65. Roman, M.R.; Brandt, S.B.; Houde, E.D.; Pierson, J.J. Interactive Effects of Hypoxia and Temperature on Coastal Pelagic Zooplankton and Fish. Front. Mar. Sci. 2019, 6, 139. [Google Scholar] [CrossRef]
  66. Friedman, J.R.; Condon, N.E.; Drazen, J.C. Gill surface area and metabolic enzyme activities of demersal fishes associated with the oxygen minimum zone off California. Limnol. Oceanogr. 2012, 57, 1701–1710. [Google Scholar] [CrossRef]
  67. Eddy, F.B. Ammonia in estuaries and effects on fish. J. Fish Biol. 2005, 67, 1495–1513. [Google Scholar] [CrossRef]
  68. Lemarie, G.; Dosdat, A.; Coves, D.; Dutto, G.; Gasset, E.; Person-Le Ruyet, J. Effect of chronic ammonia exposure on growth of European seabass (Dicentrarchus labrax) juveniles. Aquaculture 2004, 229, 479–491. [Google Scholar] [CrossRef]
  69. Sinha, A.K.; Liew, H.J.; Diricx, M.; Blust, R.; De Boeck, G. The interactive effects of ammonia exposure, nutritional status and exercise on metabolic and physiological responses in gold fish (Carassius auratus L.). Aquat Toxicol. 2012, 109, 33–46. [Google Scholar] [CrossRef] [PubMed]
  70. Li, M.; Yu, N.; Qin, J.G.; Li, E.; Du, Z.; Chen, L. Effects of ammonia stress, dietary linseed oil and Edwardsiella ictaluri challenge on juvenile dark barbel catfish Pelteobagrus vachelli. Fish Shellfish Immunol. 2014, 38, 158–165. [Google Scholar] [CrossRef] [PubMed]
  71. Camargo, J.A.; Alonso, A.; Salamanca, A. Nitrate toxicity to aquatic animals: A review with new data for freshwater invertebrates. Chemosphere 2005, 58, 1255–1267. [Google Scholar] [CrossRef]
  72. Cheng, S.-Y.; Tsai, S.-J.; Chen, J.-C. Accumulation of nitrate in the tissues of Penaeus monodon following elevated ambient nitrate exposure after different time periods. Aquat. Toxicol. 2002, 56, 133–146. [Google Scholar] [CrossRef]
  73. Camargo, J.A.; Alonso, A. Ecological and toxicological effects of inorganic nitrogen pollutionin aquatic ecosystems: A global assessment. Environ. Int. 2006, 32, 831–849. [Google Scholar] [CrossRef]
  74. Schindler, D.W.; Hecky, R.E.; Findlay, D.L.; Stainton, M.P.; Parker, B.R.; Paterson, M.J. Eutrophication of lakes cannot be controlled by reducing nitrogen input: Results of a 37-year whole-ecosystem experiment. Proc. Natl. Acad. Sci. USA 2008, 105, 11254–11258. [Google Scholar] [CrossRef] [PubMed]
  75. Griffiths, D. The direct contribution of fish to lake phosphorus cycles. Ecol. Freshw. Fish 2006, 15, 86–95. [Google Scholar] [CrossRef]
  76. Gorman, M.W.; Zimmer, K.D.; Herwig, B.R.; Hanson, M.A.; Wright, R.G.; Vaughn, S.R.; Younk, J.A. Relative importance of phosphorus, fish biomass, and watershed land use as drivers of phytoplankton abundance in shallow lakes. Sci. Total Environ. 2014, 466–467, 849–855. [Google Scholar] [CrossRef] [PubMed]
Figure 1. Study areas within the Central European Plain ecoregion: top left, Europe with the ecoregion, centre, location of two study areas within Poland; (A,B), location of the study sites (red circles).
Water 14 02697 g001
Figure 2. Results of cluster analysis (UPGMA) for the studied watercourses.
Water 14 02697 g002
Figure 3. Correlation between oxygen content and N-NH4 in small watercourses.
Water 14 02697 g003
Figure 4. Maximum number of species and density for the studied watercourses.
Water 14 02697 g004
Figure 5. CCA graph for dependences between density of guilds and environmental conditions.
Water 14 02697 g005
Figure 6. CCA graph for the dependence of density of particular fish species on environmental conditions.
Water 14 02697 g006
Figure 7. CCA graph for the ecological indices on environmental conditions.
Water 14 02697 g007
Table 1. Characteristics of sampling sites in the 10 watercourses.
Watercourse NameRegionGeographical CoordinatesSurface Area of Catchment (km2)Land Use and Characteristics of Catchment 1
Płonia (Plo)NW PLN 53.132223
E 15.133033
N 53.122824
E 15.159683
174.59
143.59
A—54%, FO—30%, M—8%, U—5%, W—2%, MA—1%
Myśla (Mys)NW PLN 52.999399
E 14.977928
N 52.997431
E 15.043580
143.16
111.07
A—68%, FO—22%, M—7%, U—1%, W—1%, MA—1%
Tywa (Tyw)NW PLN 53.226618
E 14.488537
N 53.230132
E 14.478140
270.23
274.25
A—57%, FO—28%, M—7%, U—4%, W—3%, MA—1%
Rurzyca (Rur)NW PLN 52.976910
E 14.543279
N 52.966904
E 14.594320
83.03
68.41
A—58%, FO—24%, M—12%, U—3%, MA—2%, W—1%
Wardynka (War)NW PLN 53.160318
E 15.621905
N 53.155871
E 15.619340
25.16
25.93
FO—51%, A—36%, M—13%
Kanał Habdziński (KHb)CE PLN 52.109913
E 21.159885
N 52.079362
E 21.174069
21.57
11.03
A—56%, M—16%, U—16%, FO—7%, MA—5%
Zielona (Zie)CE PLN 51.972162
E 21.044578
N 51.950092
E 21.014168
26.72
19.37
A—59%, M—19%, FO—13%, U—7%, O—2%
Czarna Cedron (CCd)CE PLN 51.973815
E 21.217970
N 51.984218
E 21.222136
69.48
73.80
O—34%, FO—32%, A—18%, U—13%, M—3%
Kraska (Kra)CE PLN 51.803904
E 20.879642
N 51.805846
E 20.886593
27.14
27.50
O—44%, A—30%, FO—14%, M—8%, U—4%
Molnica (Mln)CE PLN 51.854814
E 20.810983
N 51.857631
E 20.816710
13.25
13.79
O—68%, A—19%, FO—13%
1 NW PL– north-western Poland, CE PL—central Poland; A—arable land, M—meadows, O—orchards, FO—forest, U—urban areas, W—water (reservoirs, rivers), MA—marshes.
Table 2. Physico-chemical and hydrometrical parameters in the studied watercourses, with results of Kruskal–Wallis and Dunn’s tests.
FeatureCCdKHbKraMlnMysPloRurTywWarZieAverageSDCV
Flow velocity
[cm/s]
0.11 a0.07 a0.12 abc0.07 c0.16 abc0.37 b0.33 b0.39 b0.79 b0.14 abc0.240.27112.7
Discharge
[cm3/s]
0.18 ab0.21 a0.05 b0.01 b0.06 b1.82 b0.55 a0.93 a0.27 ab0.06 b0.470.89186.7
Width
[m]
4.81 a5.45 a2.25 b1.10 b1.71 b7.57 a3.88 abc3.92 abc2.55 ab2.49 ab3.892.2056.4
Depth
[m]
0.47 a0.41 ab0.21 b0.12 b0.15 b0.70 a0.38 ab0.46 a0.12 b0.16 b0.350.2467.1
Temp
[°C]
18.40 a17.16 a16.89 a20.39 a16.89 a16.54 a16.49 a16.47 a14.50 a17.97 a17.132.5314.8
pH7.37 a7.19 a7.70 b7.40 ab7.63 b7.74 b7.41 ab7.75 b7.71 b7.50 ab7.540.273.6
EC
[mS/cm]
492 a569 a843 b691 b784 b605 ac705 bc665 bc577 abc565 ac650142.421.9
O2 [mg/dm3]5.47 abc4.72 abc6.40 abc7.93 b4.54 abc5.66 abc3.85 c6.18 abc6.41 abc6.46 abc5.622.0636.5
N-NO3
[mg/dm3]
3.32 a3.88 a8.63 b13.08 c3.88 a3.16 a3.67 a3.95 a4.05 a7.19 b5.094.5890.0
N-NH4
[mg/dm3]
0.14 abc0.32 abc0.17 abc0.14 abc0.43 abc0.38 abc1.43 b0.36 abc0.10 c0.12 abc0.380.56149.8
P-PO4
[mg/dm3]
0.61 a0.73 ab0.84 ab1.13 ab0.94 ab1.28 b1.46 b0.84 ab0.74 ab0.86 ab0.940.5457.8
The mean values designated with the same letter in the table line do not show a statistically significant difference, values of parameters in the same row with different indices differ significantly (Dunn’s test, p < 0.05),—mean, SD—standard deviation, CV—coefficient of variation. Abbreviations: Płonia (Plo), Myśla (Mys), Tywa (Tyw), Rurzyca (Rur), Wardynka (War), Kanał Habdziński (KH), Zielona (Ziel), Czarna Cedron (CCd), Kraska (Kr), and Molnica (Mln). Orange color marks catchments with more than 50% of agricultural crops, and yellow marks water courses in catchments with more than 30% forests.
Table 3. Results of stepwise regression and correlation of the effect of variables on the fish density of particular guilds.
VariableAll FishRheophilous FishLimnephilous FishEuryoecious Fish
Stepwise AnalysisCorr AnalysisStepwise AnalysisCorr AnalysisStepwise AnalysisCorr AnalysisStepwise AnalysisCorr Analysis
t ValuePr (>|t|)Sign. CodeRSign. Codet ValuePr (>|t|)Sign. CodeRSign. Codet ValuePr (>|t|)Sign. CodeRSign. Codet ValuePr (>|t|)Sign. CodeRSign. Code
99.54<0.00**** 11.97<0.00 **** 24.97<0.00**** 4.46<0.00****
Hydrometrical features of water
Flow velocity [cm/s]0.000.000.00−0.09-2.100.04**0.03-0.000.000.00−0.17-0.000.000.000.10-
Discharge [cm3/s]0.000.000.00−0.19*0.000.000.00−0.27**−1.840.07*−0.27***−1.450.15-−0.13-
Depth [m]−5.71<0.00****−0.33****0.000.000.00−0.49****−3.09<0.00***−0.37****2.360.02**−0.23-
Width [m]0.000.000.00−0.33****6.52<0.00****−0.51****0.000.000.00−0.36****0.000.000.00−0.23-
Chemical and physical features of water
Temperature [°C]0.000.000.00−0.03-0.000.000.000.16-0.000.000.00−0.03-0.000.000.000.20-
pH0.000.000.00−0.01-−1.900.06*−0.13-0.000.000.00−0.01-−2.380.02**−0.07-
EC [mS/cm]0.000.000.000.23**0.000.000.000.20-1.610.11-0.15-2.820.01***0.03-
O2 [mg/dm3]1.520.13-−0.06-−2.780.01***0.04-0.000.000.000.12-−3.46<0.00***0.44***
N-NO3 [mg/dm3]2.210.03**0.01-0.000.000.000.01-0.000.000.00−0.09-−1.920.06*−0.09-
P-PO4 [mg/dm3]−3.080.003***−0.13-0.000.000.00−0.04-−2.190.03**−0.20*1.610.12-0.02-
N-NH4 [mg/dm3]0.000.000.000.08-0.000.000.000.00-−1.690.10*−0.14-0.000.000.00−0.04-
Streambed substrate composition
Kd0.000.000.000.06-0.000.000.000.29-0.000.000.00−0.13-0.000.000.00−0.02-
Km0.000.000.00−0.07-0.000.000.000.27-0.000.000.00−0.23-0.000.000.00−0.17-
Zd0.000.000.00−0.26-0.000.000.00−0.24-0.000.000.00−0.34**0.000.000.000.34-
Zm0.000.000.00−0.04-0.000.000.00−0.03-0.000.000.00−0.11-0.000.000.000.04-
P0.000.000.000.24**0.000.000.000.32**0.000.000.000.23**0.000.000.000.18-
M0.000.000.00−0.08-0.000.000.000.16-0.000.000.00−0.04-0.000.000.00−0.20-
Macrophytes
No of plant sp.0.000.000.000.10-0.000.000.00−0.05-0.000.000.000.29***0.000.000.00−0.08-
Vegetation coverage (%) 0.000.000.000.15-0.000.000.000.24*0.000.000.000.26**0.000.000.00−0.28*
Legend: Signif. codes: 0 ‘****’ 0.001 ‘***’ 0.01 ‘**’ 0.05 ‘*’ Kd—large stones, Km—small stones, Zd—coarse gravel, Zm—fine gravel, P—sand, M—md; 0.00 [In column: “stepwise analysis”]—variables not considered in stepwise analysis.
Table 4. Eigenvalues, % of explained variation and p-value estimates for three axes determined by CCA for the effect of conditions on the fish density of particular guilds.
AxisEigenvalue%p
10.06146.260.097
20.05037.810.022
30.02115.930.058
Table 5. Eigenvalues, % of explained variation and p-value estimates for the first four of 17 axes determined by CCA for the effect of conditions on particular fish species.
AxisEigenvalue%p
10.01230.150.805
20.00819.720.860
30.00615.520.707
40.00410.460.829
Table 6. Values of the Jaccard index for the studied localities.
KHbKraMlnMysPlnRurTywWarZie
CCd0.3890.3500.2500.4000.5260.3530.3210.3570.316
KHb 0.5290.4620.4210.3330.2940.2860.3850.500
Kra 0.5000.6110.4290.5000.4620.3330.625
Mln 0.2940.2780.3080.1920.4440.462
Mys 0.4760.3160.3930.2350.350
Pln 0.3680.3790.2220.400
Rur 0.2590.4550.571
Tyw 0.1540.333
Table 7. Biotic indices for the studied localities.
CodeTaxa_SSimpson_1-DShannon_HEvenness_e^H/S
CCd130.8372.1140.637
KHb *120.7611.8440.527
Kra140.8502.1350.604
Mln *70.7151.4370.601
Mys *150.8312.2290.619
Pln160.8732.3020.625
Rur *100.7941.8560.639
Tyw *240.9062.6190.572
War60.6001.2150.562
Zie *120.7911.8530.531
Table 8. Eigenvalues, % of explained the total variation and p-value estimates for the first three of 9 axes determined by CCA.
AxisEigenvalue%p
10.01097.950.030
20.0001.630.134
34.3100.4210.029
Publisher’s Note: MDPI stays neutral with regard to jurisdictional claims in published maps and institutional affiliations.

