
Ecological Risk Evaluation of Baihetan Dam Based on Fuzzy Hazard Quotient Model
1
School of Infrastructure Engineering, Nanchang University, Nanchang 330031, China
2
Key Laboratory of Poyang Lake Environment and Resource Utilization, Nanchang University, Ministry of Education, Nanchang 330031, China
3
Hydrology Bureau of Changjiang Water Resources Commission, Wuhan 430010, China
*
Author to whom correspondence should be addressed.
Water 2022, 14(17), 2694; https://doi.org/10.3390/w14172694
Submission received: 29 April 2022
/
Revised: 20 August 2022
/
Accepted: 23 August 2022
/
Published: 30 August 2022
(This article belongs to the Special Issue The Role of Dam to the River Water Environment)
Abstract
:To evaluate the variation in ecological risk induced by pollutants from the construction of Baihetan Dam, the largest hydropower station under construction in the world, this study proposes a fuzzy hazard quotient (HQ) model designed on the basis of triangular fuzzy number (TFN) theory. The fuzzy HQ model uses hazardous TFN to evaluate the ecological risk including uncertain observation data, and the transition TFN to analyze the variation in ecological risk before and after the dam construction. The results show the following: (i) The ecological risk of ammonia nitrogen (NH3-N) showed a marked increasing trend after the construction of the dam because this activity weakened the degradation ability of the water body. The chronic hazard of NH3-N was classified as “medium” grade and its acute hazard was “low” grade. (ii) The crucial acute hazard factor for the local aquatic ecosystem was copper (Cu) and the key chronic hazard factor was lead (Pb). (iii) After the construction of Baihetan Dam, both the long-term and short-term hazardous TFNs of Cu were classified as “medium” grade. The acute hazard of Pb belonged to “low” grade with high certainty, whereas its chronic hazard classification had uncertainties. Its long-term hazardous vectors upstream were {0.000, 0.928, 0.072}, whereas its long-term hazardous vectors downstream were {0.000, 0.108, 0.892}. (iv) Both of the ecological risks of Cu and Pb showed substantial decreasing trends after the construction of Baihetan Dam because the impounding effect of Baihetan Dam promoted the settlement of heavy metals with sediment. (v) The hazardous TFN method can be applied to perform an ecological risk evaluation that accounts for uncertainties in the observation data set, and the transition TFN method can analyze the variation in ecological risk with a small sample size. Therefore, the fuzzy HQ model is effective for the evaluation of ecological risk induced by dam construction.
1. Introduction
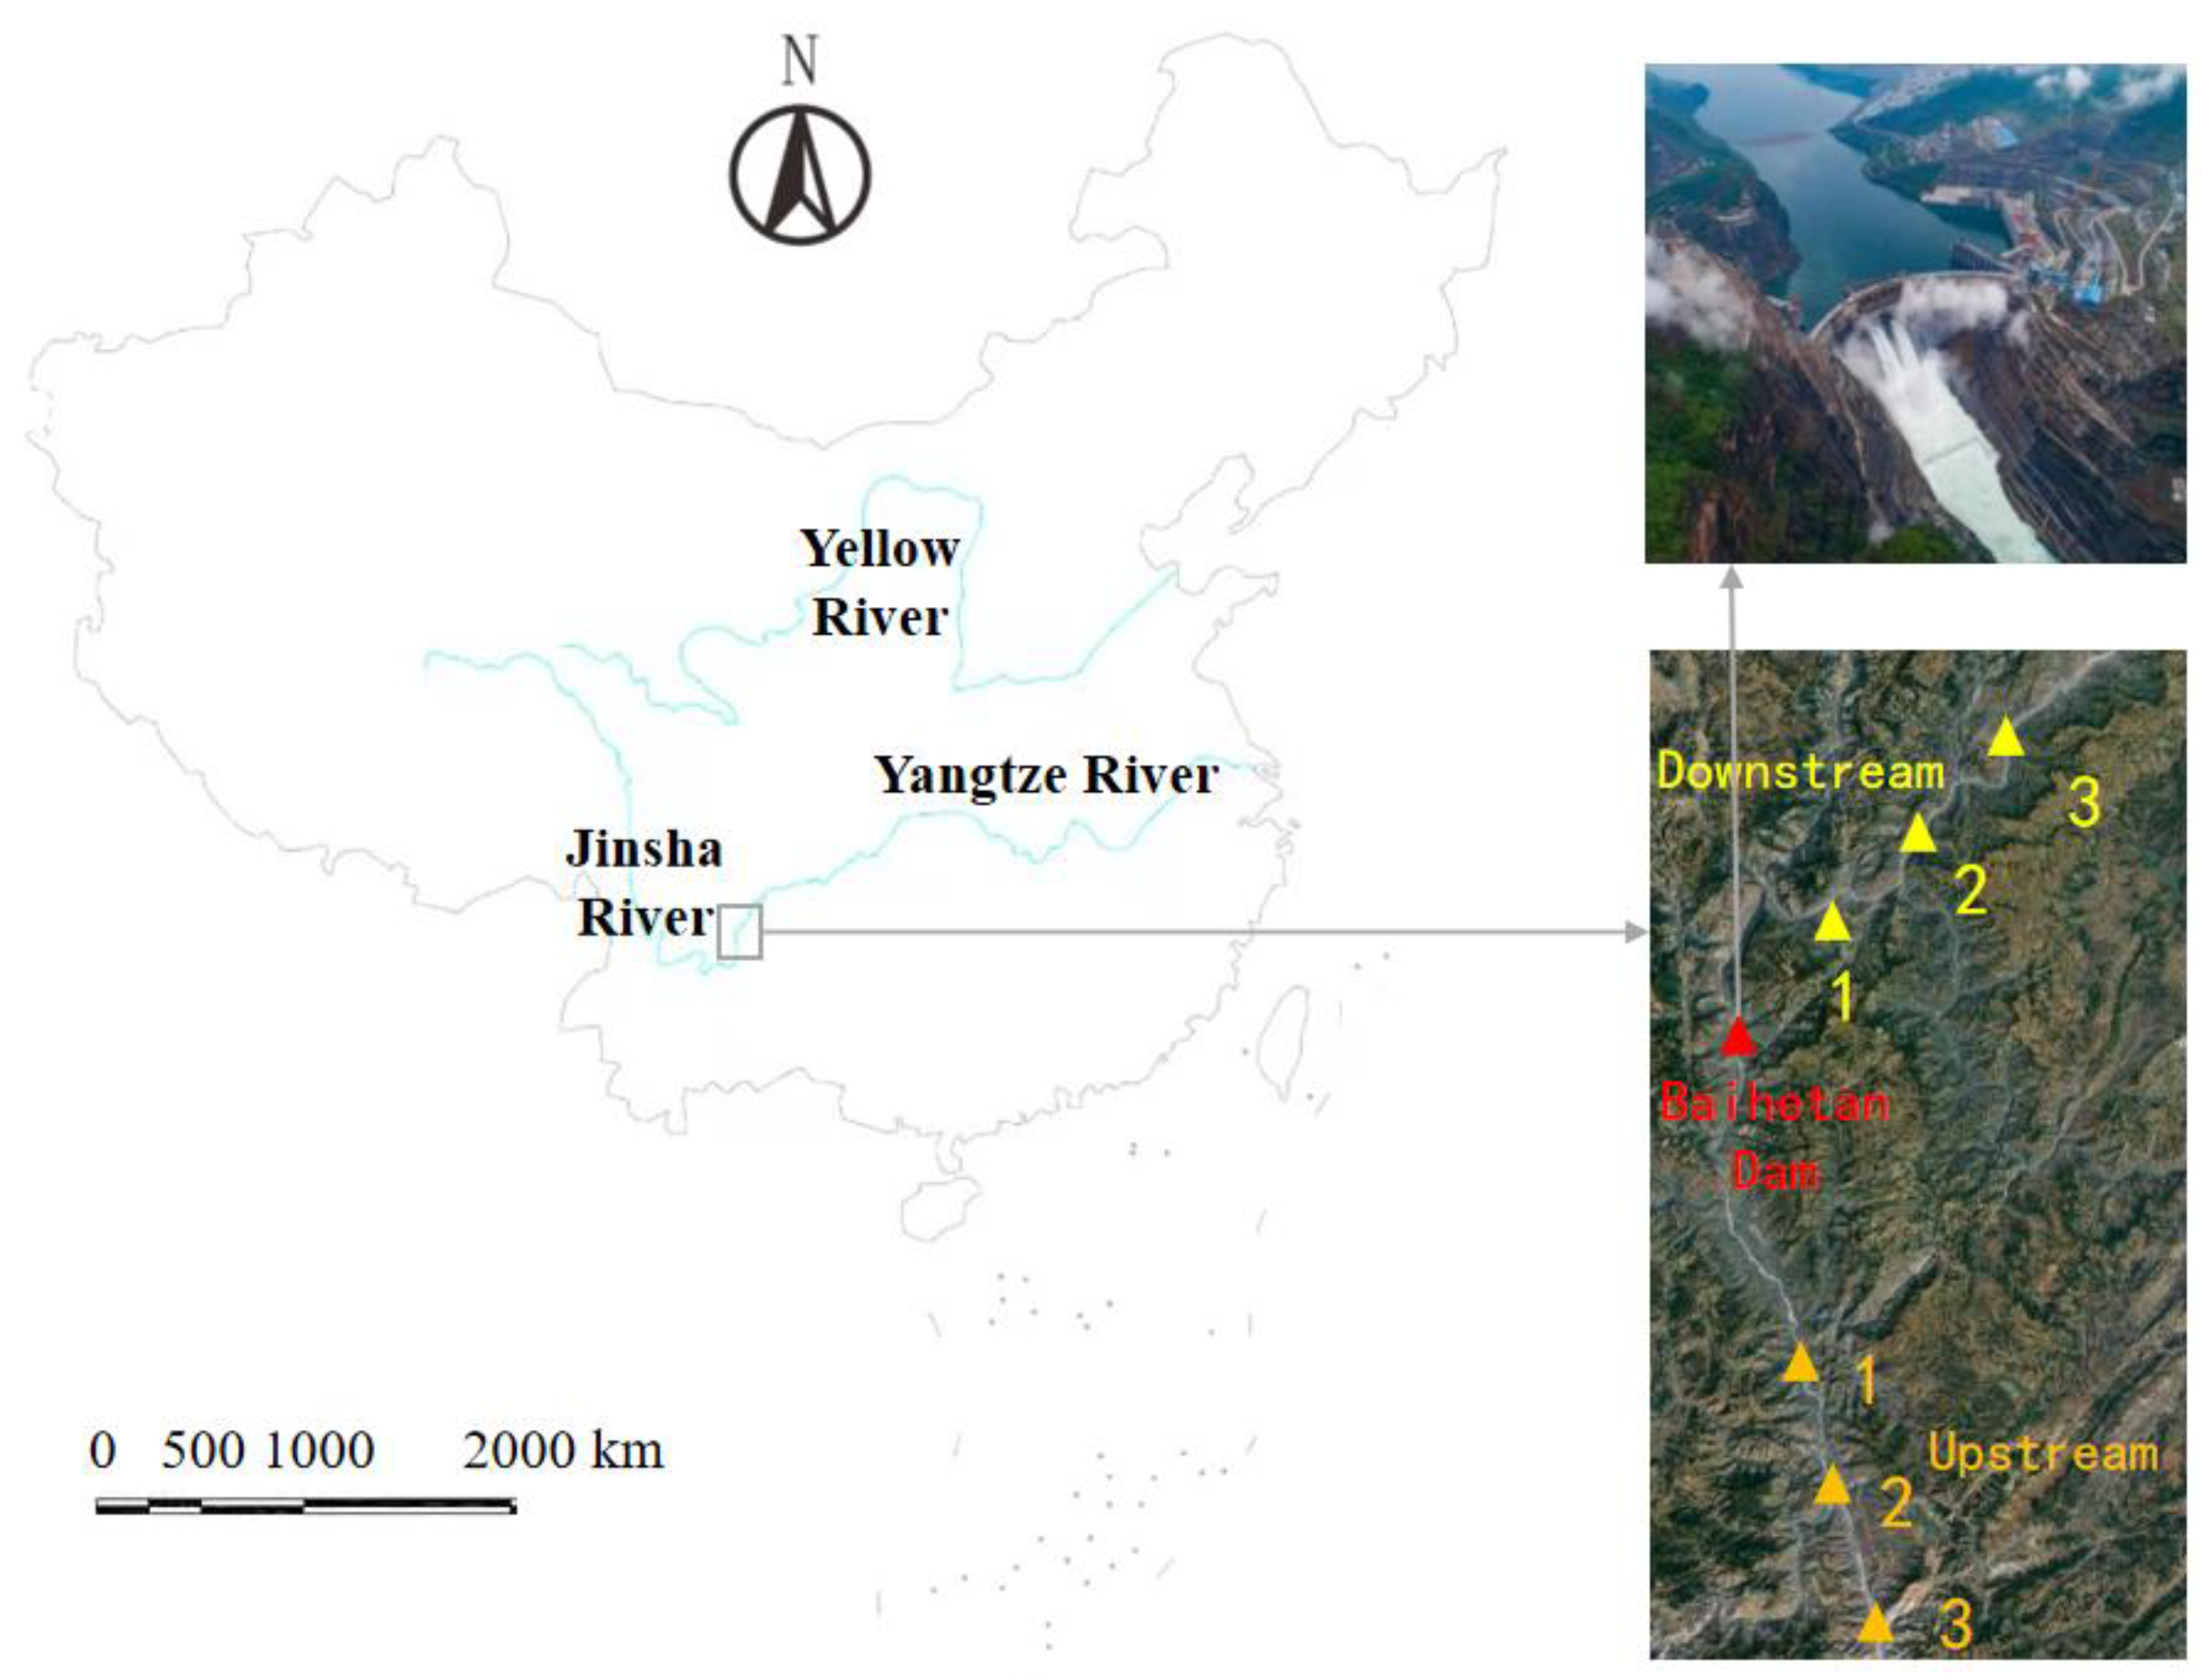
Baihetan Hydropower Station is the largest hydropower station under construction in the world [1,2]. The dam of this hydropower station is a double-curvature arch dam. Its height is 289 m, ranking third in China [1,2]. The dam is located on the Jinsha River, a major river in the upper reaches of the Yangtze [1,2]. Jinsha River is an important habitat and spawning ground for freshwater fish in China, but Baihetan Dam has profoundly altered its hydrological and environmental characteristics [1,2]. Therefore, assessing the ecological risks posed to the Jinsha River by the construction of Baihetan Dam is important.
The impact of dams on the water environment of rivers is a key topic in water resource management. For example, Agostinho et al. [3] analyzed the impact of dams on the flood regime of the Upper Parana River and evaluated its effects on assemblage attributes, reproduction, and recruitment. Yang et al. [4] conducted a spatial assessment of the hydrologic alterations caused by dam construction in the middle and lower Yellow River, China. Graf [5] evaluated the pervasive influence of an extensive water control infrastructure including more than 75,000 dams on the hydrology and geomorphology of large rivers in the United States. In general, the influence of dams on aquatic ecology that occurs through changing hydrological rhythms has received extensive attention.
In addition to hydrological functions, dams can affect the health of aquatic ecosystems by altering the distribution of pollutants. For example, in an ecological impact assessment of the Xiangjiaba Dam on the Yangtze River, Lu et al. [6] found that ammonia nitrogen (NH3-N) trapped in the reservoir could directly harm the health of fish by damaging the liver and nerves, which caused the fish deaths in the Xiangjiaba reservoir area in July 2014 [6]. Therefore, to comprehensively evaluate the role of dams in river water environments, we have to study the influences of dams on the ecological risks from pollutants.
In the current literature, hazard quotient (HQ) is the model most widely used to quantify the risks of pollutants to the aquatic ecosystem. HQ is the ratio of exposure concentration and safety criteria, which is concise and intuitive. For these advantages, HQ has obtained many applications in global ecological risk assessment. For example, Liang et al. [7] used HQ to assess the human health impacts of heavy metals on the surface waters of Taihu Lake, China. Feng et al. [8] conducted an ecological and risk assessment of polycyclic aromatic hydrocarbons in the Yellow River water based on the HQ model. Ding et al. [9] applied HQ to assess the ecological risk of ammonia in the Shaying River Basin, China.
Although HQ has been effectively applied in assessing the ecological risk of pollutants in natural water bodies, it faces the following challenges when assessing the influence of dams on the threat of pollutants: (i) Given that the dam construction changes the hydrodynamic conditions, the distribution of pollutants in water is usually uneven, which brings uncertainty to the exposure concentration values [6]. (ii) As the dams are usually far from urban areas, environmental monitoring data are not abundant [6]. Therefore, using conventional mathematical statistics, time series analysis, or machine learning methods to evaluate the changing rule of HQ values induced by dam construction is difficult.
The objectives of this study are as follows: (i) Based on triangular fuzzy number (TFN) theory, a fuzzy HQ model, which includes a hazardous TFN model and a transitional TFN model, is designed. The hazardous TFN model is used to evaluate the ecological risk including uncertain observation data, and the transition TFN model is used to evaluate the ecological risk variation induced by dam construction. (ii) Based on the hazardous TFN model, the ecological risks of NH3-N, copper (Cu), and lead (Pb) in locations upstream and downstream of Baihetan Dam are evaluated, and the critical threat factors to the aquatic ecosystem are revealed. (iii) Based on the transition TFN model, the variation in fuzzy HQs before and after the construction of Baihetan Dam is analyzed, and the influences of the dam on the ecological risks from pollutants are revealed. The fuzzy HQ model provides a new method to assess ecological risk with sparse observation data and quantify the influences of dam construction on the pollutant hazards, which are important for clarifying the role of the dam in the river water environment.
2. Methods and Materials
2.1. Study Area
Figure 1 shows the Baihetan Hydropower Station situated on the Jinsha River. Its location is 102°54′ E longitude and 27°17′ N latitude [1,2]. The installed capacity of the Baihetan Hydropower Station is 16 million kilowatts, which is the third largest in the world. The station has a double-curvature arch dam with a height of 289 m [1,2].
The Baihetan Hydropower Station is the largest hydropower station under construction in the world [1,2]. Its cofferdam intercept was completed in November 2015 [1,2]. The construction of Baihetan Dam began in August 2017 and was completed in May 2021 [1,2]. In July 2021, the first generator set was placed in operation [1,2]. According to the schedule, the construction of Baihetan Hydropower Station will be fully completed in 2023 [1,2].
The evaluation data of this paper came from the environmental survey of the Hydrology Bureau of Changjiang Water Resources Commission (HBCWRC) and Nanchang University, China. Figure 1 shows the Jinsha River is an important habitat and spawning ground for freshwater fish. To assess the impact of Baihetan Dam on the local environment, HBCWRC and Nanchang University assigned three monitoring sites upstream and downstream of the dam. In August 2015, three parallel water samples were collected at each monitoring site and sent to HBCWRC and Nanchang University for a water quality test, which reflected the environmental conditions before the construction of the dam. In August 2021, three parallel water samples were collected at each monitoring site and sent to HBCWRC and Nanchang University again for a water quality test which reflected the environmental conditions after the construction of Baihetan Dam.
Many pollutants, such as NH3-N, heavy metals, and toxic organic contaminants, may induce hazards to aquatic organisms. The following principles were followed in selecting the representative pollutants for evaluation:
- (i)
- The representative pollutants should have definite biological safety thresholds.
Biological safety standards for toxic organic contaminants, chromium, vanadium, and arsenic were few because ecological risk assessment in China is in its infancy. As a result, these contaminants were not used for ecological risk evaluation in this study.
- (ii)
- The representative pollutants should have the potential to exceed their biological safety threshold.
According to the preliminary investigation, the concentrations of mercury and titanium were below the detection limit at sites both upstream and downstream from Baihetan Dam. Moreover, the concentrations of zinc and manganese were much lower than their biological safety threshold. As a result, these contaminants were also not used for ecological risk evaluation in this study.
Three pollutants, namely, NH3-N, Cu, and Pb, satisfied the aforementioned principles. All of these pollutants have definite toxic effects, biological standards, and potential to exceed their safety thresholds. NH3-N can directly harm fish health by damaging the nervous system, respiratory system, and liver tissue [11]. Cu can cause an imbalance in the immune function of the organism, damage liver function, and threaten the growth, development, reproduction and other life activities of fish [12]. Pb can affect the growth and development of aquatic animals at different stages and enter the human body through the food chain, harming the nervous and digestive systems [13].
Therefore, NH3-N, Cu, and Pb were selected as the representative pollutants for ecological risk evaluation in this study. The experimental method was based on the Chinese “Surface Water Environmental Quality Standards (GB 3838-2002)” [14]. The raw observation data are provided in Tables S1 and S2 of the Supplementary Materials.
2.2. HQ Model
HQ is the ratio of a pollutant’s exposure concentration and biosafety criteria [6]. The biosafety criteria are divided into long-term and short-term criteria, which reflect the allowable thresholds of chronic and acute toxicities, respectively [6]. Therefore, HQ is also divided into long-term and short-term HQ, reflecting the chronic and acute hazards of pollutants to aquatic ecosystems, respectively [6].
Supposing m pollutants are evaluated, the exposure concentration value of the ith pollutant is denoted as xi, the long-term criteria is li, and the short-term criteria is si.
The biosafety criteria of NH3-N, Cu, and Pb in the Jinsha River, according to Wang et al. [15], Wu et al. [12], and He et al. [13], are listed in Table 1.
In Chinese ecological risk assessment, HQ is usually divided into three grades: low (<0.1), medium (0.1–1), and high (>1), which represent that the ecological risk is negligible, allowable but not negligible, and not allowable, respectively [6].
Compared with the natural water body, in assessing the impact of dams on the threats of pollutants, the conventional HQ model faces the following challenges:
- (i)
- The concentration distribution of pollutants in the water is usually uneven because the dam construction changes the hydrodynamic conditions [6]. As a result, the exposure concentration in Equations (1) and (2) is not a unique value but has uncertainty.
- (ii)
- As the dams are usually far from urban areas, the environmental monitoring data are not abundant [6]. For example, due to inconvenient transportation, only two investigations were made for this paper, which reflect the environmental conditions before and after the construction of Baihetan Dam. Therefore, using conventional mathematical statistics, time series analysis, or machine learning methods to evaluate the changing patterns of HQ values induced by dam construction is difficult.
To address these challenges, the HQ model must be improved to deal with the uncertainty in the exposure concentration values and evaluate the changes in the ecological risk induced by dam construction.
2.3. TFN Theory
Fuzzy math theory was designed to address ambiguous concepts, such as good–bad, beautiful–ugly, and old–young [12,15]. Clearly, these concepts have opposite meanings, but their boundaries are vague. In this condition, determining that the research object belongs to a certain concept is difficult. Therefore, fuzzy math theory uses the membership function to quantify the possibility that the research object belongs to each concept [12,15].
Even if the boundaries of the concepts are determined, due to the influences of monitoring error and the inhomogeneity of the research object, the observation data often have uncertainties that cause difficulty in obtaining a definite judgment [12,15]. For example, suppose the safety threshold of Pb is 0.0051 mg/L, and the upper limit and lower limit of its observation data are 0.006 mg/L and 0.004 mg/L, respectively. Evidently, determining whether the concentrations of Pb are acceptable is difficult. In such situations, fuzzy math theory is also an effective evaluation tool to reveal the quantitative relationship between the research object and each concept.
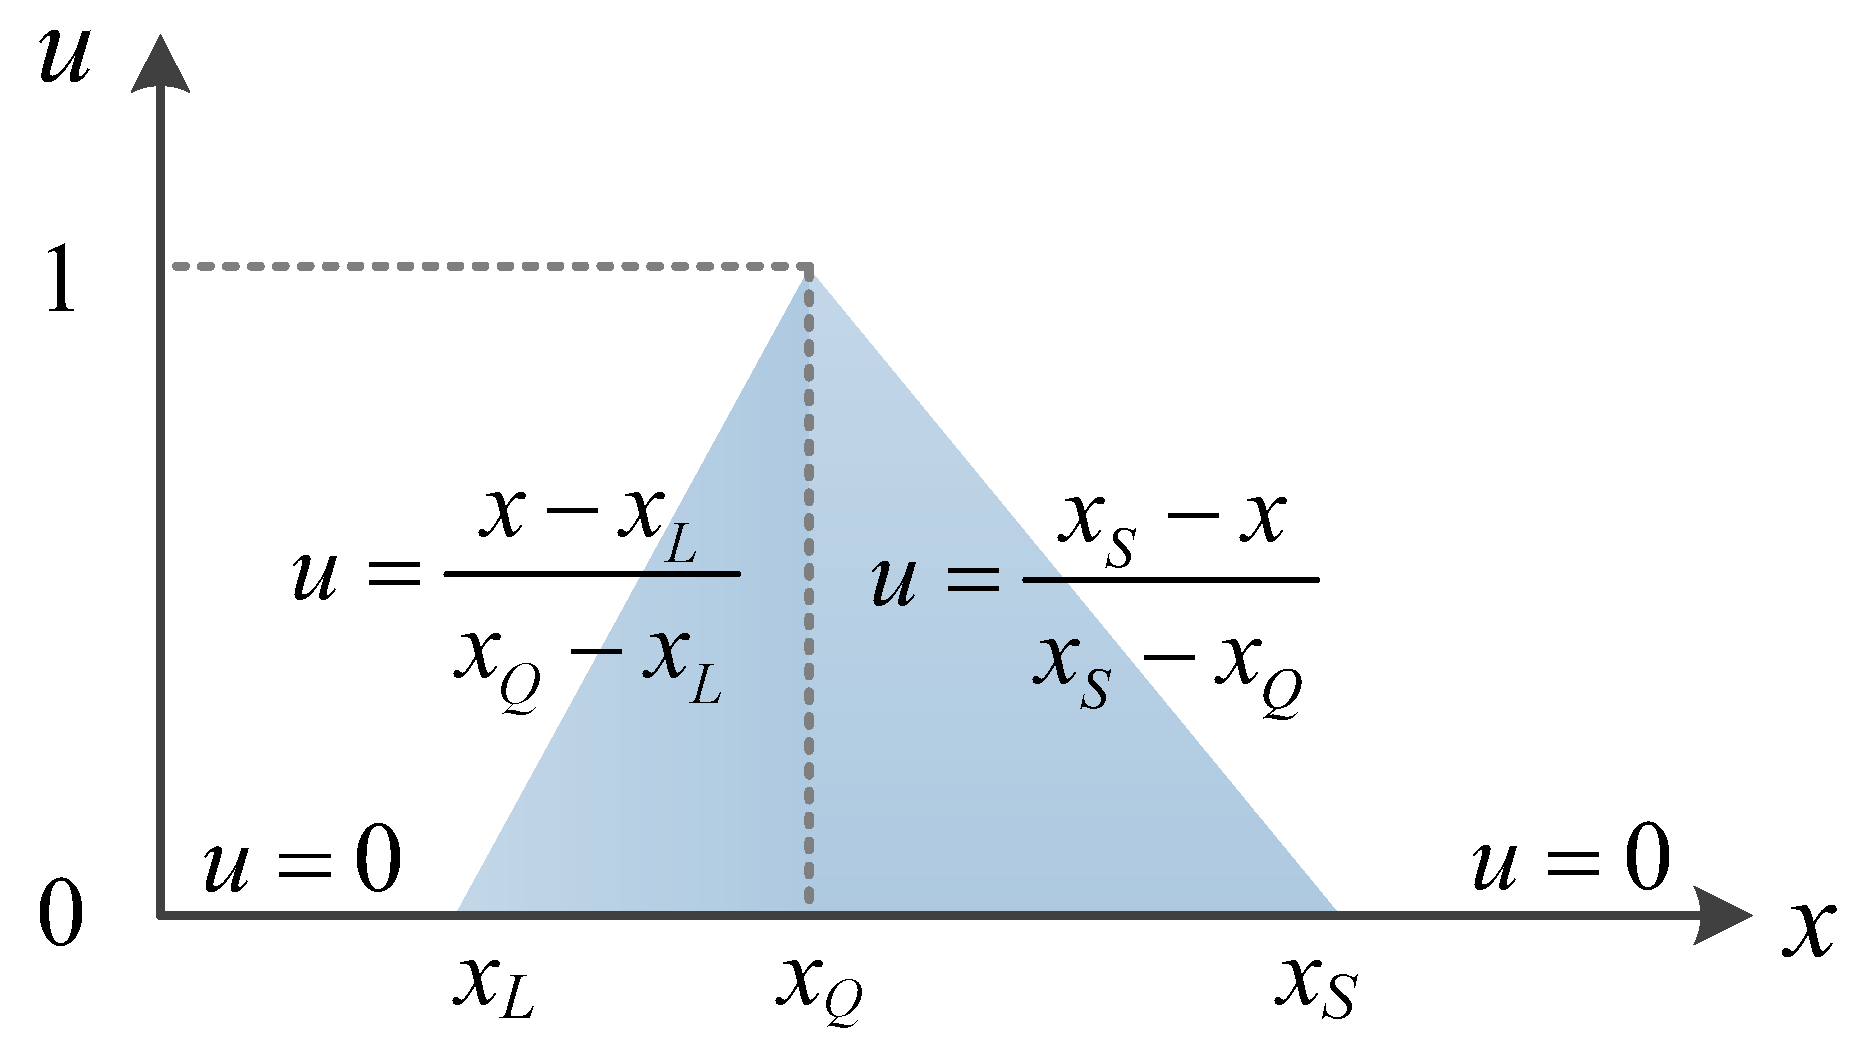
TFN is a fuzzy mathematical evaluation method proposed by Zadeh [12,15]. For a fuzzy variable x, its TFN is defined as T(x) = {xL, xQ, xS}, where xL, xQ, and xS are the lower limit, the most probable value, and the upper limit of x, respectively. In TFN, the calculation method of membership function u(x) is listed, as shown in Figure 2.
Based on the assumption that the water quality grade is x ∈ [a,b], the probability that T(x) belongs to this grade is calculated as [12,15]:
Furthermore, assuming that T(x) = {xL, xQ, xS} and T(y) = {yL, yQ, yS} are two different TFNs and λ is a constant larger than 0, they satisfy the following operational properties [16,17].
- (1)
- (2)
Compared with a mathematical statistics method that requires more probability distribution information, TFN can reflect the main uncertainty information of pollutants using fewer digital characteristics [16,17]. Therefore, when the survey data are not abundant, TFN is widely used for uncertainty analysis in water resource management [16,17].
2.4. Fuzzy HQ Model
In this section, a fuzzy HQ model is designed based on TFN theory. As an improvement to the conventional HQ, the fuzzy HQ model includes a hazardous TFN model and a transitional TFN model. The hazardous TFN model is used to evaluate the ecological risk including uncertainty factors, and the transition TFN model is used to evaluate the ecological risk variation induced by dam construction.
2.4.1. Hazardous TFN Model
As introduced in Section 2.2, for the nonuniformity of hydraulic conditions, the exposure concentrations of pollutants often have uncertainties. Supposing n monitoring sites in the evaluation area, the observation data of the ith pollutant at the jth site are denoted as xij. According to the construction habit of TFN, xiL, xiQ, and xiS can be selected as the minimum, mean, and maximum values of the monitoring data set. Therefore, the exposure concentrations of the ith pollutant can be represented as the TFN: T(xi) = {xiL, xiQ, xiS}, which is generated by:
Table 1 shows that the long-term and short-term criteria can be considered constants. According to the number multiplication rule in Equation (5), long-term HQ and short-term HQ can also be written as TFNs, T(Qi) = {QiL, QiQ, QiS} and T(qi) = {qiL, qiQ, qiS}, respectively, and their calculation method is:
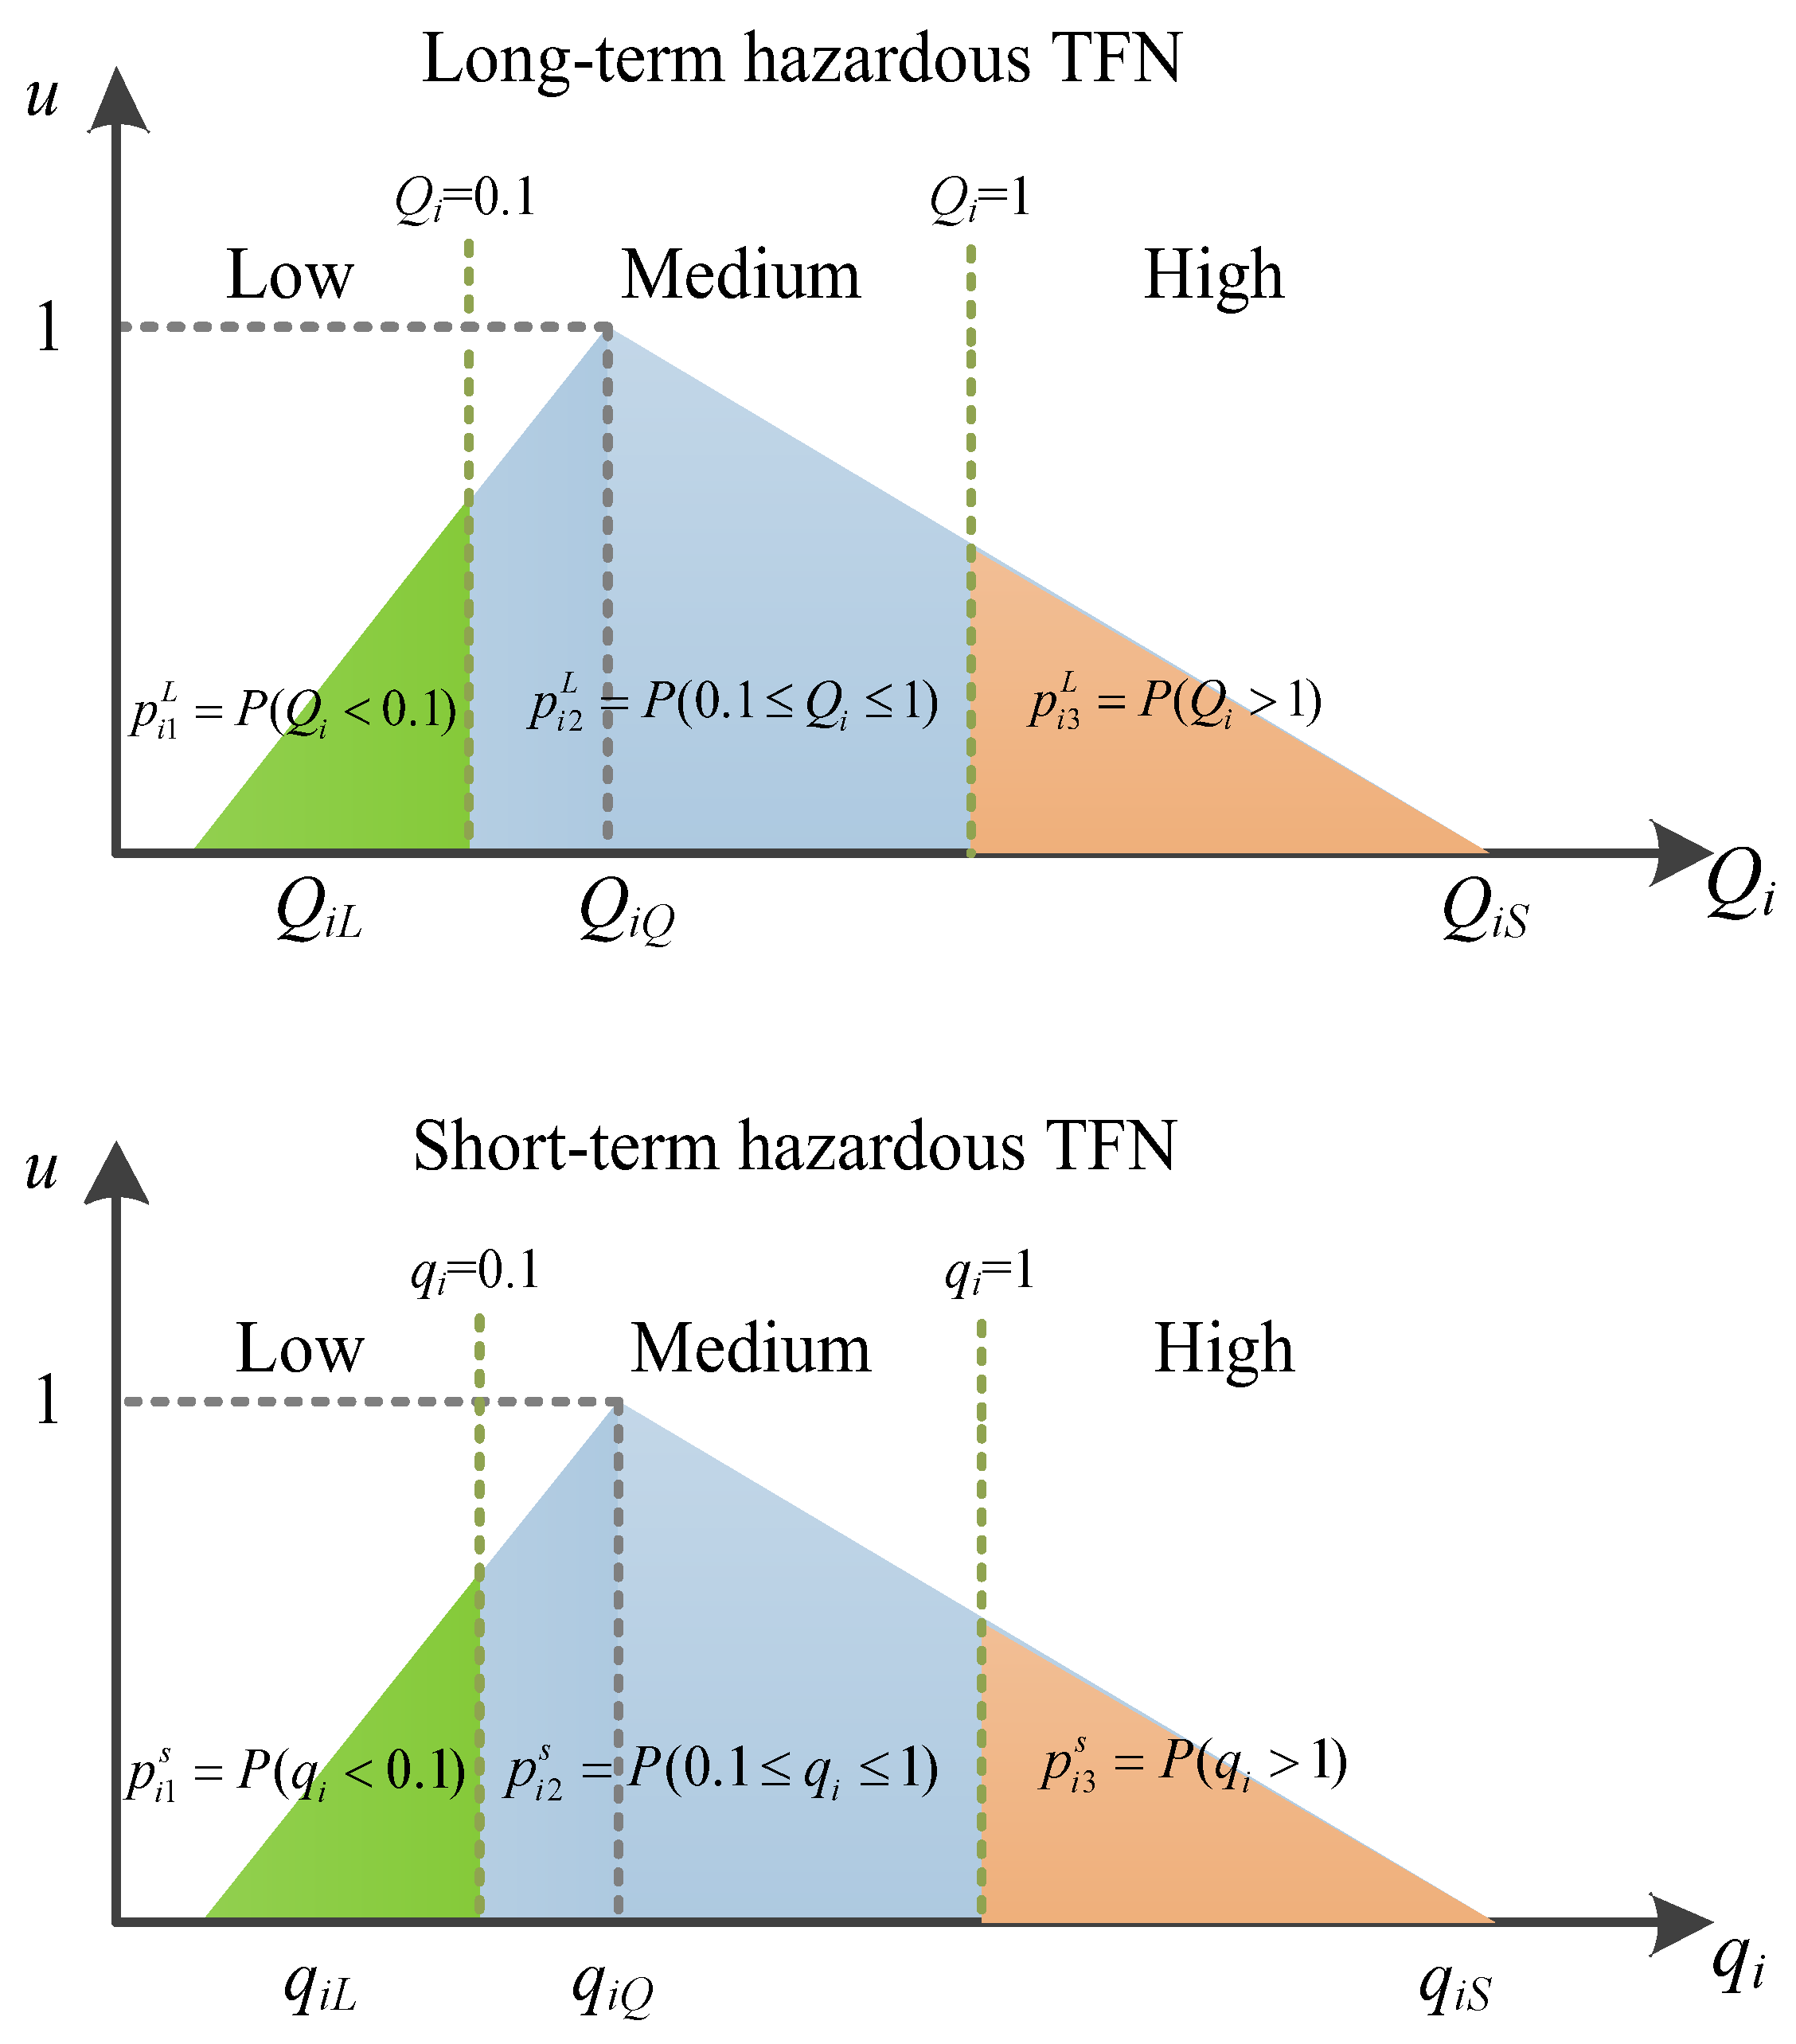
where T(Qi) and T(qi) represent the chronic and acute ecological hazards of the pollutants, respectively, which include uncertainty factors. Thus, this paper defines T(Qi) and T(qi) as the long-term hazardous TFN and the short-term hazardous TFN, respectively. The hazardous TFNs are illustrated in Figure 3.
Figure 3 shows that after considering the uncertainties, the range of HQ values may be distributed in multiple risk grades. To solve this problem, the long-term hazardous vector {pLi1, pLi2, pLi3} and short-term hazardous vector {psi1, psi2, psi3} are further designed in this paper. pLi1, pLi2, and pLi3 quantify the probabilities that the chronic ecological hazard of the ith pollutant is classified as low, medium, and high, respectively. psi1, psi2, and psi3 quantify the probabilities that the acute ecological hazard of the ith pollutant is low, medium, and high, respectively.
According to the probability calculation rule of TFN in Equation (3), pLi1, pLi2, and pLi3 can be generated as follows:
The calculation method of {psi1, psi2, psi3} is similar to {pLi1, pLi2, pLi3}. The variables QiL, QiQ, and QiS in Equations (8)–(10) are simply replaced with qiL, qiQ, and qiS, respectively.
2.4.2. Transition TFN Model
Although the hazardous TFN model can evaluate the ecological risk including uncertainty factors, it cannot quantify the ecological risk variation induced by dam construction. To address this problem, this study further proposes the transition TFN model.
The long-term hazardous TFNs before and after dam construction are denoted as T(Qi) = (QiL, QiQ, QiS) and T() = (), respectively. According to the subtraction rule introduced in Equation (4), the difference between T(Qi) = (QiL, QiQ, QiS) and T() = (), is also a TFN: T(Di) = (DiL, DiQ, DiS). Its calculation method is:
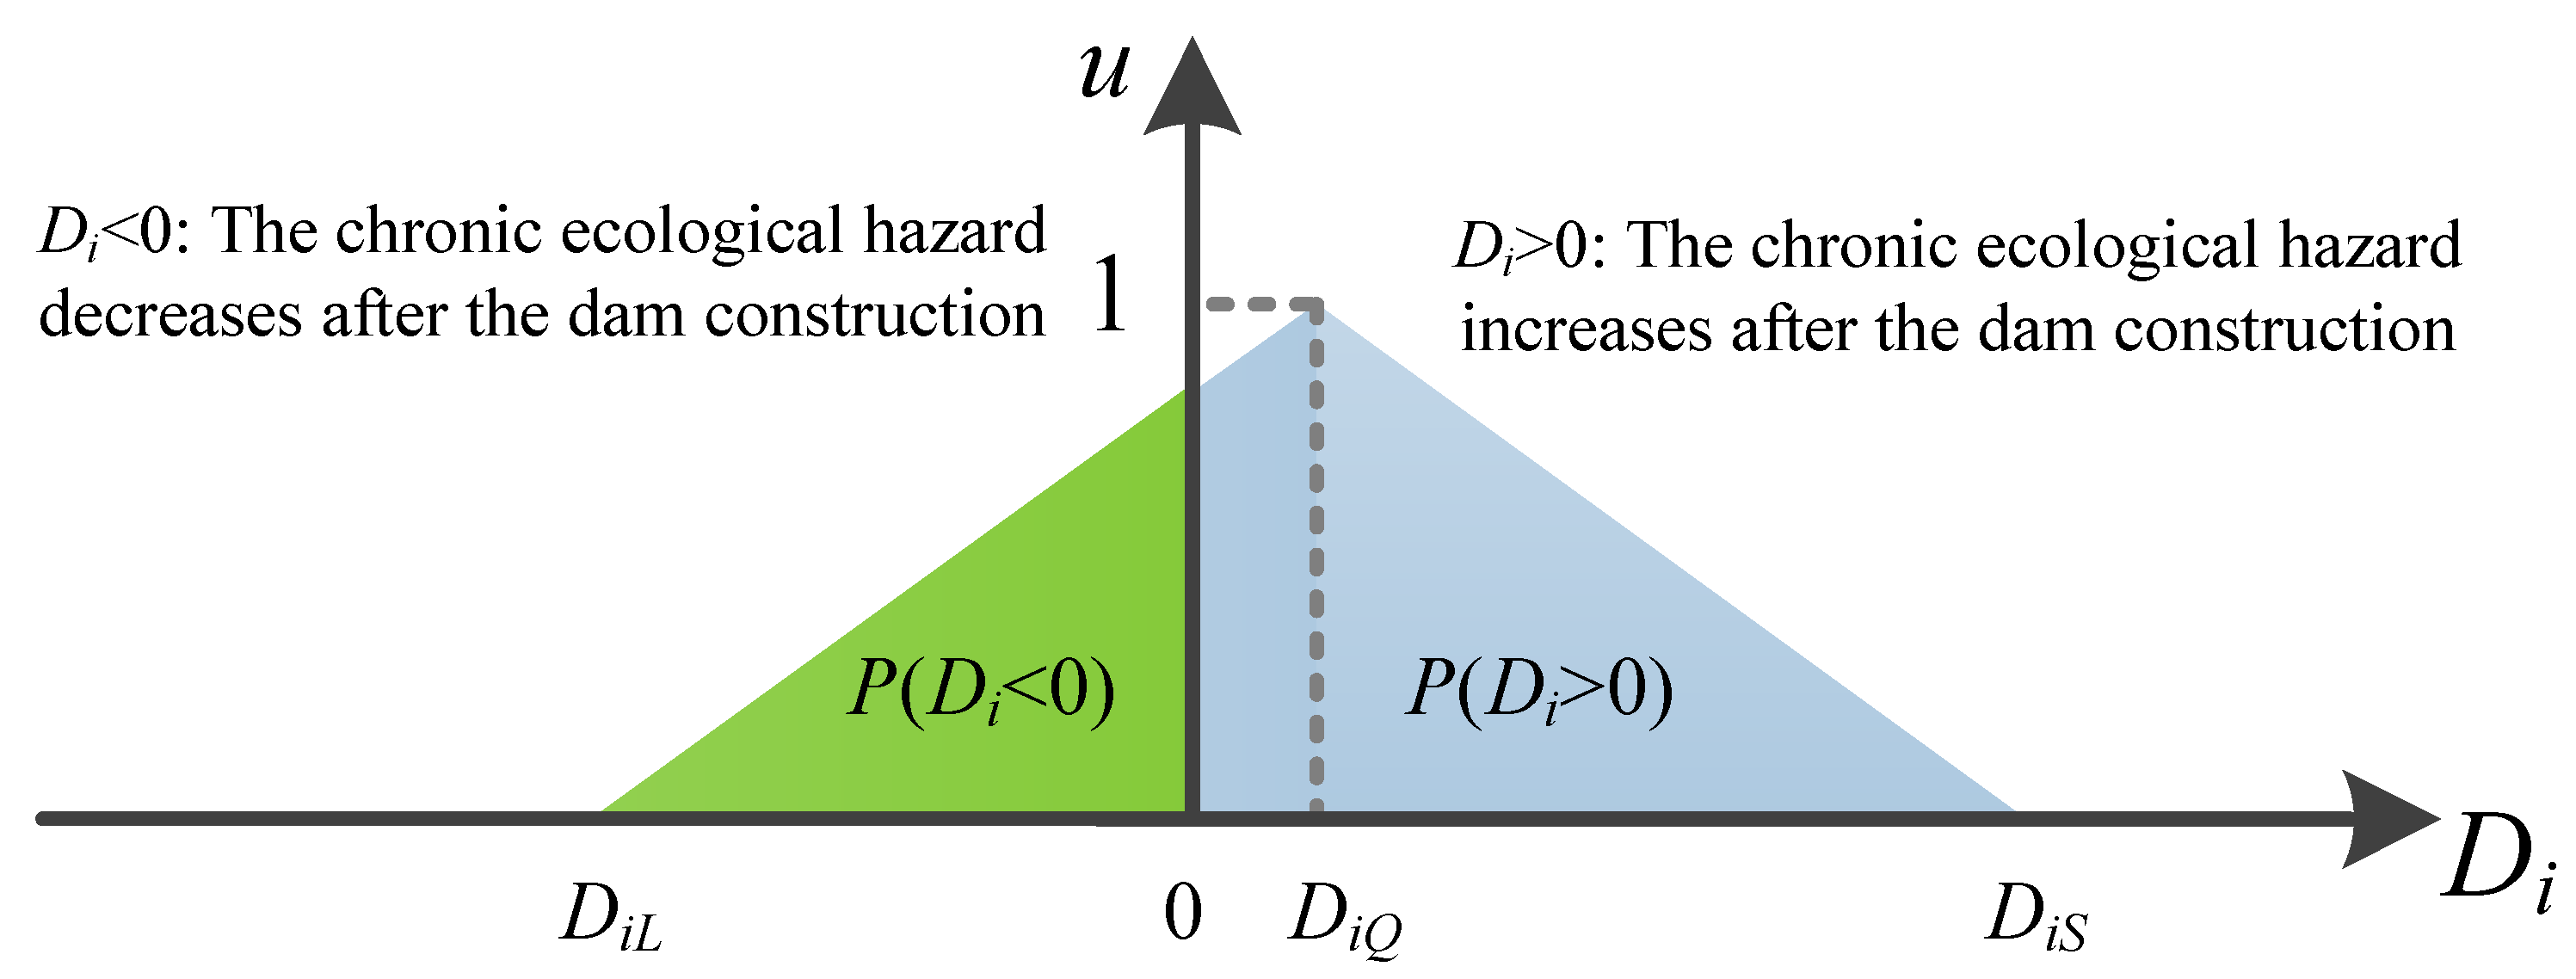
Figure 4 shows that T(Di) represents the variation of the chronic ecological hazard induced by dam construction. Furthermore, values of Di > 0 indicate that compared with the initial condition, the chronic ecological hazard of the ith pollutant increases after the dam construction. In contrast, values of Di < 0 indicate that compared with the initial condition, the chronic ecological hazard of the ith pollutant decreases after the dam construction. Therefore, the probabilities that P(Di > 0) and P(Di < 0) can be used to quantify the variation trend of the chronic ecological hazard induced by dam construction.
According to the probability calculation rule of TFN in Equation (3), P(Di > 0) and P(Di < 0) can be generated as follows:
According to the general convention of TFN, when P(Di > 0) is larger than 0.95, the increasing trend of the chronic ecological hazard after dam construction can be considered substantial. Conversly, when P(Di < 0) is larger than 0.95, the decreasing trend of the chronic ecological hazard after dam construction can be considered notable.
The short-term hazardous TFNs before and after dam construction are denoted as T(qi) = (qiL, qiQ, qiS) and T() = (), respectively. The difference between T(qi) = (qiL, qiQ, qiS) and T() = () is also a TFN: T(di) = (diL, diQ, diS). Its calculation method is:
Similarly, the probabilities that P(di > 0) and P(di < 0) represent the variation trend of the acute ecological hazard induced by dam construction, and their calculation methods are similar to P(Di > 0) and P(Di < 0). The variables DiL, DiQ, and DiS in Equations (12)–(13) are simply replaced with diL, diQ, and diS, respectively.
3. Results and Discussion
3.1. Concentrations of Pollutants
As shown in Tables S1 and S2 in the Supplementary Materials, whether before or after the dam construction, each pollutant in each sampling site had three parallel monitoring values to control error. When the parallel sample error was controlled within 5%, the mean values were selected as the evaluation data.
In fuzzy theory, at least three observation data points are required to generate the TFN for each pollutant. The lower limit, the most probable value, and the upper limit of this TFN is the minimum value, mean value, and maximum value of these three observation data points. Tables S1 and S2 in the Supplementary Materials illustrate that whether before or after the dam construction, each pollutant in the upstream and downstream locations had three data points. Therefore, a TFN can be designed for each pollutant in the upstream and downstream sites in each evaluation period.
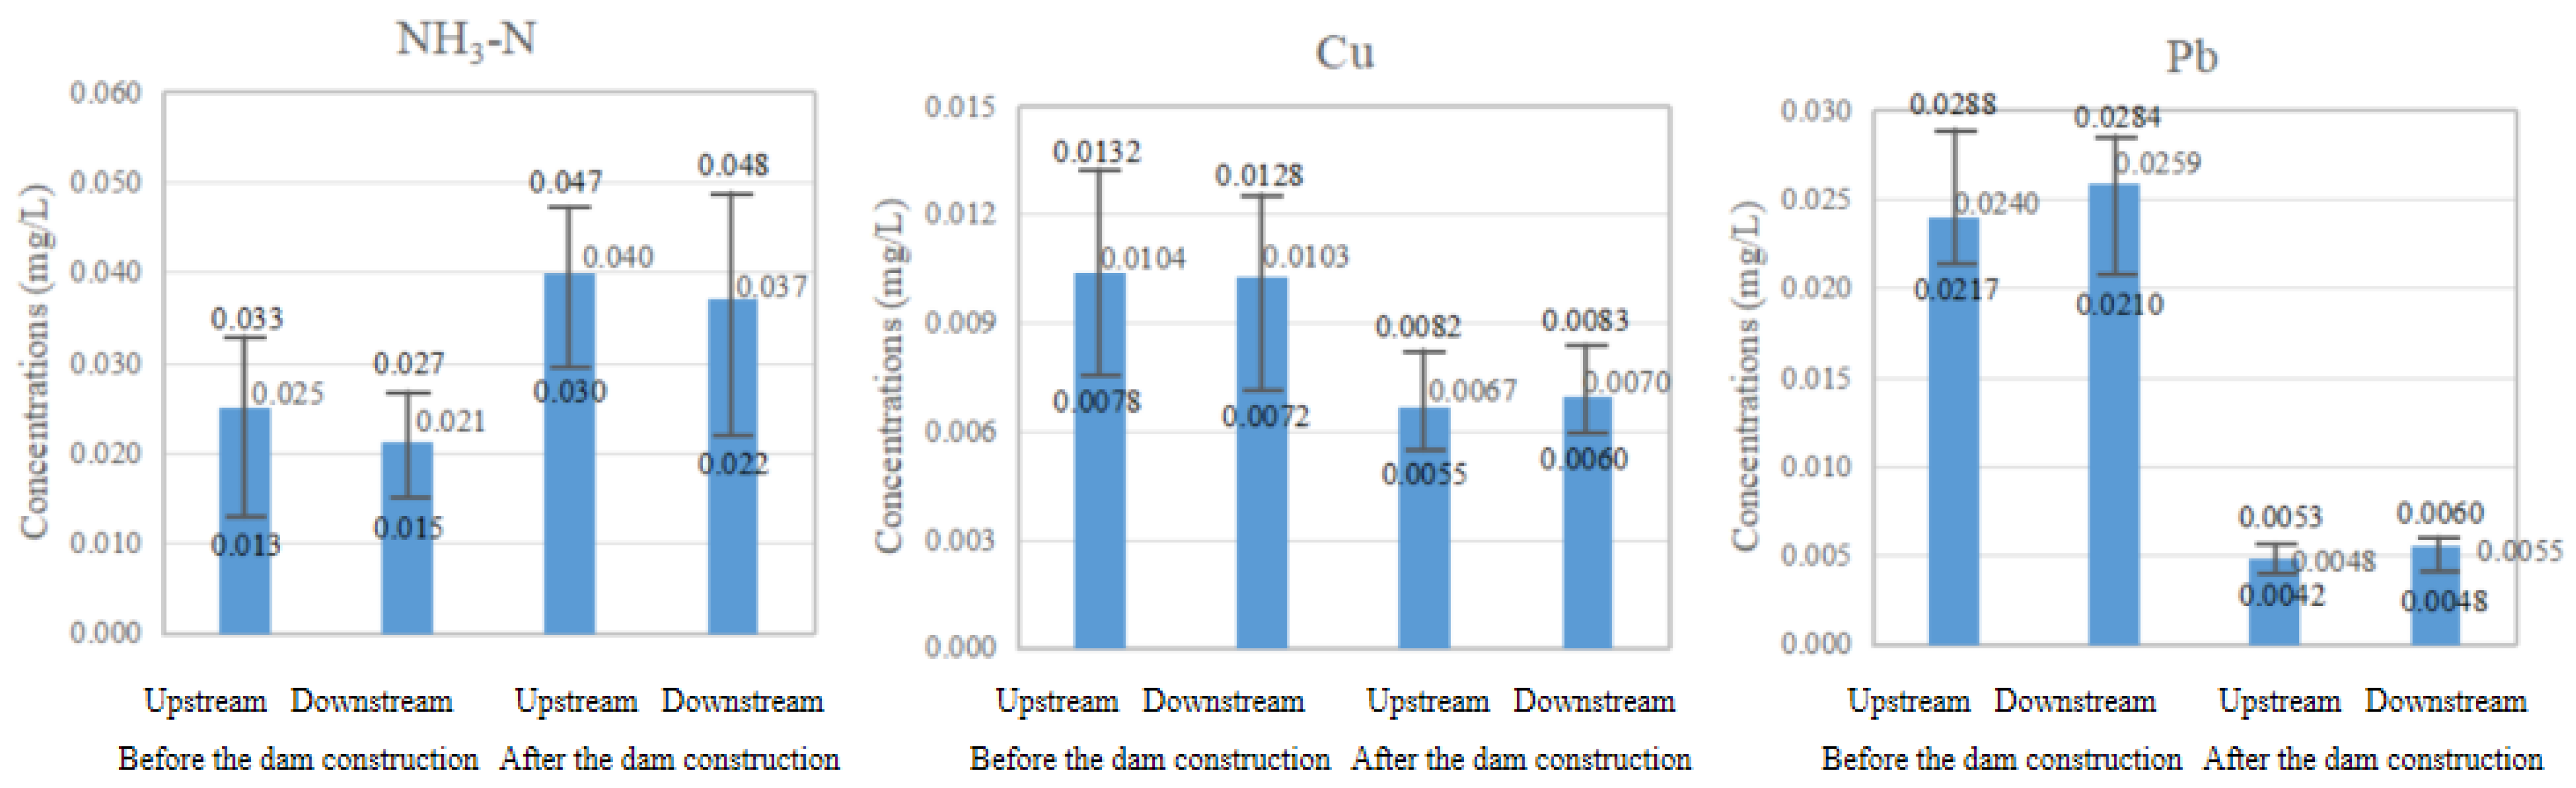
The minimum, mean, and maximum values of pollutants are shown in Figure 5.
Figure 5 shows that before the construction of Baihetan Dam, the average concentrations of NH3-N upstream and downstream of the dam were 0.025 mg/L and 0.021 mg/L, respectively. After dam construction, the average concentrations of NH3−N upstream and downstream of the dam were 0.040 mg/L and 0.037 mg/L, respectively, which was an increase of approximately 60%.
The variation in heavy metal concentration was opposite to that of NH3-N. Figure 5 shows that before the construction of Baihetan Dam, the average values of Cu and Pb upstream were 0.0104 mg/L and 0.0240 mg/L, respectively, whereas after its construction, these values decreased to 0.0067 mg/L and 0.0048 mg/L, respectively. Similarly, before the construction of Baihetan Dam, the average values of Cu and Pb downstream were 0.0103 and 0.0259 mg/L, respectively, whereas after construction, these values decreased to 0.0070 mg/L and 0.0055 mg/L, respectively. Compared with the initial state, after the construction of the dam, the concentrations of Cu and Pb were reduced by about 30% and 80%, respectively.
Overall, after the construction of Baihetan Dam, the average concentrations of NH3-N increased, whereas the concentrations of Cu and Pb decreased. Combined with relevant research, this occurred for the following two reasons:
- (i)
- The construction of Baihetan Dam changed the hydraulic conditions of the Jinsha River.
The Jinsha River is the main upper stream channel of the Yangtze River [18]. Flowing from the Qinghai–Tibet Plateau to Sichuan Basin, the longitudinal ratio drop of the Jinsha River reaches 1 m/km [19]. As a result, the water flow of the Jinsha River is turbulent. According to Yang et al. [20], the average velocity of the Jinsha River is approximately 0.64 m/s. Owing to the high flow rate, before the construction of the dam, the water body of the Jinsha River had a strong self-purification ability for NH3-N. However, after the construction of Baihetan Dam, the water velocity decreased due to its impounding effect. Therefore, the self-purification ability of the water body was weakened, and accordingly, the concentration of NH3-N increased.
Unlike NH3-N, heavy metals such as Cu and Pb are stable and extremely difficult to degrade [21]. In addition, according to Yan et al. [22], heavy metals are easily adsorbed on sediment particles. Before the construction of the dam, the water flow was more able to carry sand due to the rapid flow rate. According to Zhang [23], the concentration of suspended solids in the Jinsha River was approximately 8.06 g/L in 1999, which was the highest in the Yangtze River Basin. Owing to this high sediment content and the strong adsorption of heavy metals, the concentrations of Cu and Pb were relatively high prior to the construction of Baihetan Dam. However, after the dam construction, the water velocity decreased due to its impounding effect [24]. Heavy metals were more readily deposited on the bottom of the river with the sediment; therefore, the heavy metal content in the water body also decreased.
- (ii)
- The pollution sources in the basin changed.
According to Lu et al. [6], the main source of NH3-N in the Jinsha River is domestic sewage, whereas agricultural pollution is not prominent. Qiaojia County, where Baihetan Dam is located, was once one of the poorest areas in China [25]. It is located in a remote mountainous area with poor transportation. The population was small, and various industries were underdeveloped, so the living conditions of local residents were poor and the amount of domestic sewage produced was small. However, according to Fan et al. [25], the construction of Baihetan Dam not only improved the local transportation conditions but also brought USD 260 million in investment for Qiaojia County, which considerably contributed to the development of the local economy and the improvement of living standards. Therefore, domestic sewage generated in Qiaojia County and the emissions of NH3-N increased.
In contrast to NH3-N, the main source of Cu and Pb is the mining industry [26]. The Jinsha River flows through the region with the most abundant mineral resources in China [26]. However, because heavy metal pollution seriously threatens the health and stability of the ecosystem, to achieve sustainable development, since 2015, the Chinese government has started the strictest pollution source control policy [27]. According to an environment survey of Yunnan Province, the heavy metal discharge load in Yunnan Province dropped by about 70% from 2016 to 2020 [28]. Therefore, the heavy metal pollution in the Jinsha River has also substantially improved.
3.2. Ecological Risk Assessment
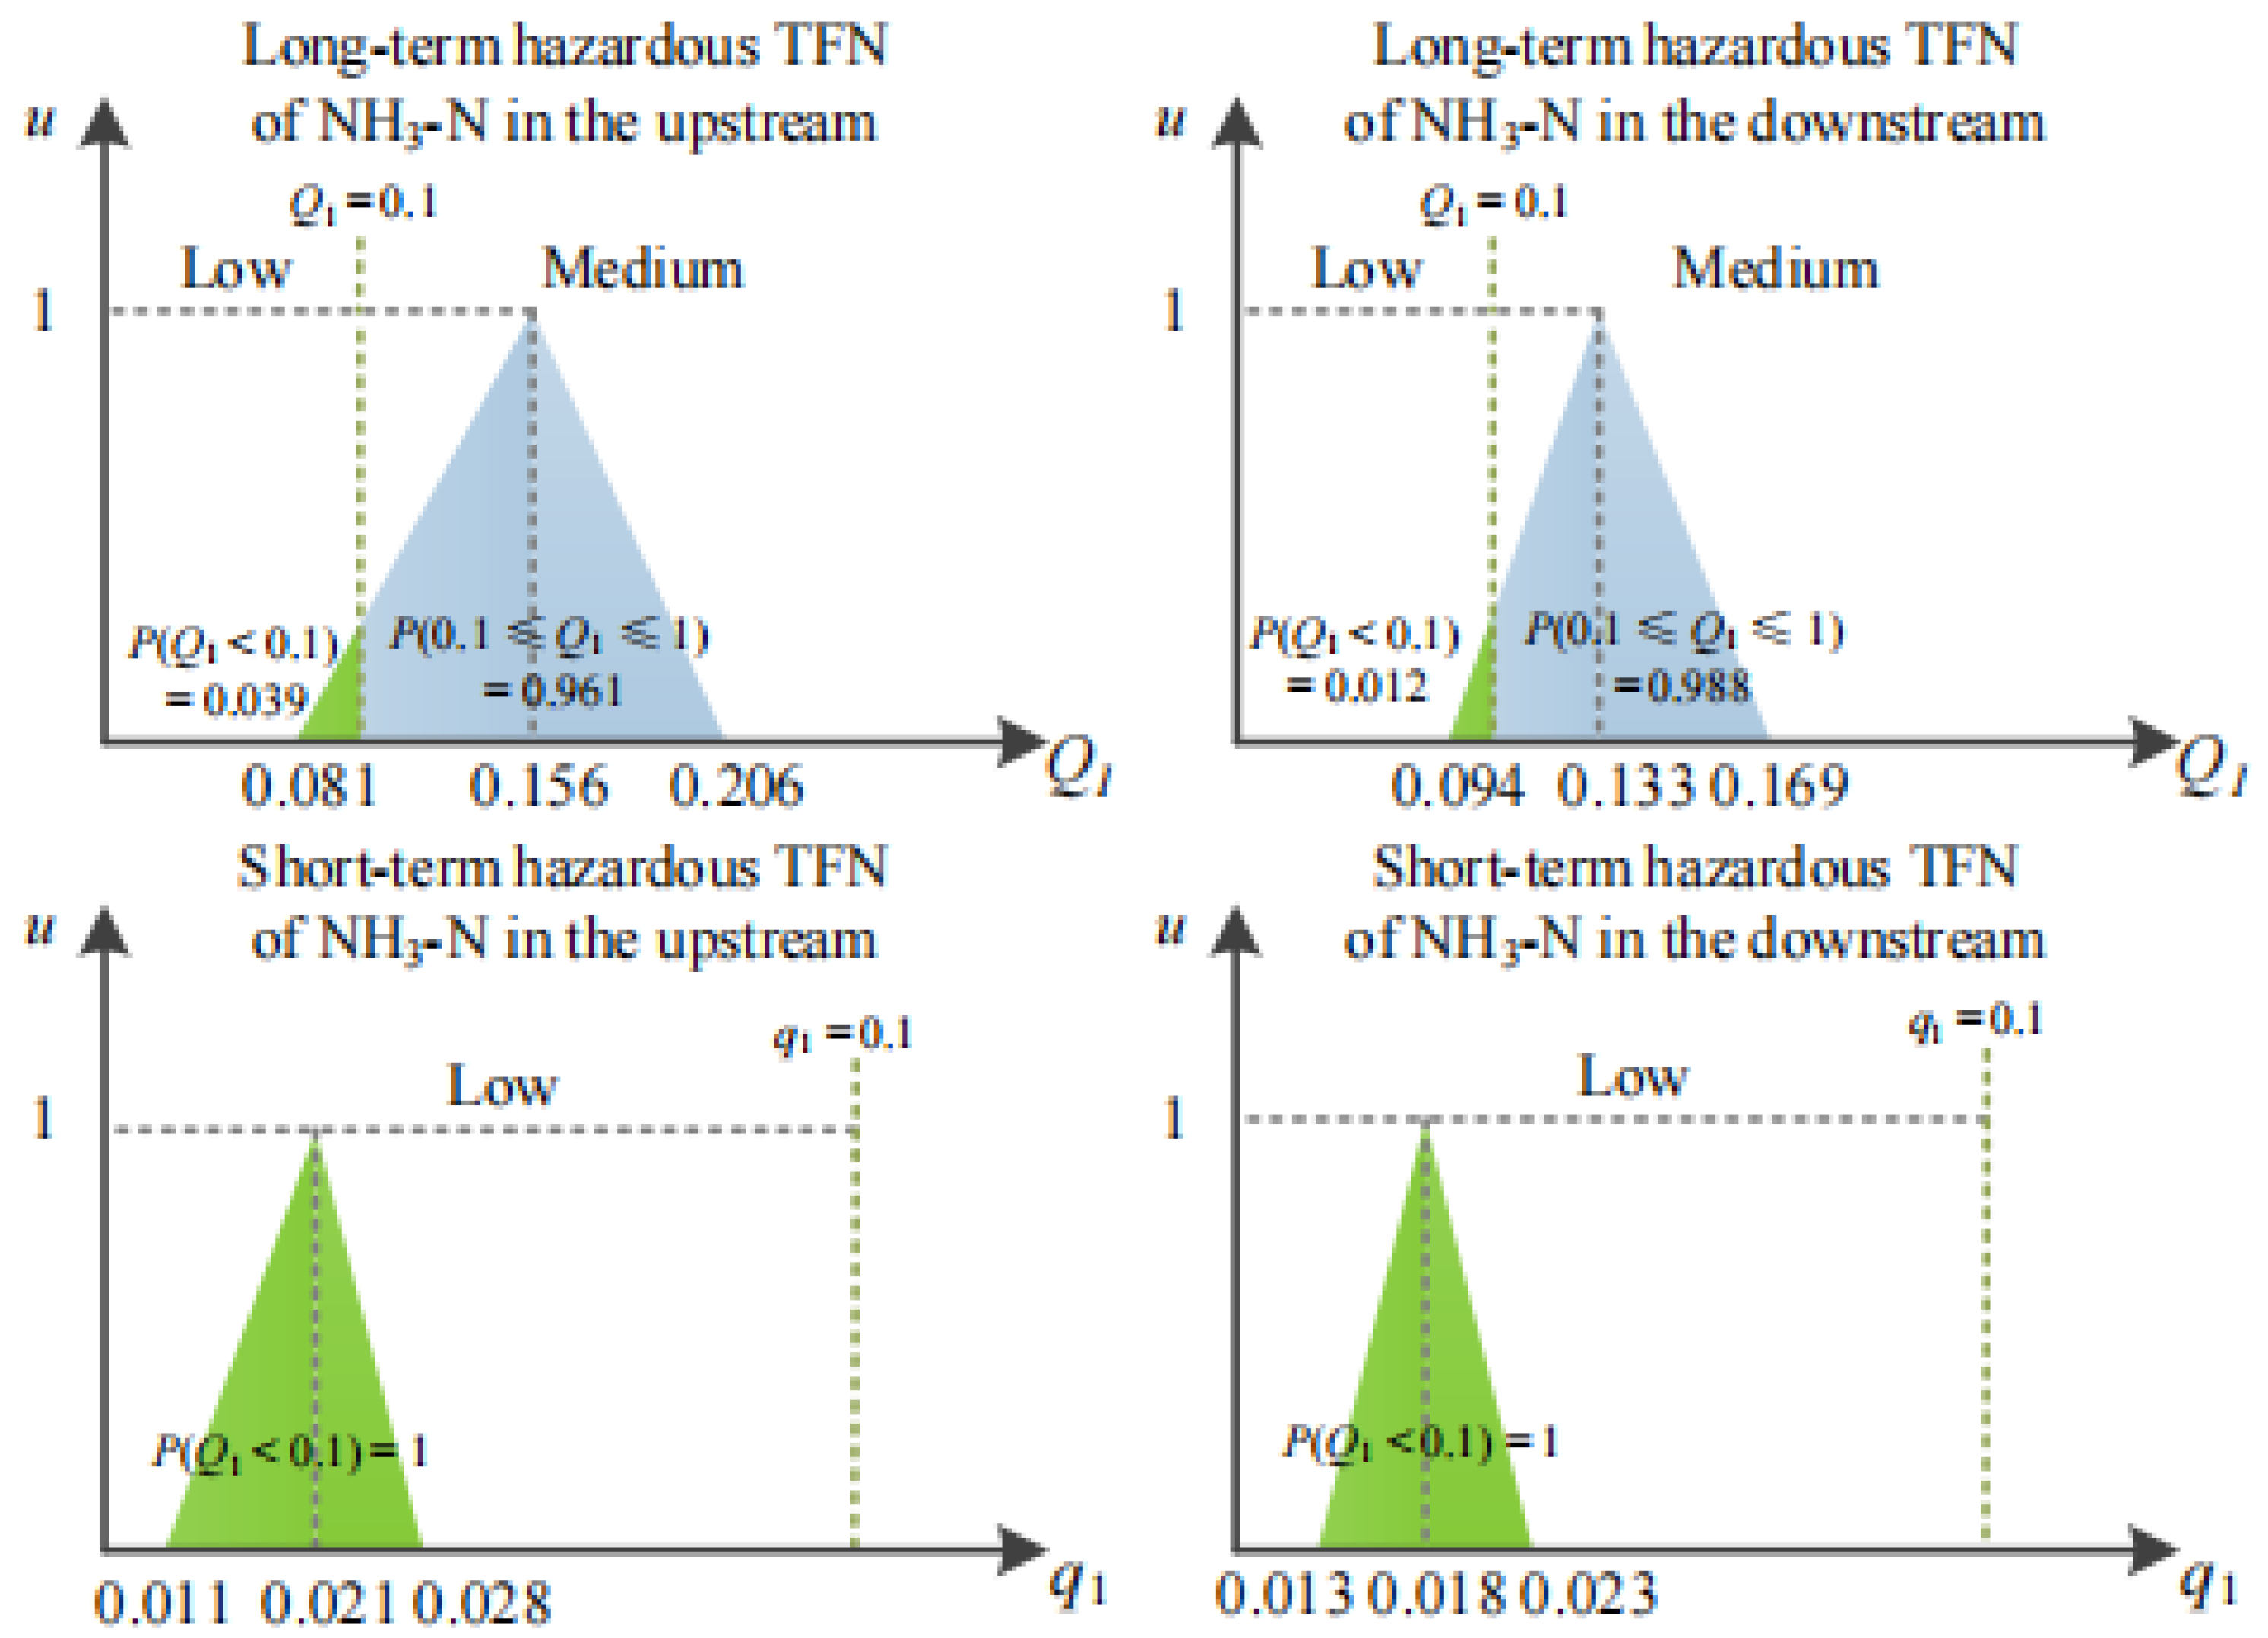
The hazardous TFNs of NH3-N before and after the construction of Baihetan Dam, as estimated by the hazardous TFN model, are illustrated in Figure 6 and Figure 7, respectively.
Figure 6 shows that before the construction of the dam, the long-term hazardous TFNs of NH3-N upstream and downstream were {0.081, 0.156, 0.206} and {0.094, 0.133, 0.169}, respectively, and the short-term hazardous TFNs were {0.011, 0.021, 0.028} and {0.013, 0.018, 0.023}, respectively. However, Figure 7 shows that after the construction of Baihetan Dam, the long-term hazardous TFNs of NH3-N in the upstream and downstream locations were {0.188, 0.250, 0.294} and {0.138, 0.231, 0.300}, respectively, and the short-term hazardous TFNs of NH3-N were {0.025, 0.034, 0.040} and {0.019, 0.031, 0.041}, respectively.
According to the evaluation results of hazardous vectors, there was more certainty in the grade changes for chronic ecological risk of NH3-N after the construction of Baihetan Dam. Figure 6 shows that the long-term hazardous vectors of NH3-N in the upstream and downstream locations were {0.039, 0.961, 0.000} and {0.012, 0.988, 0.000}, respectively, which reflected that their chronic ecological risks were mainly medium grade and few were in the low grade. Nevertheless, Figure 7 shows that after dam construction, both of the chronic hazards of NH3-N upstream and downstream locations were all classified as medium grade.
The grade variation in the acute ecological risk of NH3-N slightly differed from its chronic risk. According to the evaluation results of hazardous vectors, all the acute risks of NH3-N were completely low grade before and after the construction of Baihetan Dam.
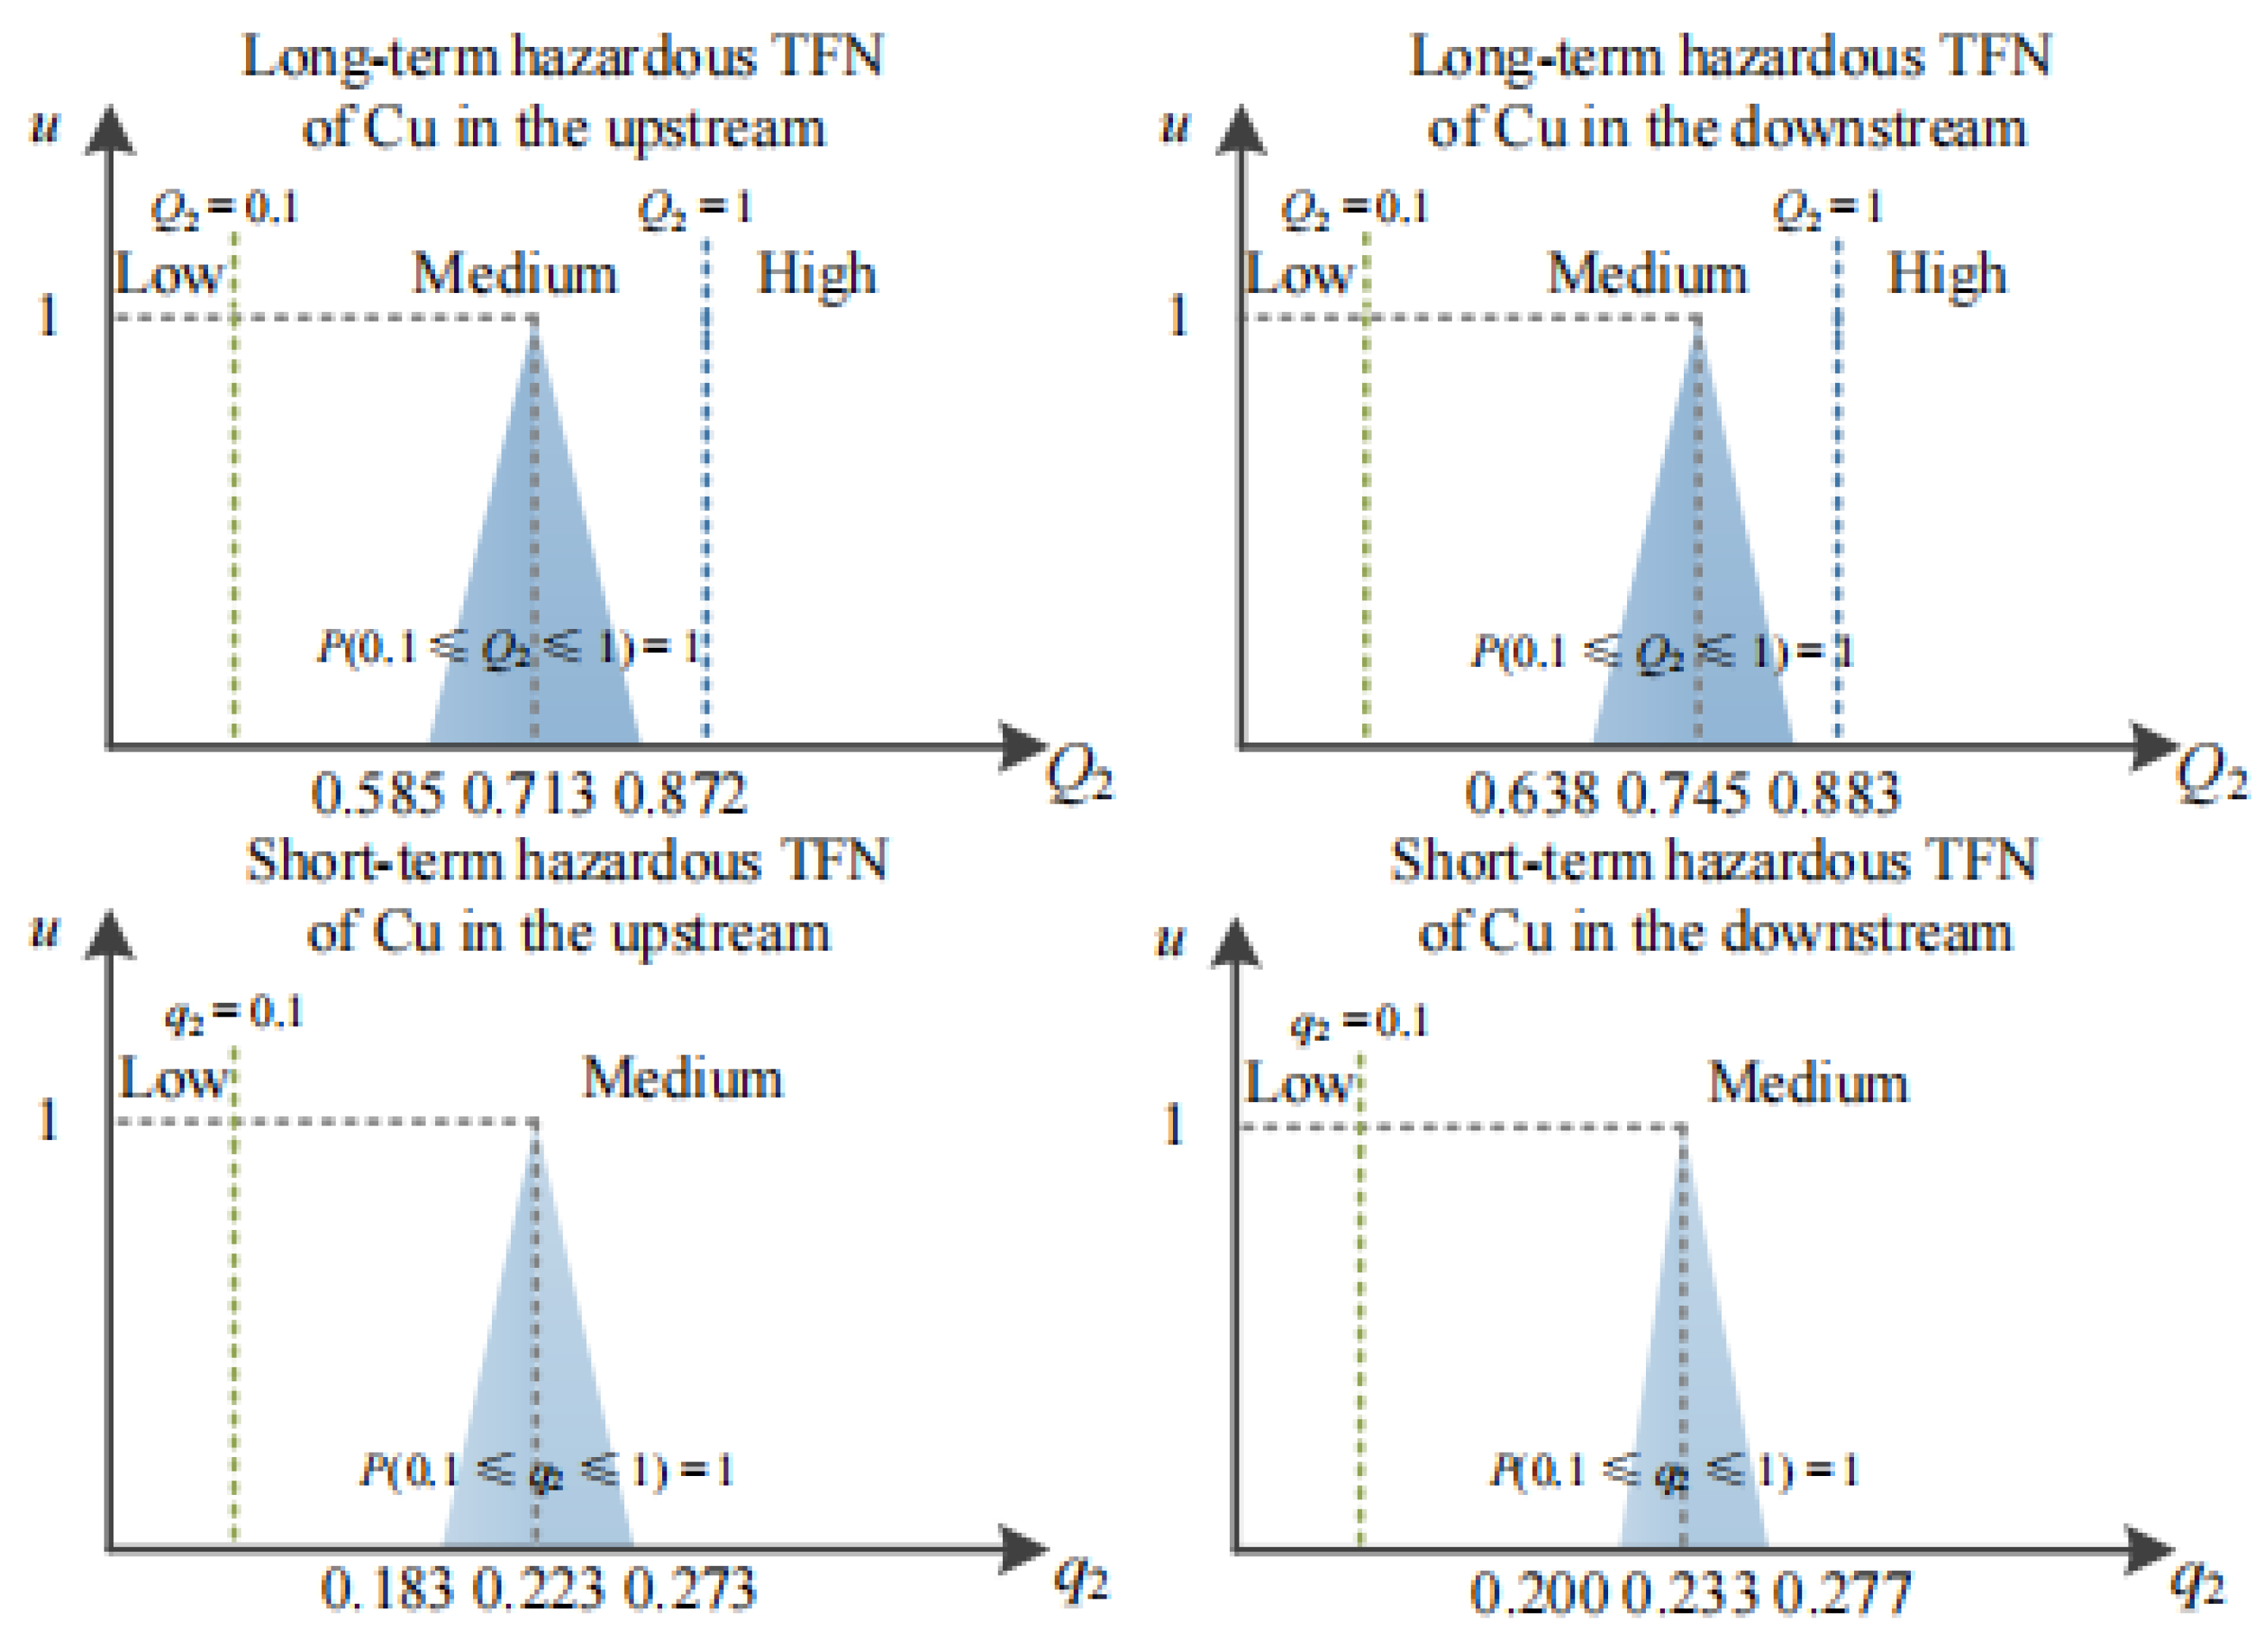
According to the hazardous TFN model, the hazardous TFNs of Cu before and after the construction of Baihetan Dam are illustrated in Figure 8 and Figure 9, respectively.
Figure 8 shows that before the construction of Baihetan Dam, the long-term hazardous TFNs of Cu in the upstream and downstream locations were {0.830, 1.106, 1.404} and {0.766, 1.096, 1.362}, respectively, and their short-term hazardous TFNs of Cu were {0.260, 0.347, 0.440} and {0.240, 0.343, 0.427}, respectively. However, Figure 9 shows that after the construction of Baihetan Dam, the long-term hazardous TFNs of Cu in the upstream and downstream locations were {0.585, 0.713, 0.872} and {0.638, 0.745, 0.883}, respectively, and their short-term hazardous TFNs of Cu were {0.183, 0.223, 0.273} and {0.200, 0.233, 0.277}, respectively.
According to the evaluation results of hazardous vectors, the chronic ecological risk of Cu had a grade variation after the construction of Baihetan Dam. Figure 8 shows that the long-term hazardous vectors of Cu upstream and downstream were {0.000, 0.182, 0.818} and {0.000, 0.278, 0.772}, respectively. This result showed that their chronic ecological risks were mainly high grade and were slightly represented in the medium grade. Nevertheless, Figure 9 shows that after the dam construction, both of the chronic hazards of Cu upstream and downstream locations were all classified as medium grade.
The grade variation of the acute ecological risk of Cu slightly differed from its chronic risk. According to the evaluation results of hazardous vectors, all the acute risks of Cu were medium grade before and after the construction of Baihetan Dam.
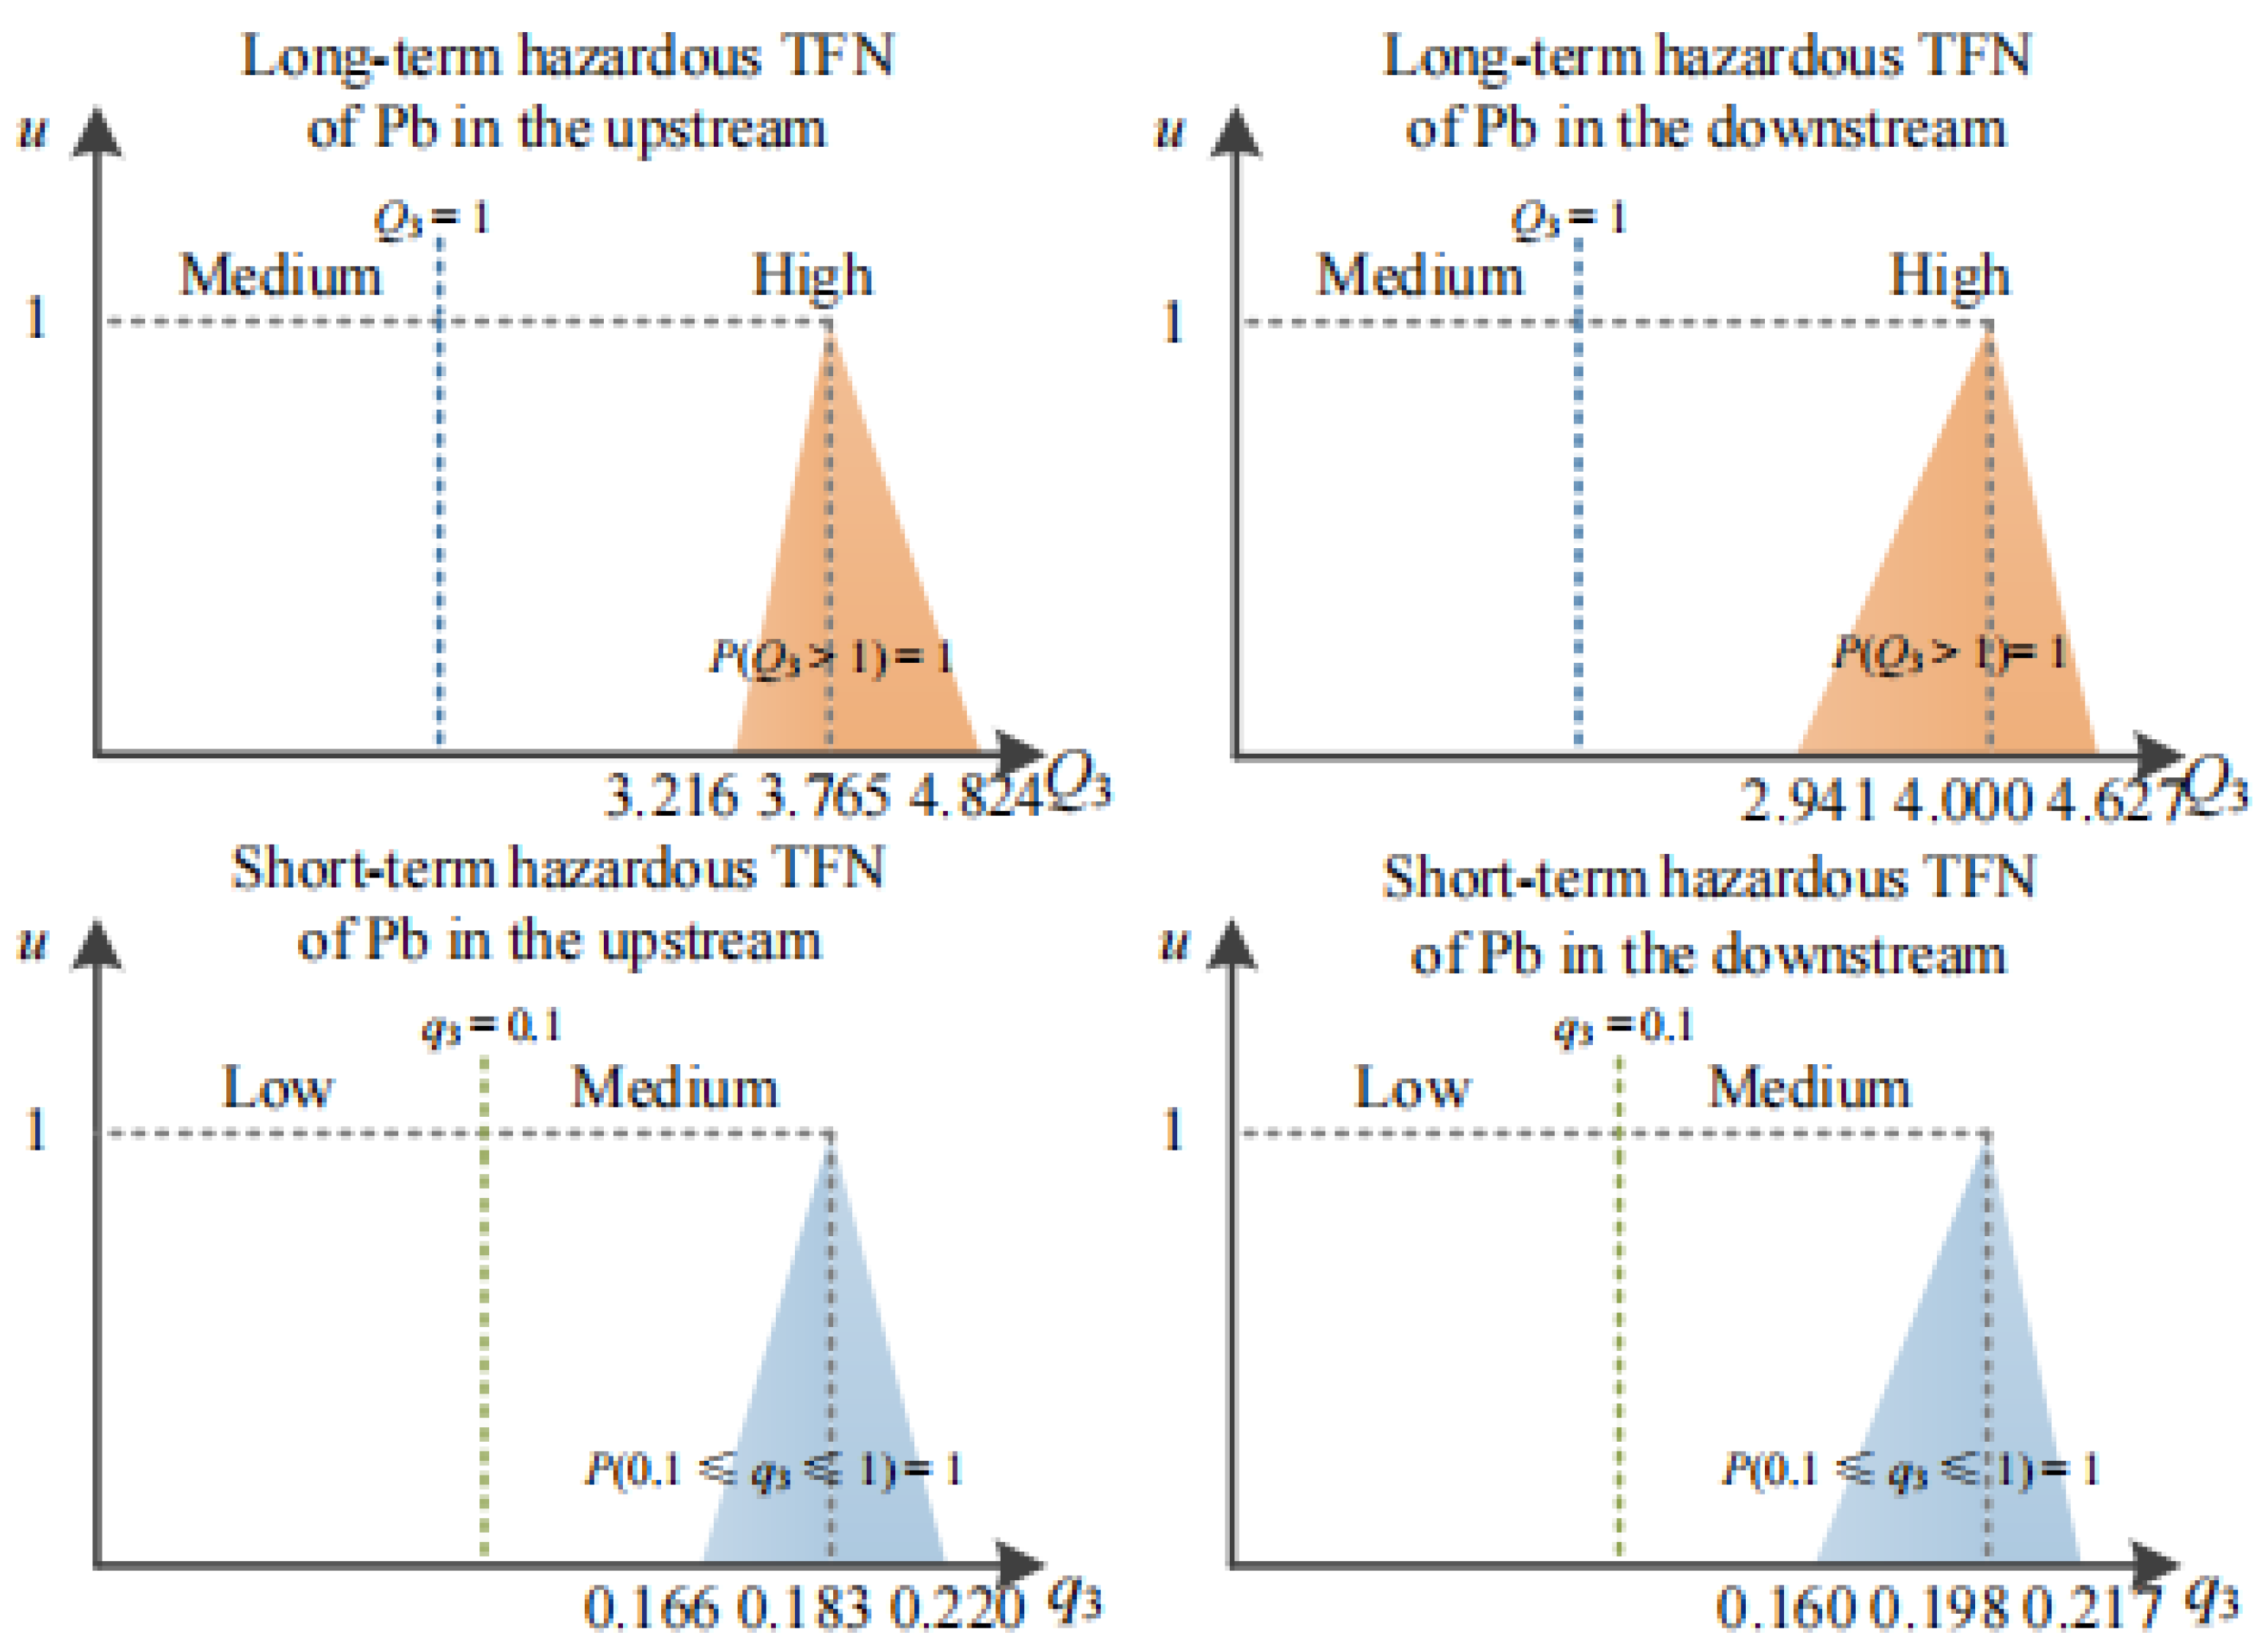
The hazardous TFNs of Pb before and after the dam, as estimated by the hazardous TFN model, are illustrated in Figure 10 and Figure 11, respectively.
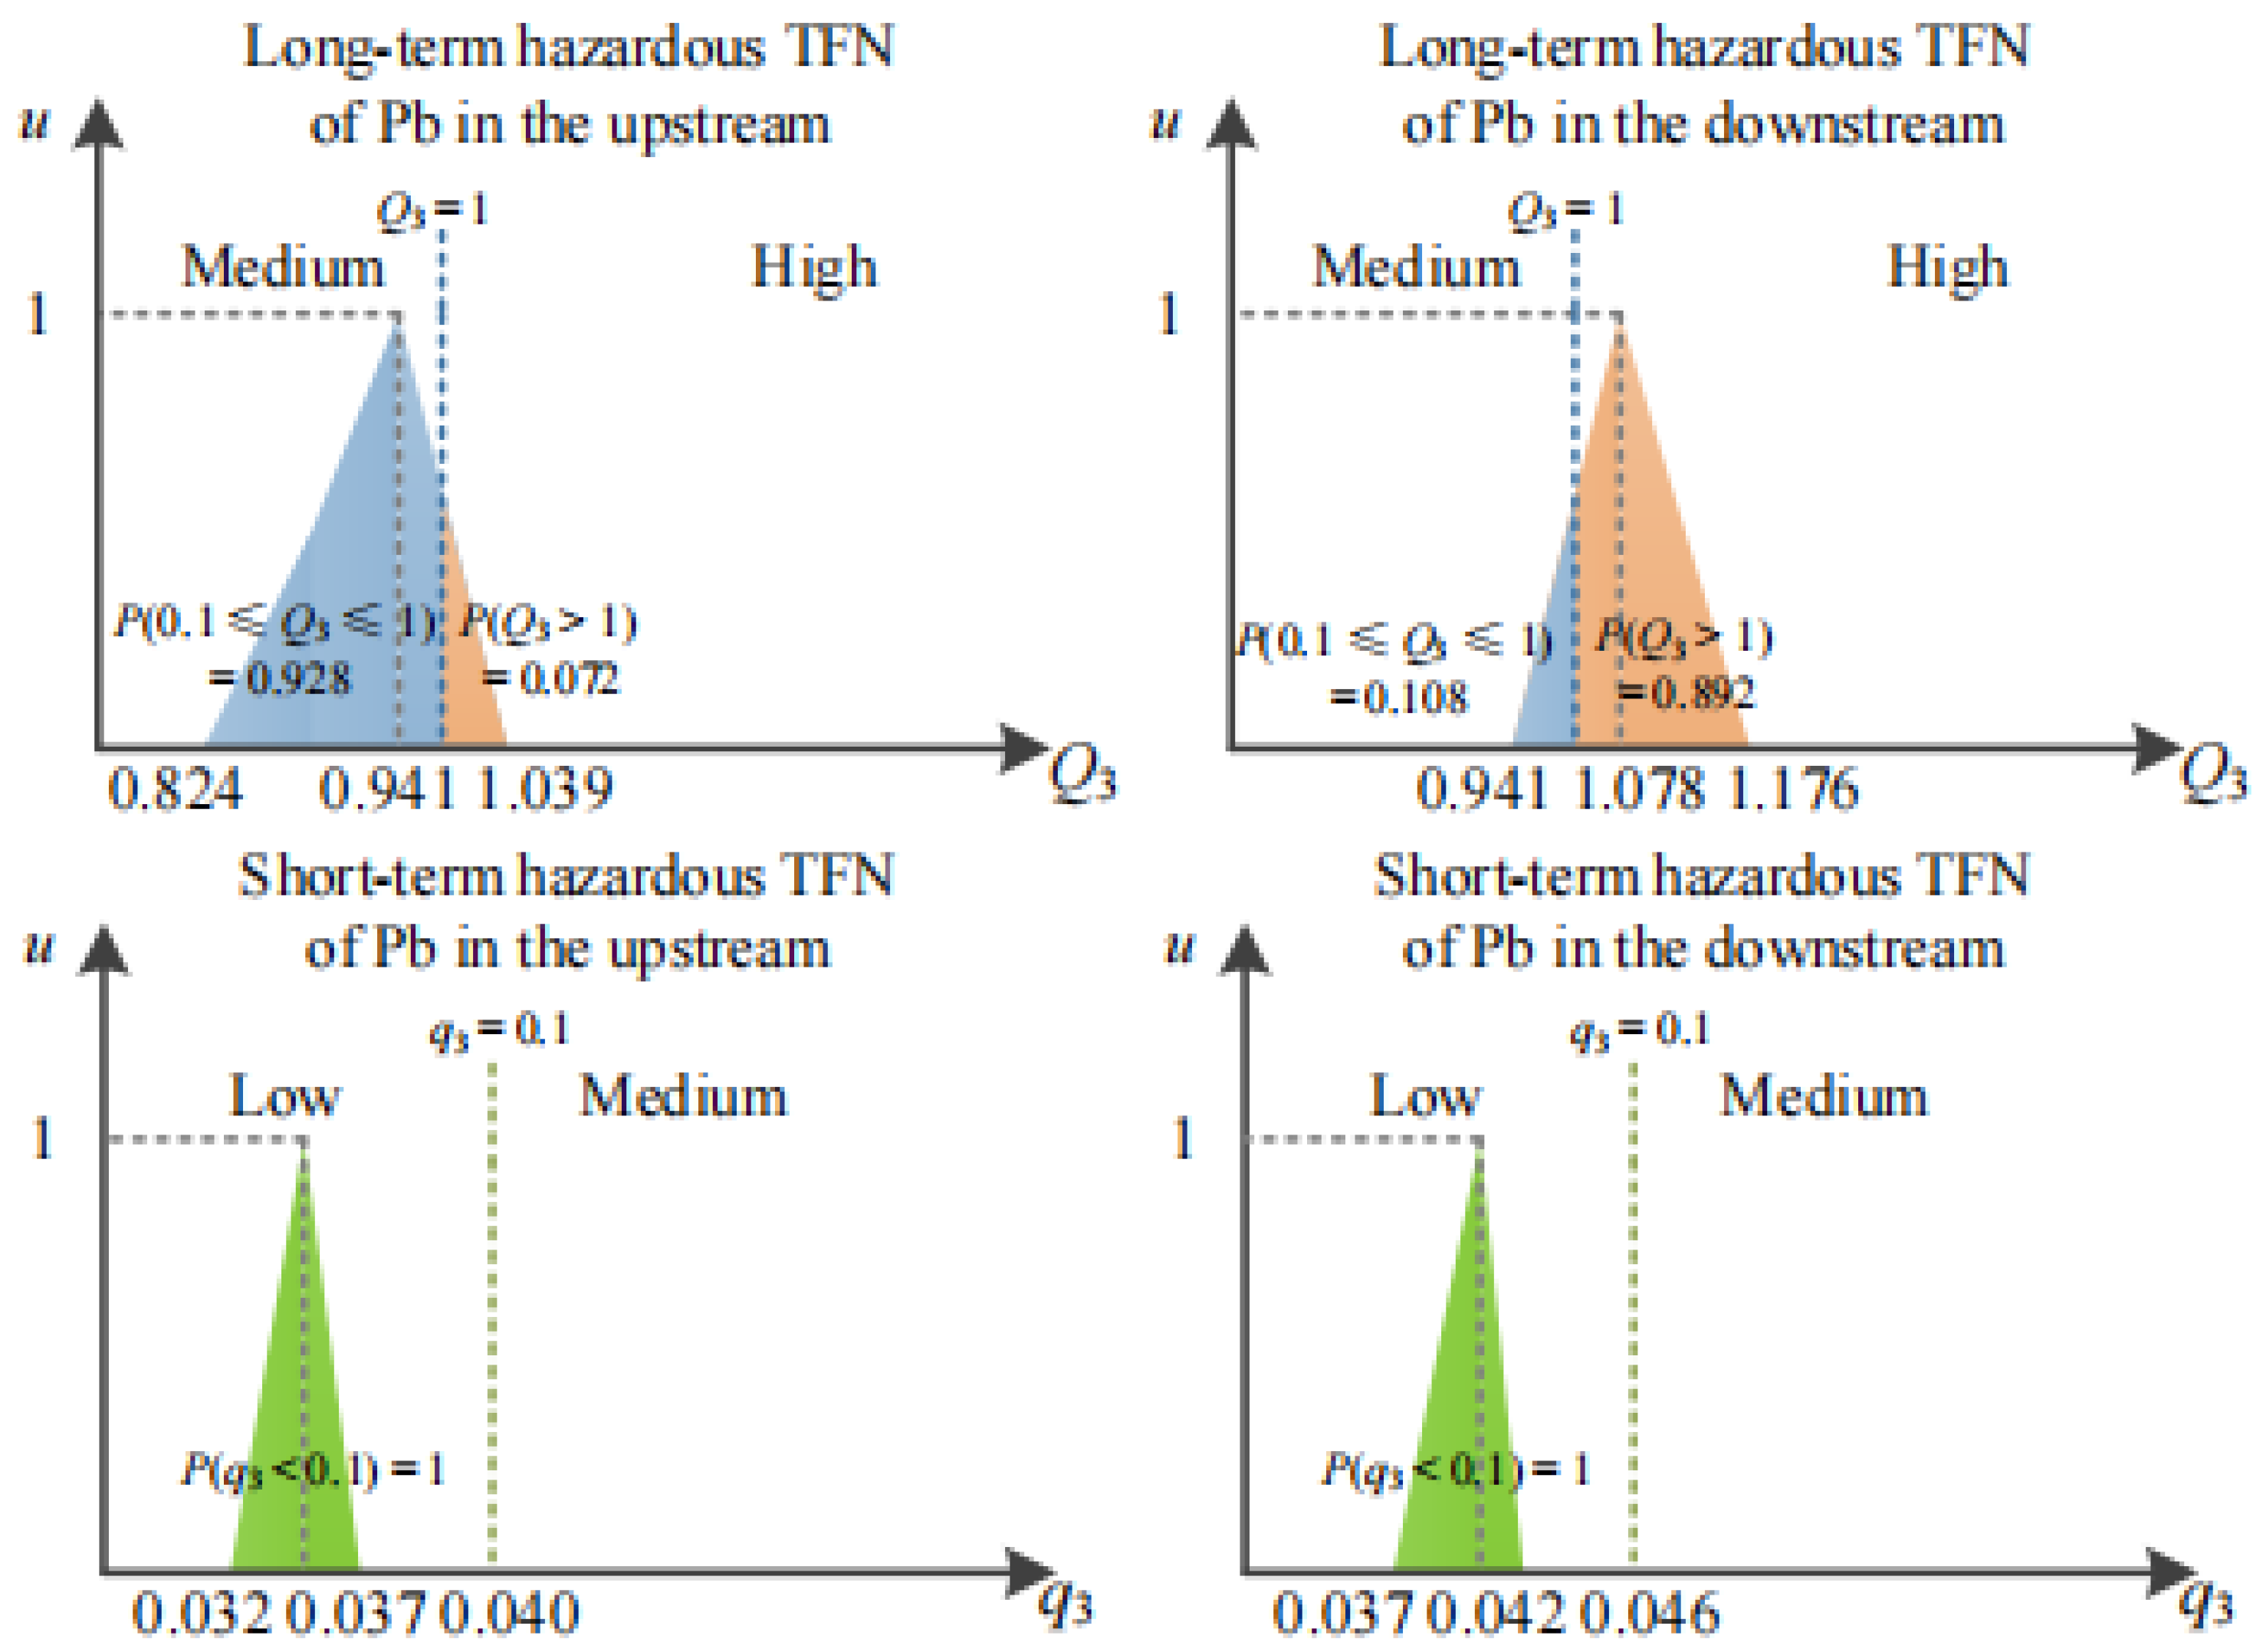
Figure 10 shows that before the construction of Baihetan Dam, the long-term hazardous TFNs of Pb in the upstream and downstream locations were {3.216, 3.765, 4.824} and {2.941, 4.000, 4.627}, respectively, and their short-term hazardous TFNs of Pb were {0.166, 0.183, 0.220} and {0.160, 0.198, 0.217}, respectively. However, Figure 11 shows that after the construction of Baihetan Dam, the long-term hazardous TFNs of Pb upstream and downstream locations were {0.824, 0.941, 1.039} and {0.941, 1.078, 1.176}, respectively, and their short-term hazardous TFNs were {0.032, 0.037, 0.040} and {0.037, 0.042, 0.046}, respectively.
According to the evaluation results of hazardous vectors, both the chronic and acute ecological risks of Pb had grade variations after the construction of Baihetan Dam. Figure 10 shows that the long-term hazardous vectors of Pb at upstream and downstream locations were {0.000, 0.000, 1.000}, which were categorized completely as high grade. Both the short-term hazardous vectors of Pb at upstream and downstream locations were {0.000, 1.000, 0.000}, which were completely medium grade.
However, Figure 11 shows that after dam construction, the long-term hazardous vectors of Pb upstream were {0.000, 0.928, 0.072}, which reflected that the chronic ecological risk was mainly medium grade with some belonging to high grade. The long-term hazardous vectors of Pb downstream were {0.000, 0.108, 0.892}, which showed the chronic ecological risk was mainly high grade and some categorized as medium grade. Furthermore, both the short-term hazardous vectors of Pb upstream and downstream were {1.000, 0.000, 0.000}, which could be completely categorized as low grade.
Overall, the critical factors for the chronic and acute risks were different. The key chronic threat was Pb, whereas the key acute threat was Cu because Pb and Cu have different pathogenic mechanisms for aquatic organisms.
According to Wang et al. [29], compared with Pb, Cu2+ ions more easily bind to the sulfhydryl moiety of the protein, which interferes with its conformation and causes acute damage to the respiratory system and liver of fish [29]. Therefore, Table 1 shows that the short-term safety tolerance threshold of Cu is only 0.0300 mg/L, which is much stricter than that of Pb (0.1310 mg/L).
In contrast, because Pb is not an essential element for organisms, its metabolism is much slower, and readily accumulates in organisms [30]. Therefore, the chronic harm of Pb is more prominent than that of Cu [30]. Table 1 shows that the long-term safety tolerance threshold of Pb is only 0.0051 mg/L, which is much smaller than that of Cu (0.0094 mg/L).
3.3. Influence of Baihetan Dam on Ecological Risk
The variations in ecological risks before and after the construction of Baihetan Dam, as estimated by the transition TFN model, are listed in Figure 12, Figure 13 and Figure 14.
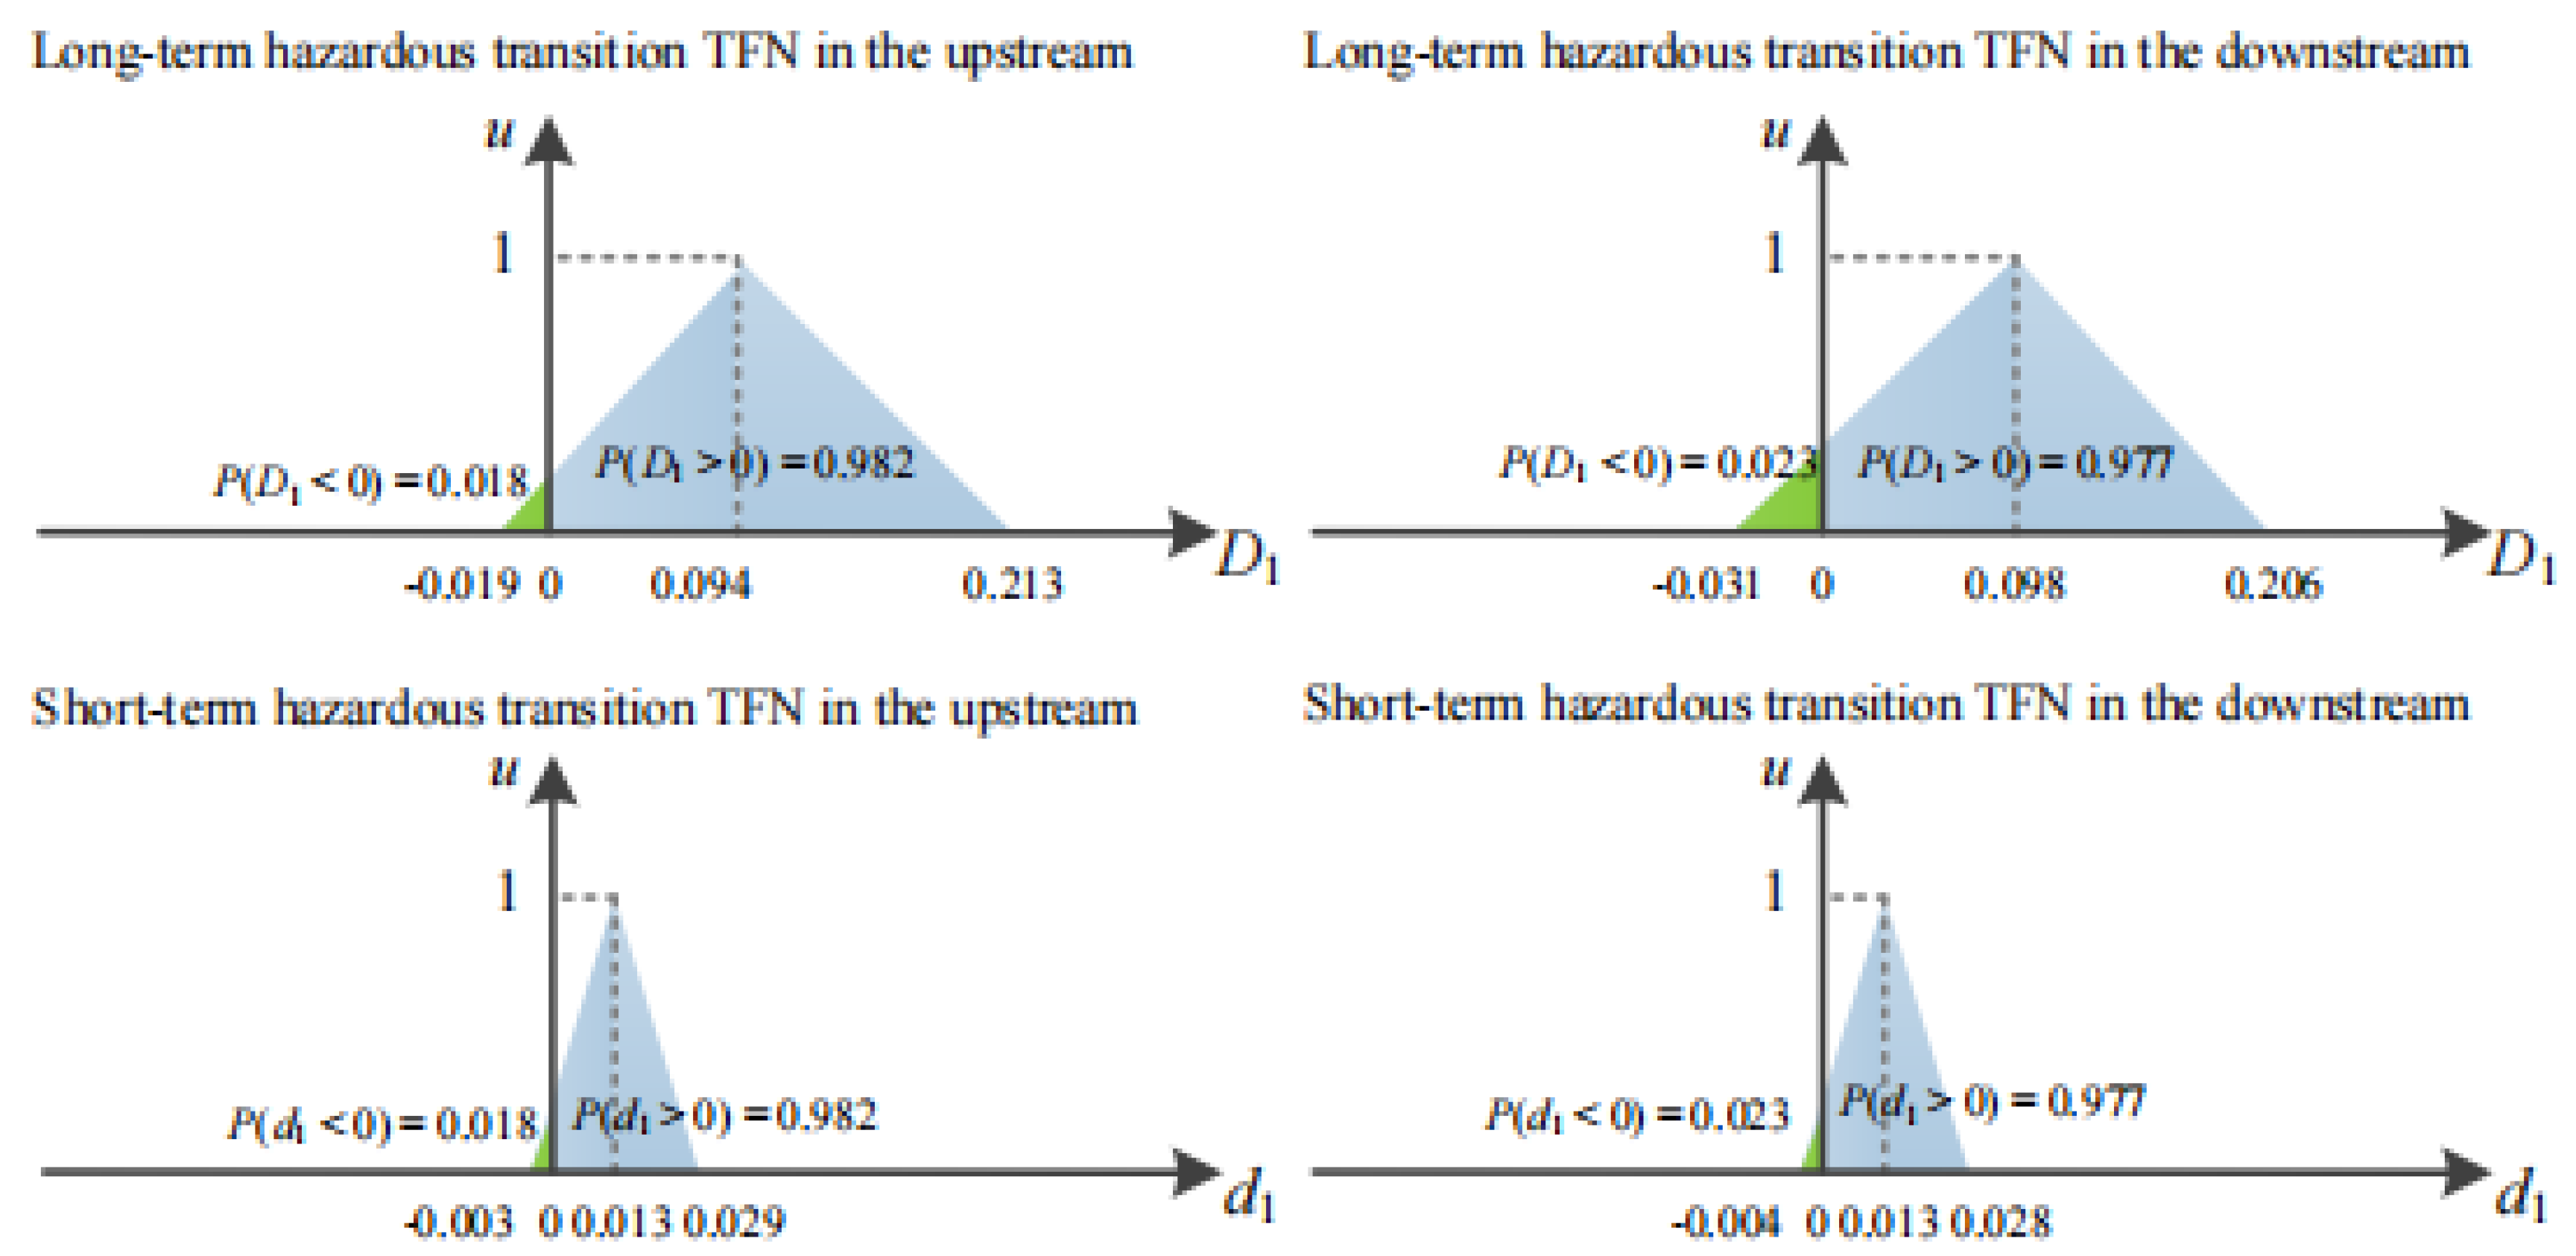
Figure 12 shows the long-term and short-term hazardous transition TFNs of NH3-N in the upstream locations were {−0.019, 0.094, 0.213} and {−0.003, 0.013, 0.029}, respectively, both of which had a probability of 0.982 of being larger than 0. However, the long-term and short-term hazardous transition TFNs downstream were {−0.031, 0.098, 0.206} and {−0.004, 0.013, 0.028}, respectively, both of which had a probability of 0.977 of being larger than 0. Both the chronic and acute ecological risks of NH3-N showed a marked increasing trend after the construction of Baihetan Dam, indicated by the fact that the probability estimates 0.982 and 0.979 were larger than 0.95.
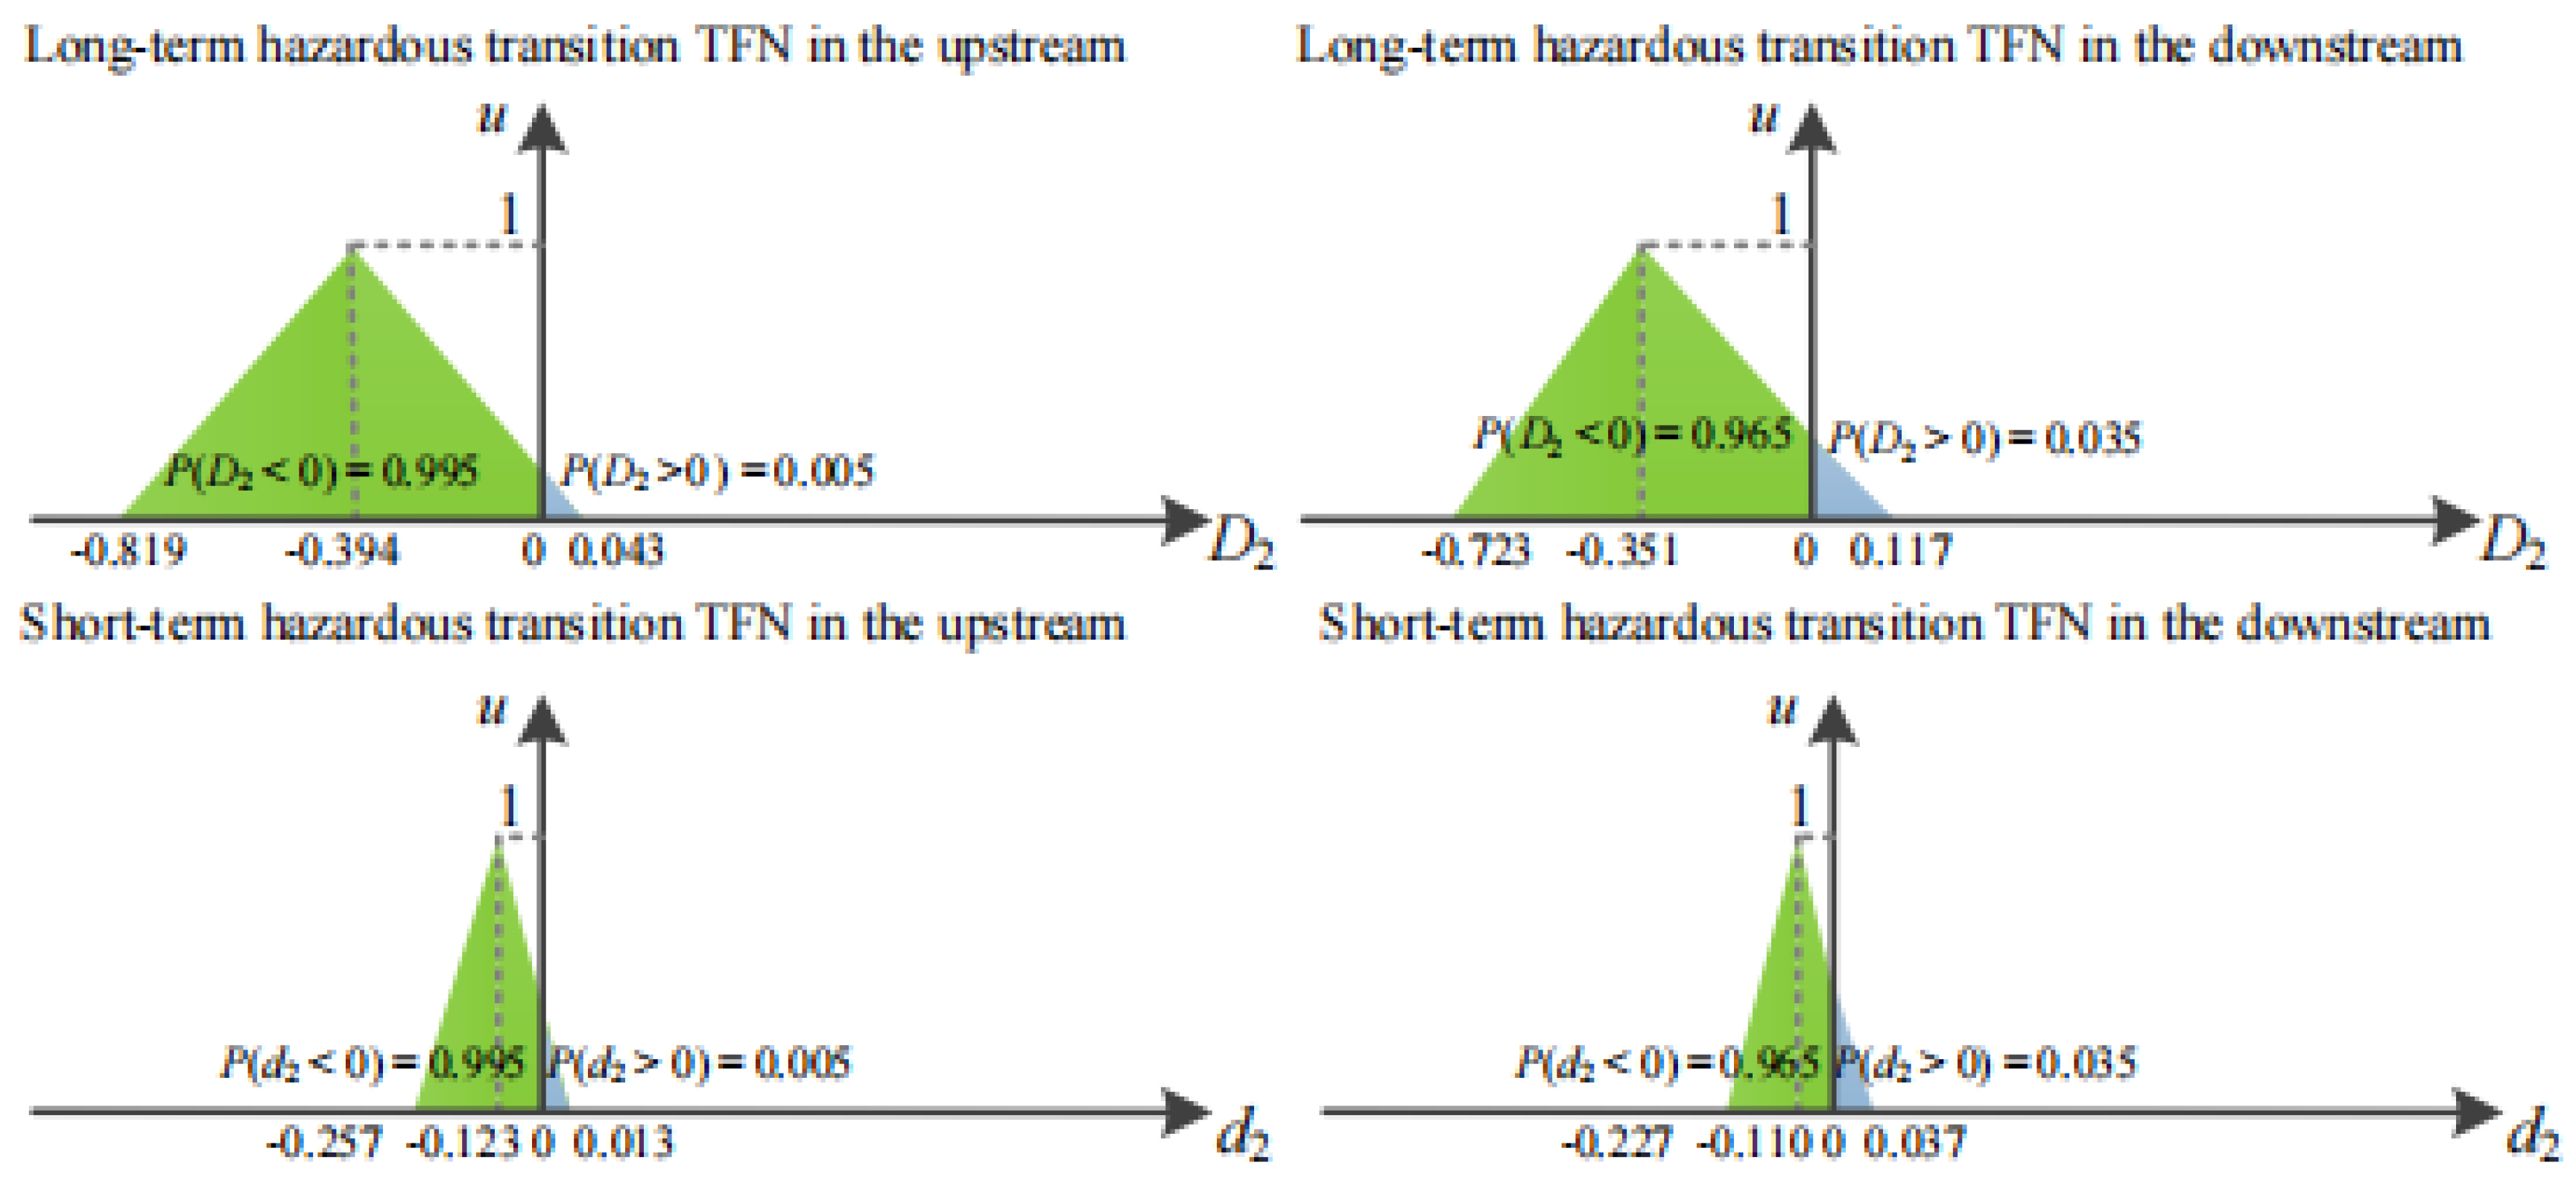
The transition TFNs of Cu are opposite to those of NH3-N. Figure 13 shows that the long-term and short-term hazardous transition TFNs of Cu upstream were {−0.819, −0.394, 0.043} and {−0.257, −0.123, 0.013}, respectively, both of which had a probability of 0.995 of being less than 0. However, the long-term and short-term hazardous transition TFNs downstream were {−0.723, −0.351, 0.117} and {−0.227, −0.110, 0.037}, respectively, both of which had a probability of 0.965 of being less than 0. Both the chronic and acute ecological risks of Cu showed a substantial decreasing trend after the construction of Baihetan Dam, indicated by the fact that the probability estimates 0.995 and 0.965 were larger than 0.95.
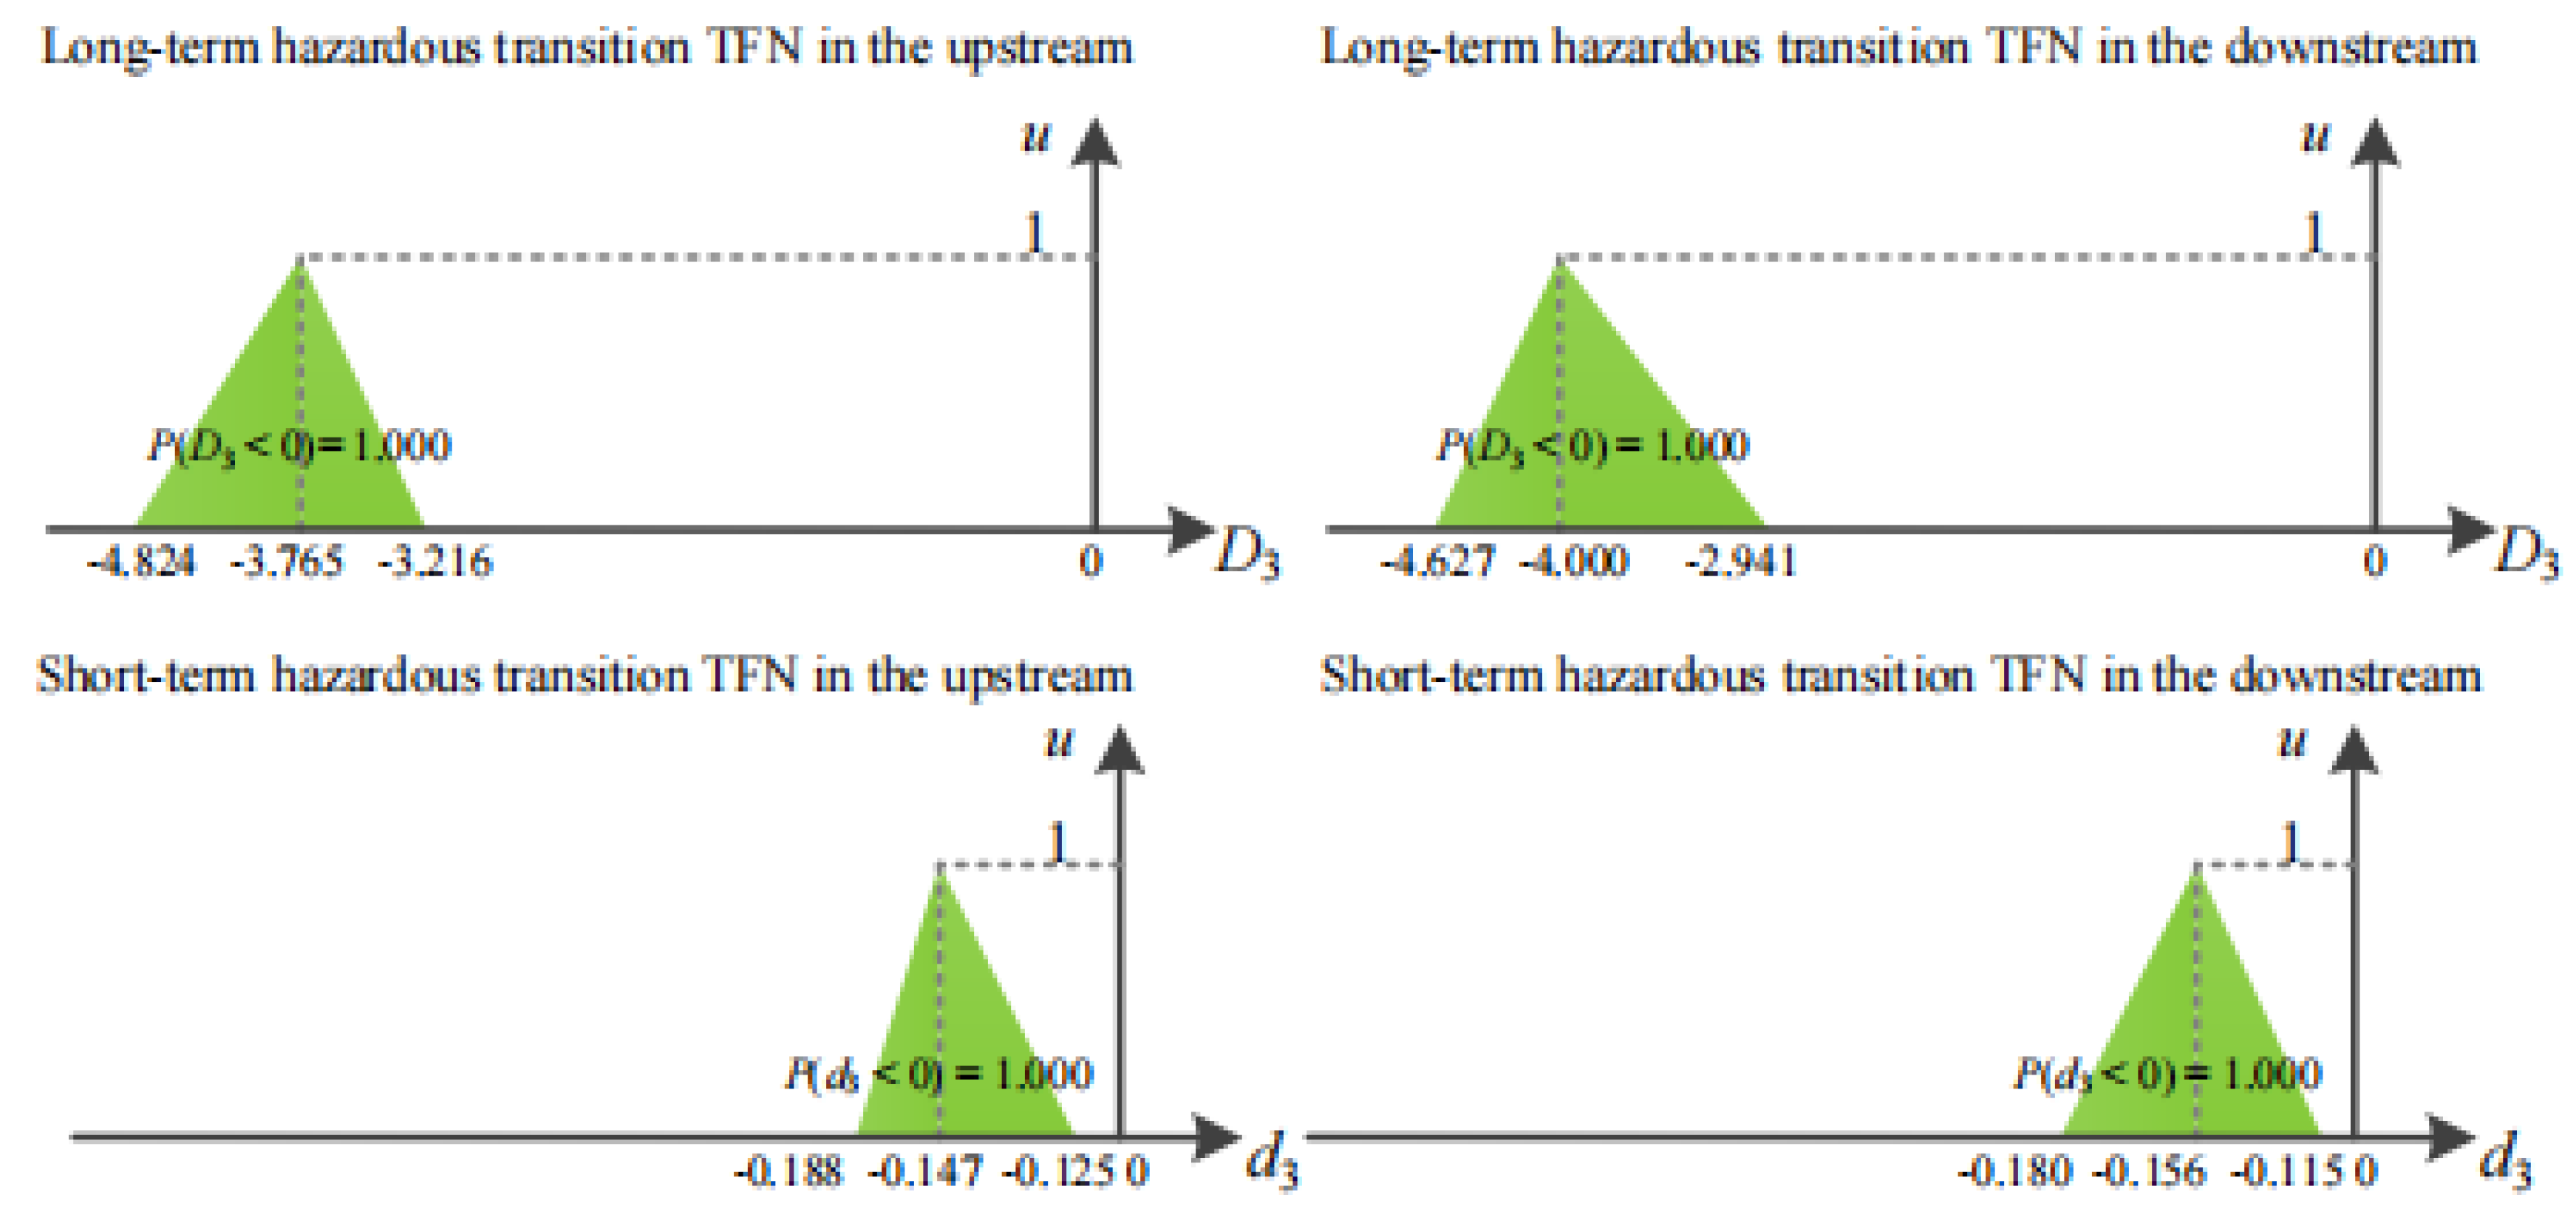
The transition TFNs of Pb were opposite to those of Cu. Figure 14 shows that the long-term transition TFNs of Pb upstream and downstream were {−4.824, −3.765, −3.216} and {−4.627, −4.000, −2.941}, respectively, and their short-term transition TFNs were {−0.188, −0.147, −0.125} and {−0.180, −0.156, −0.115}, respectively. The ecological risk induced by Pb certainly decreased after the construction of Baihetan Dam because all these transition TFNs had a probability of 1.000 of being less than 0.
Overall, after the construction of Baihetan Dam, the ecological risk of NH3-N showed a marked increasing trend, whereas the ecological risks of Cu and Pb showed substantial decreasing trends. This result is consistent with the variation in pollutant concentrations discussed in Section 3.1. However, compared with upstream of the dam, the probability of an increase in NH3-N risk and the probability of a decrease in Cu ecological risk were slightly smaller downstream, which indicated that dam construction had a more substantial impact on the ecological risk upstream.
According to Lu et al. [6], the reason for the phenomenon might be that the dam had a more prominent impact on the hydraulic conditions upstream. Under natural conditions, the water body maintained a certain velocity [6]. After dam construction, the upstream water level was raised due to its backwater action and the flow velocity was often close to zero [6]. However, dams usually need to maintain a discharge flow, so the water body downstream still has a certain velocity [6]. As a result, the changes in degradation capacity and sediment settlement were more prominent upstream.
3.4. Comparisons between Traditional HQ and Fuzzy HQ
The fuzzy HQ model was designed based on TFN theory. In the fuzzy HQ model, long-term and short-term HQs were written as TFNs. Given the large amount of evaluation results, this study only took the long-term HQ assessment of Cu as an example to illustrate the differences between HQ and fuzzy HQ. The results of the conventional HQ and fuzzy HQ evaluations of Cu are shown in Table 2 and Table 3, respectively.
As shown in Table 2 and Table 3, three differences exist between the results of the conventional HQ and fuzzy HQ.
- (i)
- The traditional HQ model can produce an approximate range of HQs. The range of values obtained by fuzzy HQ is consistent with that of conventional HQ, which indicates that the fuzzy HQ model is plausible and valid. On this basis, the fuzzy HQ model is designed based on TFN theory and can further quantify the possibility of ecological risk belonging to each grade, which comprehensively and accurately reflects the uncertainties of the concentration distribution of pollutants in the water.
- (ii)
- When the range of HQs is not a subset of the judgment interval, the traditional HQ is almost unable to identify the ecological hazard grade. Table 2 shows that the range of long-term HQ of Cu in the upstream locations before dam construction was [0.830, 1.404], which crossed two judgment intervals, medium (0.1–1), and high (>1). The conventional HQ cannot calculate the probability of the long-term HQ falling into the two judgment intervals; therefore, it cannot identify the ecological hazard grade. Nevertheless, the fuzzy HQ model solves this problem by introducing hazardous vectors.
- (iii)
- Traditional HQ cannot accurately reflect the changes in ecological risks before and after dam construction. The fuzzy HQ model includes a hazardous TFN model and a transitional TFN model. The transition TFN model is specifically used to evaluate the ecological risk variation induced by dam construction. For example, Table 3 shows that the chronic ecological risk of Cu upstream and downstream was mainly high grade before the dam construction and completely medium grade afterwards. The chronic ecological risk of Cu had a variation in grades with a considerable downward trend after the construction of Baihetan Dam.
4. Conclusions
The crucial acute hazard factor to the local aquatic ecosystem was Cu, and the key chronic hazard factor was Pb. After the construction of Baihetan Dam, the chronic hazard of NH3-N was medium grade, and its acute hazard was low grade. Both the long-term and short-term hazardous TFNs of Cu were medium grade. The acute hazard of Pb was certainly low grade, whereas its chronic hazard had uncertainties. Its long-term hazardous vectors in the upstream locations were {0.000, 0.928, 0.072}, whereas its long-term hazardous vectors in the downstream locations were {0.000, 0.108, 0.892}.
Both of the ecological risks of Cu and Pb showed marked decreasing trends after the construction of Baihetan Dam, whereas the ecological risk of NH3-N showed a substantial increasing trend. The major reason for this variation in ecological risk was that the construction of Baihetan Dam changed the hydraulic conditions of the Jinsha River. For the construction of this dam, the impounding effect reduced the rates of nutrient degradation but promoted the settlement of heavy metals with sediment.
The hazardous TFN method can deal with the ecological risk evaluation that included certainties in the observation data set, and the transition TFN method can analyze the variation in ecological risk using a small sample size. Therefore, the fuzzy HQ model is effective in the ecological risk evaluation induced by dam construction.
At present, the fuzzy HQ model designed cannot assess the comprehensive ecological risk of multiple pollutants resulting from synergistic or cumulative effects among different pollutants. Therefore, the fuzzy HQ model still needs further improvement to better deal with these synergistic and cumulative effects among pollutants.
Supplementary Materials
The following supporting information can be downloaded at: https://www.mdpi.com/article/10.3390/w14172694/s1, Table S1: Observation data before dam construction; Table S2: Observation data after dam construction.
Author Contributions
F.Y.: conceptualization, methodology and funding acquisition. N.L.: writing—original draft preparation. Z.Y.: supervision and project administration. B.Q.: data curation. All authors have read and agreed to the published version of the manuscript.
Funding
This research was funded by the National Natural Science Foundation of China (52069012).
Data Availability Statement
Not applicable.
Conflicts of Interest
The authors declare no conflict of interest.
References
- Sun, J.; Zhang, T.; Zhu, D.Z.; Fu, J. Simulative evaluation of fish habitat of backwater tributary of Baihetan Reservoir. Water Resour. Hydropower Eng. 2013, 44, 17–22. [Google Scholar]
- Yang, R.; Shang, P.; Yu, D. Water environment and atmospheric environment control of Baihetan Hydropower Station Project. Water Resour. Hydropower Eng. 2015, 46, 60–61, 64. [Google Scholar]
- Agostinho, A.A.; Gomes, L.C.; Veríssimo, S.; Okada, E.K. Flood regime, dam regulation and fish in the Upper Paraná River: Effects on assemblage attributes, reproduction and recruitment. Rev. Fish Biol. Fish. 2004, 14, 11–19. [Google Scholar] [CrossRef]
- Yang, T.; Zhang, Q.; Chen, Y.D.; Tao, X.; Xu, C.Y.; Chen, X. A spatial assessment of hydrologic alteration caused by dam construction in the middle and lower Yellow River, China. Hydrol. Processes Int. J. 2008, 22, 3829–3843. [Google Scholar] [CrossRef]
- Graf, W.L. Downstream hydrologic and geomorphic effects of large dams on American rivers. Geomorphology 2006, 79, 336–360. [Google Scholar] [CrossRef]
- Lu, J.; Wang, S.; Li, Y.; Yan, F. Ecological risk assessment of ammonia nitrogen in rare fish reserve in the upper reaches of the Yangtze River. Water Resour. Power 2022, 40, 53–56. [Google Scholar]
- Liang, F.; Yang, S.; Sun, C. Primary health risk analysis of metals in surface water of Taihu Lake, China. Bull. Environ. Contam. Toxicol. 2011, 87, 404–408. [Google Scholar] [CrossRef]
- Feng, J.; Hu, P.; Li, X.; Liu, S.; Sun, J. Ecological and health risk assessment of polycyclic aromatic hydrocarbons (PAHs) in surface water from middle and lower reaches of the Yellow River. Polycycl. Aromat. Compd. 2016, 36, 656–670. [Google Scholar] [CrossRef]
- Ding, T.T.; Du, S.L.; Huang, Z.Y.; Wang, Z.J.; Zhang, J.; Zhang, Y.H.; Liu, S.S.; He, L.S. Water quality criteria and ecological risk assessment for ammonia in the Shaying River Basin, China. Ecotoxicol. Environ. Saf. 2021, 215, 112141. [Google Scholar] [CrossRef]
- Official Website of China. Three Gorges Corporation. Available online: www.ctg.com.cn (accessed on 27 July 2021).
- Yan, Z.; Meng, W.; Liu, Z.; Yu, R. Development of Freshwater Aquatic Life Criteria for Ammonia in China. Environ. Sci. 2011, 32, 1564–1570. [Google Scholar]
- Wu, F.; Feng, C.; Cao, Y.; Zhang, R.; Li, H.; Zhao, X. Aquatic Life Ambient Freshwater Quality Criteria for Copper in China. Asian J. Ecotoxicol. 2011, 6, 617–628. [Google Scholar]
- He, L.; Cai, J.; Gao, F.; Wang, X.; Wang, W.; Yan, Z.; Zhou, J.; Liu, Z. Studies of Freshwater Aquatic Life Water Ambient Quality Criteria for Lead and Their Tentative Application to Risk Assessment. Environ. Sci. Technol. 2014, 37, 31–37+95. [Google Scholar]
- GB-3838-2002; National Surface Water Environmental Quality Standards of China. Chinese Environmental Protection Agency, Chinese General Administration of Quality Supervision, Inspection and Quarantine, China Standards Press: Beijing, China, 2002.
- Wang, Y.; Yan, Z.; Zheng, X.; Zhao, Y.; Zhang, Y.; Yang, N. Preliminary aquatic life criteria development and ecological risk assessment of ammonia in seven major river basins in China. Mar. Sci. Bull. 2016, 18, 55–68. [Google Scholar]
- Ma, L.; Liu, L.; Song, L.; Wang, L. Risk analysis of water quality of Wangyu River during water diversion. J. Hohai Univ. (Nat. Sci.) 2014, 42, 13–18. [Google Scholar]
- Li, L.; Song, F.; Liu, G.; Yan, F. Evaluation of grey water footprint of Hubei Province based on triangular fuzzy number theory. Water Resour. Power 2022, 40, 49–52. [Google Scholar]
- Li, D.; Lu, X.X.; Yang, X.; Chen, L.; Lin, L. Sediment load responses to climate variation and cascade reservoirs in the Yangtze River: A case study of the Jinsha River. Geomorphology 2018, 322, 41–52. [Google Scholar] [CrossRef]
- Zhang, X.B.; Wen, A.B. Variations of sediment in upper stream of Yangtze River and its tributary. J. Hydraul. Eng. 2002, 4, 56–59. [Google Scholar]
- Yang, Z.; Zhang, P.; Tang, H.; Gong, Y.; Dong, C.; Chen, X.; Zhao, N. The formation of habitat suitability curves for Coreius guichenoti (Sauvage & Dabry de Thiersant, 1874) of the lower Jinsha River. Ecol. Sci. 2017, 36, 129–137. [Google Scholar]
- Feng, Y.; Bao, Q.; Xiao, X.; Lin, M. Geo-accumulation vector model for evaluating the heavy metal pollution in the sediments of Western Dongting Lake. J. Hydrol. 2019, 573, 40–48. [Google Scholar] [CrossRef]
- Feng, Y.; Chenglin, L.; Bowen, W. Evaluation of heavy metal pollution in the sediment of Poyang Lake based on stochastic geo-accumulation model (SGM). Sci. Total Environ. 2019, 659, 1–6. [Google Scholar] [CrossRef]
- Zhang, X. Status and Causes of Sediment Change in the Upper Yangtze River and Sediment Reduction Measures—Comparison of Jialing River with Jinsha River. Soil Water Conserv. China 1999, 2, 24–26, 48. [Google Scholar]
- Zhu, L.; Xu, Q.; Dong, B.; Qin, L. Study on the effect and influencing factors of sand discharge of Xiluodu Reservoir in the Lower Jinsha River. Adv. Water Sci. 2021, 32, 544–555. [Google Scholar]
- Fan, Q.; Wang, Z.; Wu, G. The important role of the construction of Baihetan Hydropower Station in Jinsha River. Water Power 2018, 44, 1–6, 12. [Google Scholar]
- Liu, W.; Xu, S.; Yang, J.; Wu, W.; Lu, X.; Yin, H. Mineralogical characteristics of suspended matters and sediments in the Jinshajiang River and their superficial geochemical significance. Bull. Mineral. Petrol. Geochem. 2007, 2, 164–169. [Google Scholar]
- Wang, X.; Dong, Z.; Wang, W.; Luo, Y.; Tan, Y. Stochastic grey water footprint model based on uncertainty analysis theory. Ecol. Indic. 2021, 124, 107444. [Google Scholar] [CrossRef]
- Yunnan Provincial Bureau of Statistics. Statistics Yearbook of Yunan Province; China Statistics Press: Beijing, China, 2020. [Google Scholar]
- Wang, R.; Ma, G.; Fang, Z. Safety assessment and acute toxicity of copper‚ cadmium and zinc to white clound mountain minnow Tanichthys albonubes. Fish. Sci. 2006, 25, 117–120. [Google Scholar]
- Wang, F.; Liao, J.; Mao, D.; Sun, C.; Yang, S.; Zhou, J.; Liu, H.; Gao, S.; Li, M. Aquatic quality criteria and ecological risk assessment for lead in typical waters of China. Asian J. Ecotoxicol. 2017, 12, 434–445. [Google Scholar]
Figure 1.
Study area. The photo of Baihetan Dam is from the official website of the China Three Gorges Corporation [10].
Figure 1.
Study area. The photo of Baihetan Dam is from the official website of the China Three Gorges Corporation [10].

Figure 2.
Membership function u(x).

Figure 3.
Illustrations of hazardous TFNs.

Figure 4.
Diagram of T(Di).

Figure 5.
Concentrations of pollutants. Upstream Downstream Before the dam construction Aefore the dam construction.
Figure 5.
Concentrations of pollutants. Upstream Downstream Before the dam construction Aefore the dam construction.

Figure 6.
Hazardous TFNs of NH3-N before dam construction.

Figure 7.
Hazardous TFNs of NH3-N after dam construction.

Figure 8.
Hazardous TFNs of Cu before dam construction.

Figure 9.
Hazardous TFNs of Cu after dam construction.

Figure 10.
Hazardous TFNs of Pb before dam construction.

Figure 11.
Hazardous TFNs of Pb after dam construction.

Figure 12.
Transition TFN of ecological risk of NH3-N.

Figure 13.
Transition TFN of ecological risk of Cu.

Figure 14.
Transition TFN of ecological risk of Pb.


Table 1.
Water quality safety criteria of NH3-N, Cu, and Pb.
| Pollutant | Short-Term Criteria | Long-Term Criteria |
|---|---|---|
| NH3-N | 1.1800 mg/L | 0.1600 mg/L |
| Cu | 0.0300 mg/L | 0.0094 mg/L |
| Pb | 0.1310 mg/L | 0.0051 mg/L |
Table 2.
Long-term HQ evaluation result of Cu based on traditional HQ model.
| Evaluation Items | Upstream | Downstream | |
|---|---|---|---|
| Ecological risk before dam construction | Long-term HQ | [0.830, 1.404] | [0.766, 1.362] |
| Grade | / | / | |
| Ecological risk after dam construction | Long-term HQ | [0.585, 0.872] | [0.638, 0.883] |
| Grade | Medium | Medium | |
| Changes in ecological risk | / | / | |
Table 3.
Long-term HQ evaluation result of Cu based on the fuzzy HQ model.
| Evaluation Items | Upstream | Downstream | |
|---|---|---|---|
| Ecological risk before dam construction | Long-term HQ | {0.830, 1.106, 1.404} | {0.766, 1.096, 1.362} |
| Grade | High | High | |
| Hazardous vectors | {0.000, 0.182, 0.818} | {0.000, 0.278, 0.772} | |
| Ecological risk after dam construction | Long-term HQ | {0.585, 0.713, 0.872} | {0.638, 0.745, 0.883} |
| Grade | Medium | Medium | |
| Hazardous vectors | {0.000, 1.000, 0.000} | {0.000, 1.000, 0.000} | |
| Changes in ecological risk | Transition TFN | {−0.819, −0.394, 0.043} | {−0.723, −0.351, 0.017} |
| Probability of risk decreasing | 0.995 | 0.965 | |
| Probability of risk increasing | 0.005 | 0.035 | |
Publisher’s Note: MDPI stays neutral with regard to jurisdictional claims in published maps and institutional affiliations. |
© 2022 by the authors. Licensee MDPI, Basel, Switzerland. This article is an open access article distributed under the terms and conditions of the Creative Commons Attribution (CC BY) license (https://creativecommons.org/licenses/by/4.0/).
Share and Cite
MDPI and ACS Style
Yan, F.; Li, N.; Yang, Z.; Qian, B. Ecological Risk Evaluation of Baihetan Dam Based on Fuzzy Hazard Quotient Model. Water 2022, 14, 2694. https://doi.org/10.3390/w14172694
AMA Style
Yan F, Li N, Yang Z, Qian B. Ecological Risk Evaluation of Baihetan Dam Based on Fuzzy Hazard Quotient Model. Water. 2022; 14(17):2694. https://doi.org/10.3390/w14172694
Chicago/Turabian StyleYan, Feng, Na Li, Zhigang Yang, and Bao Qian. 2022. "Ecological Risk Evaluation of Baihetan Dam Based on Fuzzy Hazard Quotient Model" Water 14, no. 17: 2694. https://doi.org/10.3390/w14172694
Note that from the first issue of 2016, this journal uses article numbers instead of page numbers. See further details here.