
Connecting Water Access with Multidimensional Poverty: The Case of Tupiza River Basin in Bolivia

 ,
,
Abstract
:1. Introduction
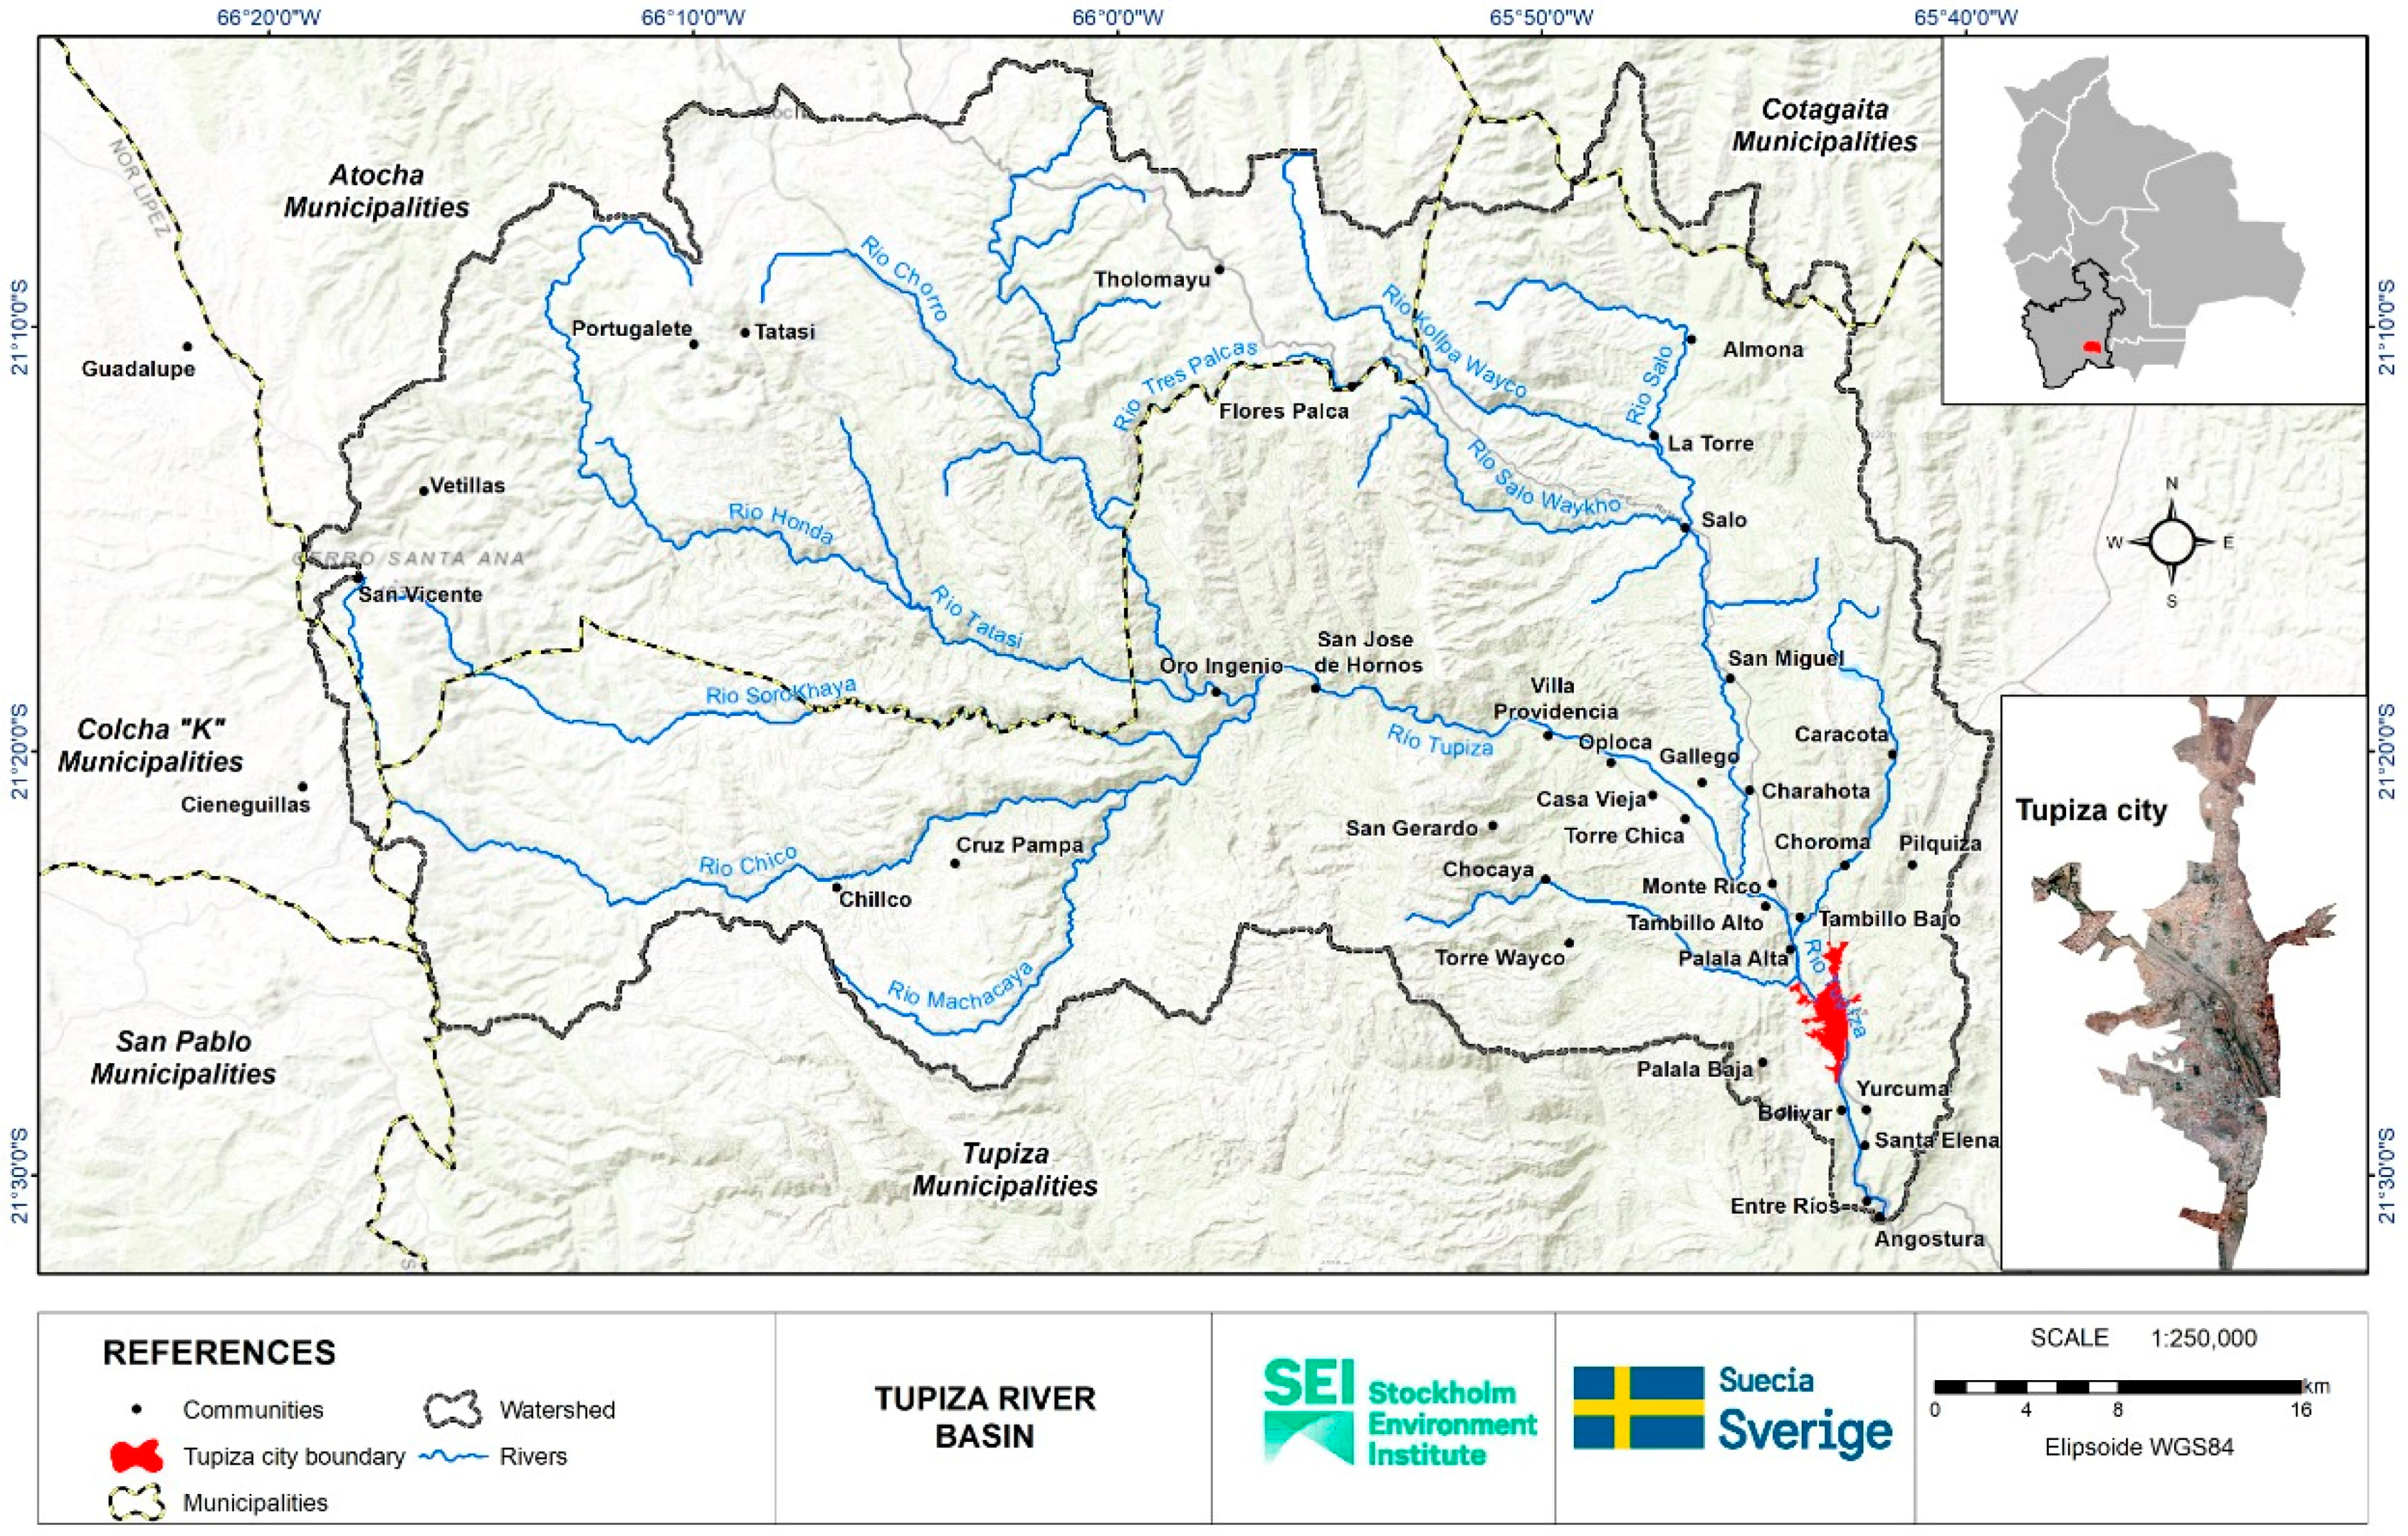
2. Study Area
3. Material and Methods
- Design and implementation of a household survey for rural and urban areas.
- Identification of multidimensional poverty variables, according to the MDPA framework.
- Estimation of multidimensional poverty indices and water access index for rural areas by applying the Shapley-Owen decomposition method.
- Estimation of econometric models to establish the relationship between water access and multidimensional poverty in the Tupiza River Basin.
3.1. Survey
3.2. Shapley-Owen Method
3.3. Multidimensional Poverty Index (MPI)
3.3.1. Poverty Sub-Indices for Rural Communities
3.3.2. Poverty Sub-Indices for the City of Tupiza
3.4. Water Index for Rural Communities of the Tupiza River Basin
3.5. Relationship between Water Access and Multidimensional Poverty in the Tupiza River Basin
4. Results
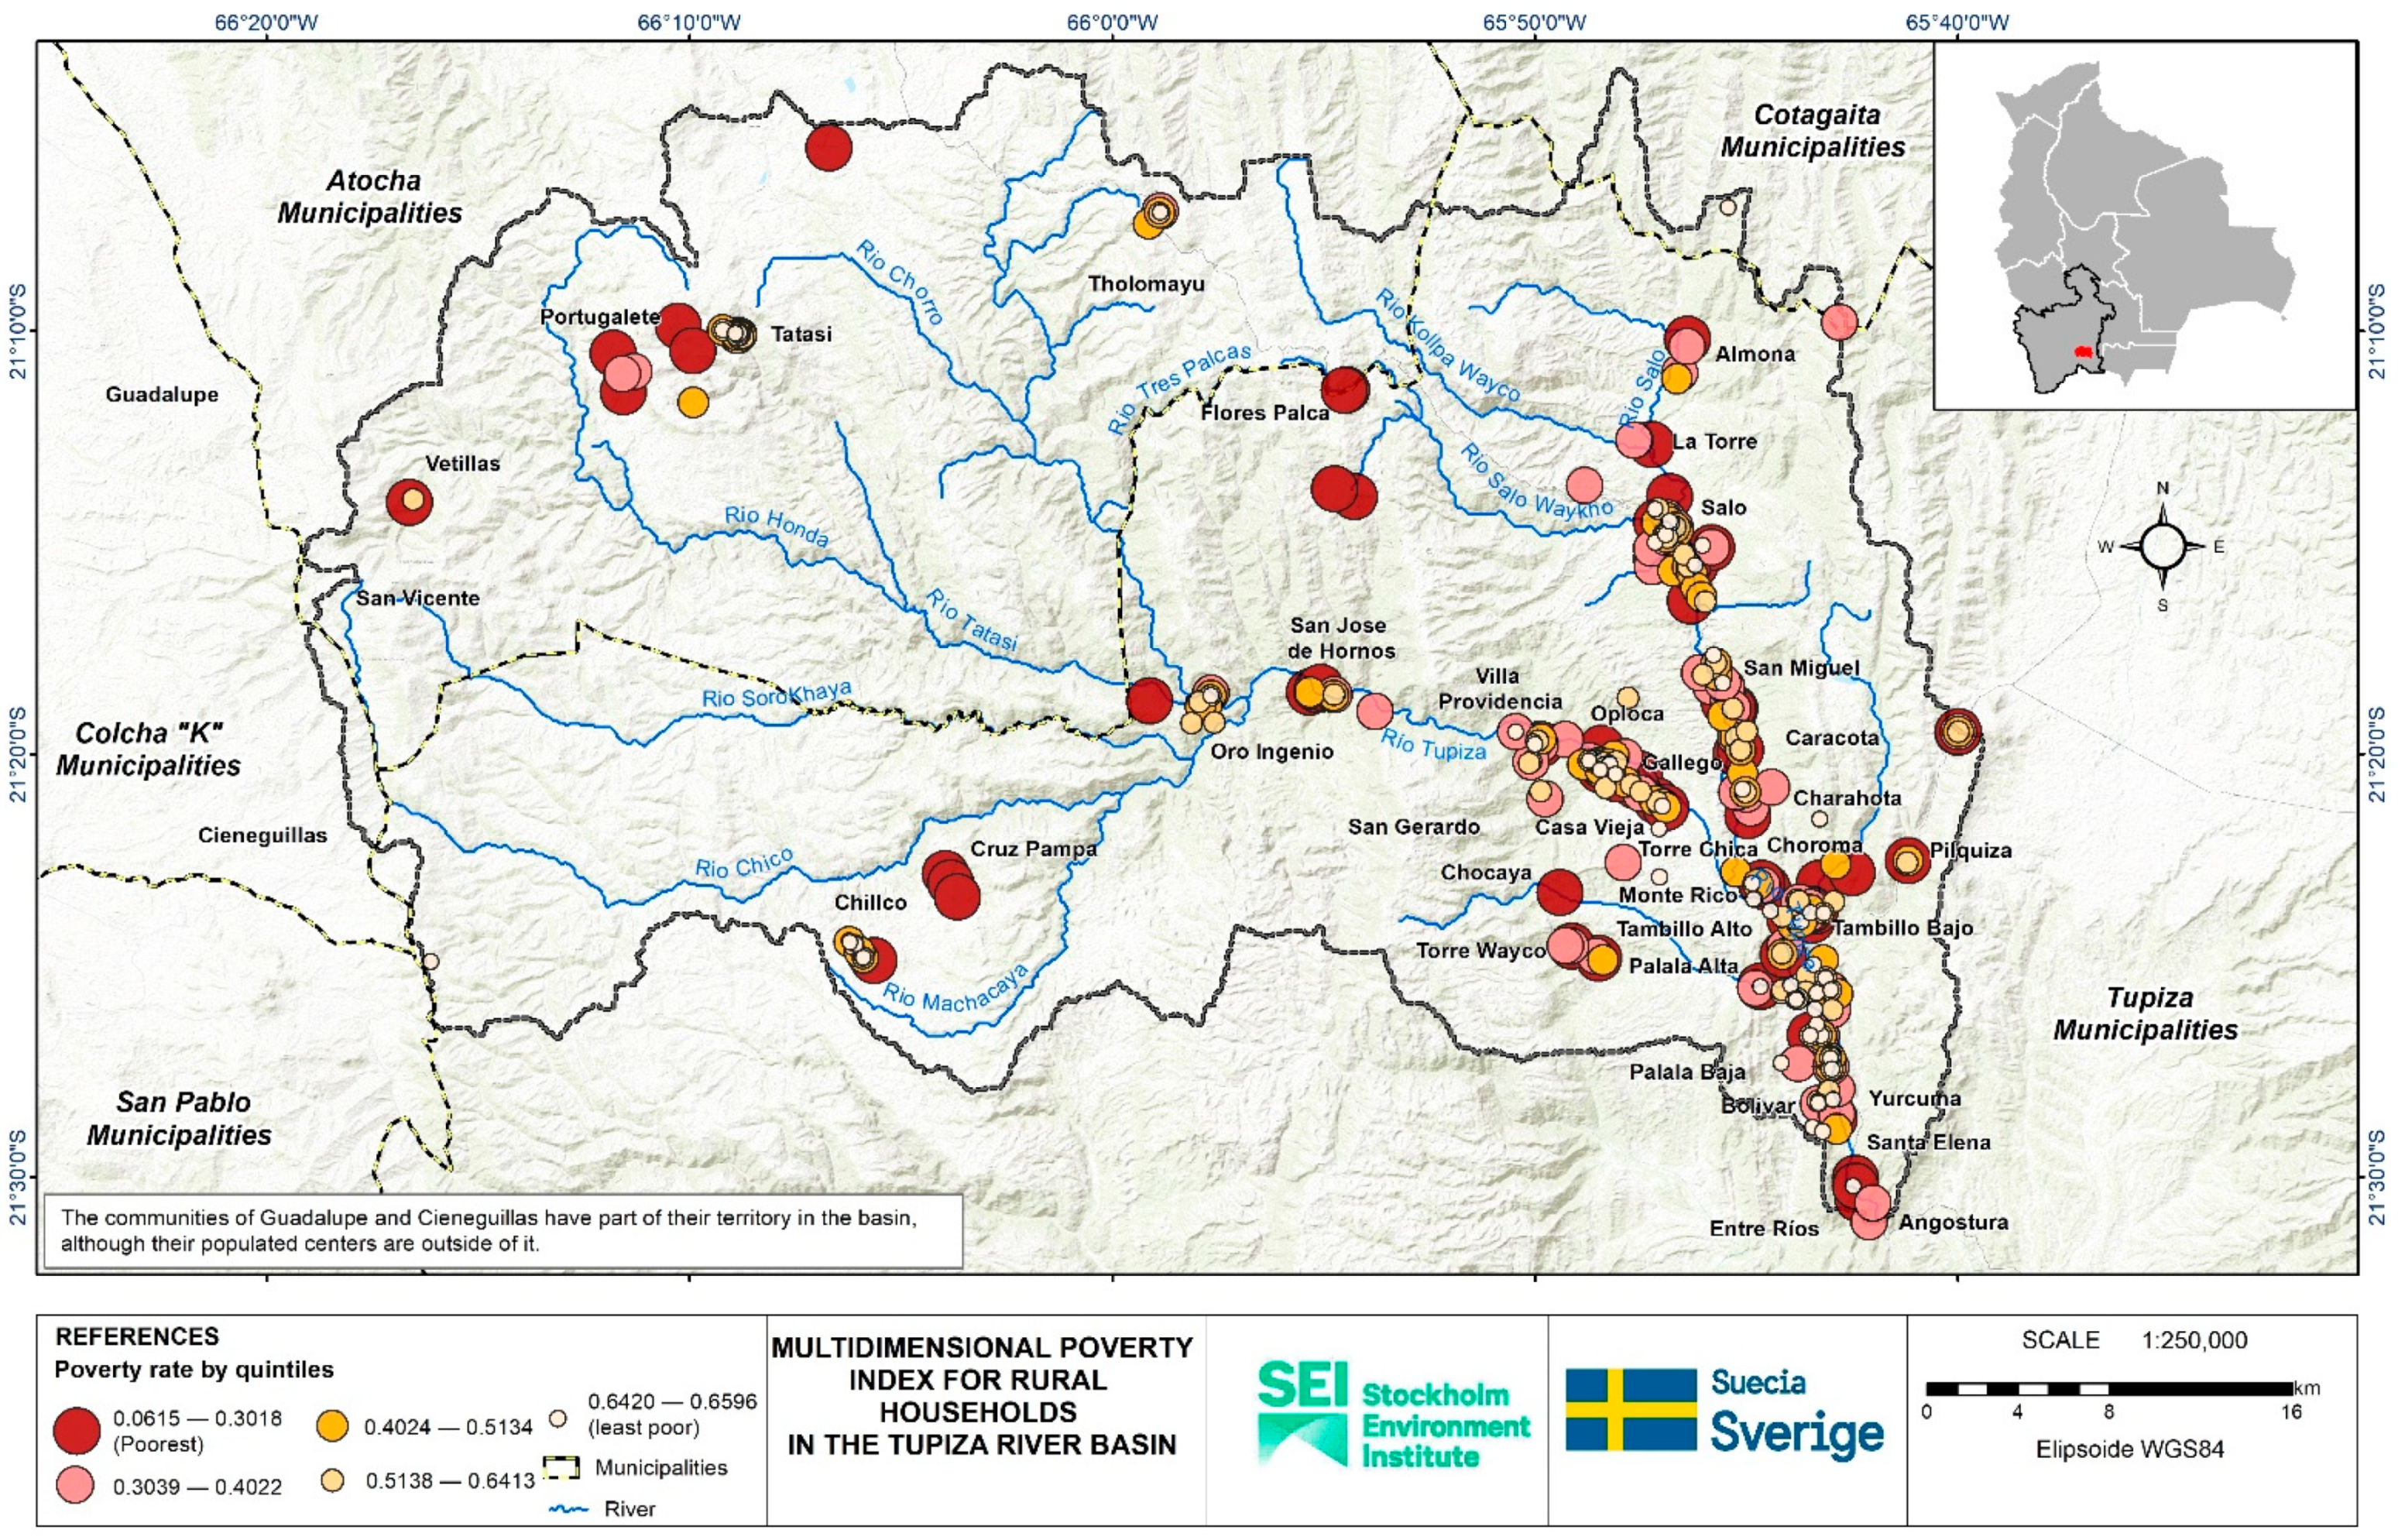
4.1. Multidimensional Poverty Index for Rural Communities
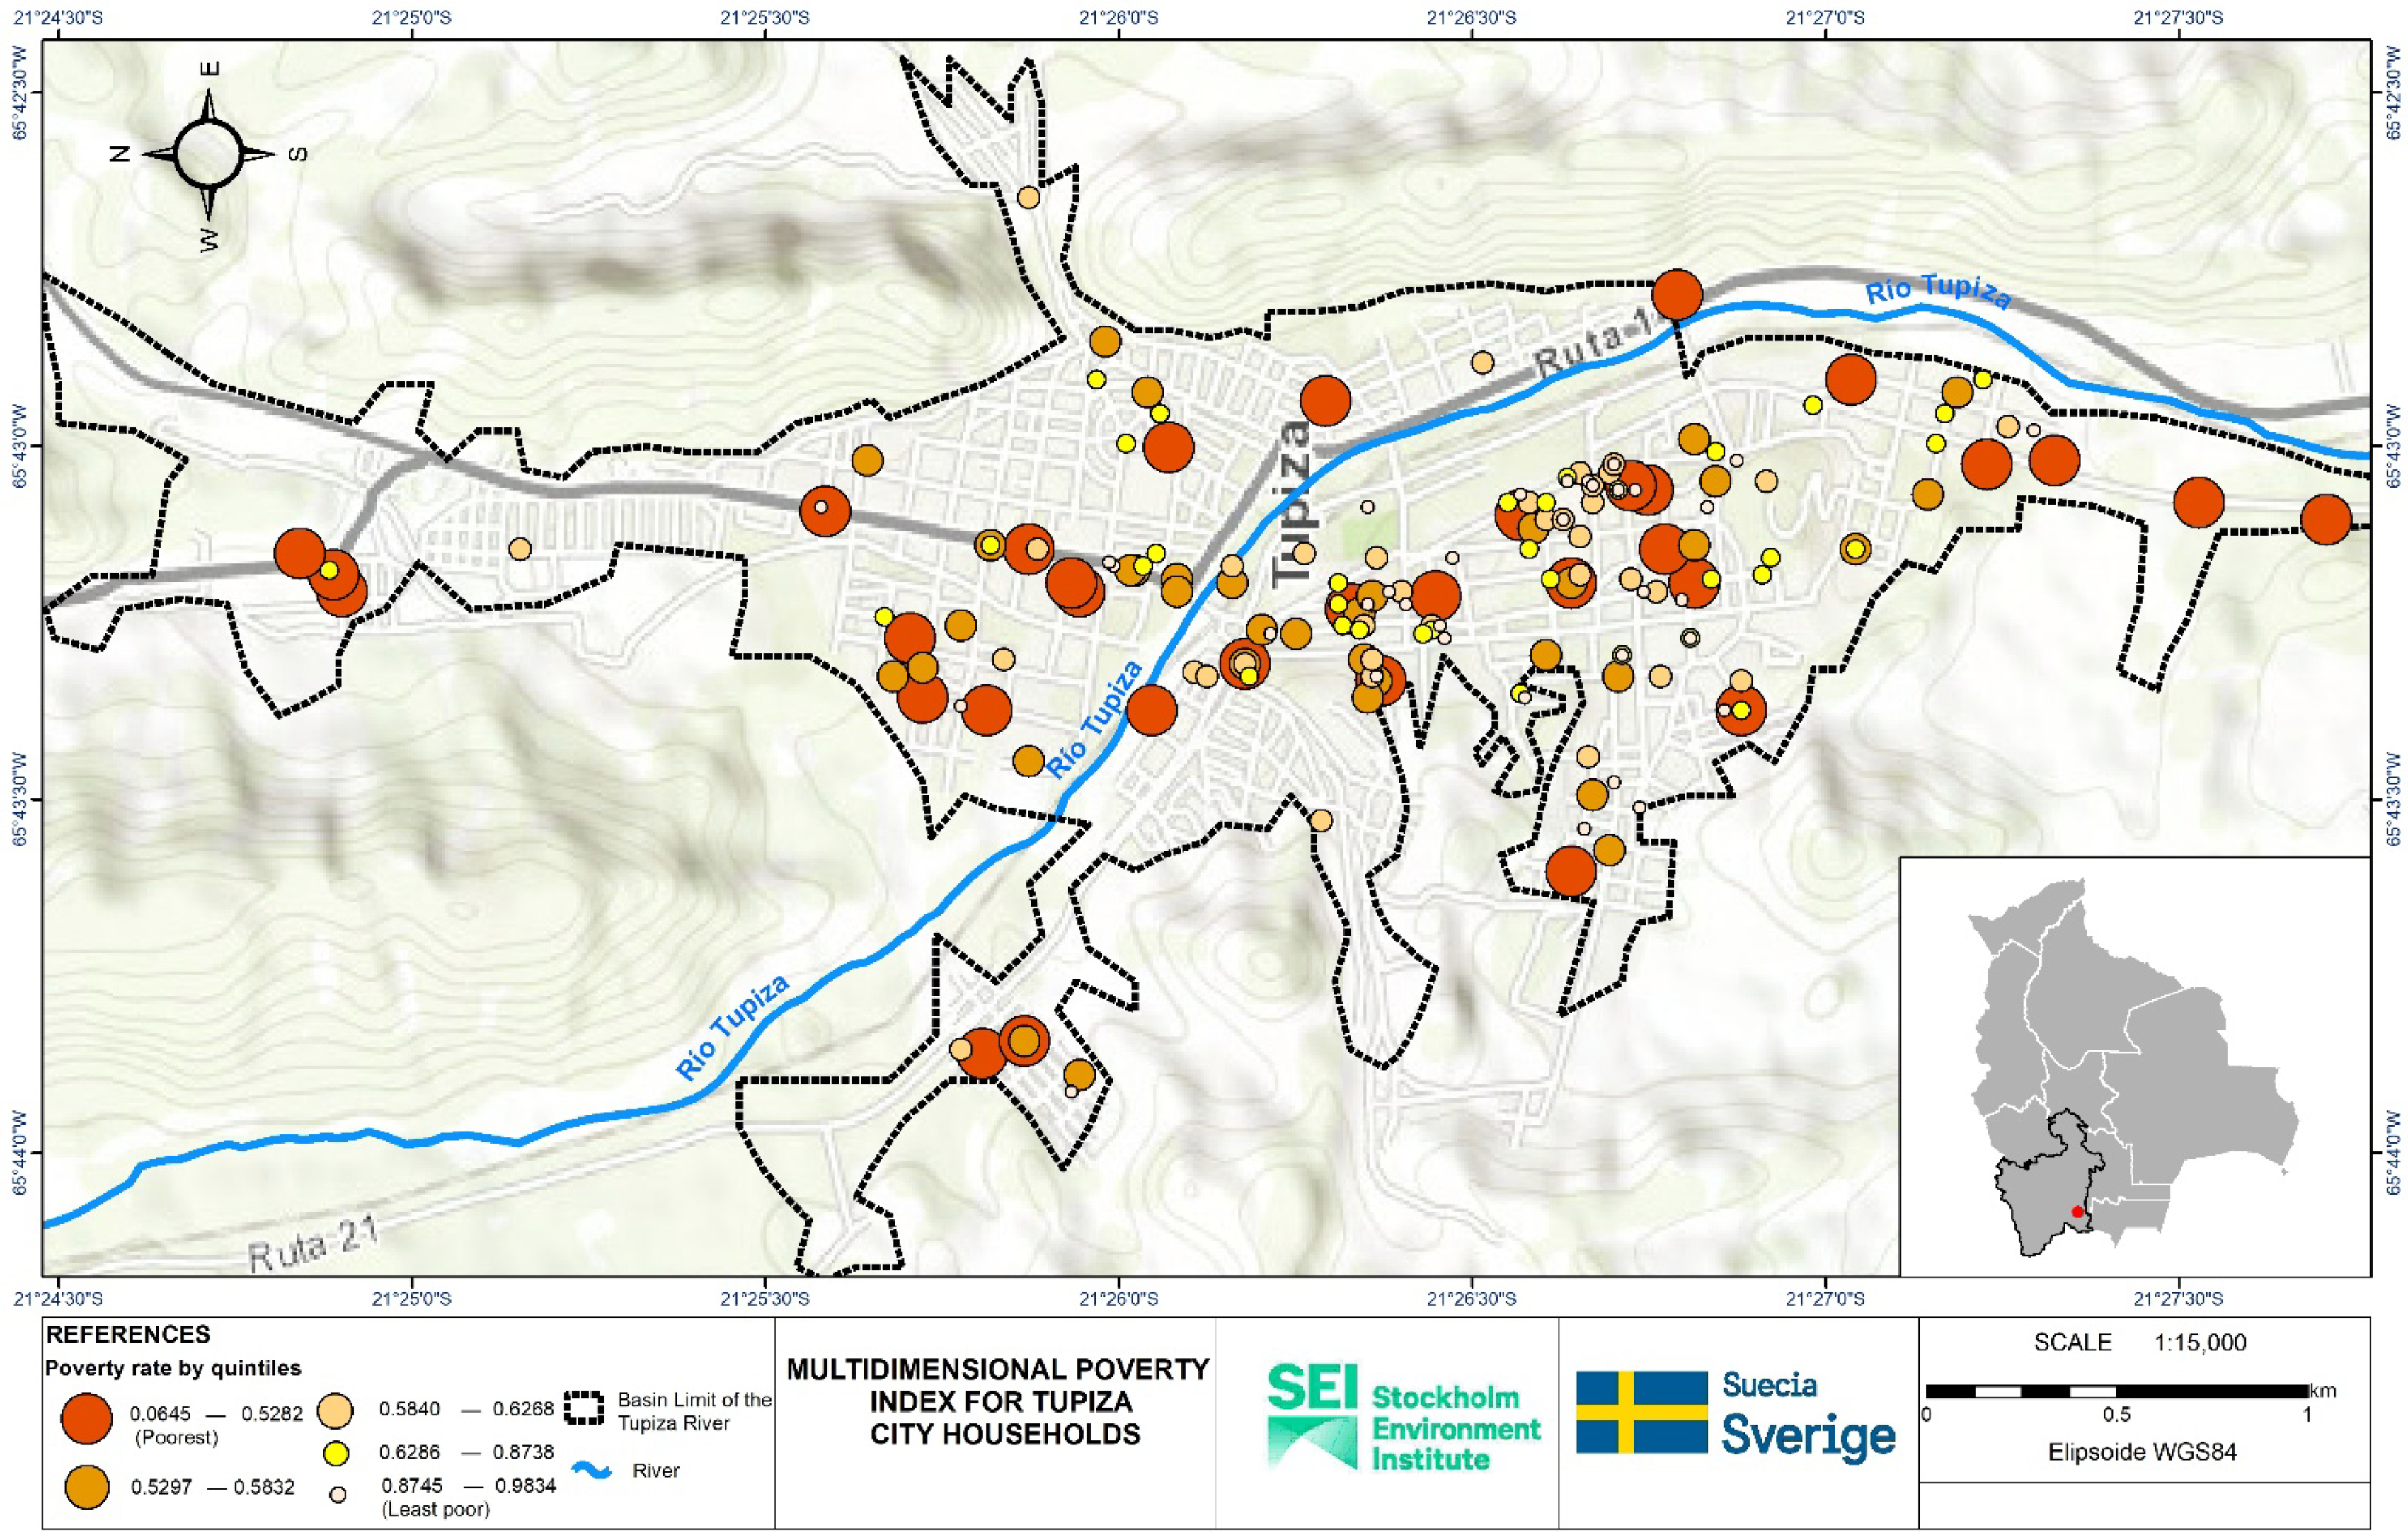
4.2. Multidimensional Poverty Index for the Urban Area
4.3. Water Access Index
4.4. Relationship between Water Access and Multidimensional Poverty in the Tupiza River Basin
4.4.1. Multidimensional Poverty Model for the Rural Area
4.4.2. Multidimensional Poverty Model for the Urban Area
4.5. Policy Implications
5. Discussion
6. Conclusions
Supplementary Materials
Author Contributions
Funding
Institutional Review Board Statement
Informed Consent Statement
Data Availability Statement
Acknowledgments
Conflicts of Interest
References
- Programme (UNDP). Global MPI 2020—Charting Pathways out of Multidimensional Poverty: Achieving the SDGs. Available online: https://ora.ox.ac.uk/objects/uuid:81d285e5-d4f3-4a11-a5e1-d9770a06d03f (accessed on 13 December 2021).
- Shatanawi, M.; Naber, S. Valuing water from social, economic and environmental perspective. In Dialogues on Mediterranean Water Challenges: Rational Water Use, Water Price Versus Value and Lessons Learned from The European Water Framework Directive; University of Jordan: Amman, Jordan, 2011; pp. 109–117. Available online: https://om.ciheam.org/om/pdf/a98/00801473.pdf (accessed on 4 January 2022).
- Barbier, E.B. Water and Economic Growth. Econ. Rec. 2004, 80, 1–16. [Google Scholar] [CrossRef]
- Brown, C.; Lall, U. November. Water and economic development: The role of variability and a framework for resilience. In Natural Resources Forum; Blackwell Publishing Ltd: Oxford, UK, 2006; Volume 30, pp. 306–317. [Google Scholar]
- Grey, D.; Sadoff, C. Water for growth and development. In A theme document of the 4th World Water Forum; Water Commission: Mexico City, Mexico, 2006; p. 55. Available online: https://www.worldwatercouncil.org/en/publications/final-report-4th-world-water-forum (accessed on 10 February 2022).
- Cox, W.E. The Role of Water in Socio-Economic Development: Report 1 of IHP-II Project C1 (on Heightening Awareness of the Socio-Economic Role of Water); United Nation Digital Library: New York, NY, USA, 1987. [Google Scholar]
- Bournaris, T.; Berbel, J.; Manos, B.; Viaggi, D. Economics of Water Management in Agriculture; CRC Press: Boca Raton, FL, USA, 2014. [Google Scholar] [CrossRef]
- Molden, D. Water for Food, Water for Life: A Comprehensive Assessment of Water Management in Agriculture; International Water Management Institute: Earhscan, UK, 2007. [Google Scholar]
- Turner, K.; Fao, R.; Georgiou, S.; Clark, R.; Brouwer, R.; Burke, J. Economic Valuation of Water Resources in Agriculture. From the Sectoral to a Functional Perspective of Natural Resource Management; FAO: Rome, Italy, 2004; Available online: https://scholar.google.com/scholar_lookup?title=Economic+valuation+of+water+resources+in+agriculture.+From+the+sectoral+to+a+functional+perspective+of+natural+resource+management&author=Turner%2C+K.&publication_year=2004 (accessed on 4 March 2020).
- UN Water. Sustainable Development Goal 6: Synthesis Report 2018 on Water and Sanitation; United Nations: New York, NY, USA, 2018. [Google Scholar]
- Sida. Dimensions of Poverty Sida’s Conceptual Framework. Sitrus. 2017. Available online: http://www.sida.se/contentassets/07acf1eb6c9e417db80a74b26692d40f/ebd4b37c-c50d-4081-810b-d7a1d5d63a44.pdf (accessed on 18 April 2021).
- Sida. Multidimensional Poverty Analysis (MDPA). 2017. Available online: https://www.sida.se/contentassets/4ecfd42348644d32abbfdccbed6f15c0/mdpa_poverty_analysis.pdf (accessed on 25 January 2022).
- WHO; UNICEF. Progress on Drinking Water, Sanitation and Hygiene; WHO: Geneva, Switzerland; UNICEF: New York, NY, USA, 2017. [Google Scholar]
- Ministerio de Medio Ambiente y Agua (MMAyA). Programa Plurianual de Gestión Integrada de Recursos Hídricos y Manejo Integral de Cuencas 2017–2020; Plan Nacional de Cuencas: La Paz, Bolivia, 2017. [Google Scholar]
- Alkire, S.; Foster, J. Counting and multidimensional poverty measurement. J. Public Econ. 2011, 95, 476–487. [Google Scholar] [CrossRef]
- Alkire, S.; Foster, J.; Seth, S.; Santos, M.E.; Roche, J.M.; Ballon, P. Multidimensional Poverty Measurement and Analysis: Chapter 1—Introduction. SSRN Electron. J. 2014. OPHI Working Paper No 82. [Google Scholar] [CrossRef]
- Alkire, S.; Foster, J.; Seth, S.; Santos, M.E.; Roche, J.M. Multidimensional poverty measurement and analysis. Chapter 8—Robustness Analysis and Statistical Inference. 2015. OPHI Working Paper No 89. Available online: http://www.ophi.org.uk/multidimensional-poverty-measurement-and-analysis-chapter-8-robustness-analysis-and-statistical-inference/ (accessed on 13 March 2022).
- Ministerio de Medio Ambiente y Agua (MMAyA). Elaboración del Diagnóstico Integral y Formulación de la Propuesta de Lineamientos Estratégicos e Institucionales del Plan Director de la Cuenca del rio Tupiza. Informe final. Empresa Consultora DESMA; Programa Plurianual de Gestión: La Paz, Bolivia, 2018. [Google Scholar]
- Llavona, A. Lecciones del Estado Plurinacional de Bolivia para la adopción del enfoque del Nexo: Análisis del Plan Nacional de Cuencas, el Sistema Múltiple Misicuni y las Políticas de Riego. 2020. Available online: https://repositorio.cepal.org/handle/11362/46546 (accessed on 8 December 2020).
- Instituto Nacional de Estadística (INE). Censo Nacional de Población y Vivienda 2012. In Crecimiento Intercensal por Municipios (National Population and Housing Census 2012, Intercensal Growth by Municipalities); Estado Plurinacional de Bolivia: La Paz, Bolivia, 2013; p. 56. [Google Scholar]
- Andersen, L.E.; Canelas, S.; Gonzales, A.; Peñaranda, L. Atlas municipal de los Objetivos de Desarrollo Sostenible en Bolivia 2020; Universidad Privada Boliviana, SDSN: La Paz, Bolivia, 2020. [Google Scholar]
- Agua Sustentable. Sistema de Monitoreo Público Social. 2013. Available online: https://issuu.com/aguasustentable/docs/13a_sistema_de_monitoreo_publico_so (accessed on 13 June 2020).
- Israeli, O. A Shapley-based decomposition of the R-Square of a linear regression. J. Econ. Inequal. 2007, 5, 199–212. [Google Scholar] [CrossRef]
- Olivera, M.; Fuerte, M. Poppy Cultivation and Eradication in Mexico, 2000–2018: The Effects of Climate. In Evaluating Climate Change Impacts, 1st ed.; Lyubchich, V., Gel, Y.R., Kilbourne, K.H., Miller, T.J., Newlands, N.K., Smith, A.B., Eds.; Chapman and Hall/CRC Taylor and Francis: New York, NY, USA, 2020; pp. 380–398. [Google Scholar] [CrossRef]
- Huettner, F.; Sunder, M. Axiomatic arguments for decomposing goodness of fit according to Shapley and Owen values. Electron. J. Stat. 2012, 6, 1239–1250. [Google Scholar] [CrossRef]
- Brown, J.D. The Cronbach alpha reliability estimate. JALT Test. Eval. SIG Newsl. 2002, 6, 17–18. [Google Scholar]
- Damania, R.; Desbureaux, S.; Rodella, A.; Russ, J.; Zaveri, E. Quality Unknown: The Invisible Water Crisis; World Bank: Washington, DC, USA, 2019; License: Creative Commons Attribution CC BY 3.0 IGO. [Google Scholar] [CrossRef]
- World Bank Group. The Connections between Poverty and Water Supply, Sanitation, and Hygiene in Panama: A Diagnostic; World Bank: Washington, DC, USA, 2018. [Google Scholar] [CrossRef]
- Wijnen, M.; Augeard, B.; Hiller, B.; Ward, C.; Huntjens, P. Understanding and Improving Groundwater Governance. 2012. Available online: https://openknowledge.worldbank.org/bitstream/handle/10986/17228/717420WP0Box370naging0the0invisible.pdf (accessed on 5 December 2021).


| Dimension | Subdimension | Variable |
|---|---|---|
| Resources | House conditions | Materials upgraded house |
| Monetizable resources—Agriculture | Land tenure own self | |
| Number of animals for livestock/poultry | ||
| Number of crops | ||
| Monetizable resources—capital goods | Number of appliances | |
| Number of communication equipment | ||
| Number of household furniture | ||
| Number of means of transport | ||
| Human capital | Number of years of schooling of the interviewed head of household | |
| Access to complementary training of the interviewed head of household | ||
| Opportunities and choice | Access to services basics | Access to bathroom or latrine |
| Access to garbage collection service | ||
| Access to electricity | ||
| Access to gas for kitchen | ||
| Power and voice | Access to projects in the community | Access to bathroom construction projects |
| Human security | Absence of natural disasters | Damage to agricultural production as a result of frosts |
| Absence of social conflicts | Absence of land conflicts in the community | |
| Absence of land conflicts with other communities | ||
| Absence of conflicts over mining in the community | ||
| Absence of mining conflicts with other communities |
| Dimension | Subdimension | Variable |
|---|---|---|
| Resources | Monetizable resources—House and land tenure | Home ownership status |
| Land tenure, own self | ||
| Land extension | ||
| Monetizable resources—capital goods | Number of home appliances | |
| Number of communication equipment | ||
| Number of household furniture | ||
| Number of means of transport | ||
| Human capital | Number of years of schooling of the interviewed head of household | |
| Access to complementary training of the interviewed head of household | ||
| Opportunities and choice | Access to services basics | Access to bathroom or latrine |
| Access to sink, water, and soap |
| Component | Variables |
|---|---|
| Water for domestic consumption | Daily availability of water by piped connection |
| Access to a secondary water source | |
| Water continuity in daily access to piped water | |
| Access to an improved water source | |
| Water for agricultural use | Access to irrigation water in all crops |
| Access to water infrastructure for animals |
| Dimension | Statistical Weight |
|---|---|
| Resources—Housing Materials | 18.0% |
| Resources—Monetizable Agricultural Capital | 4.4% |
| Resources—Monetisable Capital Home goods | 11.7% |
| Resources—Human capital | 8.7% |
| Opportunities and Choice | 24.0% |
| Power and Voice | 24.2% |
| Human Security | 9.1% |
| Total | 100% |
| Dimension | Dimension Weight (A) | Sub-Dimension | Sub-Dimension Weight (B) | Variable | Variable Statistical Weight (C) | Total Statistical Weight (A × B × C) |
|---|---|---|---|---|---|---|
| Resources | Could not be estimated * | House conditions—Materials upgraded | 18.0% | - | - | 18.0% |
| Monetizable resources—Agriculture | 4.4% | Land tenure ownership | 56.8% | 2.5% | ||
| Number of animals for livestock/poultry | 11.7% | 0.5% | ||||
| Number of crops | 31.5% | 1.4% | ||||
| Monetizable resources—capital goods | 11.7% | Number of appliances | 27.9% | 3.3% | ||
| Number of communication equipment | 36.0% | 4.2% | ||||
| Number of household furniture | 18.1% | 2.1% | ||||
| Number of means of transport | 18.1% | 2.1% | ||||
| Human capital | 8.7% | Number of years of schooling of the interviewed head of household | 41.8% | 3.6% | ||
| Access to complementary training of the interviewed head of household | 58.2% | 5.1% | ||||
| Opportunities and choice | 24.0% | Access to basic services | - | Access to bathroom or latrine | 23.8% | 5.7% |
| Access to garbage collection service | 21.3% | 5.1% | ||||
| Access to electricity | 25.2% | 6.1% | ||||
| Access to gas for kitchen | 29.7% | 7.1% | ||||
| Power and voice | 24.2% | Access to bathroom construction projects | - | - | - | 24.2% |
| Human security | 9.1% | Absence of natural disasters | 66.6% | Damage to agricultural production as a result of frosts | - | 6.0% |
| Absence of social conflicts | 33.4% | Absence of land conflicts in the community | 22.3% | 0.7% | ||
| Absence of land conflicts with other communities | 24.4% | 0.7% | ||||
| Absence of conflicts over mining in the community | 26.9% | 0.8% | ||||
| Absence of mining conflicts with other communities | 26.4% | 0.8% |
| Dimension | Statistical Weight Dimension (A) | Sub-Dimension | Statistical Weight Sub-Dimension (B) | Variable | Variable Statistical Weight (C) | Total Weight (A × B × C) |
|---|---|---|---|---|---|---|
| Resources | 56.6% | Monetizable resources | 24.6% | House ownership | 20.8% | 2.9% |
| Land tenure ownership | 13.4% | 1.9% | ||||
| Land size | 9.1% | 1.3% | ||||
| Number of appliances | 18.0% | 2.5% | ||||
| Number of communication equipment | 11.8% | 1.6% | ||||
| Number of household furniture | 13.0% | 1.8% | ||||
| Number of means of transport | 13.9% | 1.9% | ||||
| Human capital | 75.5% | Number of years of schooling of the interviewed head of household | 36.2% | 15.4% | ||
| Access to training complementary | 63.9% | 27.3% | ||||
| Opportunities and choice | 43.4% | Access to basic services | - | Access to bathroom | 39.2% | 17.0% |
| Access to sink, water, and soap | 60.8% | 26.4% | ||||
| Total | 100.0% | |||||
| Component | Variable | Statistical Weight |
|---|---|---|
| Water for domestic consumption | Daily availability of water by piped connection | 23.0% |
| Access to a secondary water source | 20.3% | |
| Continuity in access to daily piped water | 18.9% | |
| Access to an improved water source | 14.0% | |
| Water for agricultural use | Access to irrigation water in all crops | 16.5% |
| Access to water infrastructure for animals | 7.3% | |
| Total | 100.0% | |
| Variable | Model |
|---|---|
| House endowed by a mining company | 0.1429 *** (0.0201) |
| Existence of a water tank in the house | 0.1422 *** (0.0167) |
| Water Index | 0.1074 *** (0.0290) |
| Main income associated with mining | 0.0796 *** (0.0299) |
| Main income associated with livestock breeding | −0.0777 ** (0.0344) |
| Perception of the influence of water on the household livelihood | 0.0698 *** (0.0178) |
| Main income associated with commerce | 0.0688 *** (0.0243) |
| Lifelong resident to the municipality of Tupiza | 0.0621 *** (0.0215) |
| Main income associated with rents, bonds, or retirement | −0.0599 *** (0.0211) |
| Main income associated with agriculture | −0.0522 *** (0.0164) |
| Perception of income sufficiency | 0.0506 *** (0.0148) |
| Number of income sources for the household | −0.0503 *** (0.0130) |
| Perception of community relationship | 0.0372 *** (0.0141) |
| Water treatment before consuming | 0.0306 ** (0.0149) |
| Household size | 0.0070 ** (0.0029) |
| Constant | 0.1919 *** (0.0351) |
| Number of observations = 445 R-squared = 0.3815 Prob > F = 0.0000 |
| Variable | Model |
|---|---|
| Principal income associated with rents, bonuses and/or retirement | −0.1461 *** (0.0260) |
| No overcrowding | 0.1443 *** (0.0378) |
| Continuity in daily access to piped water | 0.1219 *** (0.0576) |
| Secondary water source | 0.0935 *** (0.0282) |
| Water treatment | 0.0884 *** (0.0362) |
| Perception of income sufficiency | 0.0810 ** (0.0257) |
| Investment to improve continuity in daily access to water in the home | 0.0756 *** (0.0370) |
| Main income associated with transportation | −0.0602 *** (0.0222) |
| Lifelong residence in the city of Tupiza | 0.0541 *** (0.0241) |
| Constant | 0.1063 *** (0.1039) |
| Number of observations = 187 R-squared = 0.2666 Prob > F = 0.0000 |
| Variable | Policy (Simulated Changes on Observed Variables) | Households that Reduce Their Poverty Level | Households That Move to Higher Poverty Quintile | ||
|---|---|---|---|---|---|
| n | % | n | % | ||
| Daily availability of water by a pipe connection | Households that do not have piped water upgrade to households with piped water but not on a daily basis | 130 | 29% | 16 | 4% |
| Households that have piped water but do not have it daily basis upgrade to households to have water on a daily basis | 106 | 24% | 13 | 3% | |
| Existence of a secondary source of water in the home | Households that do not have a secondary source of water upgrade to households that have a secondary source of water for domestic use | 194 | 43% | 35 | 8% |
| Water continuity (Number of hours the household has water on a daily basis) | Households that do not have piped water change to households that have piped water for less than 6 h a day | 130 | 29% | 35 | 8% |
| Households that have piped water for less than 6 h per day upgrade to households that have piped water between 6 and 11 h per day | 131 | 29% | 24 | 5% | |
| Households that have piped water for 6 to 11 h a day upgrade to households that have piped water between 12 to 17 h a day | 4 | 1% | 1 | 0% | |
| Households that have piped water for 12 to 17 h a day upgrade to households that have piped water between 18 to 23 h a day | 10 | 2% | 3 | 1% | |
| Households that have piped water for 18 to 23 h a day upgrade to households that have piped water 24 h a day | 11 | 2% | 1 | 0% | |
| Access to irrigation system in all crops | Households that do agriculture and do not have an irrigation system for all their crops upgrade to households that have irrigation systems for all their crops | 43 | 10% | 0 | 0% |
| Existence of an improved water source in the home | Households that do not have an improved water source upgrade to households that have an improved water source for domestic use | 56 | 12% | 7 | 2% |
| Existence of water troughs for animals | Households that breed livestock and do not have water troughs for their animals (fountains) upgrade to households that have water troughs for their animals | 148 | 33% | 5 | 1% |
| Existence of a water tank in the house | Households that do not have a water tank in their homes upgrade to households that have a water tank in their homes | 293 | 65% | 225 | 50% |
| The household does some water treatment before consuming it | Households that do not implement some type of water treatment before consuming it upgrade to households that apply some type of water treatment | 147 | 33% | 39 | 9% |
| Variable | Policy (Simulated Changes on Observed Variables) | Households That Reduce Their Poverty Level | Households That Move to Higher Poverty Quintile | ||
|---|---|---|---|---|---|
| n | % | n | % | ||
| Number of hours the household has water daily | Households that do not have piped water upgrade to households that have piped water for less than 6 h a day | 3 | 2% | 2 | 1% |
| Households that have piped water for less than 6 h per day upgrade to households that have piped water between 6 and 11 h per day | 10 | 5% | 2 | 1% | |
| Households that have piped water for 6 to 11 h a day upgrade to households that have piped water between 12 to 17 h a day | 7 | 4% | 2 | 1% | |
| Households that have piped water for 12 to 17 h a day upgrade to households that have piped water between 18 to 23 h a day | 7 | 4% | 1 | 1% | |
| Households that have piped water for 18 to 23 h a day upgrade to households that have piped water 24 h a day | 11 | 6% | 3 | 2% | |
| The household does some water treatment before consuming it | Households that do not implement some type of water treatment before consuming it upgrade to households that apply some type of water treatment | 24 | 13% | 15 | 8% |
Publisher’s Note: MDPI stays neutral with regard to jurisdictional claims in published maps and institutional affiliations. |
© 2022 by the authors. Licensee MDPI, Basel, Switzerland. This article is an open access article distributed under the terms and conditions of the Creative Commons Attribution (CC BY) license (https://creativecommons.org/licenses/by/4.0/).
Share and Cite
Espinoza, S.; Forni, L.; Lavado, A.; Olivera, M.; Tapia, C.; Vega, B.; Balderrama, M.; Escobar, M. Connecting Water Access with Multidimensional Poverty: The Case of Tupiza River Basin in Bolivia. Water 2022, 14, 2691. https://doi.org/10.3390/w14172691
Espinoza S, Forni L, Lavado A, Olivera M, Tapia C, Vega B, Balderrama M, Escobar M. Connecting Water Access with Multidimensional Poverty: The Case of Tupiza River Basin in Bolivia. Water. 2022; 14(17):2691. https://doi.org/10.3390/w14172691
Chicago/Turabian StyleEspinoza, Sophia, Laura Forni, Angela Lavado, Marcelo Olivera, Cecilia Tapia, Blanca Vega, Melina Balderrama, and Marisa Escobar. 2022. "Connecting Water Access with Multidimensional Poverty: The Case of Tupiza River Basin in Bolivia" Water 14, no. 17: 2691. https://doi.org/10.3390/w14172691