
Dynamic Change Characteristics of Soil Moisture and Its Relationship with Precipitation in Hani Rice Terraces Water Source Area

1
College of Ecology and Environment, Southwest Forestry University, Kunming 650224, China
2
Shaanxi Provincial Forestry Survey of Planning Institute, Xi’an 710082, China
*
Author to whom correspondence should be addressed.
Water 2022, 14(17), 2690; https://doi.org/10.3390/w14172690
Submission received: 1 July 2022
/
Revised: 24 August 2022
/
Accepted: 26 August 2022
/
Published: 30 August 2022
(This article belongs to the Section Ecohydrology)
Abstract
:Precipitation in the Hani Rice Terraces water source area is redistributed through the soil, providing a continuous water flow to the terraces downstream and keeping a healthy regional ecosystem. The dynamic characteristics of soil moisture and its relationship with precipitation need to be further investigated. In this study, we examined the dynamics of soil moisture content (SMC) in different site types (based on vegetation), at varying depths, and at varying time scales from 2012 to 2016, using time-series data. Fitting and fuzzy query methods were used to determine the greatest positive correlation between daily/accumulated precipitation and SMC. The results showed that: (1) the dynamic characteristics of soil moisture at depths between 0–100 cm substantially varied between three site types; (2) the relationship graphs of Pearson’s coefficient r between SMC and prior 0–360 day’s daily precipitation were sine curves in three site types; the daily precipitation in the half a year before the test day has a positive effect on SMC at 0–100 cm depth, and the 2–3 month’s daily precipitation has the greatest effect from the test day’s SMC; (3) the influence of daily precipitation on SMC is limited, while cumulative precipitation is the main factor affecting SMC; and (4) there is a linear relationship between accumulated precipitation and SMC. A linear equation was constructed using the strongest correlation and was used to predict SMC. These models are useful to assess the sustainability of the water supply to the terraces downstream, and also to provide a basic understanding of the effect of different sites (by vegetation type) on soil moisture. This study is of great significance for the protection and sustainable utilization of Hani Rice Terraces.
1. Introduction
Soil moisture, an important link between precipitation, surface water, groundwater and plant water in an ecosystem, is a key eco-hydrological variable in the soil-plant-atmosphere continuum (SPAC), and plays an important role in material transport and energy transfer [1,2,3]. Due to the influence of climate, topography, vegetation type, soil properties, soil depth and other factors, SMC exhibits temporal and spatial variability [4]. There are many methods for the determination of SMC. Traditional methods are either to conduct sampling at the test site and measure the samples in the laboratory or directly measure SMC in the field using equipment such as time domain reflectometry and frequency domain reflectometry. Recently, remote sensing technology (RST) has been applied to measure SMC [2,5,6,7].
It is well known that SMC could be impacted by meteorological factors (mainly precipitation), soil characteristics (porosity, bulk density, infiltration properties, etc.), vegetation status, and anthropogenic activities [8,9,10]. Many researchers have concluded that precipitation is the main factor affecting soil moisture and estimated the initial soil moisture based on the antecedent precipitation [11,12,13,14,15,16,17]. Estimation of soil moisture dynamics using precipitation data based on a linear stochastic partial differential equation [18] and the genetic algorithm Hidden Markov Model (HMMGA) [19] are favored by researchers because of their simplicity and applicability. However, linear stochastic partial differential equations only provide estimates of surface soil moisture in a relatively short term; the HMMGA can only predict weekly soil moisture based on precipitation and soil moisture history. Further spatial-temporal relationship between SMC and precipitation is worthy of a thorough investigation. In addition, soil moisture is of particular importance to vegetation restoration and the evaluation of vegetation sustainability in arid and semi-arid regions. Thus, the relationship between soil moisture and precipitation has been studied mainly in arid and semi-arid regions [3,20,21,22,23]. Soil moisture in such areas is generally in a sub-healthy or unhealthy state due to inadequate rainfall, drought, poor soil water retention, and vegetation consumption. Therefore, it is necessary to further quantify the relationship between soil moisture and precipitation in a virtuous circular ecosystem.
Hani Rice Terraces (HRT) are a benign agricultural ecosystem and a model of the world’s artificial wetland ecosystem. Hydrogen and oxygen isotope measurements revealed that rainfall and groundwater in the Hani terraces were the main sources of water throughout the rice-growing season, while groundwater was the main source after the end of the rainy season [24,25]. Hydrogen and oxygen isotope measurements of soil water in three types of woodlands in the water source area of the Hani terraces revealed that rainfall was the source of soil water recharge, and the possibility of soil water recharge to shallow groundwater in the water source area of the Hani terraces was higher [26]. This study aimed to investigate the dynamic characteristics of SMC and its relationship with precipitation in the HRT water source area to understand the sustainability of HRT water sources over the past thousands of years. The effects of daily and accumulated precipitation on SMC at different depths and sites were analyzed. We investigated the dynamics of soil moisture in different types of sites (arbors forest land, bush land, and weed land), at different soil depths (0–10, 10–20, 20–30, 30–40, 40–60, 60–100 cm), and time scales (daily, monthly, seasonally, and annually from 2012 to 2016) in the HRT water source area. We used Pearson correlation to analyze the relationship between the precipitation and SMC of soil layer at different depths of each site using time series analyses. Through big data analysis, the correlation coefficient was obtained, which represented the degree of influence of daily precipitation and accumulated precipitation on SMC. Fitting and fuzzy query methods were used to determine the highest positive correlation of daily precipitation and accumulated precipitation with SMC. By identifying the current health status and development trends of the HRT ecosystem, this study may provide some scientific basis for its sustainable development and protection.
2. Methodology
2.1. Study Area
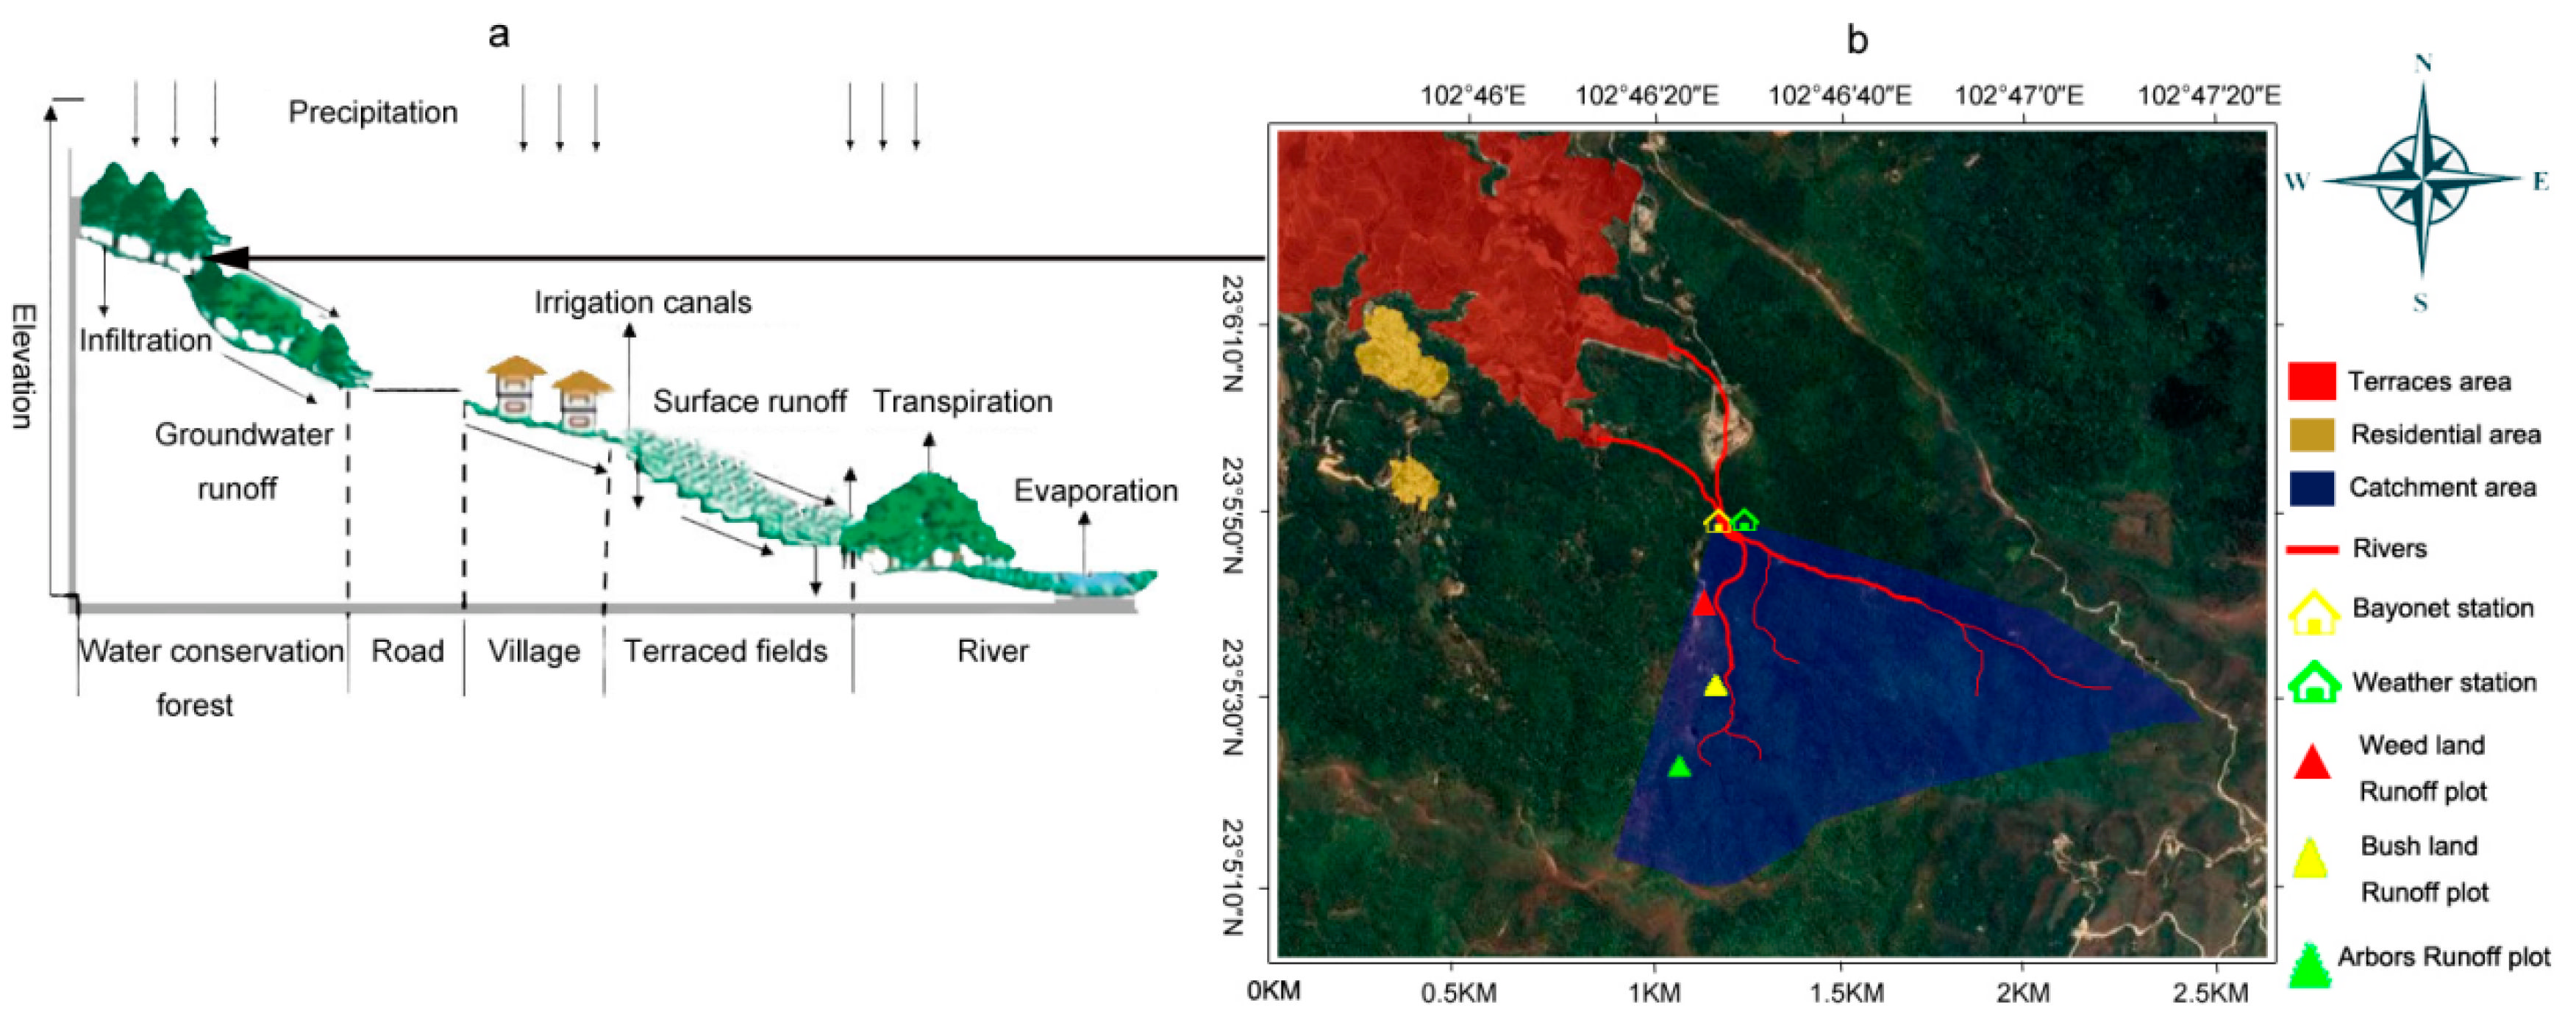
The Hani Rice Terraces, a kind of man-made agricultural ecosystem that has existed for over a millennium, are mainly in Yuanyang, Lvchun, Honghe, and Jinping counties in the southern Ailao Mountains of Yunnan Province, China. It was listed as a World Cultural Heritage site under UNESCO in 2003 and after that, has received much attention. These terraces are created and sustained by utilizing local natural and geographical conditions, and relying on the experience and intelligence of the local population. The landscape of the HRT presents a four-element isomorphism of “Forest-Village-Terrace-River” [27] (Figure 1a). Natural precipitation is regulated and redistributed by vegetation, such as forests, with a proportion of the precipitation moving directly into surface runoff, and a portion contributing to the groundwater through infiltration. Along the gullies, runoff, and groundwater flow through the village, into the terraced fields, where water flows down one piece of the terraced fields to another, from top to bottom, and finally into a river. Due to the hot climate conditions, the water evaporates, and this water vapor condenses into fog after ascending to a certain height. With the increase of altitude and a change as the climate, clouds and mist form, which leads to rain, which falls back into the forest, starting the next hydrological cycle.
The study area is located in the forest of Quanfuzhuang Watershed (Figure 1b), with an area of 0.78 km2, which belongs to Honghe Hani and Yi Autonomous Prefecture in South Yunnan (23°5′10″ N–23°5′50″ N and 102°46′20″ E–102°47′20″ E), China. The elevation ranges from 1948 m to 2020 m, while the terraces are distributed below 1900 m, and evergreen broad-leaved forests are distributed from 1970 m to 2020 m. In this area, the climate is dominated by the southwest Asian monsoon weather, with a well-defined contrast between wet (May to October) and dry (November to next April) seasons. The annual mean temperature is 16.6 °C. Mean annual precipitation is approximately 1398 mm, with about 78% of this precipitation occurring during the wet season. The springs are visible throughout the area. The average annual sunshine is 1550 hands the relative humidity is 85%. The soil in the study area is mainly yellow-brown soil with a thickness of approximately 100 cm.
2.2. Data Collection
The runoff and precipitation were measured at the gauging stations and weather station in the watershed (Figure 1b). Three 5 m × 20 m standard runoff plots, which includes forest land (102°46′11.5″ E, 23°5′37.4″ N), bush land (102°46′17.6″ E, 23°5′45.5″ N), and weed land (102°46′16.7″ E, 23°5′53.2″ N) (Figure 1b), were arranged in the water source area of the Quanfuzhuang watershed. Cylindrical waterproof casings with the length of 1 m were embedded in the upper, middle, and lower parts of each standard plot, respectively. The soil moisture meter ML2X was inserted into cylindrical casings to monitor soil volumetric moisture content at different soil depths (10, 20, 30, 40, 60, 100 cm) every day at 8:00 a.m. and 6:00 p.m. from 2012 to 2016. A total of 654-day data on SMC was collected. Furthermore, 698 precipitation event samples were collected during the five-year research period from 1 January 2012 to 31 December 2016 from the Xingjie weather station in Yuanyang County.
2.3. Methods
Soil volumetric moisture content is the ratio of soil water volume to soil volume:
where θv is soil volumetric moisture content, Vw is water volume, and Vs. is soil volume.
θv = (Vw/Vs) × 100%
Soil water storage in different soil depths of forest, bush, and weed dominated land were calculated by using the soil volumetric moisture observation data. This formula is given as:
where W is the soil water storage capacity (mm), θv is soil volumetric moisture (%), and h is soil thickness (cm).
W = θv × h × 10/100
The coefficient of variation is an important index of SMC change and is expressed as:
where C·V is the coefficient of variation, SD is the standard deviation of SMC, and Mean is the average of SMC.
C·V = (SD/Mean) × 100%
The Pearson correlation coefficient is a measure of the degree of linear correlation between two variables and is given by the following equal:
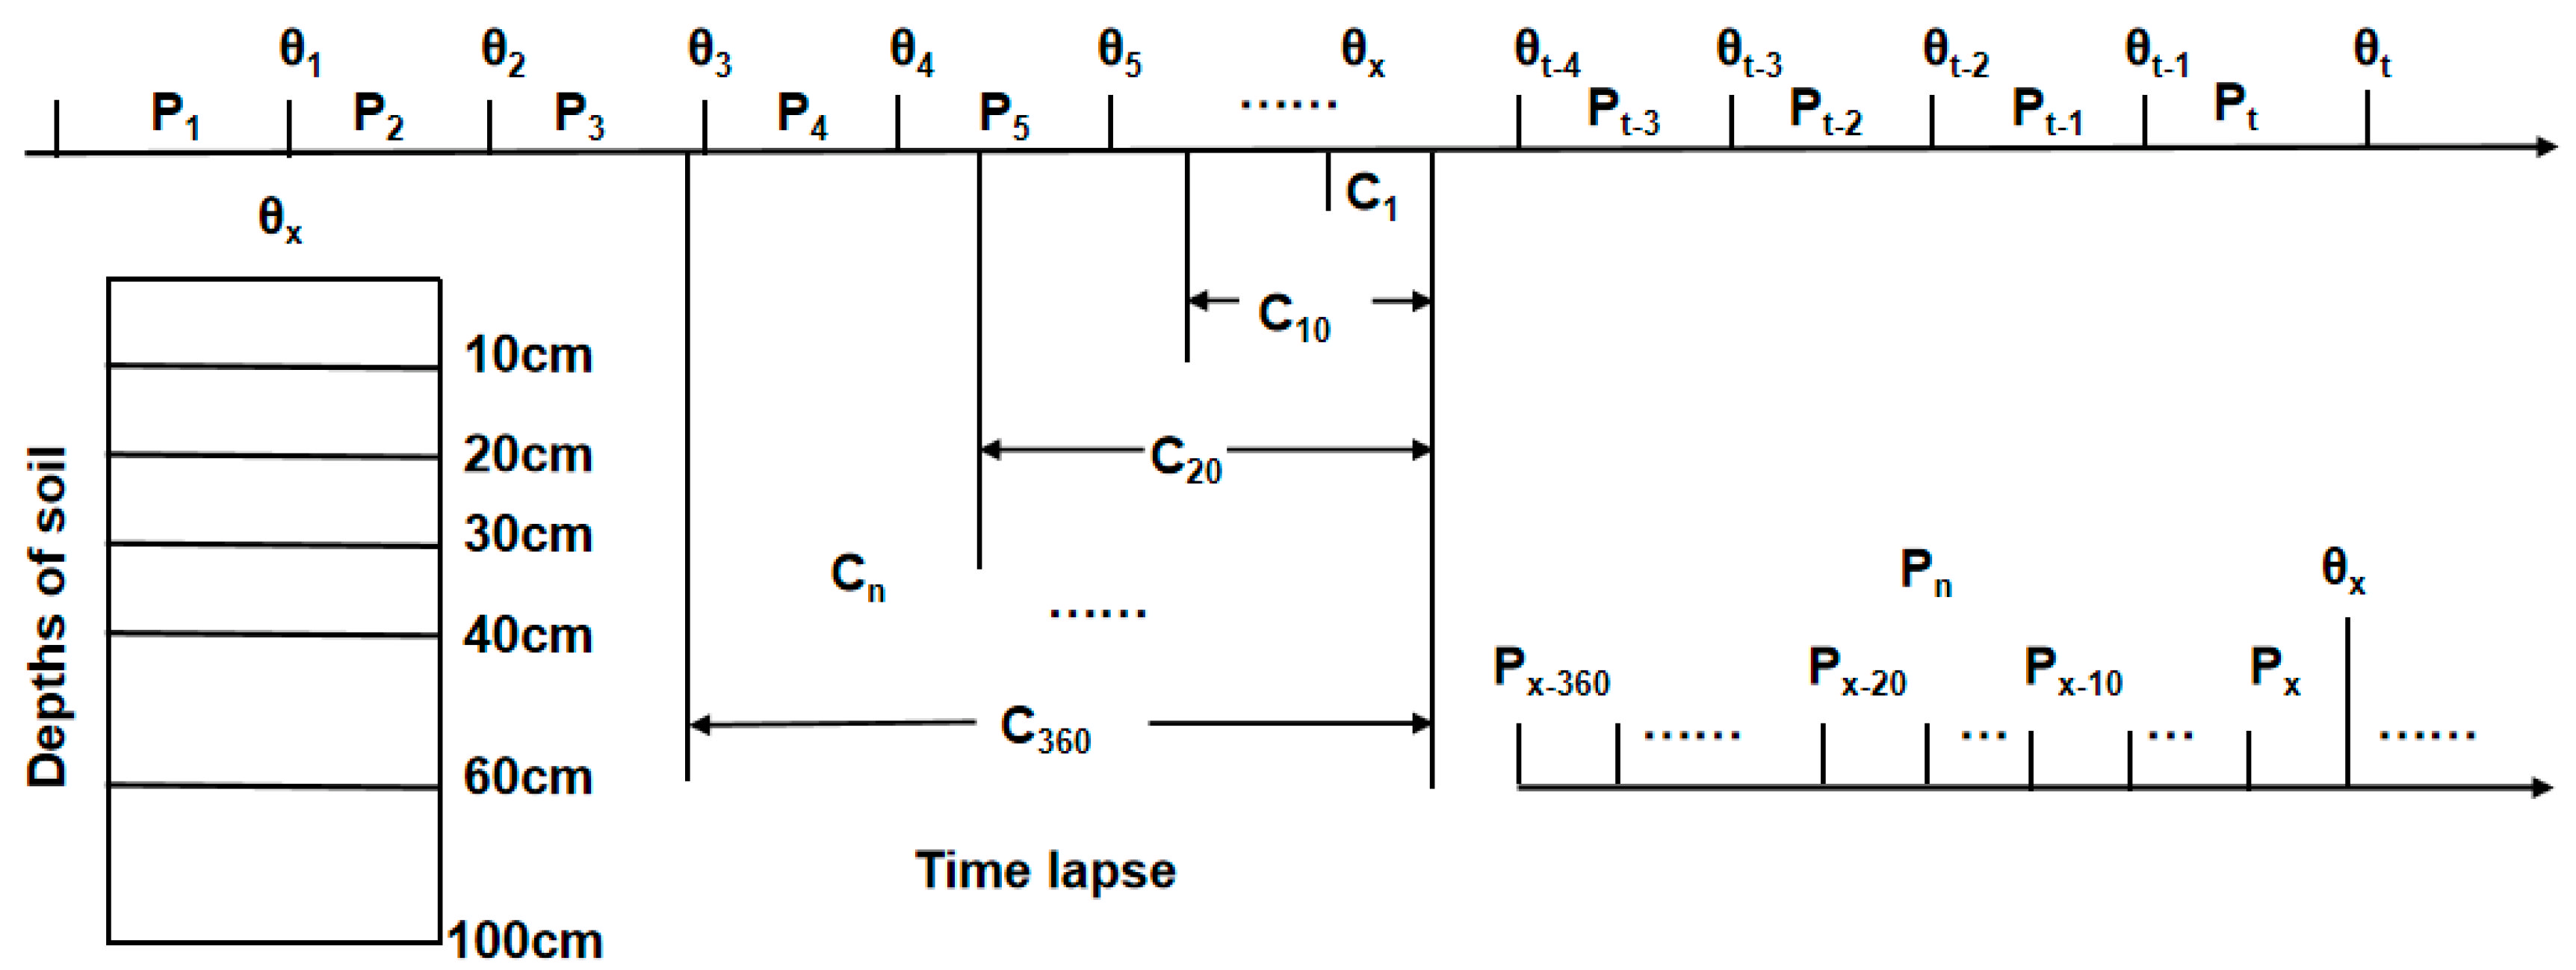
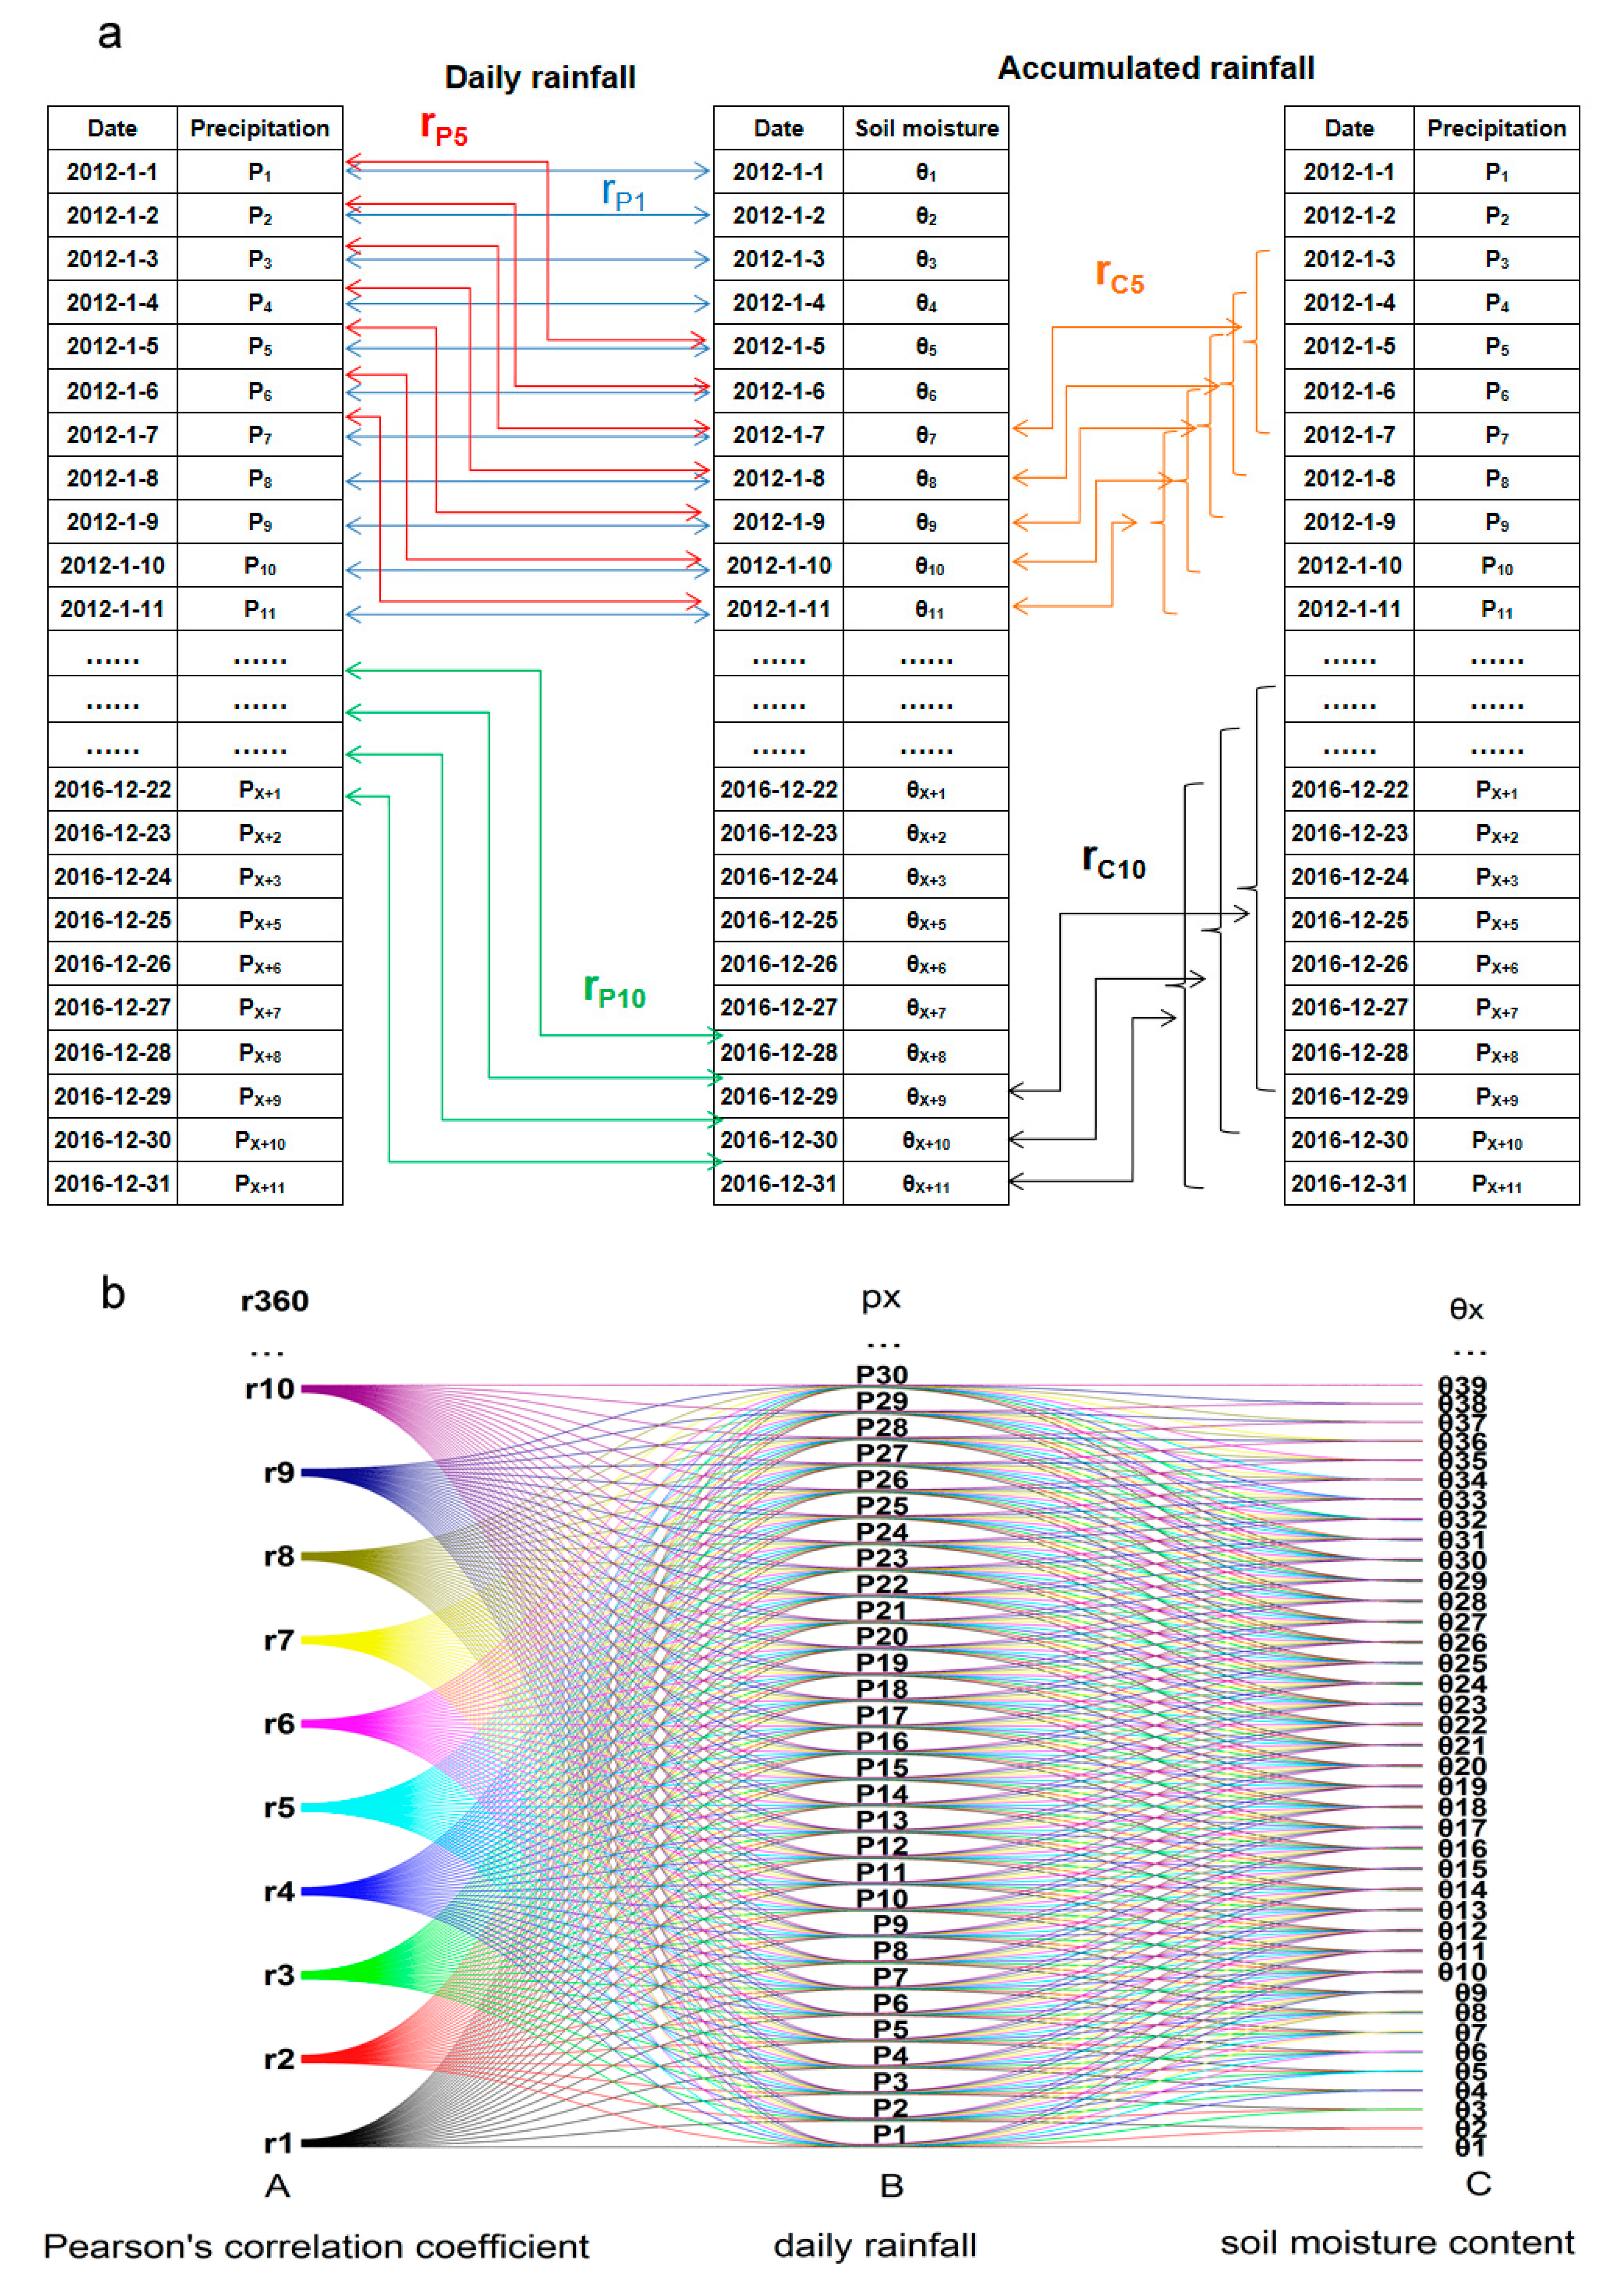
In this study, we measured daily SMC (θx) at different depths (10, 20, 30, 40, 60, and 100 cm) in three typical land types (forest, bush, and weed) from 2012 to 2016. From this data, a time series of SMC and precipitation was created (Figure 2). Equation (4) was used to analyze the correlation coefficient r between θx-Pn or θx-Cn in statistical software. In order to study how precipitation affects SMC at different sites, we performed a big data analysis of all daily SMC measurements and the daily precipitation for the 360 days prior to the test date. As shown in Figure 3, we calculated Pearson’s coefficient r between the test day’s SMC and the daily precipitation of before the test day, and again every ten days up to 360 days before the test day (rP10, rP20, rP30, rP40, rP50,..., rP360). Using the same method, we calculated Pearson’s coefficient r between the test day’s SMC and the cumulative precipitation of before the test day, and every ten days up to 360 days before the test day (rc10, rc20, rc30, rc40, rc50,..., rc360).
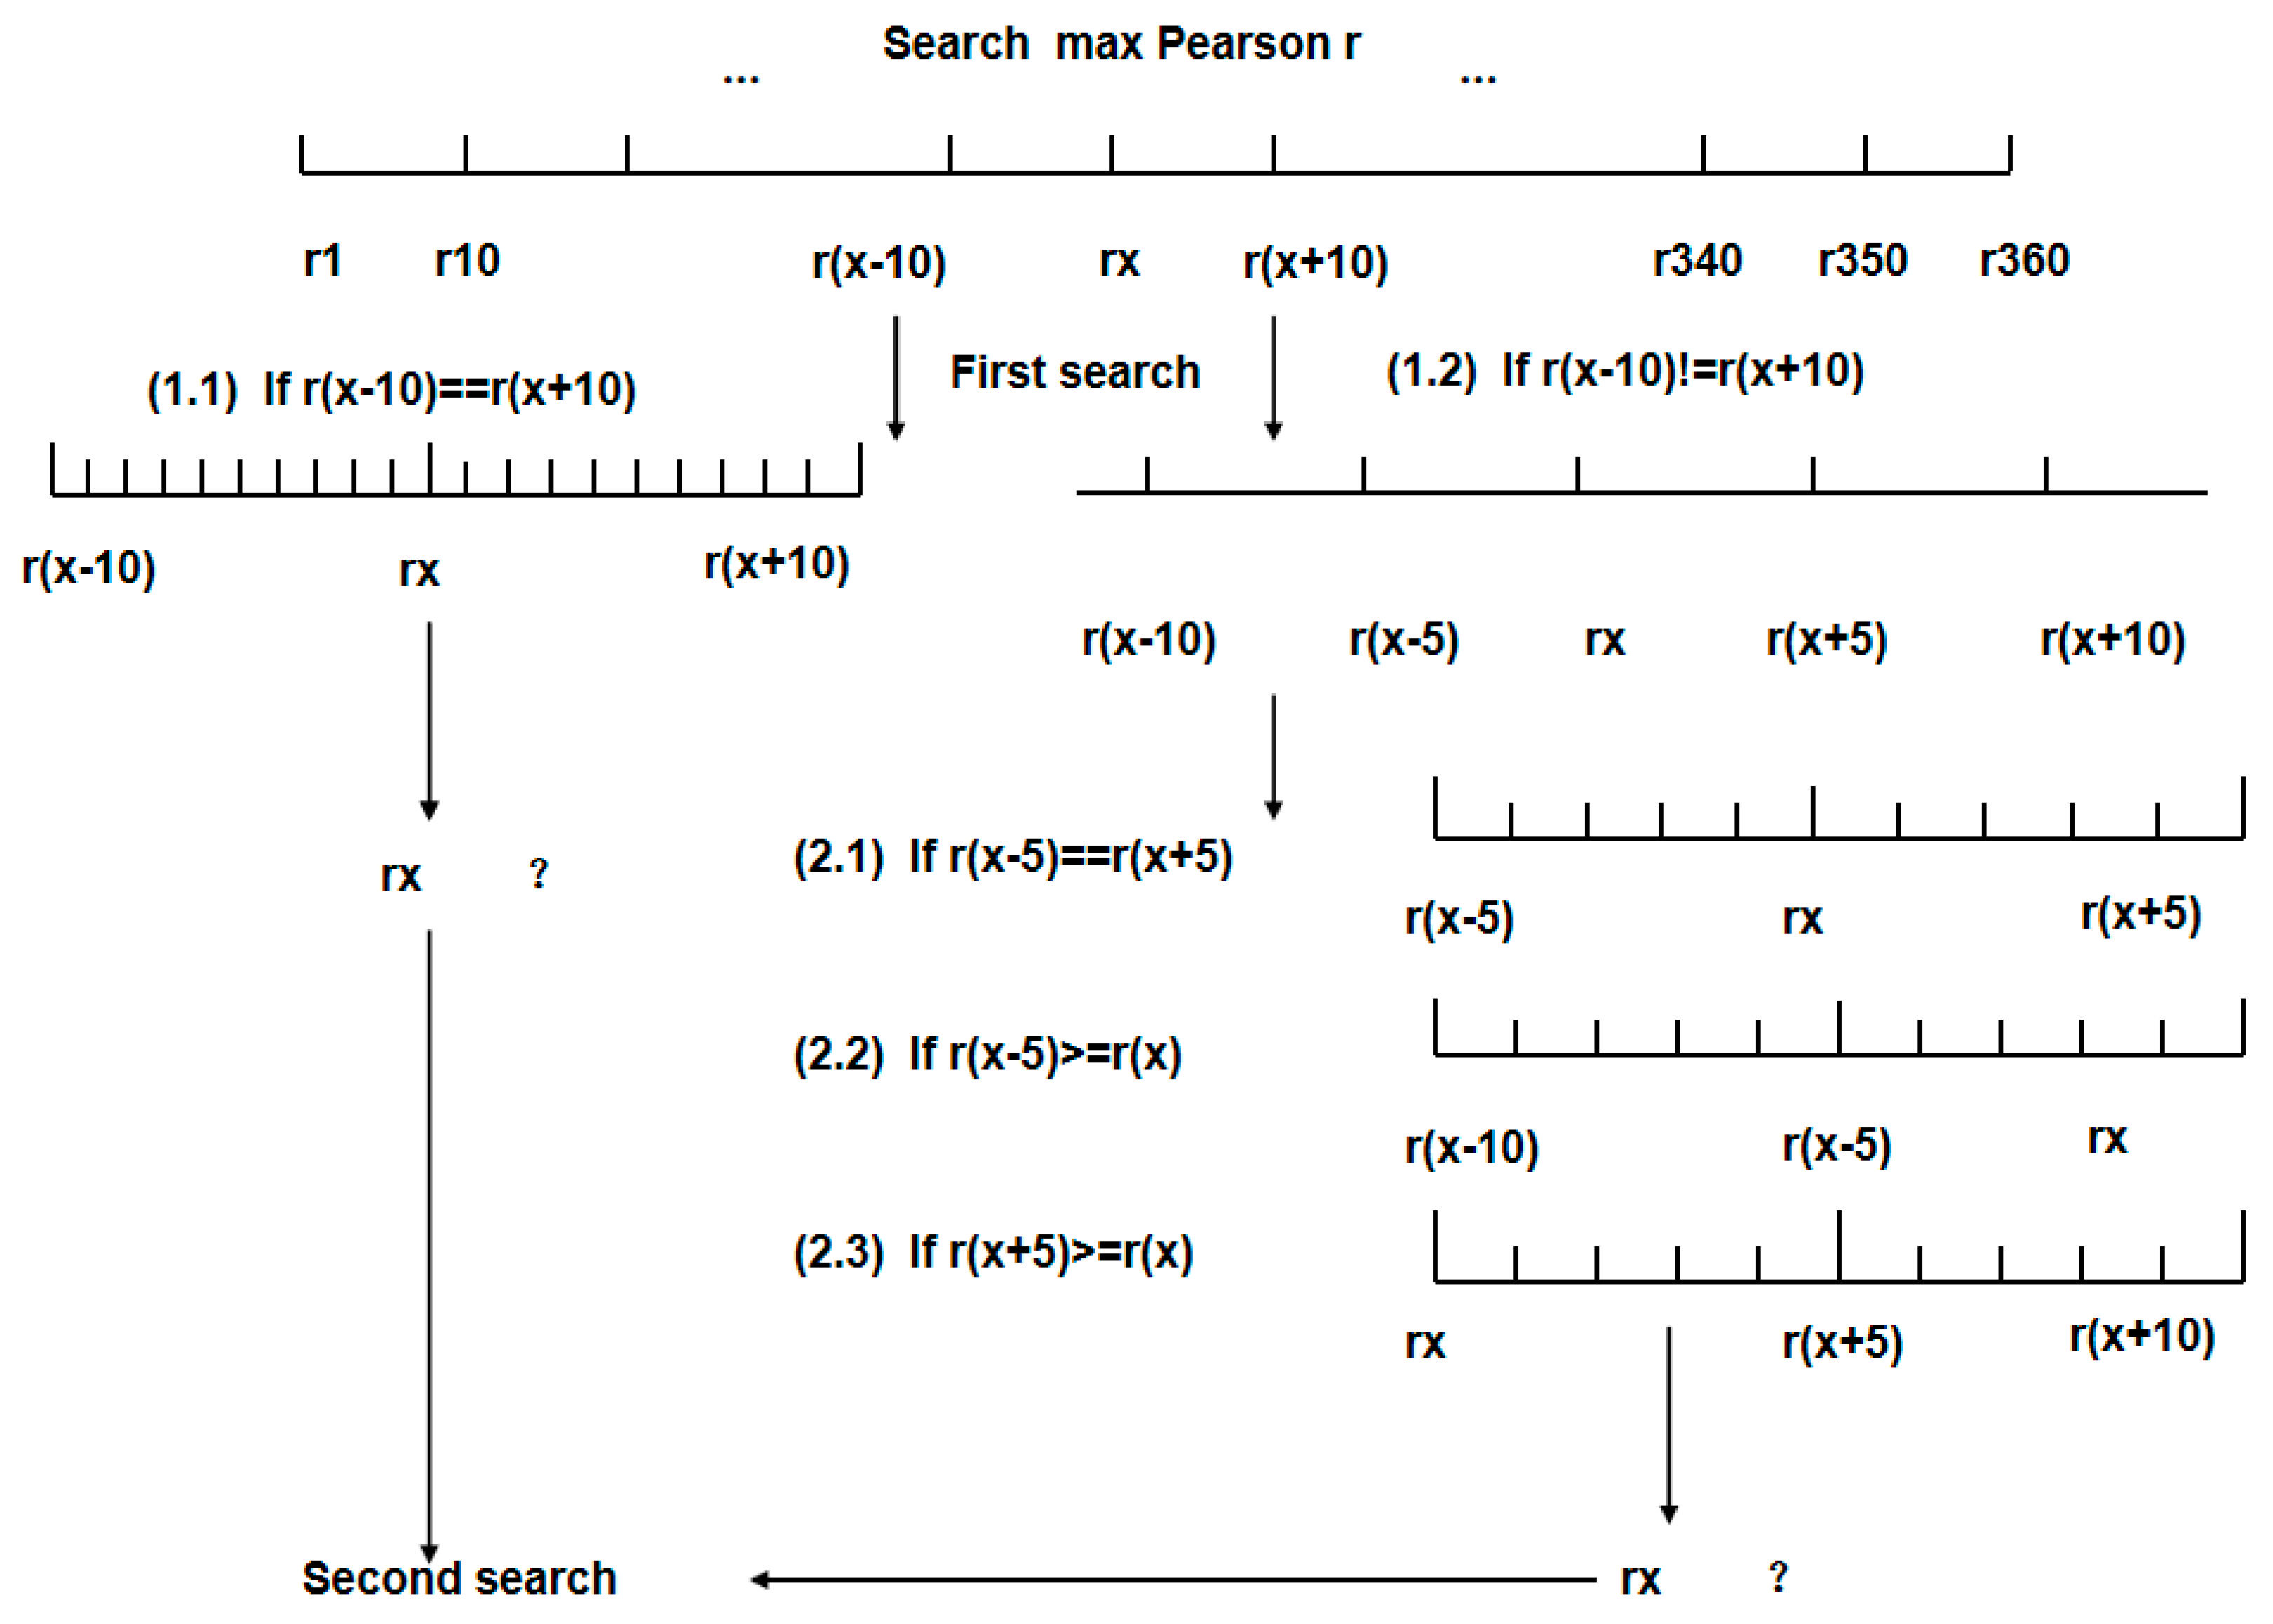
To improve computational efficiency, we used the fuzzy query method to find the most relevant date between cumulative precipitation and SMC (Figure 4). First, the Pearson’s correlation coefficient r between the cumulative precipitation and the SMC was calculated every ten days before the test day, such as r1, r10, r20, r30,..., r360. Secondly, the fuzzy query method was used to find the greatest value of the Pearson’s correlation coefficient r as the first search. For example, rx is the maximum value in r1, r10, r20, r30,..., r360 in Figure 4. Then, if r(x − 10) equal to r(x + 10), we use the method of (1.1) to list r(x − 10), r(x − 9), r(x − 8),..., r(x + 10), and find out the maximum rx in them; if r(x − 10) is unequal to r(x + 10), we use the method of (1.2) to liste r(x − 10), r(x − 5), rx, r(x + 5), and r(x + 10), and use the method of (2.1, 2.2, 2.3) to find out the maximum rx in them.
3. Results
3.1. Monthly Variations of Precipitation and Runoff
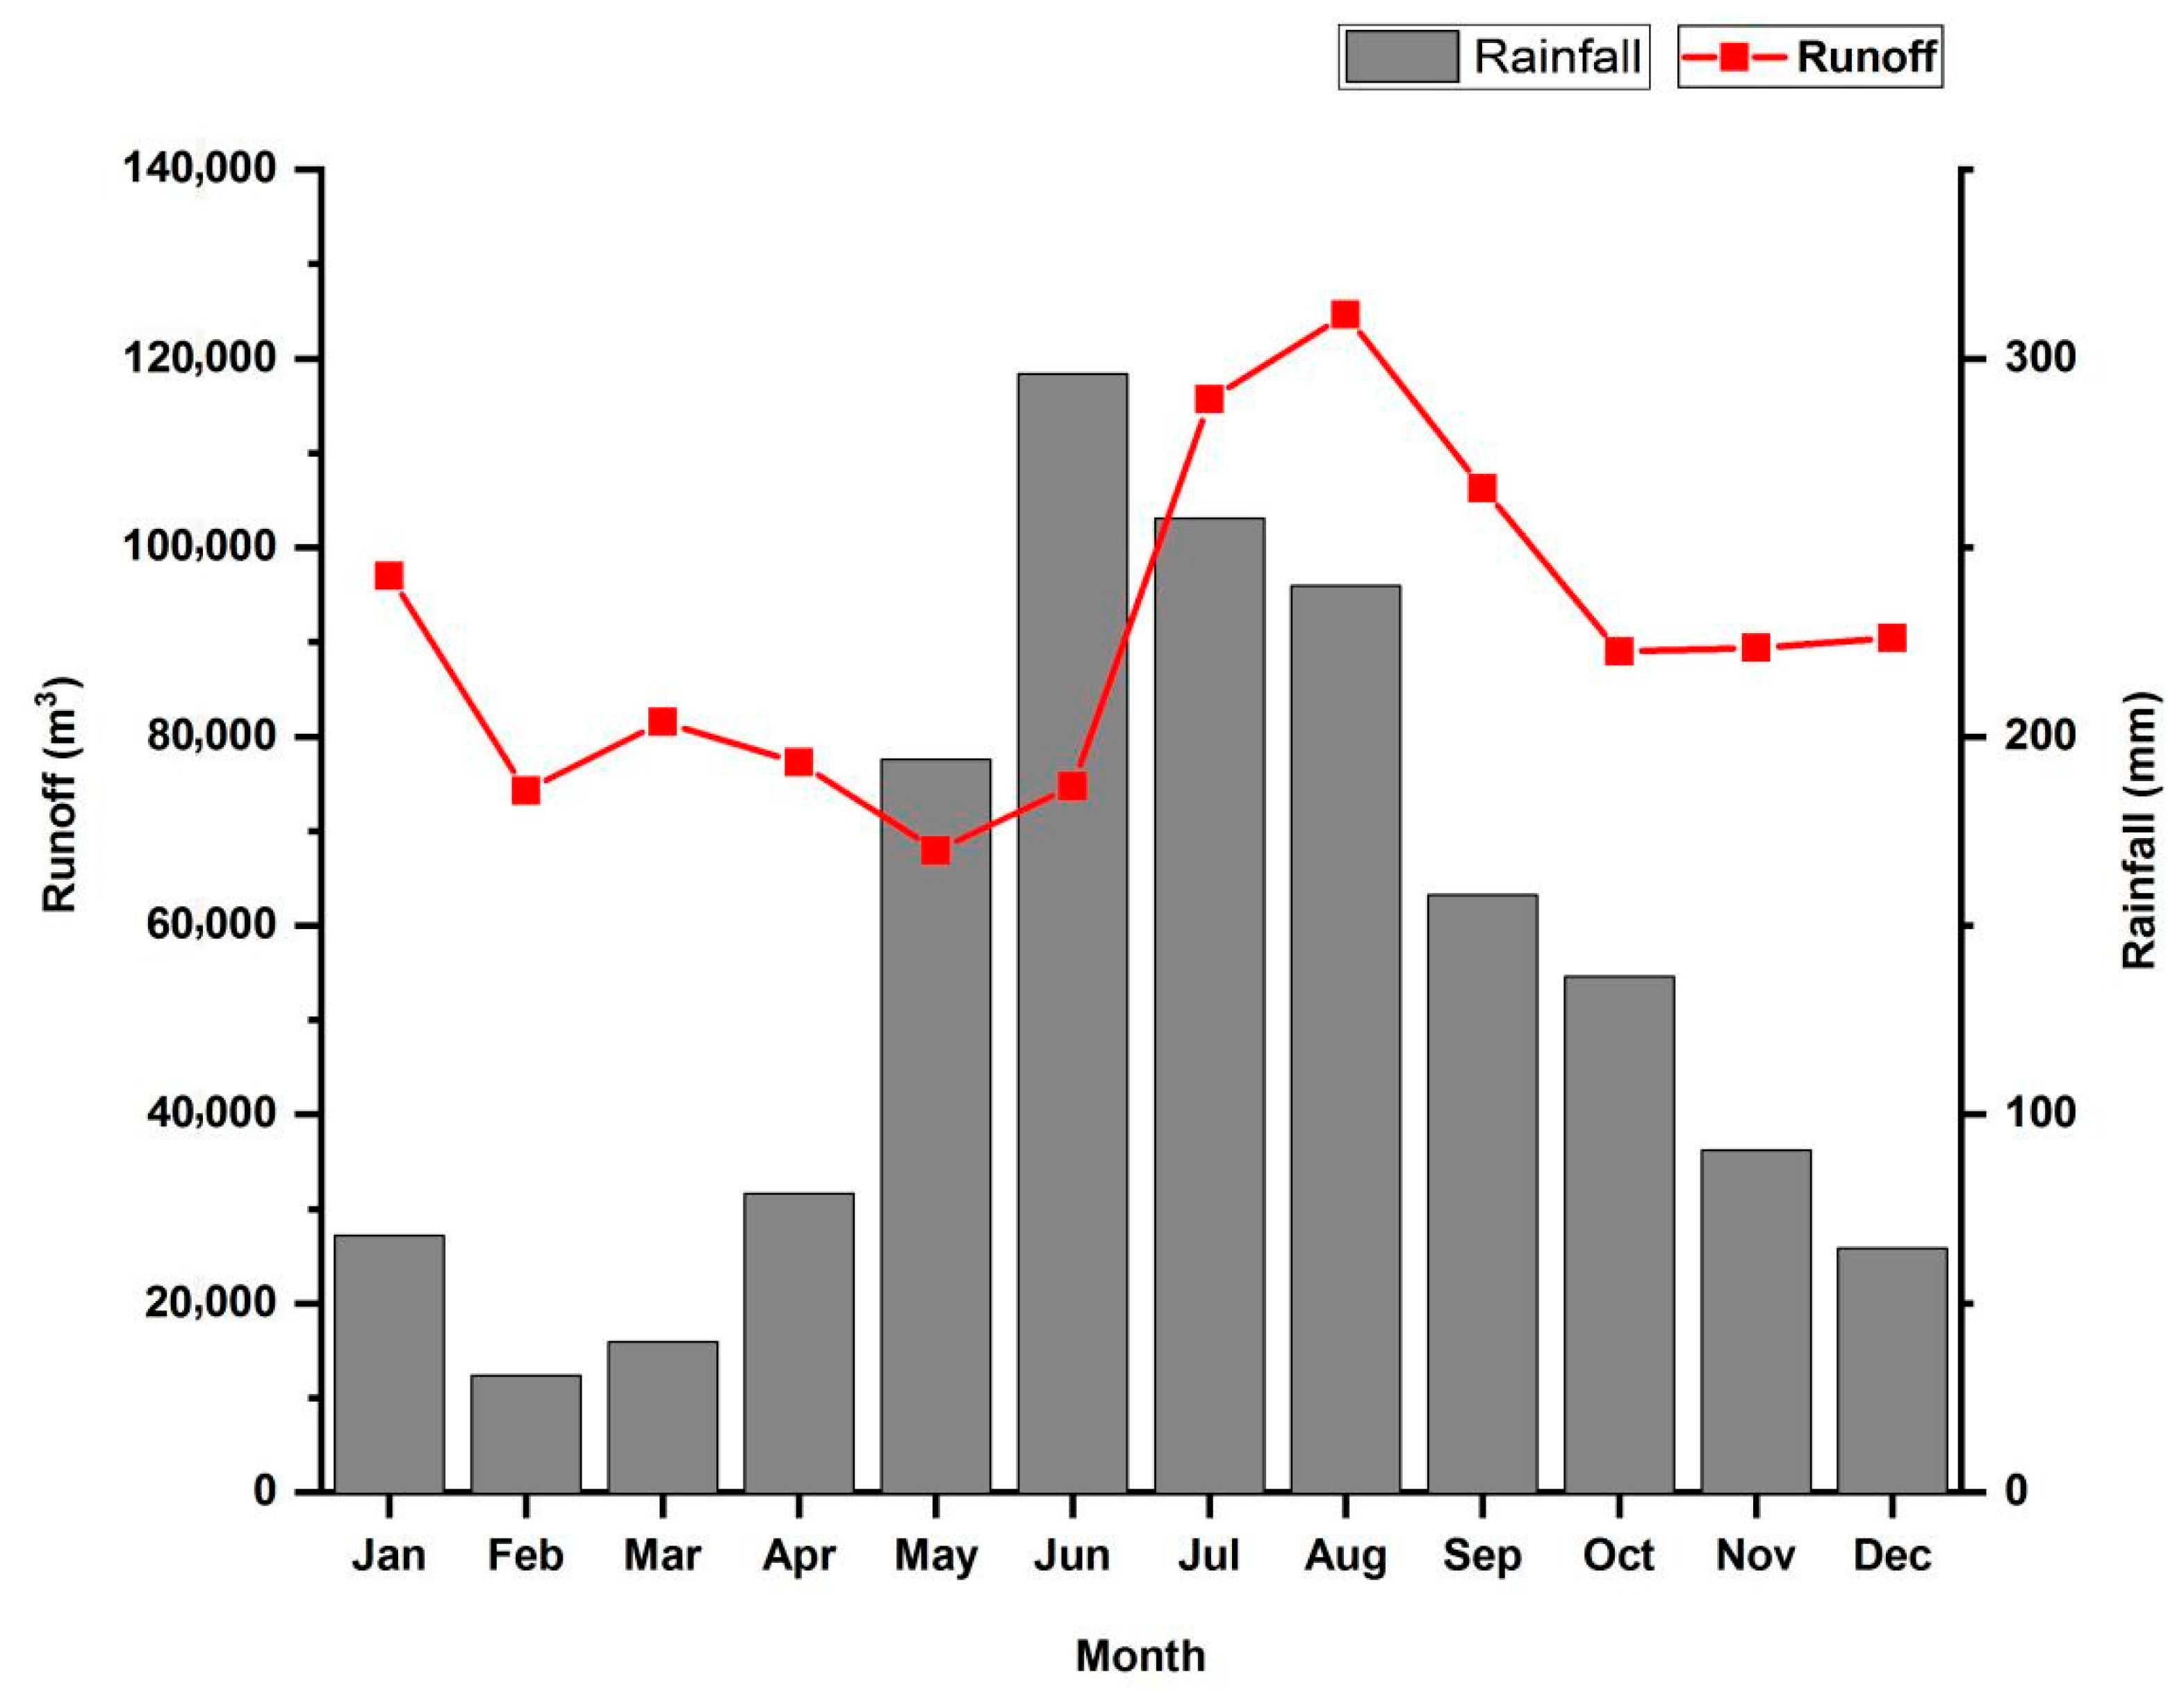
There were obvious rainy and dry seasons in the HRT area (Figure 5). Rainy days and dry days accounted for 62% and 38%, respectively, during the study period. Days with light and moderate rain accounted for about 85% of the total precipitation days. As shown in Figure 5, average monthly precipitation reaches its maximum in June, but the highest runoff occurs in August, with maximum runoff occurring two months later than maximum precipitation. The average monthly precipitation reaches its minimum in February, but the minimum runoff occurs in May, and the minimum runoff are three months later than the minimum precipitation. Scilicet, the minimum runoff lagged behind the minimum precipitation by 3 months. The facts indicated that the groundwater/soil moisture probably played an important role in the regulation of runoff.
3.2. The Dynamic Characteristics of soil Moisture
The dynamic characteristics of SMC in the 0–100 cm soil depth layers in three site types were presented as follows:
- (1)
- On the daily scale: SMC of each layer was different in the 0–100 cm depth of layers in three site types: The highest SMC in arbors forest land occurred at 100 cm, but the highest SMC for both bush and weed land occurred at 20 cm; the lowest SMC occurred at 10 cm in arbors forest land, at 100 cm in bush land, and at 40 cm in weed land.
- (2)
- On the monthly scale (Figure 6): The SMC of the forest land increased with depth within the 0–100 cm depth range, and reached the maximum value between 60–100 cm, which indicated that the root system of the forest land was deeper than that of bush land. Compared with that of weed and bush land, forest land had stronger water and soil retention in the 60–100 cm soil depth layer. The SMC was almost the same in three different site types in the range of 40–60 cm. The greatest value of soil water retention occurred in bush land and weed land in the range of 20–30 cm and 0–20 cm, respectively.
- (3)
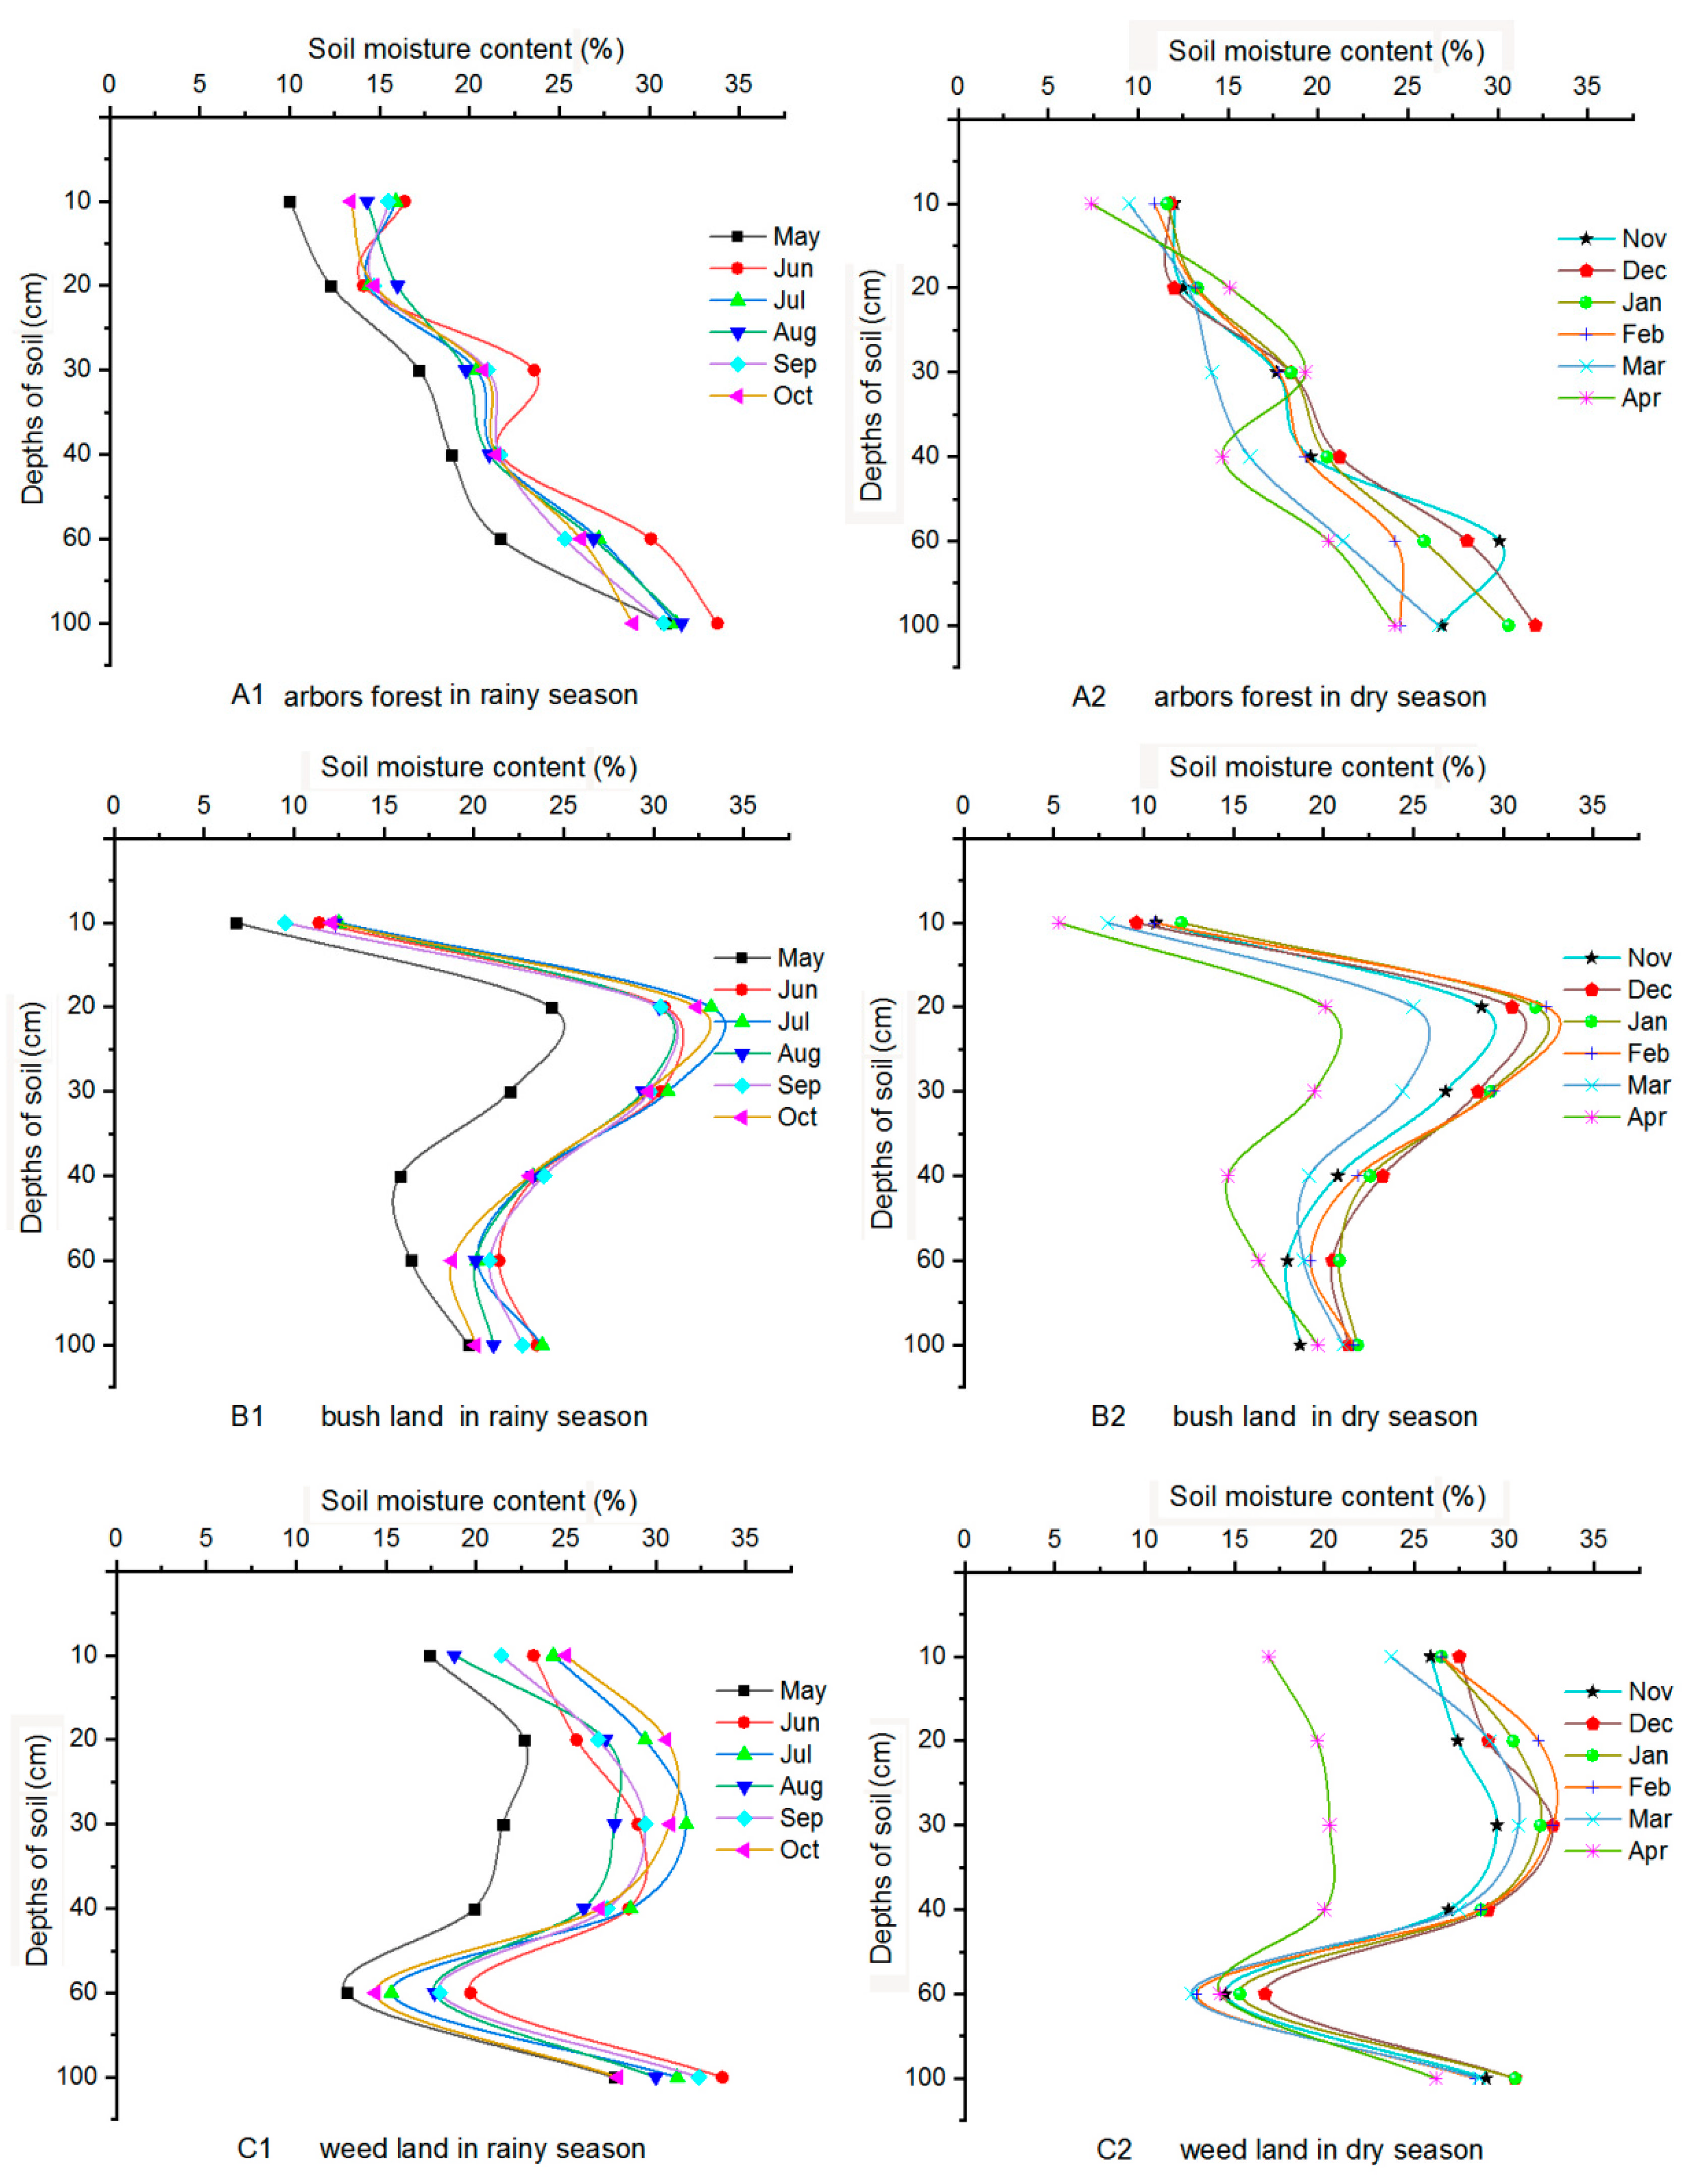
- On the seasonal scale (Figure 7): There were significant differences in SMC among the three different site types. The SMC in arbors forest land appeared as a linear curve in the rainy and dry seasons. The SMC also increases as the depth increases. The SMC curves of bush land in the rainy and dry seasons were waveform in shallow soil layers and linear in deep soil layers. The SMC increased with soil depth and reached the maximum value at 20 cm, then gradually decreased to the minimum value at 40 cm. SMC tended to be stable at 40 cm to 100 cm. The SMC curves of weed land showed a circular shape from 10 cm to 60 cm and linearly increased after reaching the minimum value at 60 cm.
- (4)
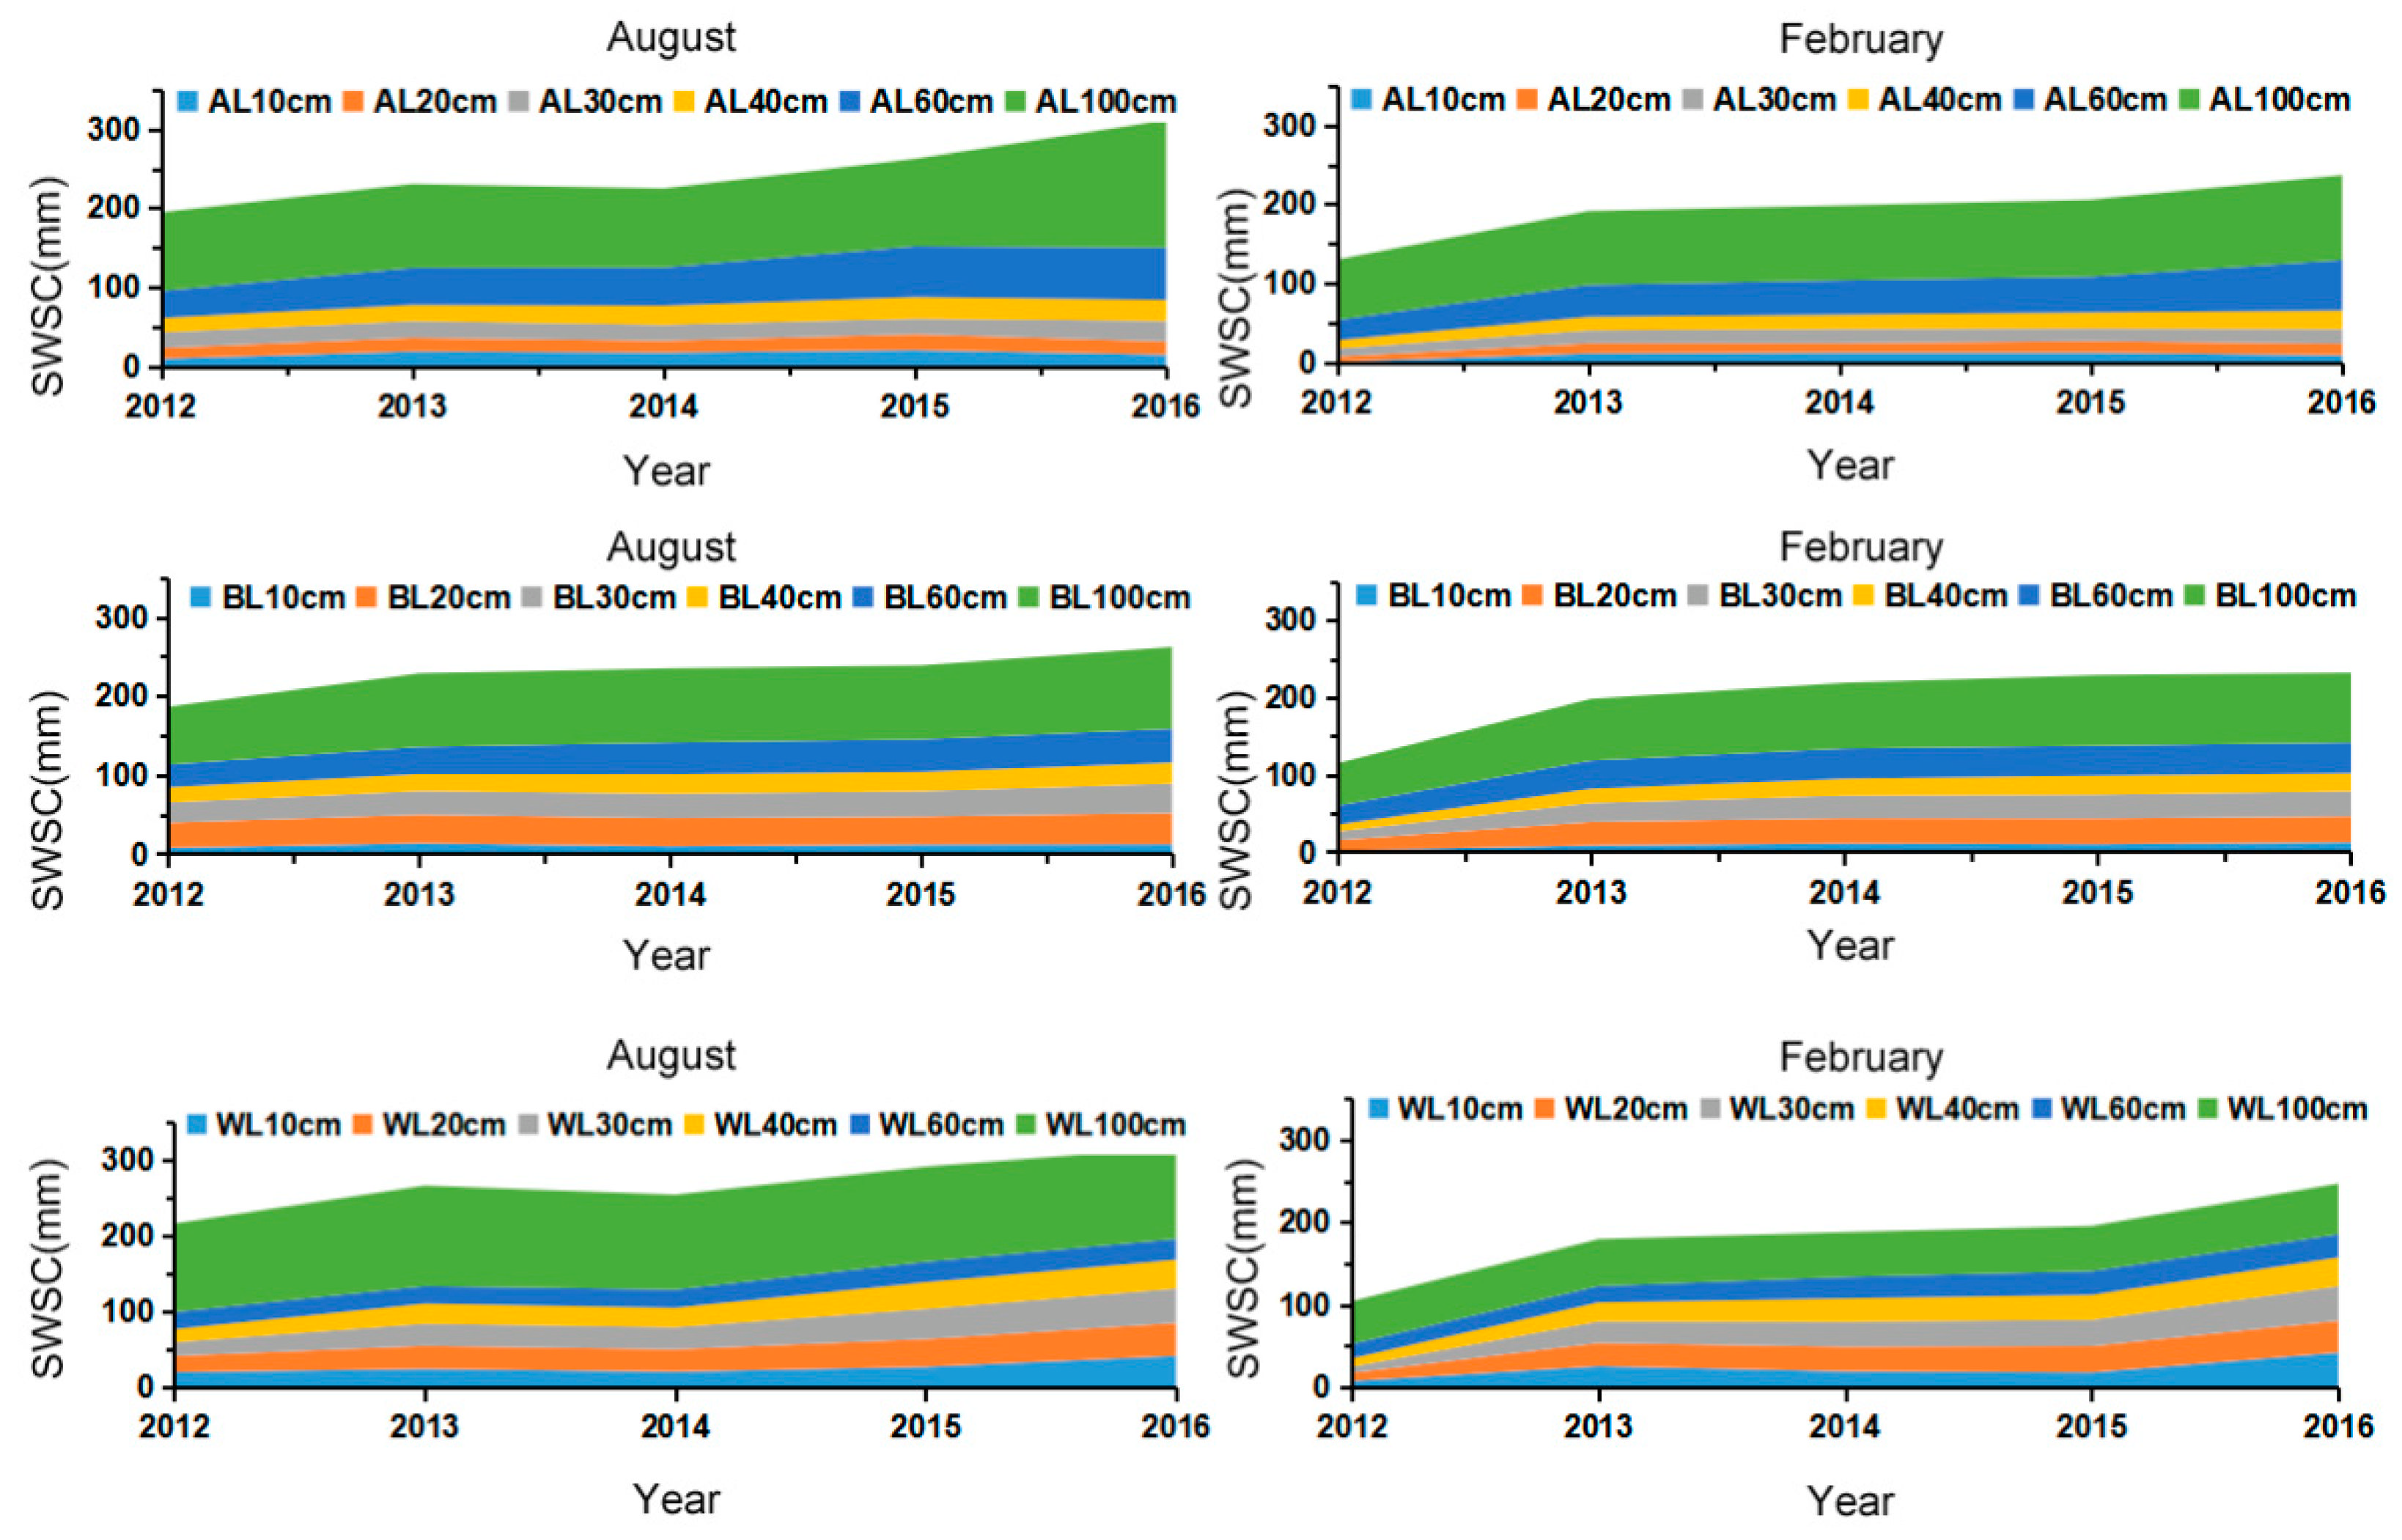
- On the annual scales (Figure 8): Soil water storage for all three stand types showed a steady increase over the five-year study period. The soil water storage in each layer of bush land was most stable. The boundary of them were clear and showed the mildest variation. The soil water storage was showed the greatest change in each layer of weed land. The weed land stored the most water in August, but the least in February. With increasing soil depth, the water storage capacity of arbors forest land becomes stronger.
3.3. The Relationship between Daily Precipitation and Soil Moisture Content
We used the previous methods as mentioned in Figure 2, Figure 3, and Equation (4) to calculate Pearson’s correlation coefficients between SMC of each layer and daily precipitation at different times in the arbors forest land. According to the quantified results at each soil depth, the weighted calculation was carried out according to the corresponding proportion of different depths. The Pearson coefficient between SMC in soil depth of 0–100 cm and daily precipitation at different times could be calculated (Table 1), and the detailed method is shown in the table note. In shrub/weed land, the Pearson correlation coefficients between SMC in the 0–100 cm soil depth layers and daily precipitation were calculated using the same method.
A scatter plot analysis was performed on Pearson’s correlation coefficient and the soil depth of 0–100 cm for three site types. Sine function fitting was performed to obtain date model diagrams of Pearson’s coefficient of daily precipitation and SMC for the three site types (Figure 9). The Pearson’s correlation coefficient never exceeded 0.2 in the three site types. Simulations indicate that daily precipitation has a limited effect on SMC. The correlations between daily precipitation and SMC were differences among the three different site types and it is ordered as follows: arbors forest land > weed land > bushland. The duration days of positive correlation between daily precipitation and SMC in forest, bush, and weed land are160 days, 185 days, and 190 days, respectively, before the test day. The dates with the highest positive correlation in forest, bush, and weed land are day 58, day 74, and day 82, respectively, before the test day.
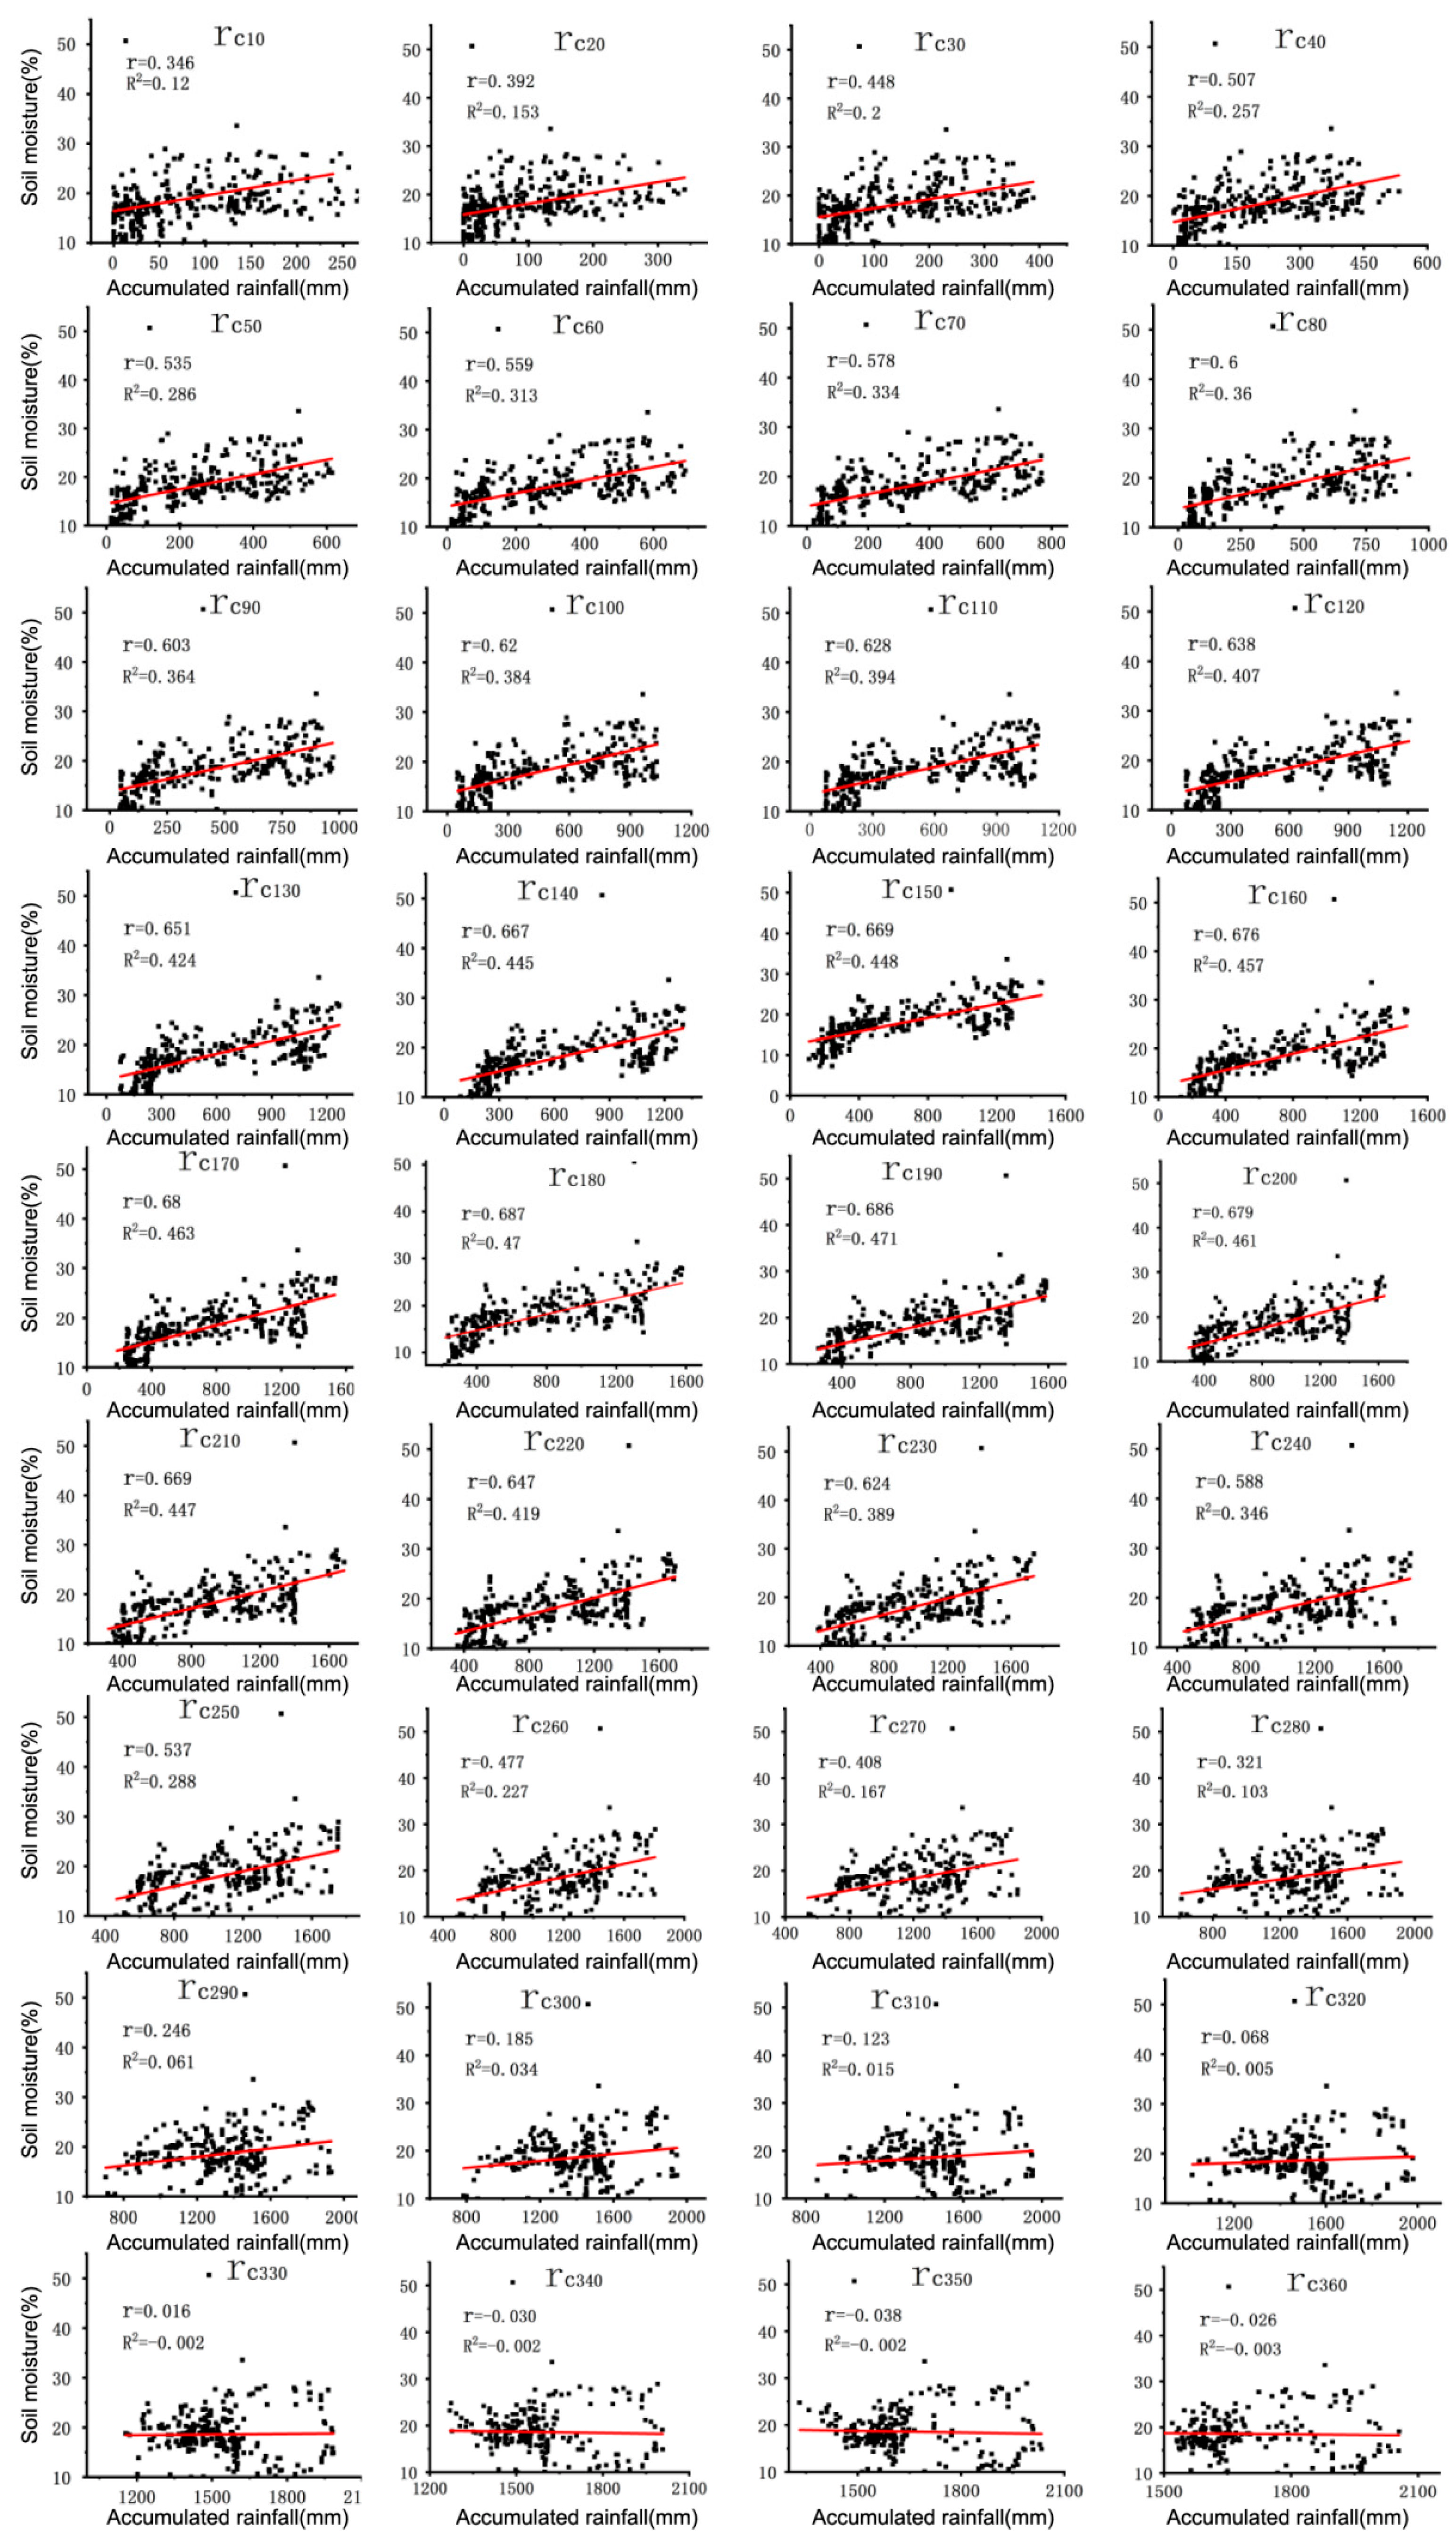
3.4. The Relationship between Accumulated Precipitation and Soil Moisture
Daily precipitation has slow and limited impact on SMC (Figure 9). Water previously stored in the soil and freshly infiltrated water forms new soil water. Therefore, it has more practical significance to study the influence of accumulated precipitation on SMC than daily precipitation. We studied the relationship between SMC and cumulative precipitation by taking 40 cm in arbors forest land for example. The results indicate that there is a linear relationship between accumulated precipitation and SMC (Figure 10). This linear correlation gradually increased from 0.35 at 10 days to a peak of 0.68 at 180 days and then gradually decreased.
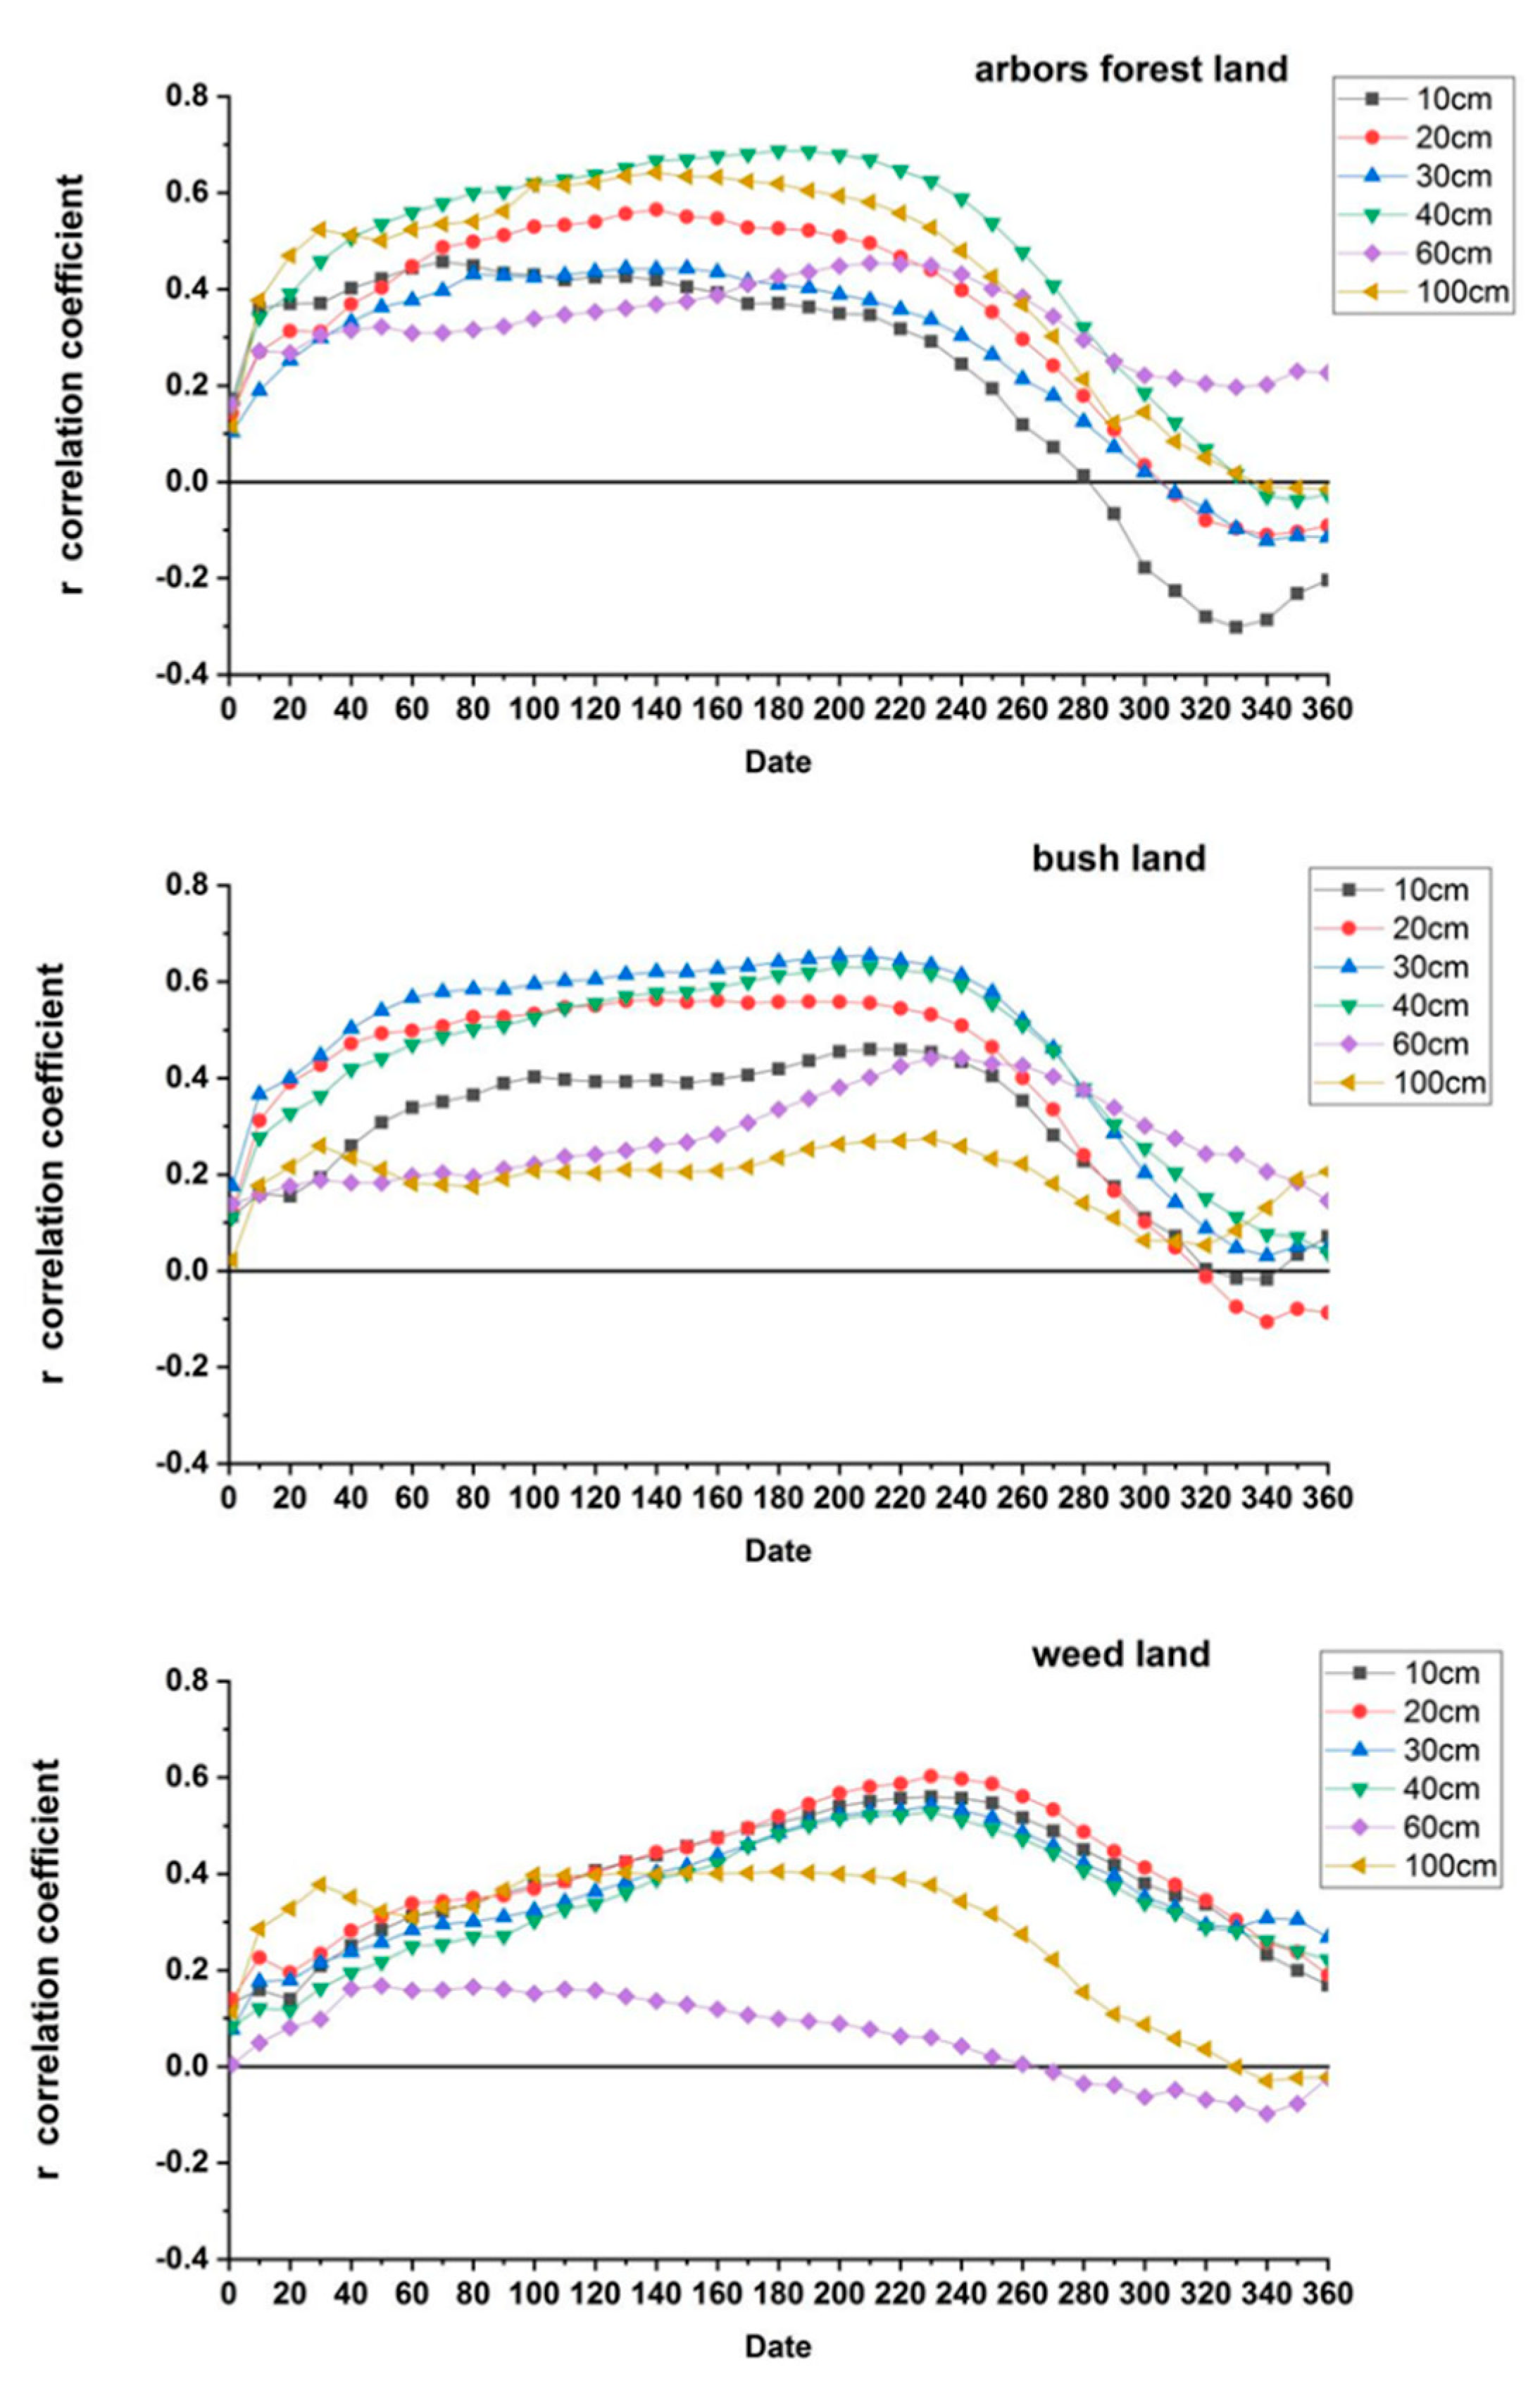
The correlation coefficient was different between accumulated precipitation and SMC at different soil depths of three different site types, and the value changes slowly with little fluctuation (Figure 11). Accumulated precipitation has the highest correlation with SMC in 40 cm and 100 cm soil layer of arbors forest land, in the 30 cm and 40 cm soil layer of bush land, and in the 20 cm and 10 cm soil layer of weed land. This supports the findings illustrated in Figure 6 and also indicates that the soil layers with more developed root systems have a stronger correlation with SMC in different site types.
As long as the Pearson coefficient increases, it indicates that precipitation has a positive linear effect on SMC (Figure 11); therefore, if the highest point of the Pearson coefficient was found, we could find the date when the two have the strongest linear relationship. By linear regression analysis of accumulated precipitation and SMC on the dates with the highest correlation, the functional relationship between the two could be established. In this study, the fuzzy query method shown in Figure 4 was used to find the date with the strongest correlation between different soil depths of the three site types, and the corresponding linear equations were constructed (Table 2). The major findings shown in Table 2 are as follows: (1) the date with the strongest correlation between accumulated precipitation and SMC at different soil depths was found; (2) using the linear equations to predict SMC of each layer by the accumulated precipitation, the SMC in each layer and the amount of water stored in the soil can be determined; (3) a practical basis for analyzing SMC of different site types was provided and the response of soil water to precipitation at different depths in different lands used was revealed.
3.5. Model Evaluation
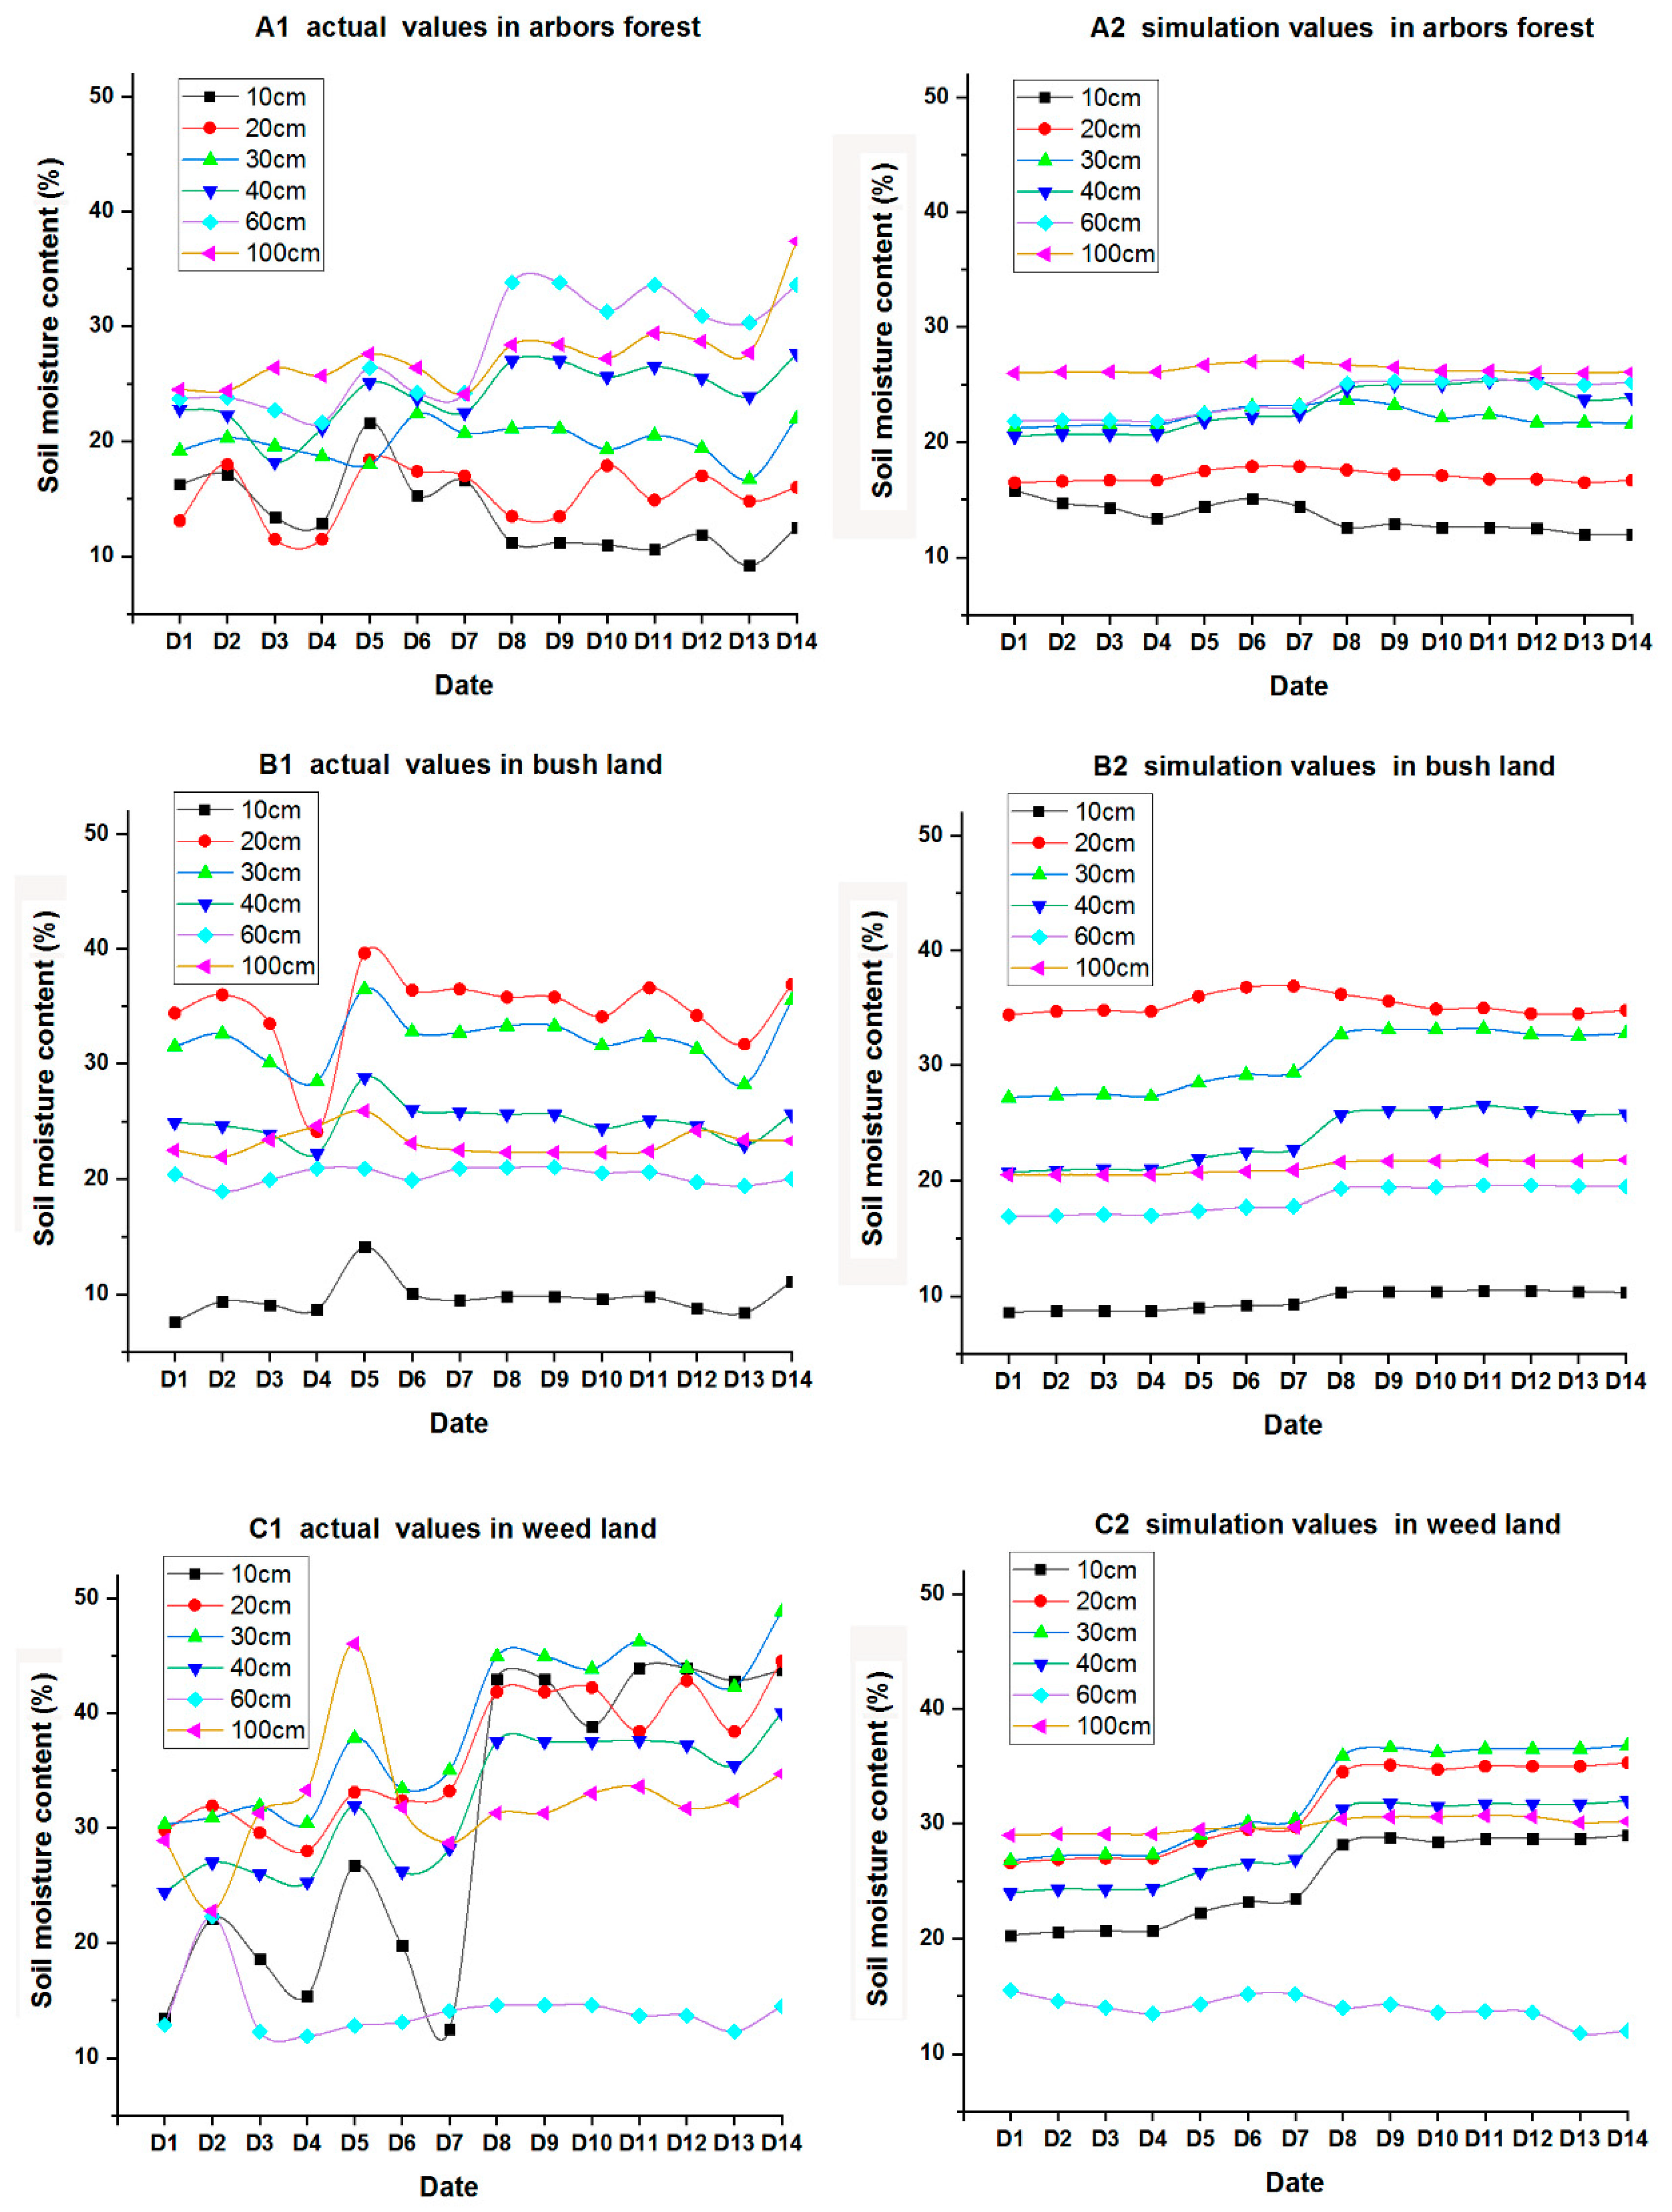
In order to verify the credibility of these models (Table 2), the SMC of each layer of the three site types in September and November, 2019 was measured. It takes 1 September and 1 November as the first day with 5-day cycles. The actual values and simulation values at the different soil depths for the three site types are shown in Figure 12. The variation of measured value has greatly fluctuated while the simulated value is relatively flat, but the simulated values almost reflect the trend and distribution of SMC of each layer in the three types of sites, so the simulation has a certain credibility. As can be expected, the models are not sensitive enough to simulate the changes at some points with large fluctuations, and further studies will be needed to solve this issue. It is very practical to calculate the SMC of each soil layer in the three types of sites by using these models and historical precipitation data.
4. Discussion
4.1. The Dynamic Characteristics of Soil Moisture
The variation coefficients of SMC decreased with the increasing soil depth. The sequence of variation coefficient in the three site types was weed land > arbors forest land > bush land. From March to May, the maximum variation coefficient of SMC in the three different site types appeared at 10 cm depth of soil. This period belongs to the dry season of the study area, with less precipitation and higher temperatures. However, vegetation growth consumes soil moisture; therefore, the water stored in the soil is reduced. SMC of the arbors forest land increased within the 0–100 cm soil depth layers, and it reached a maximum value between 60–100 cm. Arbors forest land had the strongest water retention in the 60–100 cm soil depth layer, but bush land and weed land in 20–30 cm and 0–20 cm, respectively. In the range of 40–60 cm, SMC was almost the same in the forest, bush, and weed land. The root systems of arbors forest land were deeper than that of shrub and weed land. Within 0–100 cm soil depth of arbors forest land, the deeper the depth, the better the water retention. The arbor forest in the water source area of HRT provides sustainable flowing water for terraced fields, and plays a significant role in improving soil water utilization rate and maintaining the sustainable development of terraced fields [28]. The SMC of each layer of the same site type showed the same trend, but different characteristics in the rainy and dry seasons.
4.2. The Relationship between Daily Precipitation or Accumulated Precipitation and Soil Moisture
The Pearson correlation coefficient between daily precipitation of the test day’s 0–100 cm depth SMC and that of the 360 days prior to the test day for the three site types shows a sinusoidal curve [21], and the Pearson correlation coefficient has never exceeded 0.2, which is very consistent with the natural law. In addition, it is important to note that the highest positive correlation between daily precipitation and SMC was the 60 and 80 day before the test day. This provides a further indication that the residence time of SMC in the range 0–100 cm is different and the residence time is also different in different site types [3,29]. The above conclusions show that the impact of daily precipitation on the SMC is a slow and limited process. Therefore, it is unrealistic to predict SMC based on daily precipitation.
Daily precipitation has a limited effect on SMC, and cumulative precipitation is the main factor affecting SMC [14]. There is a linear relationship between accumulated precipitation and SMC. The strongest correlation between SMC and accumulated precipitation in different soil depths of the three site types can be determined, and the corresponding linear equations can be built. These equations can be used to calculate the SMC in each layer using accumulated precipitation. With the exception of a few soil layers, Pearson’s correlation coefficients between accumulated precipitation and SMC are 0.4–0.7, indicating that SMC is affected by other factors in addition to precipitation [29,30]. Compared with other factors, precipitation is a parameter which is a more unstable factor, but relatively easy to obtain. Because the temperature of the sampling site changes little with the seasons and months, soil properties and geographical characteristics of different site types are also relatively stable, it is feasible to predict SMC using accumulative precipitation values [6,14,15,21].
From Table 2, it can be seen that there are strong correlations between accumulated precipitation and SMC in different layers in the three site types, but the Pearson’s correlation coefficient r and the linear equations at each layer in three different site types are different. These formulas can first predict SMC of different soil layers of different site types according to the accumulated precipitation data from earlier periods. Secondly, these formulas provide theoretical formulas for studying SMC of different soil layers of the same site type and different site types. It provides a basis for further research on the mechanism of influence of different site types on SMC, and provides an understanding of the relationship between water and vegetation in the vegetation construction of HRT ecosystem. It also provides the advancement of key technologies for applications in these ecosystems [2,29,31,32].
5. Conclusions
The dynamic characteristics of SMC in 0–100 cm soil layers of the HRT water source area were significantly different on the daily, monthly, seasonal, and annual scales in the three site types; however, SMC of each layer of the same site type showed the same trend in the rainy and dry seasons. The daily precipitation of about half a year had a positive effect on SMC in 0–100 cm soil depth layer, and daily precipitation of two to three months had the greatest effect on SMC. In this area, even if there is little precipitation during the dry season, the soil can adequately retain water if enough precipitation is provided during the rainy season. Moreover, the study area also receives a lot of precipitation during the dry season. Sufficient soil storage provides continuous water supply for downstream terraces; this is an important reason why HRT have functioned for thousands of years. Daily precipitation has a limited effect on SMC, and cumulative precipitation is the main factor affecting SMC. There is a linear relationship between accumulated precipitation and SMC. In this study, the corresponding linear equation with the strongest correlation was established using the linear equations, and SMC of each layer was predicted by the accumulated precipitation in the three site types. The findings of this study have great significance for the protection and sustainable utilization of HRT.
Author Contributions
Conceptualization, Z.M. and W.S.; methodology, Z.M.; software, X.H.; validation, Z.M., J.M. (Jing Ma) and W.S.; formal analysis, Z.M.; investigation, J.M. (Jiangang Ma); resources, J.M. (Jiangang Ma); data curation, X.H.; writing—original draft preparation, Z.M.; writing—review and editing, Z.M.; visualization, X.H.; supervision, J.M. (Jiangang Ma); project administration, W.S.; funding acquisition, W.S. All authors have read and agreed to the published version of the manuscript.
Funding
This study was funded by the National Natural Science Foundation of China (Grant Numbers 31070631, 41371066), Basic Research Key project of Yunnan Province (Grant Numbers 202001AS070042).
Conflicts of Interest
The authors declare no conflict of interest.
References
- Wang, C.; Fu, B.; Zhang, L.; Xu, Z. Soil moisture–plant interactions: An ecohydrological review. J. Soils Sediments 2019, 19, 1–9. [Google Scholar] [CrossRef]
- Wang, C.; Wang, S.; Fu, B.; Zhang, L.; Lu, N.; Jiao, L. Stochastic soil moisture dynamic modelling: A case study in the Loess Plateau, China. Earth Environ. Sci. Trans. R. Soc. Edinb. 2018, 109, 437–444. [Google Scholar] [CrossRef]
- Zhang, P.; Xiao, P.; Yao, W.; Liu, G.; Sun, W. Profile distribution of soil moisture response to precipitation on the Pisha sandstone hillslopes of China. Sci. Rep. 2020, 10, 9136. [Google Scholar] [CrossRef] [PubMed]
- Lin, P.F.; Zhu, X.; He, Z.B.; Du, J.; Chen, L.F. Research progress on soil moisture temporal stability. Acta Ecol. Sin. 2018, 38, 3403–3413. [Google Scholar]
- Robock, A.; Vinnikov, Y.K.; Srinivasan, G.; Entin, J.K.; Liu, S.; Namkhai, A. The Global Soil Moisture Data Bank. Bull. Am. Meteorol. Soc. 2000, 81, 1281–1299. [Google Scholar] [CrossRef]
- Shin, Y.; Mohanty, B.P.; Ines, A.V.M. Development of non-parametric evolutionary algorithm for predicting soil moisture dynamics. J. Hydrol. 2018, 564, 208–221. [Google Scholar] [CrossRef]
- Yu, Y.; Wang, J.; Cheng, F.; Chen, Y. Soil Moisture by Remote Sensing Retrieval in the Tropic of Cancer of Yunnan Province. Pol. J. Environ. Stud. 2020, 29, 1981–1993. [Google Scholar] [CrossRef]
- Jia, Y.-H.; Shao, M.-A. Dynamics of deep soil moisture in response to vegetational restoration on the Loess Plateau of China. J. Hydrol. 2014, 519, 523–531. [Google Scholar] [CrossRef]
- Mulebeke, R.; Kironchi, G.; Tenywa, M.M. Soil moisture dynamics under different tillage practices in cassava–sorghum based cropping systems in eastern Uganda. Ecohydrol. Hydrobiol. 2013, 13, 22–30. [Google Scholar] [CrossRef]
- Ghajarnia, N.; Kalantari, Z.; Orth, R.; Destouni, G. Close co-variation between soil moisture and runoff emerging from multi-catchment data across Europe. Sci. Rep. 2020, 10, 4817. [Google Scholar] [CrossRef]
- Philip, J.R. Hillslope infiltration: Planar slopes. Water Resour. Res. 1991, 1, 109–117. [Google Scholar] [CrossRef]
- Yu, Z.; Carlson, T.N.; Barron, E.J.; Schwartz, F.W. On evaluating the spatial-temporal variation of soil moisture in the Susquehanna River Basin. Water Resour. Res. 2001, 37, 1313–1326. [Google Scholar] [CrossRef]
- Sun, L.; Yang, L.; Chen, L.; Li, S.; Zhao, F.; Sun, S. Tracing the soil water response to autumn precipitation in different land uses at multi-day timescale in a subtropical zone. Catena 2019, 180, 355–364. [Google Scholar] [CrossRef]
- Zhang, K.; Wang, Q.; Chao, L.; Ye, J.; Li, Z.; Yu, Z.; Yang, T.; Ju, Q. Ground observation-based analysis of soil moisture spatiotemporal variability across a humid to semi-humid transitional zone in China. J. Hydrol. 2019, 574, 903–914. [Google Scholar] [CrossRef]
- Hagen, K.; Berger, A.; Gartner, K.; Geitner, C.; Kofler, T.; Kogelbauer, I.; Kohl, B.; Markart, G.; Meißl, G.; Niedertscheider, K. Event-based dynamics of the soil water content at Alpine sites (Tyrol, Austria). Catena 2020, 194, 104682. [Google Scholar] [CrossRef]
- Zuo, Z.; Zhang, R. The spring soil moisture and the summer precipitation in eastern China. Chin. Sci. Bull. 2007, 52, 3310–3312. [Google Scholar] [CrossRef]
- Chen, W.; Li, Y.X.; Wang, H.Y.; Wang, J.; Sun, C.J. Dynamic response characteristics of soil moisture on slope cultivated land and abandoned land to different precipitation intensities in Loess hilly region. Acta Ecol. Sin. 2022, 42, 332–339. [Google Scholar] [CrossRef]
- Entekhabi, D.; Rodriguez-Iturbe, I. Analytical framework for the characterization of the space-time variability of soil moisture. Adv. Water Resour. Res. 1994, 17, 35–45. [Google Scholar] [CrossRef]
- Kirshner, S. Modeling of Multivariate Time Series Using Hidden Markov Models. Ph.D. Thesis, University of California, Irvine, CA, USA, 2005. [Google Scholar]
- Penna, D.; Borga, M.; Norbiato, D.; Dalla Fontana, G. Hillslope scale soil moisture variability in a steep alpine terrain. J. Hydrol. 2009, 364, 311–327. [Google Scholar] [CrossRef]
- Pan, F.; Nieswiadomy, M.; Qian, S. Application of a soil moisture diagnostic equation for estimating root-zone soil moisture in arid and semi-arid regions. J. Hydrol. 2015, 524, 296–310. [Google Scholar] [CrossRef]
- Kim, S. Time series modeling of soil moisture dynamics on a steep mountainous hillside. J. Hydrol. 2016, 536, 37–49. [Google Scholar] [CrossRef]
- Zhao, W.; Fang, X.; Daryanto, S.; Zhang, X.; Wang, Y. Factors influencing soil moisture in the Loess Plateau, China: A review. Earth Environ. Sci. Trans. R. Soc. Edinb. 2018, 109, 501–509. [Google Scholar] [CrossRef]
- Ma, J.; Song, W.; Wu, J.; Liu, Z.; Wei, Z. Identifying the mean residence time of soil water for different vegetation types in a water source area of the Yuanyang Terrace, southwestern China. Isot. Environ. Health Stud. 2019, 55, 272–289. [Google Scholar] [CrossRef] [PubMed]
- Zhang, X.-J.; Song, W.-F.; Wu, J.-K.; Wang, Z.-J. Charcteristics of Hydrogen and Oxygen Isotopes of Soil Water in the Water Source Area of Yuanyang Terrace. Environ. Sci. 2015, 36, 2102–2108. [Google Scholar]
- Jiao, Y.; Liu, C.; Gao, X.; Xu, Q.; Ding, Y.; Liu, Z. Impacts of moisture sources on the isotopic inverse altitude effect and amount of precipitation in the Hani Rice Terraces region of the Ailao Mountains. Sci. Total Environ. 2019, 687, 470–478. [Google Scholar] [CrossRef]
- Yao, M.; Cui, B.-S.; Cui, B.-S. The vertical characteristics of ecosystem of Hani terrace paddyfield in Yunnan, China. Ecol. Soc. China 2006, 26, 2115–2124. [Google Scholar]
- Jiao, Y.; Zhao, D.; Xu, Q.; Liu, Z.; Ding, Z.; Ding, Y.; Liu, C.; Zha, Z. Mapping lateral and longitudinal hydrological connectivity to identify conservation priority areas in the water-holding forest in Honghe Hani Rice Terraces World Heritage Site. Landsc. Ecol. 2020, 35, 709–725. [Google Scholar] [CrossRef]
- Yu, B.; Liu, G.; Liu, Q. Effects of land use changes for ecological restoration on soil moisture on the Chinese Loess Plateau: A meta-analytical approach. J. For. Res. 2018, 31, 443–452. [Google Scholar] [CrossRef]
- Huang, X.; Shi, Z.H.; Zhu, H.D.; Zhang, H.Y.; Ai, L.; Yin, W. Soil moisture dynamics within soil profiles and associated environmental controls. Catena 2016, 136, 189–196. [Google Scholar] [CrossRef]
- Yang, L.; Wei, W.; Chen, L.; Mo, B. Response of deep soil moisture to land use and afforestation in the semi-arid Loess Plateau, China. J. Hydrol. 2012, 475, 111–122. [Google Scholar] [CrossRef]
- Yang, L.; Wei, W.; Chen, L.; Chen, W.; Wang, J. Response of temporal variation of soil moisture to vegetation restoration in semi-arid Loess Plateau, China. Catena 2014, 115, 123–133. [Google Scholar] [CrossRef]
Figure 1.
(a) An ecosystem structure map of the Hani Rice Terraces with Four prime isomorphisms “Forest-Village-Terrace-River”; (b) Location of the study area in Honghe Hani Rice Terraces.
Figure 1.
(a) An ecosystem structure map of the Hani Rice Terraces with Four prime isomorphisms “Forest-Village-Terrace-River”; (b) Location of the study area in Honghe Hani Rice Terraces.

Figure 2.
Time series of soil moisture from θ1 to θt; θx is soil moisture at time x and it is measured at different soil depths; Pn is every day precipitation; and Cn is cumulative precipitation during n days before test.
Figure 2.
Time series of soil moisture from θ1 to θt; θx is soil moisture at time x and it is measured at different soil depths; Pn is every day precipitation; and Cn is cumulative precipitation during n days before test.

Figure 3.
(a) Plot of Pearson’s correlation coefficient between soil moisture content and daily accumulated precipitation based on time series to rp1, rp5, rp10, rc5, and rc10for example. (b) Pearson’s correlation coefficient r (r1, r2, r3,..., r360) between soil moisture content and daily precipitation big data graph.

Figure 4.
Fuzzy query method for finding the greatest value for the Pearson’s correlation coefficient r between cumulative precipitation and soil moisture content. rx is the x day before the test day.
Figure 4.
Fuzzy query method for finding the greatest value for the Pearson’s correlation coefficient r between cumulative precipitation and soil moisture content. rx is the x day before the test day.

Figure 5.
Monthly average precipitation and runoff from 2012 to 2016.

Figure 6.
Monthly average soil moisture content in three different site types between 2012 to 2016.

Figure 7.
The variation of soil moisture content in the rainy and dry seasons in different soil.

Figure 8.
Soil water storage in August and February of different site types in 2012 to 2016 (SWSC: soil water storage capacity; AL: arbors forest land; BL: bush land; WL: weed land).
Figure 8.
Soil water storage in August and February of different site types in 2012 to 2016 (SWSC: soil water storage capacity; AL: arbors forest land; BL: bush land; WL: weed land).

Figure 9.
Date model diagram of Pearson’s coefficient r for daily precipitation and soil moisture content of three site types.
Figure 9.
Date model diagram of Pearson’s coefficient r for daily precipitation and soil moisture content of three site types.

Figure 10.
The linear relationship between accumulated precipitation and soil moisture content at 40 cm in arbors forest land.
Figure 10.
The linear relationship between accumulated precipitation and soil moisture content at 40 cm in arbors forest land.

Figure 11.
Pearson’s coefficient r between accumulated precipitation and soil moisture content at different soil depths for three site types.
Figure 11.
Pearson’s coefficient r between accumulated precipitation and soil moisture content at different soil depths for three site types.

Figure 12.
The comparison of actual values and simulation values at different soil depths for three site types. (D1: 2019-9-1, D2: 2019-9-5, D3: 2019-9-10, D4: 2019-9-15, D5: 2019-9-20, D6: 2019-9-25, D7: 2019-9-30, D8: 2019-11-1, D9: 2019-11-5, D10: 2019-11-10, D11: 2019-11-15, D12: 2019-11-20, D13: 2019-11-25, D14: 2019-11-30).


Table 1.
Pearson’s correlation coefficient between soil moisture content of each layer and daily precipitation at different times in the arbors forest land (SD: soil depth).
Table 1.
Pearson’s correlation coefficient between soil moisture content of each layer and daily precipitation at different times in the arbors forest land (SD: soil depth).
| SD | Pearson’s Correlation Coefficient r | ||||||||||||||||||
| rP1 | rP10 | rP20 | rP30 | rP40 | rP50 | rP60 | rP70 | rP80 | rP90 | rP100 | rP110 | rP120 | rP130 | rP140 | rP150 | rP160 | rP170 | rP180 | |
| 10 cm | 0.17 | 0.28 | 0.04 | 0.09 | 0.14 | 0.17 | 0.18 | 0.14 | 0.07 | 0.11 | 0.21 | 0.04 | 0.07 | −0.03 | 0.03 | −0.01 | 0.01 | −0.05 | 0.00 |
| 20 cm | 0.14 | 0.24 | 0.06 | 0.09 | 0.21 | 0.20 | 0.26 | 0.17 | 0.09 | 0.19 | 0.28 | 0.13 | 0.07 | 0.04 | 0.05 | 0.03 | 0.01 | −0.01 | −0.06 |
| 30 cm | 0.10 | 0.14 | 0.08 | 0.06 | 0.14 | 0.14 | 0.17 | 0.14 | 0.22 | 0.06 | 0.05 | 0.03 | 0.09 | 0.01 | 0.20 | 0.11 | −0.01 | −0.05 | 0.03 |
| 40 cm | 0.16 | 0.26 | 0.20 | 0.12 | 0.18 | 0.20 | 0.21 | 0.23 | 0.16 | 0.15 | 0.18 | 0.08 | 0.10 | 0.10 | 0.14 | 0.12 | 0.10 | 0.00 | −0.03 |
| 60 cm | 0.16 | 0.17 | 0.17 | 0.03 | 0.05 | 0.07 | 0.09 | 0.15 | 0.07 | 0.00 | 0.00 | −0.01 | 0.05 | 0.03 | 0.13 | 0.17 | 0.15 | 0.11 | −0.01 |
| 100 cm | 0.12 | 0.25 | 0.23 | 0.16 | 0.16 | 0.10 | 0.17 | 0.15 | 0.14 | 0.20 | 0.22 | 0.08 | 0.06 | 0.05 | 0.07 | 0.08 | 0.06 | 0.02 | −0.04 |
| 0–100 cm | 0.14 | 0.23 | 0.16 | 0.11 | 0.14 | 0.13 | 0.17 | 0.16 | 0.12 | 0.13 | 0.16 | 0.06 | 0.07 | 0.04 | 0.09 | 0.09 | 0.06 | 0.02 | −0.02 |
| SD | Pearson’s Correlation Coefficient r | ||||||||||||||||||
| rP190 | rP200 | rP210 | rP220 | rP230 | rP240 | rP250 | rP260 | rP270 | rP280 | rP290 | rP300 | rP310 | rP320 | rP330 | rP340 | rP350 | rP360 | ||
| 10 cm | −0.11 | −0.07 | −0.15 | −0.17 | −0.11 | −0.16 | −0.16 | −0.14 | −0.15 | −0.17 | −0.16 | −0.12 | −0.04 | 0.08 | 0.06 | 0.06 | 0.04 | 0.09 | |
| 20 cm | 0.00 | −0.09 | −0.17 | −0.14 | −0.07 | −0.12 | −0.15 | −0.20 | −0.15 | −0.16 | −0.19 | −0.11 | −0.17 | −0.02 | 0.08 | 0.03 | 0.00 | 0.00 | |
| 30 cm | −0.09 | −0.07 | −0.08 | −0.11 | −0.10 | −0.13 | −0.16 | −0.16 | −0.17 | −0.16 | −0.16 | −0.11 | −0.09 | −0.06 | −0.05 | −0.02 | −0.02 | −0.01 | |
| 40 cm | −0.05 | −0.10 | −0.11 | −0.14 | −0.14 | −0.17 | −0.24 | −0.24 | −0.27 | −0.29 | −0.25 | −0.20 | −0.16 | −0.10 | −0.12 | −0.06 | 0.00 | −0.01 | |
| 60 cm | 0.00 | −0.04 | −0.05 | −0.01 | −0.04 | −0.04 | −0.16 | −0.15 | −0.10 | −0.14 | −0.15 | −0.10 | −0.08 | −0.04 | −0.13 | −0.01 | 0.01 | −0.05 | |
| 100 cm | −0.07 | −0.08 | −0.05 | −0.13 | −0.14 | −0.22 | −0.18 | −0.18 | −0.27 | −0.23 | −0.26 | −0.19 | −0.19 | −0.06 | 0.00 | −0.04 | 0.05 | 0.02 | |
| 0–100 cm | −0.05 | −0.07 | −0.08 | −0.11 | −0.10 | −0.15 | −0.17 | −0.18 | −0.20 | −0.19 | −0.21 | −0.15 | −0.14 | −0.04 | −0.03 | −0.02 | 0.02 | 0.01 | |
Note: r0–100cm = r10cm × 0.1 + r20cm × 0.1 + r30cm × 0.1 + r40cm × 0.1 + r60cm × 0.2 + r100cm × 0.4.
Table 2.
The strongest correlation between accumulated precipitation, depth of soil, moisture content, and the linear equation at each layer in three different site types (SD: soil depth, x: Cx’s accumulated precipitation, y: soil moisture content).
Table 2.
The strongest correlation between accumulated precipitation, depth of soil, moisture content, and the linear equation at each layer in three different site types (SD: soil depth, x: Cx’s accumulated precipitation, y: soil moisture content).
| SD | Arbors Forest Land | ||||
| First Search | Second Search | Pearson r | Equation | Sign. | |
| 10 cm | r70 | r75 | 0.459 | y = (7.7 + 0.01x)/100 | 0.000 |
| 20 cm | r130 | r138 | 0.568 | y = (9.45 + 0.007x)/100 | |
| 30 cm | r145 | r143 | 0.449 | y = (12.2 + 0.009x)/100 | |
| 40 cm | r180 | r184 | 0.689 | y = (11.15 + 0.009x)/100 | |
| 60 cm | r210 | r207 | 0.455 | y = (15.45+ 0.006x)/100 | |
| 100 cm | r140 | r137 | 0.644 | y = (20.96 + 0.005x)/100 | |
| SD | Bush Land | ||||
| First Search | Second Search | Pearson r | Equation | Sign. | |
| 10 cm | r210 | r216 | 0.462 | y = (5.44 + 0.003x)/100 | 0.000 |
| 20 cm | r140 | r137 | 0.565 | y = (22.35 + 0.012x)/100 | |
| 30 cm | r210 | r205 | 0.655 | y = (16.67 + 0.01x)/100 | |
| 40 cm | r200-r210 | r210-r211 | 0.633 | y = (11.25 + 0.009x)/100 | |
| 60 cm | r240 | r242 | 0.444 | y = (12.62 + 0.004x)/100 | |
| 100 cm | r230 | r235 | 0.314 | y = (18.3 + 0.002x)/100 | |
| SD | Weed Land | ||||
| First Search | Second Search | Pearson r | Equation | Sign. | |
| 10 cm | r230 | r229 | 0.561 | y =(6.64 + 0.013x)/100 | 0.000 |
| 20 cm | r230 | r229 | 0.601 | y = (12.92 + 0.013x)/100 | |
| 30 cm | r230 | r230 | 0.542 | y = (11.01 + 0.015x)/100 | |
| 40 cm | r230 | r230 | 0.529 | y = (11.35 + 0.012x)/100 | |
| 60 cm | r50 | r45 | 0.172 | y = (10.35 + 0.012x)/100 | 0.002 |
| 100 cm | r180 | r184 | 0.406 | y = (25.93 + 0.003x)/100 | 0.000 |
Publisher’s Note: MDPI stays neutral with regard to jurisdictional claims in published maps and institutional affiliations. |
© 2022 by the authors. Licensee MDPI, Basel, Switzerland. This article is an open access article distributed under the terms and conditions of the Creative Commons Attribution (CC BY) license (https://creativecommons.org/licenses/by/4.0/).
Share and Cite
MDPI and ACS Style
Ma, Z.; Song, W.; Ma, J.; Ma, J.; He, X. Dynamic Change Characteristics of Soil Moisture and Its Relationship with Precipitation in Hani Rice Terraces Water Source Area. Water 2022, 14, 2690. https://doi.org/10.3390/w14172690
AMA Style
Ma Z, Song W, Ma J, Ma J, He X. Dynamic Change Characteristics of Soil Moisture and Its Relationship with Precipitation in Hani Rice Terraces Water Source Area. Water. 2022; 14(17):2690. https://doi.org/10.3390/w14172690
Chicago/Turabian StyleMa, Ze, Weifeng Song, Jiangang Ma, Jing Ma, and Xiaokang He. 2022. "Dynamic Change Characteristics of Soil Moisture and Its Relationship with Precipitation in Hani Rice Terraces Water Source Area" Water 14, no. 17: 2690. https://doi.org/10.3390/w14172690
Note that from the first issue of 2016, this journal uses article numbers instead of page numbers. See further details here.