
_Dionysiou.jpg)
Investigation on Energetic Efficiency of Reactor Systems for Oxidation of Micro-Pollutants by Immobilized Active Titanium Dioxide Photocatalysis


1
Professorship of Urban Water Management, Department of Civil Engineering, Bauhaus-Universität Weimar, 99423 Weimar, Germany
2
Professorship of Environmental Engineering, Engineering Department, University of Applied Science Hof, 95028 Hof, Germany
*
Author to whom correspondence should be addressed.
Water 2022, 14(17), 2681; https://doi.org/10.3390/w14172681
Submission received: 12 July 2022
/
Revised: 10 August 2022
/
Accepted: 25 August 2022
/
Published: 29 August 2022
(This article belongs to the Special Issue Advanced Oxidation Processes for Emerging Contaminant Removal)
Abstract
:In this work, the degradation performance for the photocatalytic oxidation of eight micro-pollutants (amisulpride, benzotriazole, candesartan, carbamazepine, diclofenac, gabapentin, methlybenzotriazole, and metoprolol) within real secondary effluent was investigated using three different reactor designs. For all reactor types, the influence of irradiation power on its reaction rate and energetic efficiency was investigated. Flat cell and batch reactor showed almost similar substance specific degradation behavior. Within the immersion rotary body reactor, benzotriazole and methyl-benzotriazole showed a significantly lower degradation affinity. The flat cell reactor achieved the highest mean degradation rate, with half time values ranging from 5 to 64 min with a mean of 18 min, due to its high catalysts surface to hydraulic volume ratio. The EE/O values were calculated for all micro-pollutants as well as the mean degradation rate constant of each experimental step. The lowest substance specific energy per order (EE/O) values of 5 kWh/m3 were measured for benzotriazole within the batch reactor. The batch reactor also reached the lowest mean values (11.8–15.9 kWh/m3) followed by the flat cell reactor (21.0–37.0 kWh/m3) and immersion rotary body reactor (23.9–41.0 kWh/m3). Catalyst arrangement and irradiation power were identified as major influences on the energetic performance of the reactors. Low radiation intensities as well as the use of submerged catalyst arrangement allowed a reduction in energy demand by a factor of 3–4. A treatment according to existing treatment goals of wastewater treatment plants (80% total degradation) was achieved using the batch reactor with a calculated energy demand of 7000 Wh/m3.
1. Introduction
Within our industrialized society, thousands of chemical compounds are used daily for industrial and household purposes. Within the European Union, for example, over 100 thousand unique substances are registered within the European Community (EC) inventory [1]. Some of these substances, such as pharmaceuticals, industrial chemicals, and pesticides, enter the wastewater stream and can be discharged into downstream aquatic systems due to inadequate treatment performance of conventional wastewater treatment technologies [2,3]. Despite their low concentrations with a range of ng/L to µg/L, these micro-pollutants represent a challenge for future water and drinking water protection [4]. An additional treatment stage for municipal wastewater is necessary as an important barrier to the emission of these pollutants. This (4th) treatment stage is usually arranged after the biological treatment stage of wastewater treatment plants. The state of the art of treatment mostly consists of adsorptive processes, which use granulated or powdered activated carbon, and oxidative processes, which use ozone [5,6,7]. The cumulative energy demand of a large-scale ozonation can be assumed to be 50–100 Wh/m3 [8]. For this application, a biological post treatment, in most case an aerated sand filtration, is necessary due to transformation products, which requires a cumulative energy consumption of 20–50 Wh/m3 [8]. Powdered activated carbon (PAC) applications also require the use of sand filtration, which can be associated with an energy demand of 120 Wh/m3. Further relevant energy consumption occurs during the production of activated carbon and can be quantified as 350 Wh/m3 (primary energy/treated wastewater) [8]. These values can be seen as a first point of comparison towards the state of the art.
Advanced oxidation processes (AOP), which use cold oxidation by hydroxyl radicals as a core mechanism, are not yet used on a broad industrial scale within municipal wastewater treatment [9]. The main advantage of these applications is the higher oxidation potential of the hydroxyl radicals, which in principle allows a complete mineralization of treated pollutants to , water, and mineral salts [9,10]. During photocatalysis on titanium dioxide, irradiation of the catalyst with UV-A light (320–400 nm) leads to charge separation and, thus, to the formation of electron holes and free electrons [11]. The use of this process is possible in several variations. Existing developments can be differentiated in terms of the light source (wavelength, natural/artificial, type), the catalyst (-based/other material, immobilized/suspended, size), and the reactor design and operation [12]. The emphasis of this work is the use of immobilized and UVA-LEDs as light source for the treatment of micro-pollutants in wastewater. A comparison of reactor systems is possible by a number of performance indicators [12,13]. In the context of economic competitiveness, the energy efficiency is an important parameter if artificial irradiation is used Wang et al. 2021 [14]. The electrical energy required to degrade a pollutant by a factor of 10 in relation to the volume of water treated is called electrical energy per order (EE/O) and is usually given as a characteristic value [14]. Within the literature, values from up to kWh/m3 are reported for different pollutants and reactor systems [14]. Most of these systems described in [12] are in the range of 10–50 kWh/m3. In addition to the pollutant treated and the type of reactor, degradation rates and, thus, energy efficiencies get influenced/decreased by a variety of other parameters, especially matrix influences [15,16]. A realistic assessment of the suitability of photocatalytic processes for wastewater treatment consequently requires an investigation of a wide range of micro-pollutants in real matrix. [17] achieved EE/O values of 0.21 kWh/m3 for diclofenac and 2.1 kWh/m3 for carbamazepine using suspended TiO2 and UVC-lamps when treating river water with a photocatalytic membrane reactor module. In contrast, [18] stated, that no strictly photocatalytic experiment measured EE/O values lower than 10, except the experiments of [19], which was conducted using ultrapure water at pH 3.8. [20] measured EE/O values of 15–57.3 kWh/m3 for the treatment of azithromycin, trimethopirm, oflaxacin, and sulfamethoxazole within secondary effluent via suspended TiO2 photocatalysis.
The content of this work is the comparison of three reactor types for the photocatalytic degradation of eight micro-pollutants based on experimental measurement data within secondary effluent. The catalyst used was immobilized TiO2, which is suitable for wastewater treatment due to its low resource cost and toxicity, if nanoparticulate emission can be avoided. The focus lays on the energetic efficiency of these applications, since this parameter has a significant influence on the economic competitiveness compared to conventional processes of the 4th treatment stage. The energetic comparison is carried out in this work using the EE/O methodology. It must be noted that, at least for the German context, a degradation of 90% is substantially beyond currently discussed cleaning targets. Existing requirements for the degradation performance of these applications require an 80% elimination of a selection of indicator substances relative to the raw wastewater [21,22]. A detailed comparison with conventional treatment technologies requires a detailed configuration of a photocatalytic treatment stage considering variable degradation performances of upstream biological stages and, thus, exceeds the scope of this work. As a rough estimate, it can be assumed that a 20% average micro-pollutant degradation is achieved within the biological stage of a wastewater treatment plant [2,8]. Assuming 75% elimination within a (photocatalytic) 4th treatment stage (relative to secondary effluent), this results in a total degradation of 80%. Assuming pseudo 1st order reaction kinetics, which applies for the photocatalytic treatment of most micropollutants, a non-linear reduction of the energy demand of about 40% for a reduced elimination rate (90% to 75%) is to be expected.
2. Methods
2.1. Chemicals and Materials
A more detailed description of the catalyst material used is given in previous works [23,24]. It consists of a suspension of anatase-modified titanium dioxide nanoparticles of 14 nm diameter and an anatase content of the titanium dioxide of 90%, which is coated onto a stainless-steel mesh. The V4A steel mesh had a mesh size of 200 µm and a wire thickness of 100 µm. A 10 μg/L terbutryn (Sigma Aldrich, St. Louis, MO, USA) solution in methanol was used within analysis as an internal standard. Further analytical purity chemicals were used for calibration: amisulpride (Gentham Life Science, Corsham, UK), benzotriazole (Gentham Life Science), candesartan (BLD Pharma, Hyderabad, India), carbamazepine (Sigma Aldrich), diclofenac (Cayman Chemical Company, Ann Arbor, MI, USA), gabapentin (Gentham Life Science), 1-methylbenzotriazole (Chempure, Bengaluru, India), and metoprolol (Sigma Aldrich).
2.2. Experimental Set-Up and Procedure
The investigations were carried out in different time series in 2019, 2020, 2021, and 2022. The investigated wastewater was always taken during dry weather conditions from the effluent of the wastewater treatment plant Weimar-Tiefurt and were filtered (50 µm) before use. The treatment plant has a capacity of 100,000 inhabitants. It consists of a mechanical treatment stage and a double channel cascade biological treatment system with horizontal secondary sedimentation. In total, three different reactor systems were used:
- Laboratory scale batch reactor
- Laboratory scale flat cell reactor
- Semi-technical photocatalytic immersion rotary body reactor
Data regarding the individual cleaning performance are already published for the flat cell [24] and the immersion rotary body reactor [23].
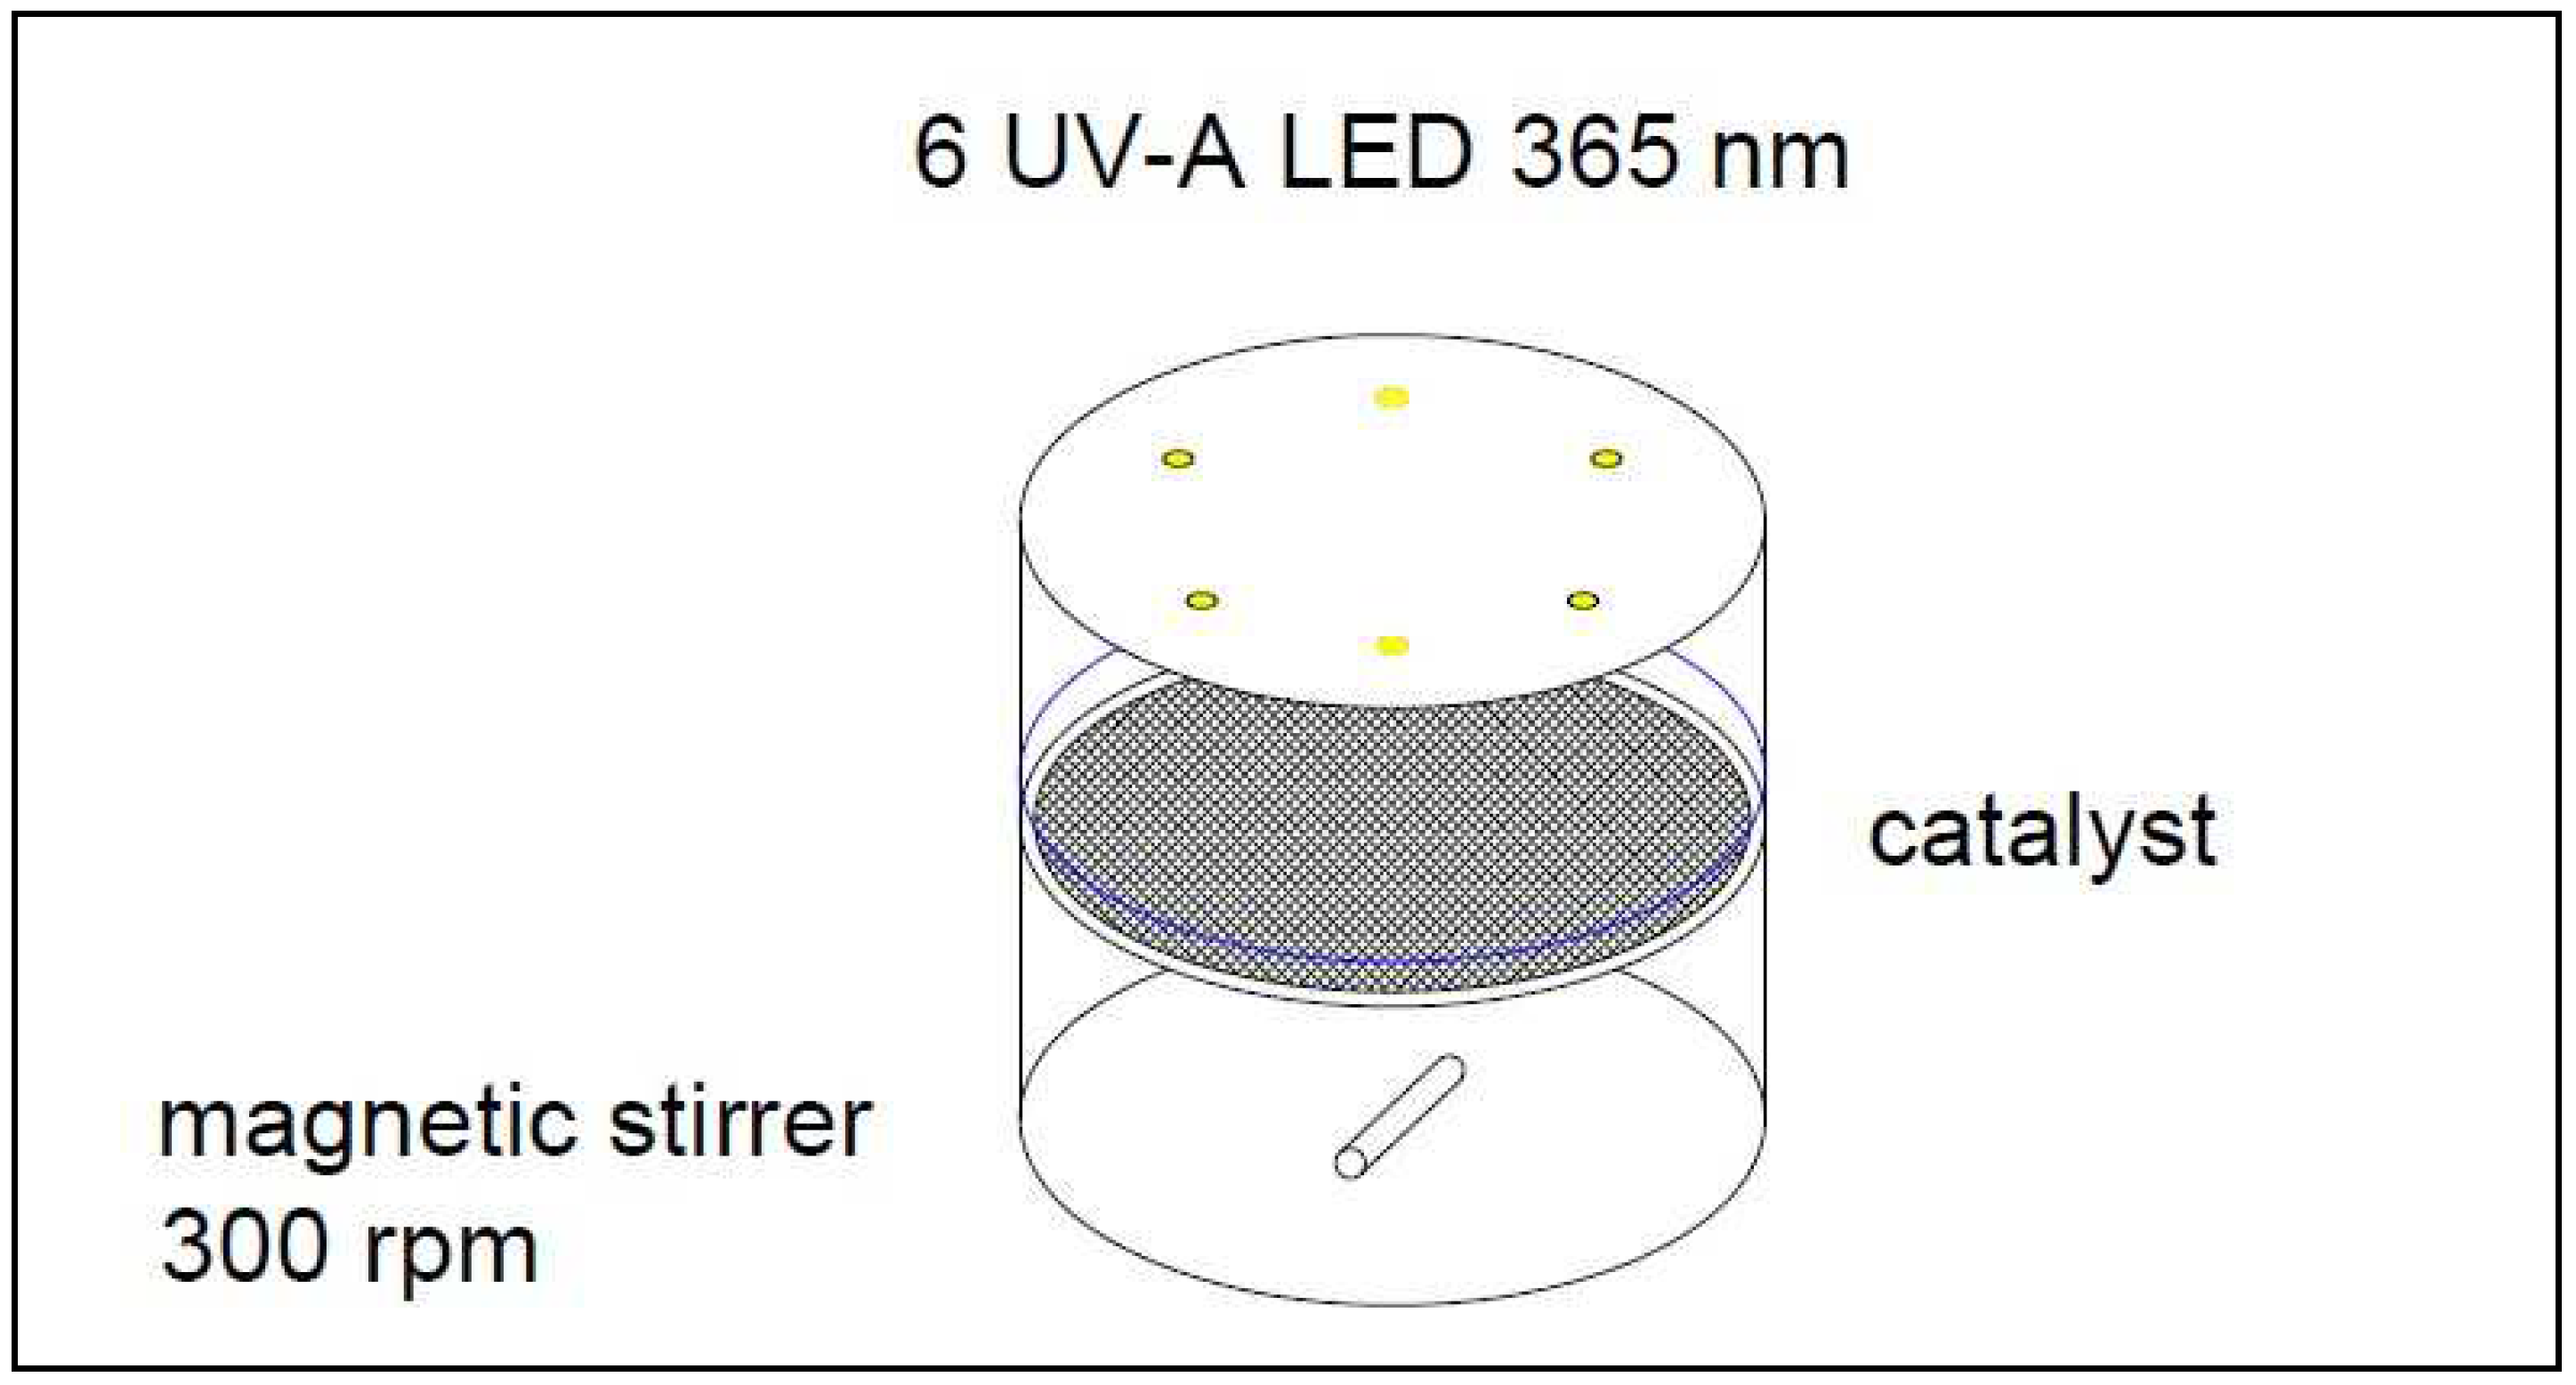
As shown in Figure 1, the laboratory batch reactor consists of an aluminum cylinder with a diameter of 14 cm and a hydraulic volume of 500 mL. The irradiated catalyst area is 0.0154 m2. The reactor is stirred continuously at 300 rpm. Six LEDs with a total electrical power of 12 W are installed and the power can be manually controlled. The catalyst is placed horizontally, submerged in the reactor 5 mm below the water surface. The reactor was investigated in batch mode. Before starting the experiment, the reactor was flushed with wastewater. Afterwards, a 30-min concentration equilibration was performed whereby the reactor was mixed and not irradiated. Subsequently, a photocatalytic treatment was carried out for 90 min, with 5 mL of sample material being taken every 15 min.
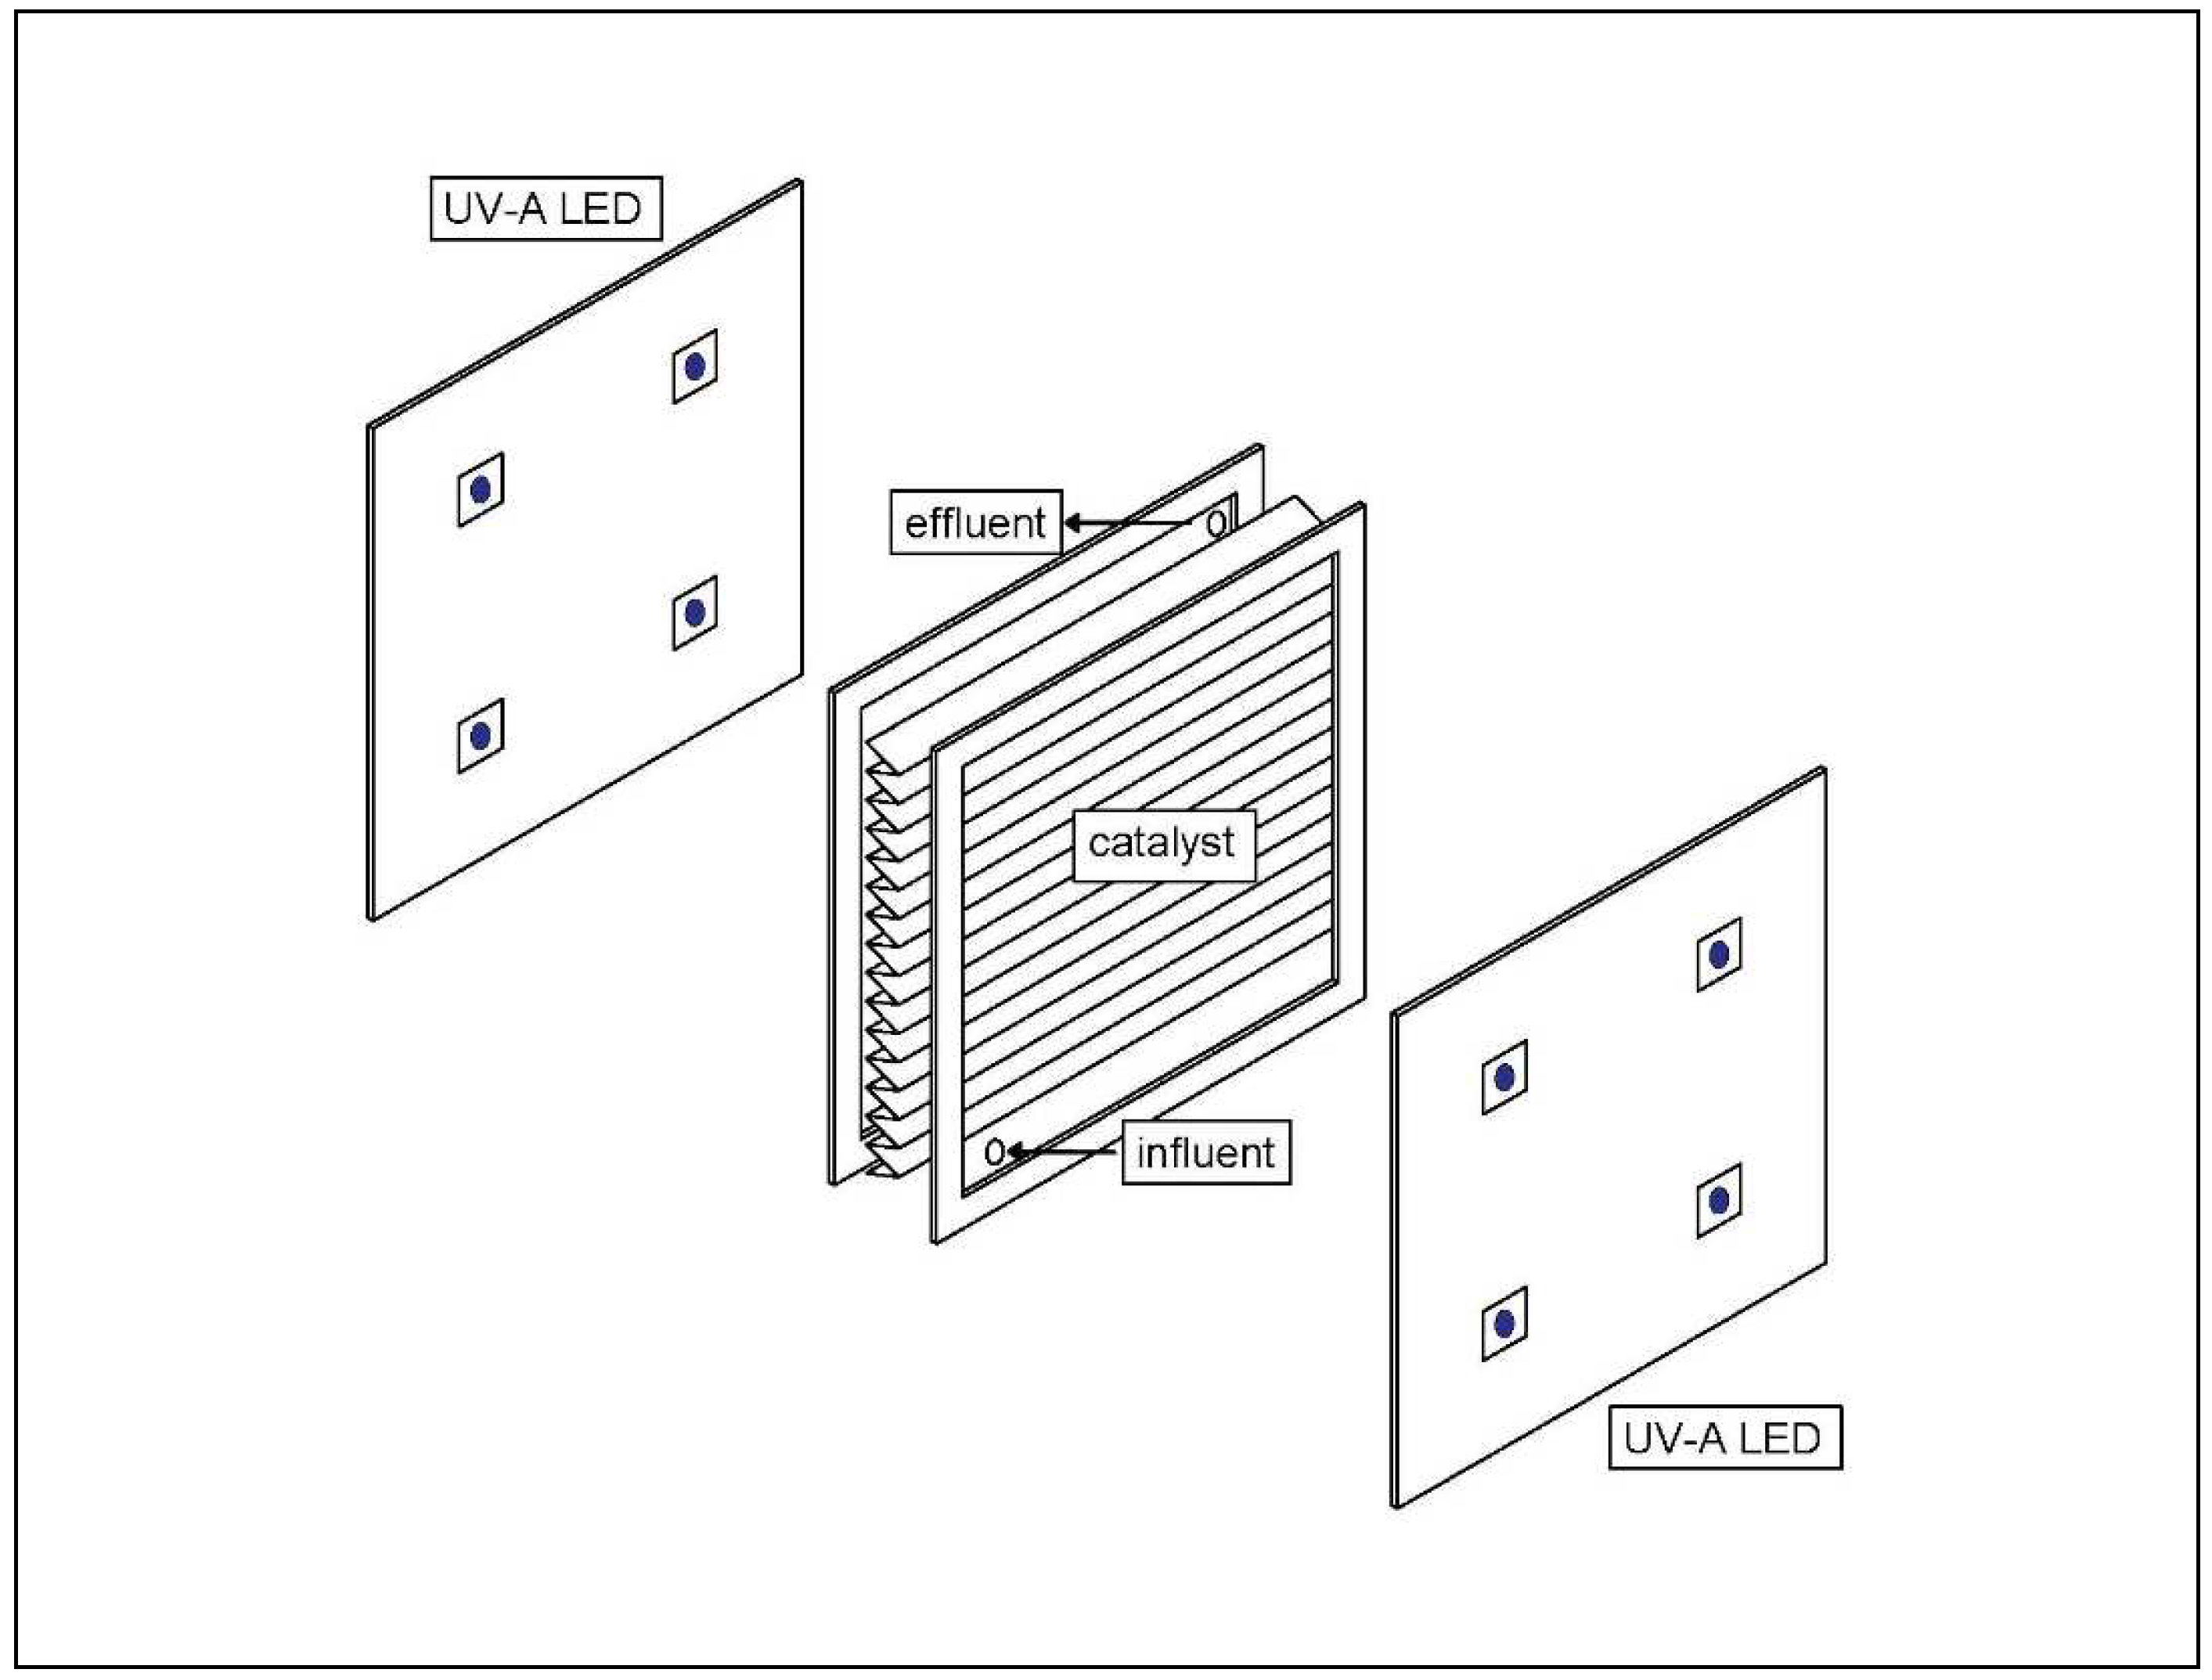
The flat cell reactor studied, as shown in Figure 2, consists of a pleated steel mesh coated with and eight UV-A LEDs (365 nm). The catalyst is placed inside a stainless-steel enclosure with glass windows on both sides. The edge length is 11.5 cm, and the hydraulic volume is 200 mL. The pleated design of the catalyst allowed a surface area of 0.0181 m2 to be arranged on a base area of 0.0128 m2. On each side of the reactor, 4 UV-A LEDs (1.8 W each) were evenly spaced at 8 cm distance. The reactor was constantly fed via peristaltic pump. Within the experiments, a hydraulic residence time of 12.17 min was set. After a run time of 30 min, which ensured a stationary reactor condition, the inlet and outlet of the reactor were sampled.
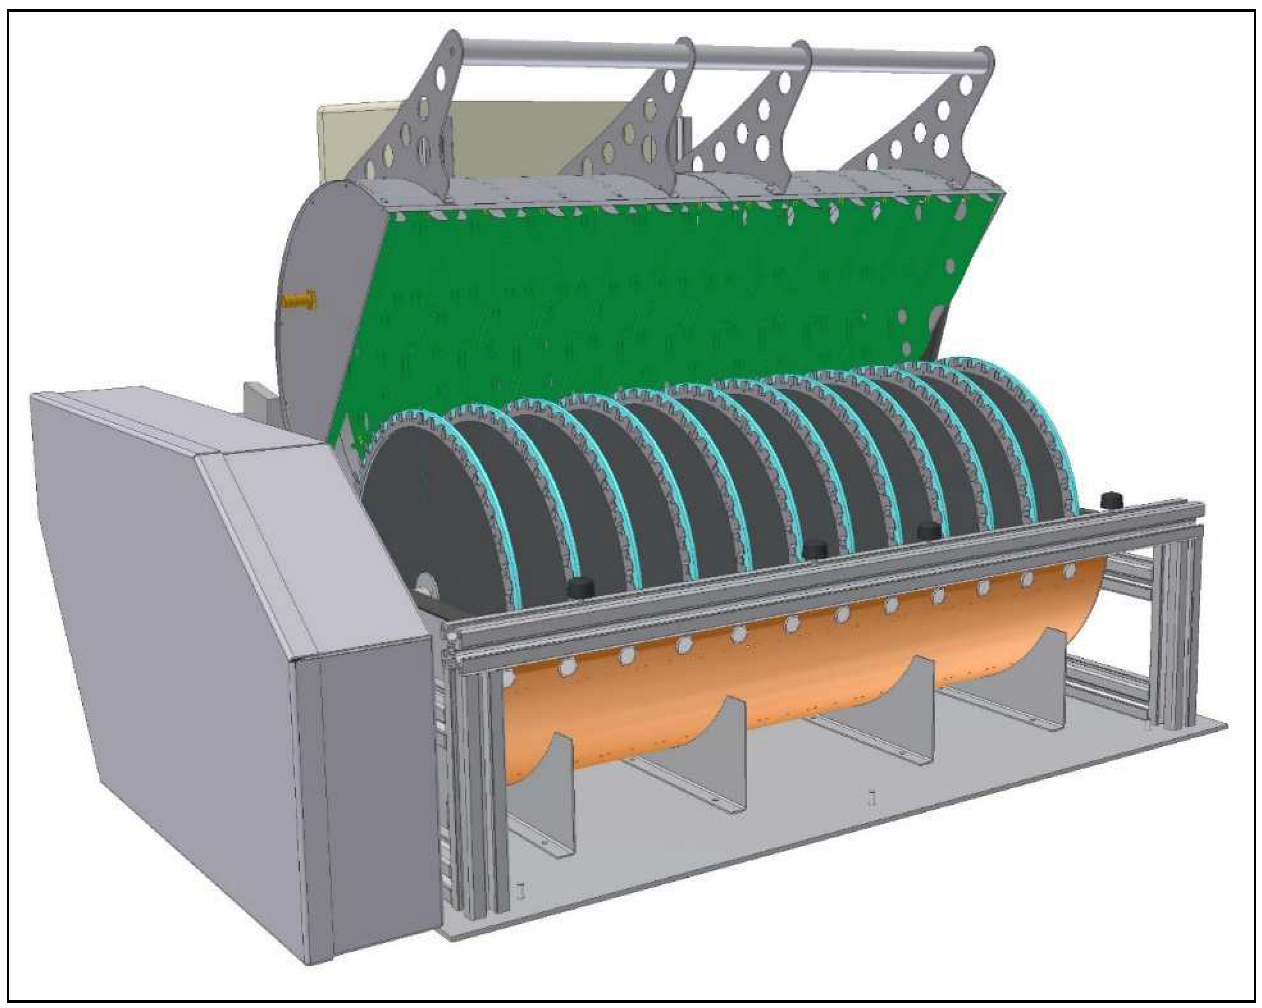
The photocatalytic immersion body reactor in Figure 3 consists of 12 rotating discs of 36 cm diameter on which the catalyst material is placed on both sides. Total catalyst area is 2.44 m2, of which about 50% is irradiated via UV-A LED arrays. The hydraulic part of the reactor is divided into 12 cascades, which are flown through in series with a total volume of 25 L. Investigation and sampling were carried out in the following steps: replace reactor volume with fresh wastewater, start reactor feed and operation and let run for 90 min, stop the reactor feed and operation, and sample. For this reactor, one sample is taken from every second of the twelve cascades. In contrast to previous laboratory applications, continuous feeding continues to take place directly from the effluent of the Weimar-Tiefurt wastewater treatment plant, whereas in the laboratory scale sample, the material was fed to the reactors via a tank, which was taken as a quick sample (about 20 L).
The experimental program is divided according to the reactor type. For the batch reactor, the degradation of micro-pollutants was investigated under the influence of the electrical irradiation power at constant treatment time. For the other continuous flow reactors, a variation of the irradiation power at a constant feed rate was also carried out. An overview of the investigated parameters can be seen in Table 1. The investigated radiation power per reactor volume was varied for different reactor systems. There are overlapping ranges for all reactor systems with a total magnitude of about 3.08–57.60 kW/m3. The LED power relative to the irradiated catalyst area was also similar for the batch and immersion rotary body reactor (100–300 W/m2). In the experiment with the flat-cell reactor, higher LED powers per catalyst area of up to 636 W/m2 were additionally investigated.
The values of the catalyst area-related irradiation power must be understood as a coefficient for reactor configuration and do not represent the actual average irradiation intensity on the respective catalysts. Due to the emission angle of the LEDs being 120° and the LED gap being 8 cm for the flat-cell reactor, considerable lateral losses are to be expected here. Furthermore, adsorption and reflection dynamics or other geometric characteristics of irradiation sources are not considered within this value.
2.3. Analytical Methods
The micro-pollutant analysis for the flat-cell and immersion rotary body reactor experiments was conducted using LC-MS/MS analogous to previous publications [24]. The HPLC was a Dionex R3000 system (ThermoFischer, Waltham, MA, USA) with gradient pump and autosampler. The HPLC eluent was ultrapure water with 1 mmol/l ammonium acetate and acetonitrile with 0.1% acetic acid. A Synergy 2.5 μm hydro PP column (Phenomenex, Aschaffenburg, Germany) measuring 100 2 mm was used as analytical separation column. The flow was 0.25 mL/min, and the gradient was run from 4% acetonitrile to 96% acetonitrile in 28 min. The injection volume was 100 μL sample, which was mixed with 10 μL internal standard. An API 4000 triple quadrupole mass spectrometer (Sciex, Framingham, MA, USA) with electro spray ionization was used for detection. For each substance, two multiple reaction monitoring mass transitions were evaluated. The micro-pollutant measurements of the batch reactor experiments were carried out by the commercial laboratory “GWA Umweltanalytik Luisenthal” following [25]. The following substances were analyzed: amisulpride, benzotriazole, candesartan, carbamazepine, diclofenac, gabapentin, 1-methylbenzotriazole, and metoprolol. All analytical measurements were carried out at least in duplicate.
2.4. Kinetic and Modelling
The kinetics of heterogeneous photocatalytic degradation can be described by the Langmuir–Hinshelwood (L–H) model [26,27], where the reaction rate of the parent substances can be calculated as follows:
The reaction rate is determined by the specific reaction constant , the Langmuir constant and the equilibrium concentration . The constant is significantly influenced by the formation and recombination rate of radicals. These are again significantly influenced by the activity of the catalyst, the radiation power, and the concentration of electron acceptors in the liquid matrix. The constant describes the substance-specific adsorption capacity of the reactant on the catalyst material. and are the Langmuir constant and the concentration of every substance within the solution. However, the application of this model in practice is very difficult, because, on the one hand, in a wastewater matrix in the rarest cases, all ingredients can be determined and the adsorption of the investigated micro-pollutants on the catalyst within the present concentration ranges cannot be measured. However, according to the observations of many authors, the practically observed reaction follows the first order [26]. Thus, the following simplification is assumed:
For easier readability of measured reaction rates, they have been presented within this work as half-lives according to Formula (3):
In order to compare the efficiency of different reactor systems, it is necessary to balance the amount of energy used, in this case electrical irradiation power, per unit volume of treated wastewater. The volume-specific energy requirement is calculated according to the following formula:
Here, is the electrical radiation power per catalyst surface, is the catalyst area used per volume, is the reactor volume, and is the volumetric flow rate. Assuming a 90% degradation rate, the feed rate can be calculated from reactor volume and reaction rate on a substance-specific basis. Under this assumption, Formula (5) can be represented as follows:
where, is the treatment or hydraulic retention time to achieve a given degradation ratio of a micropollutant within a specific experimental set-up. By means of Formula (6), an energy balance for a batch reactor is also possible. For flow reactors this balancing is only valid if a plug-flow behavior can be assumed. This proof as well as the corresponding 1st order reaction rate constants have been provided experimentally for the flat cell reactors within [24]. The 1st order reaction rate constants for immersion rotary body were determined in [25]. The time was calculated using Formula (6):
Here is the degradation ration (0.9 for calculation of the EE/O-values) and reaction rate constant. The first order reaction rate constants for the batch reactor were calculated using the following formula:
where x is equal to the treatment time within the batch reactor. The correlation was conducted using the Origin Pro software.
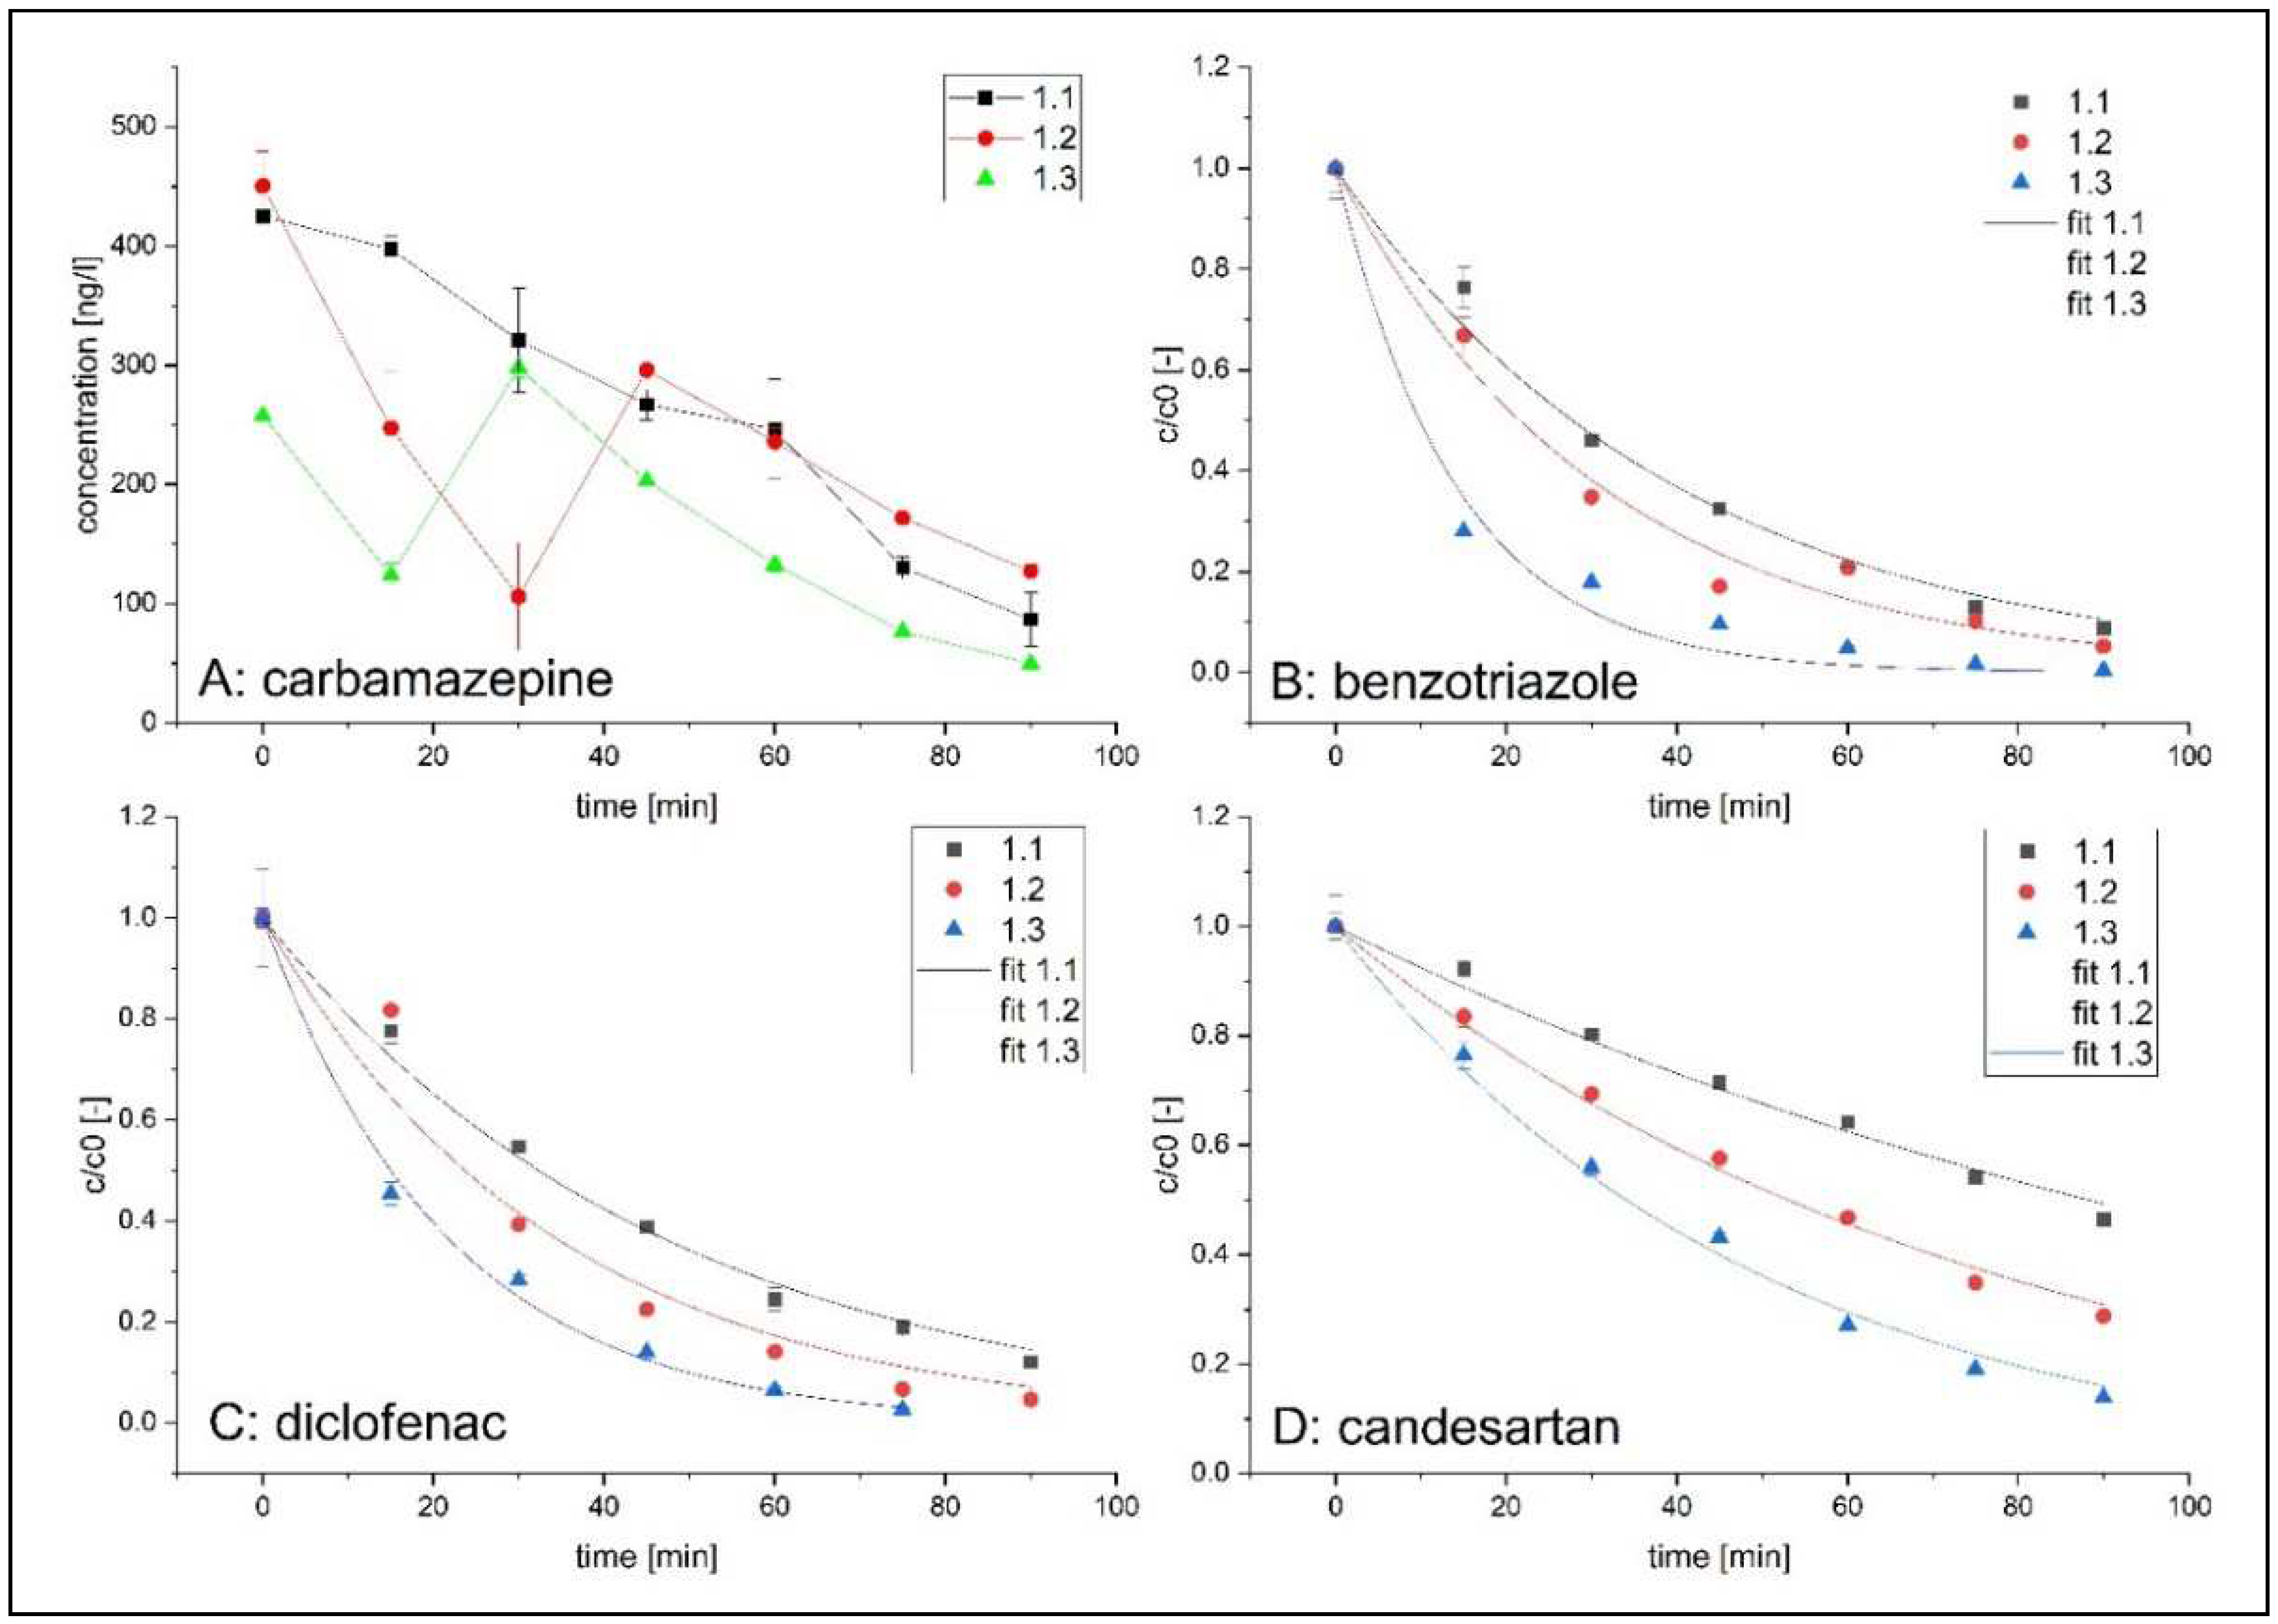
In Figure 4, the concentration curves and parameter estimations for the batch reactor are shown exemplary. For carbamazepine, inconsistent concentration curves were measured. As shown in Figure 4A, in two experiments, an increase of concentration occurred during the photocatalytic treatment. These increases may be explained, by the presence of oxcarbazepine, among other predecessor substances, within these wastewater samples. Consequently, carbamazepine was not included in the evaluation of the batch tests. For all reactors, 1st order reaction kinetic was applied and experimental proven. All experimental parameters (Table S1), measured concentrations (Table S2) as well as the corresponding half-live constants and fitting parameters (Table S3) are shown in the Supplementary Materials.
3. Results
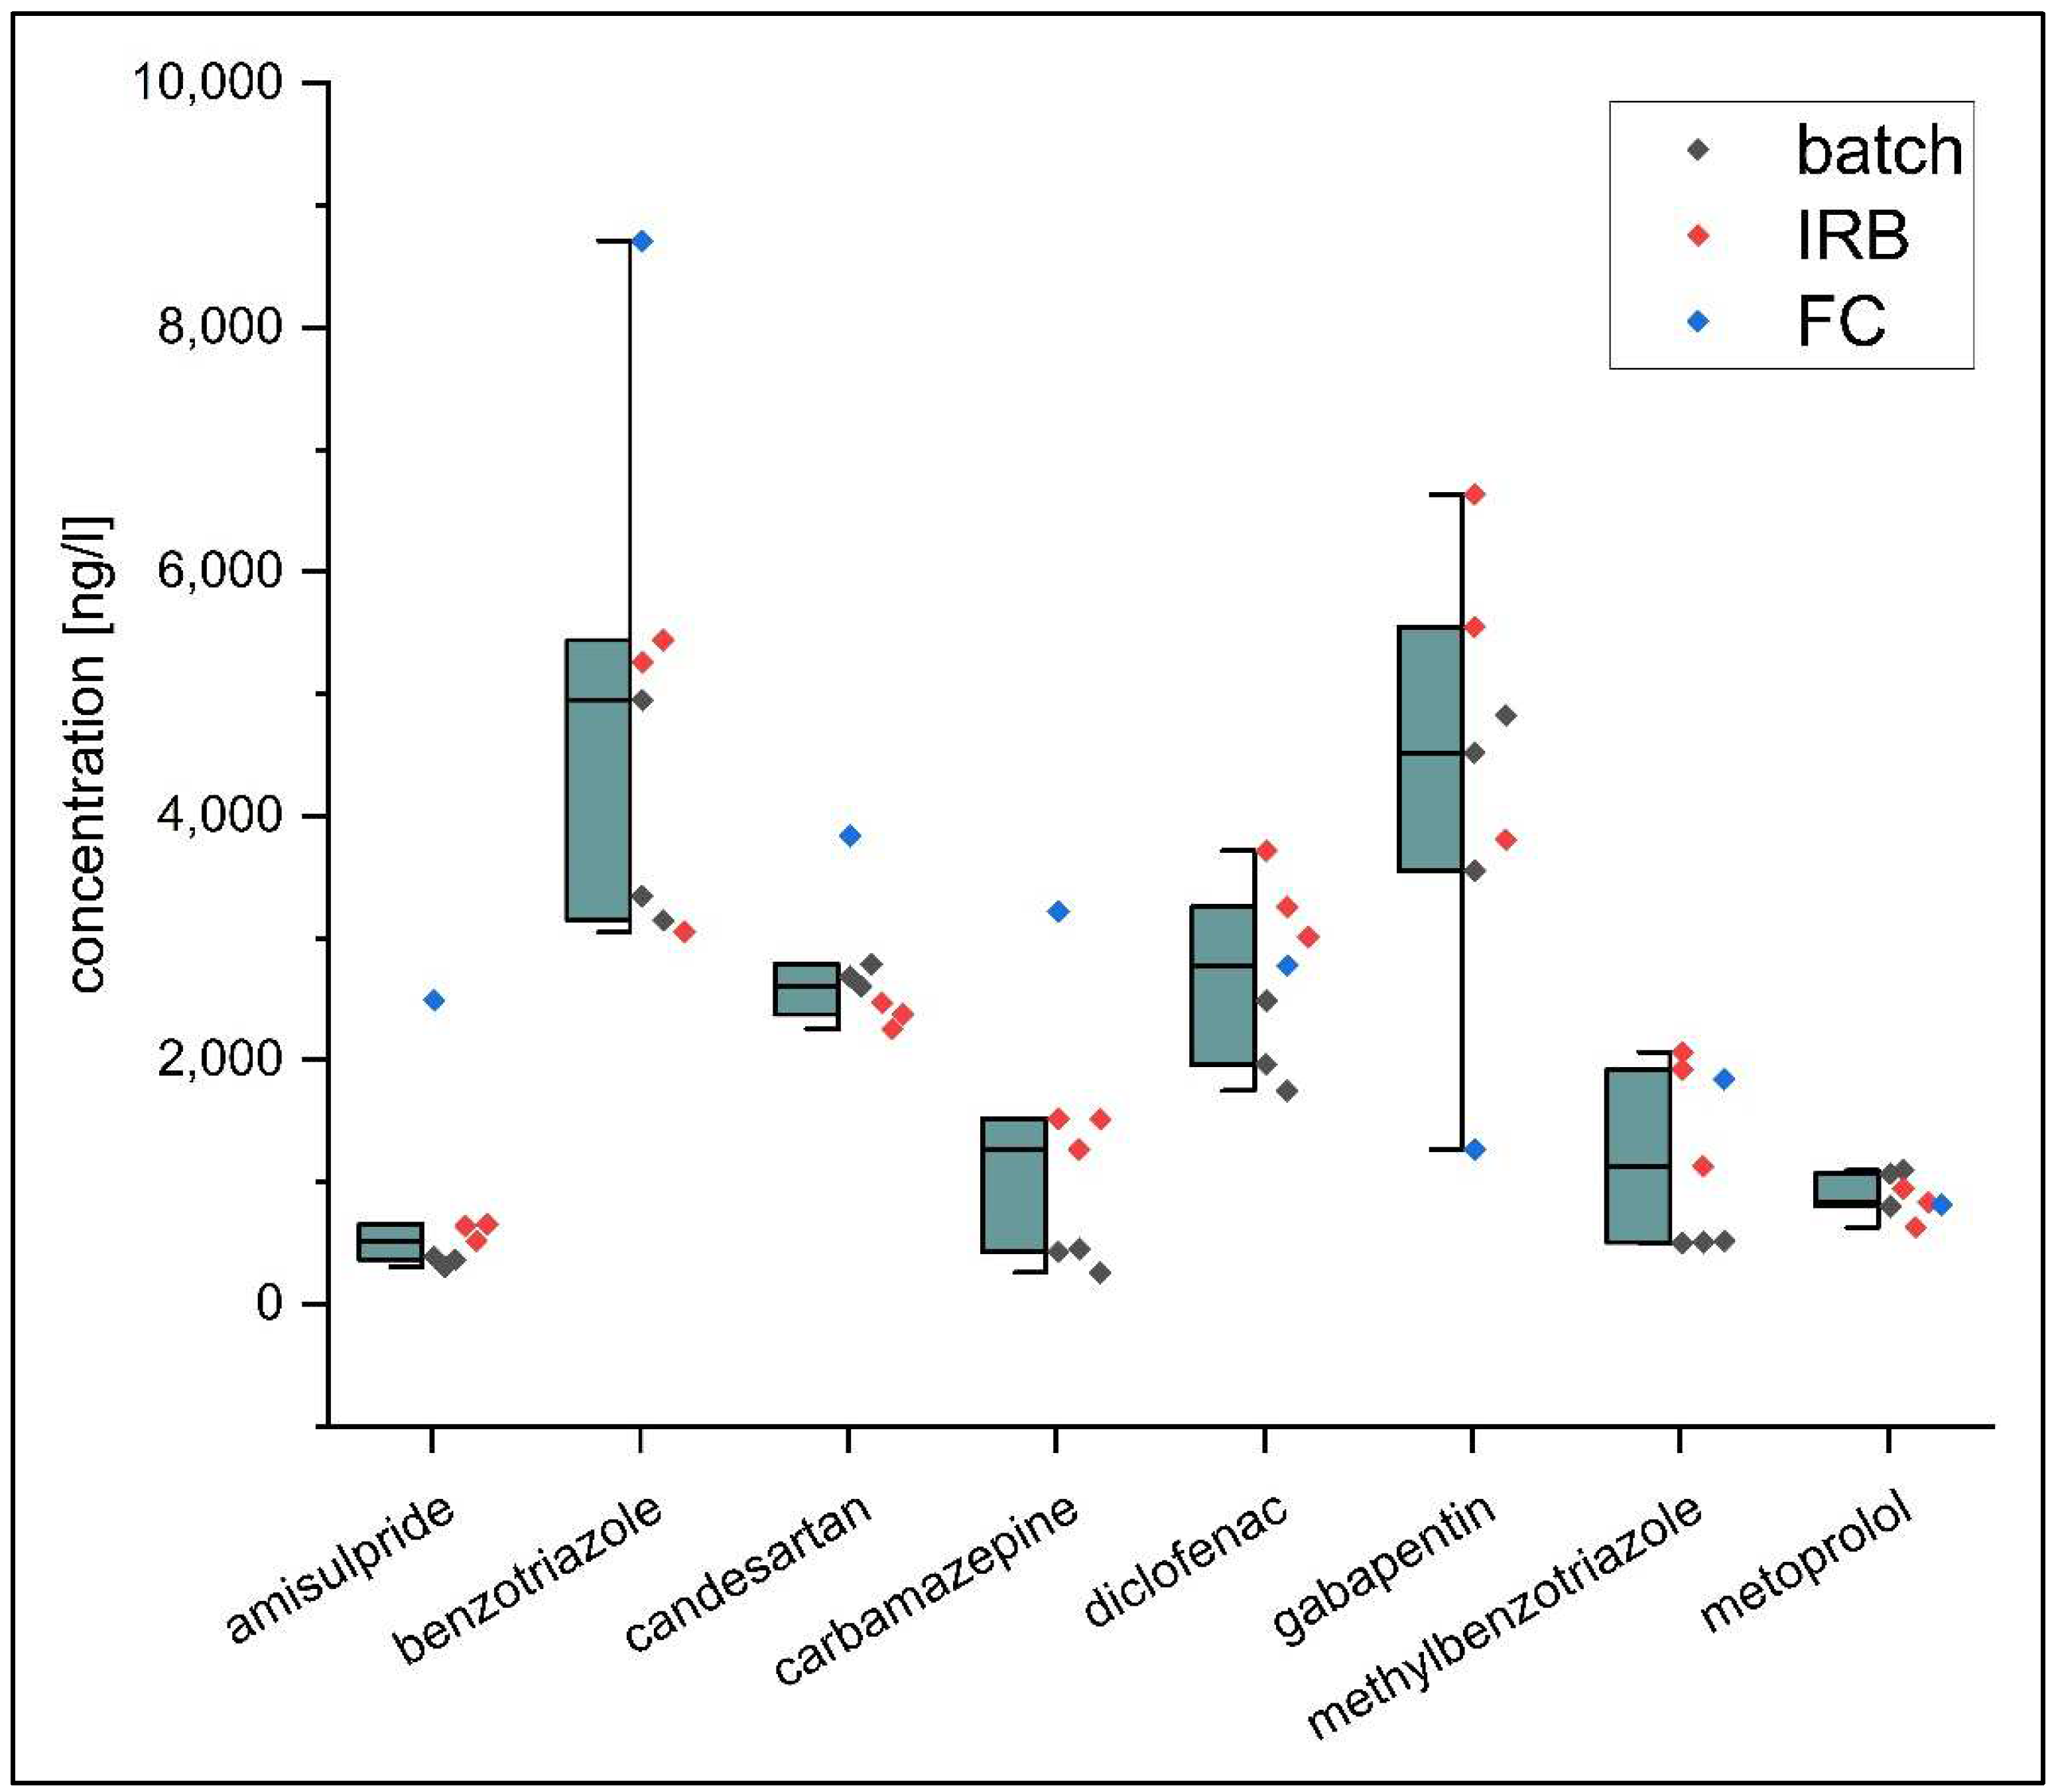
In Figure 5, the measured micro-pollutant concentrations in the effluent of the wastewater treatment plant Weimar-Tiefurt are shown. There were high loads of benzotraizole, diclofenac, and gabapentin. The initial concentrations of the flat cell reactor experiments were elevated for amisulpride, benzotriazole, candesartan, and carbamazepine compared to the other samples. Especially the parameters benzotriazole and gabapentin showed high fluctuations. Compared to typical effluent concentrations reported in [2], similar values were measured for all the micropollutants except diclofenac and carbamazepine, which were detected in higher concentrations. Overall, representative micro-pollutant concentrations of the secondary effluent were observed.
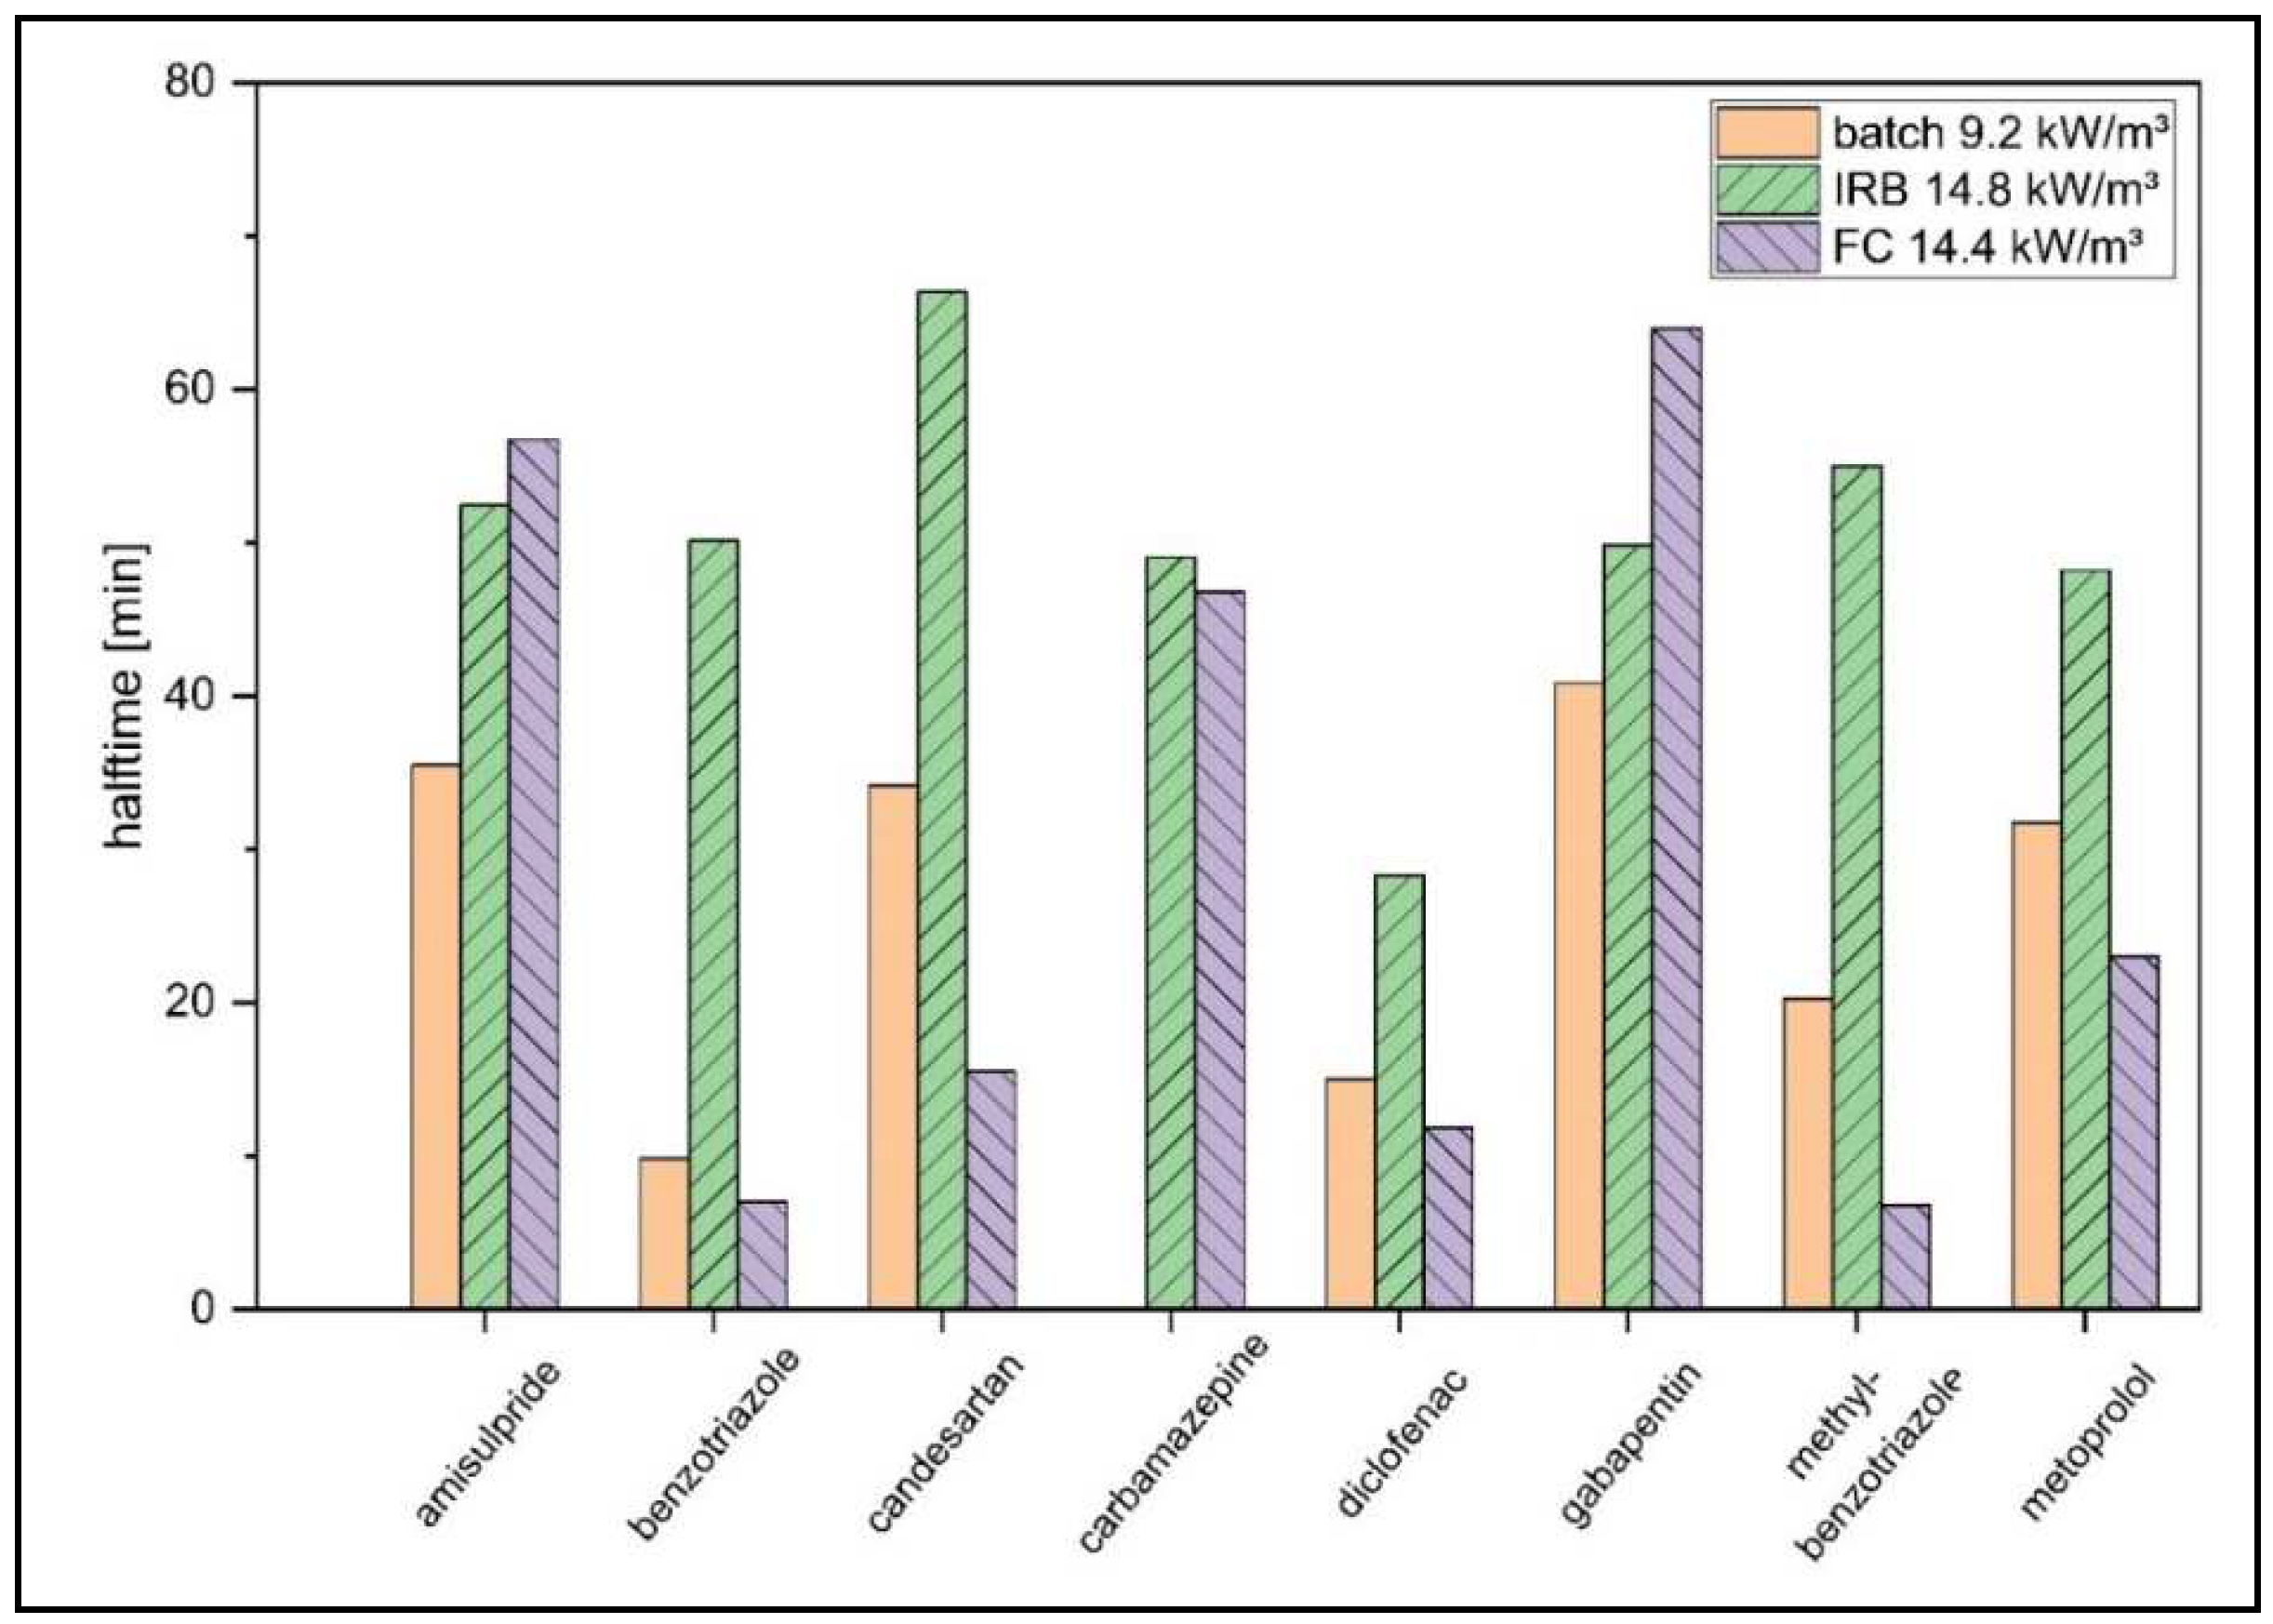
The photocatalytic reaction constants for all three reactor systems operated with similar electrical irradiation power per hydraulic volume are presented as halftime values in Figure 6. A higher reaction rate of many substances is evident for the flat cell reactor. For benzotriazole and diclofenac, similar degradation rates were measured for flat cell and batch reactor. Similar half time values were achieved for carbamazepine, amisulpride, and gabapentin within flat cell and immersion rotary body reactor. Interestingly, benzotriazole and methlybenzotriazole showed significantly lower degradation affinity within the immersion rotary body reactor. Overall, a reactor- and substance specific reaction behaviour was found.
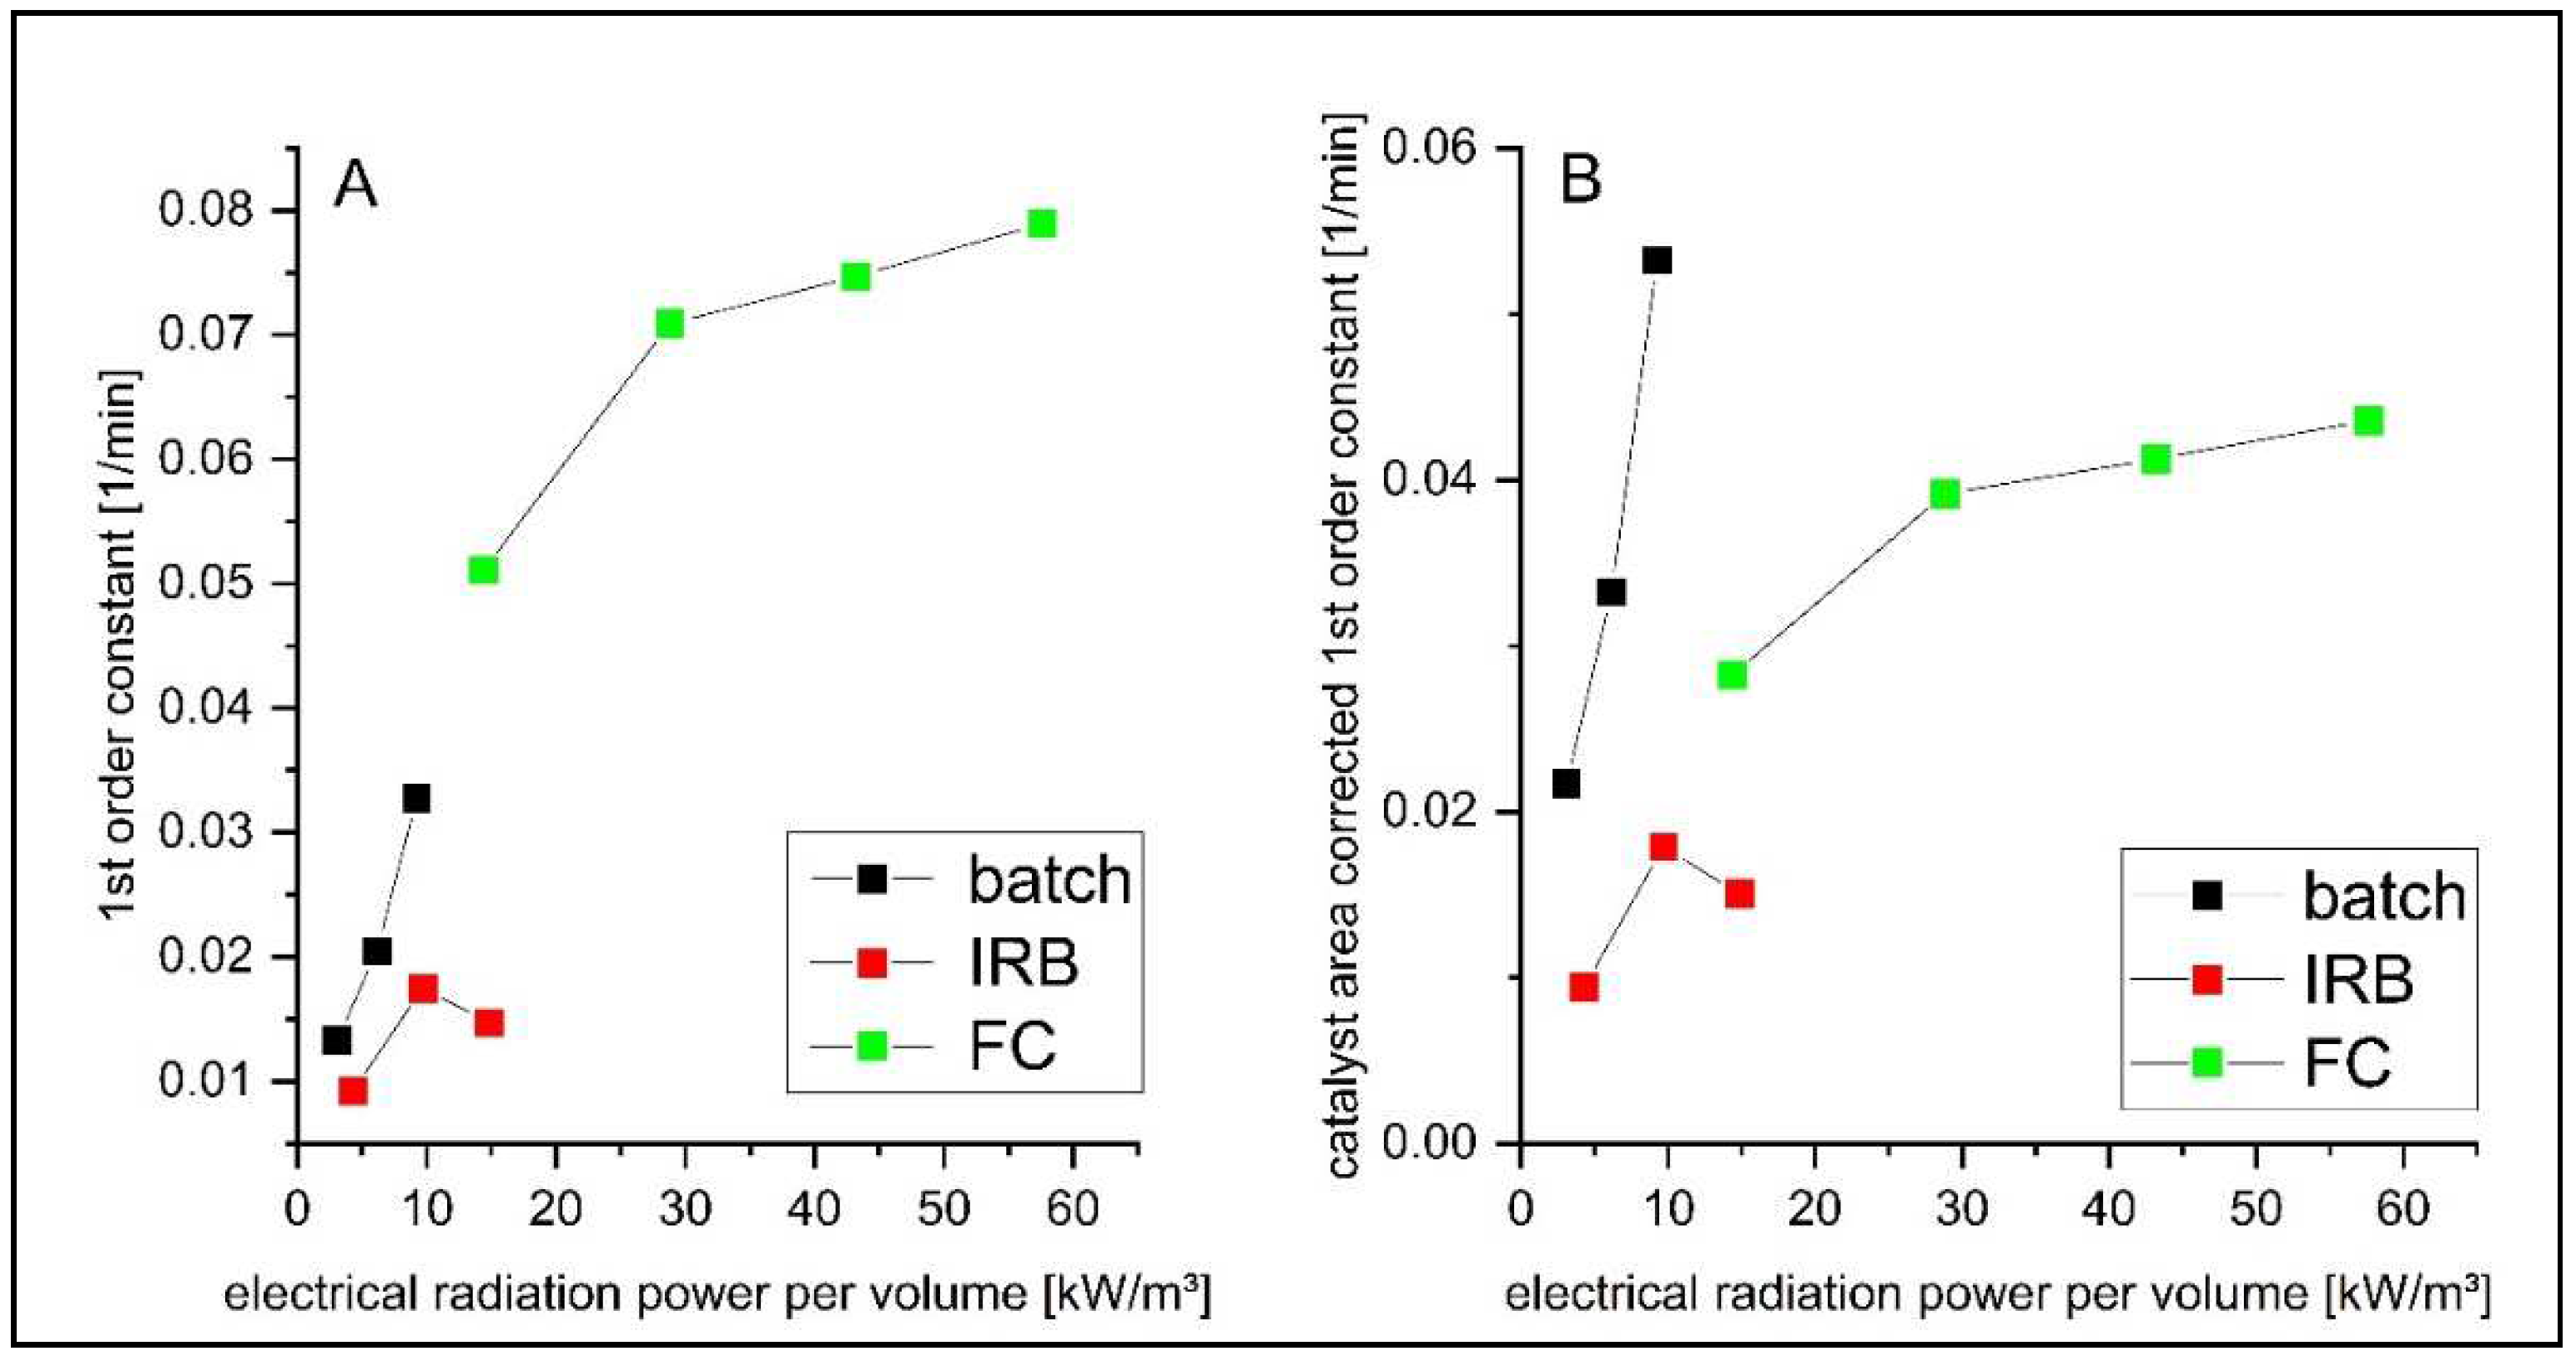
In Figure 7A the mean 1st order reaction constants for all experimental steps are shown in relation to each electrical irradiation power. Similar to Figure 6, overall higher values were achieved for the flat cell reactor. The progression of curves indicates an overlapping behaviour at similar radiation powers for batch and flat cell reactor. The immersion rotary body reactor showed overall lower mean reaction rates. For all reactors, an increase in radiation power was associated with higher degradation rates. For the flat cell, as well as the immersion rotary body reactor, efficiency losses at higher radiation powers can be observed. This effect can be caused by the quantum efficiency of the catalysts, diffusion processes, or substances specific adsorption affinities. In Figure 7B, the influence of varying irradiated catalyst area to hydraulic volume (A/V) ratios was corrected assuming a linear relation to the mean 1st order constants. The A/V values of the batch (30.8 m2/m3), flat cell (90.5 m2/m3), and immersion rotary body (48.9 m2/m3) were scaled to an intermediate value of 50 m2/m3. It is evident that the comparatively high reaction performance of the flat cell reactor is mainly caused by its higher A/V ratio. The reaction rates of flat cell and batch reactor show similar magnitudes; however, for the batch reactor, these are achieved with significantly lower irradiation powers. The immersion rotary body reactor shows overall about a 2–3 times lower reaction rate even at significantly higher irradiation powers than the batch reactor.
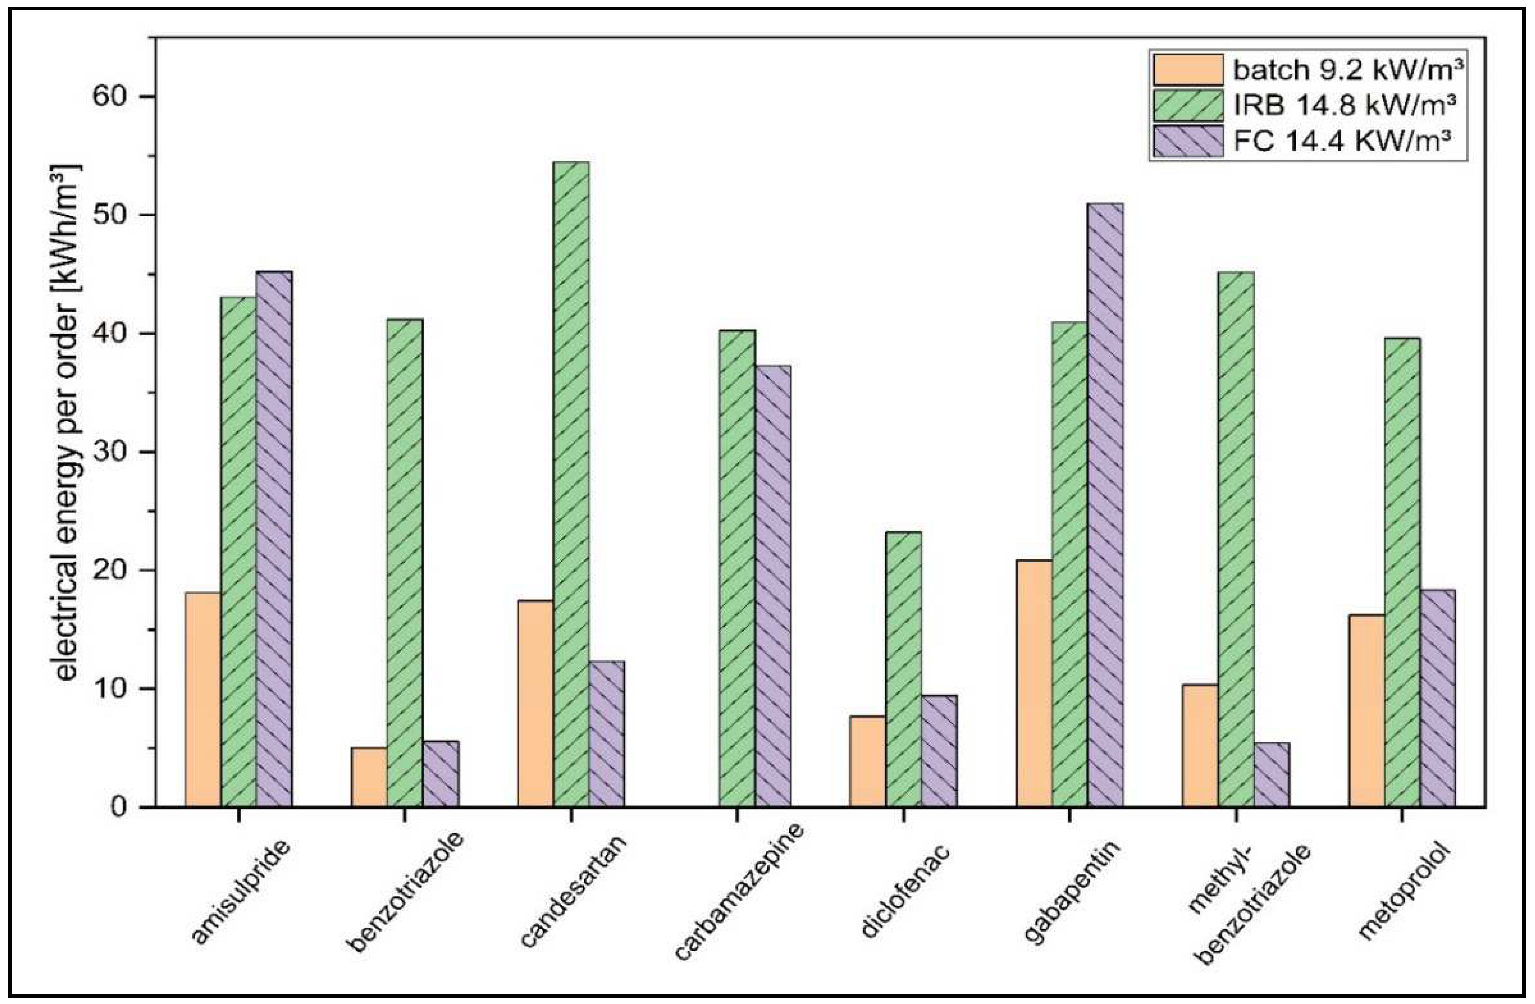
The EE/O values were calculated for all experimental steps using the mean 1st order reaction constant of every micro-pollutant. The result is shown in Figure 8 for all micro-pollutants and the three reactor types at similar radiation power per hydraulic volume. The lowest EE/O values of 5–10 kWh/m3 were achieved for benzotriazole and diclofenac within the batch and flat cell reactor. Within the batch reactor, the other investigated substances were degraded with EE/O values of 10–20 kWh/m3. For the immersion rotary body reactor, overall higher EE/O values were measured ranging from 30 to 60 kWh/m3. The flat cell showed the biggest substance specific range of energy demand with values from 5 to 50 kWh/m3.
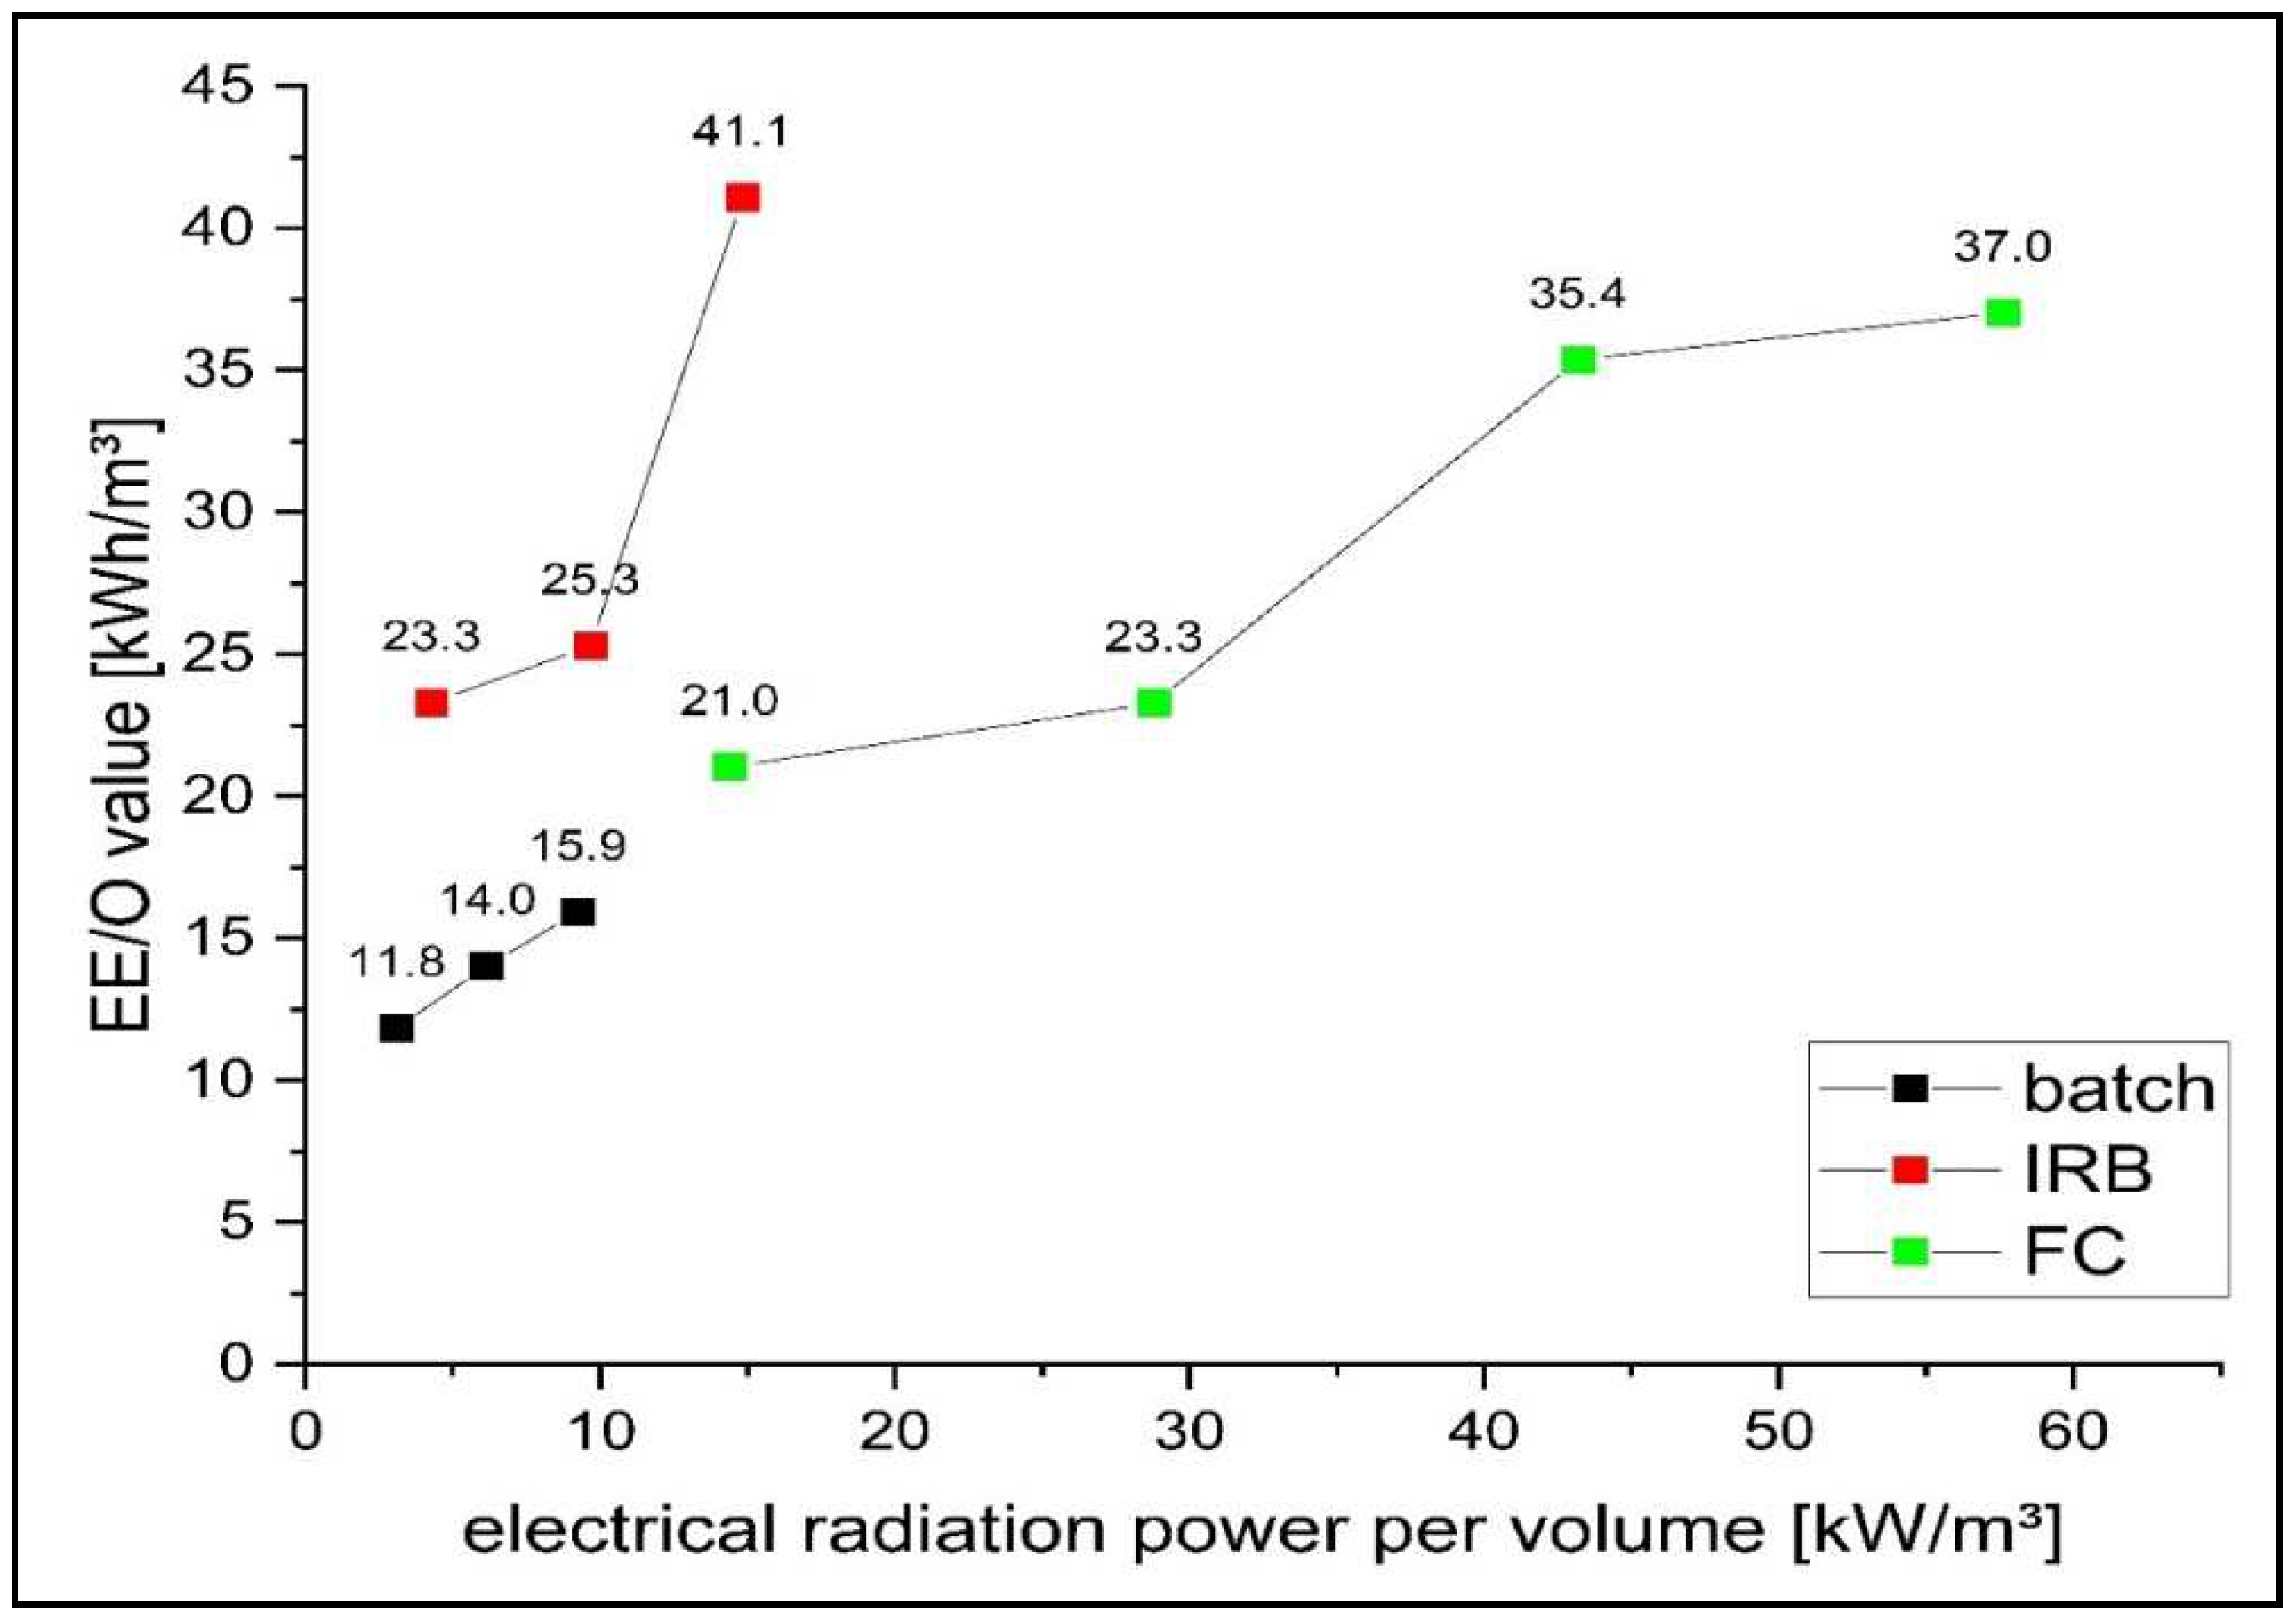
In Figure 9, the mean EE/O values for every experiment are shown in relation to the LED power depicted as the electrical irradiation power per hydraulic volume. For all three reactors, lower EE/O values were archived when using lower radiation lowers and consequentially higher treatment durations. This effect resulted in a 25–45% reduction in energy consumption. Significant differences are evident in the overall energy efficiency of the investigated reactor systems. The batch reactor achieved the lowest EE/O values of 11.8–15.9 kWh/m3. The EE/O values of the flat cell and immersion rotary body reactor were 2–3 times higher. Analogous to Figure 7A similar values at overlapping radiation powers are indicated by the curve progression of batch and flat cell reactor.
Given the use of similar catalyst material, wastewater samples, and reactor parameters, this result must be significantly influenced by the geometrical arrangement of the catalyst and associated hydraulic impacts. Within the immersion rotary body reactor, the catalyst is only periodically submerged within the medium. The catalyst within the batch reactor is permanently submerged. The hydraulic volume below the catalyst is in a turbulent state due to the magnetic mixer. In the flat cell reactor, the fluid is forced through the catalysts grid via the pressure gradient of the inlet pump. Based on these results, a submerged arrangement of catalysts proves beneficial in terms of energetic efficiency, whereby no difference could be found between external sources of turbulence and flow path through the catalysts mesh itself.
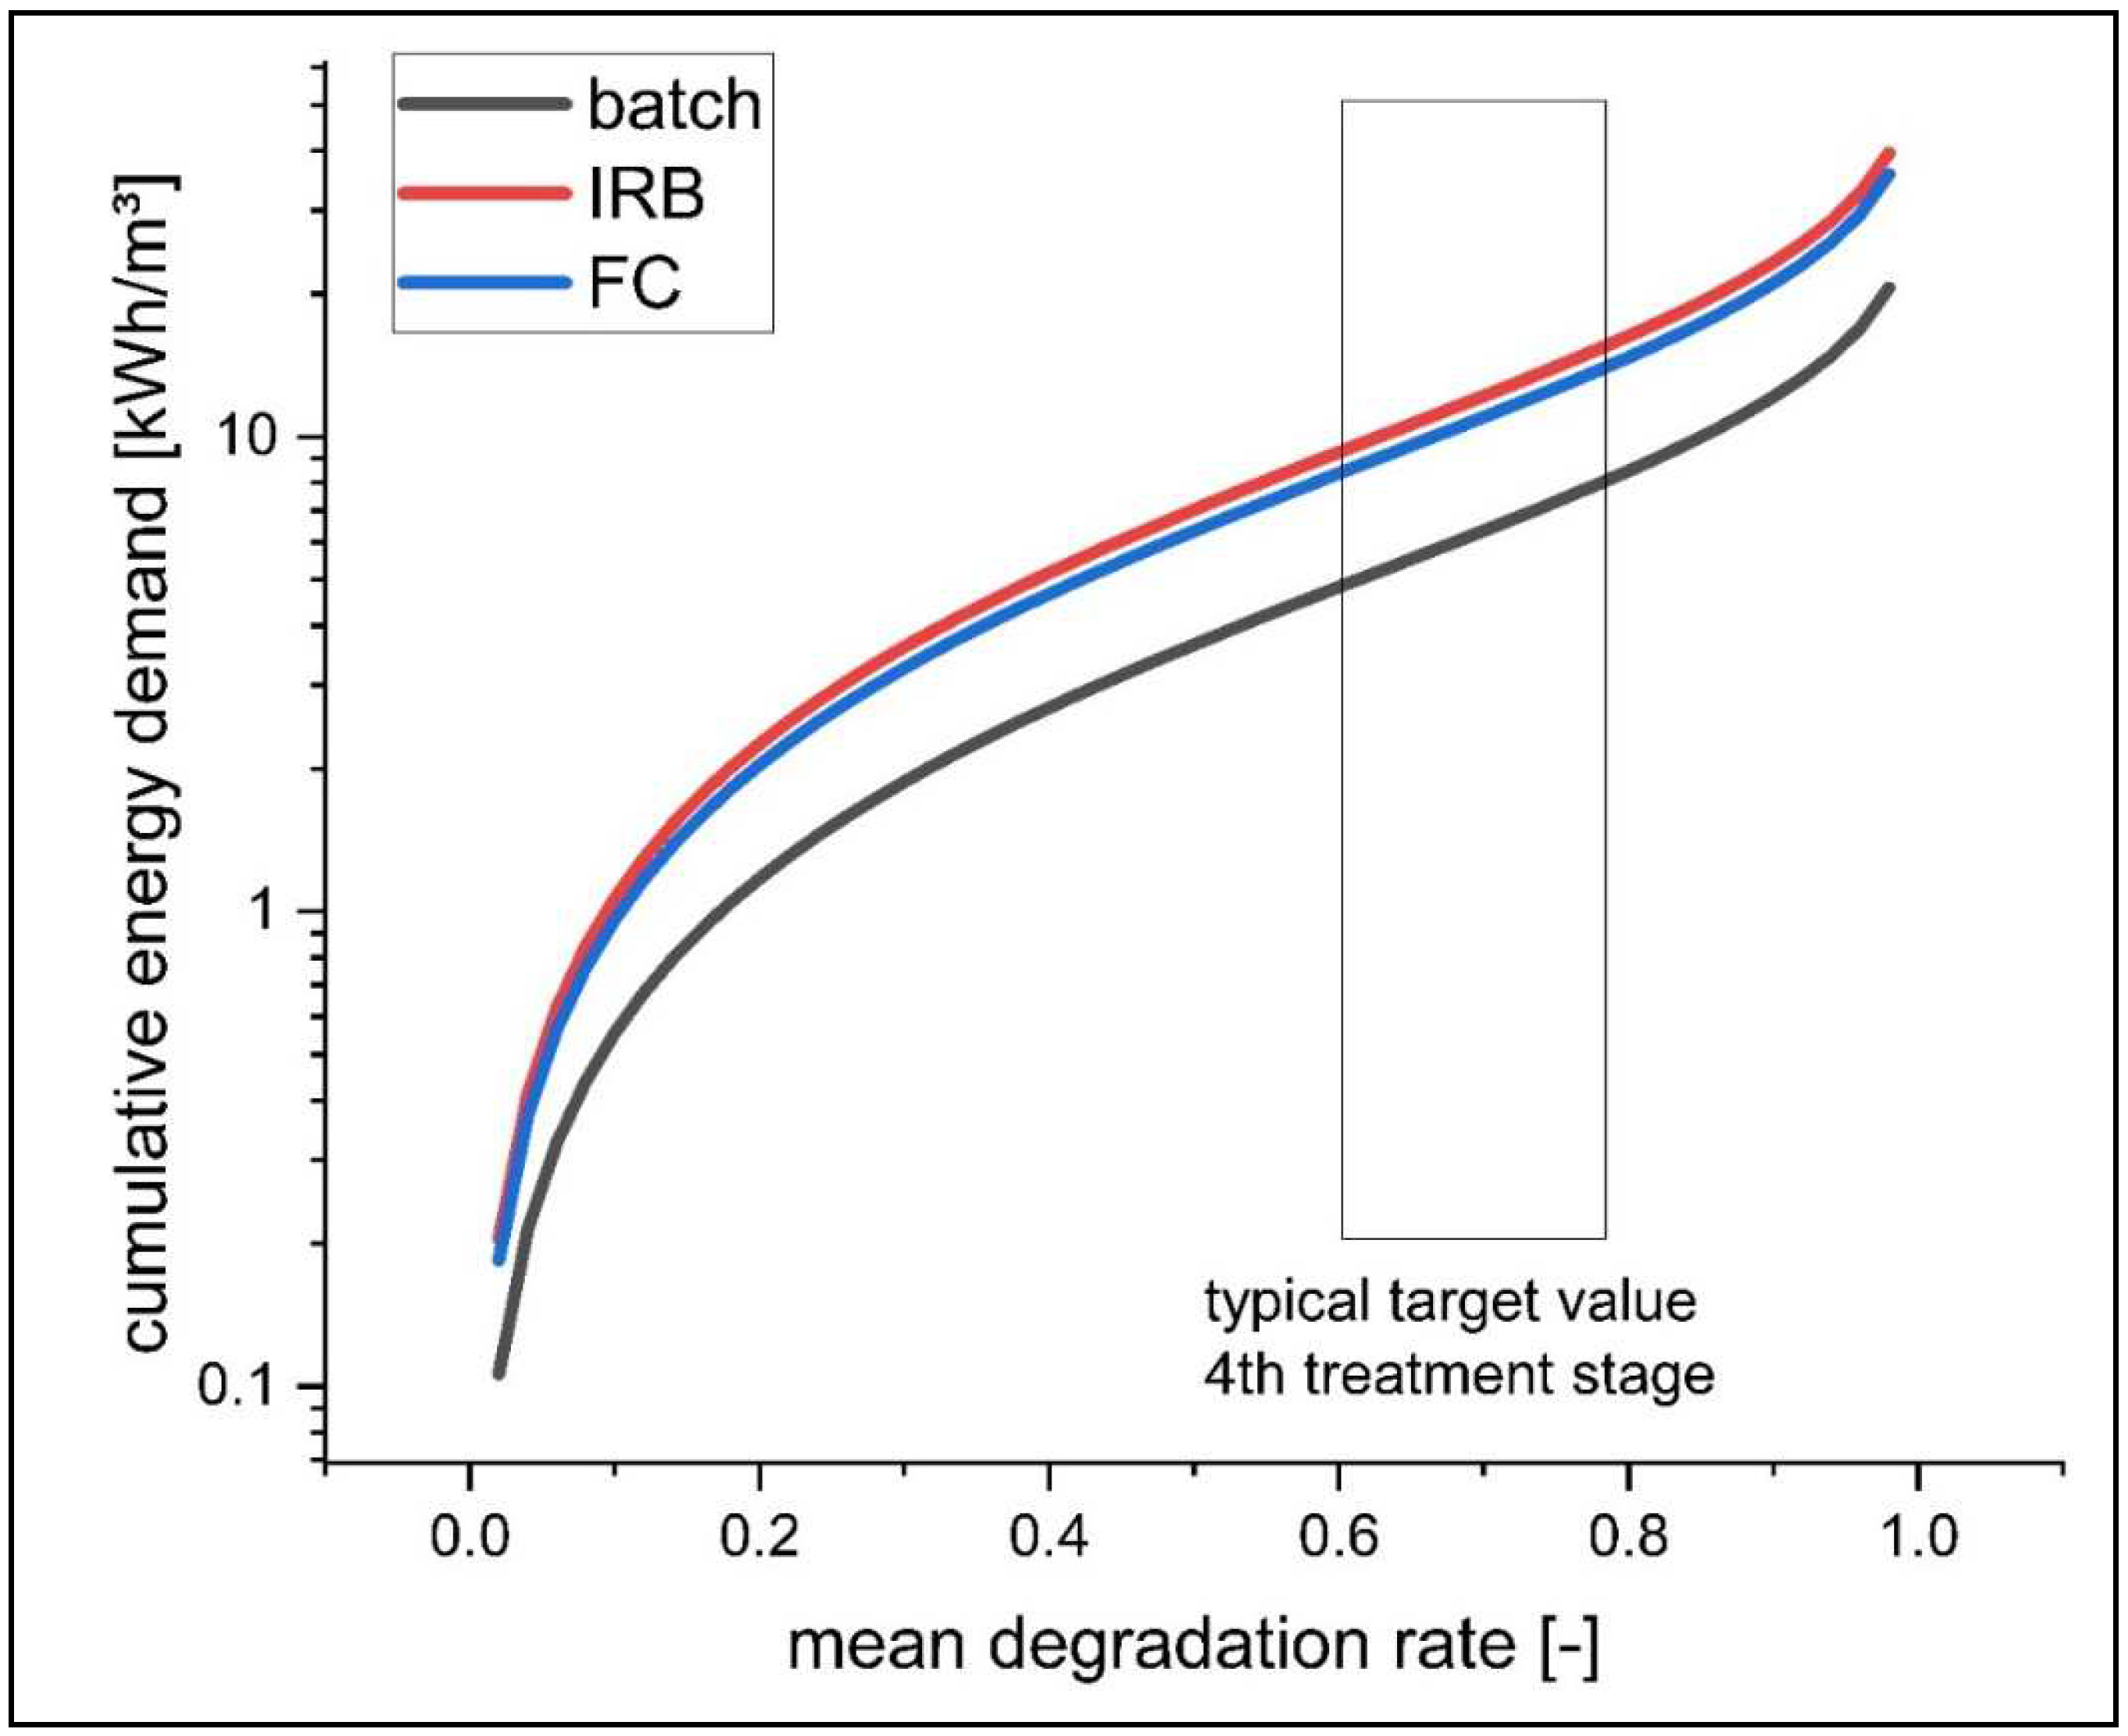
The energy demand for variable mean degradation rates was calculated based on the experimental results of all reactor types (Figure 10). For all reactors, the 1st order constant, which resulted in the lowest EE/O value, was chosen for calculation. Typical treatment target values, as described within the introduction, are indicated graphically. Using the batch reactor, a 75% degradation rate can be achieved with an electrical energy input of 7000 Wh/m3. The flat cell and immersion rotary body reactor had an energy demand of 12,000–14,000 Wh/m3 to achieve a similar degradation. However, following the trend described in Figure 9, values similar to the batch reactor are to be expected when using the flat cell reactor with lower radiation intensities.
Compared to the state of the art, with typical values of 100–300 Wh/m3, further improvement is still needed to achieve a beneficial use of photocatalytic technics. However, compared to the immersion body reactor, significant improvement in energetic efficiency could be achieved at a laboratory scale. When comparing the results to previous measurement of EE/O values within wastewater, similar EE/O values were achieved within the immersion rotary body and flat cell reactor system [20]. The results of the batch reactor test showed an overall improvement in energetic efficiency with EE/O values ranging from 5 to 20 kWh/m3. When comparing the EE/O values aggregated in [12], significantly lower energy demands (up to 240 Wh/m3) were measured for the degradation of various indicator substances (e.g., methylene blue, methylene orange, malachite green). However, a comparability of results is not given due the use of ultra-pure water and the increased degradation affinity of these indicator substances. In [28], an energy demand of 38–47 kWh/m3 was determined for the degradation of phenol within secondary effluent using suspended TiO2 catalysts.
4. Conclusions
In this work, the degradation performance for the photocatalytic oxidation of eight micro-pollutants with real secondary effluent was investigated using three different reactor designs. Flat cell and batch reactor showed similar substance specific degradation behaviors. Within the immersion rotary body reactor, benzotriazole and methyl-benzotriazole showed a significantly lower degradation affinity. The flat cell reactor achieved the highest mean degradation rate due to its high catalysts surfaces to hydraulic volume ratio. The EE/O values were calculated for all micro-pollutants as well as the mean degradation rate constant of each experimental step. The lowest substance specific EE/O values of 5 kWh/m3 were measured for benzotriazole within the batch reactor. The batch reactor also reached the lowest mean values (11.8–15.9 kWh/m3) followed by the flat cell reactor (21.0–37.0 kWh/m3) and immersion rotary body reactor (23.9–41.0 kWh/m3). Catalyst arrangement and irradiation power were identified as major influences on the energetic performance of the reactors. A high catalyst surface to hydraulic volume ratio, which led to high degradation rates within the flat cell reactor showed no beneficial impact on energetic efficiency. A treatment according to existing treatment goals of wastewater treatment plants can be achieved using the batch reactor with a calculated energy demand of 7000 Wh/m3. Compared to existing literature values, an improved energetic efficiency was measured for the batch reactor configuration. This highlights the potential of this reactor type within photocatalytic wastewater treatment. However, a major difference compared to the energetic efficiency of ozonation and activated carbon still persists.
As mentioned in the introduction, the batch and flat cell reactor types were only developed on a laboratory scale. Especially in terms of radiation, transport optimizations, such as equalizing radiation fields, minimizing absorption of the liquid and reflections, are possible. Therefore, further research work regarding these reactor types is necessary. Following the results of [29], further increases in efficiency seem possible, when integration controlled periodic illumination (CPI) within the reactor systems. When comparing the energy demand with the state of the art (especially ozone oxidation), it also needs to be mentioned that a direct comparability is not given due to deviating oxidation, transformation, and mineralization characteristics of each reaction cascade. The beneficial effect of AOP on the formation of transformation products as described in [30] needs to be seriously considered when comparing treatment options.
Supplementary Materials
The following are available online at https://www.mdpi.com/article/10.3390/w14172681/s1, Table S1: Experimental program; Table S2: Concentrations; Table S3: Kinetics.
Author Contributions
Conceptualization, S.M.; methodology, S.M. and T.S.; investigation, S.M.; data curation, S.M.; writing—original draft preparation, S.M. and T.S.; writing—review and editing, S.M.; supervision, J.L. All authors have read and agreed to the published version of the manuscript.
Funding
This research was funded by Federal Ministry of Education and Research grant number [02WQ1492A].
Institutional Review Board Statement
Not applicable.
Informed Consent Statement
Not applicable.
Data Availability Statement
Supporting data can be found in Supplementary Materials.
Conflicts of Interest
The authors declare no conflict of interest.
References
- ECHA. EC Inventory. Edited by European Chemicals Agency, 2022. Available online: https://echa.europa.eu/information-on-chemicals/ec-inventory (accessed on 7 June 2022).
- Margot, J.; Rossi, L.; Barry, D.A.; Holliger, C. A review of the fate of micropollutants in wastewater treatment plants. WIREs Water 2015, 2, 457–487. [Google Scholar] [CrossRef]
- Kanaujiya, D.K.; Paul, T.; Sinharoy, A.; Pakshirajan, K. Biological Treatment Processes for the Removal of Organic Micropollutants from Wastewater: A Review. Curr. Pollut. Rep. 2019, 5, 112–128. [Google Scholar] [CrossRef]
- Gallé, T.; Pittois, D.; Bayerle, M.; Braun, C. An immission perspective of emerging micropollutant pressure in Luxembourgish surface waters: A simple evaluation scheme for wastewater impact assessment. Environ. Pollut. 2019, 253, 992–999. [Google Scholar] [CrossRef] [PubMed]
- Guillossou, R.; Le Roux, J.; Brosillon, S.; Mailler, R.; Vulliet, E.; Morlay, C.; Nauleau, F.; Rocher, V.; Gaspéri, J. Benefits of ozonation before activated carbon adsorption for the removal of organic micropollutants from wastewater effluents. Chemosphere 2020, 245, 125530. [Google Scholar] [CrossRef] [PubMed]
- Guillossou, R.; Le Roux, J.; Mailler, R.; Vulliet, E.; Morlay, C.; Nauleau, F.; Gasperi, J.; Rocher, V. Organic micropollutants in a large wastewater treatment plant: What are the benefits of an advanced treatment by activated carbon adsorption in comparison to conventional treatment? Chemosphere 2019, 218, 1050–1060. [Google Scholar] [CrossRef]
- Bourgin, M.; Beck, B.; Boehler, M.; Borowska, E.; Fleiner, J.; Salhi, E.; Teichler, R.; von Gunten, U.; Siegrist, H.; McArdell, C.S. Evaluation of a full-scale wastewater treatment plant upgraded with ozonation and biological post-treatments: Abatement of micropollutants, formation of transformation products and oxidation by-products. Water Res. 2018, 129, 486–498. [Google Scholar] [CrossRef]
- Abegglen, C.; Siegrist, H. Mikroverunreinigungen aus Kommunalem Abwasser Verfahren zur Weitergehenden Elimination auf Kläranlagen (Micropollutants from Municipal Wastewater Process for further Elimination in Sewage Treatment Plants); Federal Office for the Environment BAFU: Ittigen, Switzerland, 2012. [Google Scholar]
- Kanakaraju, D.; Glass, B.D.; Oelgemöller, M. Advanced oxidation process-mediated removal of pharmaceuticals from water: A review. J. Environ. Manag. 2018, 219, 189–207. [Google Scholar] [CrossRef]
- Kisch, H. Semiconductor Photokatalysis—Principles and Applications; Wiley: Hoboken, NJ, USA, 2015. [Google Scholar]
- Pitre, S.P.; Yoon, T.P.; Scaiano, J.C. Titanium dioxide visible light photocatalysis: Surface association enables photocatalysis with visible light irradiation. Chem. Commun. 2017, 53, 4335–4338. [Google Scholar] [CrossRef]
- Sundar, K.P.; Kanmani, S. Progression of Photocatalytic reactors and it’s comparison: A Review. Chem. Eng. Res. Des. 2019, 154, 135–150. [Google Scholar] [CrossRef]
- Sacco, O.; Vaiano, V.; Sannino, D. Main parameters influencing the design of photocatalytic reactors for wastewater treatment: A mini review. J. Chem. Technol. Biotechnol. 2020, 95, 2608–2618. [Google Scholar] [CrossRef]
- Wang, D.; Mueses, M.A.; Márquez, J.A.C.; Machuca-Martínez, F.; Grčić, I.; Moreira, R.P.M.; Puma, G.L. Engineering and modeling perspectives on photocatalytic reactors for water treatment. Water Res. 2021, 202, 117421. [Google Scholar] [CrossRef]
- Mecha, A.C.; Chollom, M.N. Photocatalytic ozonation of wastewater: A review. Environ. Chem. Lett. 2020, 18, 1491–1507. [Google Scholar] [CrossRef]
- Mehrjouei, M.; Müller, S.; Möller, D. A review on photocatalytic ozonation used for the treatment of water and wastewater. Chem. Eng. J. 2015, 263, 209–219. [Google Scholar]
- Benotti, M.J.; Stanford, B.D.; Wert, E.C.; Snyder, S.A. Evaluation of a photocatalytic reactor membrane pilot system for the removal of pharmaceuticals and endocrine disrupting compounds from water. Water Res. 2009, 43, 1513–1522. [Google Scholar] [CrossRef]
- Silva, D.B.; Buttiglieri, G.; Babić, S. State-of-the-art and current challenges for TiO2/UV-LED photocatalytic degradation of emerging organic micropollutants. Environ. Sci. Pollut. Res. 2021, 28, 103–120. [Google Scholar] [CrossRef]
- Kelly, J.; Morrison, G.; Skillen, N.; Manesiotis, P.; Robertson, P. An investigation of the role of pH in the rapid photocatalytic degradation of MCPA and its primary intermediate by low-power UV LED irradiation. Chem. Eng. J. 2019, 359, 112–118. [Google Scholar] [CrossRef]
- Biancullo, F.; Moreira, N.F.; Ribeiro, A.R.; Manaia, C.M.; Faria, J.L.; Nunes, O.C.; Castro-Silva, S.M.; Silva, A.M. Heterogeneous photocatalysis using UVA-LEDs for the removal of antibiotics and antibiotic resistant bacteria from urban wastewater treatment plant effluents. Chem. Eng. J. 2019, 367, 304–313. [Google Scholar] [CrossRef]
- GSchV (1/1/2020). Gewässerschutzverordnung (Water Protection Ordinance) Switzerland. Available online: https://fedlex.data.admin.ch/filestore/fedlex.data.admin.ch/eli/cc/1998/2863_2863_2863/20210101/en/pdf-a/fedlex-data-admin-ch-eli-cc-1998-2863_2863_2863-20210101-en-pdf-a-1.pdf (accessed on 1 April 2022).
- Competence Center for Trace Substances Baden-Württemberg. Handlungsempfehlungen für die Vergleichskontrolle und den Betrieb von Verfahrenstechniken zur gezielten Spurenstoffelimination (Recommendations for Action for Comparative Control and the Operation of Process Technologies for Targeted Trace Substance Elimination); Kompetenzzentrum Spurenstoffe: Stuttgart, Germany, 2018. [Google Scholar]
- Mehling, S.; Schnabel, T.; Londong, J. Photocatalytic ozonation in an immersion rotary body reactor for the removal of micro-pollutants from the effluent of wastewater treatment plants. Water Sci. Technol. 2021, 85, 535–548. [Google Scholar] [CrossRef]
- Schnabel, T.; Mehling, S.; Londong, J.; Springer, C. Hydrogen peroxide-assisted photocatalytic water treatment for the removal of anthropogenic trace substances from the effluent of wastewater treatment plants. Water Sci. Technol. 2020, 82, 2019–2028. [Google Scholar] [CrossRef]
- DIN 38407-47:2017-07; German Standard Methods for the Examination of Water, Waste Water and Sludge. International Organization for Standardization: Geneva, Switzerland, 2017.
- Lin, Y.; Ferronato, C.; Deng, N.; Wu, F.; Chovelon, J.-M. Photocatalytic deg-radation of methylparaben by TiO2: Multivariable experimental design and mechanism. Appl. Catal. B Environ. 2009, 88, 32–41. [Google Scholar] [CrossRef]
- Asenjo, N.G.; Santamaría, R.; Blanco, C.; Granda, M.; Álvarez, P.; Menéndez, R. Correct use of the Langmuir–Hinshelwood equation for proving the absence of a synergy effect in the photocatalytic degradation of phenol on a suspended mixture of titania and activated carbon. Carbon 2013, 55, 62–69. [Google Scholar] [CrossRef]
- Mecha, A.C.; Onyango, M.S.; Ochieng, A.; Momba, M.N. Ultraviolet and solar photocatalytic ozonation of municipal wastewater: Catalyst reuse, energy requirements and toxicity assessment. Chemosphere 2017, 186, 669–676. [Google Scholar] [CrossRef] [PubMed]
- Liang, R.; Van Leuwen, J.C.; Bragg, L.M.; Arlos, M.J.; Fong, L.C.L.C.; Schneider, O.M.; Jaciw-Zurakowsky, I.; Fattahi, A.; Rathod, S.; Peng, P.; et al. Utilizing UV-LED pulse width modulation on TiO2 advanced oxidation processes to enhance the decomposition efficiency of pharmaceutical micropollutants. Chem. Eng. J. 2019, 361, 439–449. [Google Scholar] [CrossRef]
- Rueda-Marquez, J.J.; Levchuk, I.; Ibañez, P.F.; Sillanpää, M. A critical review on application of photocatalysis for toxicity reduction of real wastewaters. J. Clean. Prod. 2020, 258, 120694. [Google Scholar] [CrossRef]
Figure 1.
Schematic 3D-Model of the photocatalytic batch reactor.

Figure 2.
Schematic 3D-Model of the photocatalytic flat cell reactor.

Figure 3.
Schematic 3D-Model of the photocatalytic immersion body reactor (© Lynatox GmbH, 2020).

Figure 4.
Concentration curves of carbamazepine and concentration curves and first-order fitting curves for benzotriazole, diclofenac, and candesartan for batch reactor experiments.
Figure 4.
Concentration curves of carbamazepine and concentration curves and first-order fitting curves for benzotriazole, diclofenac, and candesartan for batch reactor experiments.

Figure 5.
Initial concentrations of micro-pollutants shown as boxplot and individual data point for all experimental steps measured in samples of the secondary effluent of the Weimar-Tiefurt treatment plant (IRB: immersion rotary body reactor; FC: flat cell reactor).
Figure 5.
Initial concentrations of micro-pollutants shown as boxplot and individual data point for all experimental steps measured in samples of the secondary effluent of the Weimar-Tiefurt treatment plant (IRB: immersion rotary body reactor; FC: flat cell reactor).

Figure 6.
Halftime constants for the degradation of micro-pollutants within batch, flat cell (FC), and immersion rotary body reactor (IRB) with similar electrical irradiation powers of 9.2 to 1483 kW/m3.
Figure 6.
Halftime constants for the degradation of micro-pollutants within batch, flat cell (FC), and immersion rotary body reactor (IRB) with similar electrical irradiation powers of 9.2 to 1483 kW/m3.

Figure 7.
Mean 1st order reaction constant for the degradation of micro-pollutants with the batch, flat cell (FC), and immersion rotary body reactor (IRB) for varying electrical irradiation powers (A); mean 1st order reaction constant with a linear correction to a surface area to volume ratio of 50 m2/m3 (B) (all mean values without carbamazepine).

Figure 8.
Calculated EE/O value for the photocatalytic oxidation of all micro-pollutants within all three reactor systems at a radiation power of 9.2–14.8 kW/m3.
Figure 8.
Calculated EE/O value for the photocatalytic oxidation of all micro-pollutants within all three reactor systems at a radiation power of 9.2–14.8 kW/m3.

Figure 9.
Mean EE/O values for the degradation of all eight micro-pollutants within the batch, flat cell, and immersion rotary body reactor as a function of the electrical irradiation per surface area (all mean values without carbamazepine).
Figure 9.
Mean EE/O values for the degradation of all eight micro-pollutants within the batch, flat cell, and immersion rotary body reactor as a function of the electrical irradiation per surface area (all mean values without carbamazepine).

Figure 10.
Energy demand per volume treated of the batch, flat cell (FC), and immersion rotary body reactor (IRB) in relation to the mean degradation rate of all measured micro-pollutants.
Figure 10.
Energy demand per volume treated of the batch, flat cell (FC), and immersion rotary body reactor (IRB) in relation to the mean degradation rate of all measured micro-pollutants.


Table 1.
Experimental reactor operation and geometric parameters.
| Batch Reactor | ||||
| Number | LED-power per irradiated catalyst area [W/m2] | Irradiated catalyst area per hydraulic volume [m2/m3] | LED-power per hydraulic volume [kW/m3] | Treatment time [min] |
| 1.1 | 99.94 | 30.79 | 3.08 | 90 |
| 1.2 | 199.88 | 6.15 | 90 | |
| 1.3 | 299.82 | 9.23 | 90 | |
| Immersion Rotary Body Reactor | ||||
| Number | LED-power per irradiated catalyst area [W/m2] | Irradiated catalyst area per hydraulic volume [m2/m3] | LED-power per hydraulic volume [kW/m3] | Hydraulic retention time [min] |
| 2.1 | 87.83 | 48.86 | 4.29 | 59.76 |
| 2.2 | 197.89 | 9.67 | 64.10 | |
| 2.3 | 303.72 | 14.84 | 63.83 | |
| Flat-Cell Reactor | ||||
| Number | LED-power per irradiated catalyst area [W/m2] | Irradiated catalyst area per hydraulic volume [m2/m3] | LED-power per hydraulic volume [kW/m3] | Hydraulic retention time [min] |
| 3.1 | 159.12 | 90.50 | 14.40 | 12.17 |
| 3.2 | 318.23 | 28.80 | 12.17 | |
| 3.3 | 477.35 | 43.20 | 12.17 | |
| 3.4 | 636.46 | 57.60 | 12.17 | |
Publisher’s Note: MDPI stays neutral with regard to jurisdictional claims in published maps and institutional affiliations. |
© 2022 by the authors. Licensee MDPI, Basel, Switzerland. This article is an open access article distributed under the terms and conditions of the Creative Commons Attribution (CC BY) license (https://creativecommons.org/licenses/by/4.0/).
Share and Cite
MDPI and ACS Style
Mehling, S.; Schnabel, T.; Londong, J. Investigation on Energetic Efficiency of Reactor Systems for Oxidation of Micro-Pollutants by Immobilized Active Titanium Dioxide Photocatalysis. Water 2022, 14, 2681. https://doi.org/10.3390/w14172681
AMA Style
Mehling S, Schnabel T, Londong J. Investigation on Energetic Efficiency of Reactor Systems for Oxidation of Micro-Pollutants by Immobilized Active Titanium Dioxide Photocatalysis. Water. 2022; 14(17):2681. https://doi.org/10.3390/w14172681
Chicago/Turabian StyleMehling, Simon, Tobias Schnabel, and Jörg Londong. 2022. "Investigation on Energetic Efficiency of Reactor Systems for Oxidation of Micro-Pollutants by Immobilized Active Titanium Dioxide Photocatalysis" Water 14, no. 17: 2681. https://doi.org/10.3390/w14172681
Note that from the first issue of 2016, this journal uses article numbers instead of page numbers. See further details here.