Article

The Emergent Integrated Constructed Wetland-Reservoir (CW-R) Is Being Challenged by 2-Methylisoborneol Episode—A Case Study in Yanlonghu CW-R

1
State Key Laboratory of Freshwater Ecology and Biotechnology, Institute of Hydrobiology, Chinese Academy of Sciences, Wuhan 430072, China
2
University of Chinese Academy of Sciences, Beijing 100049, China
*
Authors to whom correspondence should be addressed.
Water 2022, 14(17), 2670; https://doi.org/10.3390/w14172670
Submission received: 6 July 2022 / Revised: 27 August 2022 / Accepted: 28 August 2022 / Published: 29 August 2022
(This article belongs to the Section Water Quality and Contamination)

Abstract

:
Integrated constructed wetland-reservoirs (referred to as CW-Rs) are being built for ensuring drinking water supply in plain areas where the source water often cannot meet the quality criteria for drinking water. CW-Rs consist of a series of treatment units and have been reported to reduce the concentration of major nutrients. The efficiency of CW-Rs in mitigating odor compounds and their producer(s) remains largely unclear. In this study, Yanlonghu CW-R located in Jiangsu province, eastern China, was selected to monitor the occurrence and dynamics of 2-methylisoborneol (2-MIB). Two peaks of 2-MIB, attributed mainly to Pseudanabaena in April, and Pseudanabaena and Oscillatoria in July, were observed. This indicated that benthic Oscillatoria is also a threatening factor and should be considered. The concentrations of 2-MIB at the inlet and outlet were 9.75 and 50.08 ng/L in April and 73.11 and 25.21 ng/L in July, respectively. Yanlonghu CW-R was reported to be effective in reducing the content of major nutrients (total phosphorus in particular) throughout the year. In addition, it was effective in mitigating the levels of 2-MIB-producers/2-MIB during the summer season. It is proposed that qPCR for mic gene detection can be performed to screen and establish an early warning method. We revealed that the 2-MIB episode is related to the function of the CW-R, which is shown to be different from what is known in lakes or reservoirs. It is emphasized that each treatment unit of CW-R should be maintained at full capacity so that the frequency and hazardous effects caused by 2-MIB in the system can be controlled or reduced. This finding is implicated in the control strategy selection and contributes to the better management and improvement of future applications.

1. Introduction

Earthy and musty odor problems are widely present in aquaculture and freshwater bodies, which are mainly caused by geosmin and 2-methylisoborneol (2-MIB) [1,2,3]. Geosmin and 2-MIB are volatile organic compounds and secondary metabolites produced by planktonic and benthic cyanobacteria, actinomycetes, fungi, and mycobacteria [4,5]. Though taste and odor compounds are not reported to have any typical toxicological effects or other biological effects on humans at environmental concentrations [6,7], consumers of drinking water or aquaculture foods often complain of taste and odor. Therefore, water treatment to remove these compounds increases the cost of drinking water [2]. Recent studies have reported that the odor from cyanobacteria in drinking water is a global problem [8,9,10,11]. In many countries, water authorities are urged to strictly control the levels of odor compounds based on national standards for drinking water quality (between 4 and 10 ng/L for geosmin and 2-MIB, respectively) [12,13]. Concerning the control of odor-compound-producing filamentous cyanobacteria, it is generally accepted that controlling eutrophication is one of the key measures, although it is well known that the level of nutrients is not necessarily consistent with the abundance of filamentous cyanobacteria [14]. In addition, the growth of filamentous cyanobacteria and release of odorants are influenced by several factors such as light, temperature, and water depth [15,16]. In view of the wide application of emerging types of water treatment/supply systems, such as the South-to-North Water Diversion Project and integrated constructed wetland-reservoirs (CW-Rs) [17,18], studying the dynamics of odorants and their producers is imperative to gain a better understanding of the systems and employ better management. Since the identification of the fundamental 2-MIB synthase gene, studies are being conducted to assess its levels in laboratory cultures and in lakes, in reservoirs and recirculating systems through qPCR [8,19,20].
As a new type of water treatment/supply system, integrated CW-Rs are being built for drinking water purification and supply in some plain areas where the source water (mostly rivers) often cannot meet the quality criteria for drinking water. A CW-R normally consists of four units, including three primary purified units (zone I: pretreatment zone, zone II: emerged plants zone, and zone III: submerged plants zone) and one water storage unit (zone IV: deep purification reservoir) that is supposed to function as a purification system for reduction or transformation of major nutrients or phytoplankton. So far, CW-Rs have been reported to be effective in the absorption, sedimentation, or transformation of nutrients and other contaminants [21,22,23,24]. Therefore, although they could reduce the amount of major nutrients during the treatment, their efficiency in the abatement of abundant phytoplankton and the underlying mechanism remain largely unknown. Guo et al. (2020) reported that the odor problems in CW-Rs are more complex than those in valley or ground water reservoirs, suggesting that the system has almost no effect on odor removal [25]. However, the study had a limitation in helping the management of the system as it did not consider the spatial–temporal changes in the odor substance producer(s). The efficiency and sustainability of this type of CW-R and its influential factors are still unclear.
Over the past decade, this type of system is being increasingly adopted for water quality improvement. However, we are often informed by the managing agents that a gap exists between the actual and designed operational efficiency. In this study, Yanlonghu CW-R located in Jiangsu province, eastern China, was selected to assess the occurrence and dynamics of 2-MIB. Operated since 2012, the Yanlonghu CW-R has the capacity to provide 300,000 m3 tap water every day. We hypothesized that the dynamics of off-flavor substances in this emergent system would have their unique feature and may be different from that of the traditional reservoirs or lakes. This study aimed to establish the correlation between production of 2-MIB and physicochemical and biological parameters and assess the feasibility of the qPCR method for the detection of 2-MIB. In addition, this study aimed to provide strategies for the management of CW-Rs by evaluating the dynamics of odor compounds and removal efficiency of the CW-R. In the long run, the present study may be useful in improving the design of CW-Rs.

2. Materials and Methods

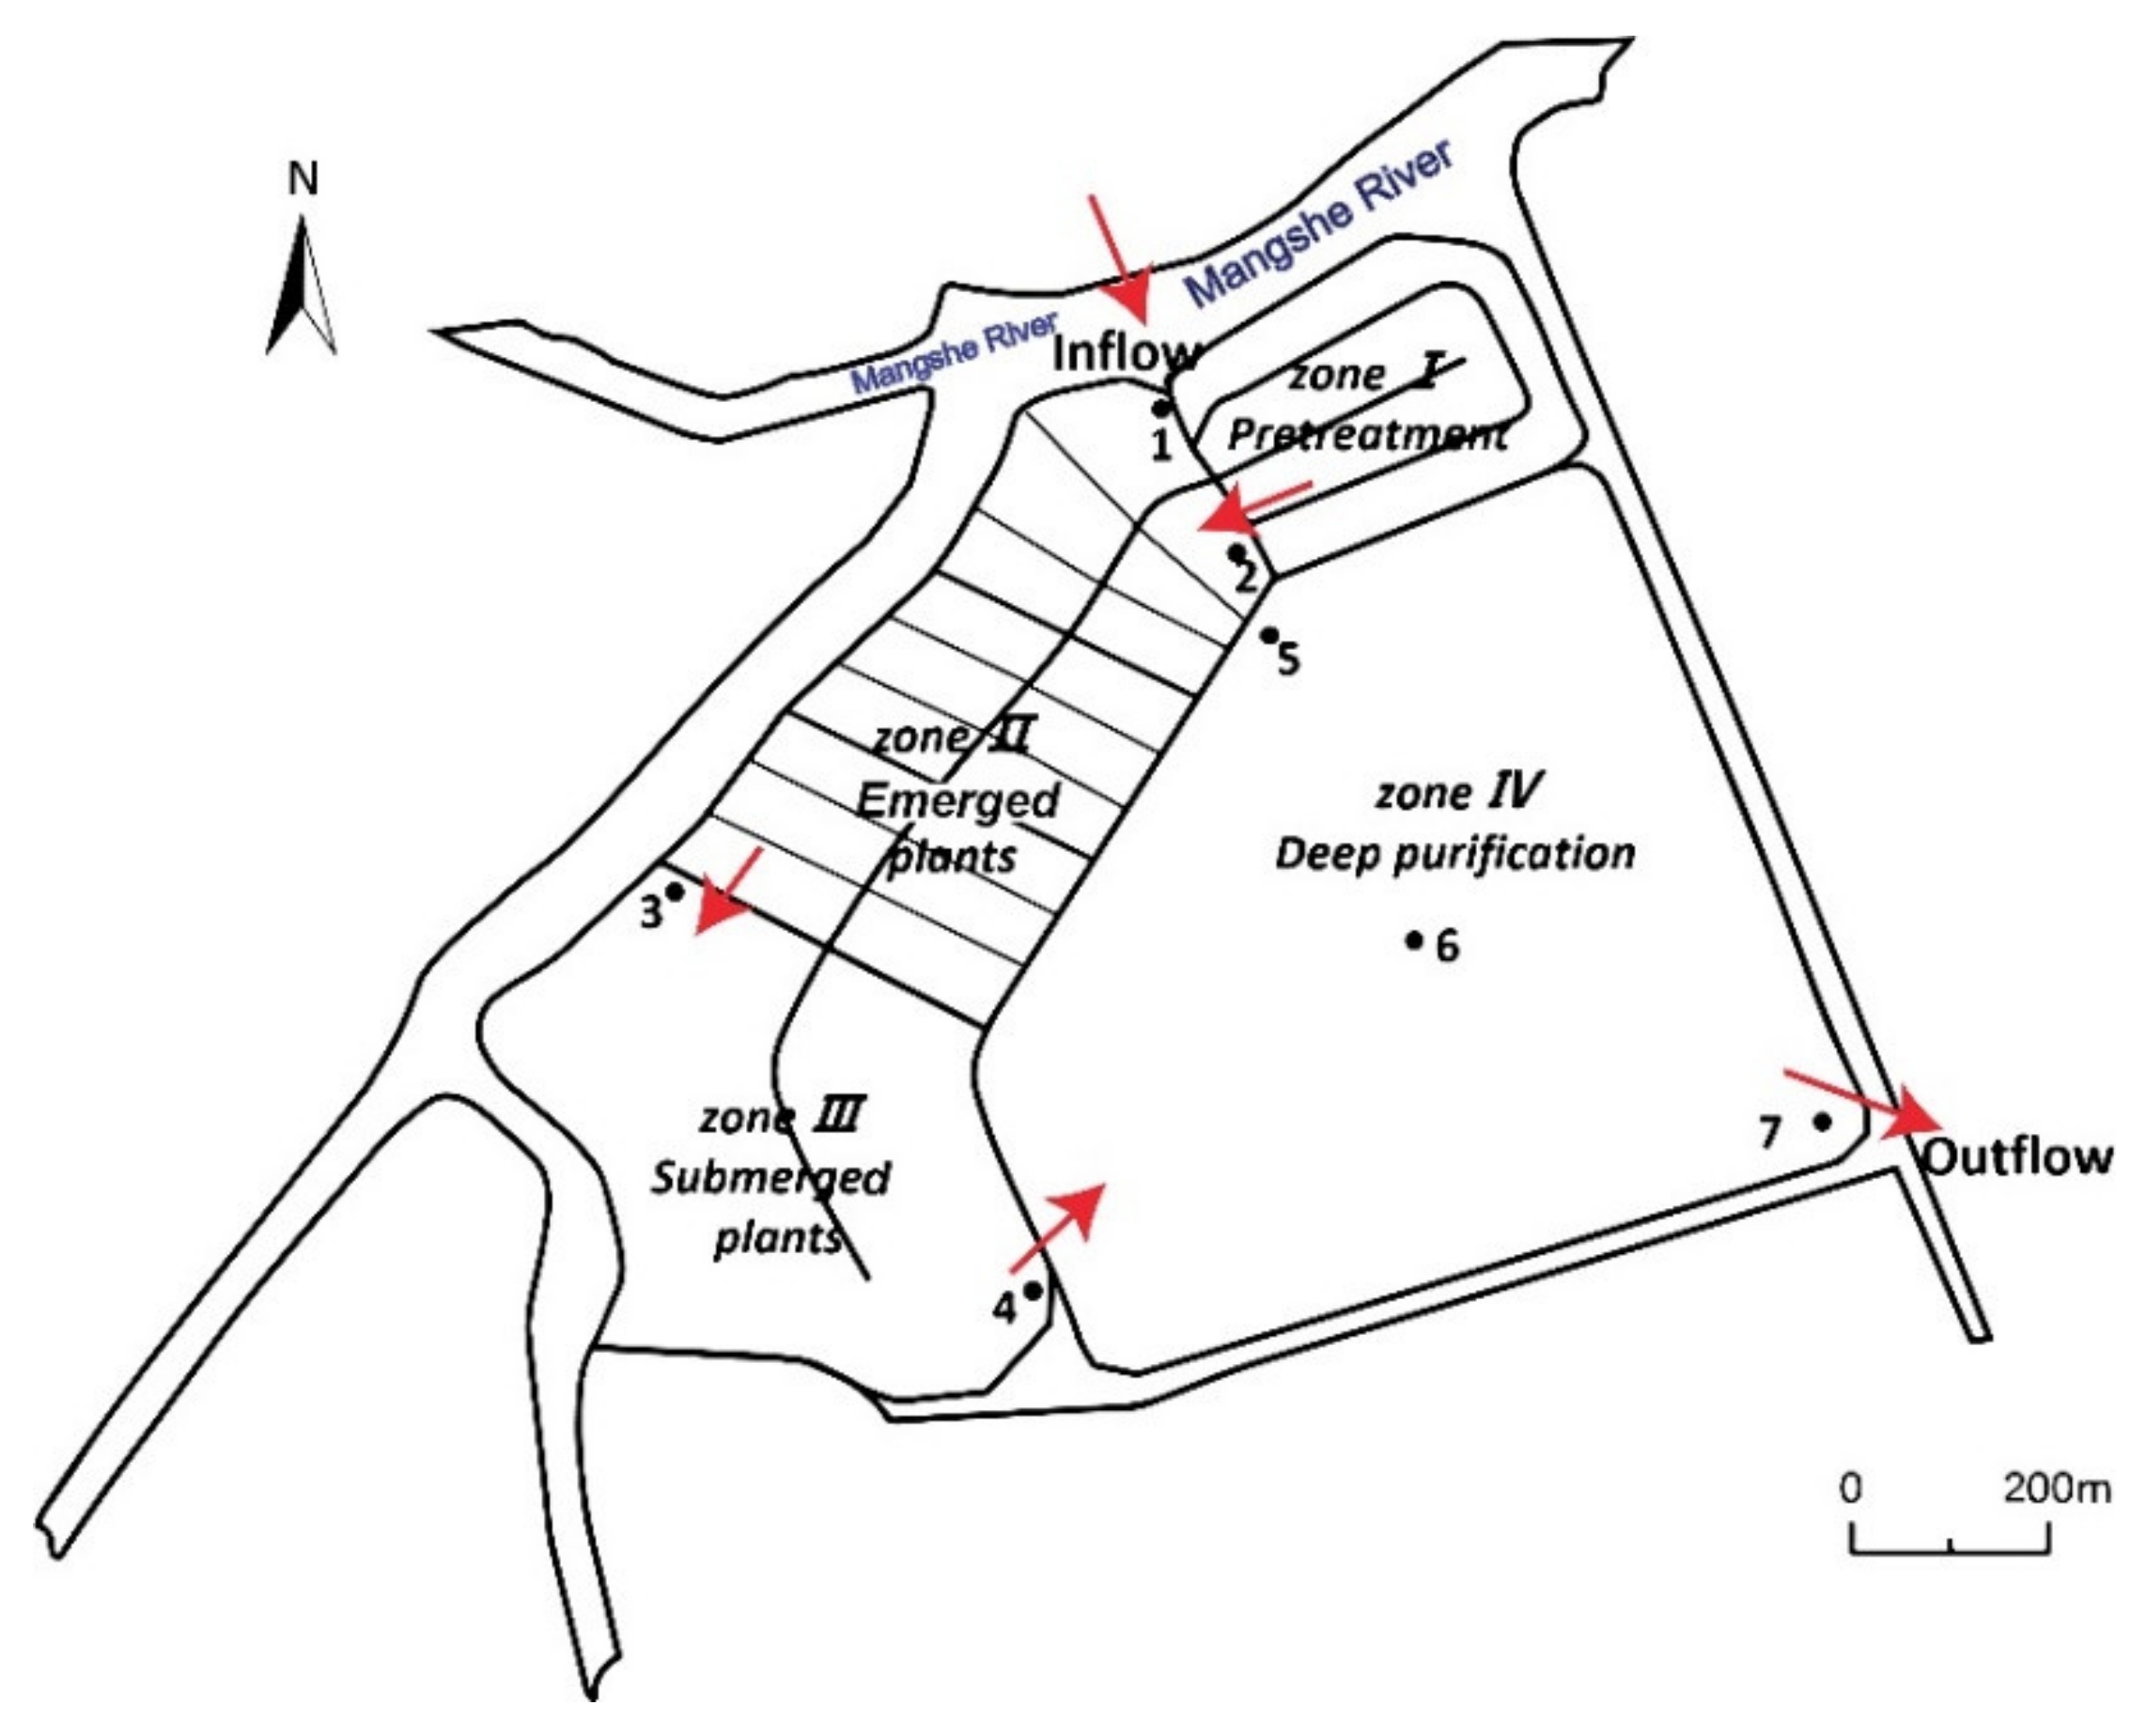
2.1. Study Area and Sampling

Yanlonghu CW-R (33°20′09.32″ N, 120° 01′10.38″ E) is the first multifunctional artificial wetland in the Northern Jiangsu Plain. Previously, almost all the drinking water was provided from the surface water of the river in the Yancheng City, China. Therefore, the artificially constructed drinking water system was built to improve drinking water quality. The influent water of zone I was pumped from Mangshe River. Zone I covered an area of 20.3 ha with an average water depth of 2 m, where suspended particles were gradually reduced along the two long “U” diversion channels. Zone II covered an area of 41.3 ha, with an average depth of 0.4 m, and was divided into 18 parts of surface flow constructed wetlands which were full of emerged plants including Zizania caduciflora, Phragmites communis, and Typha angustifolia. Zone III covered an area of 40 ha with a depth of 1.2–2.0 m, with submerged aquatic plants such as Myriophyllum verticillatum, Vallisneria natans, Antirrhinum majus, and Potamogeton crispus; however, the vegetation cover is quite low (<3%). Zone IV, the largest unit of the CW-R, covered an area of 109.3 ha with an average depth of 4.7 m and a water storage capacity of 4.6 million m3 to guarantee drinking water supply for 1 million people in Yancheng City for at least 7 days in case of urgency. During 2017, samples were taken monthly from the surface layer from seven sites (Figure 1). The sampling sites were set at the inlet and outlet of four processing units, in which S1 was at the inlet of the whole CW-R; S2 was at the outflow of zone I; S3 was at the outflow of zone II; S4 was at the outflow of zone III, and S5, S6, and S7 were at the inlet, center, and outlet of zone IV, respectively. Moreover, S7 was the outlet of the whole CW-R.
Water samples were collected once a month from January to December 2017. The EXO2 multiparameter sonde (Yellow Springs Instruments, Yellow Springs, OH, USA) was used in situ to detect physicochemical parameters, such as temperature, pH, turbidity, conductivity, dissolved oxygen, and fluorescent dissolved organic matter. The chemical parameters, such as total nitrogen (TN), dissolved total nitrogen (DTN) (GB 11894-89), total phosphorus (TP), dissolved total phosphorus (DTP), and ammonium (NH3-N) (HJ 535-2009), were measured according to Chinese standard methods [26]. Chlorophyll a (Chl a) was extracted using 90% acetone and its content was determined through spectrophotometry [27]. The samples were stored in 3.5-L PET bottles for DNA extraction, cell counting, and water parameter analysis. The samples were stored in 300-mL PE bottles for 2-MIB analysis and kept at −20 °C until analysis.

2.2. Identification of Phytoplankton Communities and Cell Counting

After sampling, 10 mL of Lugol’ s iodine solution was added to 1 L water. The supernatant was removed gently after a fixed 48 h and 30–50 mL concentrate has remained for cell counting. The cell numbers were counted using a microscope (Eclipse E200, Nikon Corporation, Tokyo, Japan) with a plankton counting chamber. The concentrate was placed in the dark until counting. 0.1 mL concentrate was transferred to the counting chamber, and the phytoplankton community was identified at the species level.

2.3. DNA Extraction and Quantification of 2-MIB Synthesis Gene through qPCR

MP FastDNA Spin Kit for Soil (MP Biomedicals, Irvine, CA, USA) was used to extract DNA. In total, 100 mL sample was filtered through a 0.22-μm nominal pore-size Nuclepore Track-Etch Membrane (Whatman, GE, New York, NY, USA), and the membrane was stored at −20 °C before processing. After extraction, the purity and concentration of DNA were evaluated by comparing the optical density at 260 and 280 nm using spectrophotometry (NanoDrop 8000, Thermo Fisher Inc., MA, USA).
The gene standards for RT-PCR experiments were prepared using previously extracted DNA from water samples. The mic fragments (202 bp) in cyanobacteria were amplified using specific primers MIB-Rf and MIB-Rr. The sequences were as follows: forward primer MIB-Rf (5′-CGACAGCTTCTACAYCYCCATGAC-3′) and reverse primer MIB-Rr (5′-CGCCGCAATCTGTAGCACCAT-3′) [20]. The PCR reaction mix (50 μL) contained 25 μL of 2× Es Taq MasterMix (CWBIO, Shanghai, China), 2 μL of each primer, 1 μL of template DNA, and RNase-Free Water (CWBIO, Shanghai, China) to make up the volume to 50 μL. The PCR conditions were as follows: predenaturation at 94 °C for 2 min; 35 cycles of 94 °C for 30 s, 59 °C for 30 s (annealing), and 72 °C for 30 s (extension); and a final extension at 72 °C for 2 min.
The PCR products were cloned in PMDTM 18-T Vector (Takara, Japan) and transferred to E. coli DH5α (Takara, Japan). Overall, 20 randomly selected clones were amplified using primers M13F (5′-CGCCAGGGTTTCCCAGTCAGAC-3′) and M13R (5′-AGCGGATAACAATTTCACACAGGA-3′) [28] and sequenced using the ABI 3730XL instrument (Invitrogen, China). After selecting the positive bacterial colonies, the recombinant plasmid was extracted using Plasmid Midiprep Kit (Shanghai Generay Biotech Co., Ltd., Shanghai, China). The number of gene copies was calculated as:
N c o p i e s   m L 1 = C D N A n g   m L 1 × 10 9 × 6.022 × 10 23 L p l a s m i d b p × 660
qPCR was performed in 96-well plates (Bio-Rad, CA, USA), which contained 10 μL of SYBR Green I (Toyobo, Tokyo, Japan), 0.5 μL of a final concentration of MIB-R (f/r), and double distilled water to make up the volume to 20 μL. The reactions were detected using a Bio-Rad cycler with the iQ5 real-time fluorescence system. The program was set as follows: 5 min at 95 °C; 40 cycles each consisting of 15 s at 95 °C and 30 s at 59 °C, and elongation at 72 °C for 30 s. The Melting Curve program had a heating rate of 0.5 °C per second through 70 to 95 °C. The amplification efficiencies for these standards were determined using the formula E = [10(−1/Slope) − 1], and the slope was calculated by plotting the log of the gene copy number by the threshold cycle number Ct values. The R2 value of the standard curves for qPCR assays with 10-fold serially diluted linear plasmid was 0.994, and the efficiency of amplification was 99.5% (Figure S2).

2.4. 2-MIB Analysis

Water samples for 2-MIB analysis were stored at 4 °C for 72 h or −20 °C for 5 days before subjecting them to head solid-phase microextraction (SPME) coupled with gas chromatography–mass spectrometry (GC–MS) (Agilent 5957T, Agilent Tech., Palo Alto, USA). 2-MIB standard (100 μg/mL; 47523-U, Sigma, Sigma Chemical Co. St. Louis, MO, USA) was used to plot standard curves. The SPME was performed in a 60 °C water bath in 120 mL screw-capped vials (Supelco 23230-U, Sigma) with PTFE septum and 65-μm polydimethylsiloxane -divinylbenzene (Supelco 57310-U, Sigma) fiber coating being the main parts [5]. Overall, 60 mL water samples and 18 g dry NaCl with a 2.5-cm stirrer were put into the 120 mL vial, and the fiber was injected through the septum for the headspace extraction for 40 min [29]. After incubation, the fiber was desorbed for 2 min at 250 °C. The 2-MIB concentrations in water samples were calculated using the standard curves drawn using the software Agilent Quantitative Analysis.

3. Results

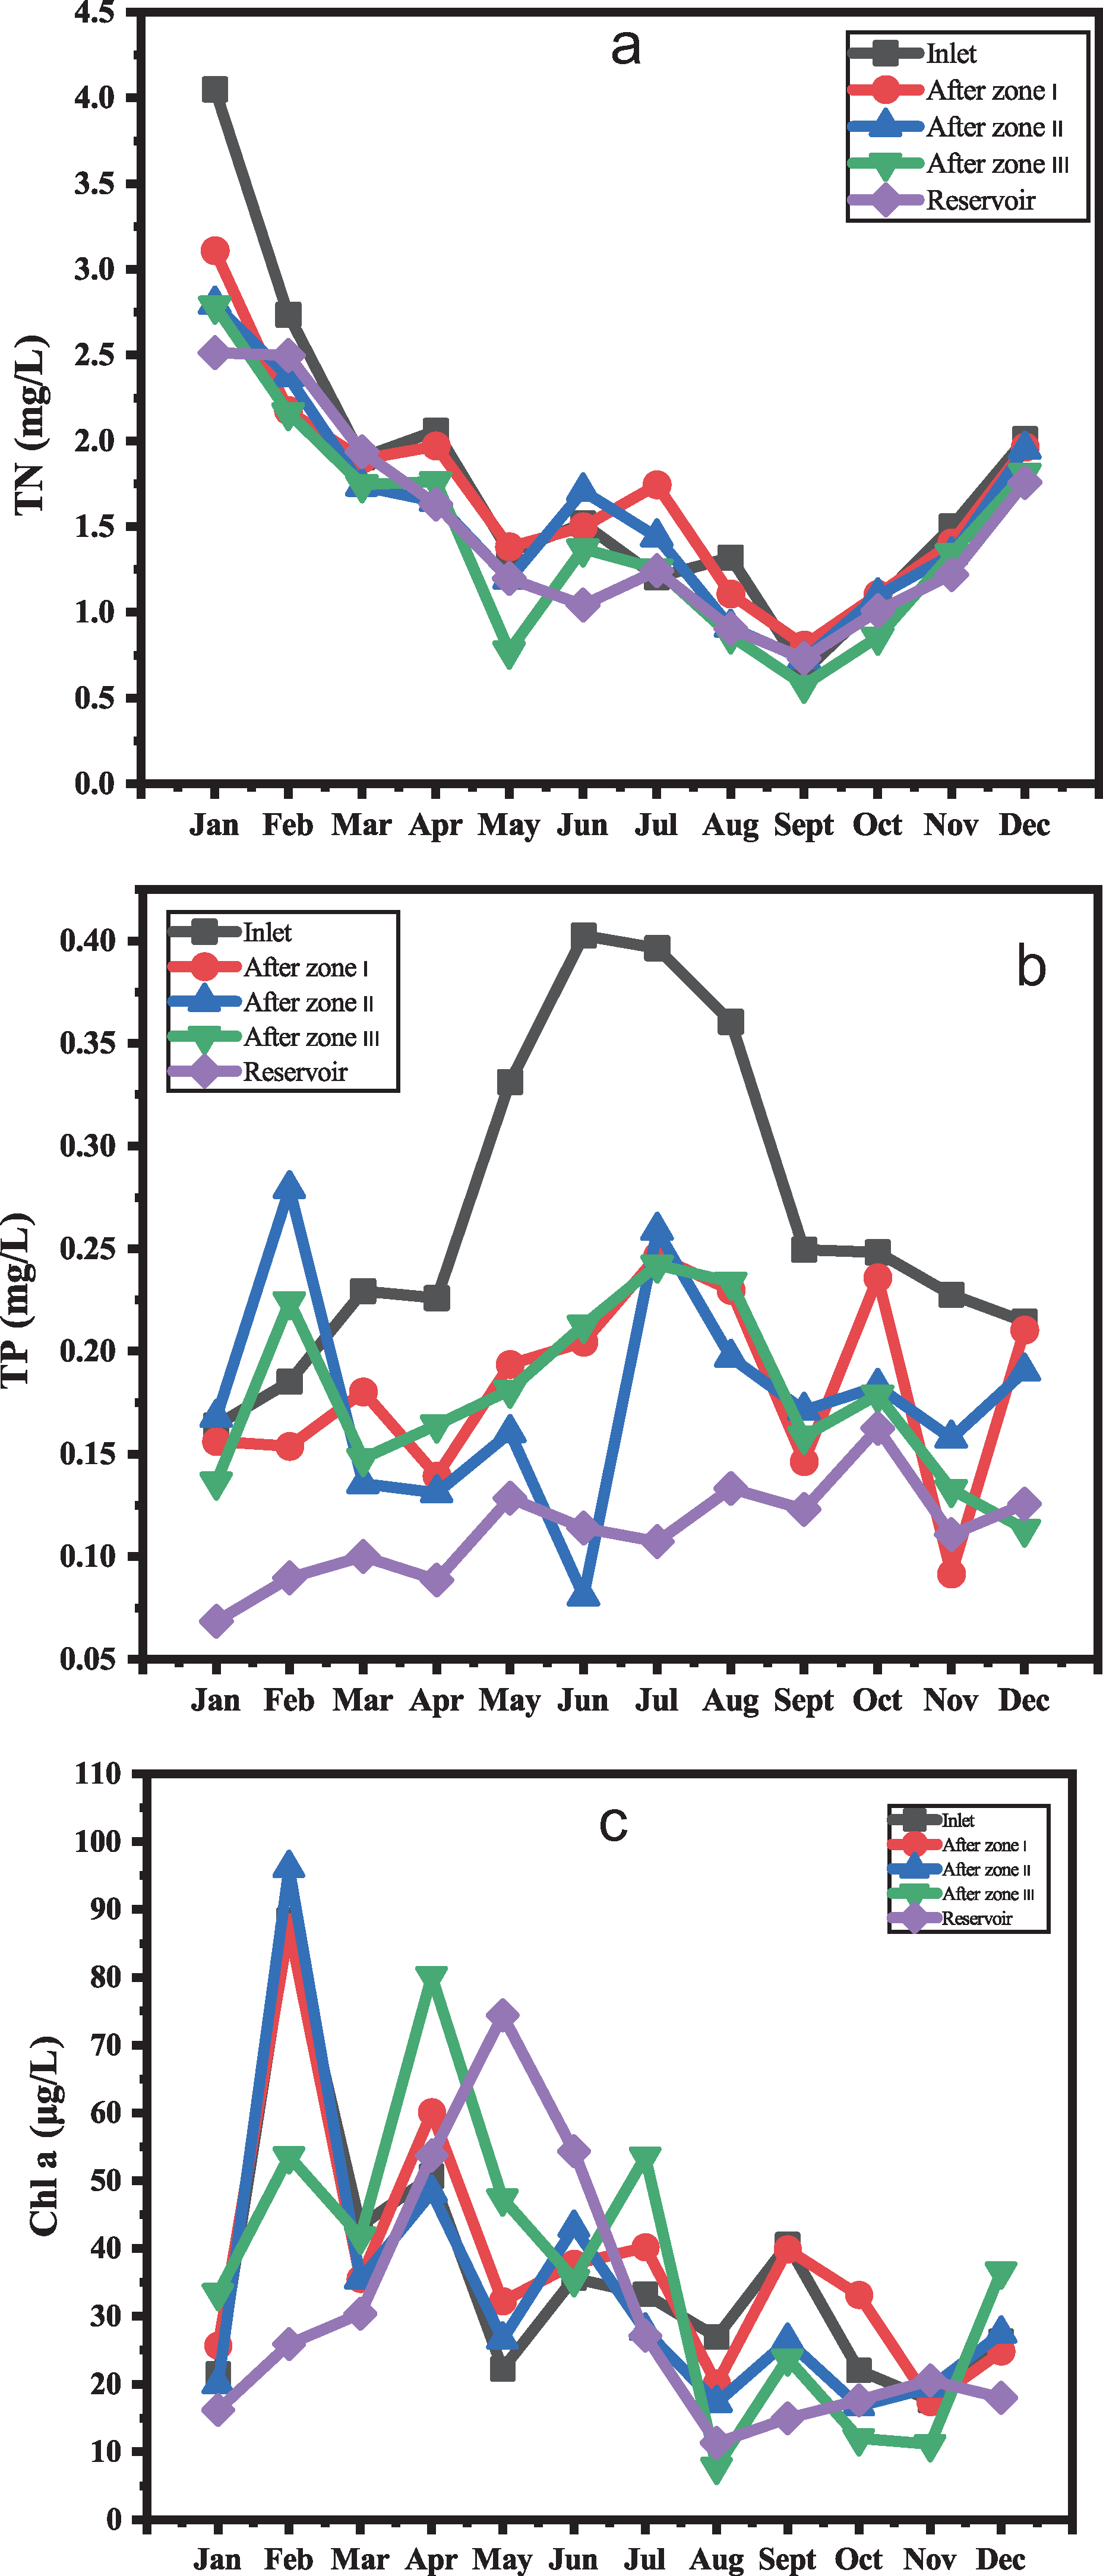
3.1. Spatial and Temporal Variations in TN, TP, and Chlorophyll a along the Different Treatment Zones in the CW-R

Originally, the CW-R system consisted of four zones in series that were supposed to function as a purification system for reduction of major nutrients or phytoplankton. However, after monthly monitoring during 2017, the efficiency of reduction of nutrient content and phytoplankton abundance (referred to as chlorophyll a) changed dramatically with different seasons and zones (Figure 2). Generally, the concentrations of TN and TP were decreased after treatment, indicating that the system had a positive effect on the removal of the major nutrients. In comparison, the removal efficiency of TP was much higher than that of TN, as indicated by the removal rate of 58.87% for TP and 11.27% for TN (Figure S1). Furthermore, the removal of TP was observed to be the most effective in zones I and IV during summer season. For chlorophyll a, the trend of variation after treatment was different from that for the nutrients, indicating that the concentration of chlorophyll a decreased during summer but enhanced during spring. The correspondence of the decrease in chlorophyll a and TP along the treatment process in summer indicate that the role of phosphorus in regulating the dynamics of the phytoplankton may be conspicuous during the summer season.

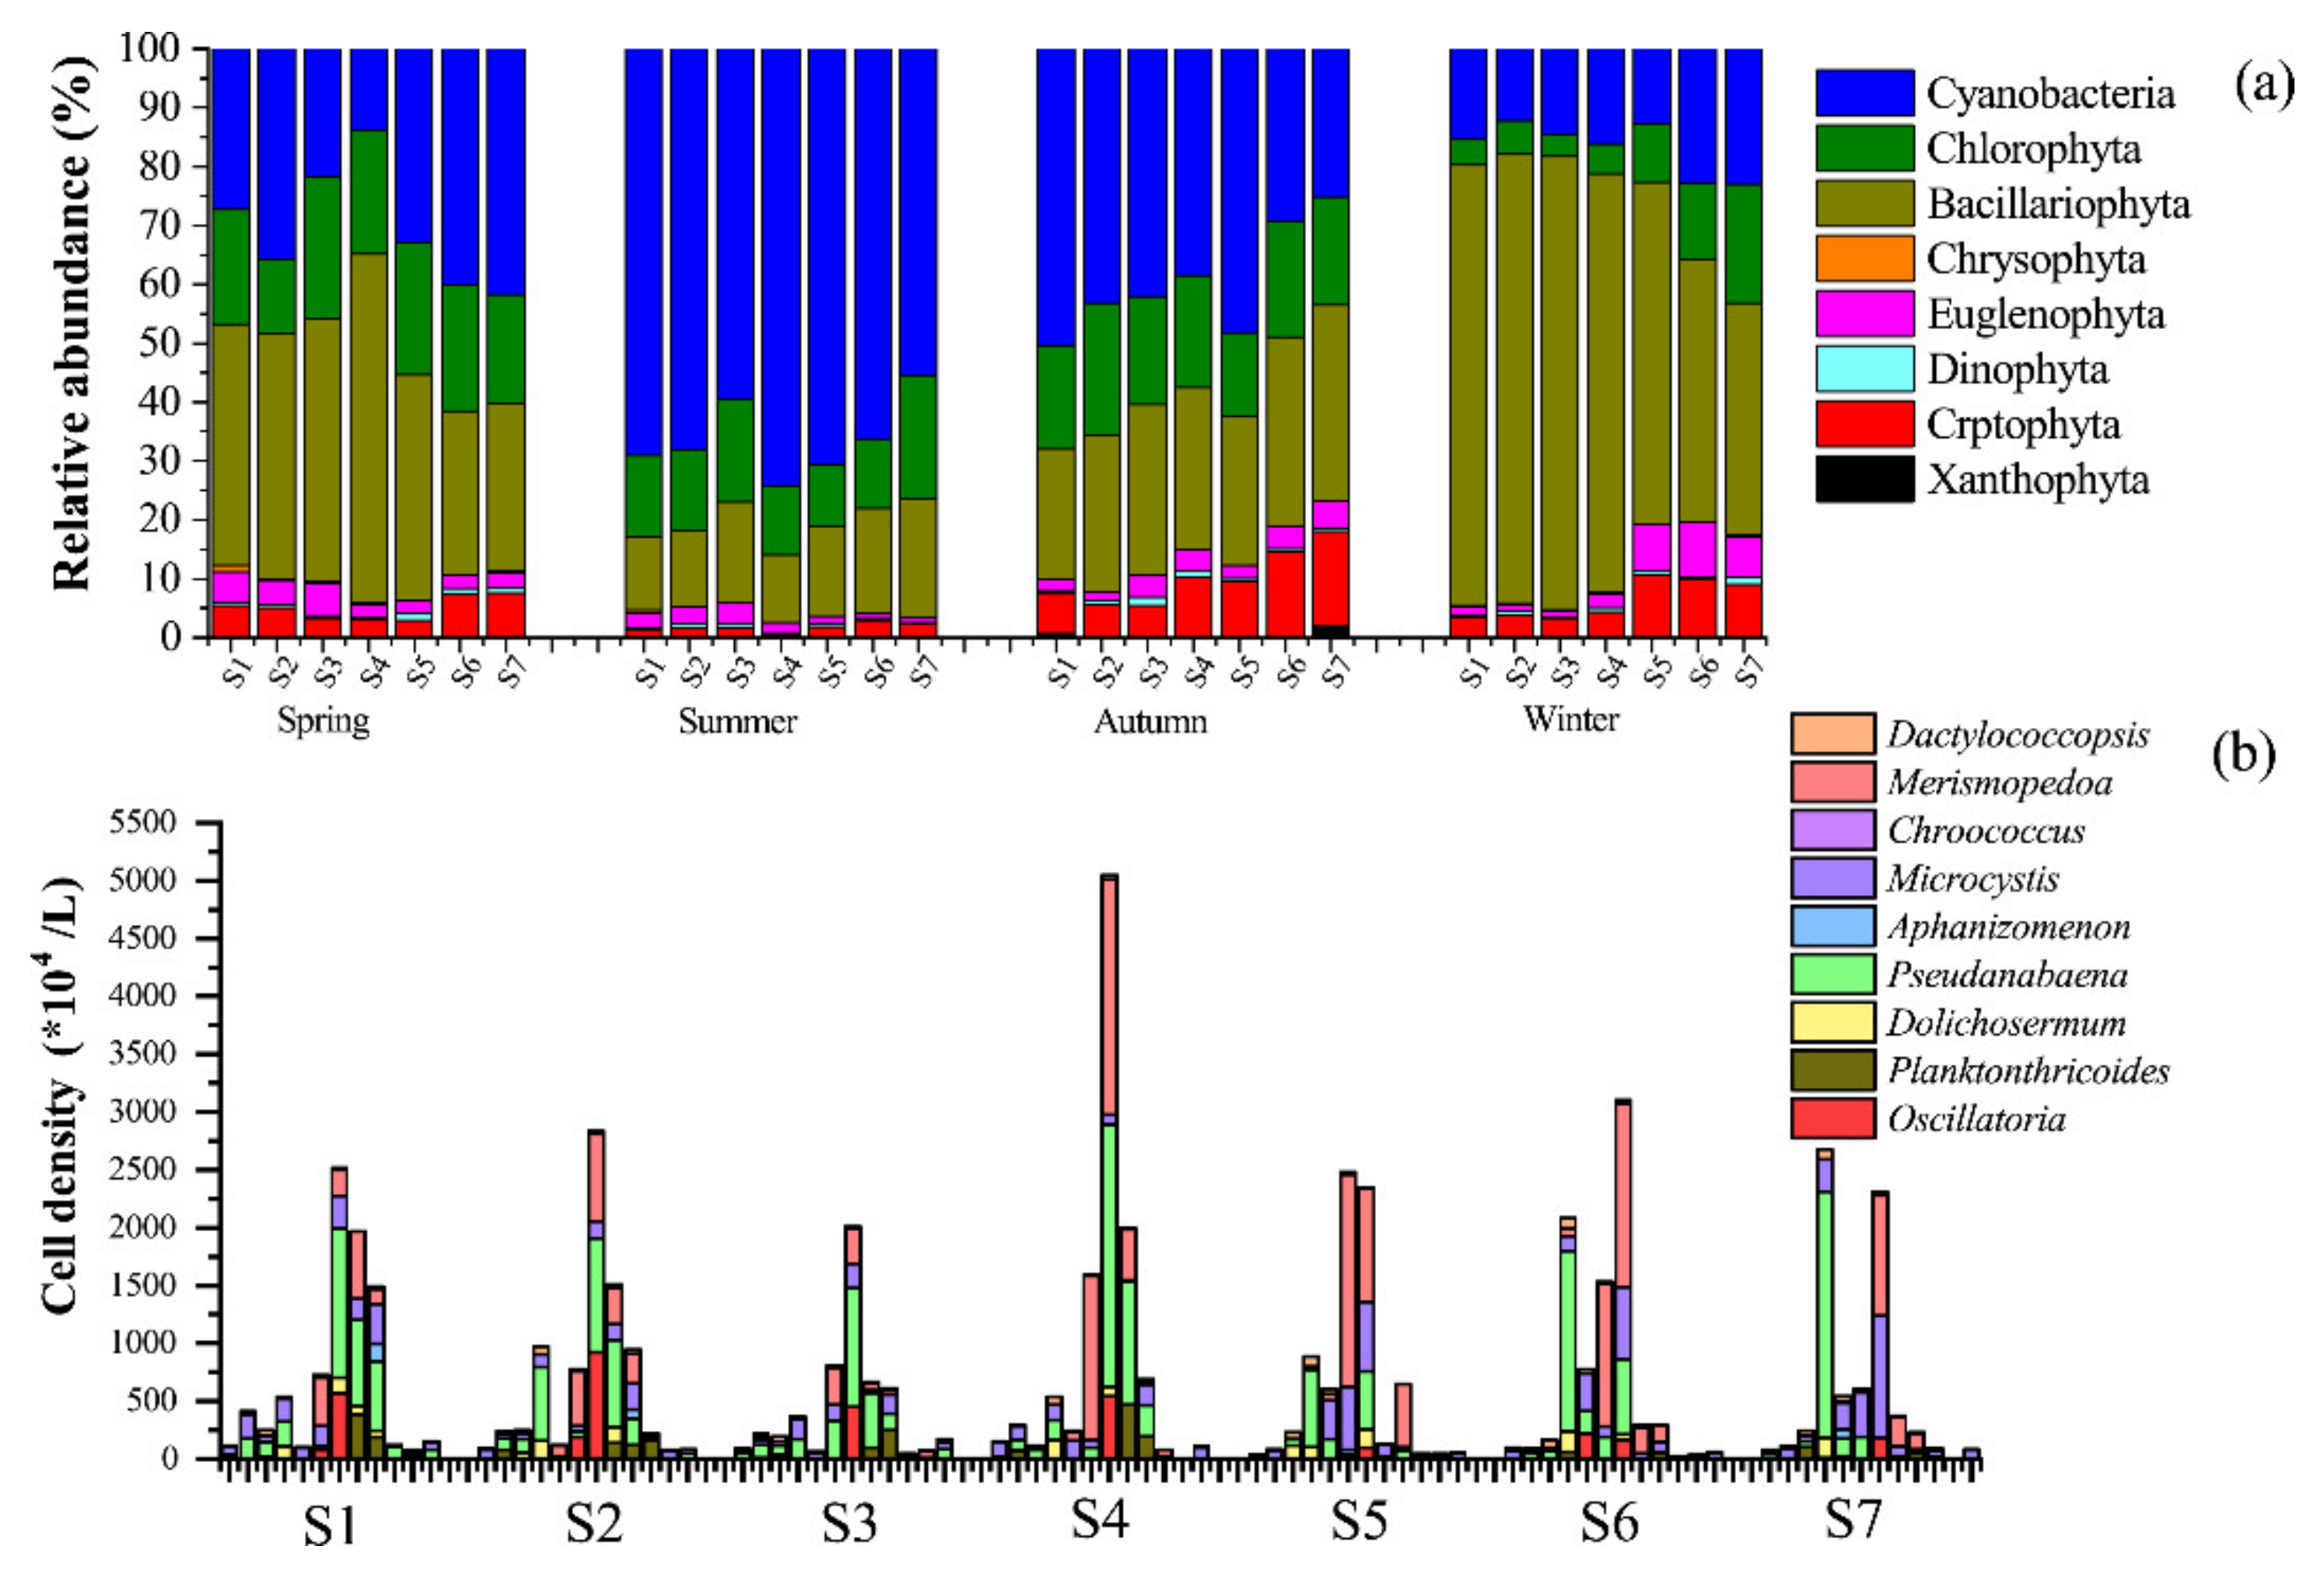
3.2. Seasonal Changes in Phytoplankton Composition and Major Cyanobacteria in Different Treatment Zones

During the study period, 51 taxa belonging to 8 phyla were identified in Yanlonghu CW-R. Among them, 19, 14, 9, 3, 2, 2, 1, and 1 taxa belonged to Chlorophyta, Bacillariophyta, Cyanobacteria, Chrysophyta, Euglenophyta, Dinophyta, Cryptophyta, and Xanthophyta, respectively. The frequency of the identified taxa was the highest in spring, followed by summer, autumn, and winter. It was reported that the Shannon index H’ and evenness J followed a similar pattern of change. The lowest species diversity index was 1.57 in winter, and the highest was 2.30 in spring. The lowest species evenness index was 0.28 in winter, and the highest was 0.41 in spring (Table S1).
The relative abundance of the eight phyla was calculated at different sites from spring to winter (Figure 3a). Cyanobacteria were dominant in summer and autumn, and Bacillariophyta were dominant in winter and spring. Nine taxa of cyanobacteria were observed, including four non-filamentous taxa (Microcystis sp., Chroococcus sp., Merismopedoa sp., and Dactylococcopsis sp.) and five filamentous taxa (Planktothricoides sp., Dolichospermum sp., Pseudanabaena sp., Aphanizomenon sp., and Oscillatoria sp.) Mostly, the growth of filamentous cyanobacteria was promoted during the whole sampling period. Of 84 samples, Pseudanabaena sp. was dominant in 51 samples, and Planktothricoides sp., Oscillatoria sp., Dolichospermum sp., and Aphanizomenon sp. were dominant in 7, 4, 2, and 2 samples, respectively (Figure 3b).
At S1, Pseudanabaena sp., among five filamentous cyanobacteria, was dominant mostly in spring, autumn, and winter and codominated with Oscillatoria sp. and Planktothricoides sp. in summer. At S7, Pseudanabaena sp. dominated during spring and winter, and codominated with Oscillatoria sp. in summer. It was noted that Planktothricoides sp. dominated in autumn.

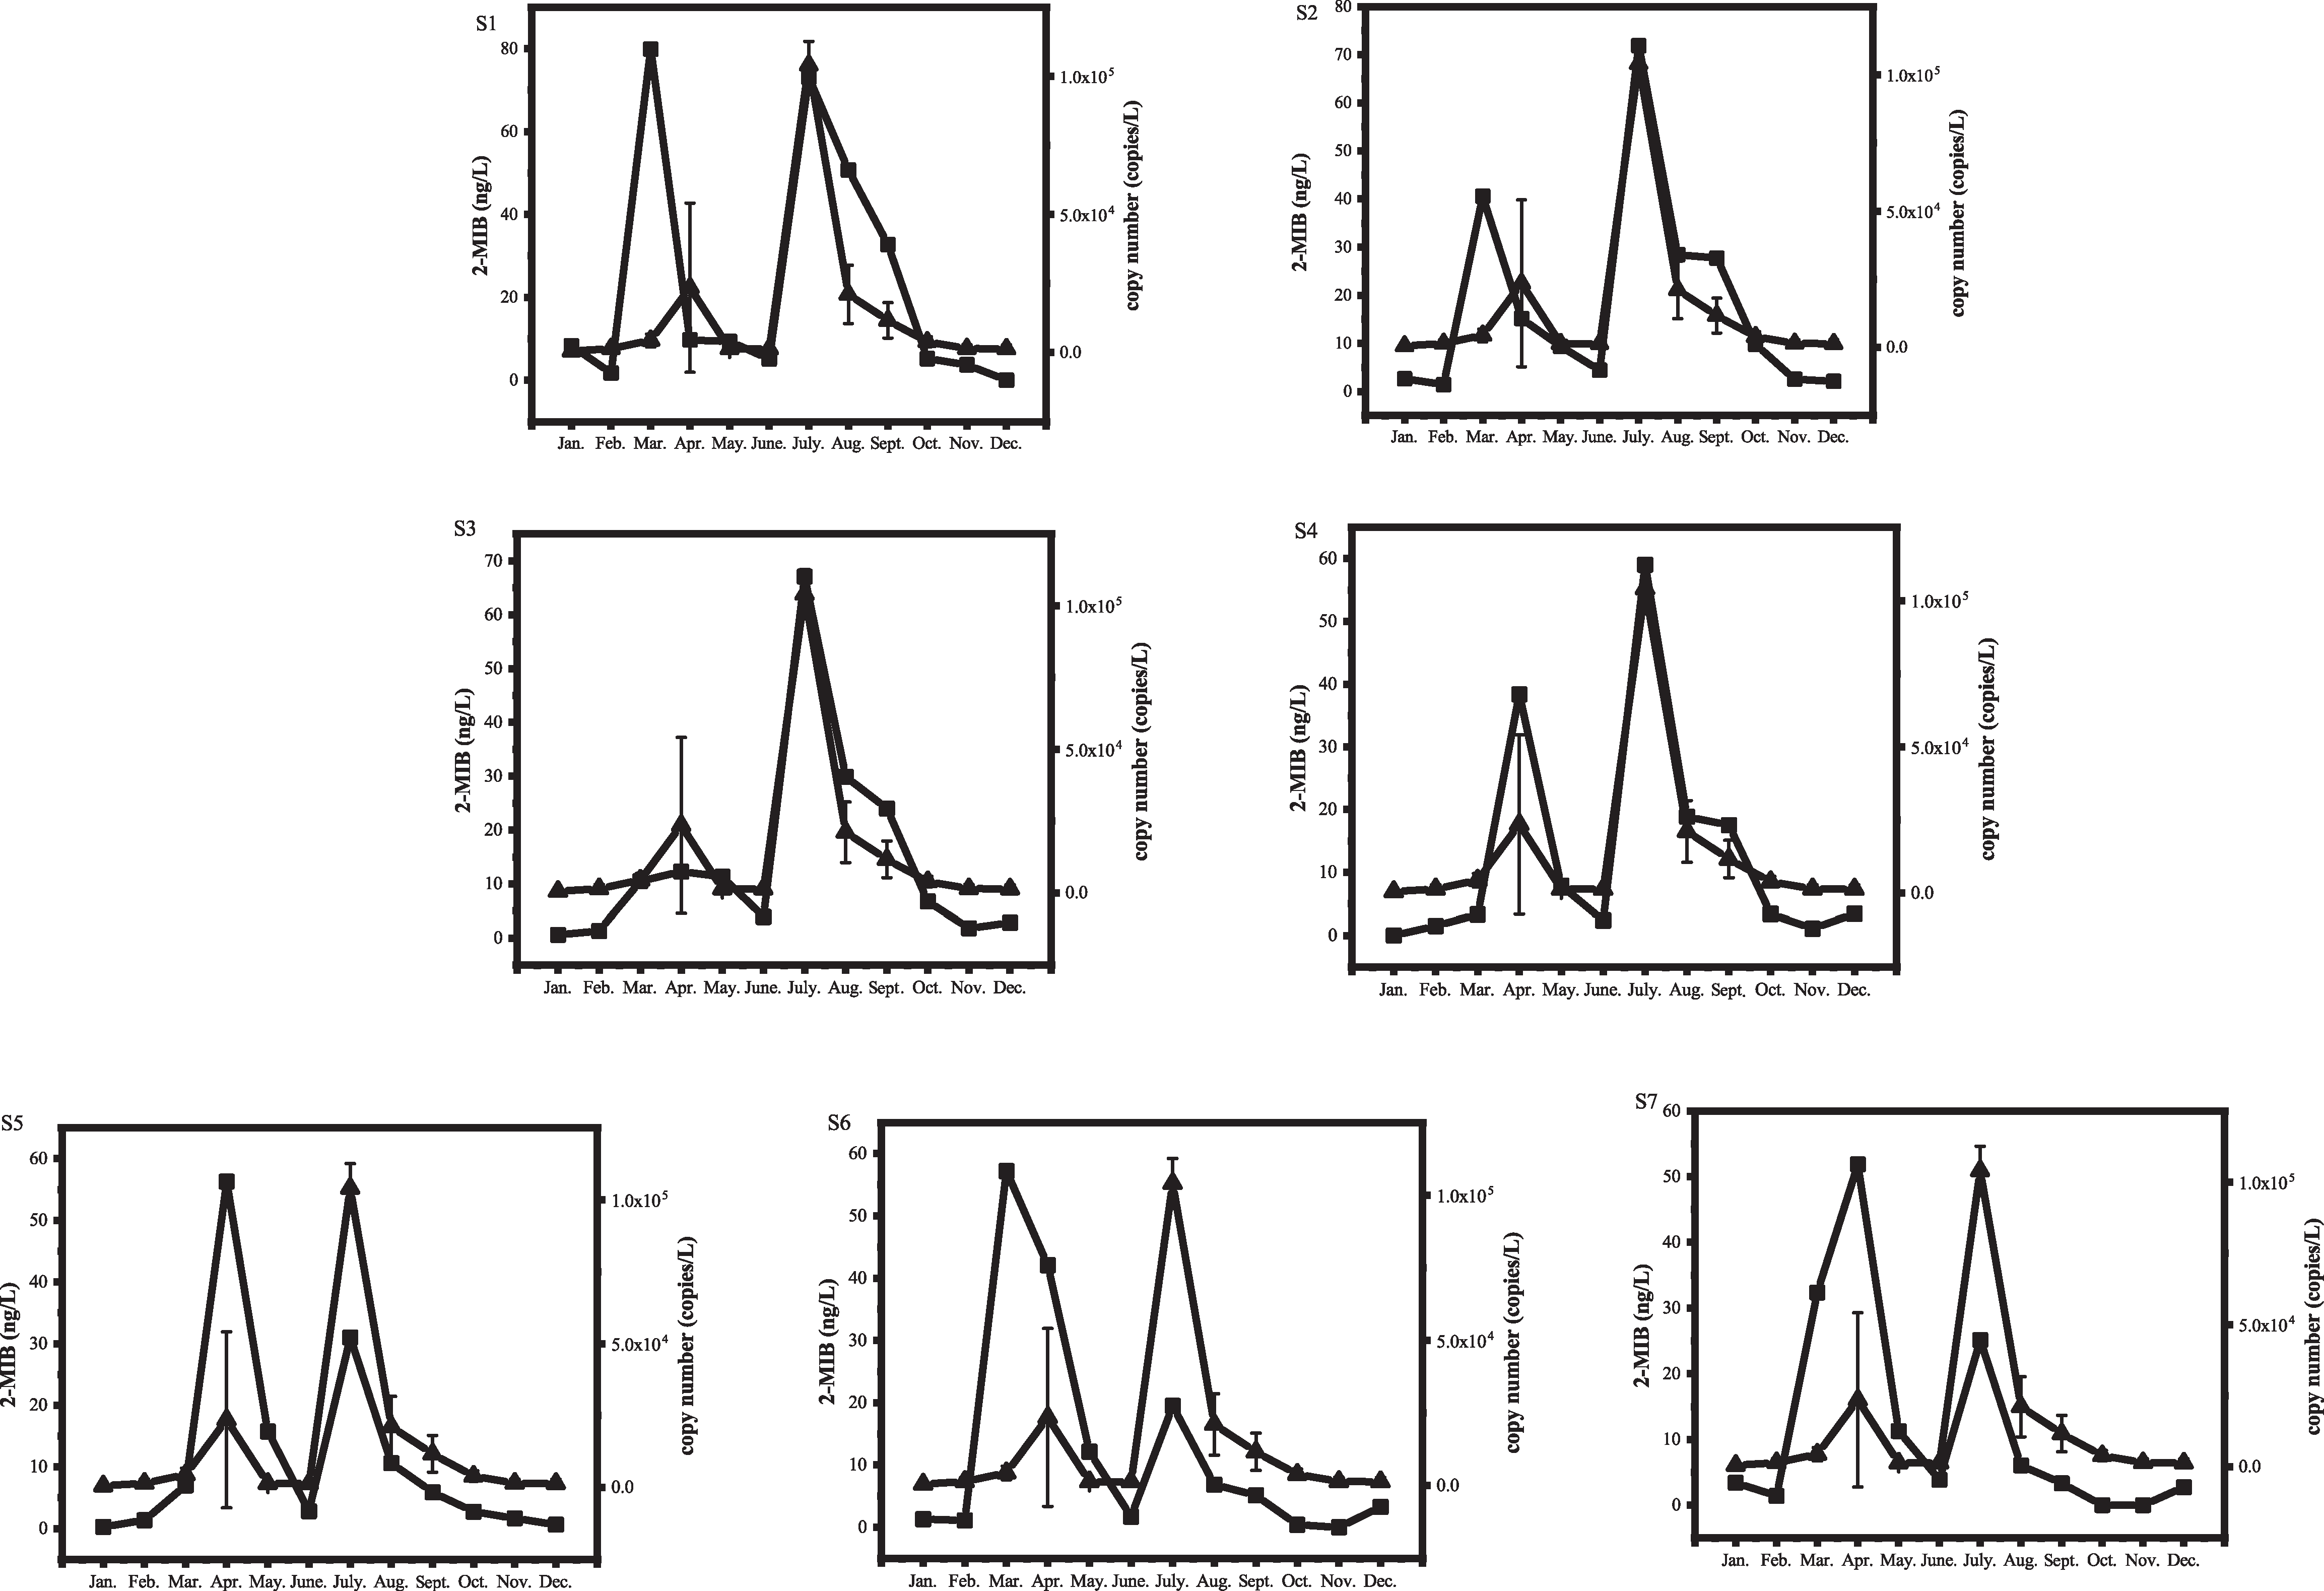
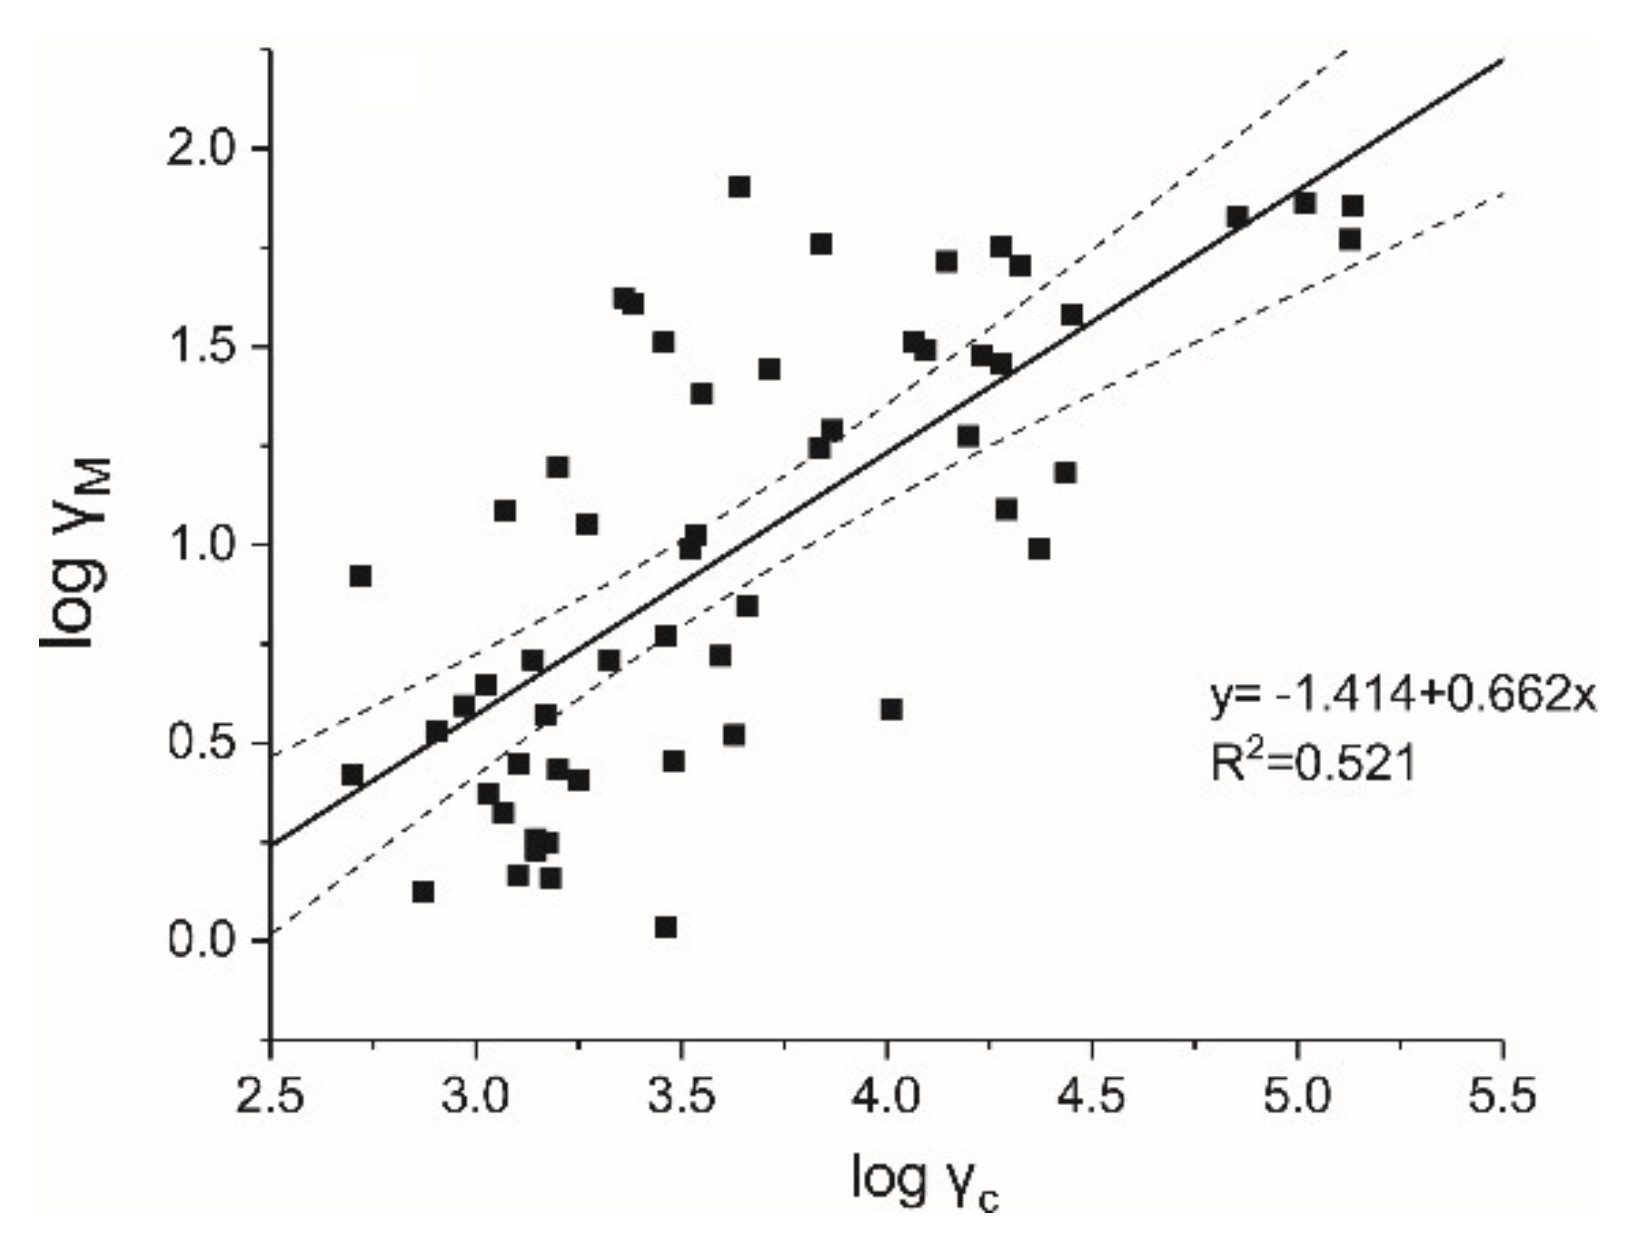
3.3. Correlation between 2-MIB Synthesis Gene Copies (Mic) and 2-MIB Concentrations

The threshold concentration for 2-MIB is normally set at 10 ng/L, and it has been adopted as the national standard for drinking water in many countries. Over one third of 84 samples exceeded the threshold mostly during spring and summer. The higher concentration normally occurred from March to September, particularly in April and July. Coincidently, mic gene copies were seen to peak in April and July (Figure 4). The Pearson’s correlation analysis revealed statistically significant correlations between mic gene copies and 2-MIB concentrations throughout the year (R2 = 0.662, p < 0.01). The correlation coefficient increased to 0.704** when data from April and July were collated. Figure 5 illustrates a positive linear correlation (R2 = 0.521) between mic gene copies and 2-MIB concentrations, indicated by the equation: log (γM) = 0.662 × log (γc) − 1.414. According to the equation, 10 ng/L 2-MIB corresponded to approximately 4431.244 mic copies/mL.

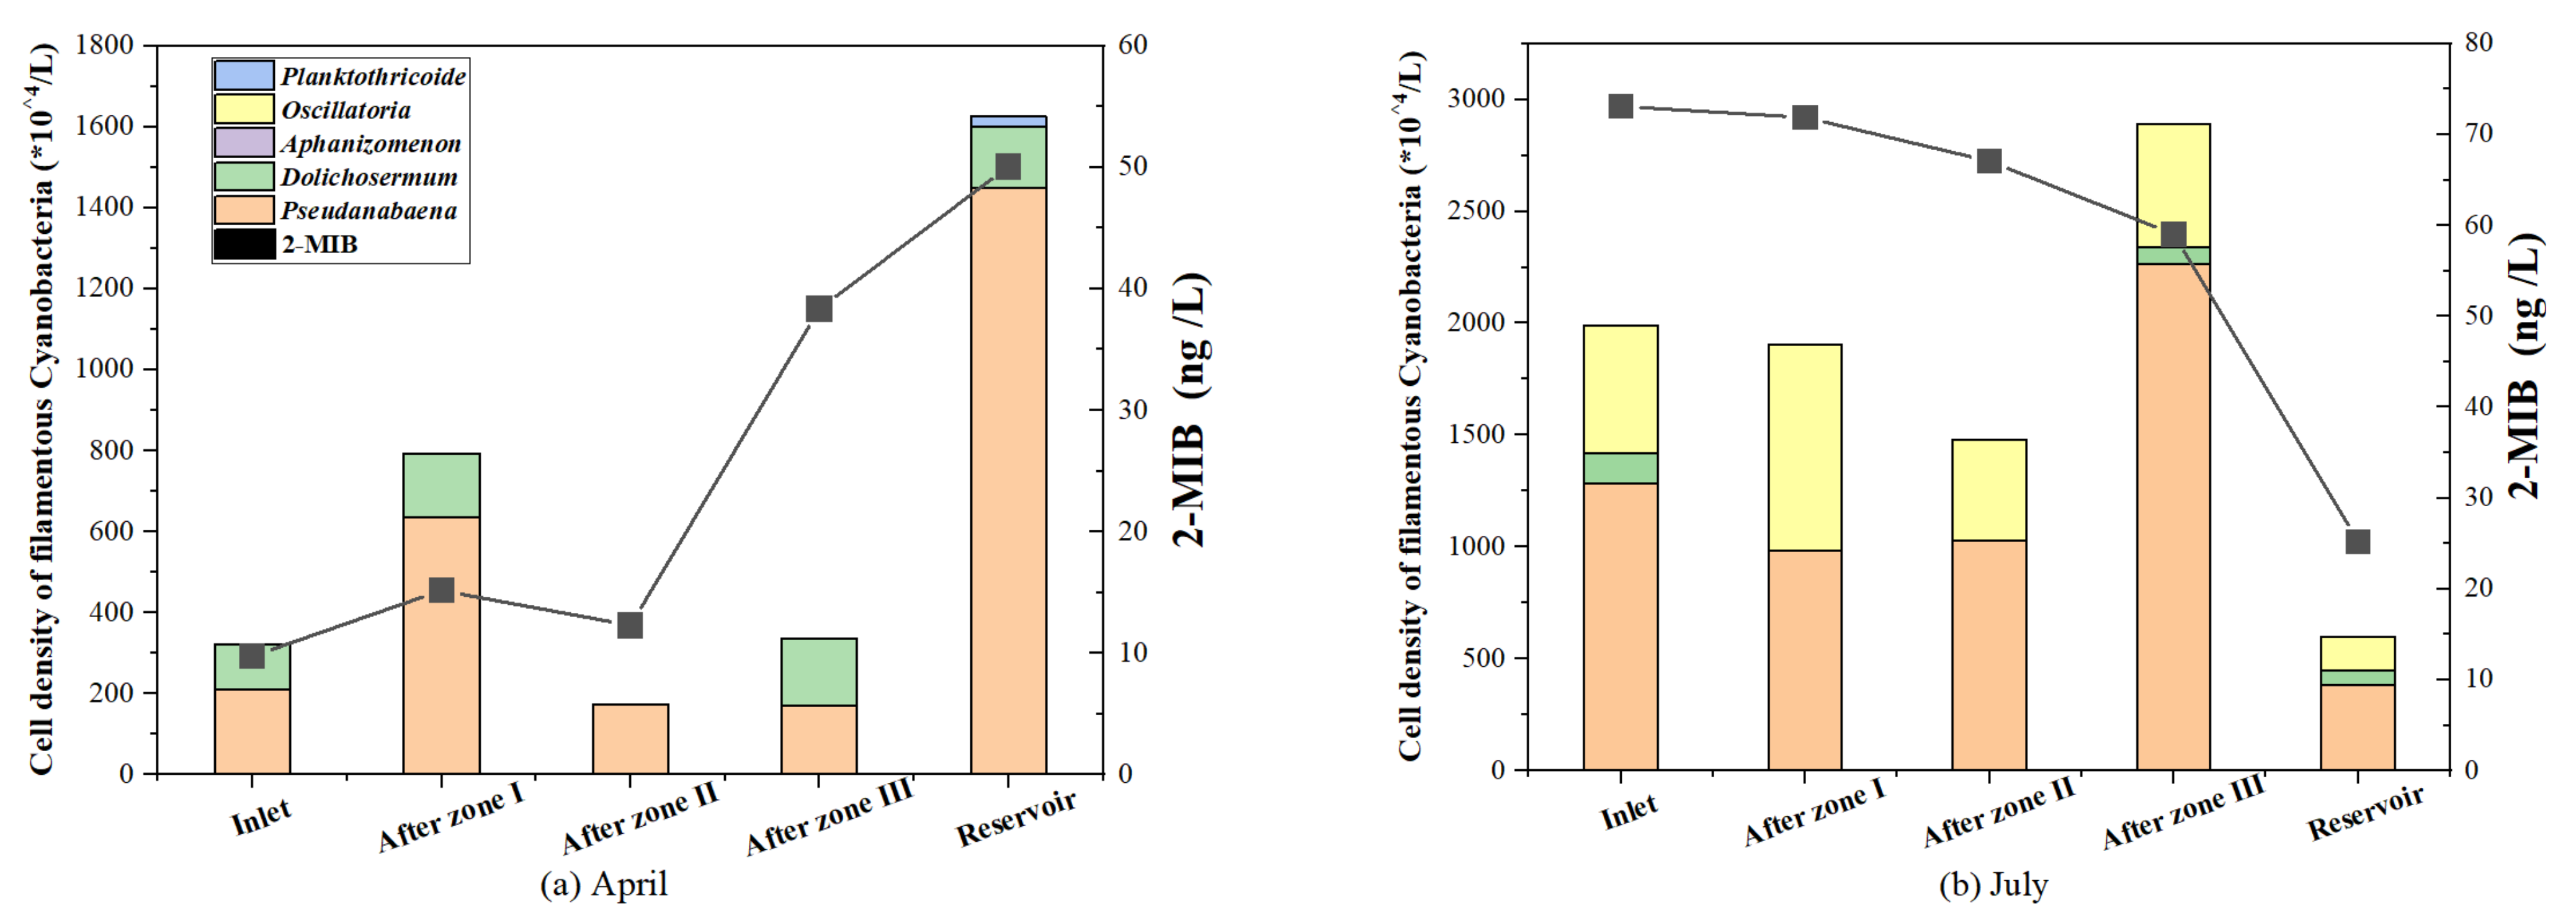
3.4. Association of Pseudanabaena and Oscillatoria with the Dynamic Change in 2-MIB Concentration in April and July

As mentioned, a high 2-MIB concentration was detected during spring and summer, particularly in April and July, and the mic gene copies and abundance of Pseudanabaena were generally consistent with the change in 2-MIB concentration. To identify the major 2-MIB-producers and their correlation with the dynamic change in the 2-MIB concentration in the CW-R and to define the efficiency of treatment units in transforming the algal abundance and 2-MIB, the dynamics of 2-MIB and five filamentous cyanobacteria in different units of the CW-R were examined in April and July (Figure 6).
In April, 2-MIB concentration was low at the inlet and high at the outlet, with a sharp increase in Pseudanabaena abundance. In July, the 2-MIB concentration was high at the inlet and reduced at the outlet, with a decreasing trend (except after zone III) in the abundance of both Pseudanabaena and Oscillatoria. It was clear that the concentrations of 2-MIB at the inlet and outlet were 9.75 and 50.08 ng/L, respectively, in April and 73.11 and 25.21 ng/L, respectively, in July.
Therefore, the 2-MIB peak was clearly attributed to Pseudanabaena in April and to both Pseudanabaena and Oscillatoria in July. This finding was supported by the observed positive correlations among mic gene copies, 2-MIB concentrations, and abundances of Pseudanabaena and Oscillatoria (Table 1). Though the abundance of Pseudanabaena in April originated mainly from zone IV, the dynamic of codominance of Pseudanabaena and Oscillatoria in July was largely influenced by the external abundance of the species. The removal efficiency of the treatment units seemed to be more effective during summer. Notably, a sudden increase in Oscillatoria, typically of benthic origin, clearly originated from the Oscillatoria-dominated mat that was detached from the surface of zones I and II. During summer, benthic Oscillatoria was often observed to float from its sediments because of the increase in buoyancy due to the mass accumulation of oxygen gas by a high photosynthesis rate [30,31] (Figure 7).

4. Discussion

As an emerging system for drinking water purification, the integrated CW-Rs have been playing a key role in facilitating water purification in plain areas where source water from rivers often cannot meet the quality criteria. It was questioned whether these CW-Rs have functioned efficiently as designed, that is, whether they have played a significant role in improving water quality. So far, CW-Rs have been reported to be relatively highly efficient in reducing the concentration of major nutrients and other contaminants [21,22,23,24]. However, their efficiency in treating biological odorants has rarely been reported [25], and the dynamics of the off-flavor substances during the operation remain unclear. We hypothesized and proposed that the dynamics of off-flavor substances in this emergent system would be unique, and different from what we have known from the studies on the traditional reservoirs or lakes. Therefore, Yanlonghu CW-R located in the eastern part of China was selected to study the dynamics of 2-MIB along with the different treatment zones in 2017. We observed two peaks of the 2-MIB episodes, which were attributed mainly to Pseudanabaena in April and Pseudanabaena and Oscillatoria in July, indicating that benthic Oscillatoria is also a threatening factor. Yanlonghu CW-R system was observed to be effective in reducing the levels of major nutrients (TP in particular) throughout the year. In addition, it was effective in mitigating the 2-MIB-producers/2-MIB during summer. It was proposed that qPCR for mic gene detection is suitable for screening and establishing an early warning method. Our study provides new insights to understand 2-MIB dynamics in the emergent CW-R system, indicating that planktonic and benthic filamentous cyanobacteria were both involved in changing the 2-MIB peaks. Our study would help in the better management of odor problems in drinking water and in improving the design of the system for future applications.
As a filamentous cyanobacterium, the outbreak of planktonic Pseudanabaena has often been associated with a high concentration of 2-MIB and regarded as the sole producer of 2-MIB episode in several water bodies, including the Dianchi Lake [32] and Xionghe Reservoir [33] in China; Castaic Lake in California in USA [34]; Ui Am Lake, Sam Bong Lake, and Cheong Pyeong Lake in Korea [35]; and the Plas Uchaf Reservoir in the UK [36]. In Yanlonghu CW-R, Pseudanabaena was confirmed to be the major producer of 2-MIB in spring. The scenario changed in summer since both Pseudanabaena and Oscillatoria codominated when the concentration of 2-MIB was highest. It appeared that two peaks of 2-MIB existed during spring and summer, respectively. Between the two peaks, no obvious 2-MIB was detected. It is proposed that the structure of the CW-R may be actively involved in shaping the composition and abundance of 2-MIB producers. This phenomenon has rarely been reported in traditional reservoirs or lakes where 2-MIB usually occurred in a manner of a continuum spectrum. A study in Vietnam reported that algae-derived odors persist from spring to summer and even in autumn in Dau Tieng Reservoir and Tri An Reservoir [37].
Considering that benthic Oscillatoria was attributed to the 2-MIB episode during summer, establishing the origin and response of Oscillatoria in this emergent CW-R is crucial. In this study, upstream river water with floating mats flew into Yanlonghu CW-R system, and the Oscillatoria settled down and gradually formed a long band of benthic mats at the front overflow weir of zone I. The benthic mats at zone I were often observed to detach and flush into the water column, and Oscillatoria was detected in water samples of other zones. Previous studies have reported that benthic cyanobacteria grow attached to surfaces such as sediment, rocks, biofilms, or macrophytes [38,39,40]. After an active period of photosynthesis, oxygen bubbles are emitted and entrapped in parts within the sheath of the mat, leading to high buoyancy that helps in detaching the parts of the mat, which then float to the surface and form “floating mats” [30,38]. Moreover, benthic cyanobacteria can drift downstream as free-floating biofilms or are flushed into water column as pelagic filamentous cyanobacteria by water shear force of strong currents [31]. Some studies in the last 30 years have implicated benthic cyanobacteria as the source of 2-MIB or geosmin in lakes, reservoirs, or rivers [9,41,42,43]. An off-flavor episode with 63 ng/L 2-MIB in a reservoir in southern California in 2004 was mainly caused by benthic cyanobacteria (Oscillatoria cf. Curviceps as the dominant species) along the 3–9 m deep shoreline [44]. Growing evidence suggests that benthic cyanobacteria are the major contributors to off-flavor episodes in waterbodies throughout the world. Field surveys conducted on 36 reservoirs, lakes, and rivers across three continents revealed that benthic cyanobacteria were the sole 2-MIB producers in 17% of the 69 collected samples compared with actinobacteria, which were the sole producers in only 1% of the samples [9]. However, limited studies have been conducted on benthic cyanobacteria. Ecologically, it is unclear how benthic cyanobacteria are attached, detached, and migrated and how this process is related to the 2-MIB event. Compared with a single lake or reservoir, the dynamics of benthic cyanobacteria in an integrated CW-R system are surely more complex and have gained much less attention. To reduce the 2-MIB concentration, the long band of benthic mats in the shallow area of Yanlonghu CW-R could be mechanically removed to prevent the growth and accumulation of the 2-MIB-producing cyanobacteria.
The key to early response and management of increasing cyanobacterial blooms and associated geosmin/2-MIB events is the development of rapid, robust, and on-site early detection and monitoring initiatives [8]. The average 2-MIB cell quota was reported as 0.085 pg/cell in the Miyun reservoir coupling with Planktothrix bloom [16], and the 2-MIB quota ranged from 0.001 to 0.143 pg/cell in Yanlonghu CW-R. In this study, positive correlations among mic genes, 2-MIB concentrations, and abundances of Pseudanabaena/Oscillatoria were reported (Table 1). However, the correlation between mic gene copies and MIB-producing species varied greatly. It was observed that the genome copy numbers in different cyanobacterial species may differ from 1 to over 100 [45]. This may partly explain the discrepancy in the correlation coefficient between mic copies and the abundance of certain species. Therefore, caution should be taken when applying this qPCR method for screening and monitoring 2-MIB when more than one MIB-producing species are present.
The efficiency of the CW-R in reducing phytoplankton abundance and odor compounds varied with seasons and different treatment zones. As observed in the study, the odor problem differs significantly between spring and summer seasons. High concentrations of 2-MIB at the inlet seemed to be due to a high abundance of Oscillatoria in raw water during summer, suggesting that great effort is needed to improve the quality of raw water. In spring, the increase in the number of Pseudanabaena may directly contribute to the increase in 2-MIB in zone IV. Therefore, it is necessary to take preventive measures (for example, lowering hydraulic retention time) to reduce the proliferation of Pseudanabaena either by inhibiting growth or by increasing the hydraulic discharge in zone IV. It should be noted that the submerged plant zone (zone III) had not performed as good as other zones since the coverage of the submerged plants was much less than designed, leading to increased phytoplankton abundance and nutrient concentration after zone III. Therefore, each treatment unit should be kept in full capacity so that the CW-R system can reduce the frequency and hazardous effects caused by 2-MIB.
In conclusion, the 2-MIB episodes in the emergent CW-R are different from those observed in lakes or reservoirs. The findings confirmed that planktonic Pseudanabaena was the major species responsible for 2-MIB production, and benthic Oscillatoria also contributed to 2-MIB production during certain periods. The CW-R was effective in reducing the nutrients levels. However, it exhibited relatively low efficiency in reducing phytoplankton than nutrient. This finding is implicated in the selection of control strategy and contributes to the better management and improvement of future applications.

Supplementary Materials

The following supporting information can be downloaded at: https://www.mdpi.com/article/10.3390/w14172670/s1, Figure S1: Variations of reduction efficiency of nutrients and Chl a in four treatment zones, a: Zone I; b: Zone II; c: Zone III; d: Zone IV. Variables: TN (total nitrogen), TP (total phosphorus) and Chl a (Chlorophyll a), from left to right; Figure S2: Standard curves for qPCR assays with tenfold serial diluted linear plasmid which cloned the mic fragment. Primer sets MIB-R(f/r), and Ctaq were used for SYBR Green. E value: efficiency of amplification; Table S1: The Shannon wiener diversity index and evenness index of Yanlonghu CW-R in four seasons.

Author Contributions

Conceptualization, L.L. and L.S.; Investigation, X.R. and J.S.; Samples analysis, X.R., J.S., Y.Z. and Q.Z.; Methodology, X.R., L.L. and L.S.; Discussion, X.R., L.L., L.S. and J.L. (Jiashou Liu); Writing—draft preparation, Review and editing, X.R., L.L. and L.S.; Project administration, J.L. (Jiashou Liu), J.L. (Jin Liu), L.L. and L.S. All authors have read and agreed to the published version of the manuscript.

Funding

This study was financially supported by National Key R&D Program of China (No.2018YFE0110600), National Natural Science Foundation of China (No.52030002) and Chinese Academy of Sciences (KFJ-SW-YW036).

Institutional Review Board Statement

Not applicable.

Informed Consent Statement

Not applicable.

Data Availability Statement

The data are contained within the article/Supplementary Materials.

Acknowledgments

Thanks to Guanchao Du, Wei Ding, Xu Gao, and Fengdong Li for their support and technical assistance during the field surveys. We thank the Yancheng Water Supply Guarantee Center and Yancheng Water Affairs Group Co., LTD for their financial support. We thank the anonymous reviewers and editors for their constructive comments and advice.

Conflicts of Interest

The authors declare no conflict of interest.

References

  1. Klausen, C.; Nicolaisen, M.H.; Strobel, B.W.; Warnecke, F.; Nielsen, J.L.; Jørgensen, N.O.G. Abundance of actinobacteria and production of geosmin and 2-methylisoborneol in Danish streams and fish ponds. FEMS Microbiol. Ecol. 2005, 52, 265–278. [Google Scholar] [CrossRef] [PubMed]
  2. Watson, S.B.; Ridal, J.; Boyer, G.L. Taste and odour and cyanobacterial toxins: Impairment, prediction, and management in the Great Lakes. Can. J. Fish. Aquat. Sci. 2008, 65, 1779–1796. [Google Scholar] [CrossRef]
  3. Lu, J.; Su, M.; Su, Y.; Wu, B.; Cao, T.; Fang, J.; Yu, J.; Zhang, H.; Yang, M. Driving forces for the growth of MIB-producing Planktothricoides raciborskii in a low-latitude reservoir. Water Res. 2022, 220, 118670. [Google Scholar] [CrossRef] [PubMed]
  4. Schulz, S.; Fuhlendorff, J.; Reichenbach, H. Identification and synthesis of volatiles released by the myxobacterium Chondromyces crocatus. Tetrahedron 2004, 60, 3863–3872. [Google Scholar] [CrossRef]
  5. Zuo, Y.; Li, L.; Zhang, T.; Zheng, L.; Dai, G.; Liu, L.; Song, L. Contribution of Streptomyces in sediment to earthy odor in the overlying water in Xionghe Reservoir, China. Water Res. 2010, 44, 6085–6094. [Google Scholar] [CrossRef]
  6. Watson, S.B. Ecotoxicity of Taste and Odor Compounds. Encycl. Aquat. Ecotoxicol. 2013, 337–352. [Google Scholar] [CrossRef]
  7. Burgos, L.; Lehmann, M.; Simon, D.; de Andrade, H.H.R.; de Abreu, B.R.R.; Nabinger, D.D.; Grivicich, I.; Juliano, V.B.; Dihl, R.R. Agents of earthy-musty taste and odor in water: Evaluation of cytotoxicity, genotoxicity and toxicogenomics. Sci. Total Environ. 2014, 490, 679–685. [Google Scholar] [CrossRef]
  8. Devi, A.; Chiu, Y.T.; Hsueh, H.T.; Lin, T.F. Quantitative PCR based detection system for cyanobacterial geosmin/2-methylisoborneol (2-MIB) events in drinking water sources: Current status and challenges. Water Res. 2021, 188, 116478. [Google Scholar] [CrossRef]
  9. Gaget, V.; Almuhtaram, H.; Kibuye, F.; Hobson, P.; Zamyadi, A.; Wert, E.; Brookes, J.D. Benthic cyanobacteria: A utility-centred field study. Harmful Algae 2022, 113, 102185. [Google Scholar] [CrossRef]
  10. Watson, S.B.; Monis, P.; Baker, P.; Giglio, S. Biochemistry and genetics of taste- and odor-producing cyanobacteria. Harmful Algae 2016, 54, 112–127. [Google Scholar] [CrossRef]
  11. Su, M.; Zhu, Y.; Jia, Z.; Liu, T.; Yu, J.; Burch, M.; Yang, M. Identification of MIB producers and odor risk assessment using routine data: A case study of an estuary drinking water reservoir. Water Res. 2021, 192, 116848. [Google Scholar] [CrossRef]
  12. Kishida, N.; Konno, Y.; Nemoto, K.; Amitani, T.; Maki, A.; Fujimoto, N.; Akiba, M. Recent trends in microorganism-related off-flavor problems in drinking water treatment systems in Japan. Water Supply 2013, 13, 1228–1235. [Google Scholar] [CrossRef]
  13. Dietrich, A.M.; Burlingame, G.A. Critical Review and Rethinking of USEPA Secondary Standards for Maintaining Organoleptic Quality of Drinking Water. Environ. Sci. Technol. 2015, 49, 708–720. [Google Scholar] [CrossRef]
  14. Jeppesen, E.; Søndergaard, M.; Jensen, J.P.; Havens, K.E.; Anneville, O.; Carvalho, L.; Coveney, M.F.; Deneke, R.; Dokulil, M.T.; Foy, B.; et al. Lake responses to reduced nutrient loading—An analysis of contemporary long-term data from 35 case studies. Freshw. Biol. 2005, 50, 1747–1771. [Google Scholar] [CrossRef]
  15. Alghanmi, H.A.; Alkam, F.A.M.; Al-Taee, M.M. Effect of light and temperature on new cyanobacteria producers for geosmin and 2-methylisoborneol. J. Appl. Phycol. 2018, 30, 319–328. [Google Scholar] [CrossRef]
  16. Su, M.; Yu, J.; Zhang, J.; Chen, H.; An, W.; Vogt, R.D.; Andersen, T.; Jia, D.; Wang, J.; Yang, M. MIB-producing cyanobacteria (Planktothrix sp.) in a drinking water reservoir: Distribution and odor producing potential. Water Res. 2015, 68, 444–453. [Google Scholar] [CrossRef]
  17. Luo, Z.; Li, S.; Hou, K.; Ji, G. Spatial and seasonal bacterioplankton community dynamics in the main channel of the Middle Route of South-to-North Water Diversion Project. Res. Microbiol. 2019, 170, 24–34. [Google Scholar] [CrossRef]
  18. Zhu, Y.; Mi, W.; Tu, X.; Song, G.; Bi, Y. Environmental Factors Drive Periphytic Algal Community Assembly in the Largest Long-Distance Water Diversion Channel. Water 2022, 14, 914. [Google Scholar] [CrossRef]
  19. Giglio, S.; Chou, W.K.W.; Ikeda, H.; Cane, D.E.; Monis, P.T. Biosynthesis of 2-Methylisoborneol in Cyanobacteria. Environ. Sci. Technol. 2011, 45, 992–998. [Google Scholar] [CrossRef]
  20. Wang, Z.; Song, G.; Shao, J.; Tan, W.; Li, Y.; Li, R. Establishment and field applications of real-time PCR methods for the quantification of potential MIB-producing cyanobacteria in aquatic systems. J. Appl. Phycol. 2016, 28, 325–333. [Google Scholar] [CrossRef]
  21. Wang, W.; Su, Y.; Wang, B.; Wang, Y.; Zhuang, L.; Zhu, G. Spatiotemporal shifts of ammonia-oxidizing archaea abundance and structure during the restoration of a multiple pond and plant-bed/ditch wetland. Sci. Total Environ. 2019, 684, 629–640. [Google Scholar] [CrossRef]
  22. Wang, W.; Zheng, J.; Wang, Z.; Zhang, R.; Chen, Q.; Yu, X.; Yin, C. Performance of pond-wetland complexes as a preliminary processor of drinking water sources. J. Environ. Sci. 2016, 39, 119–133. [Google Scholar] [CrossRef]
  23. Li, Y.; Zhang, H.; Zhu, L.; Chen, H.; Du, G.; Gao, X.; Pu, Y. Evaluation of the long-term performance in a large-scale integrated surface flow constructed wetland-pond system: A case study. Bioresour. Technol. 2020, 309, 123310. [Google Scholar] [CrossRef]
  24. Li, X.; Ma, W.; Huang, T.; Wang, A.; Guo, Q.; Zou, L.; Ding, C. Spectroscopic fingerprinting of dissolved organic matter in a constructed wetland-reservoir ecosystem for source water improvement-a case study in Yanlong project, eastern China. Sci. Total Environ. 2021, 770, 144791. [Google Scholar] [CrossRef]
  25. Guo, Q.; Yu, J.; Li, X.; Chen, T.; Wang, C.; Li, Z.; Ma, W.; Ding, C.; Yang, M. A systematic study on the odorants characterization and evaluation in a plain reservoir with wetlands ecosystem. J. Hazard. Mater. 2020, 393, 122404. [Google Scholar] [CrossRef]
  26. Hu, L.; Shan, K.; Lin, L.; Shen, W.; Huang, L.; Gan, N.; Song, L. Multi-year assessment of toxic genotypes and microcystin concentration in northern lake taihu, China. Toxins 2016, 8, 23. [Google Scholar] [CrossRef]
  27. Nusch, E.A. Comparison of different methods for chlorophyll and phaeopigment determination. Arch. Hydrobiol. Bieh. Ergebn. Limnol. 1980, 14, 14–36. [Google Scholar]
  28. Serghini, M.A.; Ritzenthaler, C.; Pinck, L. A rapid and efficient ‘miniprep’ for isolation of plasmid DNA. Nucleic Acids Res. 1989, 17, 3604. [Google Scholar] [CrossRef]
  29. Lloyd, S.W.; Lea, J.M.; Zimba, P.V.; Grimm, C.C. Rapid analysis of geosmin and 2-methylisoborneol in water using solid phase micro extraction procedures. Water Res. 1998, 32, 2140–2146. [Google Scholar] [CrossRef]
  30. Gaget, V.; Hobson, P.; Keulen, A.; Newton, K.; Monis, P.; Humpage, A.R.; Weyrich, L.S.; Brookes, J.D. Toolbox for the sampling and monitoring of benthic cyanobacteria. Water Res. 2020, 169, 115222. [Google Scholar] [CrossRef]
  31. Vilalta, E.; Guasch, H.; Muñoz, I.; Romaní, A.; Valero, F.; Rodriguez, J.J.; Alcaraz, R.; Sabater, S. Nuisance odours produced by benthic cyanobacteria in a Mediterranean river. Water Sci. Technol. 2004, 49, 25–31. [Google Scholar] [CrossRef] [PubMed]
  32. Li, L.; Song, L.; Gan, N.; Chen, W. Determination of odorous compounds in water by headspace solid-phase microextraction-gas chromatography-mass spectrometry. Fenxi Huaxue 2005, 33, 1058–1062. [Google Scholar]
  33. Zhang, T.; Li, L.; Zuo, Y.; Zhou, Q.; Song, L. Biological origins and annual variations of Earthy-musty off-flavours in the Xionghe Reservoir in China. J. Water Supply: Res. Technol. 2010, 59, 243–254. [Google Scholar] [CrossRef]
  34. Izaguirre, G.; Taylor, W.D. A pseudanabaena species from Castaic Lake, California, that produces 2-methylisoborneol. Water Res. 1998, 32, 1673–1677. [Google Scholar] [CrossRef]
  35. Lee, J.E.; Yu, M.N.; Yu, S.; Byeon, M. Occurrence and phylogenetic analysis of Pseudanabaena sp. producing 2-methylisoborneol in drinking water source of South Korea. Environ. Microbiol. Rep. 2022, 14, 197–202. [Google Scholar] [CrossRef]
  36. Perkins, R.G.; Slavin, E.I.; Andrade, T.M.C.; Blenkinsopp, C.; Pearson, P.; Froggatt, T.; Godwin, G.; Parslow, J.; Hurley, S.; Luckwell, R.; et al. Managing taste and odour metabolite production in drinking water reservoirs: The importance of ammonium as a key nutrient trigger. J. Environ. Manag. 2019, 244, 276–284. [Google Scholar] [CrossRef]
  37. Pham, T.-L.; Bui, M.H.; Driscoll, M.; Shimizu, K.; Motoo, U. First report of geosmin and 2-methylisoborneol (2-MIB) in Dolichospermum and Oscillatoria from Vietnam. Limnology 2020, 22, 43–56. [Google Scholar] [CrossRef]
  38. Catherine, Q.; Susanna, W.; Isidora, E.-S.; Mark, H.; Aurélie, V.; Jean-François, H. A review of current knowledge on toxic benthic freshwater cyanobacteria—Ecology, toxin production and risk management. Water Res. 2013, 47, 5464–5479. [Google Scholar] [CrossRef]
  39. Wood, S.A.; Kelly, L.T.; Bouma-Gregson, K.; Humbert, J.-F.; Laughinghouse IV, H.D.; Lazorchak, J.; McAllister, T.G.; McQueen, A.; Pokrzywinski, K.; Puddick, J. Toxic benthic freshwater cyanobacterial proliferations: Challenges and solutions for enhancing knowledge and improving monitoring and mitigation. Freshw. Biol. 2020, 65, 1824–1842. [Google Scholar] [CrossRef]
  40. Wood, S.A.; Smith, F.M.J.; Heath, M.W.; Palfroy, T.; Gaw, S.; Young, R.G.; Ryan, K.G. Within-Mat Variability in Anatoxin-a and Homoanatoxin-a Production among Benthic Phormidium (Cyanobacteria) Strains. Toxins 2012, 4, 900–912. [Google Scholar] [CrossRef]
  41. Burlingame, G.A.; Dann, R.M.; Brock, G.L. A Case Study of Geosmin in Philadelphia’s Water. J. Am. Water Work. Assoc. 1986, 78, 56–61. [Google Scholar] [CrossRef]
  42. Sugiura, N.; Iwami, N.; Inamori, Y.; Nishimura, O.; Sudo, R. Significance of attached cyanobacteria relevant to the occurrence of musty odor in Lake Kasumigaura. Water Res. 1998, 32, 3549–3554. [Google Scholar] [CrossRef]
  43. Watson, S.B.; Ridal, J. Periphyton: A primary source of widespread and severe taste and odour. Water Sci. Technol. 2004, 49, 33–39. [Google Scholar] [CrossRef]
  44. Izaguirre, G.; Taylor, W.D. Geosmin and MIB events in a new reservoir in southern California. Water Sci. Technol. 2007, 55, 9–14. [Google Scholar] [CrossRef]
  45. Soppa, J. Non-equivalent genomes in polyploid prokaryotes. Nat. Microbiol. 2022, 7, 186–188. [Google Scholar] [CrossRef]
Figure 1. Sampling sites in the Yanlonghu CW-R. Seven sampling transects corresponded with the water flow direction. Note: S1 was at the inlet of the whole system; S2 was at the outflow of zone I; S3 was at the outflow of zone II; S4 was at the outflow of zone III, and S5, S6, and S7 were at the inlet, center, and outlet of zone IV, respectively. Red arrows indicate the water flow along the four zones.
Water 14 02670 g001
Figure 2. Monthly changes in the concentrations of (a) total nitrogen (TN), (b) total phosphorus (TP), and (c) chlorophyll a (Chl a) in the inlet and four treatment zones in the CW-R.
Water 14 02670 g002
Figure 3. (a) Seasonal variations in relative abundance of different phyla, and (b) cell density of nine genera in cyanobacteria (each site contains 12 bars corresponding to 12 months). Note: S1 was at the inlet of the whole reservoir; S2 was at the outflow of zone I; S3 was at the outflow of zone II; S4 was at the outflow of zone III, and S5, S6, and S7 were at the inlet, center, and outlet of zone IV, respectively.
Water 14 02670 g003
Figure 4. Monthly variation in 2-MIB synthesis gene copies and 2-MIB concentrations at 7 sampling sites in Yanlonghu CW-R. (▲) Copy numbers of 2-MIB synthesis gene revealed through qPCR using MIB-Rf/MIB-Rr primers (triplicates); (■) 2-MIB concentrations determined using HSPME/GC/MS.
Water 14 02670 g004
Figure 5. Correlation between mic gene copies and 2-MIB concentrations in Yanlonghu CW-R. γc (x-axis) and γM (y-axis) correspond to the mic abundance (copies/mL) and 2-MIB concentration (ng/L), respectively, with the 95% confidence interval (broken line).
Water 14 02670 g005
Figure 6. Double Y plots of the cell densities of five filamentous cyanobacteria and 2-MIB concentration along the four treatment zones in April (a) and July (b).
Water 14 02670 g006
Figure 7. Images of the main MIB-producing cyanobacteria and benthic mats. Microscopic images of Pseudanabaena sp. (a) and Oscillatoria sp. (b). A long band of benthic mats (200 m × 3 m) full of brown patches developed all around the shallow water-distribution channel at the front end of the pretreatment zone (c). Thin biofilm of the brown patches (d), which was composed of benthic Oscillatoria (b). The Oscillatoria strain isolated from the biofilm could produce 2-MIB, as demonstrated by GC–MS.
Water 14 02670 g007
Table 1. Pearson’s correlation coefficient of cell densities of different algae, gene copies, and the concentration of 2-MIB.
Cell Densitiesmic2-MIB
Pseudanabaena0.667 **0.644 **
Dolichospermum0.306 **0.494 **
Aphanizomenon−0.350.074
Oscillatoria0.900 **0.586 **
Planktothricoide0.0090.198
filamentous cyanobacteria0.630 **0.685 **
Cyanobacteria0.4520.611 *
Phytoplankton0.540 **0.504 **
Note(s): A 0.05 significance level with one asterisk (*) and a 0.01 significance level with two asterisks (**).
Publisher’s Note: MDPI stays neutral with regard to jurisdictional claims in published maps and institutional affiliations.

