1. Introduction
The Sanhe region, located in the middle reaches of the Yellow River, is an important area for the origin of early national civilization in China, and a large number of early sites from the Paleolithic, Neolithic, and Xia, Shang and Zhou Dynasties are distributed in the region. A systematic study of the spatial and temporal distribution characteristics of early sites in the Sanhe region is of great empirical significance in revealing the development and evolution of early civilizations.
At present, scholars have carried out relevant research on the spatial and temporal distribution of ancient sites [
1] which mainly involves the process of cultural evolution and the driving factors for prehistoric human lifestyle [
2,
3]; the current situation of protection and utilization of ancient sites, pointed out the problems of unreasonable protection zoning and difficulties in displaying prehistoric sites, and proposed some development and utilization models and ideas of ancient sites based on the experiences of protection and utilization of ancient sites worldwide [
4]. In addition, with the development and popularization of GIS technology, GIS technology is gradually used in the study of human–land relations in historical periods, and scholars are also keen to study and analyze the spatial distribution characteristics of sites quantitatively and explore the connection between their distribution modes and the natural environment with the help of GIS tools, involving various disciplines such as archaeology, geography, architecture and cultural heritage. The main content of previous research includes using GIS technology to analyze the relationship between the distribution of sites and impact factors such as elevation, slope, coastline changes, etc [
5,
6]. With the help of GIS technology, there are also studies that are used to guide the conservation planning of cultural heritage and ancient sites [
7]. In addition, there are research studies about geodiversity evaluation [
8,
9], including methods of geodiversity evaluation, such as Forte. J.P. put forward the application of kernel density estimation in geodiversity assessment. In the existing research, geology, geomorphology, hydrology and soil elements are usually regarded as important elements of geodiversity and used for geodiversity evaluation [
10]. Other studies have involved the influence of the geographical environment on biodiversity; for example, He, F. studied the influence of altitude, aspect and local environment on the diversity of diatoms and macroinvertebrates on Cangshan Mountain [
11].
The existing relevant GIS studies are mostly limited to the separate discussion of geographical factors, but there are relatively few studies on the comprehensive analysis of the correlation between geodiversity and cultural sites. This study applies the method of geodiversity–diversity kernel density analysis to the research of cultural sites and improves this kind of research.
The purpose of this study was to further examine the origin and evolution of early civilization by analyzing the spatial and temporal distribution characteristics and human–land relationship of early sites in the Sanhe region from the Paleolithic to the Xia, Shang and Zhou Dynasties; to reveal the internal consistency between its distribution pattern and the origin and evolution of early civilization; and to provide methods for the protection, display and utilization of early sites in order to protect and preserve the Yellow River culture, and to assist with the high-quality development of the Yellow River Basin.
2. Data and Methods
2.1. Research Scope
2.1.1. Time Scope
The Sanhe region in the middle reaches of the Yellow River has a long history and abundant site resources. People have lived here since the Paleolithic Age, and kingdoms in the early Xia, Shang and Zhou Dynasties established their capitals here. This study limits the time to the historical stages, namely the Paleolithic Age, the Neolithic Age and the Xia, Shang and Zhou Dynasties (including the Western Zhou Dynasty and the Eastern Zhou Dynasty), from the appearance of early human beings to the appearance and formation of early civilization. The distribution characteristics of the sites in these three periods are analyzed to explore the development of a regular pattern of early civilization.
2.1.2. Spatial Scope
The Sanhe region is composed of the Hedong region, Henan region and Henei region. Before the Qin and Han dynasties, the Sanhe region was only used as a generalized geographical location [
12], and whether there was a county or not in the pre-Qin period does not have clear evidence in academic research. Until the Qin and Han Dynasties, there was a clear administrative boundary. In the Qin Dynasty, the region was named Hedong County [
13], Hanei County and Sanchuan County, chronologically, and during the Western Han Dynasty, it was named Hedong County, Hanei County and Henan County, chronologically [
14]. Compared with the Qin Dynasty, the area of the Sanhe region in the Western Han Dynasty had expand. In this study, the research boundary is determined by the Sanhe region map in the Qin and Han Dynasties depicted in the “Atlas of Chinese History and the Records of the Sanhe Region in the pre-Qin Period” written by Tan Qixiang (
Figure 1), which roughly overlaps the city area of Yuncheng City and Linfen City in Shanxi Province (namely the ancient Hedong region), Luoyang City and Zhengzhou City in Henan Province (namely the ancient Henan region), Jiyuan City, Jiaozuo City, Xinxiang City, Anyang City and Hebi City (namely the ancient Henei region) [
15].
2.2. Data
The sites in this study are mainly chosen from the list of “China national key cultural relics protection units”, provincial cultural relic protection units published on the website of the Shanxi Provincial Cultural Relics Bureau (
http://wwj.shanxi.gov.cn/, accessed on 20 May 2021), and municipal cultural relic protection units, county-level cultural relic protection units, and unclassified cultural relic protection units in the Chinese Cultural Relics Atlas—Shanxi volume; and the Henan Provincial Cultural Relics Bureau website (
http://wwj.henan.gov.cn/, accessed on 20 January 2022) announced the national key cultural relics protection units in Henan Province, as well as the volumes on the immovable cultural relic lists of Zhengzhou, Luoyang, Anyang, Hebi, Xinxiang, Jiyuan, and Jiaozuo from the third Henan Provincial Cultural Relics survey. Among them, a total of 478 Paleolithic sites, a total of 2137 Neolithic sites, and a total of 2318 Xia–Shang-Zhou sites are recorded.
The DEM elevation data was obtained from Google Maps. In addition, the slope, aspect, and topographic relief data were also based on the DEM elevation data and calculated by GIS software. The data used in the research is raster elevation data. As the research area is very large, high-precision data cannot be calculated in GIS software, so DEM elevation data with a 9.5 m precision was selected. In fact, for a large research area, existing research generally uses 30 m precision data provided by government websites, and its accuracy is difficult to guarantee. Therefore, the highest-precision data on the research area that could be operated by computers was selected to improve the accuracy of the research results.
2.3. Methods
2.3.1. Adjacent Index
The spatial distribution types of the sites in the study area are determined through adjacent index analysis of the sites. The adjacent index analysis results will return five values: average observation distance, theoretical average distance, nearest neighbor index,
Z score and
p value.
p value represents probability; when the
p value is lower, the observed spatial pattern is unlikely to be generated in a random process (small probability). The
Z score is a multiple of the standard deviation. The higher the the
Z value, the greater the degree of aggregation. The classification rules of the spatial distribution types of sites are as follows: if the adjacent index is less than 1, the spatial distribution type belongs to the aggregation distribution type; if the nearest neighbor index is equal to 1, the spatial distribution type is random; if the adjacent index is greater than 1, it belongs to uniform distribution type. The calculation formula is as follows:
In the formula,
refers to the average value of the distance
between the nearest neighbor points, and
refers to the average distance of the nearest neighbor points in the random distribution pattern.
D refers to the density of all points, and finally the adjacent index
R is calculated [
16,
17].
2.3.2. Kernel Density Estimation
The kernel density estimation method can reflect the spatial distribution and aggregation characteristics of site points. The larger the kernel density, the denser the distribution of sites. In addition, the kernel density map of geodiversity elements and the distribution of cultural sites were superimposed, and the correlation between them was discussed. The calculation formula is as follows:
In the formula, the kernel density is estimated as the probability that the density function
f is at the point
x, where
is the kernel function,
h represents a search radius greater than 0, and
x −
means the distance (km) between the estimated point
x and the event
[
18,
19].
2.3.3. Standard Deviation Ellipse
The distribution direction of the sites in each period is determined by the standard deviation ellipse. The long axis of the ellipse represents the main direction of the site distribution, the short axis represents the secondary direction of the site distribution, and the inclination angle of the ellipse represents the distribution trend of the sites. By comparing the distribution trend and direction of the sites in each period, the evolution characteristics of their spatial and temporal distribution can be obtained. The calculation formula is as follows:
In the formula,
xi and
yi are the coordinates of points,
n is the total number of samples, and {
,
} is the average center of all points.
In the formula,
is the tangent of the ellipse rotation angle, and
is the deviation of
xy coordinates from the average center.
In the formula,
is the length of the long axis of the ellipse, and
is the length of the short axis of the ellipse [
20].
2.3.4. Analysis of Geographical Factors
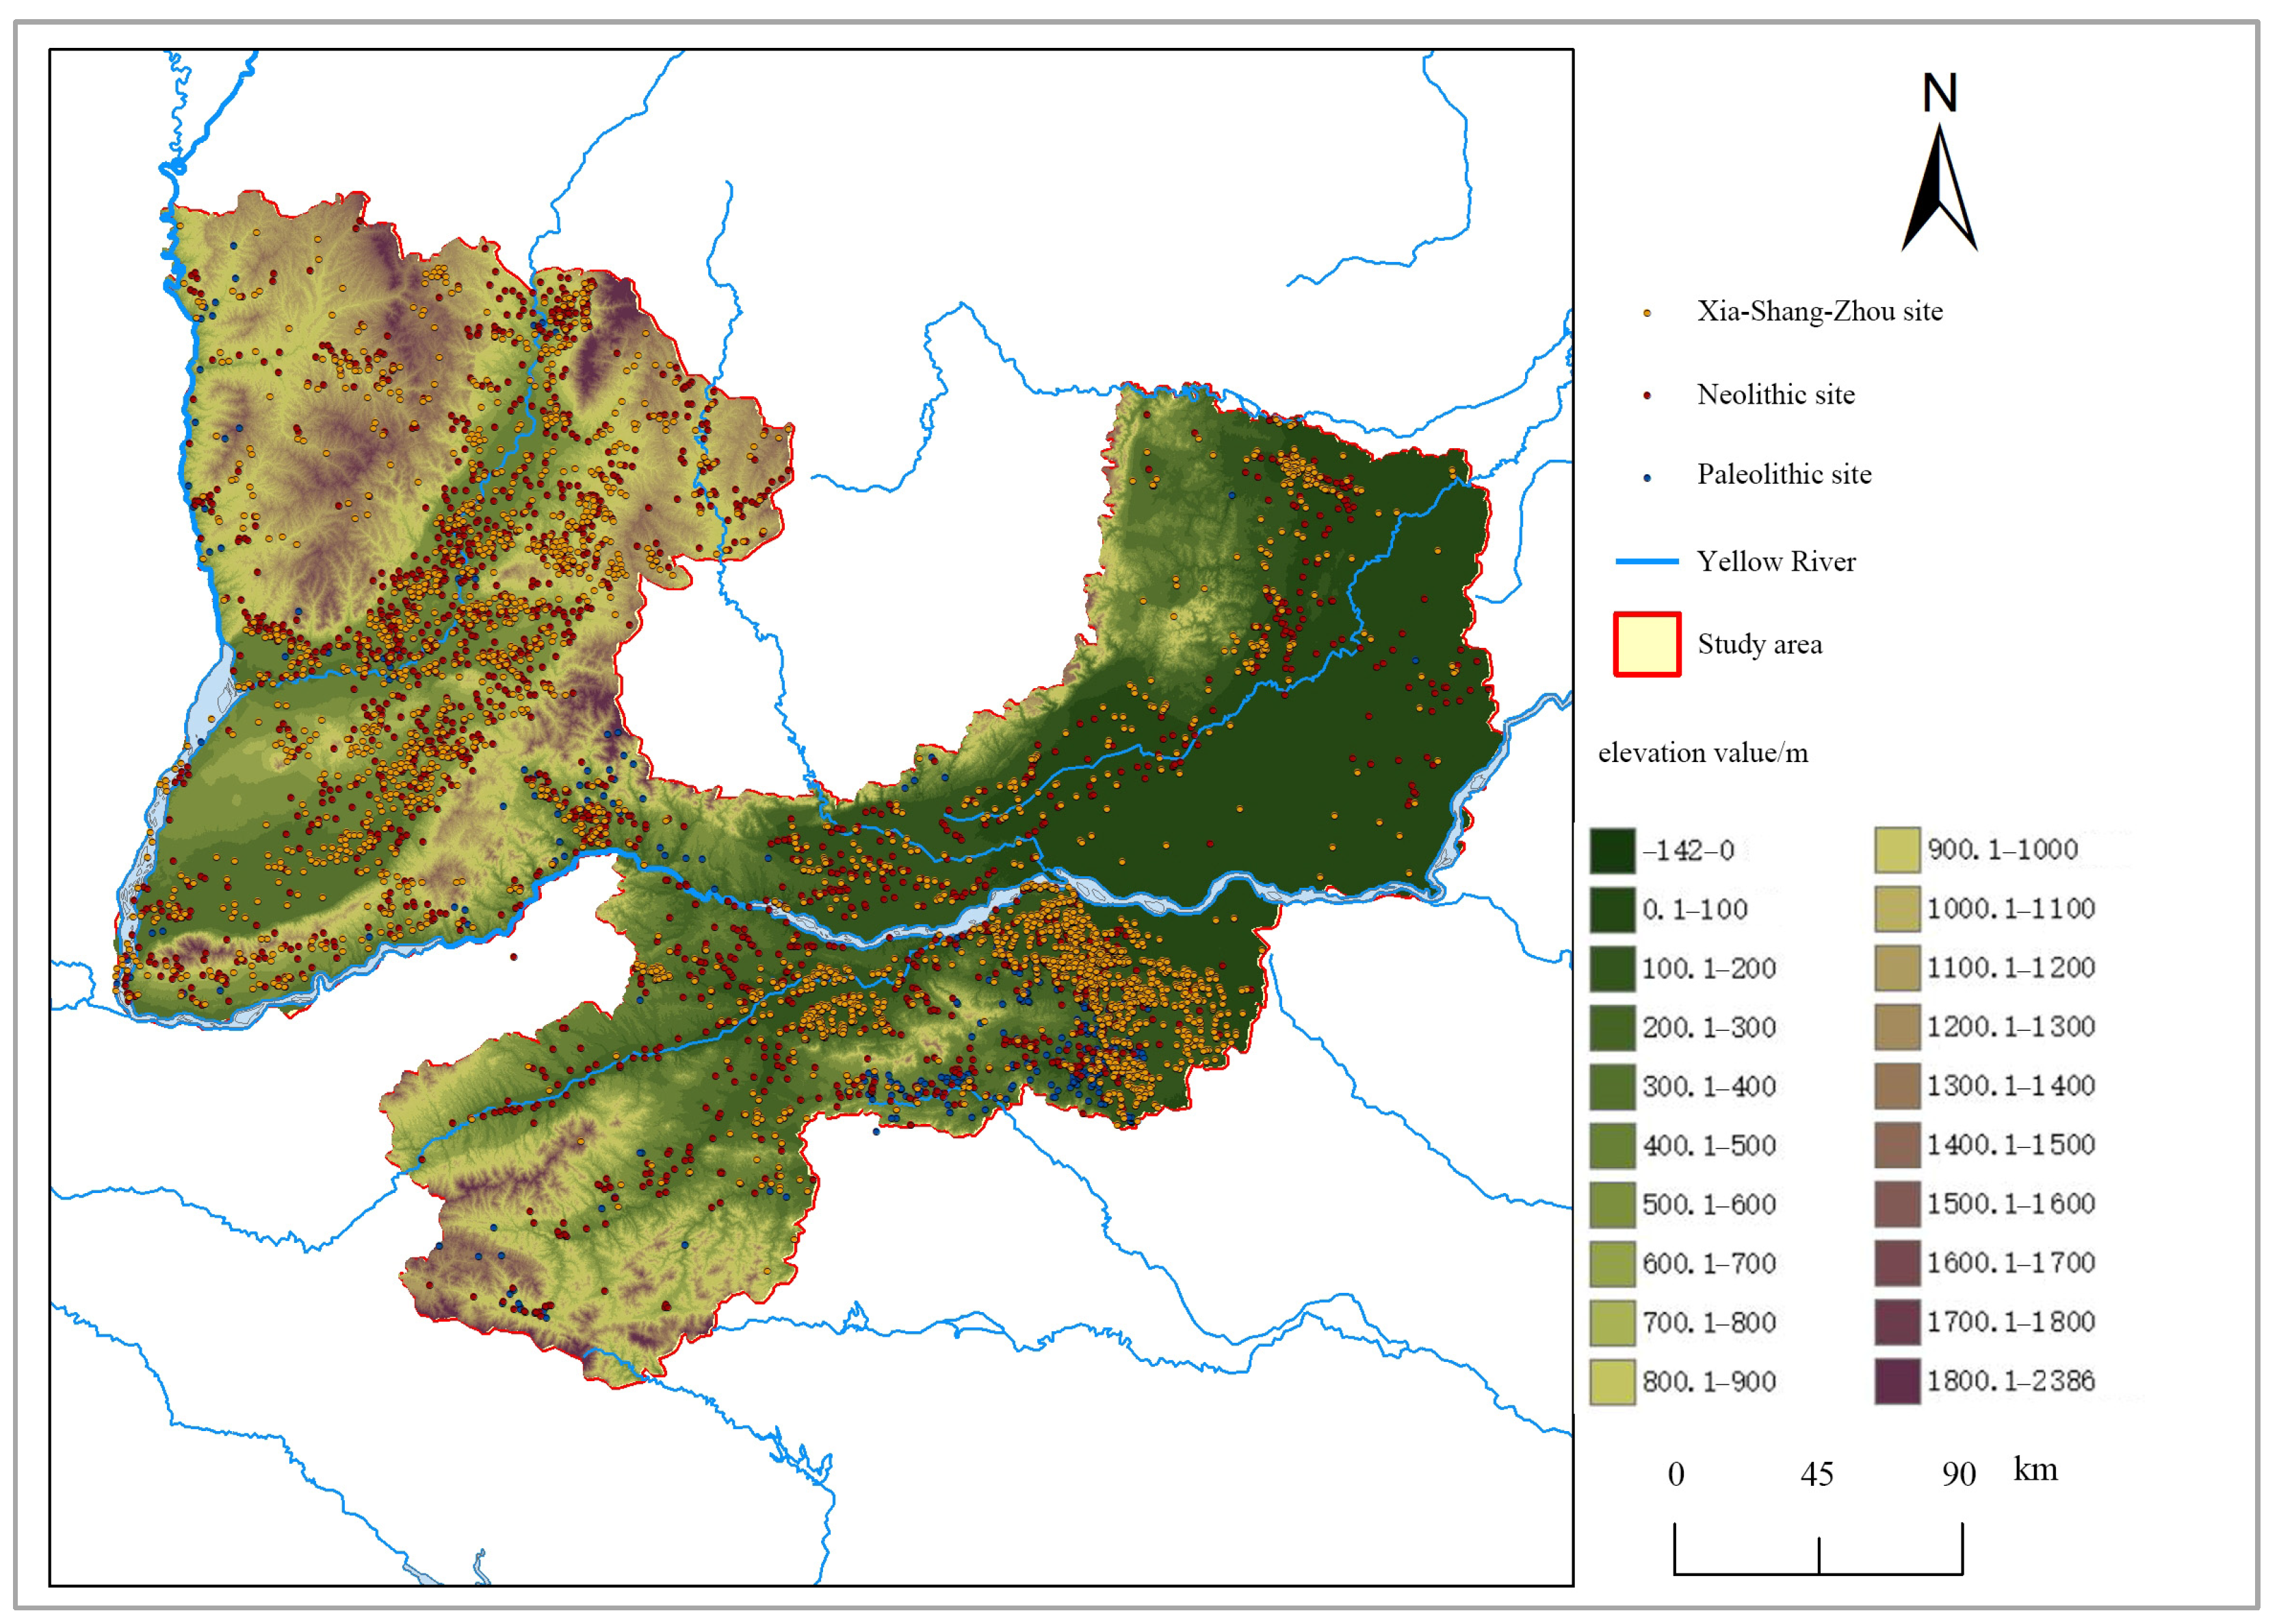
- (1)
Elevation factor. According to the DEM elevation data, the lowest elevation in the Sanhe region is −142 m, and the highest elevation is 2386 m. In order to determine the relationship between the location of the early settlement and the elevation, the elevation of the Sanhe region was first divided into 20 levels by combining the existing research methods. Level 1 is −142~0 m, level 2 is 1~100 m, level 3 is 101~200 m, level 4 is 201~300 m, level 5 is 301~400 m, level 6 is 401~500 m, level 7 is 501~600 m, level 8 is 601~700 m, level 9 is 701~800 m, level 10 is 801~900 m, level 11 level is 901~1000 m, the 12th level is 1001~1100 m, the 13th level is 1101~1200 m, the 14th level is 1201~1300 m, the 15th level is 1301~1400 m, the 16th level is 1401~1500 m, the 17th level is 1501~1600 m, the 18th level is 1601~1700 m, the 19th level is 1701~1800 m, and the 20th level is 1801~2386 m. Then, ArcGIS 10.0 software was used to link elevation level data with site data, and the number of Paleolithic, Neolithic, and Xia–Shang–Zhou sites in each elevation level in the Sanhe region was counted. As the total number of site samples for each period was different, the differences in their elevation distribution could not be directly reflected by the number, so the distribution of sites in each elevation level for each period was calculated separately in the study, and the percentage of sites in each elevation class level relative to the total number of sites in that period was calculated separately, and the percentage change of sites in different elevation levels in the three periods was plotted to investigate the influence of elevation on the distribution of early sites. Finally, the percentage change curves of sites with different elevation levels in the three periods were plotted to explore the influence of elevation on the distribution of early sites.
- (2)
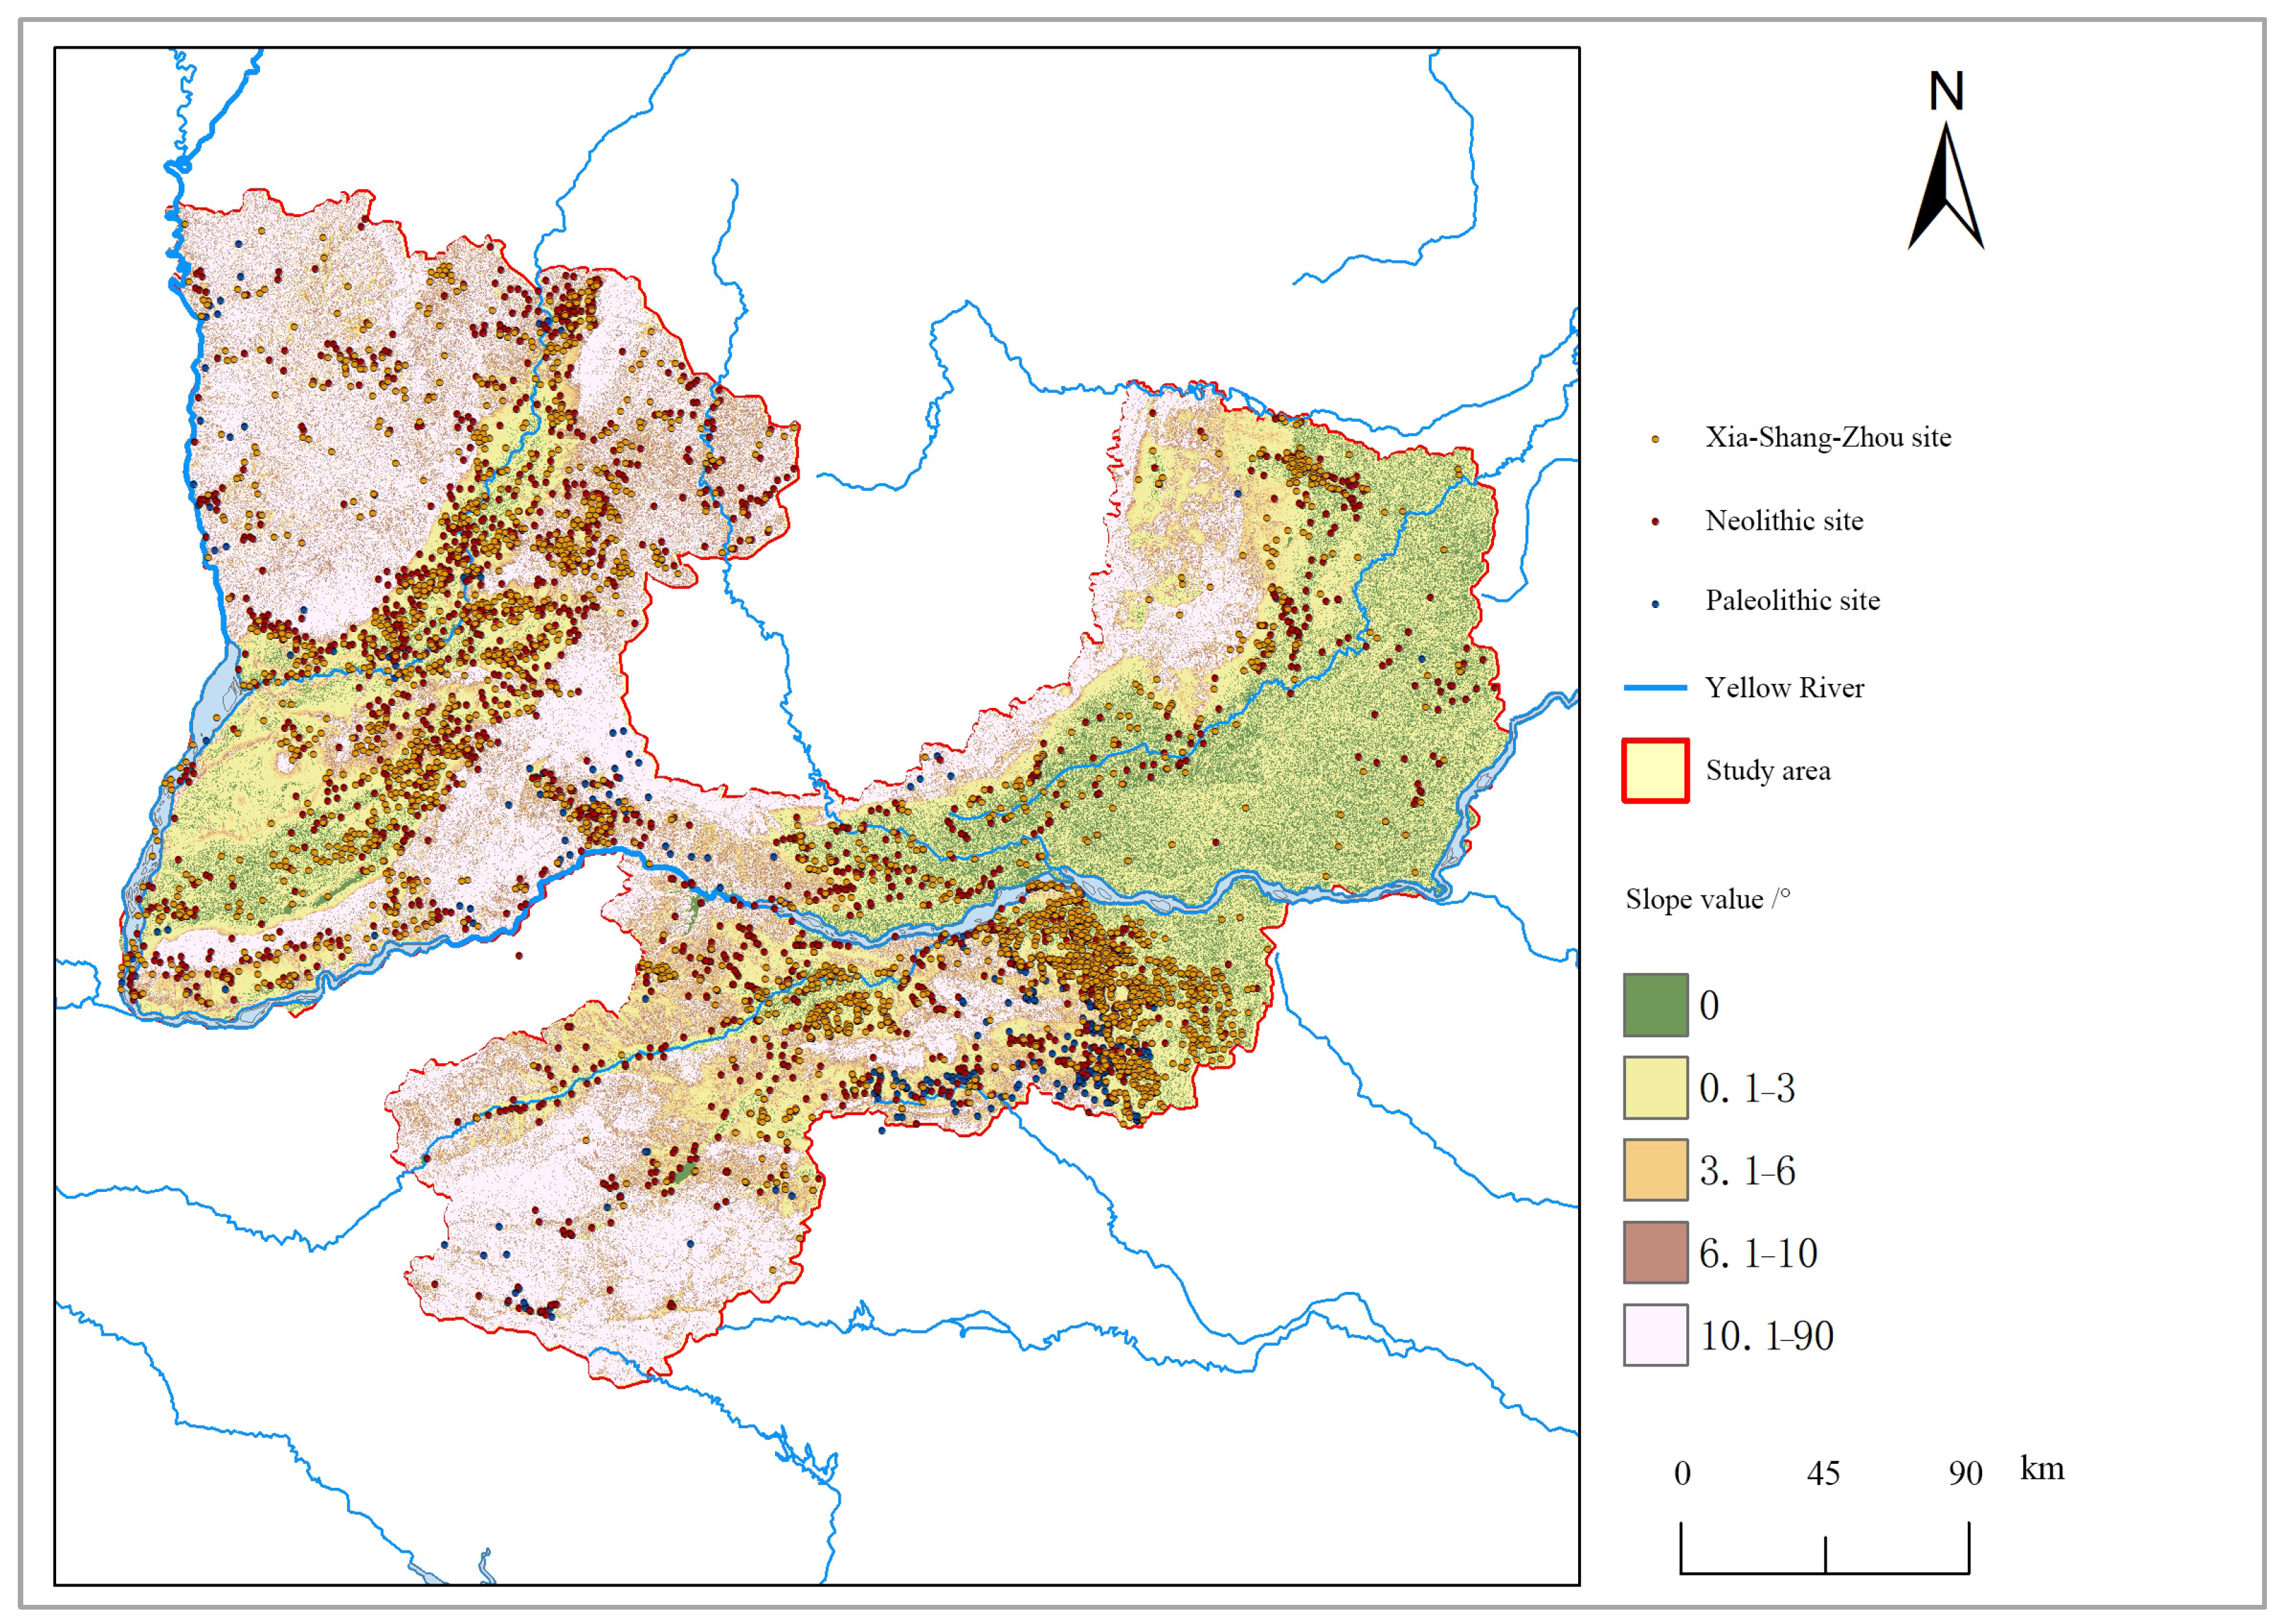
Slope factor. In ArcGIS software, the smaller the slope value, the flatter the terrain. The greater the slope value, the steeper the terrain. In order to find out the relationship between the location of the early ancestors and the slope, according to Professor Bi Shuoben’s slope classification method [
21], the slope of the Sanhe region was first divided into 4 levels. Level 1 is below 3° (very suitable for human habitation), Level 2 is within the range of 3°~6° (suitable for human habitation), Level 3 is within the range of 6°~10° (unsuitable for human habitation), and Level 4 is above 10° (very unsuitable for human habitation). Then, this research counted the number of Paleolithic, Neolithic, and Xia–Shang–Zhou sites in each level, and drew the percentage change curves of sites with different slopes in three periods to explore the impact of slopes on the distribution of early sites.
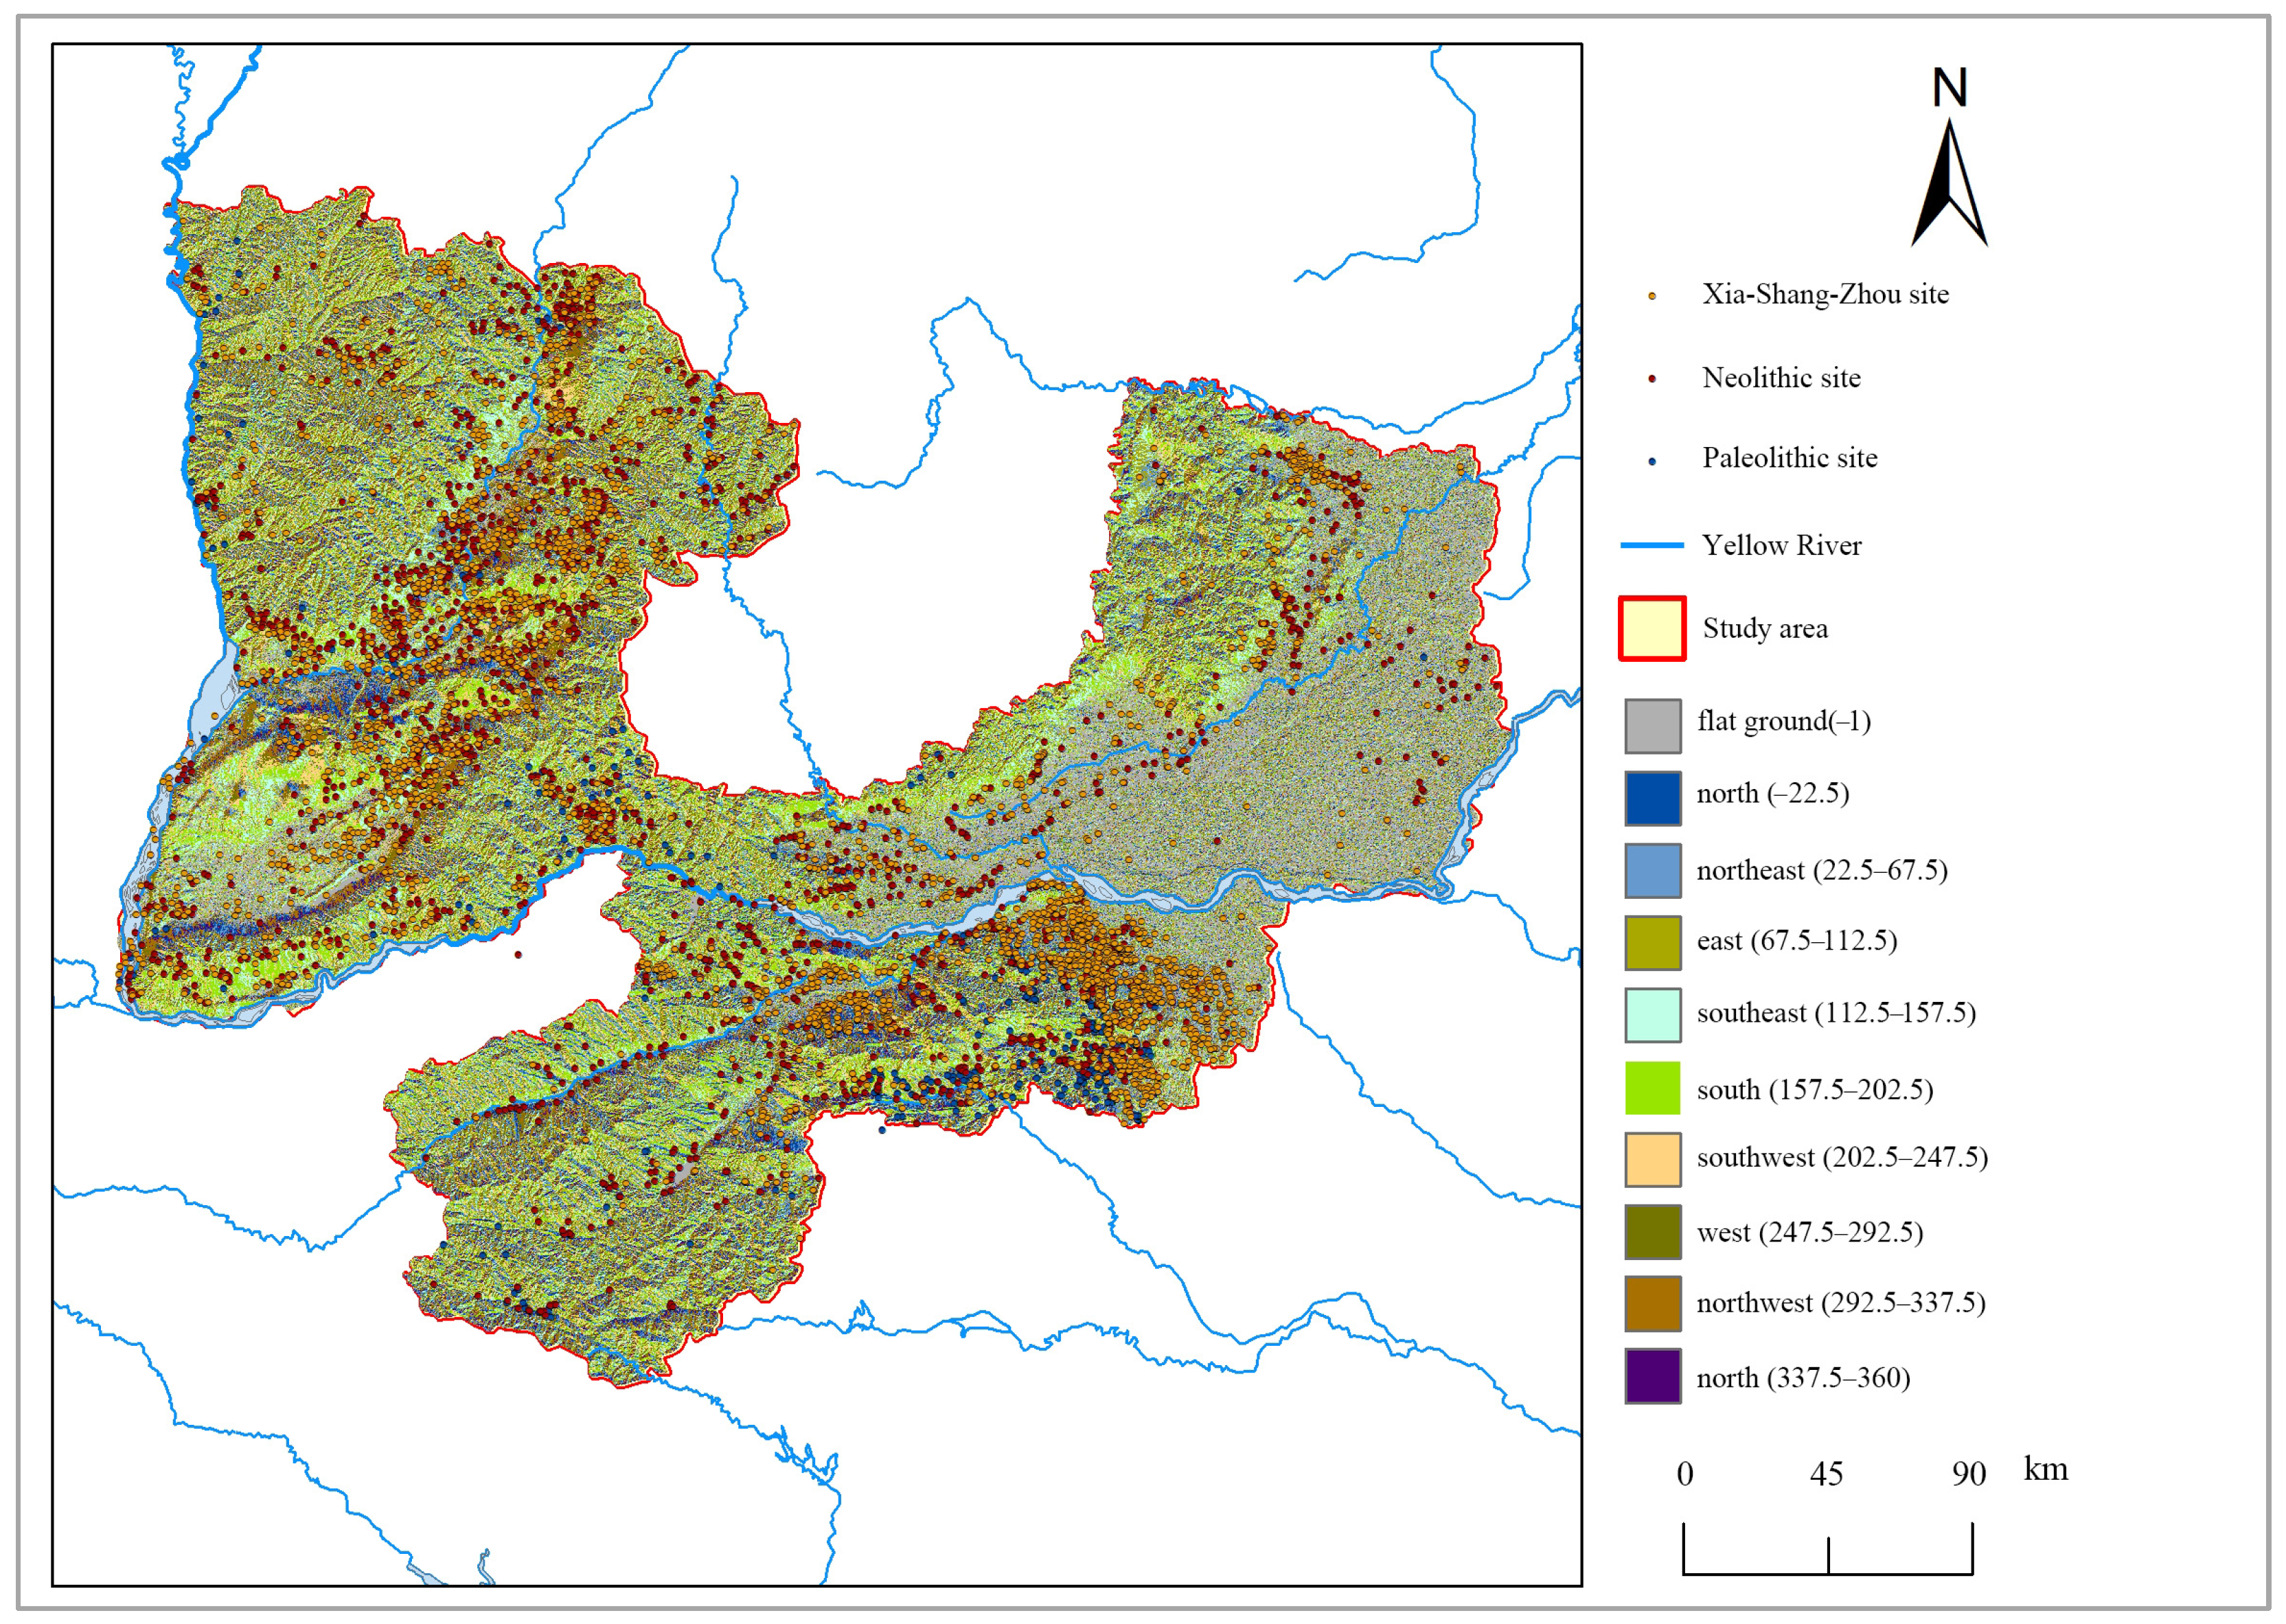
- (3)
Aspect factor. Aspect is the most important factor to determine the amount of sunshine in an area. Sunshine conditions directly affect people’s lives, heating methods, and agricultural production. Therefore, aspect is also one of the important factors that affect the settlement and site selection of the ancients. Relevant research shows that the south is the most suitable aspect for human habitation, the southeast aspect is suitable for human habitation, the north and northwest aspects are suitable for human habitation, and the east, northeast, west and southwest aspects are unsuitable for human habitation [
22]. This research counted the number of sites from the Paleolithic Age, Neolithic Age, Xia, Shang, and Zhou Dynasties in various aspects and drew a radar chart of the percentage change of sites in different aspects in three periods to explore the influence of aspect on the distribution pattern of early sites.
- (4)
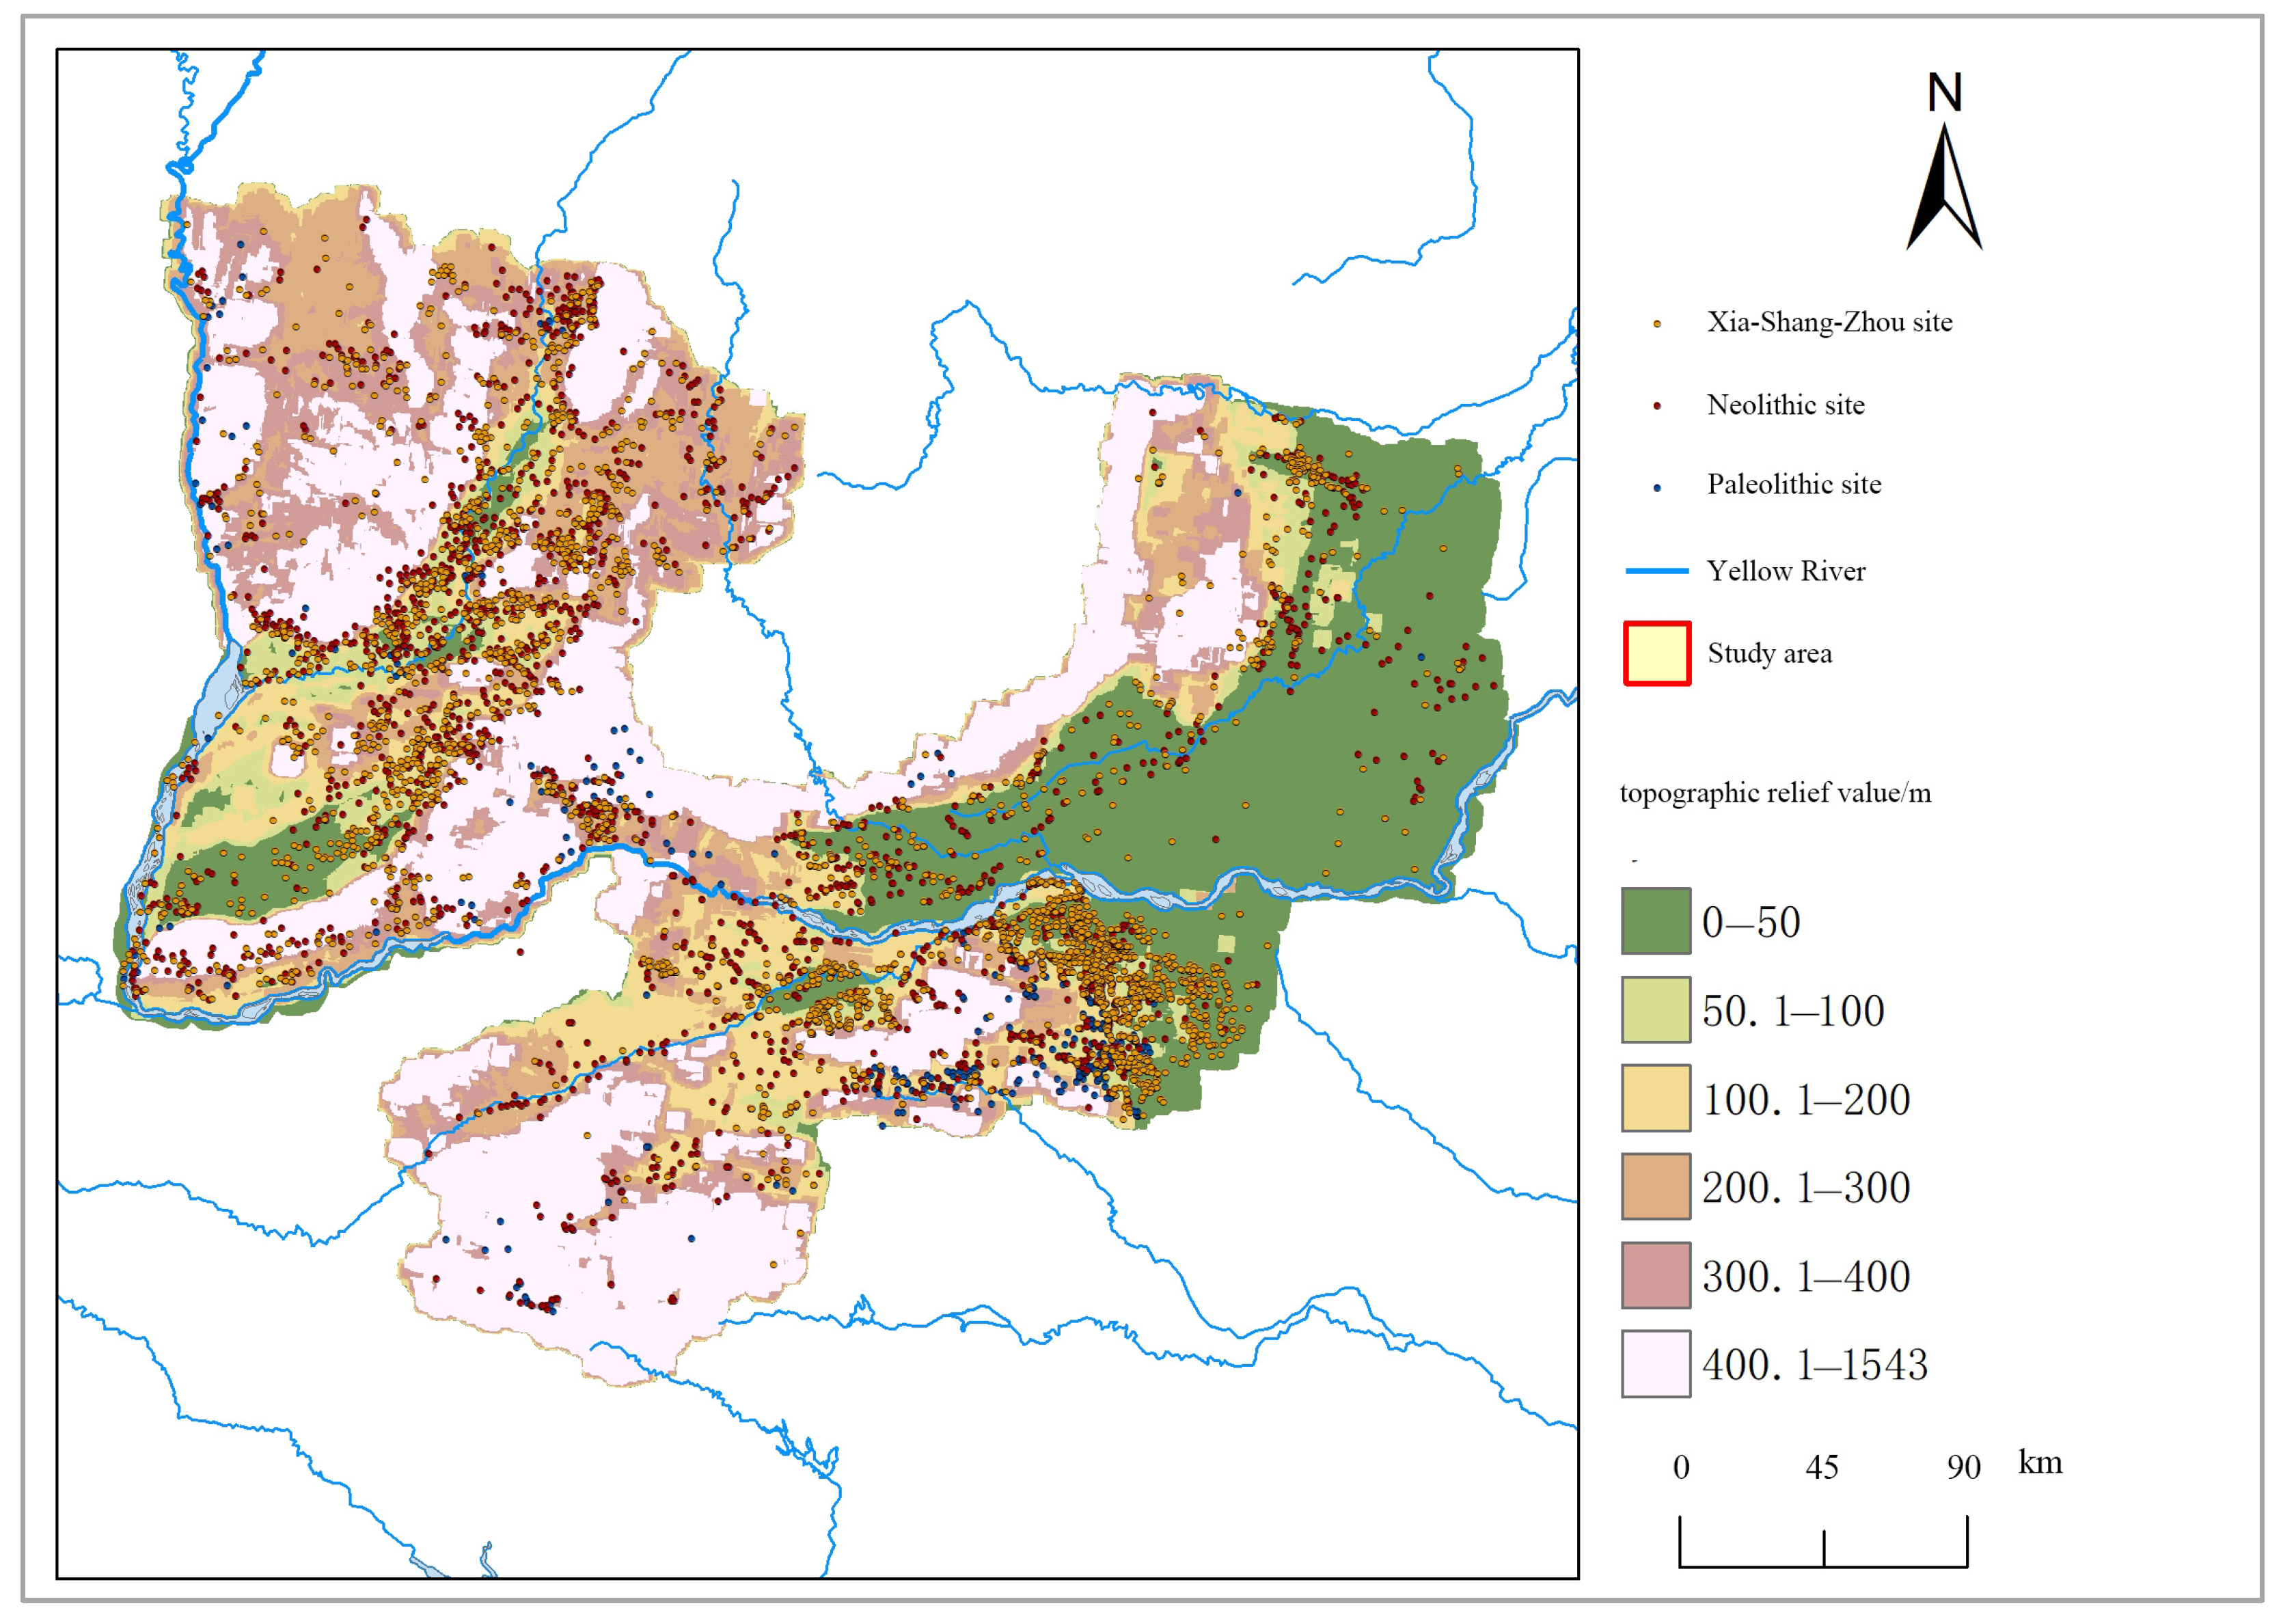
Topographic relief factor. Topographic relief, as one of the important indicators for the evaluation of habitat adaptability in a region, limits the accessibility, production, living, cultural exchange, economic development, and population distribution in a region [
23,
24]. According to the classification methods of topographic relief in existing studies, this research divided the topographic relief in the Sanhe region into six levels: the first level is 0~50 m, the second level is 50~100 m, the third level is 100~200 m, the fourth level is 200~300 m, the fifth level is 300~400 m, and the sixth level is 400~500 m [
25]. Then, this research counted the number of sites from the Paleolithic Age, Neolithic Age, and Xia, Shang, and Zhou Dynasties with various levels of topographic relief, respectively, and drew the percentage change curves of sites with different topographic relief in the three periods.
- (5)
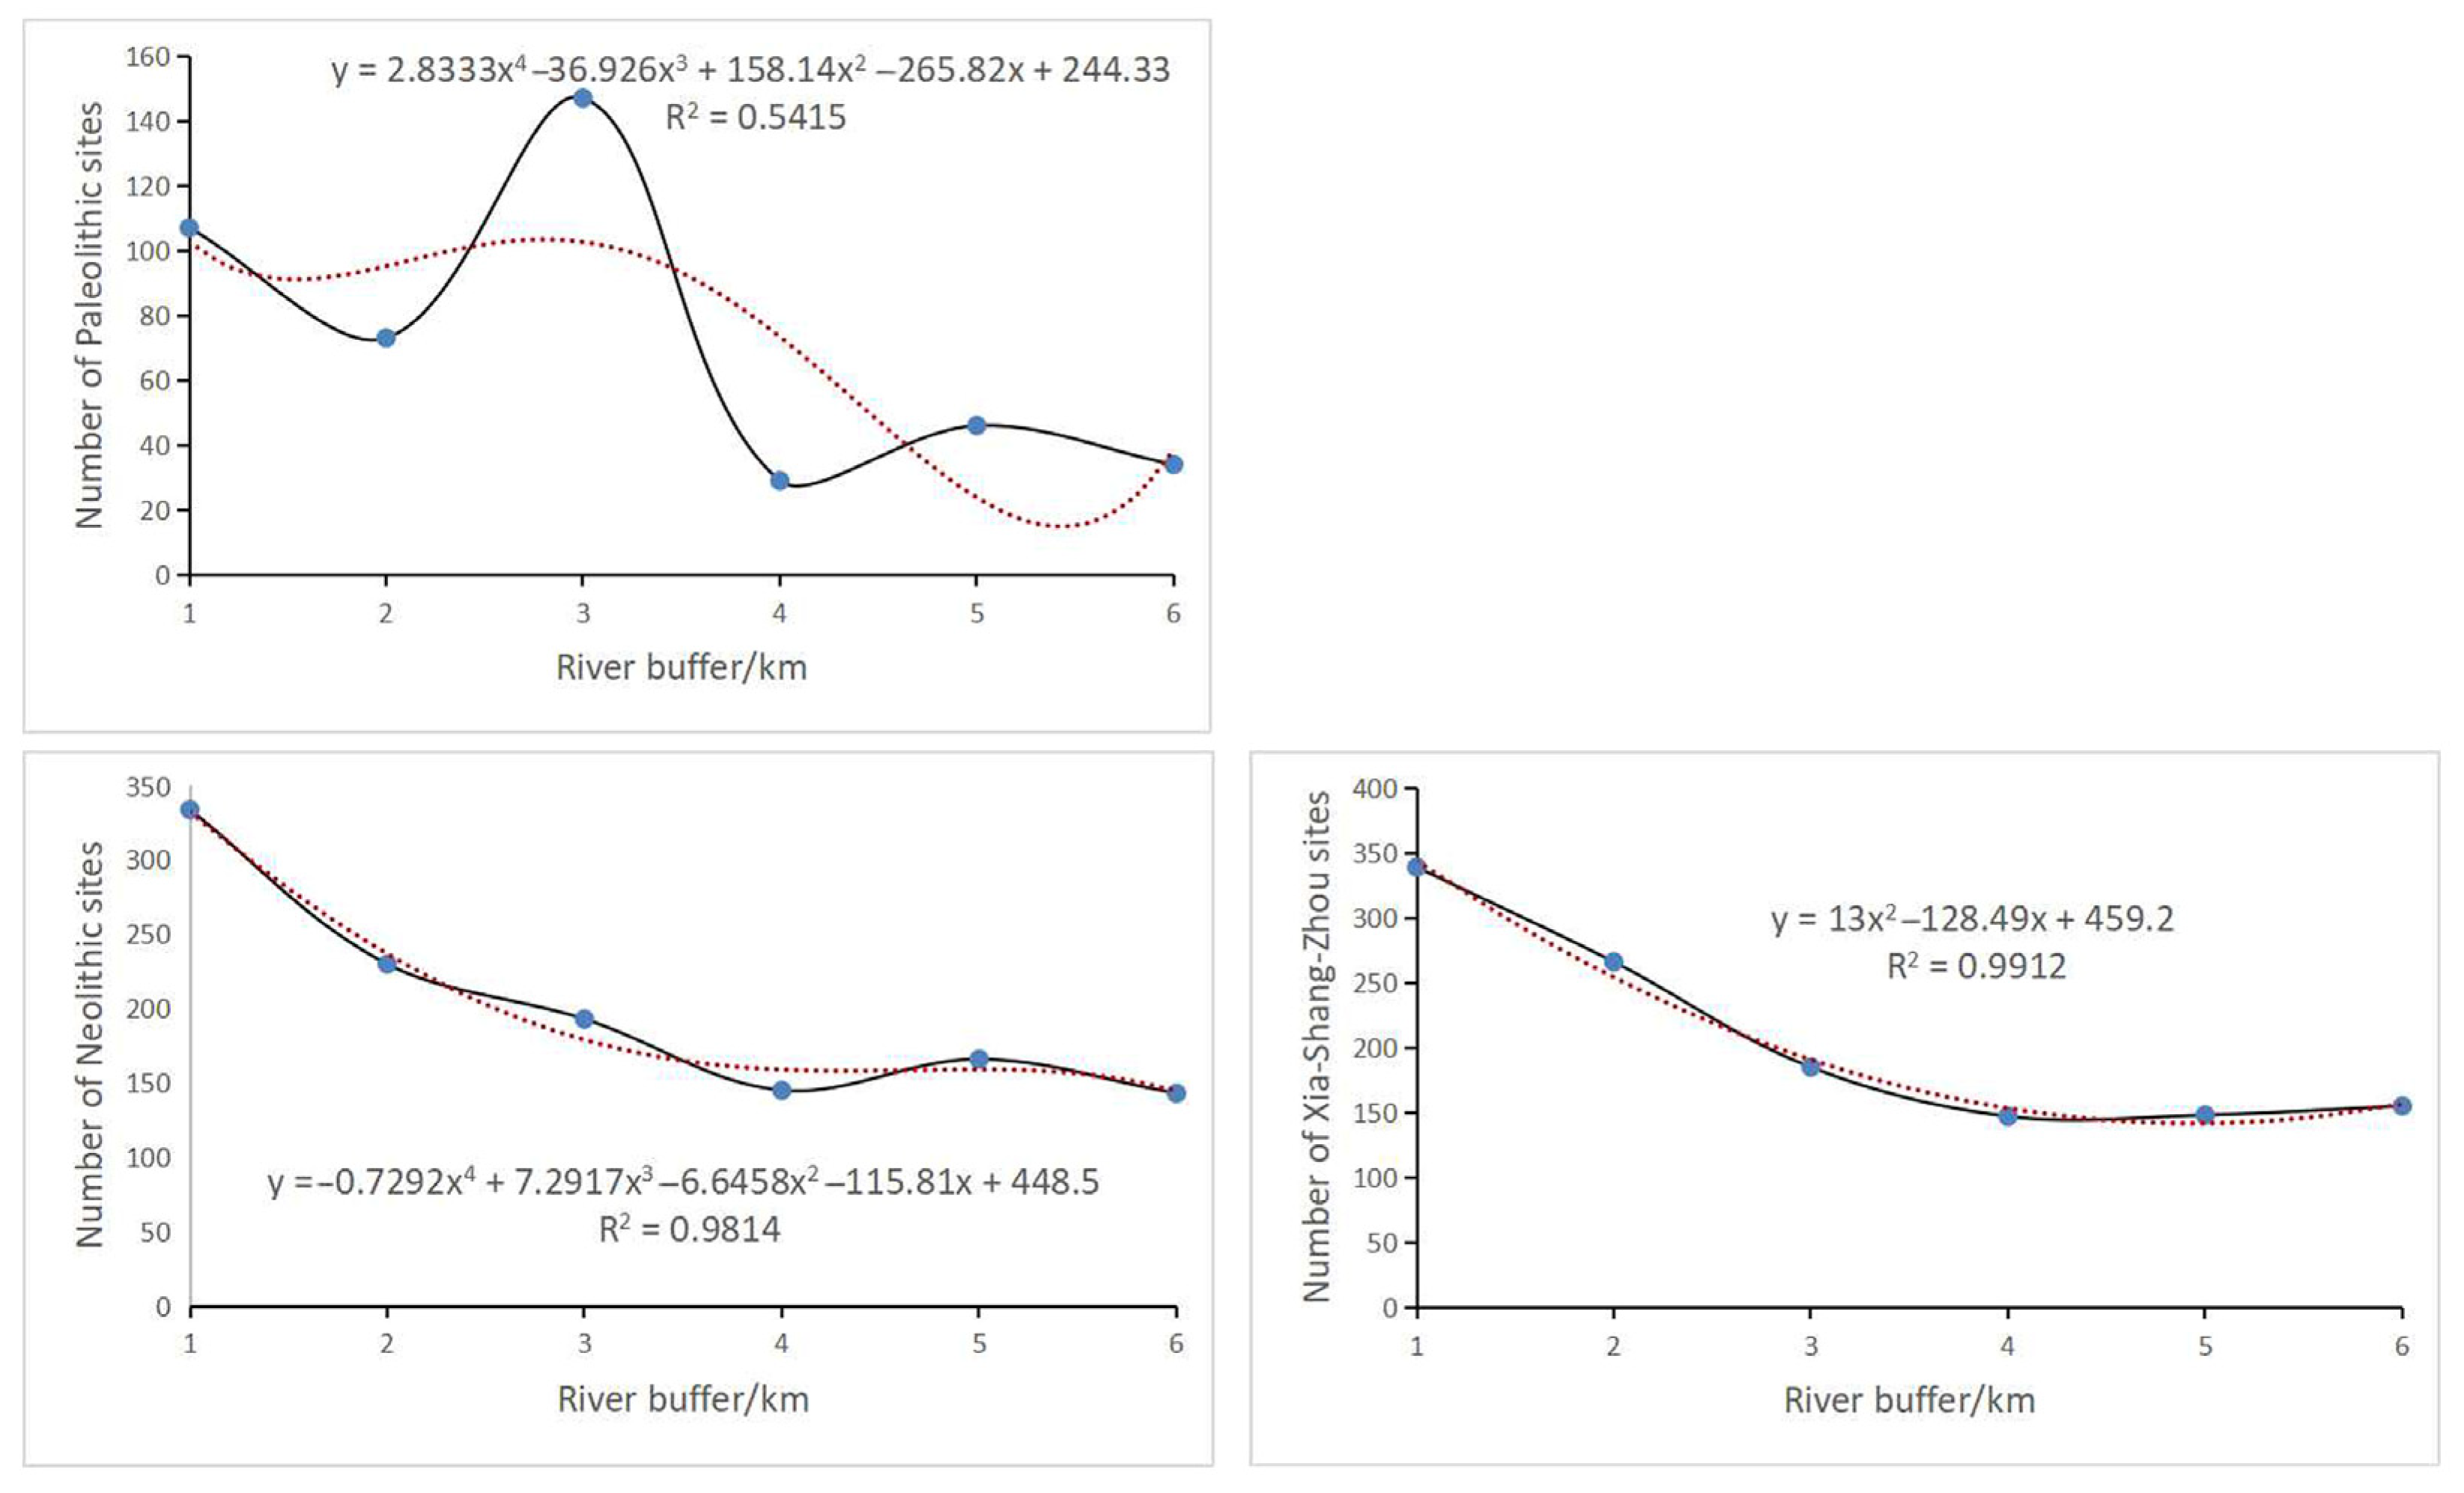
Hydrological factor. With the aid of GIS buffer tools, this research established 1 km, 2 km, 3 km, 4 km, 5 km, and 6 km buffer zones of major rivers in the Yellow River, Qinhe River, Weihe River, Yiluo River, and Fenshui River in the Sanhe region, and counted the number of sites in each buffer zone, so as to explore the relationship between the distribution of sites and the distance from the river system.
- (6)
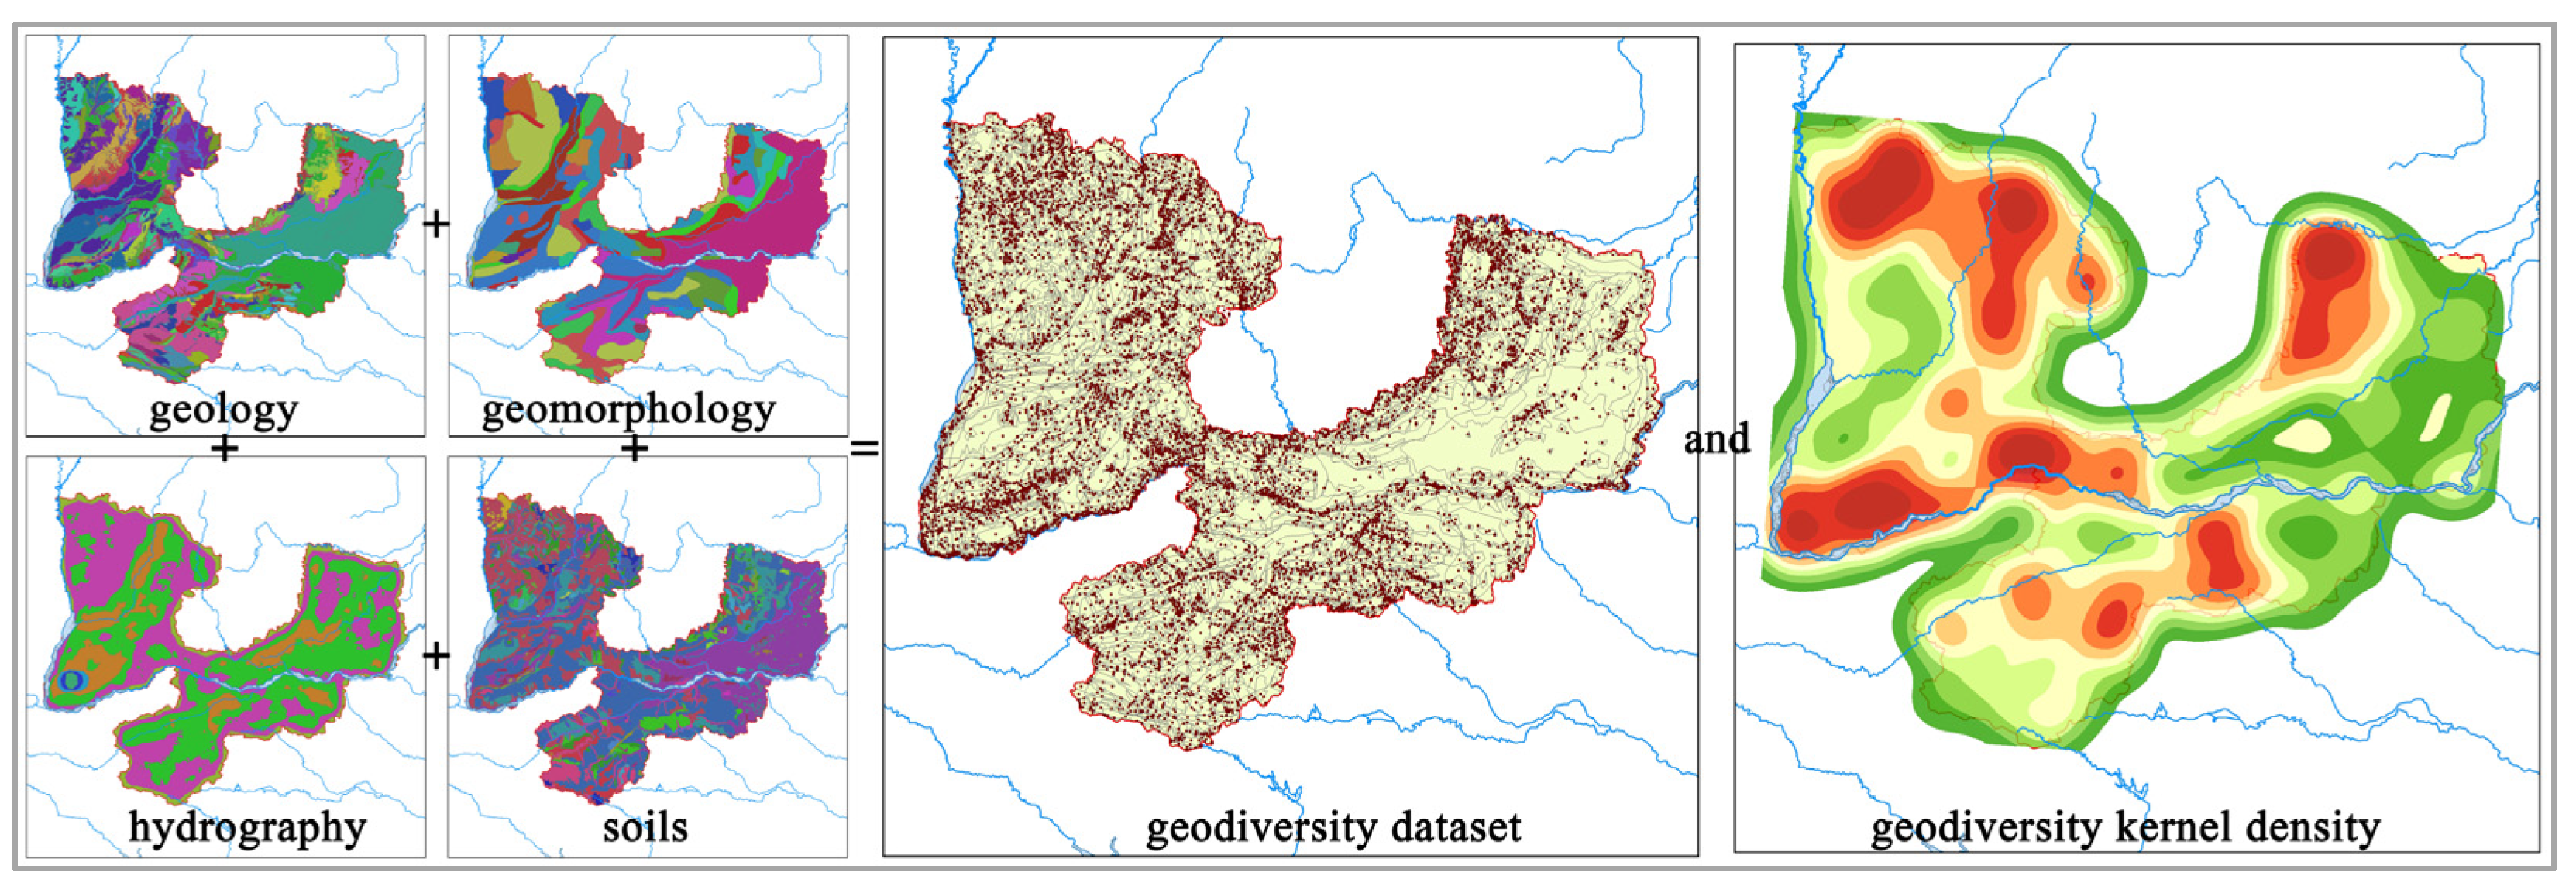
Geodiversity factor. In addition to the above part, the influence of a single geographical factor on the distribution characteristics of cultural sites, the degree of geodiversity, that is, the comprehensive effect of various geographical factors on cultural sites cannot be ignored. In academic circles, it is still inconclusive which geographical factors are the most important. In the existing studies, four indicators, geology, geomorphology, hydrology, and soil, are usually selected as the basis for evaluating geodiversity. In this research, the correlation between geodiversity and cultural distribution characteristics was studied through the following ideas: first, four data sets (geology, geomorphology, hydrology, and soil, which are from the open data of the Resources and Environment Data Center of the Chinese Academy of Sciences) were loaded into the GIS platform, respectively, and all datasets were merged into one dataset by superposition operation; second they were converted into point elements, which were generated according to the representative positions of the input elements. Then, using this new dataset, the kernel density of point elements was analyzed, and the geodiversity kernel density map was obtained. Finally, the geographical diversity–geodiversity kernel density map was superimposed with cultural sites, and the relationship between them was found.
3. Results
3.1. Evolution of Spatial and Temporal Distribution Characteristics
3.1.1. Analysis Results of Adjacent Index
According to the analysis results, it can be found that the adjacent index of Paleolithic sites was quite different from that of Neolithic sites and Xia–Shang–Zhou sites, and the Z value was quite different, with significant changes. The adjacent index of Neolithic sites was close to that of Xia–Shang–Zhou sites, and the difference of Z value was small. From the Paleolithic Age to the Neolithic Age, the spatial distribution patterns of the sites were all spatial aggregation (the adjacent index was less than 1), and the aggregation degree in the Paleolithic Age was low, and it continued to increase in the Neolithic Age. The aggregation degree in the Xia, Shang, and Zhou Dynasties was close to that in the Neolithic Age, showing an obvious inheritance relationship of aggregation degree (
Table 1).
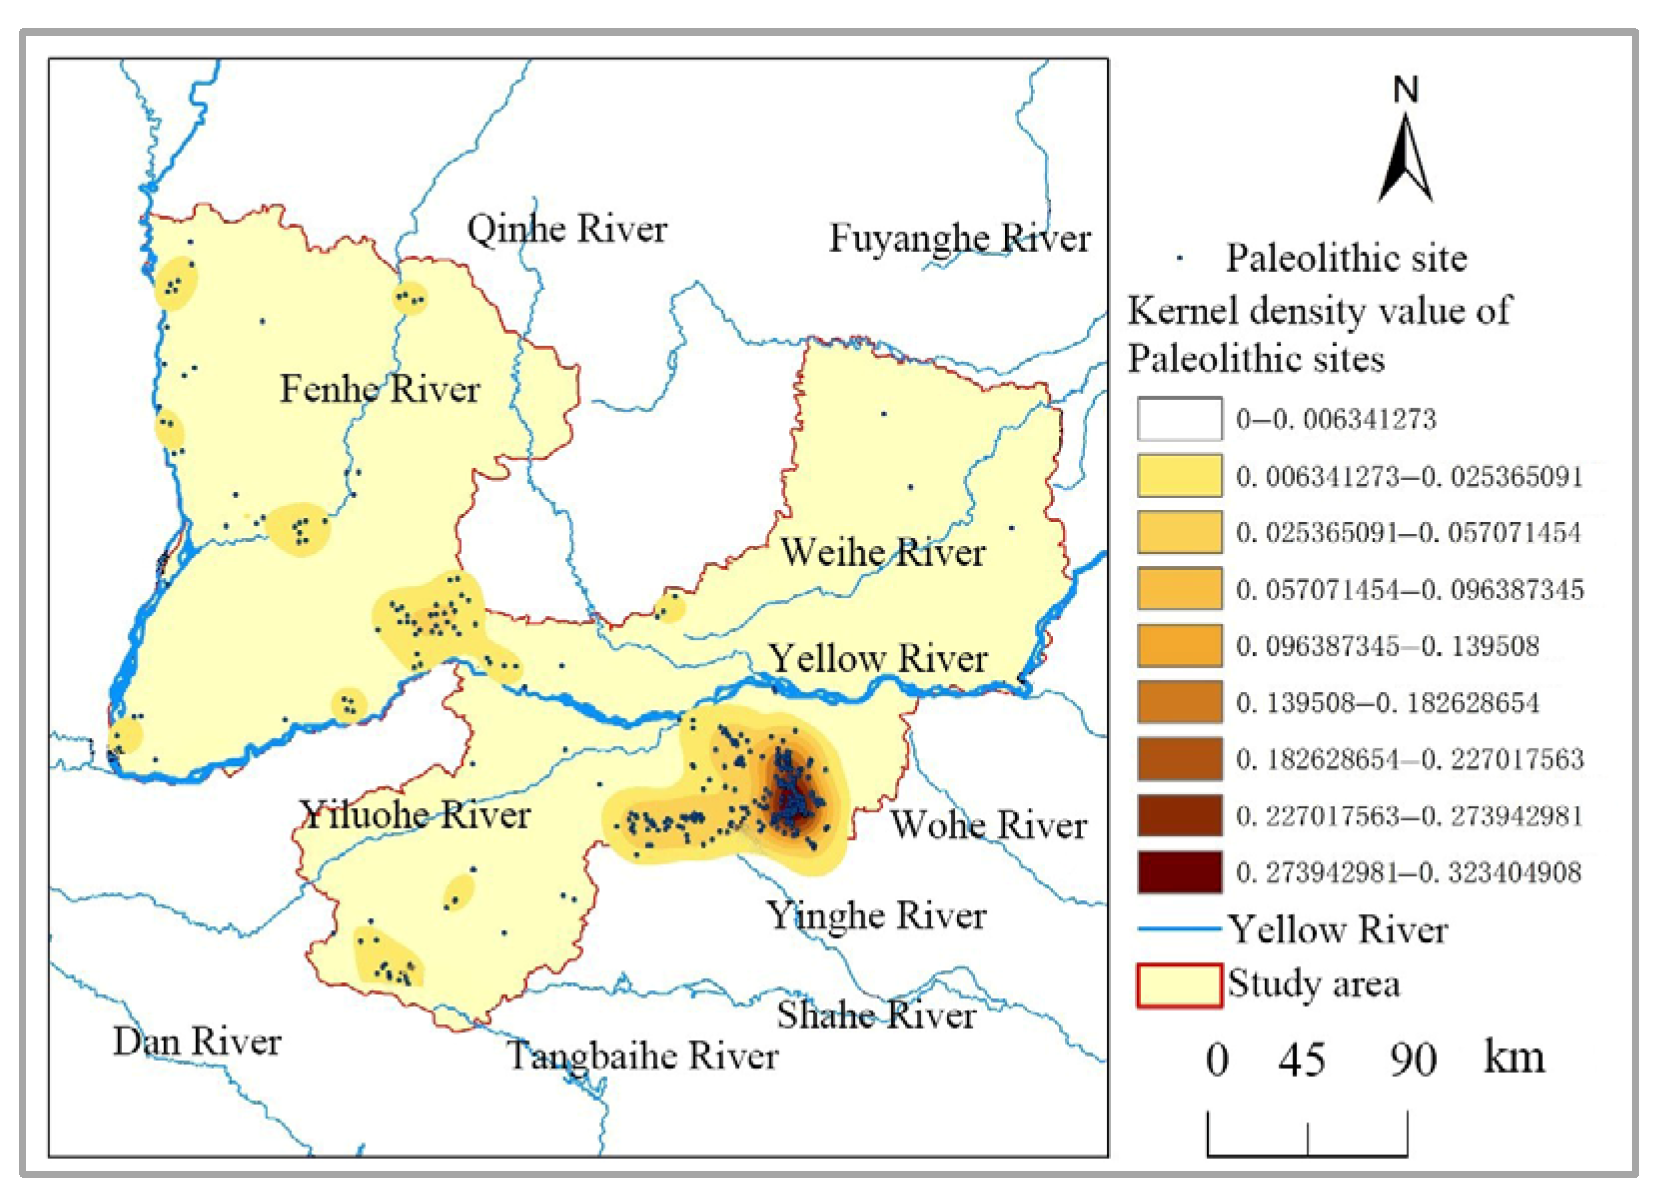
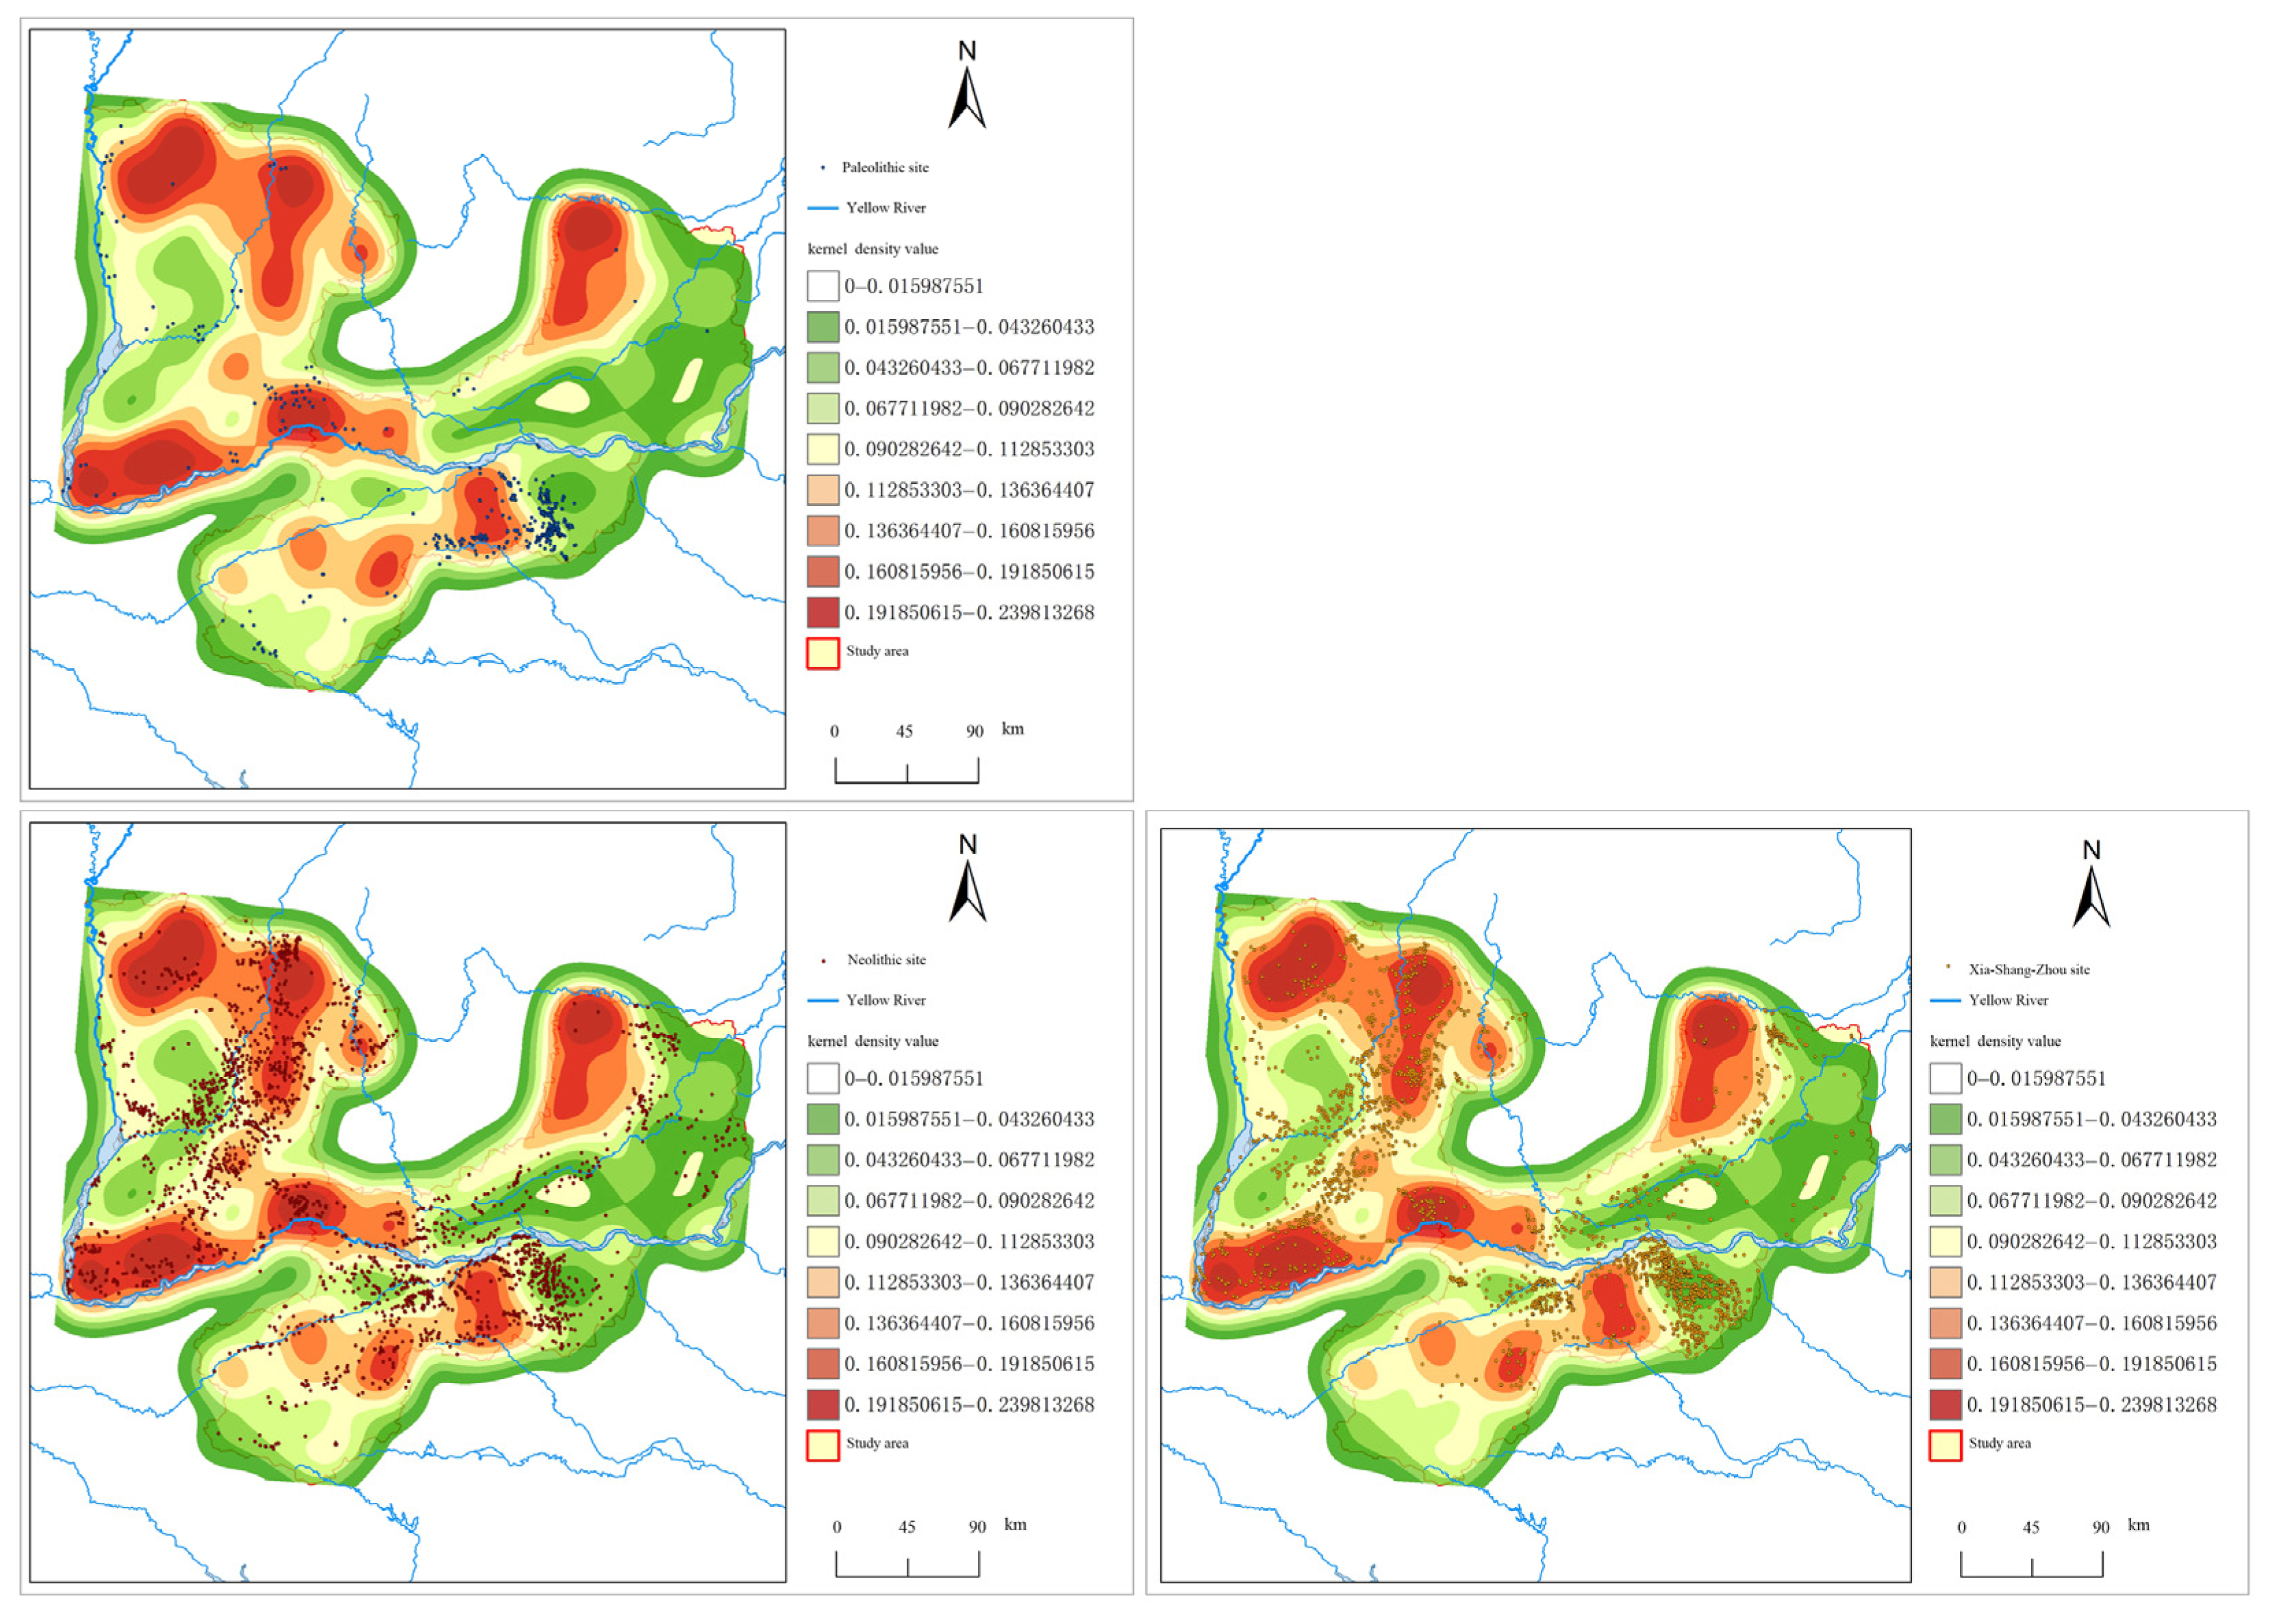
3.1.2. Analysis Results of Kernel Density
The results show that there are two high-density groups of Paleolithic sites which are located in the Wangwu Mountain area and the Songshan area, respectively. By the Neolithic Age, the distribution density of the sites increase as a whole, and change from single cluster distribution in the Paleolithic Age to the coexistence of clusters and high-density zones, especially along the Yiluo River, Fenhe River, and Weihe River, forming a typical high-density zone of the sites. The sites from the Xia, Shang, and Zhou Dynasties are further developed and integrated on the basis of the Neolithic Age, and the distribution characteristics of groups and bands become more obvious, and the number of sites groups further increases (
Figure 2).
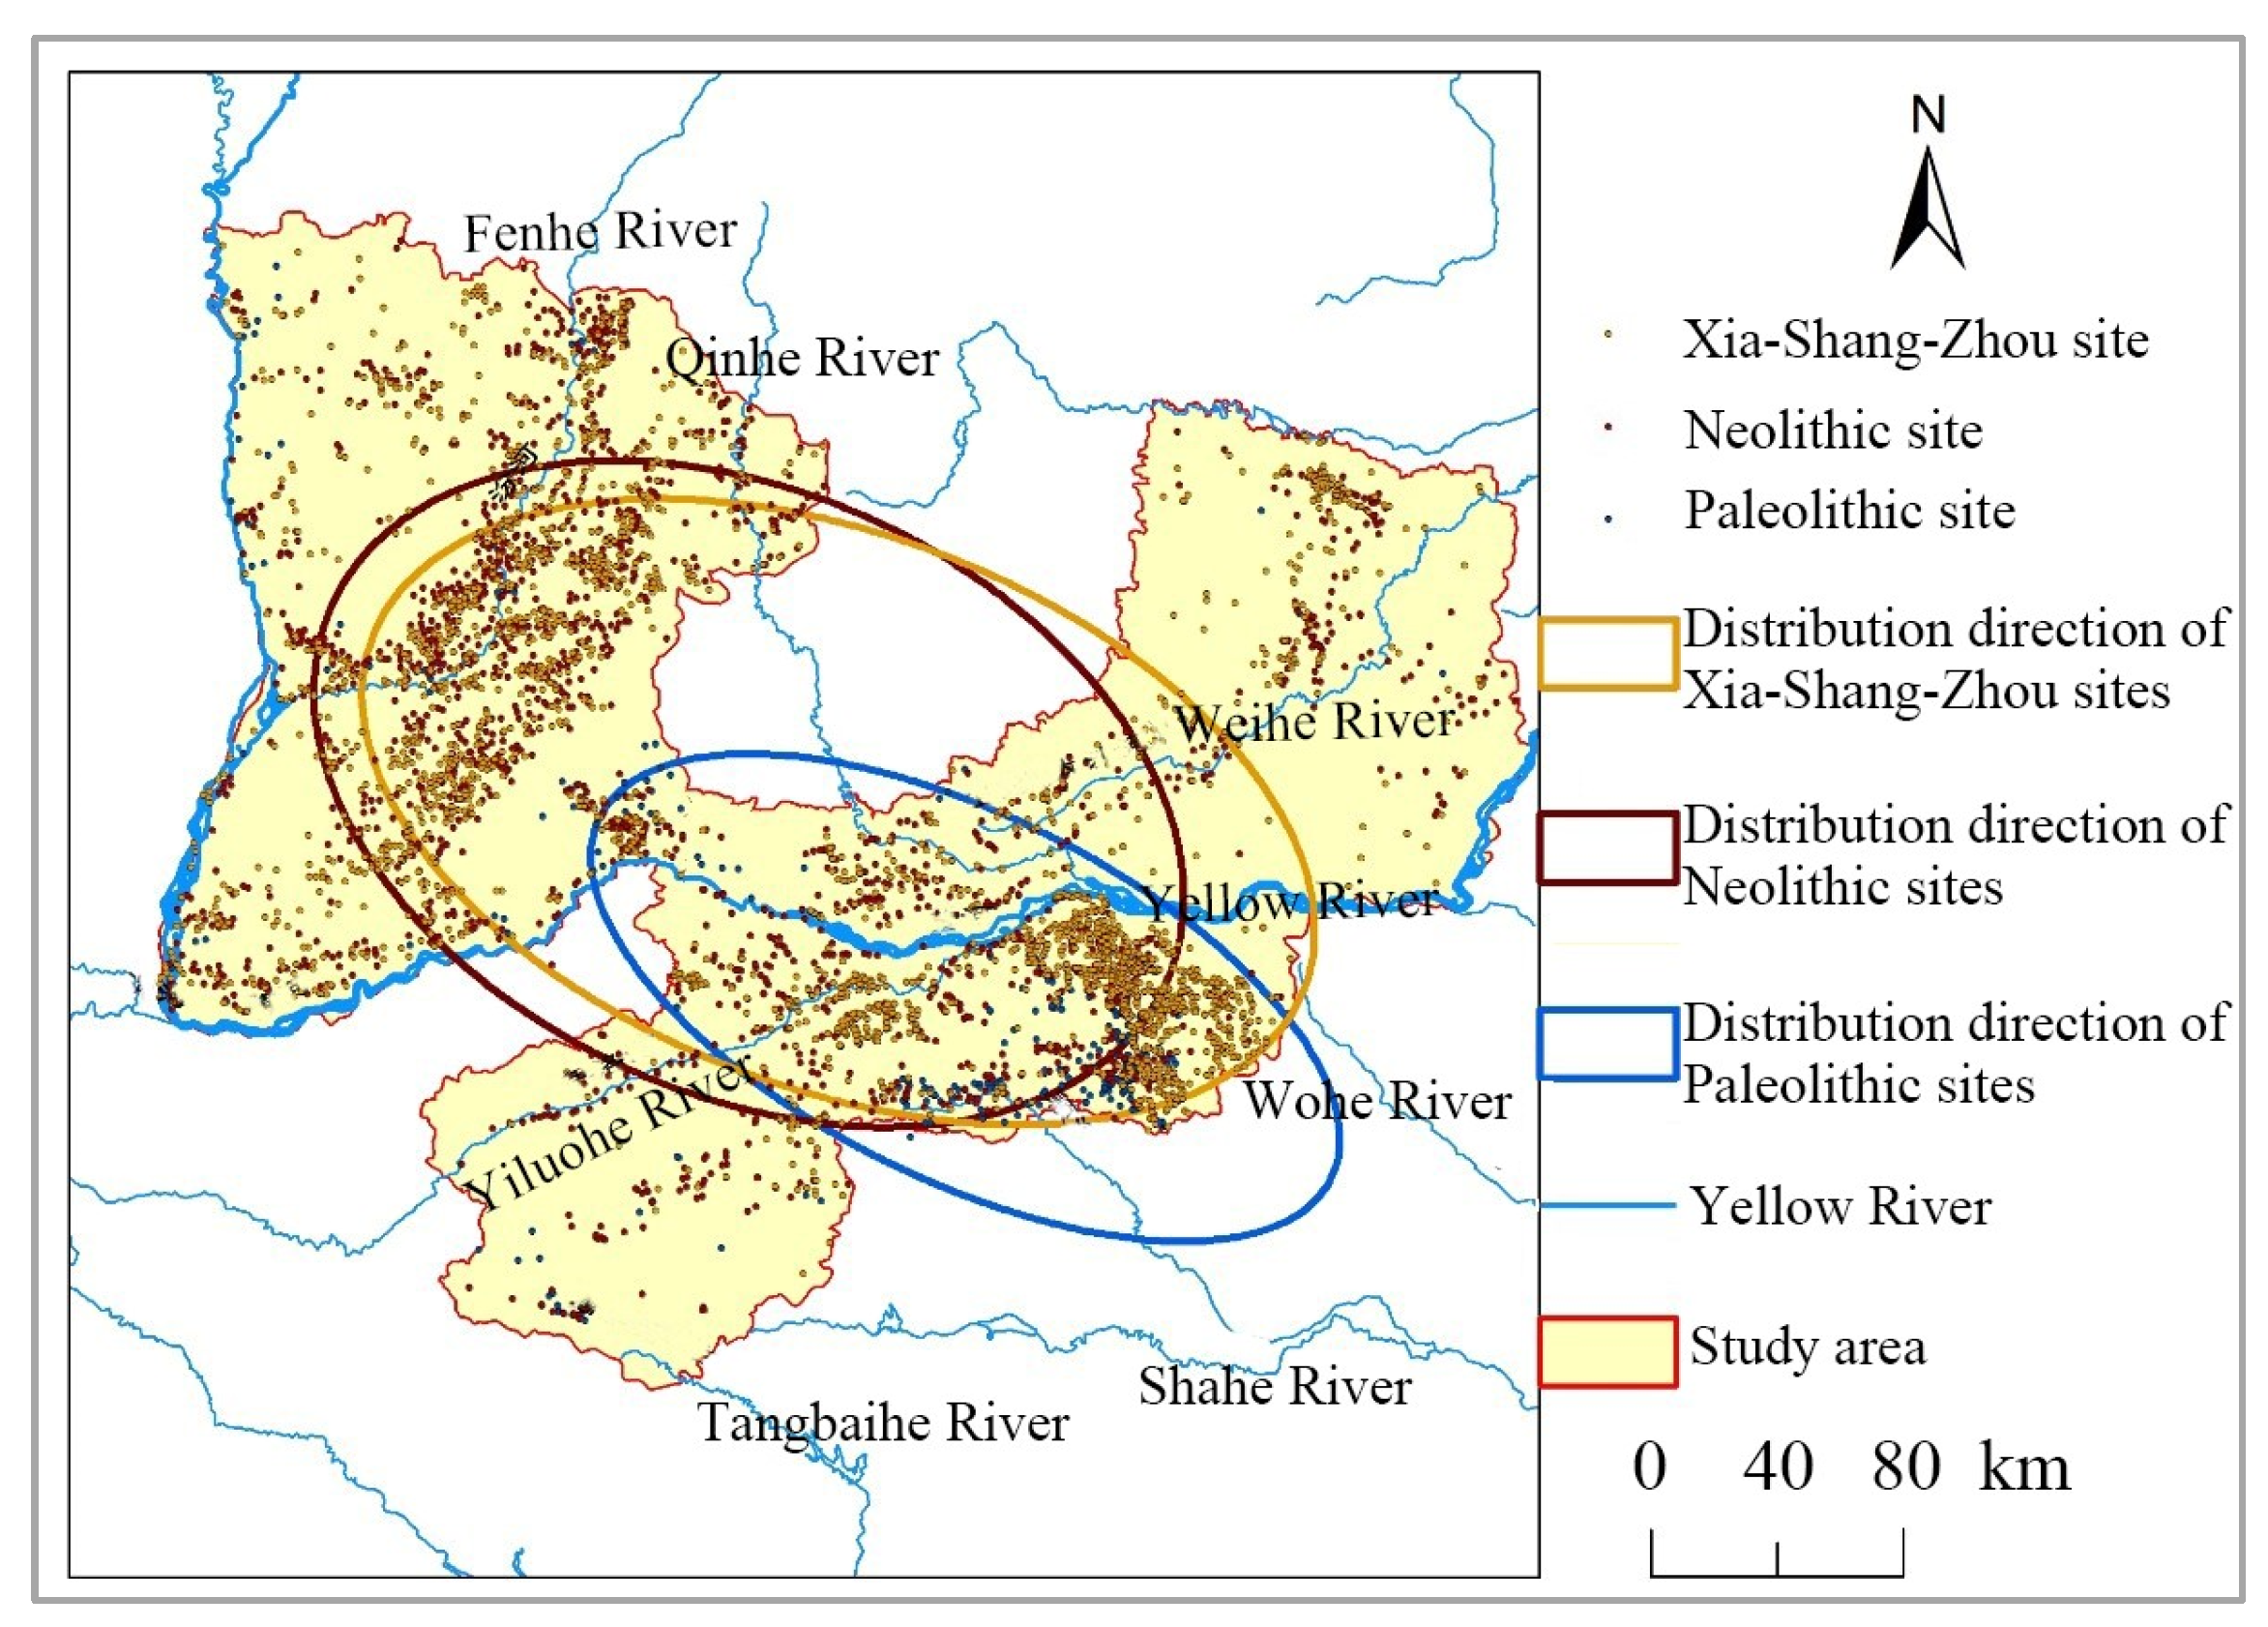
3.1.3. Standard Deviation Ellipse Analysis Results
The standard deviation ellipse is used to analyze the main directional characteristics of the distribution of early sites in the Sanhe region during the Paleolithic, Neolithic, and Xia, Shang, and Zhou Dynasties, respectively, and to compare the similarities and differences in the distribution of sites in each period in order to discover the evolution pattern of sites’ direction over time. The larger the ratio of the long and short axes of the ellipse, the more obvious the directionality of the ellipse, and the size of the area of the ellipse can reveal the range of site distribution; the larger the area of the ellipse, the wider the range of site distribution involved.
The results show that the Paleolithic, Neolithic, and Xia, Shang, and Zhou Dynasty sites in the Sanhe region all show a southeast–northwest distribution trend, and the Paleolithic sites have the smallest distribution range and more obvious directionality (
Figure 3). The number of sites in the Neolithic Age and Xia, Shang, and Zhou Dynasties are more than others, their distribution range is wider, and their directionality is inconspicuous (
Table 2).
3.2. Coupling Analysis of Man-Land Relationship
Through the analysis of the existing research in this field [
26], in order to make the research results more accurate and scientific, the relatively stable geographical features such as landform, topographic relief, river, slope, and aspect were selected. In this section, the research also follows this principle. At the same time, such factors as climate, which have changed greatly since ancient times, were discarded [
27].
3.2.1. Elevation Factor
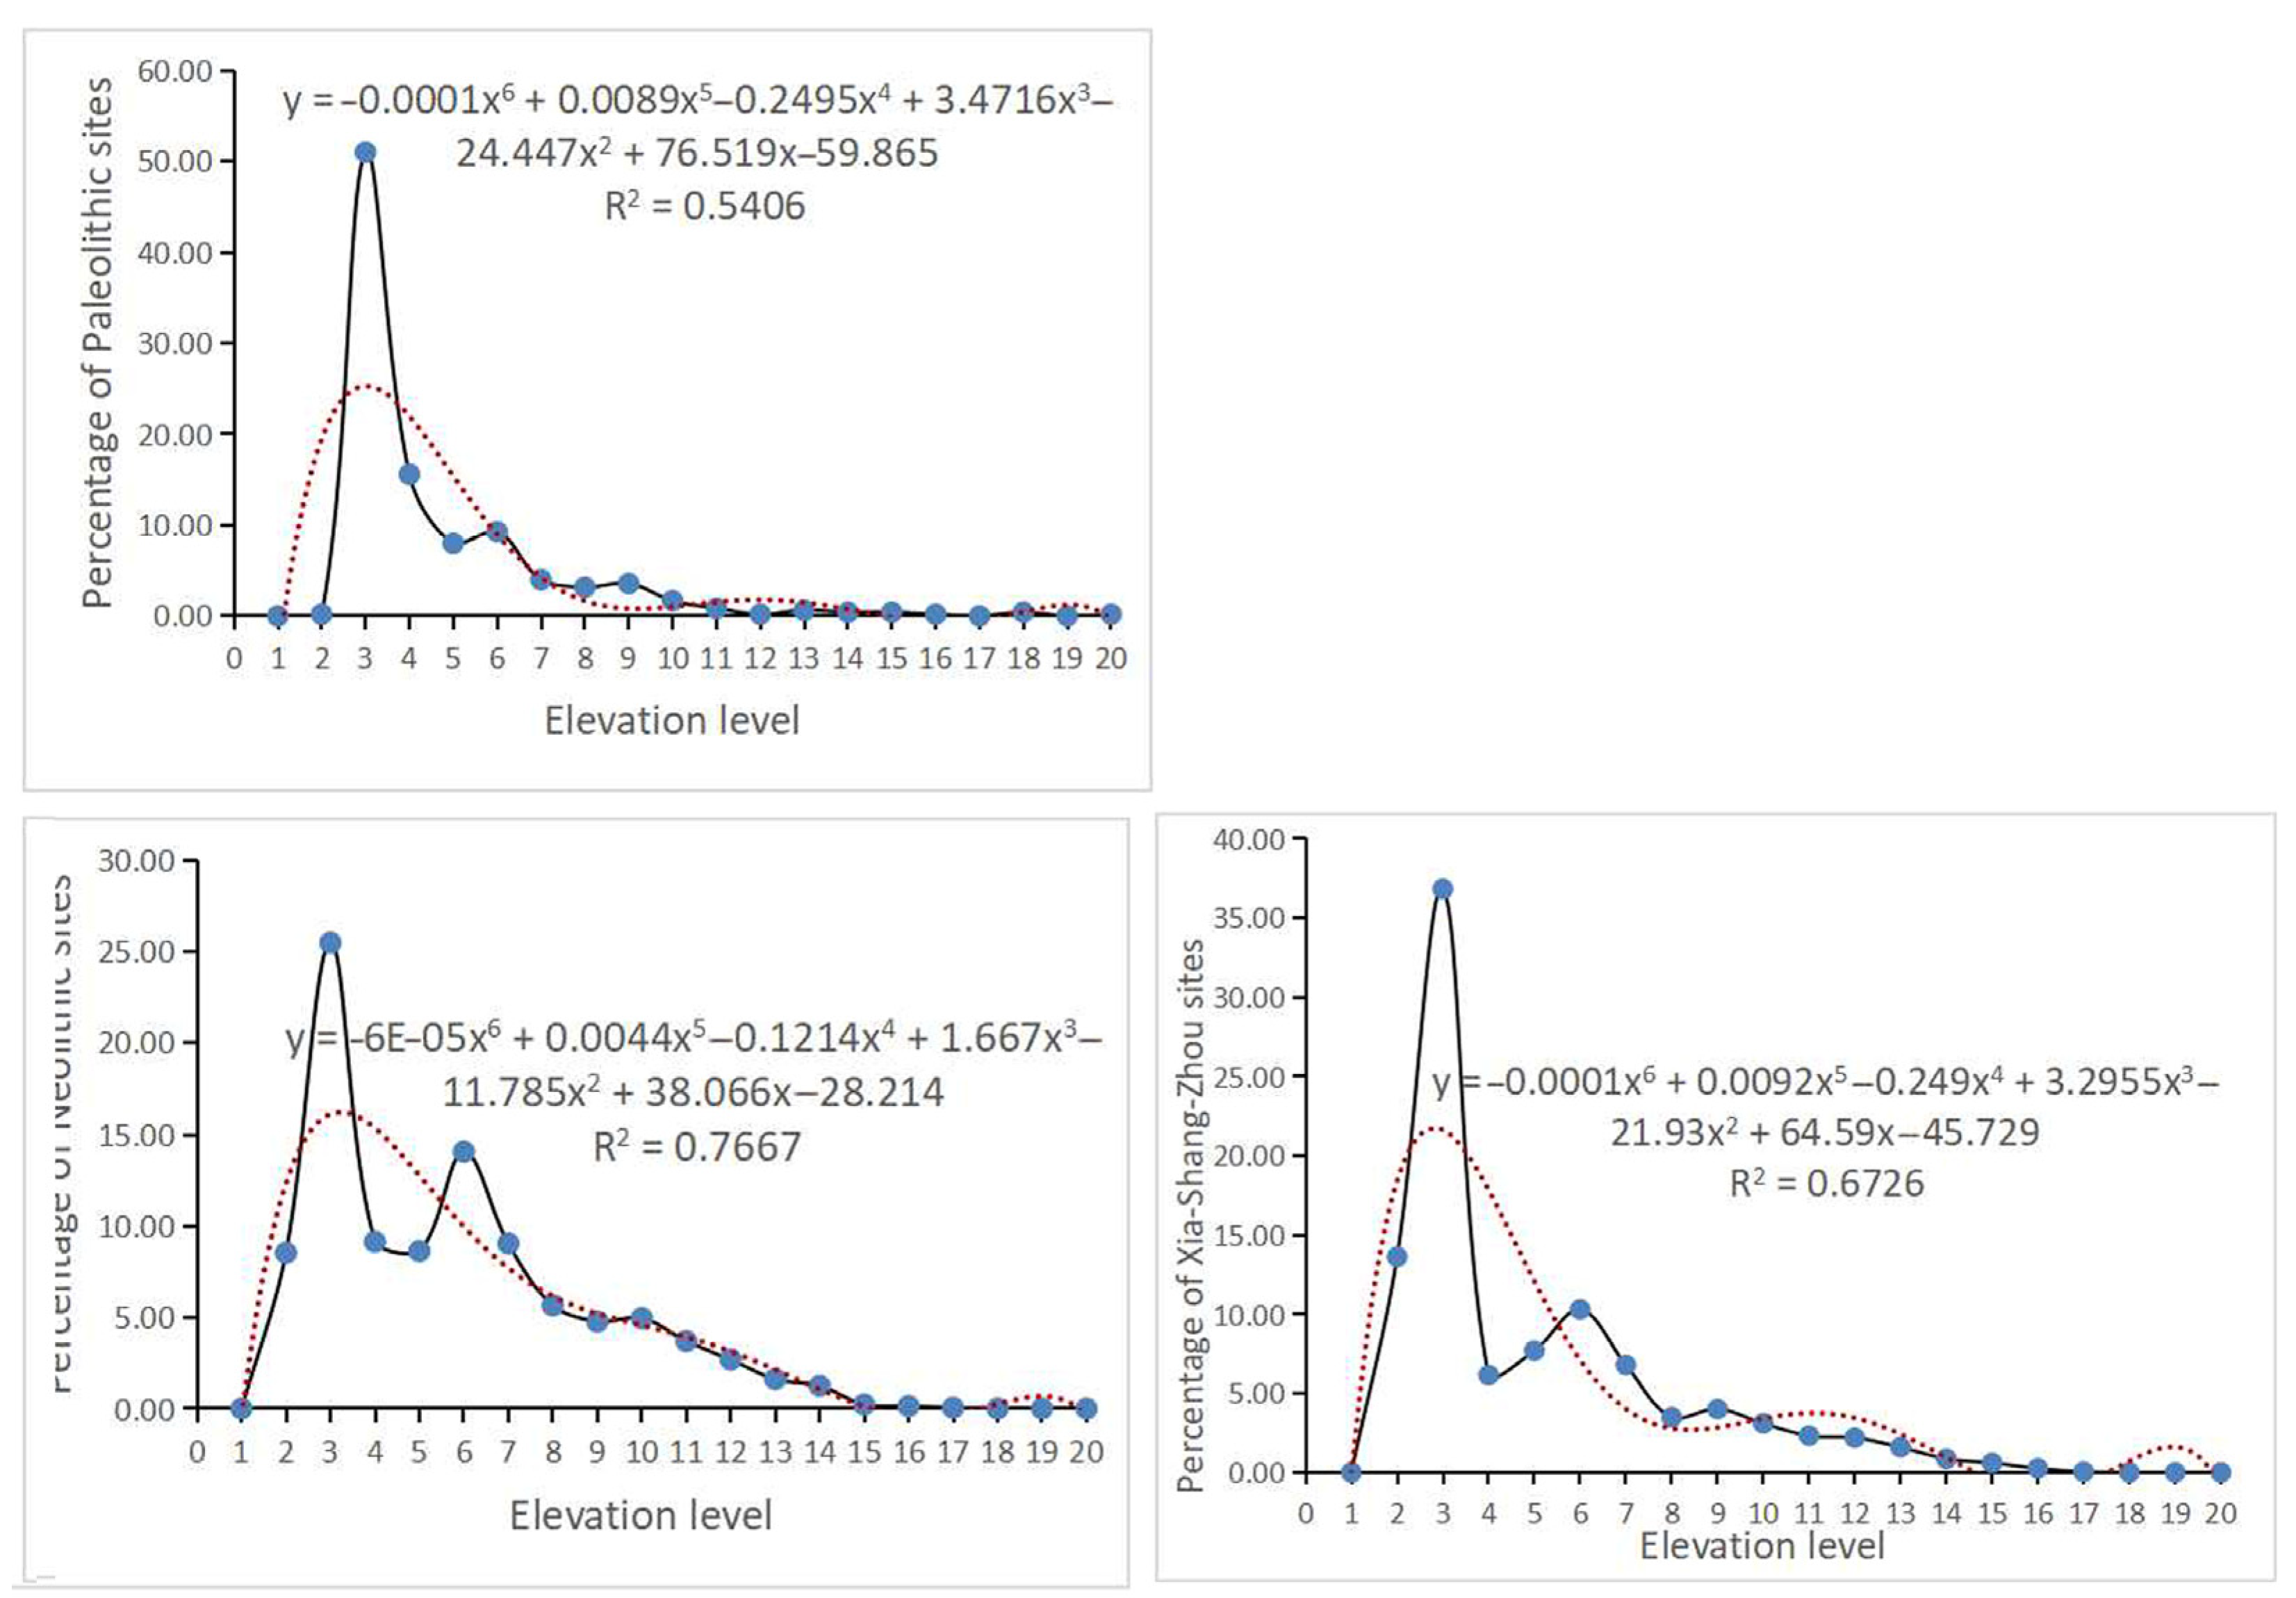
The results showed that the elevation had a certain influence on the site selection of early settlements. From the Paleolithic to the Xia, Shang, and Zhou Dynasties, with the elevation increasing, the number of sites gradually increased, and when it reached the most suitable height for survival, the number of sites began to decrease gradually, indicating that when the elevation exceeded the most suitable height in this area, the site selection of early settlements would be restricted by the higher elevation (
Figure 4). According to the relationship between the site and the elevation, a multiple regression model was established. The regression function was shown in the figure. It can be seen that the correlation coefficient is very high, indicating that the fitting effect is good (
Figure 5).
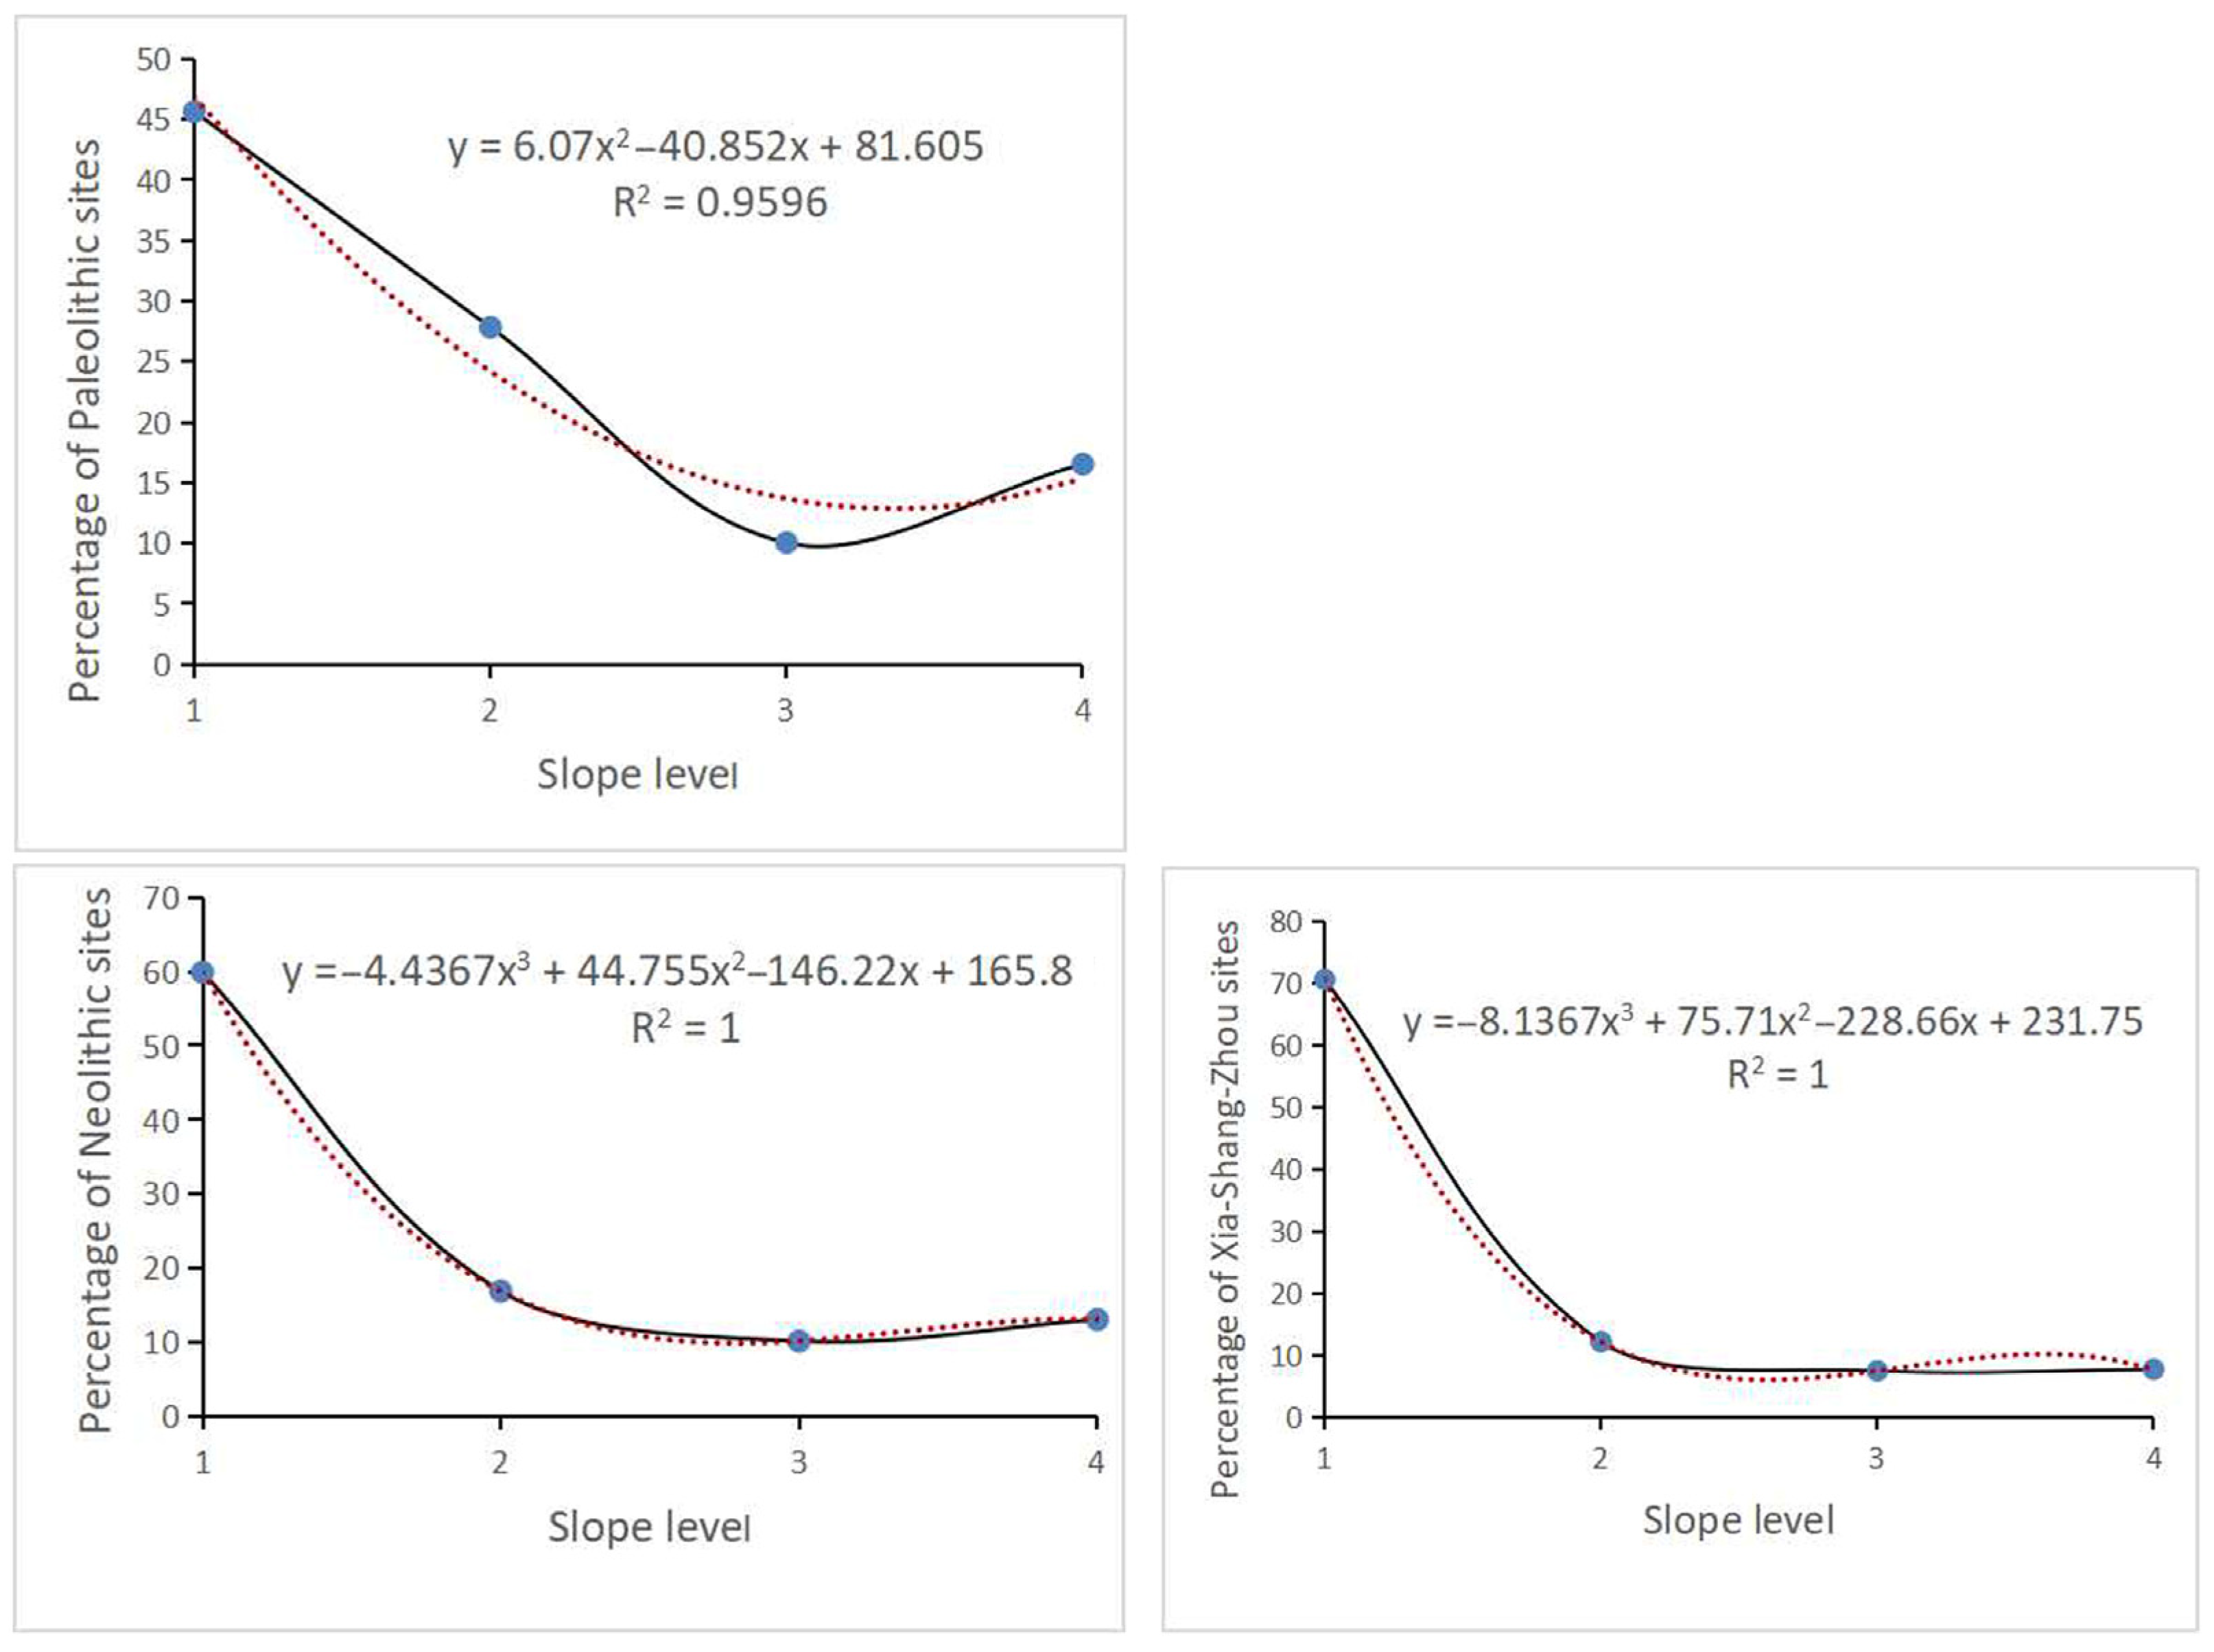
3.2.2. Slope Factor
The results showed that slope significantly affected the distribution of early cultural sites in the Sanhe region, and settlement in different periods had different requirements for terrain slope in the site selection of settlements. From the Paleolithic Age to the Xia, Shang, and Zhou Dynasties, the dependence of early human beings on gentle-slope terrain was increasing, so the proportion of sites in gentle-slope areas was gradually increasing (
Figure 6). According to the relationship between the site and the slope, a multiple regression model was established. The regression function was shown in the figure. It can be seen that the correlation coefficient is very high, indicating that the fitting effect is good (
Figure 7).
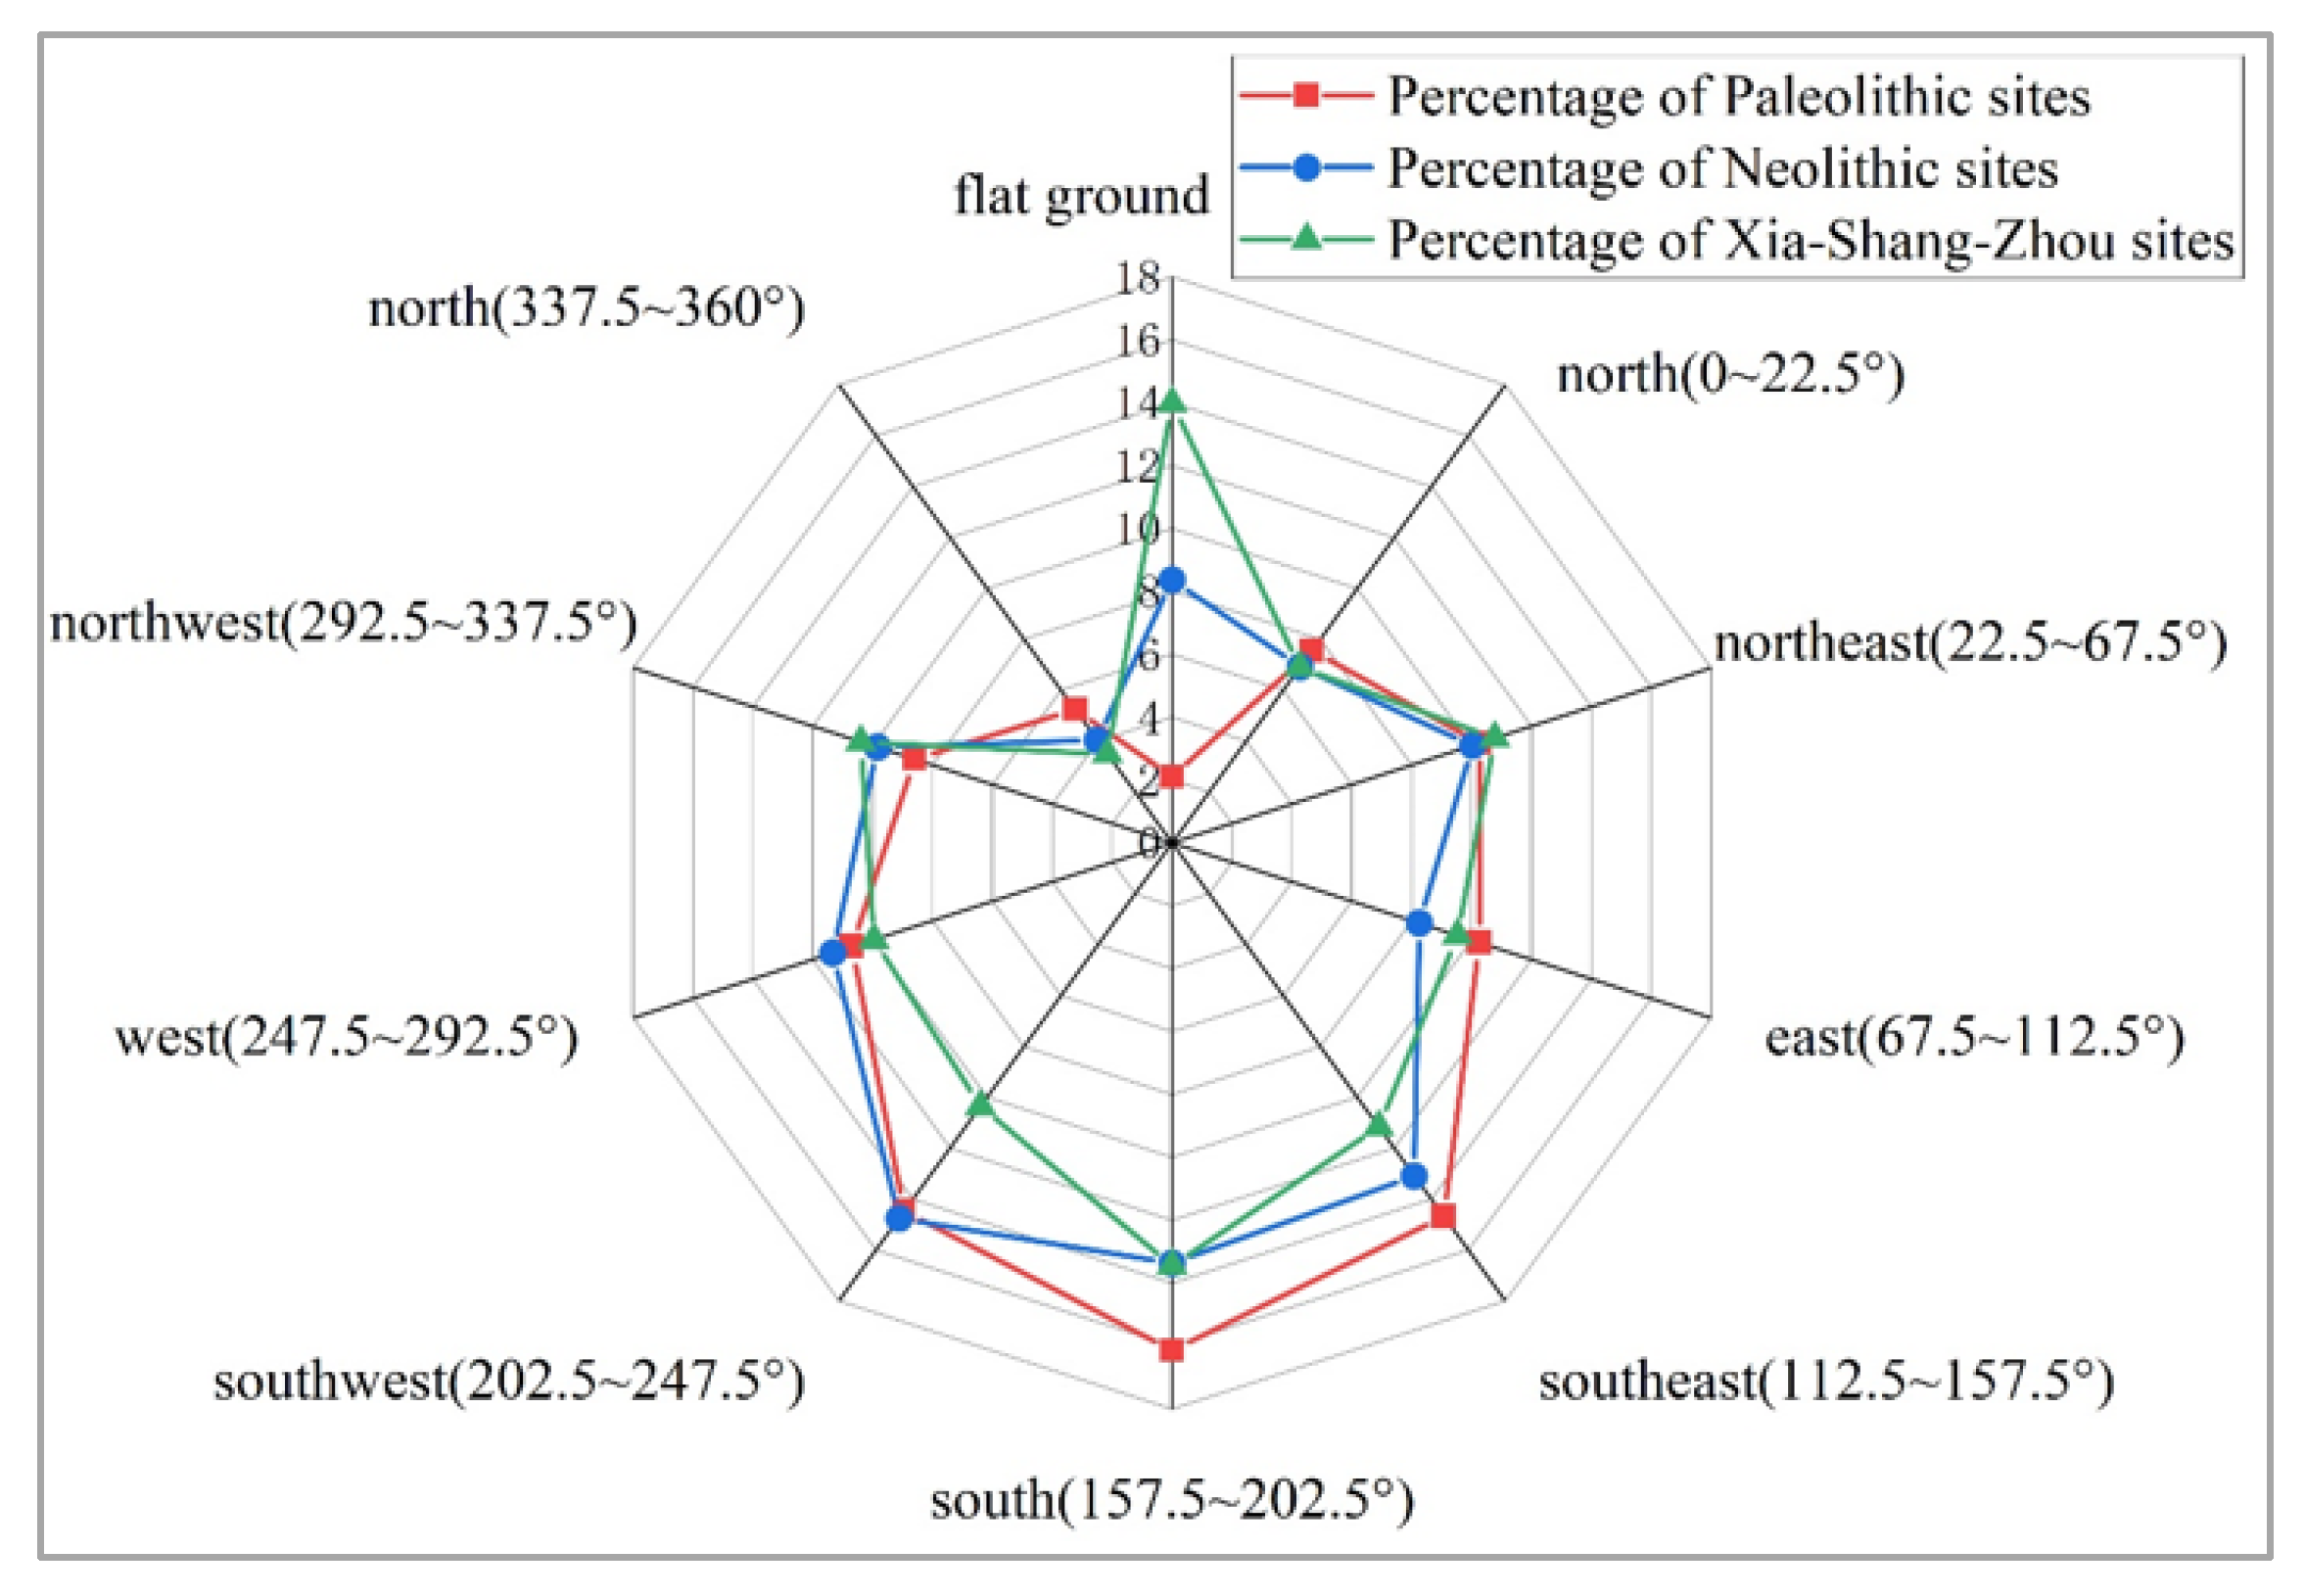
3.2.3. Aspect Factor
The results showed that (1) the vast majority of sites were distributed in flat areas or facing the sunshine, with most sites distributed in southeast, southwest, and south areas; (2) the proportion of Paleolithic sites distributed in the southeast, south, and southwest was the largest, that of Neolithic sites distributed in the, southwest was the largest, and that of Xia–Shang–Zhou sites distributed in flat areas was the largest; (3) there were also sites in some aspects that were not suitable for human habitation, and the reasons may be related to the river system and the restriction of land resources in the area where they were located [
28] (
Figure 8 and
Figure 9).
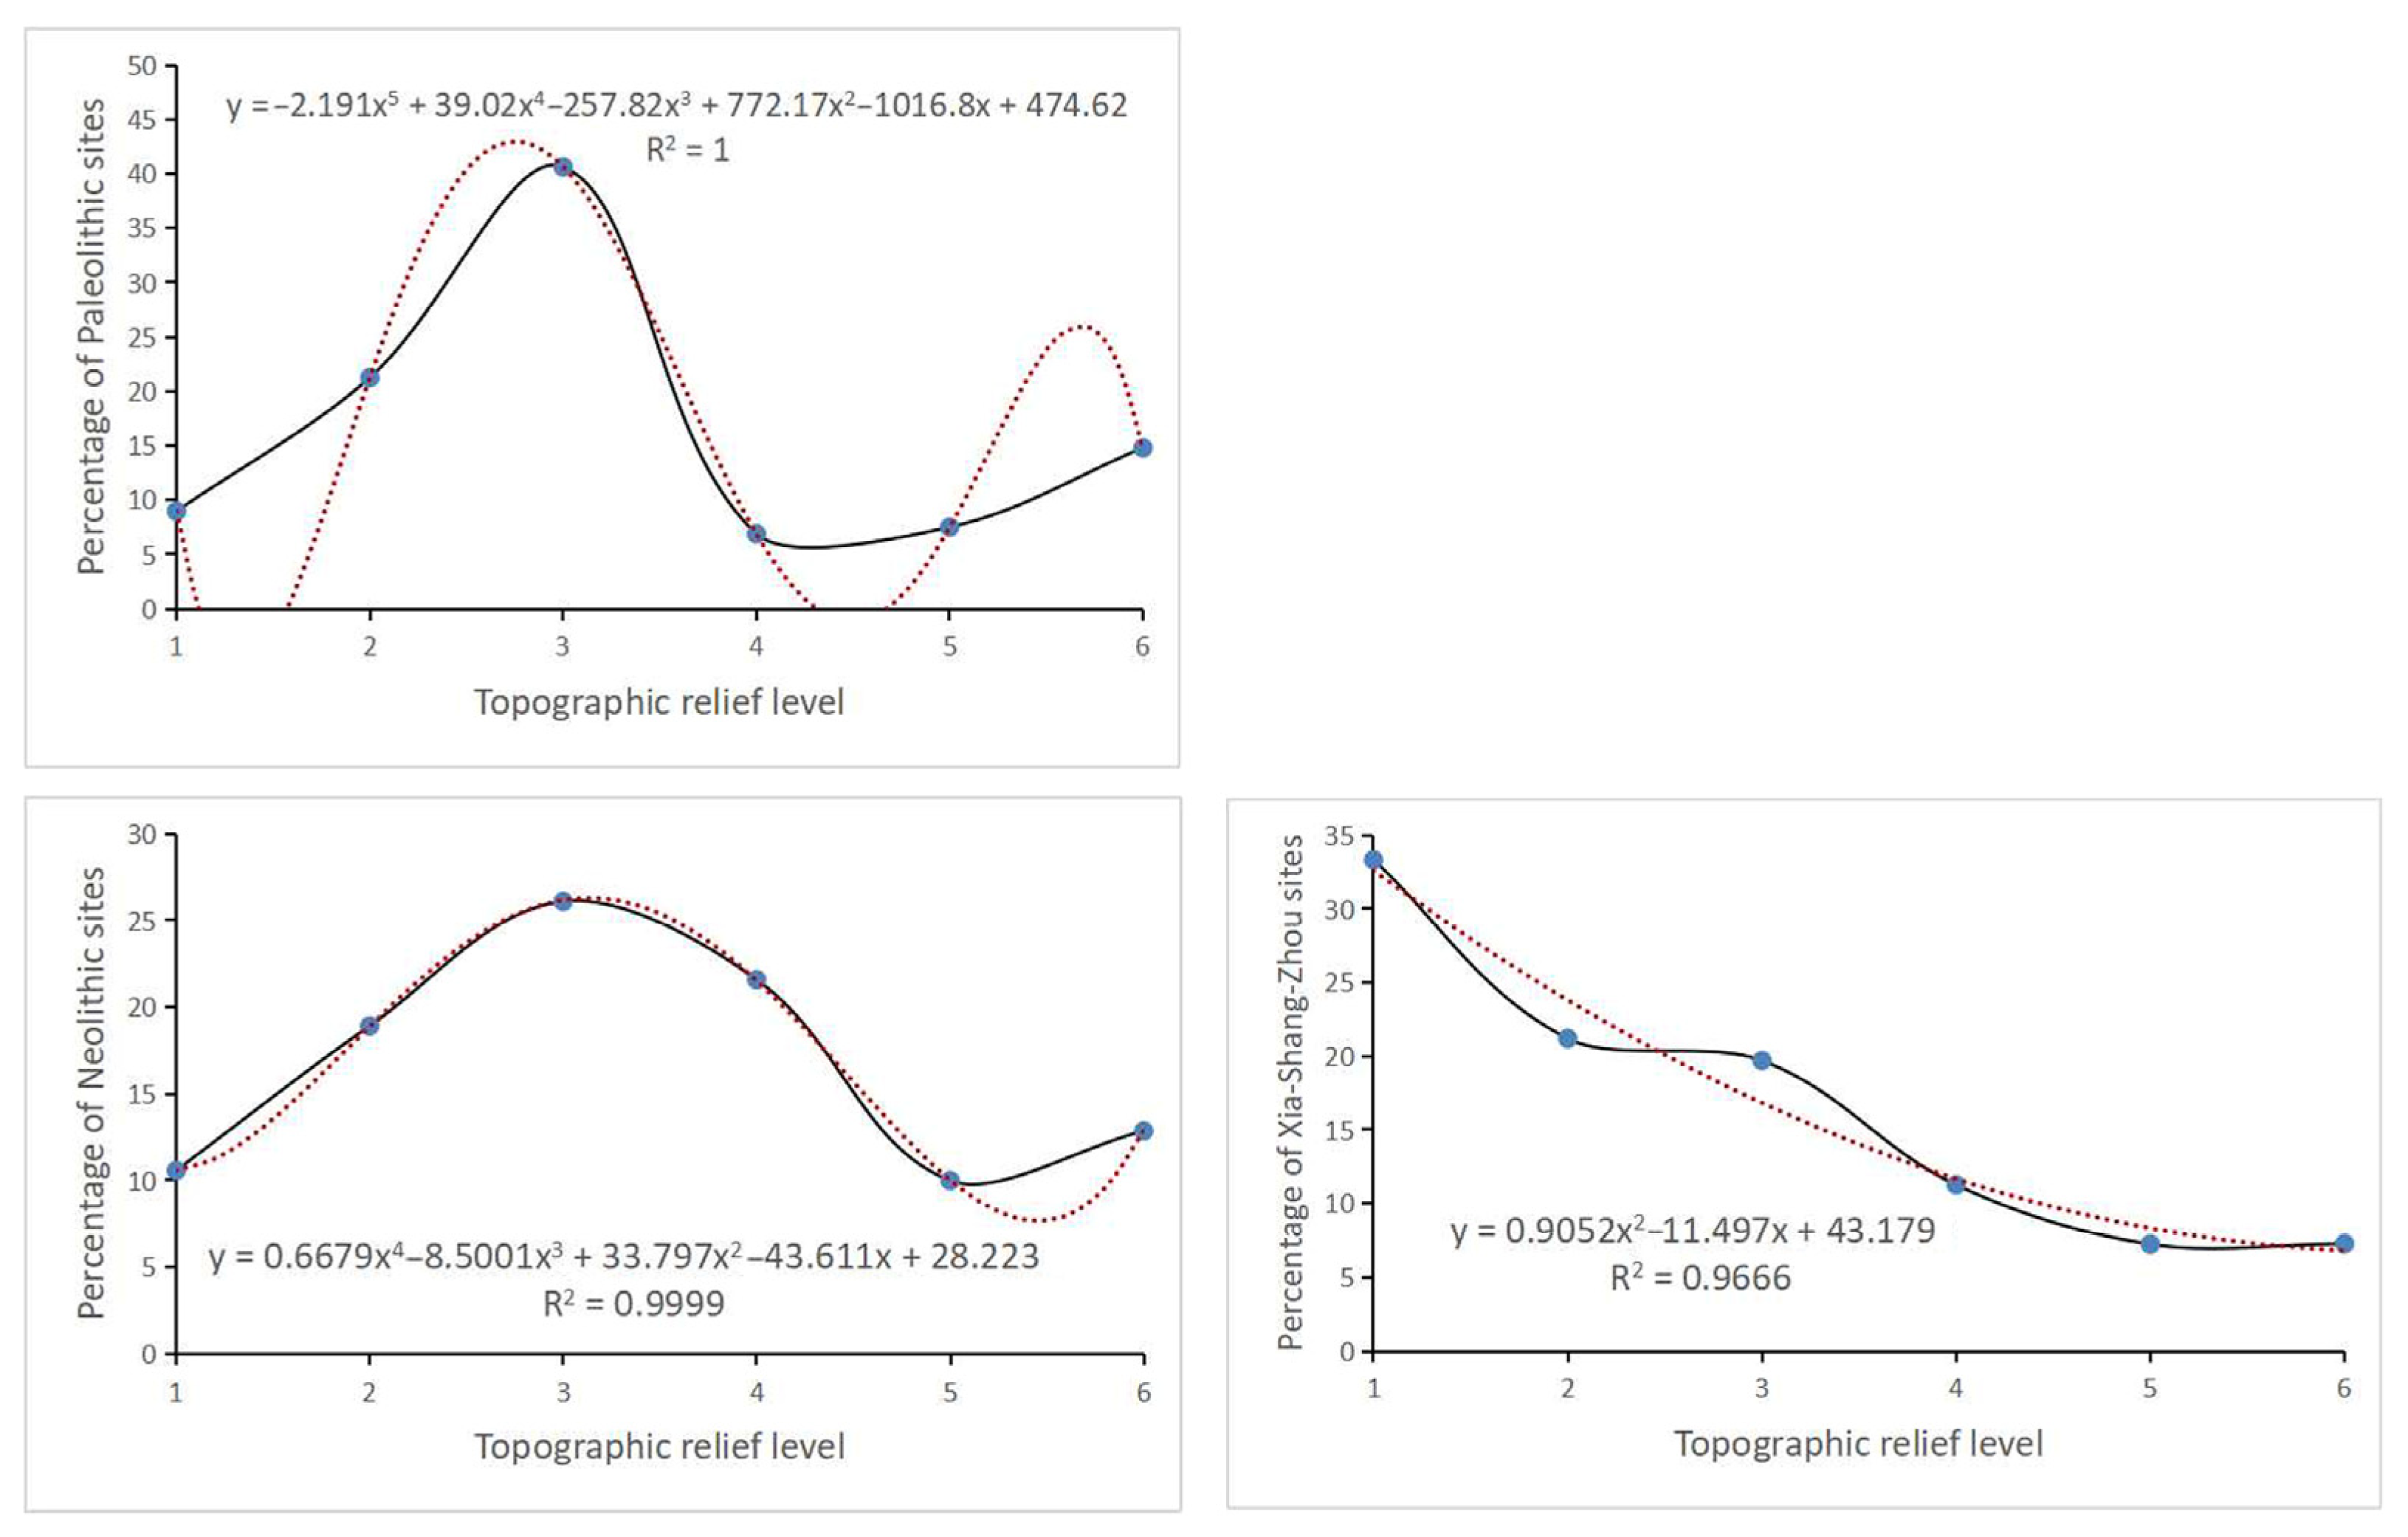
3.2.4. Topographic Relief Factor
The results showed that the topographic relief significantly affected the distribution of early cultural sites in the Sanhe region, and different periods had different requirements for topographic relief in the site selection of settlements. From the Paleolithic Age to the Xia, Shang, and Zhou Dynasties, the site selection of early human settlements gradually developed from the original area with high topographic relief to the area with low topographic relief. With the progress of productivity and the gradual development of early civilization, the dependence of early human beings on low topographic relief was increasing, and low topographic relief was more conducive to the development of primitive agricultural production and early civilization (
Figure 10). According to the relationship between the site and the topographic relief, a multiple regression model was established. The regression function was shown in the figure. It can be seen that the correlation coefficient is very high, indicating that the fitting effect is good. (
Figure 11).
3.2.5. Hydrological Factor
The results showed that with the increase of the distance from the river, the number of sites in each period showed a decreasing trend. The reason is that in early human society, water resources for production and living mostly depended on rivers, so “living by water” was the most typical feature of settlement for site selection in early human society. At the same time, the river system also became an important influencing factor of settlement site selection in early human society. According to the relationship between the site and the river buffer, a multiple regression model was established. The regression function was shown in the figure. It can be seen that the correlation coefficient is very high, indicating that the fitting effect is good (
Figure 12).
3.2.6. Geodiversity Factor
After superimposing the geodiversity kernel density map with cultural sites, it can be found that Paleolithic sites are mostly distributed in areas with high geodiversity kernel density, and Neolithic sites begin to spread to areas with low density, while Xia, Shang, and Zhou sites are further developed on the basis of Neolithic sites, and they have certain similarities (
Figure 13 and
Figure 14).
4. Discussion
The early sites in the Sanhe region were located in a variety of geographic environments, among which, in the prehistoric period, the ancestors generally settled in the sunny areas, and the areas where they were living also needed to get water conveniently and not be easily flooded. The factors in selecting sites for early settlement increased and became more complex. According to the evolution of the relationship between the distribution characteristics of early sites and the environment in the Sanhe region, it can be seen that from the Paleolithic Age to the Xia, Shang, and Zhou Dynasties, early human settlement site selection in the Sanhe region underwent a development process from being subjected to/restricted by nature to conforming to nature, and then to acceptance and coordination with nature.
The more than 5000 early sites used in the study cover almost all the early sites that have been discovered in the study area. Throughout the statistical analysis process, this research has tried to apply statistical methods to ensure the accuracy and scientificity of the analysis results; however, with the topography and water system changes, there may be some changes between the early environment and modern times. Using the current geographical environment data to represent the past, however, may bring errors to the research, so the relevant analysis should be further explored in subsequent study in conjunction with the historical literature.
In addition, to study the influence of geographical factors on cultural sites, the academic community has not yet formed a systematic index selection system, which is mostly combined with previous research experience. This practice may lead to certain errors in the research results. In this research, the selection of geographical factors is a summary made after consulting the existing literature, and in follow-up research, it is very important to form a set of systematic evaluation indexes for this kind of research. In terms of methods, it is not the best solution to study the influence of geographical factors on the distribution of sites by grading them. In future research, it is the most important thing to adopt more scientific methods or improve the existing methods.
5. Conclusions
From the Paleolithic Age to the Xia, Shang, and Zhou Dynasties, the concentration of the sites gradually increased from a more natural, scattered distribution to a more concentrated distribution. The distribution of the sites gradually developed from a single high-density group distribution to a number of high-density groups, and at the same time, high-density distribution belts and banded distribution characteristics appeared, which indicated that the links between the groups of the sites were closer, and that the spatial distribution direction was restricted by their surrounding environment.
The elevation, slope, aspect, topographic relief, river system, and other factors in this area have a significant impact on the distribution characteristics of the sites. The early human settlement environment is closely related to natural factors.
In the study, more than 5000 early cultural sites were collected and sorted out, covering almost all the early cultural sites found in the study area, which made the research conclusion closer to the truth statistically and further ensured the scientific nature of the research conclusion. This could inspire new ideas and open up new methods for the protection and utilization of cultural sites from the prehistoric to pre-Qin periods and make scientific reference for the rational planning and scientific decision-making of sites in the future. From prehistoric times to the pre-Qin period, the number of cultural sites is huge. Although this research has done its best to collect and perfect the relevant information, there will inevitably be omissions. Therefore, in follow-up research, the site database should be updated and supplemented in time to improve the research results.
Finally, the influence of cultural diversity on the distribution of sites should be an important research direction in the future, because the development of early civilization is inseparable from the influence of cultural, political, economic, and other factors. Therefore, in addition to physical geography, for example, cultural diversity should be considered in follow-up research.
Author Contributions
Conceptualization, M.G. and H.L.; methodology, X.Y.; software, M.G.; formal analysis, X.Y. and Z.L.; writing—original draft preparation, M.G. and Z.L.; writing—review and editing, M.G. and H.L.; supervision, H.L. and Z.L.; funding acquisition, H.L. All authors have read and agreed to the published version of the manuscript.
Funding
This research was funded by the Major strategic consulting projects of the Chinese Academy of Engineering (2021-HYZD-3-6).
Institutional Review Board Statement
Not applicable.
Informed Consent Statement
Not applicable.
Data Availability Statement
The data presented in this study are available on request from the corresponding author or the first author.
Acknowledgments
All authors sincerely thank all those who provided data, suggestions, and criticisms for this study.
Conflicts of Interest
The authors declare no conflict of interest.
References
- Wang, F.; Yang, Z.; Luan, F.; Xiong, H.; Shi, H.; Wang, Z.; Zhao, X.; Qin, W.; Wu, W.; Li, N. Spatiotemporal characteristics of cultural sites and their driving forces in the Ili River Valley during historical periods. J. Geogr. Sci. 2015, 25, 1089–1108. [Google Scholar] [CrossRef]
- Gao, M.; Lyu, H. Study on the Regional Differentiation Characteristics and Influencing Factors of the Yellow River Cultural Heritage—Taking the National Key Cultural Relics Protection Unit of the Yellow River Basin as an Example. Study Nat. Cult. Herit. 2021, 6, 61–74. [Google Scholar]
- Zhou, T.; Cui, J. Spatial and temporal distribution and driving force analysis of settlements in Guanzhong area from Yangshao to Shang and Zhou dynasties based on GIS. J. Earth Environ. 2022, 13, 163–175. [Google Scholar]
- Li, T. Study on the Protection, Development and Utilization of Ancient Sites in Ruicheng County, Shanxi Province; Tianjin Normal University: Tianjin, China, 2020. [Google Scholar]
- Liu, S.; Zhou, C.; Mao, L.; Jia, X.; Mo, D. The spatial and temporal distribution of archaeological settlement sites in Shandong Province from the Paleolithic to Shang and Zhou periods and its relationship with hydrology and geomorphology. Quat. Sci. 2021, 41, 1394–1407. [Google Scholar]
- Du, X.; Hu, X.; Jin, X.; Gong, W.; Liu, M.; Hu, H.; Wang, Y. Relationship between spatio-temporal distribution and its natural environment of Neolithic settlement sites in Dongting Lake Area. Econ. Geogr. 2021, 41, 167–176. [Google Scholar]
- Jiang, C.; Luo, L.; Shahina, T.; Muhammad, A.; Yao, Y.; Wang, X. Temporal-spatial distribution characteristics and protection countermeasures of cultural heritage sites in Northern Pakistan based GIS spatial analysis method. J. Univ. Chin. Acad. Sci. 2021, 38, 467–477. [Google Scholar]
- Crisp, J.R.; Ellison, J.C.; Fischer, A. Current trends and future directions in quantitative geodiversity assessment. Prog. Phys. Geogr. Earth Environ. 2021, 45, 514–540. [Google Scholar] [CrossRef]
- Năpăruş-Aljančič, M.; Pătru-Stupariu, I.; Stupariu, M.S. Multiscale wavelet-based analysis to detect hidden geo-diversity. Prog. Phys. Geogr. 2017, 41, 601–619. [Google Scholar] [CrossRef]
- Forte, J.P.; Brilha, J.; Pereira, D.I.; Nolasco, M. Kernel density applied to the quantitative assessment of geodiversity. Geoheritage 2018, 10, 205–217. [Google Scholar] [CrossRef]
- He, F.; Wu, N.; Dong, X.; Tang, T.; Domisch, S.; Cai, Q.; Jähnig, S.C. Elevation, aspect, and local environment jointly determine diatom and macroinvertebrate diversity in the Cangshan Mountain, Southwest China. Ecol. Indic. 2019, 108, 105618. [Google Scholar] [CrossRef]
- Cheng, J. An Archaeological Research on the Settlement System in Sili Area during the Han Period; Jilin University: Changchun, China, 2015. [Google Scholar]
- Xue, X. A research on the historical geography of Qin and Han Hedong County. J. Shaanxi Xueqian Norm. Univ. 2016, 32, 101–105. [Google Scholar]
- Li, X. Pre Qin Volume of the General History of Administrative Divisions in China, 2nd ed.; Fudan University Press: Shanghai, China, 2017; pp. 429–430. [Google Scholar]
- Zhu, J. A Study on Han Tombs in Sanhe Region; Zhengzhou University: Zhengzhou, China, 2015. [Google Scholar]
- Qiu, T.; Chen, B.; Li, B. Study on spatial characteristics and optimization of rural tourism spots in Great Wuyi Tourism Circle. J. Fujian Norm. Univ. (Philos. Soc. Sci. Ed.) 2020, 65, 91–99. [Google Scholar]
- Xiao, Z.; Pilates, M.; An, C. Spatial distribution and influencing factors of Xinjiang farmhouse resorts: An analysis based on POI data. J. Fujian Norm. Univ. (Philos. Soc. Sci. Ed.) 2022, 44, 144–154. [Google Scholar]
- Mu, Z.; You, W.; Zhang, X. Spatial patterns and transportation accessibility analysis of world heritages in China. Mt. Res. 2020, 38, 436–448. [Google Scholar]
- Wang, W.; Gu, Y.; Zhang, C.; Kang, Q.; Yin, W.; Xin, J.; Liao, X. Study on the distribution of urban-rural ecotone in Xianfeng County based on POI and kernel density analysis. Res. Environ. Eng. 2022, 36, 117–123. [Google Scholar]
- Zhang, P.; Du, F.; Wang, X. Spatial structure evolution and analysis of Chinese passenger aviation network in the last decade. World Reg. Stud. 2021, 30, 1253–1264. [Google Scholar]
- Bi, S.; Guo, W.; Lyu, G. Aspect and slope analysis of prehistoric settlement sites in Zhengzhou-Luoyang region. Sci. Surv. Mapp. 2010, 35, 139–141. [Google Scholar]
- Xia, H.; Xu, W.; Ren, Y. Study on spatial distribution characteristics of historical and cultural sites in Yulin City Based on GIS. J. Yangtze Univ. (Nat. Sci. Ed.) 2010, 7, 293–295. [Google Scholar]
- Liu, Y.; Deng, W.; Song, X.; Zhou, J. Population Density Correction Method in Mountain Areas Based on Relief Degree of Land Surface:A Case Study in the Upper Minjiang River Basin. Sci. Geogr. Sin. 2015, 35, 464–470. [Google Scholar]
- Ma, X.; Cui, J. Analysis of Relief Amplitude Based on DEM in Henan Province. Henan Sci. 2021, 39, 1467–1471. [Google Scholar]
- Guan, Z.; Wang, T.; Zhi, X. Temporal-Spatial pattern Differentiation of Traditional Villages in Central Plains Economic Region. Econ. Geogr. 2017, 37, 225–232. [Google Scholar]
- Gao, M.; Lyu, H. Study on the Spatial and Temporal Distribution of Ancient Cultural Sites in Hedong Area of the Yellow River’s Midstream. Areal Res. Dev. 2022, 41, 175–180. [Google Scholar]
- Zhang, J.; Zhu, W.; Zhu, L.; Cui, Y.; He, S.; Ren, H. Topographical relief characteristics and its impact on population and economy: A case study of the mountainous area in western Henan, China. J. Geogr. Sci. 2019, 29, 598–612. [Google Scholar] [CrossRef] [Green Version]
- Ruan, H.; Wang, N.; Niu, Z. Spatial pattern of ancient city sites and its driving forces in Mu Us Sandy Land during Han Dynasty. Acta Geogr. Sin. 2016, 71, 873–882. [Google Scholar]
| Publisher’s Note: MDPI stays neutral with regard to jurisdictional claims in published maps and institutional affiliations. |
© 2022 by the authors. Licensee MDPI, Basel, Switzerland. This article is an open access article distributed under the terms and conditions of the Creative Commons Attribution (CC BY) license (https://creativecommons.org/licenses/by/4.0/).


