
Multiscale Spatiotemporal Characteristics of Soil Erosion and Its Influencing Factors in the Yellow River Basin


Collage of Geography and Environment, Shandong Normal University, Jinan 250358, China
*
Author to whom correspondence should be addressed.
Water 2022, 14(17), 2658; https://doi.org/10.3390/w14172658
Submission received: 30 July 2022
/
Revised: 18 August 2022
/
Accepted: 25 August 2022
/
Published: 28 August 2022
(This article belongs to the Special Issue Yellow River Basin Management under Pressure: Present State, Restoration and Protection)
Abstract
:Soil erosion is an important ecological and environmental problem in the Yellow River Basin (YRB), which restricts the sustainable development of the YRB. Based on the Revised Universal Soil Loss Equation (RUSLE) and Optimal Parameters-based Geographical Detector (OPGD), this study discusses the multiscale spatiotemporal characteristics of soil erosion and its influencing factors in the YRB. The results show that: (1) The average values of soil-erosion modulus of the YRB in 2000, 2005, 2010, 2015, and 2020 was 1877.69, 1641.59, 1485.25, 844.84, and 832.07 t·km−2·a−1, respectively, and the areas with severe soil erosion are mainly concentrated in the three provinces of Gansu, Shanxi and Shaanxi, showing a belt-like trend in the northeast-southwest as a whole. (2) From 2000 to 2020, the q value of soil erosion influencing factors in the YRB showed a downward trend. From the YRB scale to the county scale, the q value of the influencing factors showed an increasing trend. Among them, fractional vegetation cover (FVC), landform type, and LU/LC have strong explanatory power for soil erosion in the YRB. FVC explains about 15% of soil erosion, and the interaction between FVC and landform explains up to 35% of soil erosion. (3) The ability of human activities (LU/LC, FVC) to influence soil erosion is increasing, and this feature is more pronounced at small scales. The conclusion of this study can be summarized as managers should pay attention to the role of human activities in the YRB for soil erosion, especially at small scales, in order to formulate lower-cost and targeted soil and water conservation measures.
1. Introduction
Soil erosion is one of the most serious ecological and environmental problems in the world [1,2,3]. It is not only a primary threat to food security, but also releases organic carbon sequestered in soil, which has a significant impact on the global carbon cycle and ultimately threatens human existence [4,5,6,7,8]. To solve this problem, it is crucial to explore the spatiotemporal characteristics of soil erosion and its influencing factors [9,10]. More and more attention has been paid to the multiscale effect analysis of soil erosion [9,10,11]. One of the research directions is to consider the uncertainty caused by the changes of administrative boundaries on soil erosion factors [5,7,9]. The research results can be directly applied to soil and water conservation management and planning [9,12], which beneficially impact water economics [13].
The model of the (R)USLE series is by far the most widely applied soil erosion model globally [4], as seen in [14], despite some shortcomings of these methods [15]. In China, the RUSLE model has been widely used in the Qinghai-Tibet Plateau [16,17], Loess Plateau [18,19,20,21], karst landforms [22,23], and other regions [9,12,24,25], with excellent results. At present, in addition to rainfall simulation experiments [26] and runoff monitoring [27], the commonly used methods to analyze soil erosion factors include Geographically Weighted Regression (GWR) [28], Structural Equation Modeling (SEM) [29], and Geodetector [30]. Among them, Geodetector has been widely used in the study of soil erosion influencing factors in recent years because it can quantify the substantial contributions of different factors and their interactions of soil erosion [9,10,12,23,25]. However, in the process of discretizing spatial data, traditional Geodetectors usually rely on professional experience and previous research, ignoring the possible impact of data discretization methods and break number of spatial strata on detection results [31,32]. Therefore, Wang Jinfeng’s team developed the Optimal Parameters-based Geographical Detector (OPGD) [32] to optimize the data discretization method and break number of spatial strata and improve the reliability of geographic detection results.
As one of the most severely eroded areas in the world, the complex geomorphological features, easily eroded soil characteristics, and improper land use in the YRB made the soil vulnerable to erosion [10,33]. In 2020, the hydraulic erosion area of the YRB will be 191,400 km2 [34]. The YRB is an important grain-producing area in China. Soil erosion destroys land resources in the watershed, and sediment takes away a large amount of soil nutrients such as N, P, K, etc., causing soil fertility degradation and restricting the growth of food production [35]. In addition, the congestion of downstream tributaries and rivers has promoted the occurrence of urban waterlogging to a certain extent, and directly affected people’s life safety [36]. Therefore, it is of great significance to carry out research on water erosion in the Yellow River Basin for food security, ecological protection, and social development. In order to curb the continuous deterioration of the ecology and environment, the “Grain to Green Program” (GGP) in Gansu, Shaanxi, and other provinces has been successively carried out since 1999. Deng et al. [37] evaluated the impact of the conversion of the GGP on soil erosion on the Loess Plateau from 2000 to 2018 and found that lost sediment has reduced by 348.7 Tg. Over the years, scholars have recognized the impact of human activities on soil erosion, but the spatiotemporal characteristics of the impact of human activities on soil erosion have not been thoroughly explored. Therefore, this study conducted a multiscale spatiotemporal characteristics analysis of the influencing factors of soil erosion not only from the basin scale, but also from the provincial, city, and county scales.
The main purpose of this study is to conduct a multiscale spatiotemporal analysis of soil erosion and its influencing factors in the YRB. The objectives of the research are as follows: (1) estimating the soil erosion status of the YRB from 2000 to 2020 and analyzing its spatiotemporal characteristics; (2) exploring the spatiotemporal characteristics of influencing factors of soil erosion in the YRB; (3) analyzing the spatiotemporal characteristics of human activities (LU/LC, FVC) in their impact on soil erosion.
2. Materials and Methods
2.1. Study Area
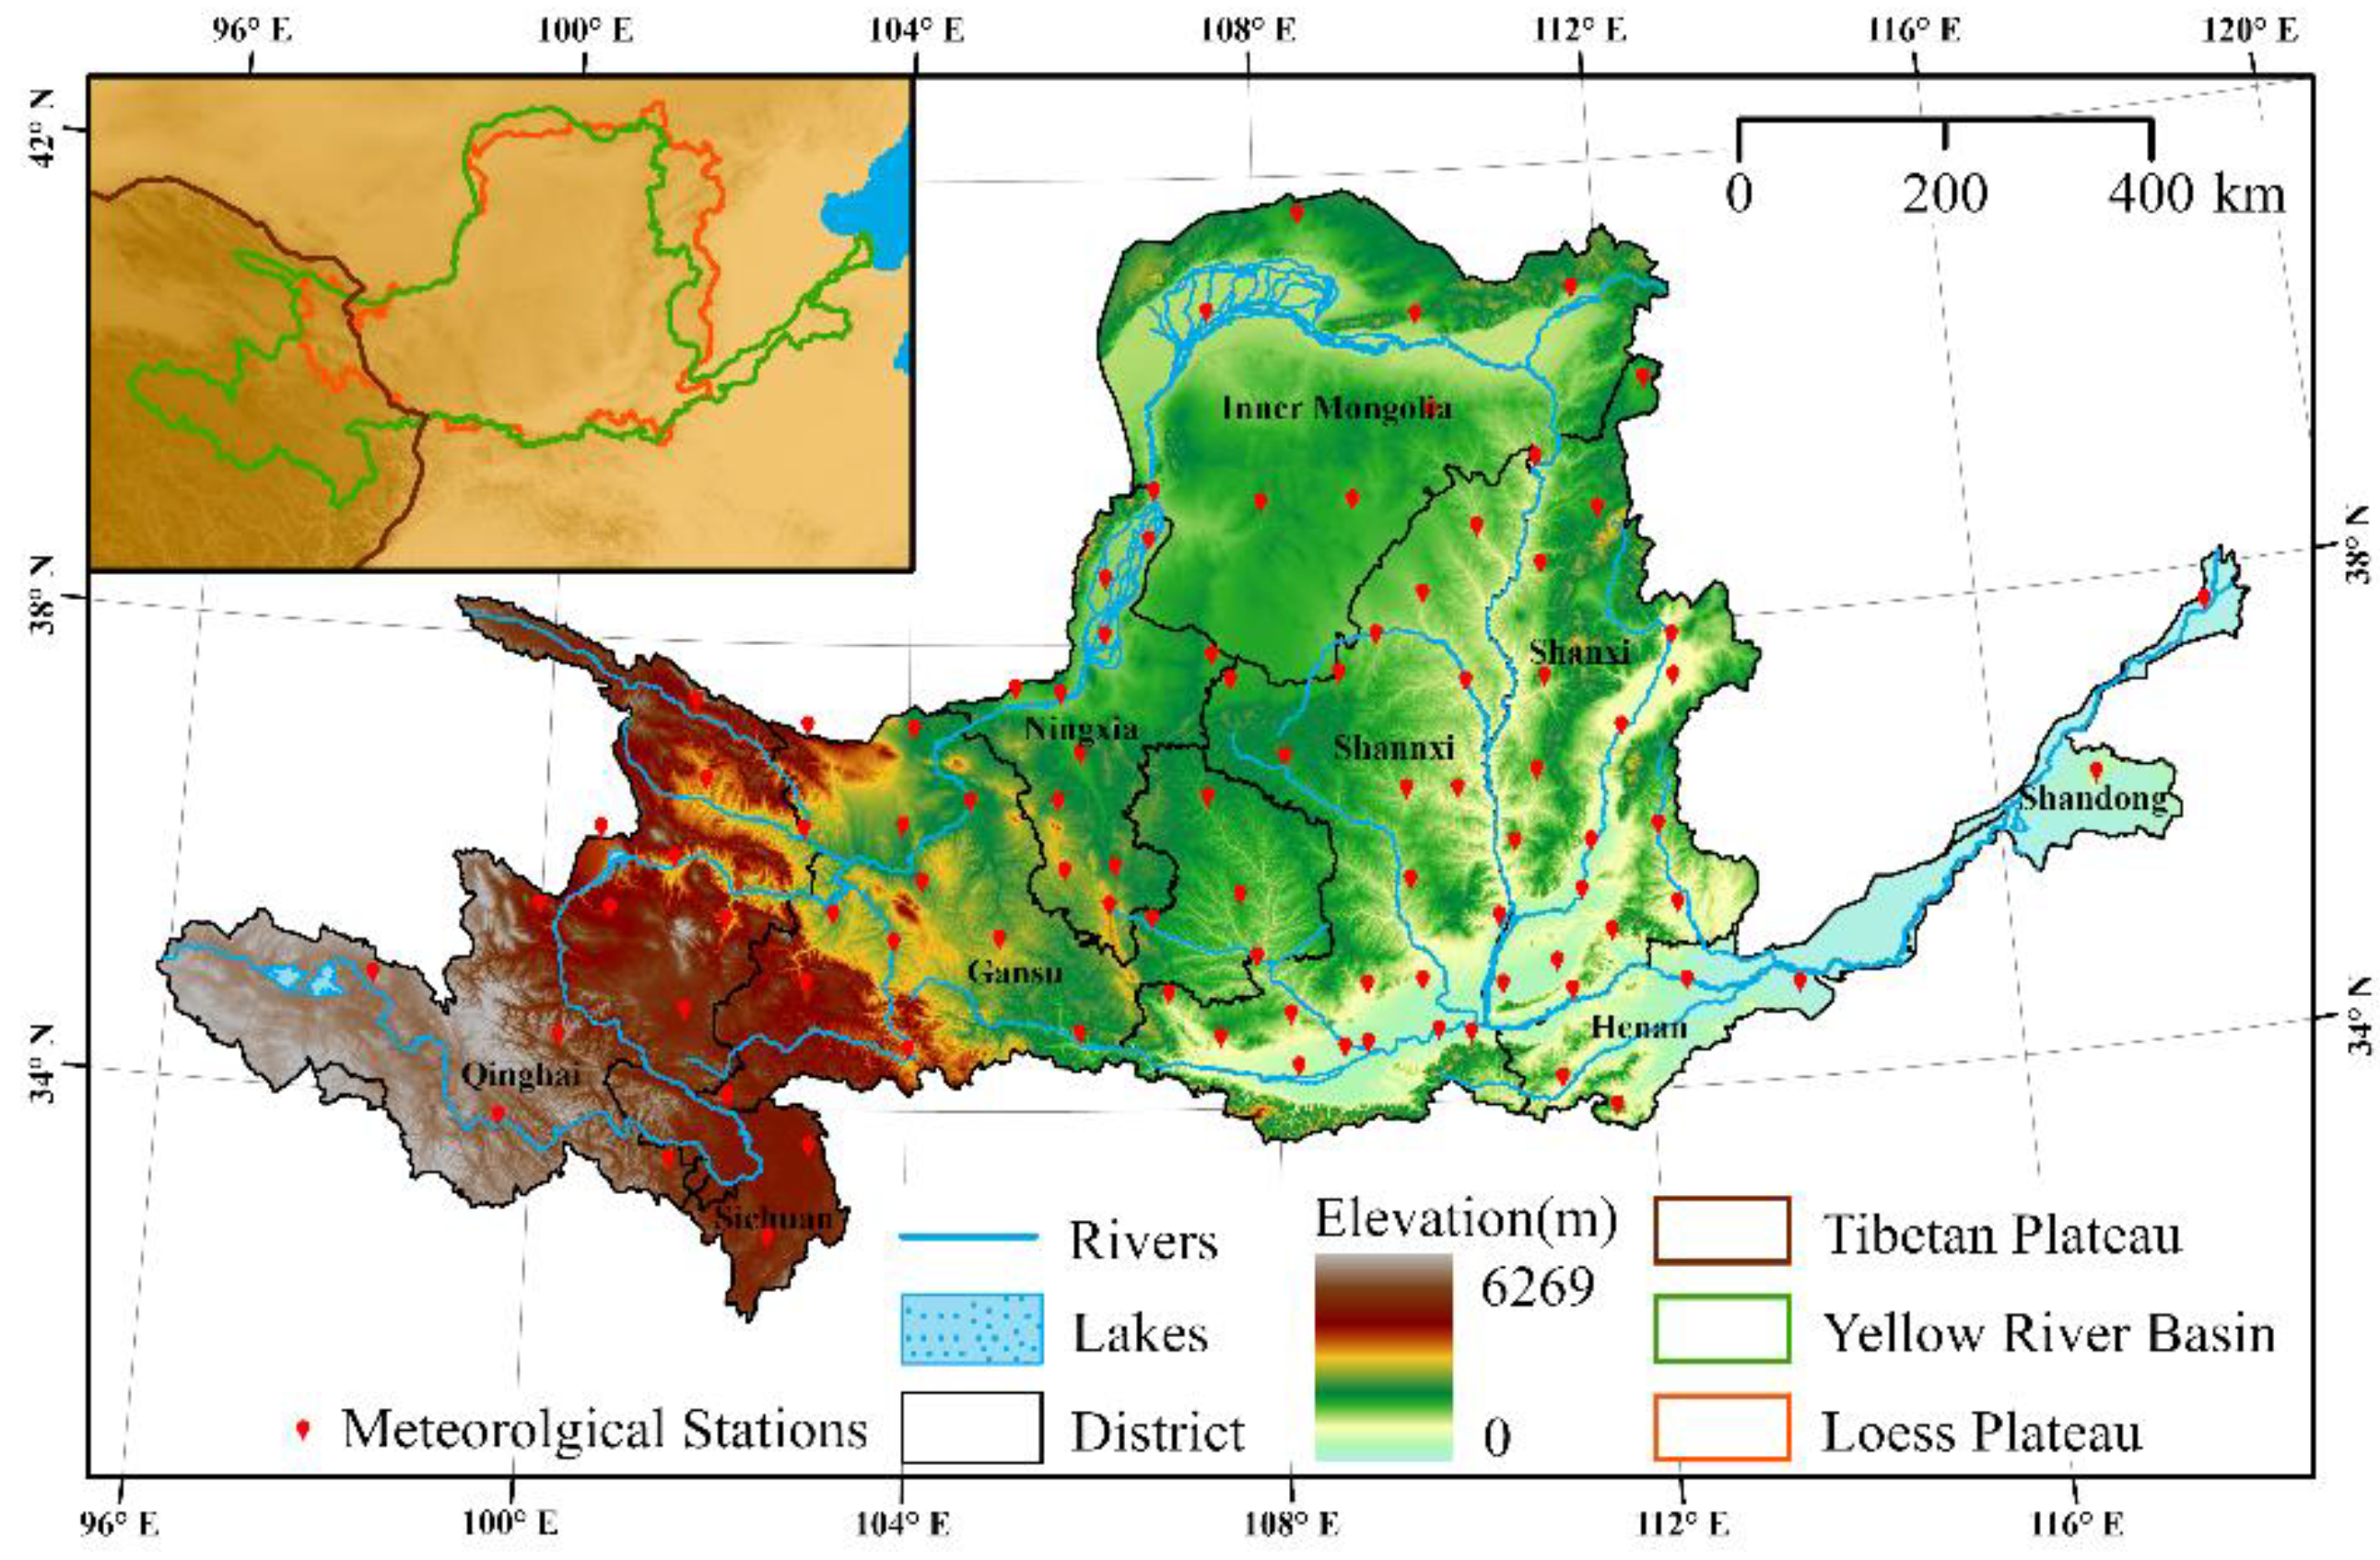
The Yellow River originates from the Brahmaputra Basin at the northern foot of the BaYanKaLa mountain on the Qinghai-Tibet Plateau. The length of the main stream exceeds 5400 km and flows through the nine provinces of Qinghai, Sichuan, Gansu, Ningxia, Inner Mongolia, Shanxi, Shaanxi, Henan, and Shandong. The YRB is located between 95°02′–119°43′ E and 31°28′–41°33′ N (Figure 1), with a drainage area of 795,000 km2. The Yellow River flows from west to east through the Qinghai-Tibet Plateau, Hetao Plain, Ordos Plateau, Loess Plateau, and North China Plain. There are significant differences in climate between different regions in the basin, with large seasonal differences and uneven temporal and spatial distribution of precipitation. Summer precipitation accounts for 70% of the total precipitation, and the daily and annual temperature ranges are large. The soil includes alpine soil, arid soil, and other types, and the natural vegetation includes alpine meadow, grassland, deciduous forest, etc. Soil erosion in the basin is dominated by hydraulic erosion forces, and there are also erosion forces such as wind, freeze-thaw, and gravity [38].
2.2. Data Sources
The data used in this study include (1) daily precipitation data of 113 meteorological stations in and around the YRB in 2000, 2005, 2010, 2015, and 2020, from the China Meteorological Information Center (https://data.cma.cn/, accessed on 10 August 2021); (2) ASTER GDEM V3 30m spatial resolution DEM data, from the Geospatial Data Cloud (http://www.gscloud.cn/, accessed on 18 January 2022); (3) the 1KM spatial resolution China soil characteristics dataset (2010) [39,40] and 1KM spatial resolution Soil map based Harmonized World Soil Database (v1.2) [41], which are from the Institute of Tibetan Plateau Research, Chinese Academy of Sciences (http://www.tpdc.ac.cn/zh-hans/, accessed on 17 April 2022); (4) the 1KM LU/LC data of the YRB in 2000, 2005, 2010, 2015, and 2020 (China’s 1:1,000,000 soil types data and landform types data are from the Resource and Environmental Science and Data Center (https://www.resdc.cn/, accessed on 24 December 2021)); (5) 250 m spatial resolution NDVI MOD13Q1 products for 2000, 2005, 2010, 2015, and 2020 from National Aeronautics and Space Administration (https://search.earthdata.nasa.gov/, accessed on 30 June 2022).
2.3. Research Methods
2.3.1. RUSLE Model
The RUSLE formula is as follows:
where A (t·hm−2·a−1) is the annual soil erosion modulus; R (MJ·mm·hm−2·h−1·a−1) is the rainfall erosivity factor; K (t·h·MJ−1·mm−1) is the soil erodibility factor; LS (dimensionless) is the slope factor S and slope length factor L; C (dimensionless) is the land cover and management factor; P (dimensionless) is the erosion control practice factor.
A = R × K × LS × C × P
R factor reflects the dynamic index of soil erosion caused by runoff generated by rainfall. Due to the difficulty of obtaining rainfall data each time, the method proposed by Zhang et al. [42] to estimate rainfall erosivity was adopted in this study. Compared with the empirical formula for estimating R factor using annual rainfall and monthly rainfall, this formula has higher accuracy and is widely used in the calculation of rainfall erosivity in the YRB and its surrounding areas [10,43,44,45]. The annual rainfall erosivity, based on aggradations of half-month rainfall erosivity, was estimated using daily rainfall data as follows:
where R is the erosivity of half monthly precipitation; Dj refers to the erosiveness daily precipitation on the jth day of the half month. It is required that the daily precipitation is greater than 12 mm, otherwise it is calculated as 0 [46]; α and β represent the coefficients; Pd12 (mm) and Py12 (mm) are the average daily precipitation and the average annual precipitation, respectively, and both require the daily rainfall to be more than 12 mm. Using the meteorological stations data, the average annual rainfall erosivity of each station is obtained by Equations (2)–(4), and then the Kriging interpolation method is used for spatial interpolation, and the spatial resolution is obtained as 1 km rainfall erosivity distribution map.
K factor is an important factor in reflecting the sensitivity of soil to erosion [47]. The method of measuring K value through natural plot test is difficult to carry out in the YRB, so this study uses the EPIC model proposed by Williams et al. [48] to calculate the soil erodibility factor, and the formula is as follows:
where Sil (%), San (%), Cla (%), and Toc (%), respectively, represent the contents of silt, sand, clay, and the total organic carbon in the soil. The results were verified based on some measured K values provided by Zhang Keli et al. [49,50], and the calculated results were reliable. The average k value in the YRB was 0.0429.
The LS factor represents the influence of slope length and slope on soil erosion. This study used the formula for L defined and developed by McCool et al. [51]. The S factor is calculated using the formula proposed by McCool et al. [51] and developed by Liu Baoyuan [52].
where γ is the slope length (m); and m is a dimensionless constant depending on the percent slope (θ).
The C factor was obtained based on vegetation coverage [53]. The formula is as follows:
where f (%) is the FVC. The FVC is estimated by using the pixel bipartite model [54] and using NDVI.
where NDVIsoil is the NDVI of no vegetation cover or bare land, and NDVIveg is the NDVI of the area completely covered by vegetation.
The P factor represents the ratio of soil loss area to soil loss area under standard conditions under the action of certain water and soil protection measures, and its value is between 0 and 1. This study estimates the p factor under different land uses based on Table 1. The p factor of farmland is calculated by the formula proposed by Wener [55], where s (%) represents the slope.
According to the calculation results of the model and the Classification Standard of Soil and Water Loss Intensity [59], the soil and water loss areas with different degrees of erosion are divided into six categories: tolerable (<1000), slight (1000–2500), moderate (2500–5000), severe (5000–8000), very severe (8000–15,000), and destructive (>15,000). The unit is: t·km−2·a−1.
2.3.2. OPGD Model
Geodetector is a statistical method used to detect influencing factors, including Factor detector, Interaction detector, Risk detector, and Ecological detector [30]. In this study, the OPGD R package GD was used to analyze the explanatory power of individual factors and factor interactions on soil erosion, in which the detection results (q-values) represent the magnitude of the explanatory power. The specific settings are as follows: Taking the soil erosion modulus of the YRB as the dependent variable, and LU/LC, Landform type, Soil type, Precipitation, Slope, Elevation, and FVC as the influencing factors, five data discretization methods (Natural break, Standard deviation, Quantile, Equal interval, and Geometric interval) were used to set the spatial layer number to 3–8 categories to analyze the influencing factors of soil erosion. At the YRB scale, factor detection and interaction detection were carried out with the YRB as the research unit. The provincial, city, and county scales were divided into study areas with provinces, cities, and counties as units, and the factor detection and interaction detection of each province, city, and county were detected after deleting the q value that failed the significance test. Finally, the averages of the detection results of every province, city, and county were calculated.
3. Results
3.1. Spatial and Temporal Distribution of Soil Erosion in the YRB
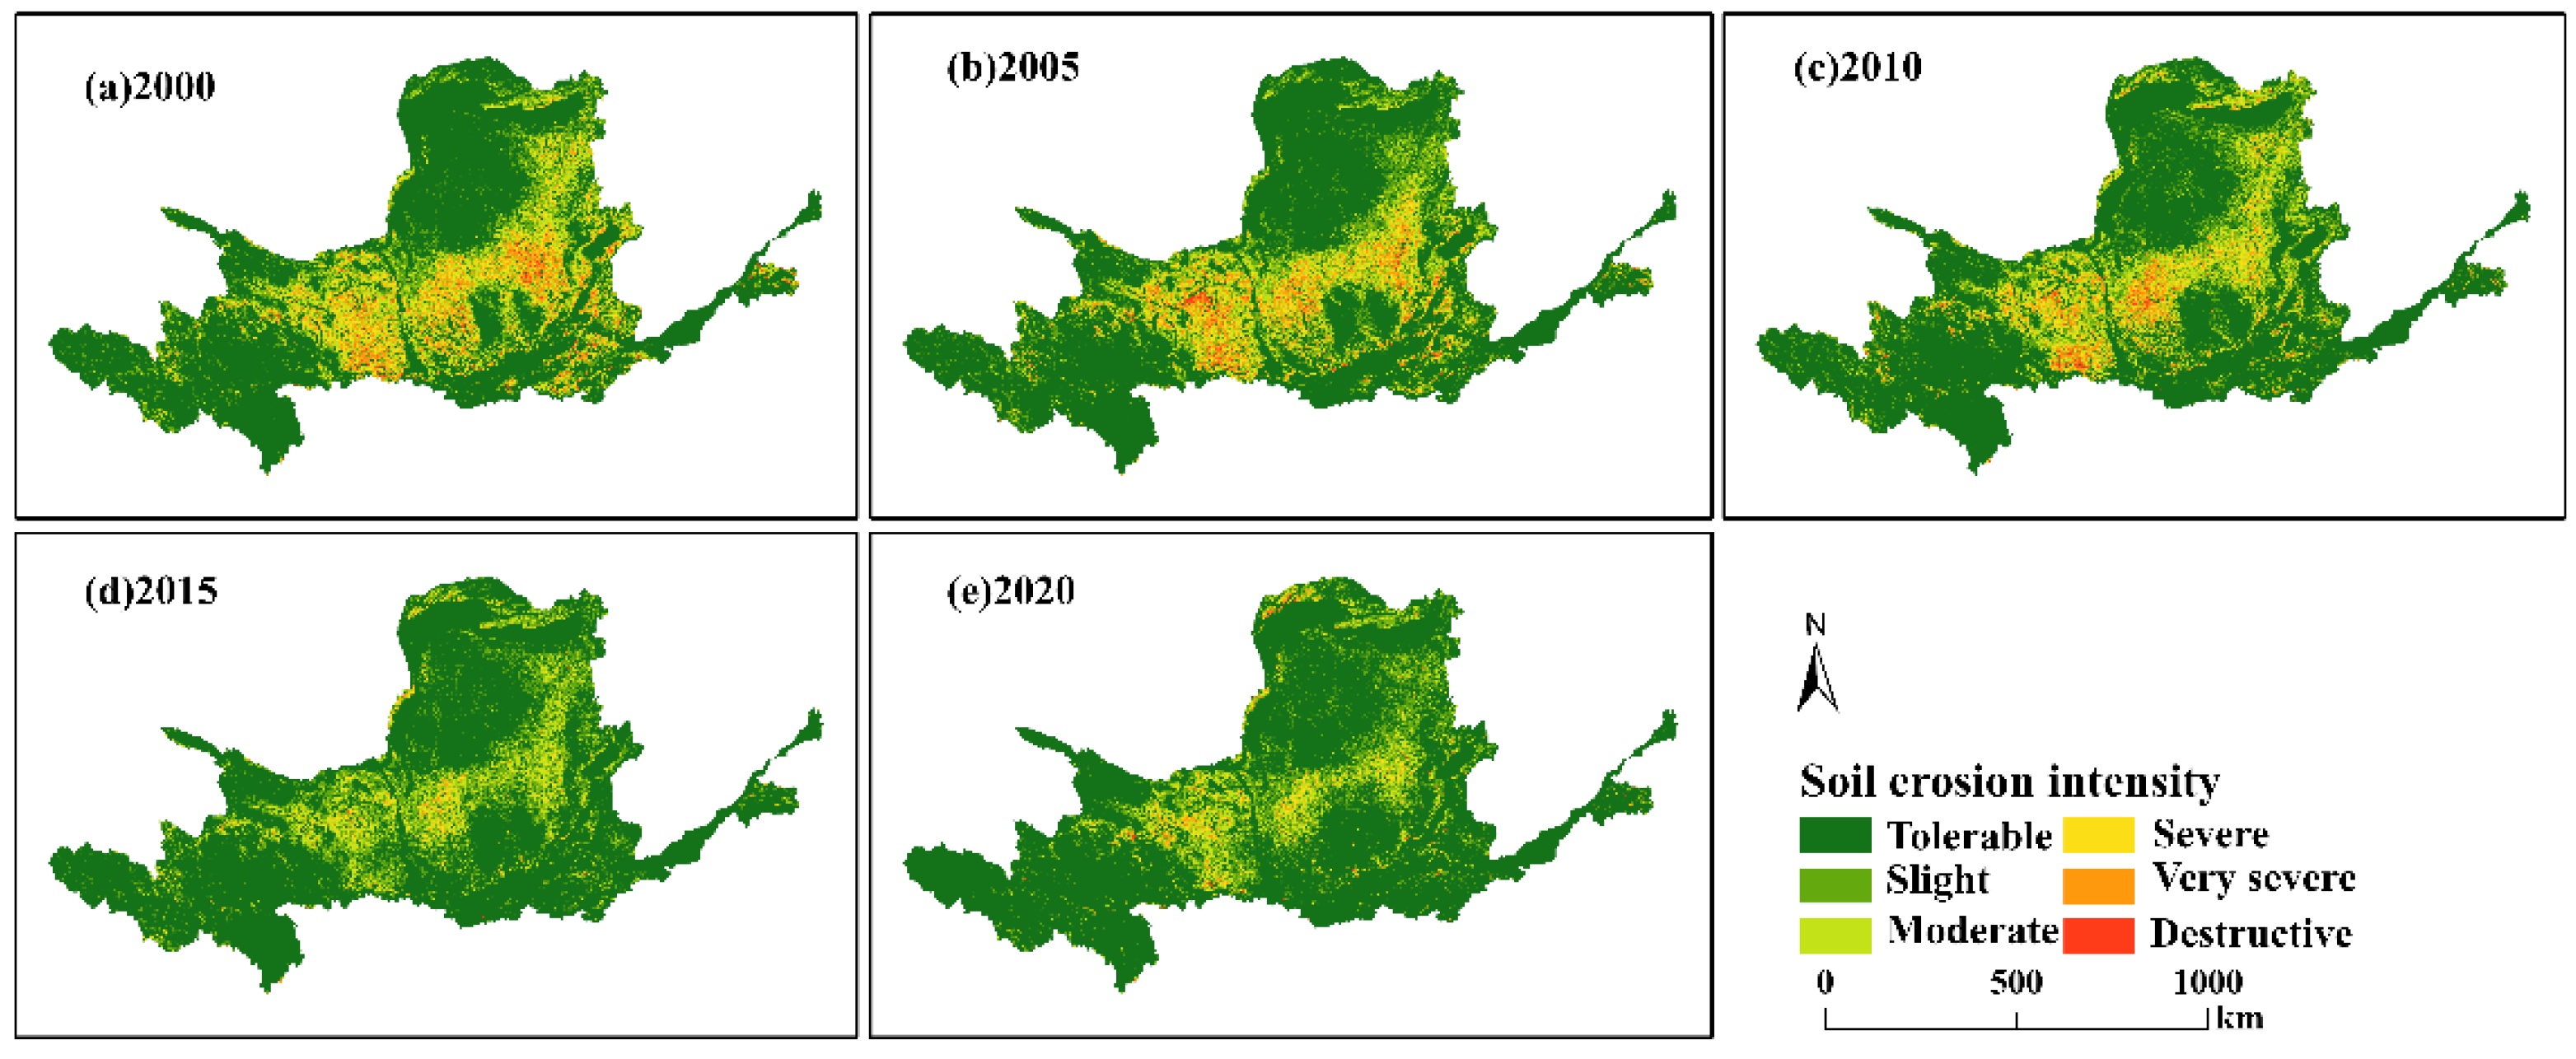
From 2000 to 2020, the average soil erosion modulus of the YRB was 1336.29 t·km−2·a−1. Overall, about 73.4% of the soil erosion areas showed slight and moderate soil erosion intensity, and the severely eroded areas were concentrated in Gansu, Shaanxi, and Shanxi provinces (Figure 2). The soil erosion status was different in different years. The average soil erosion modulus in 2000, 2005, 2010, 2015, and 2020 was 1877.69, 1641.59, 1485.25, 844.84, and 832.07 t·km−2·a−1, respectively. The soil erosion rate showed a decreasing trend, with no significant changes from 2000 to 2010, and the soil erosion situation improved significantly since 2015.
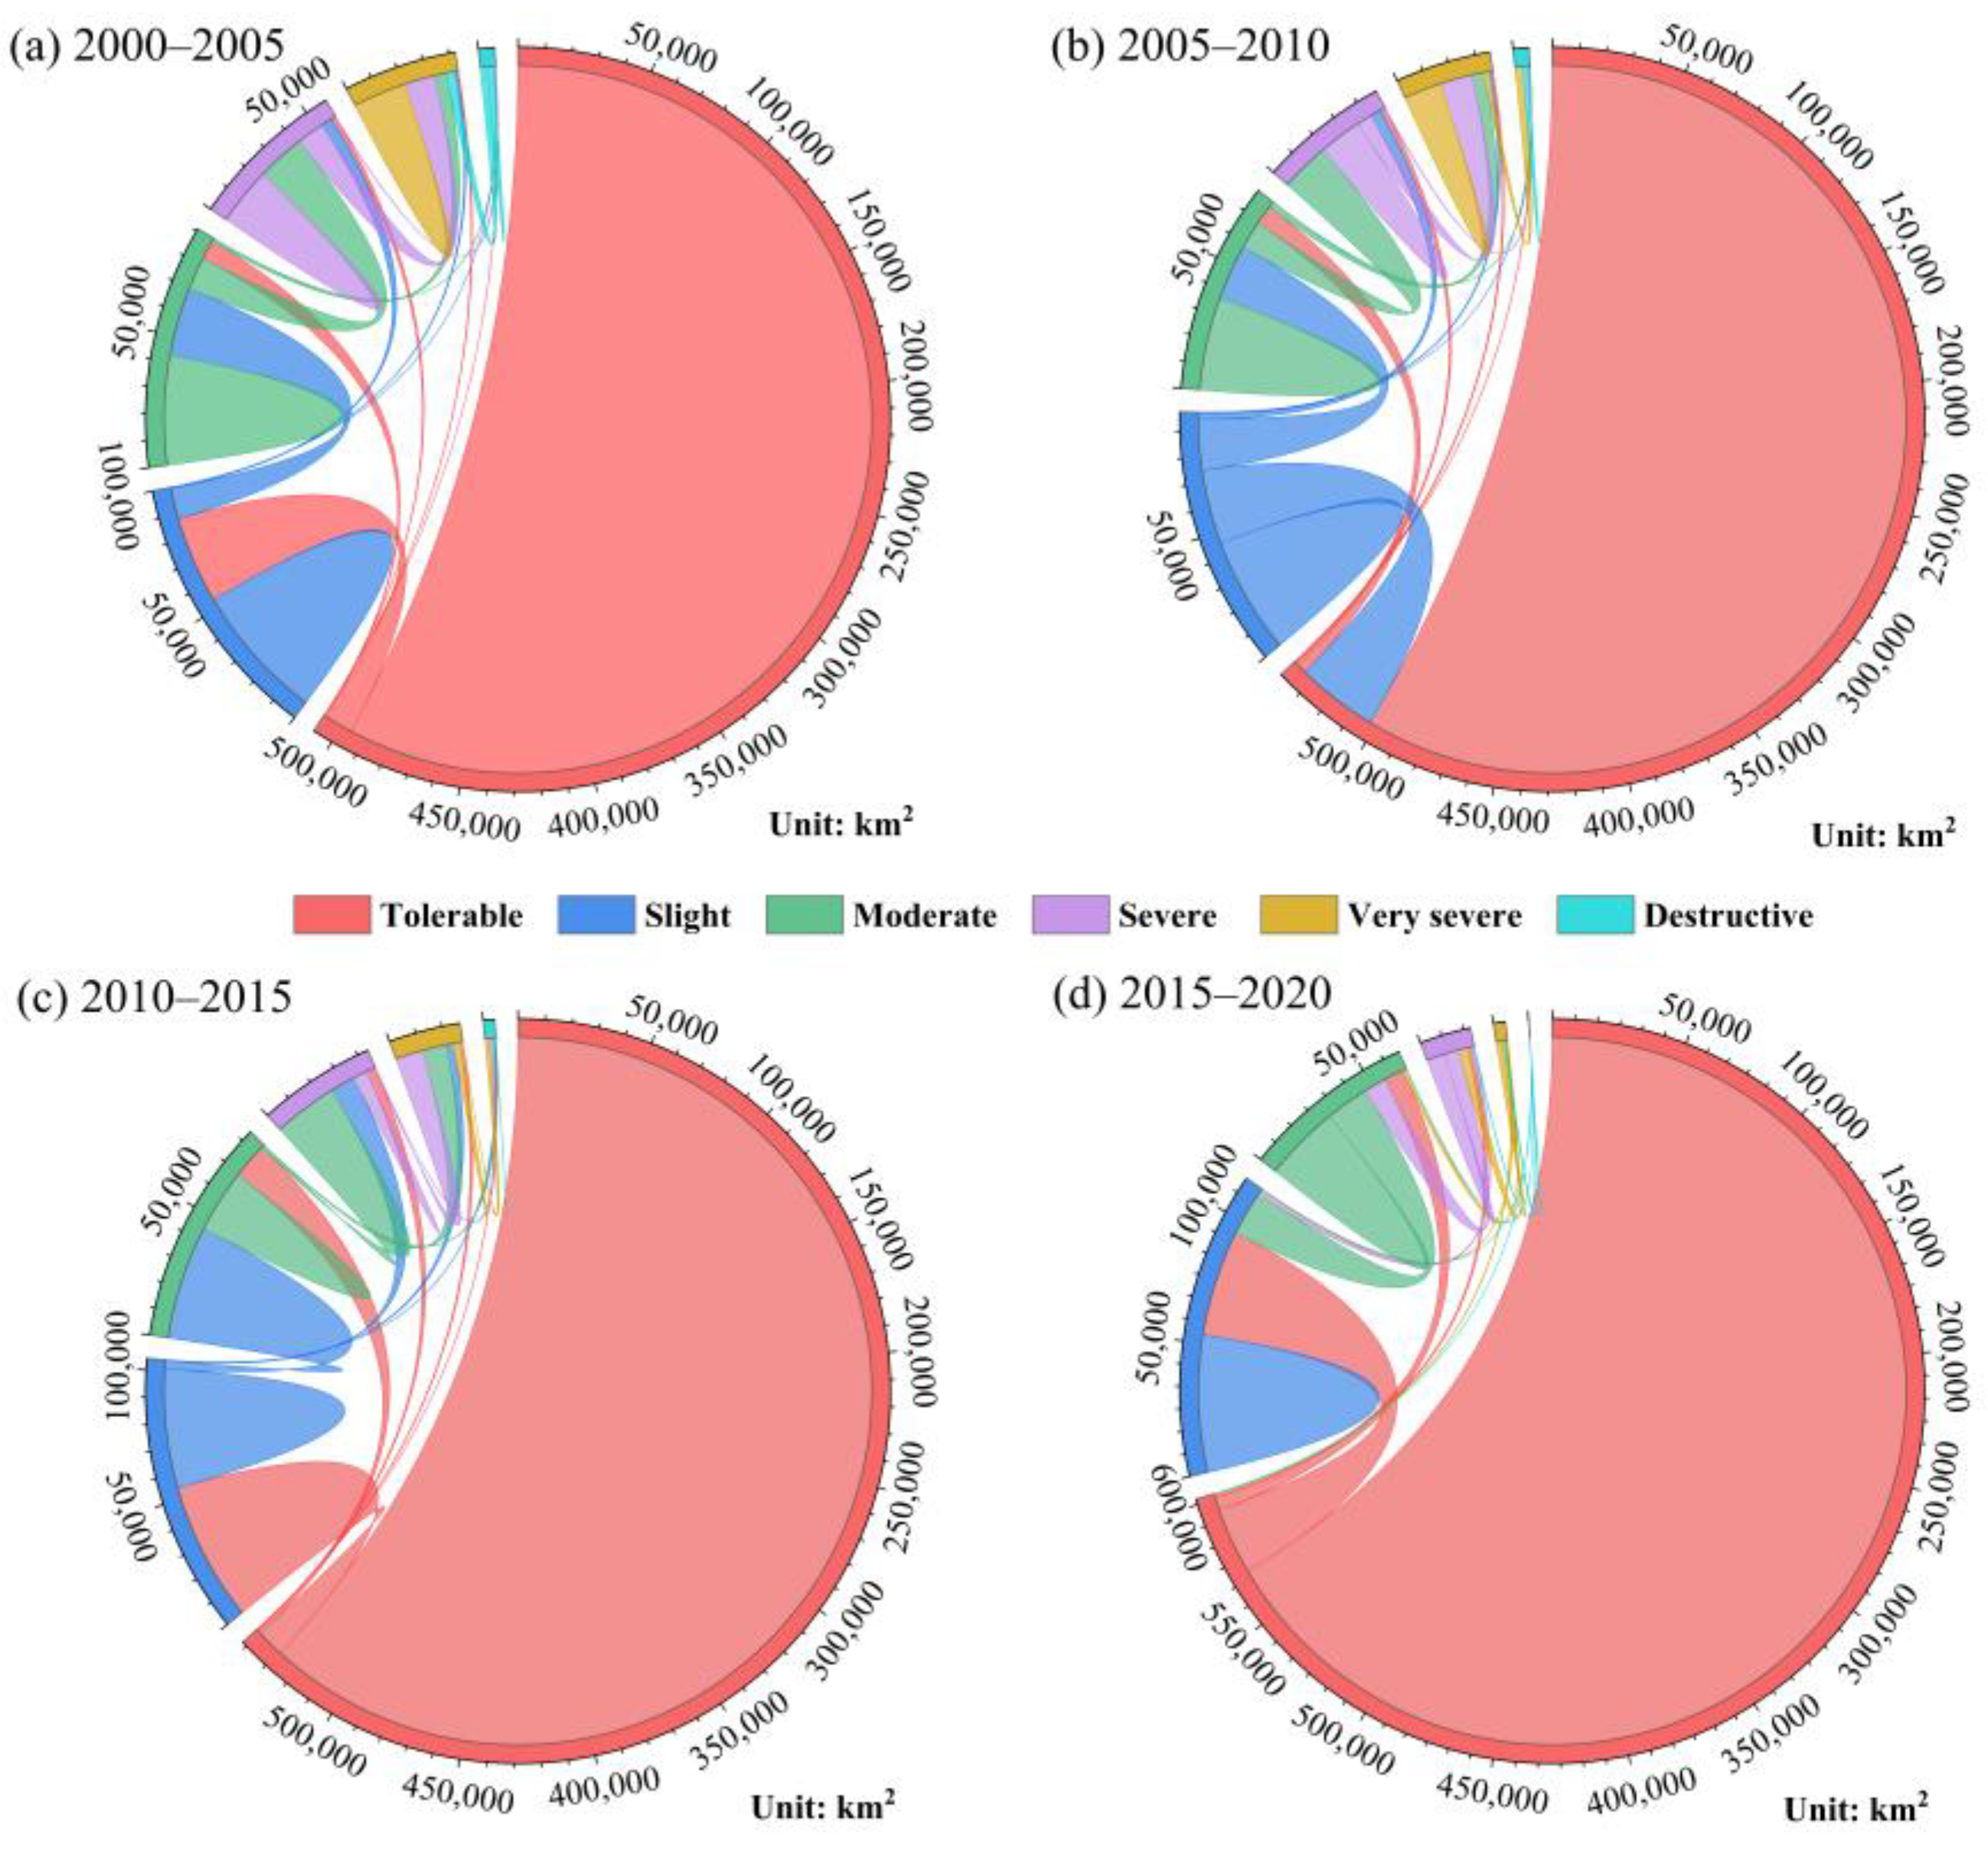
Figure 3 shows the transfer matrix for different soil erosion intensity (where the widths at both ends of the chord represent the transfer area between different erosion intensities). From 2000 to 2020, the area of hydraulic erosion in the YRB decreased by 113,800 km2, and the area of slight erosion did not change significantly. The proportion of moderate erosion in the whole basin decreased by 4.07%, the proportion of severe erosion decreased by 4.79%, the proportion of very severe erosion decreased by 4.30%, and the proportion of destructive erosion decreased by 0.63%. From 2000 to 2020, the area of tolerable erosion was the largest, and the area from high erosion intensity to low erosion intensity was larger than the area from low erosion intensity to high erosion intensity, which indicated that the overall soil erosion in the study area gradually improved during the study period. In contrast, there are certain differences in the transition of soil erosion intensity at each stage, and the transition from moderate and above erosion intensity to low erosion intensity is the most obvious. Except for the case where the erosion intensity is unchanged, the transition of erosion intensity from slight to tolerable, tolerable to slight, and moderate to slight occupies a relatively large area.
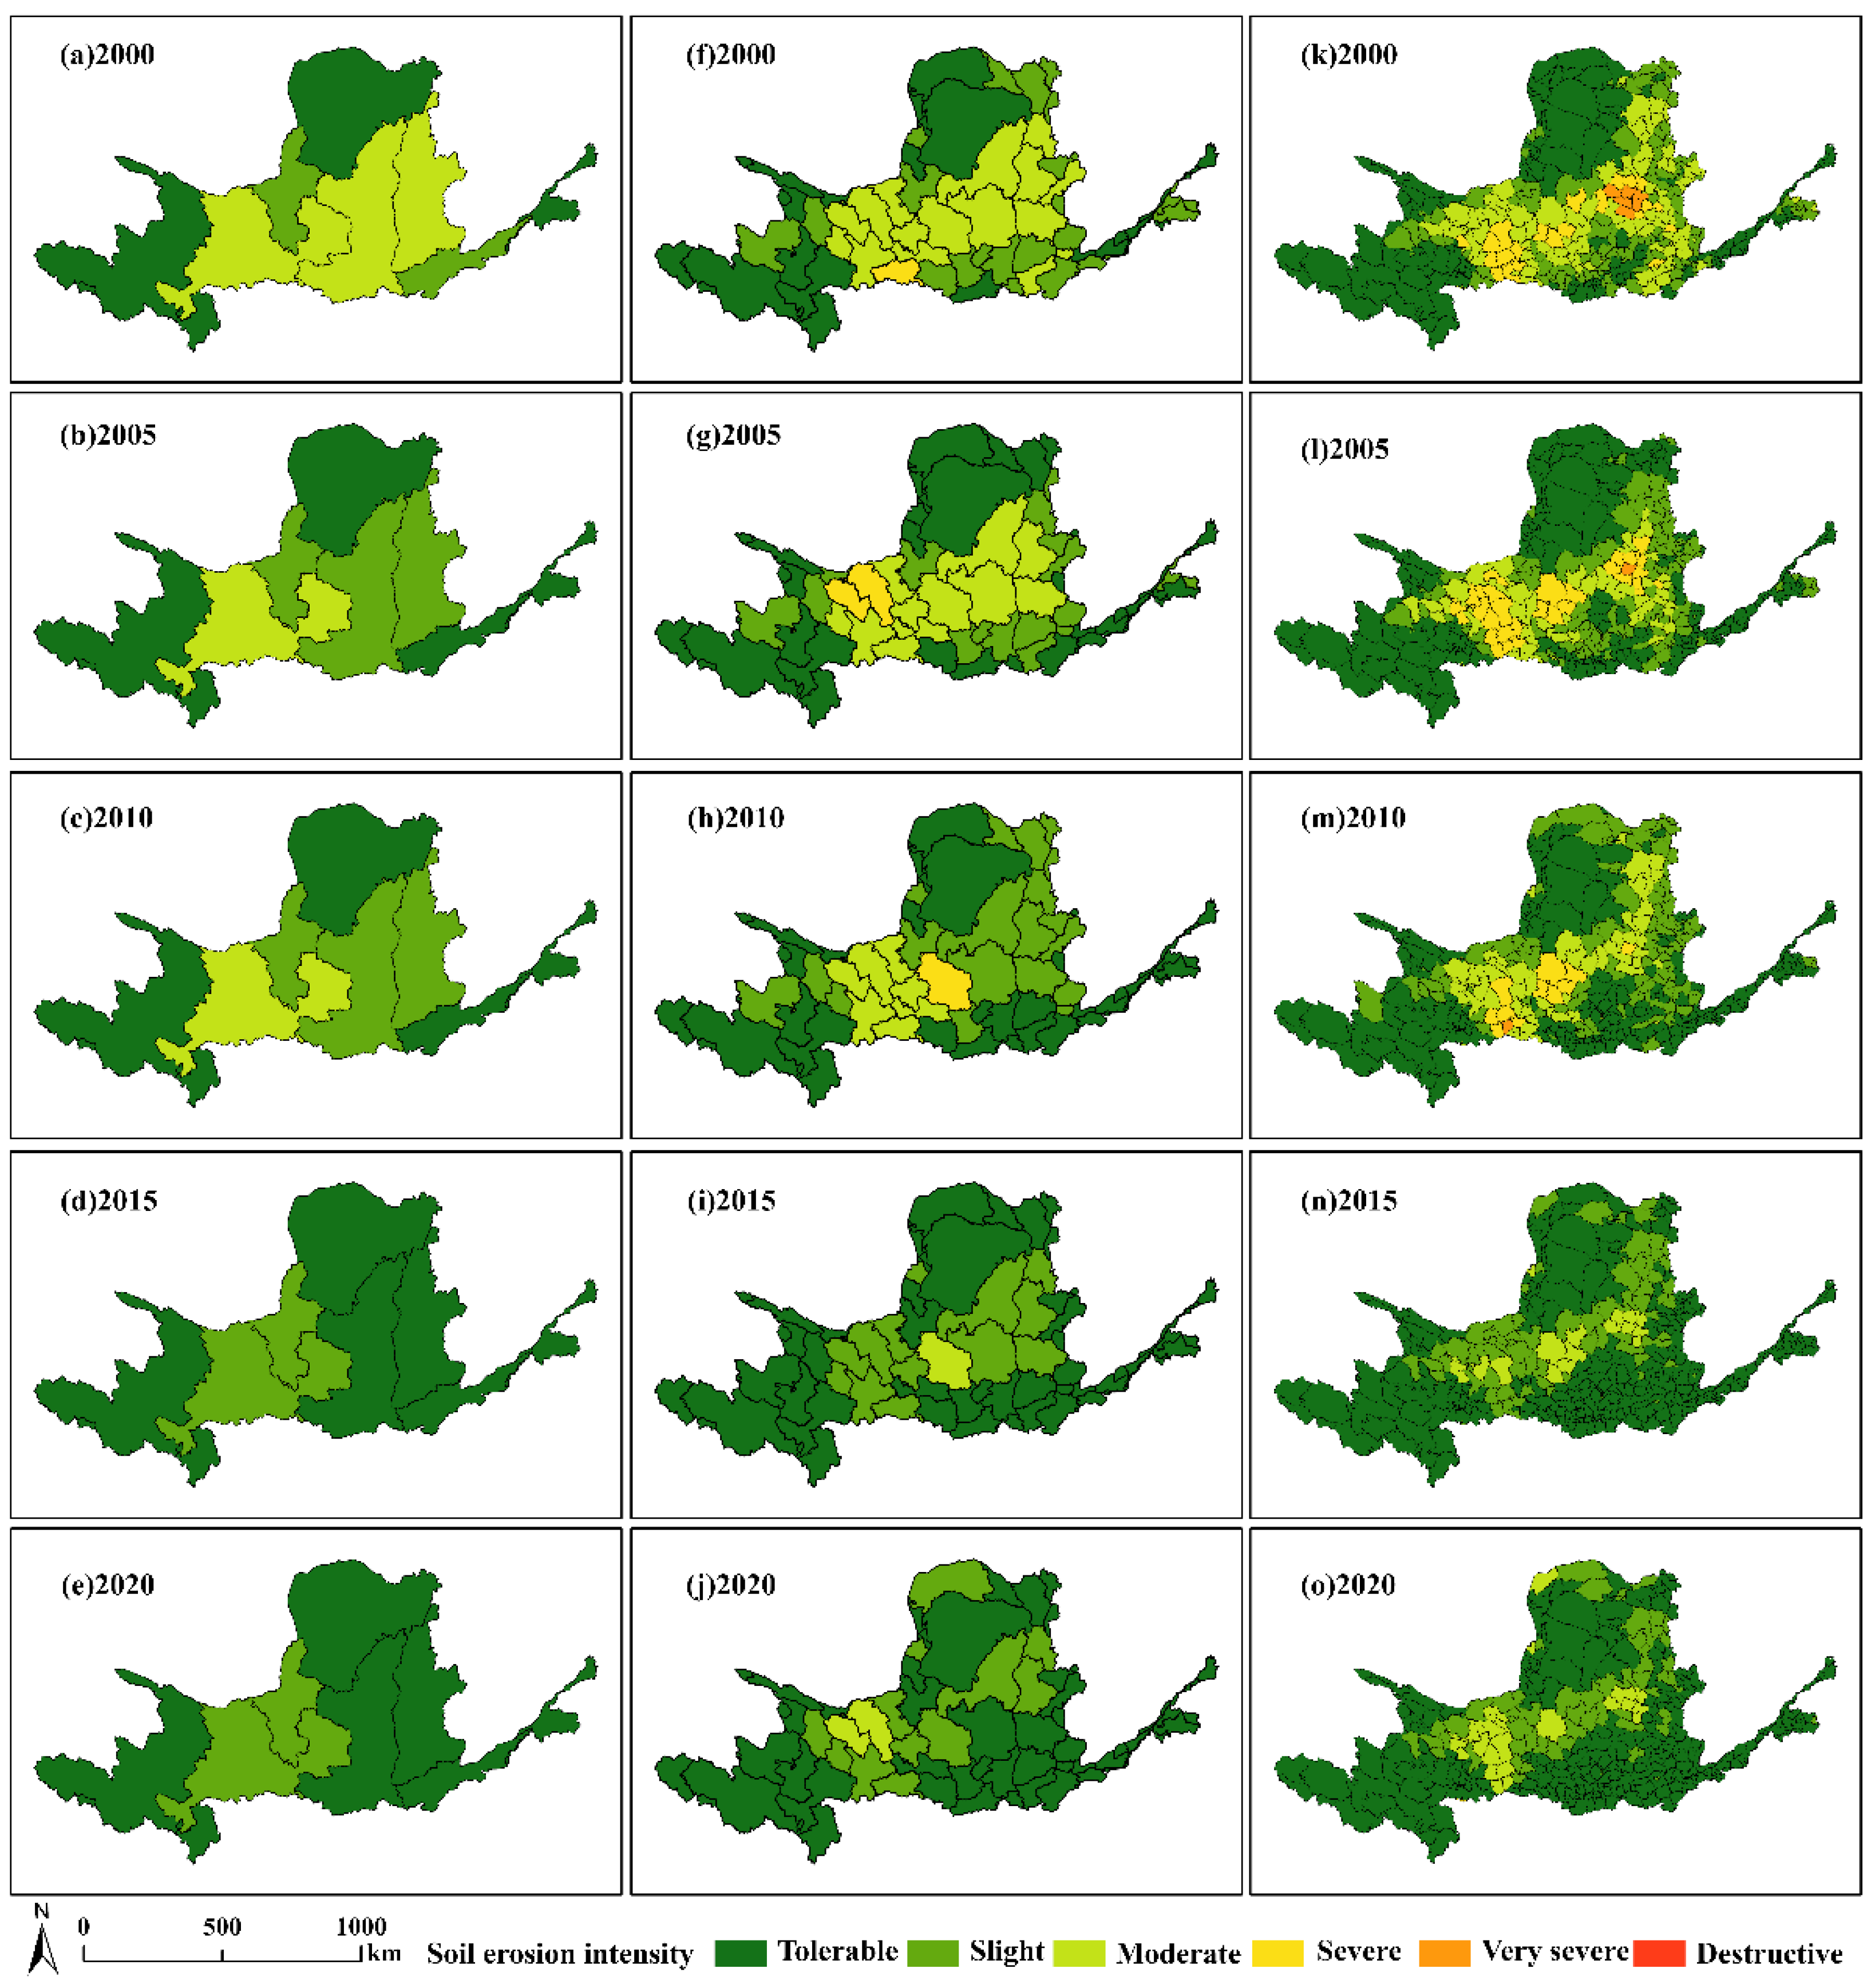
Soil erosion in the YRB occurs mainly in the loess area and gradually disperses as the scale decreases, with obvious regional differences in space (Figure 4). The high erosion areas at the provincial scale are mainly concentrated in Gansu, Shaanxi, and Shanxi provinces. In 2020, almost all counties and cities with serious soil erosion were concentrated in these three provinces. At the city scale, high-erosion areas mainly include Baiyin, Zhongwei, and Qingyang in Gansu Province, Yan’an and Yulin in Shaanxi Province, and Linfen and Luliang in Shanxi Province. At the county scale, high erosion areas mainly include Suide County, Zichang County, Qingjian County, etc., in Shaanxi Province; Yonghe County, Shilou County, Liulin County, etc., in Shanxi Province; Huining County, Tongwei County, Gangu County, etc., in Gansu Province. The abovementioned counties and cities generally show a northeast-southwest trend and are distributed in the hilly areas and loess tableland in the middle of the Loess Plateau.
3.2. Factor Detection Results
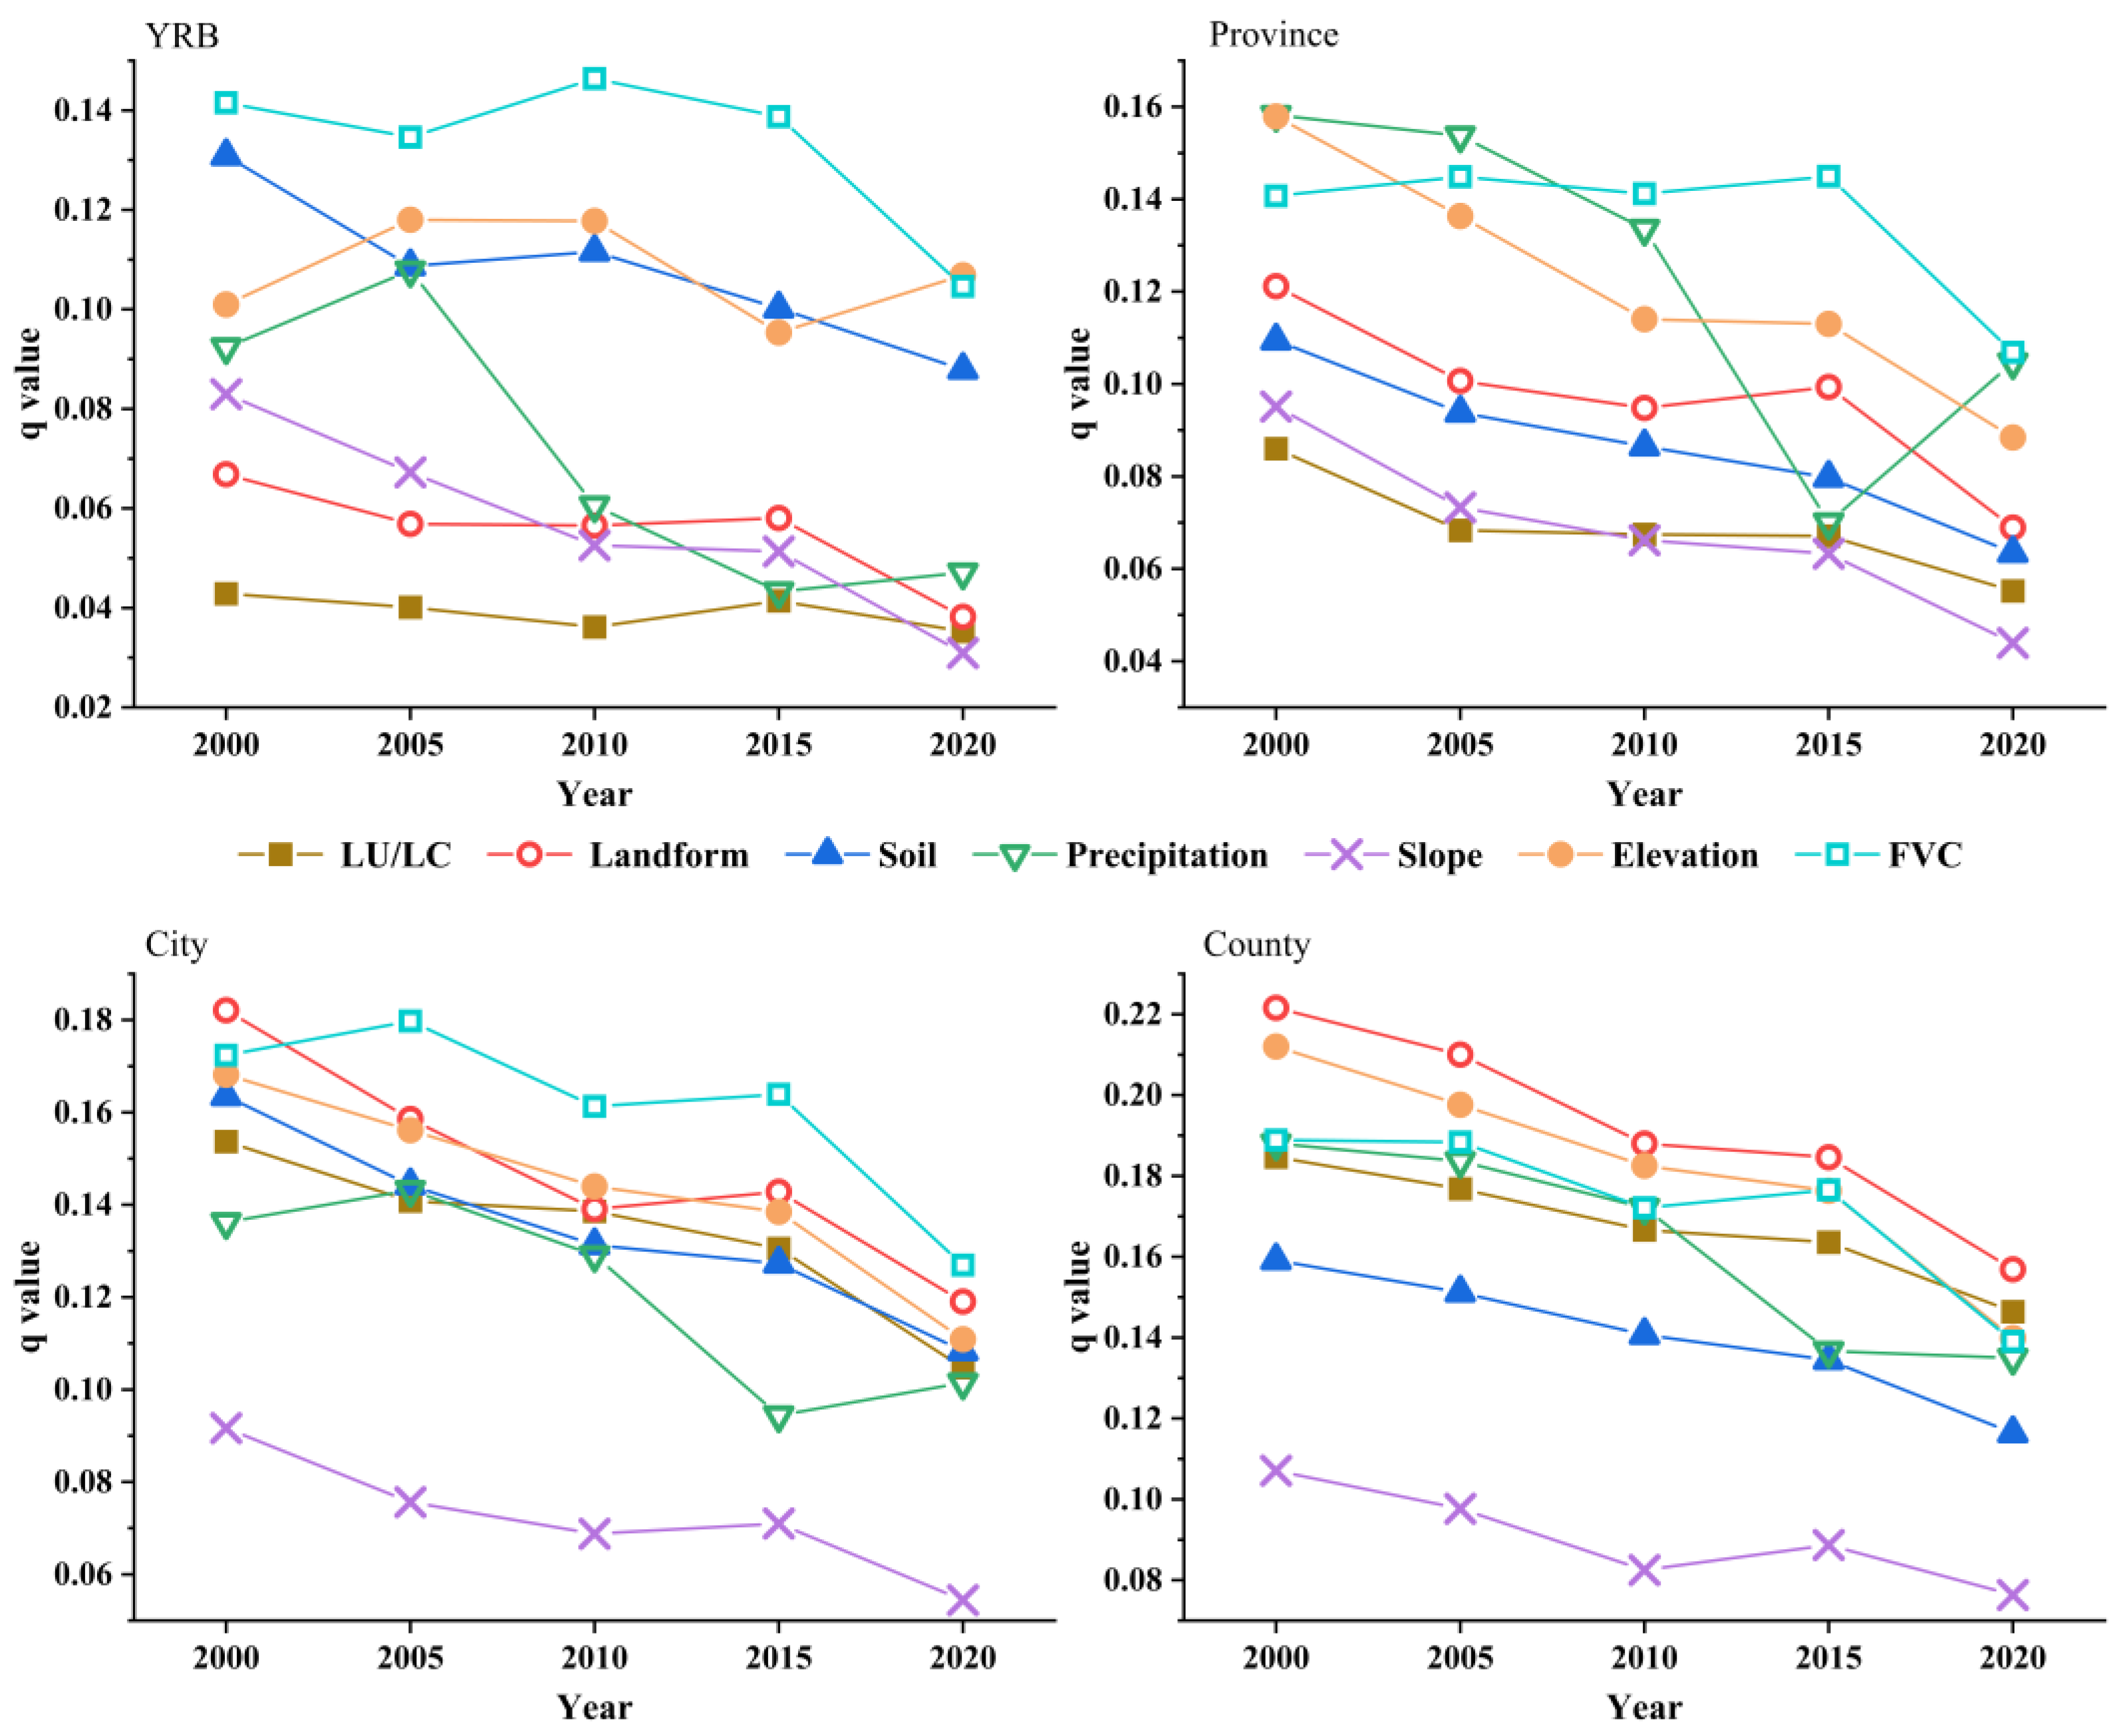
Soil erosion is impact by human activities and natural causes, among which LU/LC and FVC reflect the impact of human activities on soil erosion [9]. The factor detection results from 2000 to 2020 are shown in Figure 5. During the study period, the q value generally showed a decreasing trend, which indicated that with the passage of time, the influencing factors of soil erosion have become more complex in the context of decreasing soil erosion rate, and a single factor has an impact on soil erosion explanatory power is increasingly limited.
Specifically, there are slight differences in the changing trends of each influencing factor. The q-value of the precipitation factor was significantly lower in 2015. It was related to the decrease in precipitation in 2015, what weakened the driving ability of rainfall to soil erosion [60]. The ranking of LU/LC among the influencing factors showed an upward trend, which was more evident in the study of dividing the YRB by county. In 2000, LU/LC ranked 5th out of seven factors, rising to 2nd in 2020, which indicated that LU/LC has an increasing influence on soil erosion.
There are also differences in detection results at spatial scales. The q value order of soil erosion influencing factor detection results at the YRB scale is FVC > Soil > Elevation > Precipitation > Slope > Landform > LU/LC. Among them, FVC is the highest, which can explain 13% of soil erosion in general. LU/LC had the smallest q value, explaining only 4% of soil erosion. At provincial scale, the q value order of the factor detection results is FVC > Precipitation > Elevation > Landform > Soil > LU/LC > Slope. FVC had the largest q value, explaining about 14% of soil erosion. The slope has the smallest q value, explaining about 7% of soil erosion. At city scale, the q value order of the influencing factor detection results is FVC > Landform > Elevation > Soil > LU/LC > Precipitation > Slope. FVC has the largest q value, explaining about 16% of soil erosion. The slope has the smallest q value, explaining about 7% of soil erosion. At county scale, the q value order of the influencing factor detection results is Landform > Elevation > FVC > LU/LC > Precipitation > Soil > Slope. Landform has the largest q value, explaining about 19% of soil erosion. Slope has the smallest q value, explaining about 9% of soil erosion.
To sum up, with the decrease in the research scale, the q value of each soil erosion influencing factor generally showed an upward trend, and the ranking of the factors changed. The q value of FVC was consistently high, explaining about 15% of soil erosion, and the q value ranking of LU/LC gradually increased, which indicated that FVC was always an important controlling factor in the process of soil erosion, and the effect of LU/LC on soil erosion enhanced with decreasing scale. In general, natural causes dominate in the larger study area, while human activities can have more influence on soil erosion in part areas. Therefore, the management of soil erosion should strengthen the management of small areas to give more play to the positive impact of human activities.
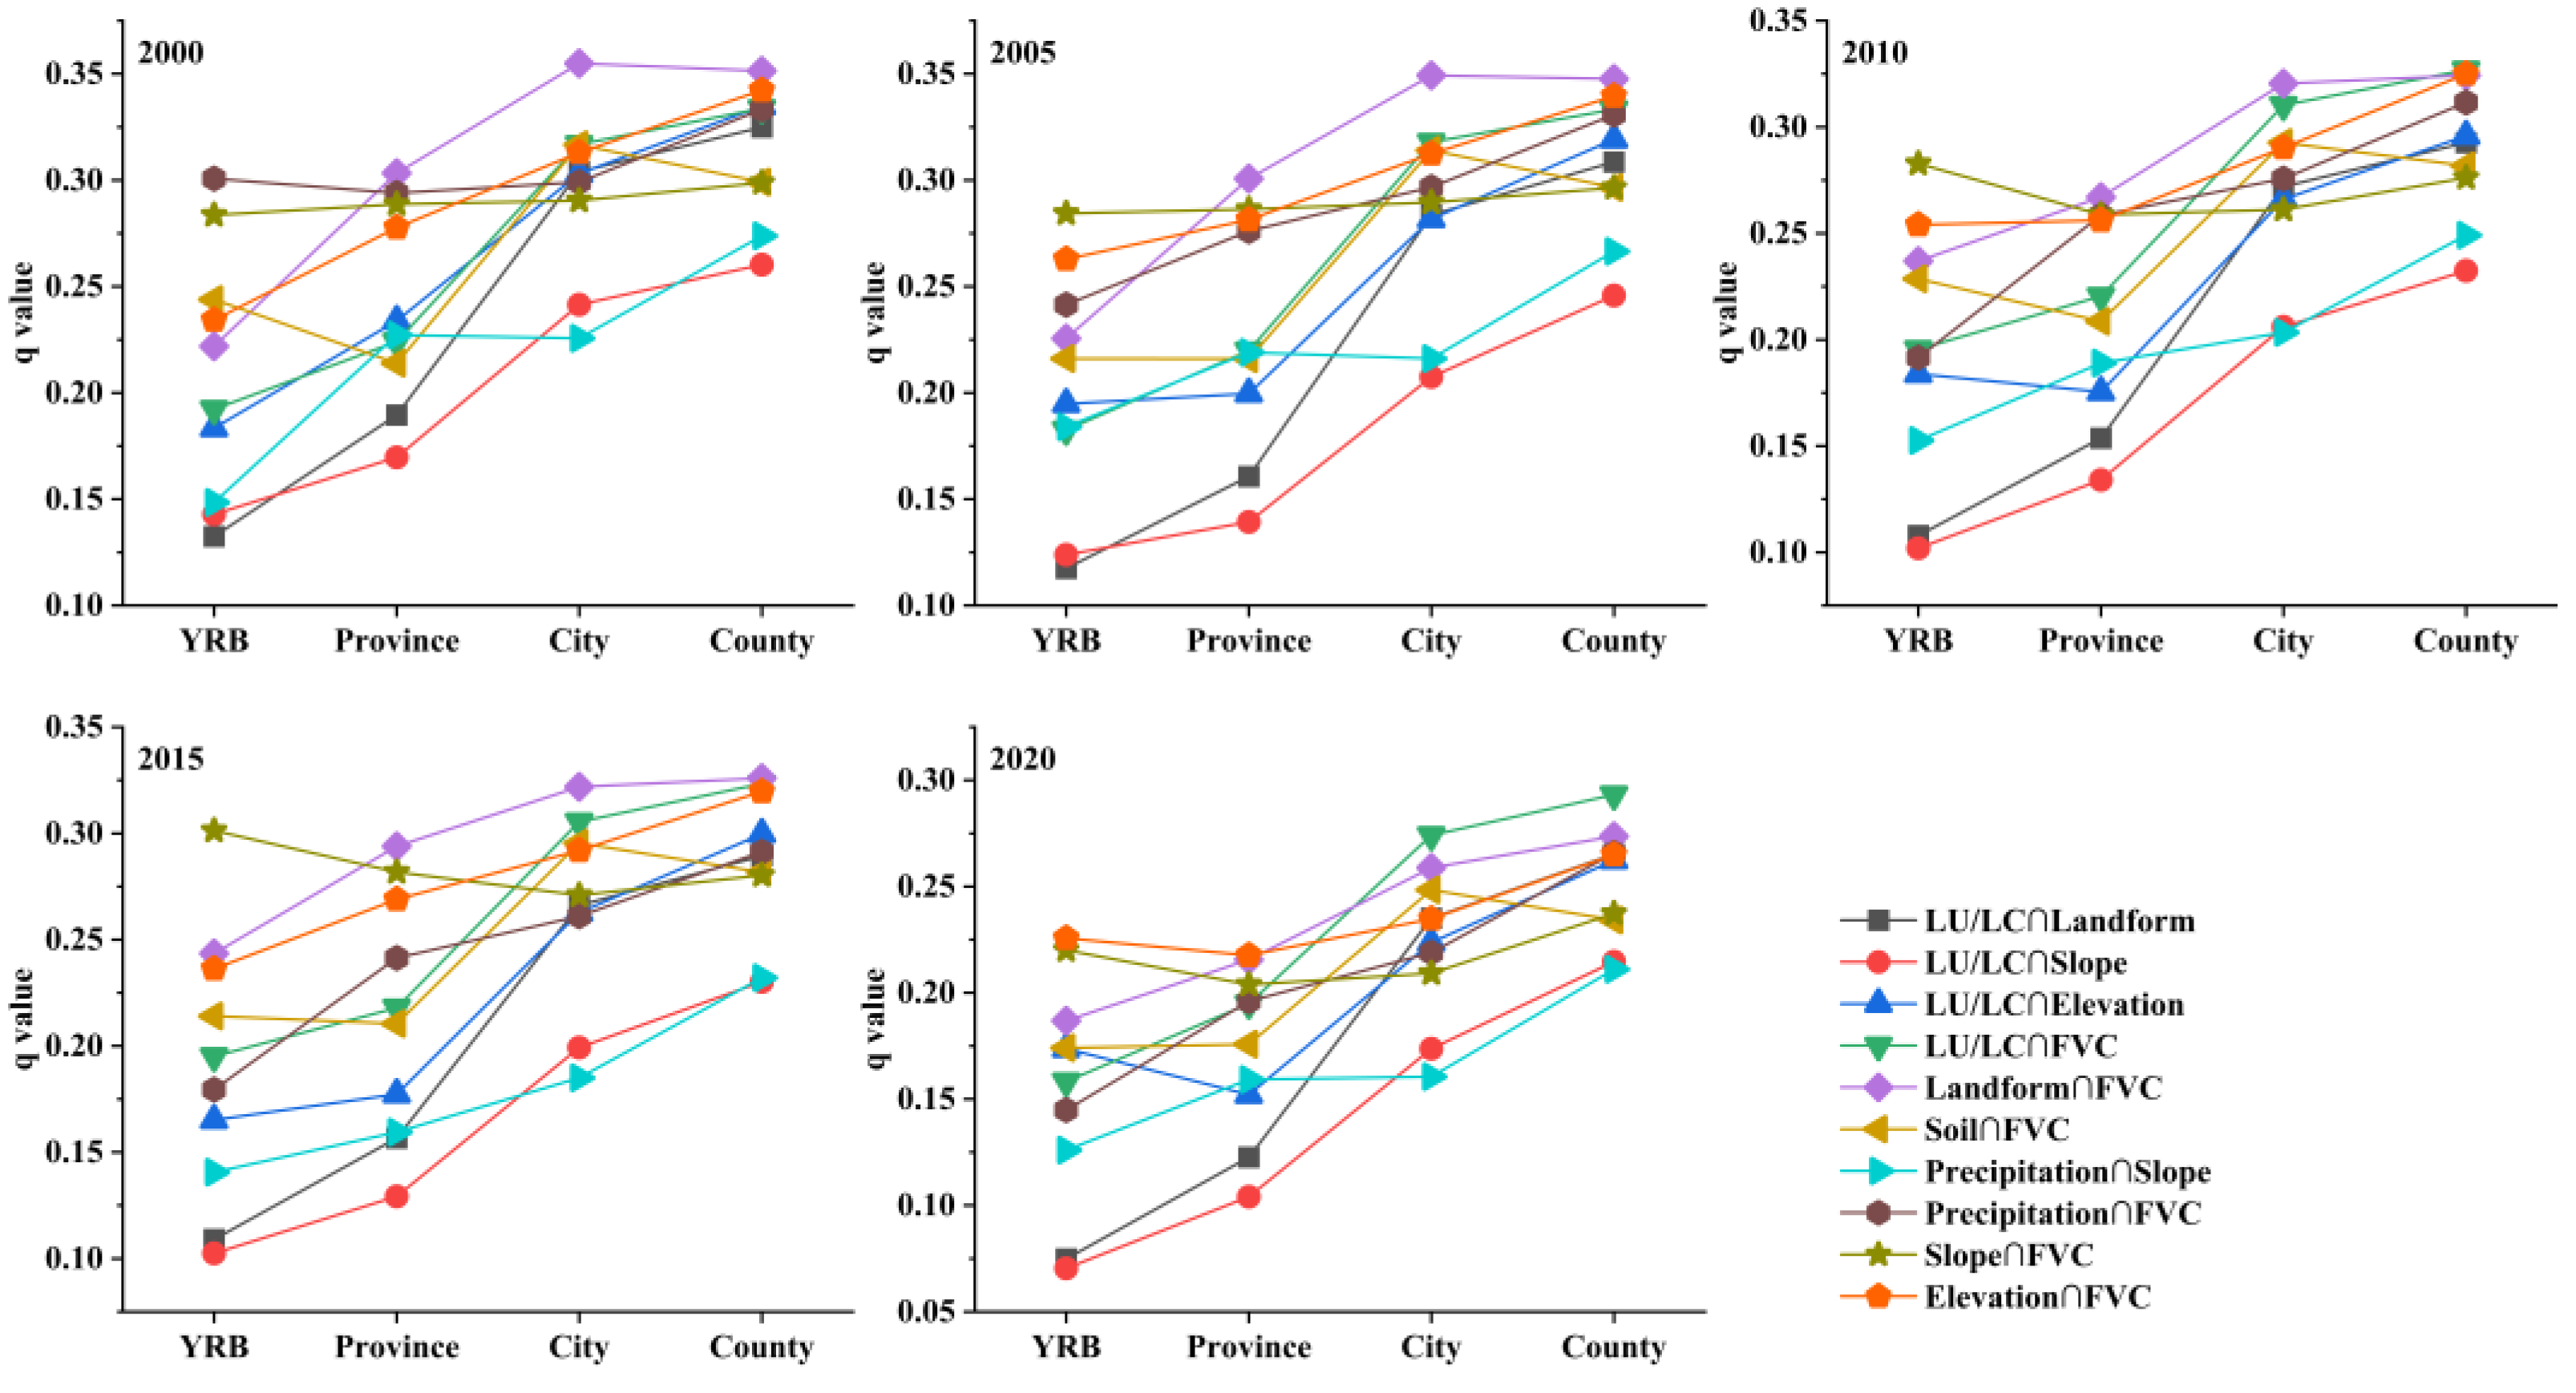
3.3. Interaction Detection Results
The explanatory power of the single factor for soil erosion is limited, and the q value of the factor interaction is significantly higher than that of the single factor (Figure 6). Among the single factors, FVC, Landform and LU/LC have a greater implication on soil erosion. The interaction between the above three factors or the interaction between the above three factors and other factors produces a higher q value, and the interaction between FVC and Landform, and FVC and LU/LC have the most direct impact on soil erosion. At the county scale, the interaction between FVC and Landform in 2000, 2005, 2010, 2015, and 2020 can explain about 35%, 35%, 32%, 33%, and 27% of soil erosion, respectively. The interaction between FVC and LU/LC can explain 33%, 33%, 33%, 32%, and 29% of soil erosion, respectively.
The change trend of the interaction results is basically consistent with the trend of the spatiotemporal characteristics of the single factor detection results. In terms of time, the results of interaction show a decreasing trend, but the effect of interaction between LU/LC and other factors increases in rank. Spatially, as the scale decreases, the q value of the interaction increases, while the ranking of the main controlling factors changes. Its variation characteristics are consistent with the detection results of a single factor. Natural causes dominated the large-scale study area, and human activities have more effects on soil erosion in local areas.
4. Discussion
4.1. Validation of the Model Results
The soil erosion situation in the YRB is complex. The data obtained from the China River Sediment Bulletin can only infer the sediment transport modulus of some hydrological stations in the Yellow River. When the sediment transport ratio is unknown, the basin soil erosion modulus cannot be estimated. Therefore, the results of the RUSLE in this study were contrasted with the results of other studies to validate the model (Table 2). Our findings have a good linear fit with those of others (R2 = 0.8924). Compared with the Soil and Water Conservation Bulletin in Yellow River Basin (2020) issued by the Yellow River Water Conservancy Commission [34], the study underestimated 3.81% of the hydraulic erosion area of the YRB in 2020.
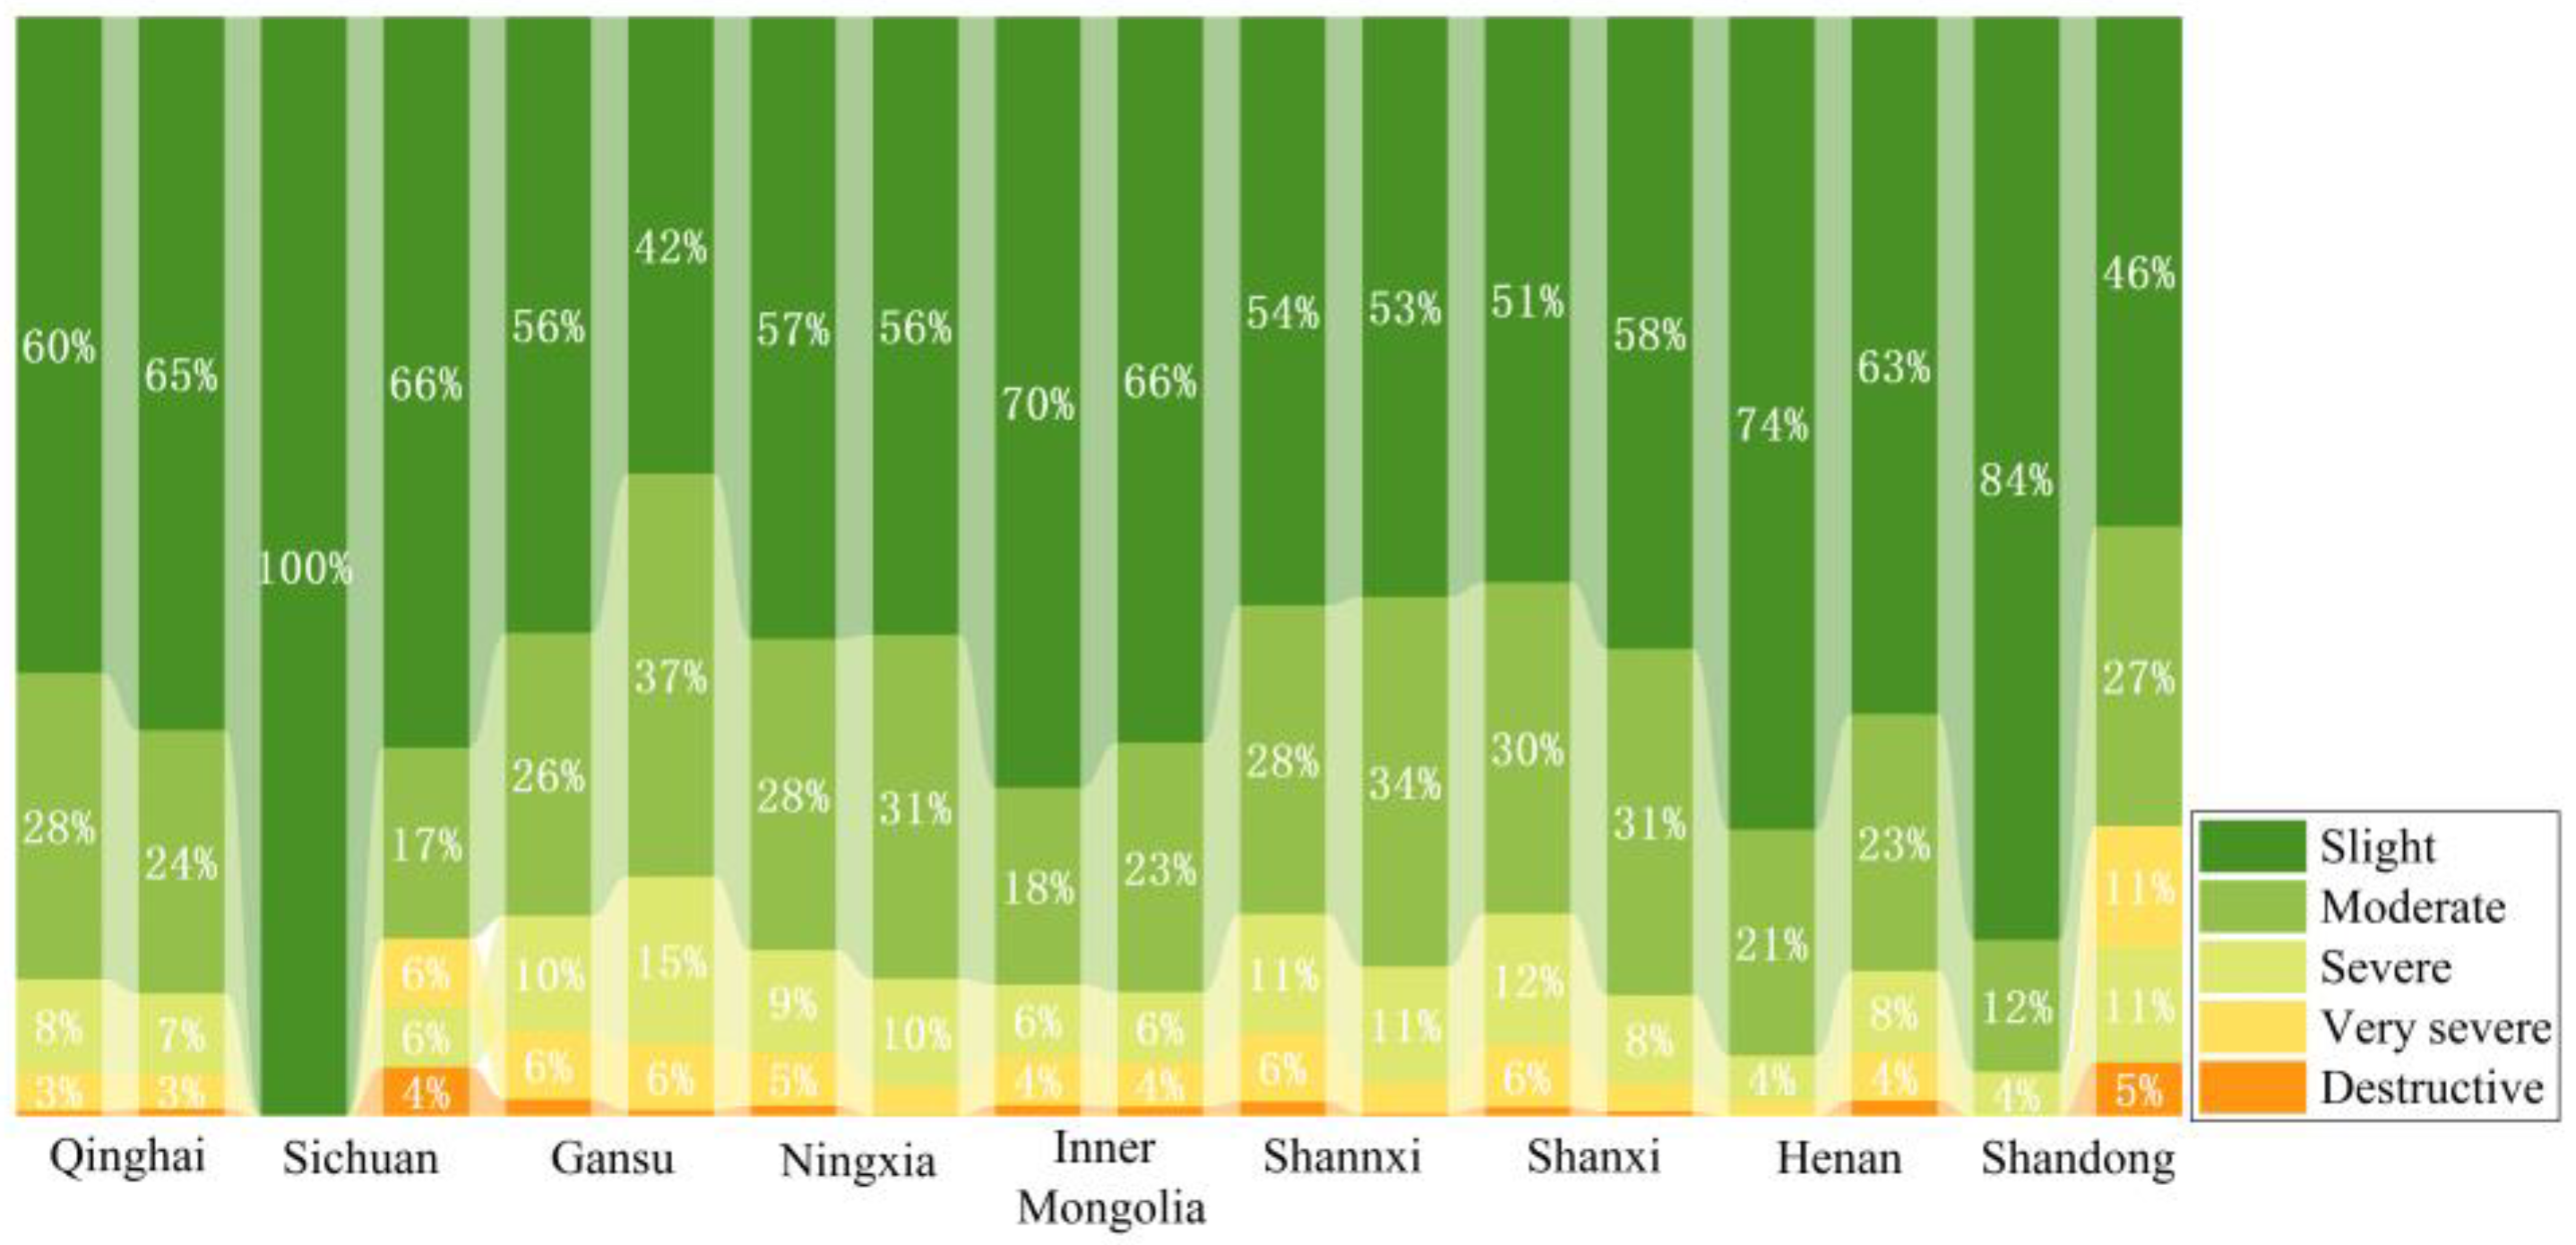
In order to further validate the spatial accuracy of the RUSLE results, the soil erosion situation in each province in 2020 was compared with the area of hydraulic erosion intensity by province in the Soil and Water Conservation Bulletin in Yellow River Basin (2020). The results show that the estimated area ratios are roughly similar (Figure 7), but there is a large difference in the proportion of grades in Shandong and Sichuan, which is mainly caused by the underestimation of the proportion of mild erosion in the two provinces. The model significantly overestimated soil erosion in both provinces.
4.2. Discussion of Soil Erosion and Its Influencing Factors
Soil erosion has obvious distinct spatial variability, which is identified as a paramount surface process [5]. The areas with severe soil erosion in the YRB show a northeast-southwest trend and are distributed in bands in the hilly areas and loess tableland in the middle of the Loess Plateau. Guo et al. [18] suggested that this spatial feature of soil erosion is significantly correlated with vegetation coverage and precipitation. In the RUSLE model, slope and precipitation play an important role in estimating the erosion modulus. In the area with large topographic relief, more intense steepness and longer slope length can provide stronger flow energy and larger sediment movement distance [65]. This study further quantifies the contributions of the dominant factors of soil erosion and their interactions at different scales. The OPGD model results indicate that soil erosion in the YRB was affected by LU/LC, landform type, soil type, precipitation, slope, elevation, and FVC to different degrees. In general, FVC, landform type and LU/LC are the main influencing factors, while precipitation and slope have limited contributions to soil erosion. This result differs from that of Guo et al. [18] and Ma et al. [65]. The reason for this difference is likely that the impact of human activities and related LU/LC on soil erosion has weakened the impact of natural causes (slope and precipitation) on soil erosion [5,7,9]. In addition, in areas with a slope greater than 20°, landslides are very likely to occur, causing severe soil erosion [10,66]. There are few living spaces and resources available to humans in these areas, so ecological restoration and abundant water-and-soil conservation measures have been introduced to suppress soil erosion [18]. Vegetation has the best soil erosion control on hillsides at 15–20° [67], which further reduces the driving effect of natural causes on soil erosion.
From 2000 to 2020, the soil erosion modulus of YRB decreased continuously, and showed a rapid decline from 2010 to 2015. According to the 2015 China River Sediment Bulletin [68], the measured sediment transport in the main hydrological control stations of the Yellow River in 2015 decreased by 46% to 82% compared with the average value of the past ten years. The measured sediment load at the main hydrological control stations of the tributaries decreased by 61–100% compared with the average value of the past ten years. In 2015, the measured sediment transport in the lower reaches of the Yellow River was zero for the first time, indicating that the soil erosion in the YRB was indeed significantly improved around 2015. The principal consideration for the above situation is that the precipitation in the YRB in 2015 was 58.95 mm smaller than the average precipitation in 2000–2020, and the R factor value was 378.02 MJ·mm·hm−2·h−1·a−1 smaller than the average in 2000–2020. In addition, the q value of soil erosion influencing factors show a decreasing trend, but the ranking of LU/LC among the factors keeps rising, which indicates that the driving mechanism of soil erosion has become more complicated while soil erosion has weakened, but human activities have played a more important role in the process of soil erosion.
A more noteworthy phenomenon is that with the reduction of the research scale, the q value of each factor shows an increasing trend, and the ranking of LU/LC in the driving factor continues to rise. The reason for it, on the one hand, is the scale effect of different spatial statistical units on the Geodetector model, which is the modifiable areal unit problem (MAUP) [32,69]. OPGD has optimal spatial unit to assess the impact of LU/LC, precipitation and other factors on soil erosion changes. Under the optimal spatial unit, the q value can reach the maximum value [32,69]. On the other hand, the smaller the research unit, the more obvious the driving mechanism of soil erosion. The contribution of natural causes diminishes with the decrease in scale, while the import of artificial activities on soil erosion magnifies with the decrease in scale [9]. Therefore, at county scale, the q value of LU/LC increased in the ranking of each factor.
Similar to other findings, FVC (NDVI) played the most critical role in inhibiting soil erosion in this study. From 2000 to 2020, the FVC in the YRB increased from 0.48 to 0.59, and the average value of the C factor in the basin decreased from 0.09 to 0.05. The benefits of vegetation for erosion control stabilize when vegetation coverage is above 0.60 [67]. In addition, Ren et al. [33] analyzed the influencing factors of vegetation change in the YRB from 2000 to 2020. They found that human activities and climate variation accounted for 66% and 34% of the vegetation change in the YRB, respectively. This shows that human activities can not only directly affect soil erosion by changing land use patterns and agricultural planting patterns, but also indirectly affect soil erosion of YRB by affecting vegetation growth.
4.3. Uncertainty Analysis and Future Perspectives
This paper not only analyzes soil erosion in the YRB, but also discusses the multiscale spatiotemporal characteristics of influencing factors. But there are still some uncertainties. Firstly, due to the insufficiency of regional experiments data and measured data, the RUSLE model was used to evaluate the soil erosion status in this study. Although the model passed the validation, the accuracy could be further improved. Data with different sources and resolutions (e.g., DEM, precipitation, NDVI) lead to uncertainty in the model [70]. The R factor, LS factor, K factor, and C factor are all calculated using empirical equations, and the P factor is assigned according to the LU/LC, which all have a certain degree of subjectivity. In the further research, the transport limited sediment delivery (TLSD) function can be integrated and calibrated with the RUSLE model. Secondly, this study did not conduct an in-depth analysis of the influencing factors at the provincial, city, and county scales. In further research, it is necessary to spatially visualize the spatial distribution of influencing factors, especially human activities, and further analyze the spatial distribution of influencing factors. At last, the soil erosion in the YRB is the most intense in June, July, and August, and NDVI has a stronger explanatory power than slope, while from October to March, the soil erosion intensity is smaller, and slope has a stronger explanatory power than NDVI [10]. Therefore, data with higher precision and temporal resolution should be collected in future research to explore the seasonal changes in soil erosion and its influencing factors.
5. Conclusions
- In 2000, 2005, 2010, 2015, and 2020, the soil erosion modulus in the YRB were 1877.69, 1641.59, 1485.25, 844.84, and 832.07 t·km−2·a−1, respectively. The soil erosion modulus of YRB showed a downward trend as a whole, and the downward trend was the most obvious from 2010 to 2015.
- From 2000 to 2020, the areas with severe soil erosion in the YRB were mainly concentrated in the three provinces of Gansu, Shanxi, and Shaanxi, and generally showed a northeast-southwest trend, and were distributed in the hilly areas and loess tableland in the middle of the Loess Plateau.
- The overall q value of soil erosion drivers in the YRB showed a decrease trend, but the ranking of LU/LC in the influencing factors kept rising. From the YRB scale to the county scale, the q values of the influencing factors tend to increase, and human activities can have a greater impact on soil erosion at smaller scales.
- Soil erosion in the YRB was most affected by FVC, Landform, and LU/LC. The FVC explained about 15% of soil erosion, and the interaction between FVC and Landform explained up to 35% of soil erosion.
- The increasing ability of human activities to influence soil erosion is more pronounced at small scales. Therefore, the governance of soil erosion should strengthen the governance of small areas and give more play to the positive impact of human activities.
Author Contributions
Conceptualization, Z.Y.; methodology, Z.Y.; software, Z.Y.; validation, Z.Y. and J.C.; formal analysis, Z.Y. and J.C.; investigation, J.C.; resources, J.C. and Y.H.; data curation, Z.Y. and Y.H.; writing—original draft preparation, Z.Y.; writing—review and editing, Z.Y. and J.C.; visualization, Z.Y.; supervision, J.C.; project administration, Z.Y.; funding acquisition, J.C. All authors have read and agreed to the published version of the manuscript.
Funding
This research was funded by the National Natural Science Foundation of China, grant number 72104130; the National Social Science Foundation of China, grant number 18BJY086, and the Natural Science Foundation of Shandong Province, China, grant number ZR2012DM009.
Institutional Review Board Statement
Not applicable.
Informed Consent Statement
Not applicable.
Data Availability Statement
Not applicable.
Acknowledgments
The data set is provided by National Tibetan Plateau Data Center (http://data.tpdc.ac.cn, accessed on 17 April 2022), Resource and Environment Science and Data Center (https://www.resdc.cn, accessed on 24 December 2021) etc.
Conflicts of Interest
The authors declare no conflict of interest.
References
- Tilahun, M.; Singh, A.; Apindi, E.; Shaure, M.; Libera, J.; Lund, G. The Economics of Land Degradation Neutrality in Asia: Empirical Analyses and Policy Implications for the Sustainable Development Goals; German Federal Ministry for Economic Cooperation and Development (BMZ): Bonn, Germany, 2018.
- Panagos, P.; Katsoyiannis, A. Soil erosion modelling: The new challenges as the result of policy developments in Europe. Environ. Res. 2019, 172, 470–474. [Google Scholar] [CrossRef] [PubMed]
- Pravalie, R.; Patriche, C.; Borrelli, P.; Panagos, P.; Rosca, B.; Dumitrascu, M.; Nita, I.A.; Savulescu, I.; Birsan, M.V.; Bandoc, G. Arable lands under the pressure of multiple land degradation processes. A global perspective. Environ. Res. 2021, 194, 110697. [Google Scholar] [CrossRef]
- Borrelli, P.; Alewell, C.; Alvarez, P.; Anache, J.A.A.; Baartman, J.; Ballabio, C.; Bezak, N.; Biddoccu, M.; Cerdà, A.; Chalise, D.; et al. Soil erosion modelling: A global review and statistical analysis. Sci. Total Environ. 2021, 780, 146494. [Google Scholar] [CrossRef] [PubMed]
- Borrelli, P.; Robinson, D.A.; Fleischer, L.R.; Lugato, E.; Ballabio, C.; Alewell, C.; Meusburger, K.; Modugno, S.; Schütt, B.; Ferro, V.; et al. An assessment of the global impact of 21st century land use change on soil erosion. Nat. Commun. 2017, 8, 2013. [Google Scholar] [CrossRef]
- Nie, X.J.; Zhang, H.B.; Su, Y.Y. Soil carbon and nitrogen fraction dynamics affected by tillage erosion. Sci. Rep. 2019, 9, 16601. [Google Scholar] [CrossRef] [PubMed]
- Wuepper, D.; Borrelli, P.; Finger, R. Countries and the global rate of soil erosion. Nat. Sustain. 2020, 3, 51–55. [Google Scholar] [CrossRef]
- Xiao, H.B.; Li, Z.W.; Chang, X.F.; Huang, B.; Nie, X.D.; Liu, C.; Liu, L.; Wang, D.Y.; Jiang, J.Y. The mineralization and sequestration of organic carbon in relation to agricultural soil erosion. Geoderma 2018, 329, 73–81. [Google Scholar] [CrossRef]
- Guo, L.J.; Liu, R.M.; Men, C.; Wang, Q.R.; Miao, Y.X.; Shoaib, M.; Wang, Y.F.; Jiao, L.J.; Zhang, Y. Multiscale spatiotemporal characteristics of landscape patterns, hotspots, and influencing factors for soil erosion. Sci. Total Environ. 2021, 779, 146474. [Google Scholar] [CrossRef]
- Li, H.C.; Guan, Q.Y.; Sun, Y.F.; Wang, Q.Z.; Liang, L.S.; Ma, Y.R.; Du, Q.Q. Spatiotemporal analysis of the quantitative attribution of soil water erosion in the upper reaches of the Yellow River Basin based on the RUSLE-TLSD model. Catena 2022, 212, 106081. [Google Scholar] [CrossRef]
- Hu, T.; Wu, J.S.; Li, W.F. Assessing relationships of ecosystem services on multi-scale: A case study of soil erosion control and water yield in the Pearl River Delta. Ecol. Indic. 2019, 99, 193–202. [Google Scholar] [CrossRef]
- Li, Q.; Zhou, Y.; Wang, L.; Zuo, Q.; Yi, S.Q.; Liu, J.Y.; Su, X.P.; Xu, T.; Jiang, Y. The Link between Landscape Characteristics and Soil Losses Rates over a Range of Spatiotemporal Scales: Hubei Province, China. Int. J. Environ. Res. Public Health 2021, 18, 11044. [Google Scholar] [CrossRef] [PubMed]
- Zisopoulou, K.; Zisopoulos, D.; Panagoulia, D. Water Economics: An In-Depth Analysis of the Connection of Blue Water with Some Primary Level Aspects of Economic Theory I. Water 2022, 14, 103. [Google Scholar] [CrossRef]
- Zarris, D.; Vlastara, M.; Panagoulia, D. Sediment Delivery Assessment for a Transboundary Mediterranean Catchment: The Example of Nestos River Catchment. Water Resour. Manag. 2011, 25, 3785–3803. [Google Scholar] [CrossRef]
- Alewell, C.; Borrelli, P.; Meusburger, K.; Panagos, P. Using the USLE: Chances, challenges and limitations of soil erosion modelling. Int. Soil Water Conserv. Res. 2019, 7, 203–225. [Google Scholar] [CrossRef]
- Wang, L.; Zhang, F.; Fu, S.H.; Shi, X.N.; Chen, Y.; Jagirani, M.D.; Zeng, C. Assessment of soil erosion risk and its response to climate change in the mid-Yarlung Tsangpo River region. Environ. Sci. Pollut. Res. 2020, 27, 607–621. [Google Scholar] [CrossRef] [PubMed]
- Teng, H.F.; Liang, Z.Z.; Chen, S.C.; Liu, Y.; Rossel, R.A.V.; Chappell, A.; Yu, W.; Shi, Z. Current and future assessments of soil erosion by water on the Tibetan Plateau based on RUSLE and CMIP5 climate models. Sci. Total Environ. 2018, 635, 673–686. [Google Scholar] [CrossRef] [PubMed]
- Guo, X.J.; Shao, Q.Q. Spatial Pattern of Soil Erosion Drivers and the Contribution Rate of Human Activities on the Loess Plateau from 2000 to 2015: A Boundary Line from Northeast to Southwest. Remote Sens. 2019, 11, 2429. [Google Scholar] [CrossRef]
- Zhao, G.J.; Gao, P.; Tian, P.; Sun, W.Y.; Hu, J.F.; Mu, X.M. Assessing sediment connectivity and soil erosion by water in a representative catchment on the Loess Plateau, China. Catena 2020, 185, 104284. [Google Scholar] [CrossRef]
- Yu, S.C.; Wang, F.; Qu, M.; Yu, B.H.; Zhao, Z. The Effect of Land Use/Cover Change on Soil Erosion Change by Spatial Regression in Changwu County on the Loess Plateau in China. Forests 2021, 12, 1209. [Google Scholar] [CrossRef]
- Xia, L.; Bi, R.T.; Song, X.Y.; Lv, C.J. Dynamic changes in soil erosion risk and its driving mechanism: A case study in the Loess Plateau of China. Eur. J. Soil Sci. 2021, 72, 1312–1331. [Google Scholar] [CrossRef]
- Zhu, D.Y.; Xiong, K.N.; Xiao, H. Multi-time scale variability of rainfall erosivity and erosivity density in the karst region of southern China 1960–2017. Catena 2021, 197, 104977. [Google Scholar] [CrossRef]
- Wang, H.; Gao, J.B.; Hou, W.J. Quantitative attribution analysis of soil erosion in different morphological types of geomorphology in karst areas: Based on the geographical detector method. Acta Geogr. Sin. 2018, 73, 1674–1686. Available online: http://www.geog.com.cn/CN/10.11821/dlxb201809005 (accessed on 8 June 2021).
- Liang, S.Z.X.; Fang, H.Y. Quantitative analysis of driving factors in soil erosion using geographic detectors in Qiantang River catchment, Southeast China. J. Soils Sediments 2021, 21, 134–147. [Google Scholar] [CrossRef]
- Liu, W.; Zhan, J.; Zhao, F.; Wang, C.; Zhang, F.; Teng, Y.; Chu, X.; Kumi, M.A. Spatio-temporal variations of ecosystem services and their drivers in the Pearl River Delta, China. J. Clean. Prod. 2022, 337, 130466. [Google Scholar] [CrossRef]
- Mhaske, S.N.; Pathak, K.; Basak, A. A comprehensive design of rainfall simulator for the assessment of soil erosion in the laboratory. Catena 2019, 172, 408–420. [Google Scholar] [CrossRef]
- Mohamadi, M.A.; Kavian, A. Effects of rainfall patterns on runoff and soil erosion in field plots. Int. Soil Water Conserv. Res. 2015, 3, 273–281. [Google Scholar] [CrossRef]
- Fotheringham, A.; Charlton, M.; Brunsdon, C. Geographically weighted regression. Technometrics 2006, 48. [Google Scholar]
- Stein, C.; Morris, N.; Nock, N. Structural Equation Modeling. Methods Mol. Biol. 2012, 850, 495–512. [Google Scholar] [CrossRef]
- Wang, J.F.; Xu, C.D. Geodetector: Principle and prospective. Acta Geogr. Sin. 2017, 72, 116–134. Available online: http://www.geog.com.cn/EN/10.11821/dlxb201701010 (accessed on 10 December 2021).
- Meng, X.Y.; Gao, X.; Lei, J.Q.; Li, S. Development of a multiscale discretization method for the geographical detector model. Int. J. Geogr. Inf. Sci. 2021, 35, 1650–1675. [Google Scholar] [CrossRef]
- Song, Y.Z.; Wang, J.F.; Ge, Y.; Xu, C.D. An optimal parameters-based geographical detector model enhances geographic characteristics of explanatory variables for spatial heterogeneity analysis: Cases with different types of spatial data. GIScience Remote Sens. 2020, 57, 593–610. [Google Scholar] [CrossRef]
- Ren, Z.G.; Tian, Z.H.; Wei, H.T.; Liu, Y.; Yu, Y.P. Spatiotemporal evolution and driving mechanisms of vegetation in the Yellow River Basin, China during 2000–2020. Ecol. Indic. 2022, 138, 108832. [Google Scholar] [CrossRef]
- Yellow River Conservancy Commission of the Ministry of Water Resources. Soil and Water Conservation Bulletin in Yellow River Basin(2020). 2022. Available online: http://www.yrcc.gov.cn/sylm/2022stbcgb/2022stbcgbgb/202201/P020220128314295348360.pdf (accessed on 20 May 2022).
- Wang, Z.L. Analysis of Affecting Factors of Soil Erosion and Its Harms in China. Trans. Chin. Soc. Agric. Eng. 2000, 16, 32–36. [Google Scholar]
- Wang, Y.; Liu, X.R.; Zhou, X.H.; Guo, X.Y. Consideration on Construction of Disaster Prevention System in Urban Underground Space afer Heavy. Chin. J. Undergr. Space Eng. 2022, 18, 28–34. [Google Scholar]
- Deng, L.; Kim, D.G.; Li, M.Y.; Huang, C.B.; Liu, Q.Y.; Cheng, M.; Shangguan, Z.P.; Peng, C.H. Land-use changes driven by ‘Grain for Green’ program reduced carbon loss induced by soil erosion on the Loess Plateau of China. Glob. Planet. Change 2019, 177, 101–115. [Google Scholar] [CrossRef]
- Chen, T.D.; Jiao, J.; Wang, H.L.; Zhao, C.J.; Lin, H. Progress in Research on Soil Erosion in Qinghai-Tibet Plateau. Acta Pedol. Sin. 2020, 57, 547–564. [Google Scholar]
- Shangguan, W.; Dai, Y.J. A China Soil Characteristics Dataset (2010). 2019. Available online: https://data.tpdc.ac.cn/en/data/8333eed3-dd42-4c9f-90a0-6255cb94ce4f/ (accessed on 17 April 2022).
- Shangguan, W.; Dai, Y.J.; Liu, B.Y.; Ye, A.Z.; Yuan, H. A soil particle-size distribution dataset for regional land and climate modelling in China. Geoderma 2012, 171, 85–91. [Google Scholar] [CrossRef]
- Meng, X.; Wang, H. Siol Map Based Harmonized World Soil Database (v1.2). 2018. Available online: https://data.tpdc.ac.cn/en/data/844010ba-d359-4020-bf76-2b58806f9205/?q=HWSD (accessed on 17 April 2022).
- Zhang, W.; Xie, Y.; Liu, B. Estimation of rainfall erosivity using rainfall amount and rainfall intensity. Geogr. Res. 2002, 21, 384–390. [Google Scholar]
- Sun, W.Y.; Shao, Q.Q.; Liu, J.Y.; Zhai, J. Assessing the effects of land use and topography on soil erosion on the Loess Plateau in China. Catena 2014, 121, 151–163. [Google Scholar] [CrossRef]
- Tian, P.; Zhu, Z.L.; Yue, Q.M.; He, Y.; Zhang, Z.Y.; Hao, F.H.; Guo, W.Z.; Chen, L.; Liu, M.X. Soil erosion assessment by RUSLE with improved P factor and its validation: Case study on mountainous and hilly areas of Hubei Province, China. Int. Soil Water Conserv. Res. 2021, 9, 433–444. [Google Scholar] [CrossRef]
- Lin, J.K.; Guan, Q.Y.; Tian, J.; Wang, Q.Z.; Tan, Z.; Li, Z.J.; Wang, N. Assessing temporal trends of soil erosion and sediment redistribution in the Hexi Corridor region using the integrated RUSLE-TLSD model. Catena 2020, 195, 104756. [Google Scholar] [CrossRef]
- Xie, Y.; Liu, B.Y.; Zhang, W.B. Study on standard of erosive rainfall. J. Soil Water Conserv. 2000, 14, 6–11. [Google Scholar]
- Wang, B.; Zheng, F.L.; Guan, Y.H. Improved USLE-K factor prediction: A case study on water erosion areas in China. Int. Soil Water Conserv. Res. 2016, 4, 168–176. [Google Scholar] [CrossRef]
- Williams, J.R.; Jones, C.A.; Dyke, P.T. A modelling approach to determining the relationship between erosion and soil productivity. Trans. ASAE 1984, 27, 129–144. [Google Scholar] [CrossRef]
- Zhang, K.; Li, S.; Peng, W.; Yu, B. Erodibility of agricultural soils on the Loess Plateau of China. Soil Tillage Res. 2004, 76, 157–165. [Google Scholar] [CrossRef]
- Zhang, K.L.; Shu, A.P.; Xu, X.L.; Yang, Q.K.; Yu, B. Soil erodibility and its estimation for agricultural soils in China. J. Arid. Environ. 2008, 72, 1002–1011. [Google Scholar] [CrossRef]
- McCool, D.K.; Brown, L.C.; Foster, G.R.; Mutchler, C.K.; Meyer, L.D. Revised Slope Steepness Factor for the Universal Soil Loss Equation. Trans. ASAE 1987, 30, 1387–1396. [Google Scholar] [CrossRef]
- Liu, B.Y.; Nearing, M.A.; Risse, L.M. Slope Gradient Effects on Soil Loss for Steep Slopes. Trans. ASAE 1994, 37, 1835–1840. [Google Scholar] [CrossRef]
- Cai, C.F.; Ding, S.W.; Shi, Z.H.; Huang, L.; Zhang, G.Y. Study of applying USLE and geographical information system IDRISI to predict soil erosion in small watershed. J. Soil Water Conserv. 2000, 14, 19–24. [Google Scholar]
- Gutman, G.; Ignatov, A. The derivation of the green vegetation fraction from NOAA/AVHRR data for use in numerical weather prediction models. Int. J. Remote Sens. 1998, 19, 1533–1543. [Google Scholar] [CrossRef]
- Lufafa, A.; Tenywa, M.M.; Isabirye, M.; Majaliwa, M.J.G.; Woomer, P.L. Prediction of soil erosion in a Lake Victoria basin catchment using a GIS-based Universal Soil Loss model. Agric. Syst. 2003, 76, 883–894. [Google Scholar] [CrossRef]
- Fu, B.J.; Zhao, W.W.; Chen, L.D.; Zhang, Q.J.; Lü, Y.H.; Gulinck, H.; Poesen, J. Assessment of soil erosion at large watershed scale using RUSLE and GIS: A case study in the Loess Plateau of China. Land Degrad. Dev. 2005, 16, 73–85. [Google Scholar] [CrossRef]
- Xiao, Y.; Guo, B.; Lu, Y.F.; Zhang, R.; Zhang, D.F.; Zhen, X.Y.; Chen, S.T.; Wu, H.W.; Wei, C.X.; Yang, L.A.; et al. Spatial-temporal evolution patterns of soil erosion in the Yellow River Basin from 1990 to 2015: Impacts of natural factors and land use change. Geomat. Nat. Hazards Risk 2021, 12, 103–122. [Google Scholar] [CrossRef]
- Wang, H.; Zhao, H. Dynamic Changes of Soil Erosion in the Taohe River Basin Using the RUSLE Model and Google Earth Engine. Water 2020, 12, 1293. [Google Scholar] [CrossRef]
- Ministry of Water Resources of the People’s Republic of China. SL190-2007 Standards of Classification of Soil Erosion; Soil and Water Conservation Division: Beijing, China, 2007.
- Zhou, J.; Fu, B.J.; Gao, G.Y.; Lü, Y.H.; Liu, Y.; Lü, N.; Wang, S. Effects of precipitation and restoration vegetation on soil erosion in a semi-arid environment in the Loess Plateau, China. Catena 2016, 137, 1–11. [Google Scholar] [CrossRef]
- Sun, W.Y.; Shao, Q.Q.; Liu, J.Y. Soil erosion and its response to the changes of precipitation and vegetation cover on the Loess Plateau. J. Geogr. Sci. 2013, 23, 1091–1106. [Google Scholar] [CrossRef]
- Wu, H.W.; Guo, B.; Xue, H.R.; Zang, W.Q.; Han, B.M.; Yang, F.; Lu, Y.F.; Wei, C.X. What are the dominant influencing factors on the soil erosion evolution process in the Yellow River Basin? Earth Sci. Inform. 2021, 14, 1899–1915. [Google Scholar] [CrossRef]
- Yan, R.; Zhang, X.P.; Yan, S.J.; Chen, H. Estimating soil erosion response to land use/cover change in a catchment of the Loess Plateau, China. Int. Soil Water Conserv. Res. 2018, 6, 13–22. [Google Scholar] [CrossRef]
- Gao, H.D.; Li, Z.B.; Jia, L.L.; Li, P.; Xu, G.C.; Ren, Z.P.; Pang, G.W.; Zhao, B.H. Capacity of soil loss control in the Loess Plateau based on soil erosion control degree. J. Geogr. Sci. 2016, 26, 457–472. [Google Scholar] [CrossRef] [Green Version]
- Ma, X.; Li, Y.; Li, B.L.; Han, W.Y.; Liu, D.B.; Gan, X.Z. Nitrogen and phosphorus losses by runoff erosion: Field data monitored under natural rainfall in Three Gorges Reservoir Area, China. Catena 2016, 147, 797–808. [Google Scholar] [CrossRef]
- Teng, M.J.; Huang, C.B.; Wang, P.C.; Zeng, L.X.; Zhou, Z.X.; Xiao, W.F.; Huang, Z.L.; Liu, C.F. Impacts of forest restoration on soil erosion in the Three Gorges Reservoir area, China. Sci. Total Environ. 2019, 697, 134164. [Google Scholar] [CrossRef] [PubMed]
- Liu, Y.F.; Liu, Y.; Shi, Z.H.; López Vicente, M.; Wu, G.L. Effectiveness of re-vegetated forest and grassland on soil erosion control in the semi-arid Loess Plateau. Catena 2020, 195, 104787. [Google Scholar] [CrossRef]
- Ministry of Water Resources of the People’s Republic of China. China River Sediment Gazette. Beijing. Available online: http://xxzx.mwr.gov.cn/xxgk/gbjb/zghlnsgb/ (accessed on 10 May 2022).
- Gao, F.; Li, S.; Tan, Z.Z.; Wu, Z.F.; Zhang, X.M.; Huang, G.P.; Huang, Z.W. Understanding the modifiable areal unit problem in dockless bike sharing usage and exploring the interactive effects of built environment factors. Int. J. Geogr. Inf. Sci. 2021, 35, 1905–1925. [Google Scholar] [CrossRef]
- Swarnkar, S.; Malini, A.; Tripathi, S.; Sinha, R. Assessment of uncertainties in soil erosion and sediment yield estimates at ungauged basins: An application to the Garra River basin, India. Hydrol. Earth Syst. Sci. 2018, 22, 2471–2485. [Google Scholar] [CrossRef] [Green Version]
Figure 1.
Overview of the study area.

Figure 2.
Soil erosion intensity of the YRB.

Figure 3.
Shift in soil erosion intensity: (a) 2000–2005; (b) 2005–2010; (c) 2010–2015; (d) 2015–2020.
Figure 3.
Shift in soil erosion intensity: (a) 2000–2005; (b) 2005–2010; (c) 2010–2015; (d) 2015–2020.

Figure 4.
The soil erosion intensity at the (a–e) province scale, (f–j) city scale, (k–o) county scale from 2000 to 2020.
Figure 4.
The soil erosion intensity at the (a–e) province scale, (f–j) city scale, (k–o) county scale from 2000 to 2020.

Figure 5.
Factor detection results from 2000 to 2020.

Figure 6.
Factor interaction detection results from 2000 to 2020.

Figure 7.
The area ratio of erosion intensity in nine provinces in the YRB in 2020 (the results in the bulletin on the left, the simulation results on the right).
Figure 7.
The area ratio of erosion intensity in nine provinces in the YRB in 2020 (the results in the bulletin on the left, the simulation results on the right).


Table 1.
The p factor estimation of various LU/LC in the YRB.
| LU/LC | p Value |
|---|---|
| Farmland [55,56] | 0.2 + 0.03 × s |
| Forest [43,45] | 1 |
| Grassland [10,43] | |
| Waterbody [57,58] | 0 |
| Construction land [57,58] | |
| Bare rock [10,45] | |
| Sandy land [10,45] | 1 |
| Bare land [10,45] | |
| Gobi Desert [10,45] | |
| Marsh [10,45] | |
| Other types [10,43] |
Table 2.
Soil erosion modulus obtained from previous studies.
| Study Site | Study Time | Soil Erosion (t·km−2·a−1) | Results of This Estimates * | Reference Sources |
|---|---|---|---|---|
| Yanhe Basin | 2010 | 3227 | 2852 | Zhao et al. [19] |
| Loess Plateau | 2000–2015 | 2088.56 | 1868.23 | Guo et al. [18] |
| 2015 | 1373.85 | 1038.79 | ||
| Loess Plateau | 2000–2010 | 1520 | 1608.53 | Sun et al. [61] |
| 2000 | 1424 | 1124 | ||
| Taohe Basin | 2000 | 1424 | 1124 | Wang et al. [58] |
| 2005 | 1195 | 1012 | ||
| 2010 | 1129 | 808 | ||
| The YRB | 1981–2019 | 2255 | 1336 | Wu et al. [62] |
| The Beiluo River basin | 2000 | 7408.93 | 5329.87 | Yan et al. [63] |
| the upper reaches of the YRB | 1982–2019 | 205 | 895 | Li et al. [10] |
| Loess Plateau | 2010 | 3355 | 1986 | Gao et al. [64] |
| Changwu county | 1987–2017 | 1371.27 | 2113.47 | Yu et al. [20] |
Note(s): * The Loess Plateau area calculated in this study is only the Loess Plateau area within the YRB, accounting for 89.53% of the total area of the Loess Plateau.
Publisher’s Note: MDPI stays neutral with regard to jurisdictional claims in published maps and institutional affiliations. |
© 2022 by the authors. Licensee MDPI, Basel, Switzerland. This article is an open access article distributed under the terms and conditions of the Creative Commons Attribution (CC BY) license (https://creativecommons.org/licenses/by/4.0/).
Share and Cite
MDPI and ACS Style
Yin, Z.; Chang, J.; Huang, Y. Multiscale Spatiotemporal Characteristics of Soil Erosion and Its Influencing Factors in the Yellow River Basin. Water 2022, 14, 2658. https://doi.org/10.3390/w14172658
AMA Style
Yin Z, Chang J, Huang Y. Multiscale Spatiotemporal Characteristics of Soil Erosion and Its Influencing Factors in the Yellow River Basin. Water. 2022; 14(17):2658. https://doi.org/10.3390/w14172658
Chicago/Turabian StyleYin, Zuotang, Jun Chang, and Yu Huang. 2022. "Multiscale Spatiotemporal Characteristics of Soil Erosion and Its Influencing Factors in the Yellow River Basin" Water 14, no. 17: 2658. https://doi.org/10.3390/w14172658
Note that from the first issue of 2016, this journal uses article numbers instead of page numbers. See further details here.