Article

137Cs Sediment Profiles as a Tracer of Marine Sedimentation Processes in a Semi-Enclosed Bay Affected by Anthropogenic Releases—Example of Kaštela Bay (Adriatic Sea, Croatia)

by
Ivanka Lovrenčić Mikelić
1,*,
Neven Cukrov
2,
Višnja Oreščanin
3,
Krunoslav Škaro
4 and
Delko Barišić
5
1
Laboratory for Low-Level Radioactivities, Division of Experimental Physics, Ruđer Bošković Institute, Bijenička cesta 54, 10 000 Zagreb, Croatia
2
Laboratory for Physical Chemistry of Traces, Division for Marine and Environmental Research, Ruđer Bošković Institute, Bijenička cesta 54, 10 000 Zagreb, Croatia
3
Advanced Energy Ltd., V. Prekrata 43, 10 000 Zagreb, Croatia
4
Oceanographic Department, Hydrographic Institute of the Republic of Croatia, Zrinsko-Frankopanska 161, 21 000 Split, Croatia
5
Laboratory for Radioecology, Division for Marine and Environmental Research, Ruđer Bošković Institute, Bijenička cesta 54, 10 000 Zagreb, Croatia
*
Author to whom correspondence should be addressed.
Water 2022, 14(17), 2655; https://doi.org/10.3390/w14172655
Submission received: 1 August 2022 / Revised: 23 August 2022 / Accepted: 24 August 2022 / Published: 28 August 2022

Abstract

:
Kaštela Bay was taken as a model to study sedimentation processes using the vertical sediment profiles of 137Cs massic activities. The aim was to distinguish the sedimentation conditions in different parts of the Bay and to partly determine the pathways of terrigenous input into the Bay. The purpose was to demonstrate that 137Cs profiles are applicable in differentiating sedimentation processes. It was found that mostly continuous, undisturbed sedimentation takes place in the central and south parts of the Bay; the sedimentation conditions in the west part of the Bay are more complicated. The west part is characterised by the extremely slow sedimentation of the coarse-grained sediment or even by erosion and selective resuspension of the fine-grained particles followed by resedimentation in other parts of the Bay. It was also observed that the upper 10 cm of the sediment is the most exposed to homogenisation. The strong influence of the Jadro River and anthropogenic activities in the east part of the Bay are reflected in the higher 137Cs activities, strong sediment mixing, and increased sediment input. This study shows that the 137Cs profiles can provide comprehensive insights for the whole study region when a sophisticated sampling layout is deployed. The results of the study are applicable to other aquatic environments with comparable processes and sedimentary environments.

1. Introduction

137Cs was introduced into the global environment as a result of nuclear weapons testing performed after the 1950s, the Chernobyl accident in 1986, and recently the accident in the Fukushima Dai–Ichi nuclear power plant in 2011 [1,2,3]. It is probably the most frequently used anthropogenic radionuclide for monitoring environmental processes [4,5,6]. It is also the most represented anthropogenic gamma emitter in marine environments in which it is especially relevant due to its long residence time. 137Cs mobility is largely dependent on its sorption to sediment surface [7,8]. Particle fluxes, including organic matter, are significantly higher in coastal and more productive waters than in the open ocean, and thus, more 137Cs can be removed by binding to particulate matter in the coastal area [9,10]. In that case, 137Cs behaves as a non-conservative element. Therefore, coastal sediments can be significant 137Cs reservoirs [11]. Since 137Cs is prone to bind with sediment particles, especially with fine-grained mineral particles of clays and organic matter, it is an appropriate sediment tracer and is widely used as a marker radionuclide for sedimentation processes monitoring [6,12,13,14,15,16,17,18,19,20]. Sedimentation processes and sedimentation rates can be researched by studying depth profiles of 137Cs massic activities. To do that, the assumptions are that 137Cs is not chemically mobile, that it does not diffuse, and that there is no bioturbation.
Sedimentation is not a uniform process but a combination of more different processes, which in the end, will be reflected in the sediment profiles. The deposited material is exposed to various influences of currents, waves, organisms, chemical processes, rivers, and anthropogenic activities. Therefore, only a few 137Cs profiles can successfully be preserved to show an ideal and undisturbed distribution, which reflects the atmospheric deposition pattern of 137Cs. In Croatia, an ideal profile would have two distinct 137Cs peaks: the deeper peak representing the sediment surface of 1963 (from nuclear weapons testing) and the shallower peak representing the sediment surface of 1986 (from Chernobyl accident) [16]. The undisturbed profiles are not influenced by the post-depositional processes. It should be noted that the ideal and undisturbed profiles of this shape are characteristic of Croatia and other countries in which 137Cs fallout originating from the Chernobyl accident was more significant than from atmospheric nuclear weapons testing. Such profiles with characteristic marker peaks are used for sedimentation rate estimation and the radiometric dating of sediments [4,21,22]. However, disturbed or non-ideal 137Cs profiles, which cannot be used for sedimentation rate estimation and dating, as well as sediments in which no 137Cs was detected, can still give useful information about sedimentation processes such as erosion, resuspension, resedimentation, focusing, mixing, etc.
Coastal areas are exposed to significant anthropogenic influences. One of such areas is Kaštela Bay and the surrounding area in the Adriatic Sea. The area around Kaštela Bay is highly urbanised and industrialised, exposing the Bay to an increased input of anthropogenic substances such as metals (especially Hg, Cu, Zn, and Pb) [23,24,25,26,27,28,29,30,31,32], radionuclides (especially 226Ra and 238U) [28,33], and nutrients [34,35], especially from the middle of the 20th century to the 1980s. The distribution of all of the substances introduced into the marine environment is, among various factors, controlled by the sedimentation processes and by sedimentary environments that affect the local accumulation of the substance or its dispersion across a wider area. At most locations worldwide, the studies of sedimentation processes using 137Cs profiles were generally limited to a small number of profiles/sampling stations, limiting the use of 137Cs profiles in comprehensive studies of complete systems (e.g., the whole bay) [8,17,36,37,38,39,40]. The same situation applies to Kaštela Bay. Previous research works concerning the sedimentation processes in Kaštela Bay were either limited by the number of profiles or by the applied methods [23,28,41]. Mikac et al. [28] used 137Cs to study the sedimentation processes in the Bay, but the study was limited to four sediment cores and only one location in the Bay.
The aim of this study was to obtain systematic insights into the sedimentation processes in Kaštela Bay, which determine the horizontal and vertical spatial distribution of contaminants, and to determine the possible areas of sediment accumulation in the Bay, i.e., to define sedimentary environments in the Bay, using 137Cs depth profiles. This Bay is interesting because it is a semi-enclosed bay and can easily be studied as a quasi-isolated marine system. It is also exposed both to natural and anthropogenic influences. The purpose of this study is to demonstrate that by using 137Cs profiles, sedimentation processes, different types of sedimentation, sediment sources, and associated influences can be comprehensively studied in a sedimentary system as a whole and that the whole system can be characterised from this point of view. Kaštela Bay will be given as an example showing the application of 137Cs profiles to other aquatic environments with similar sedimentary processes in the world. By studying sedimentation processes, useful information for the best sediment management practices can be obtained at a global and a local scale (e.g., excessive sediment accumulation).

2. Materials and Methods
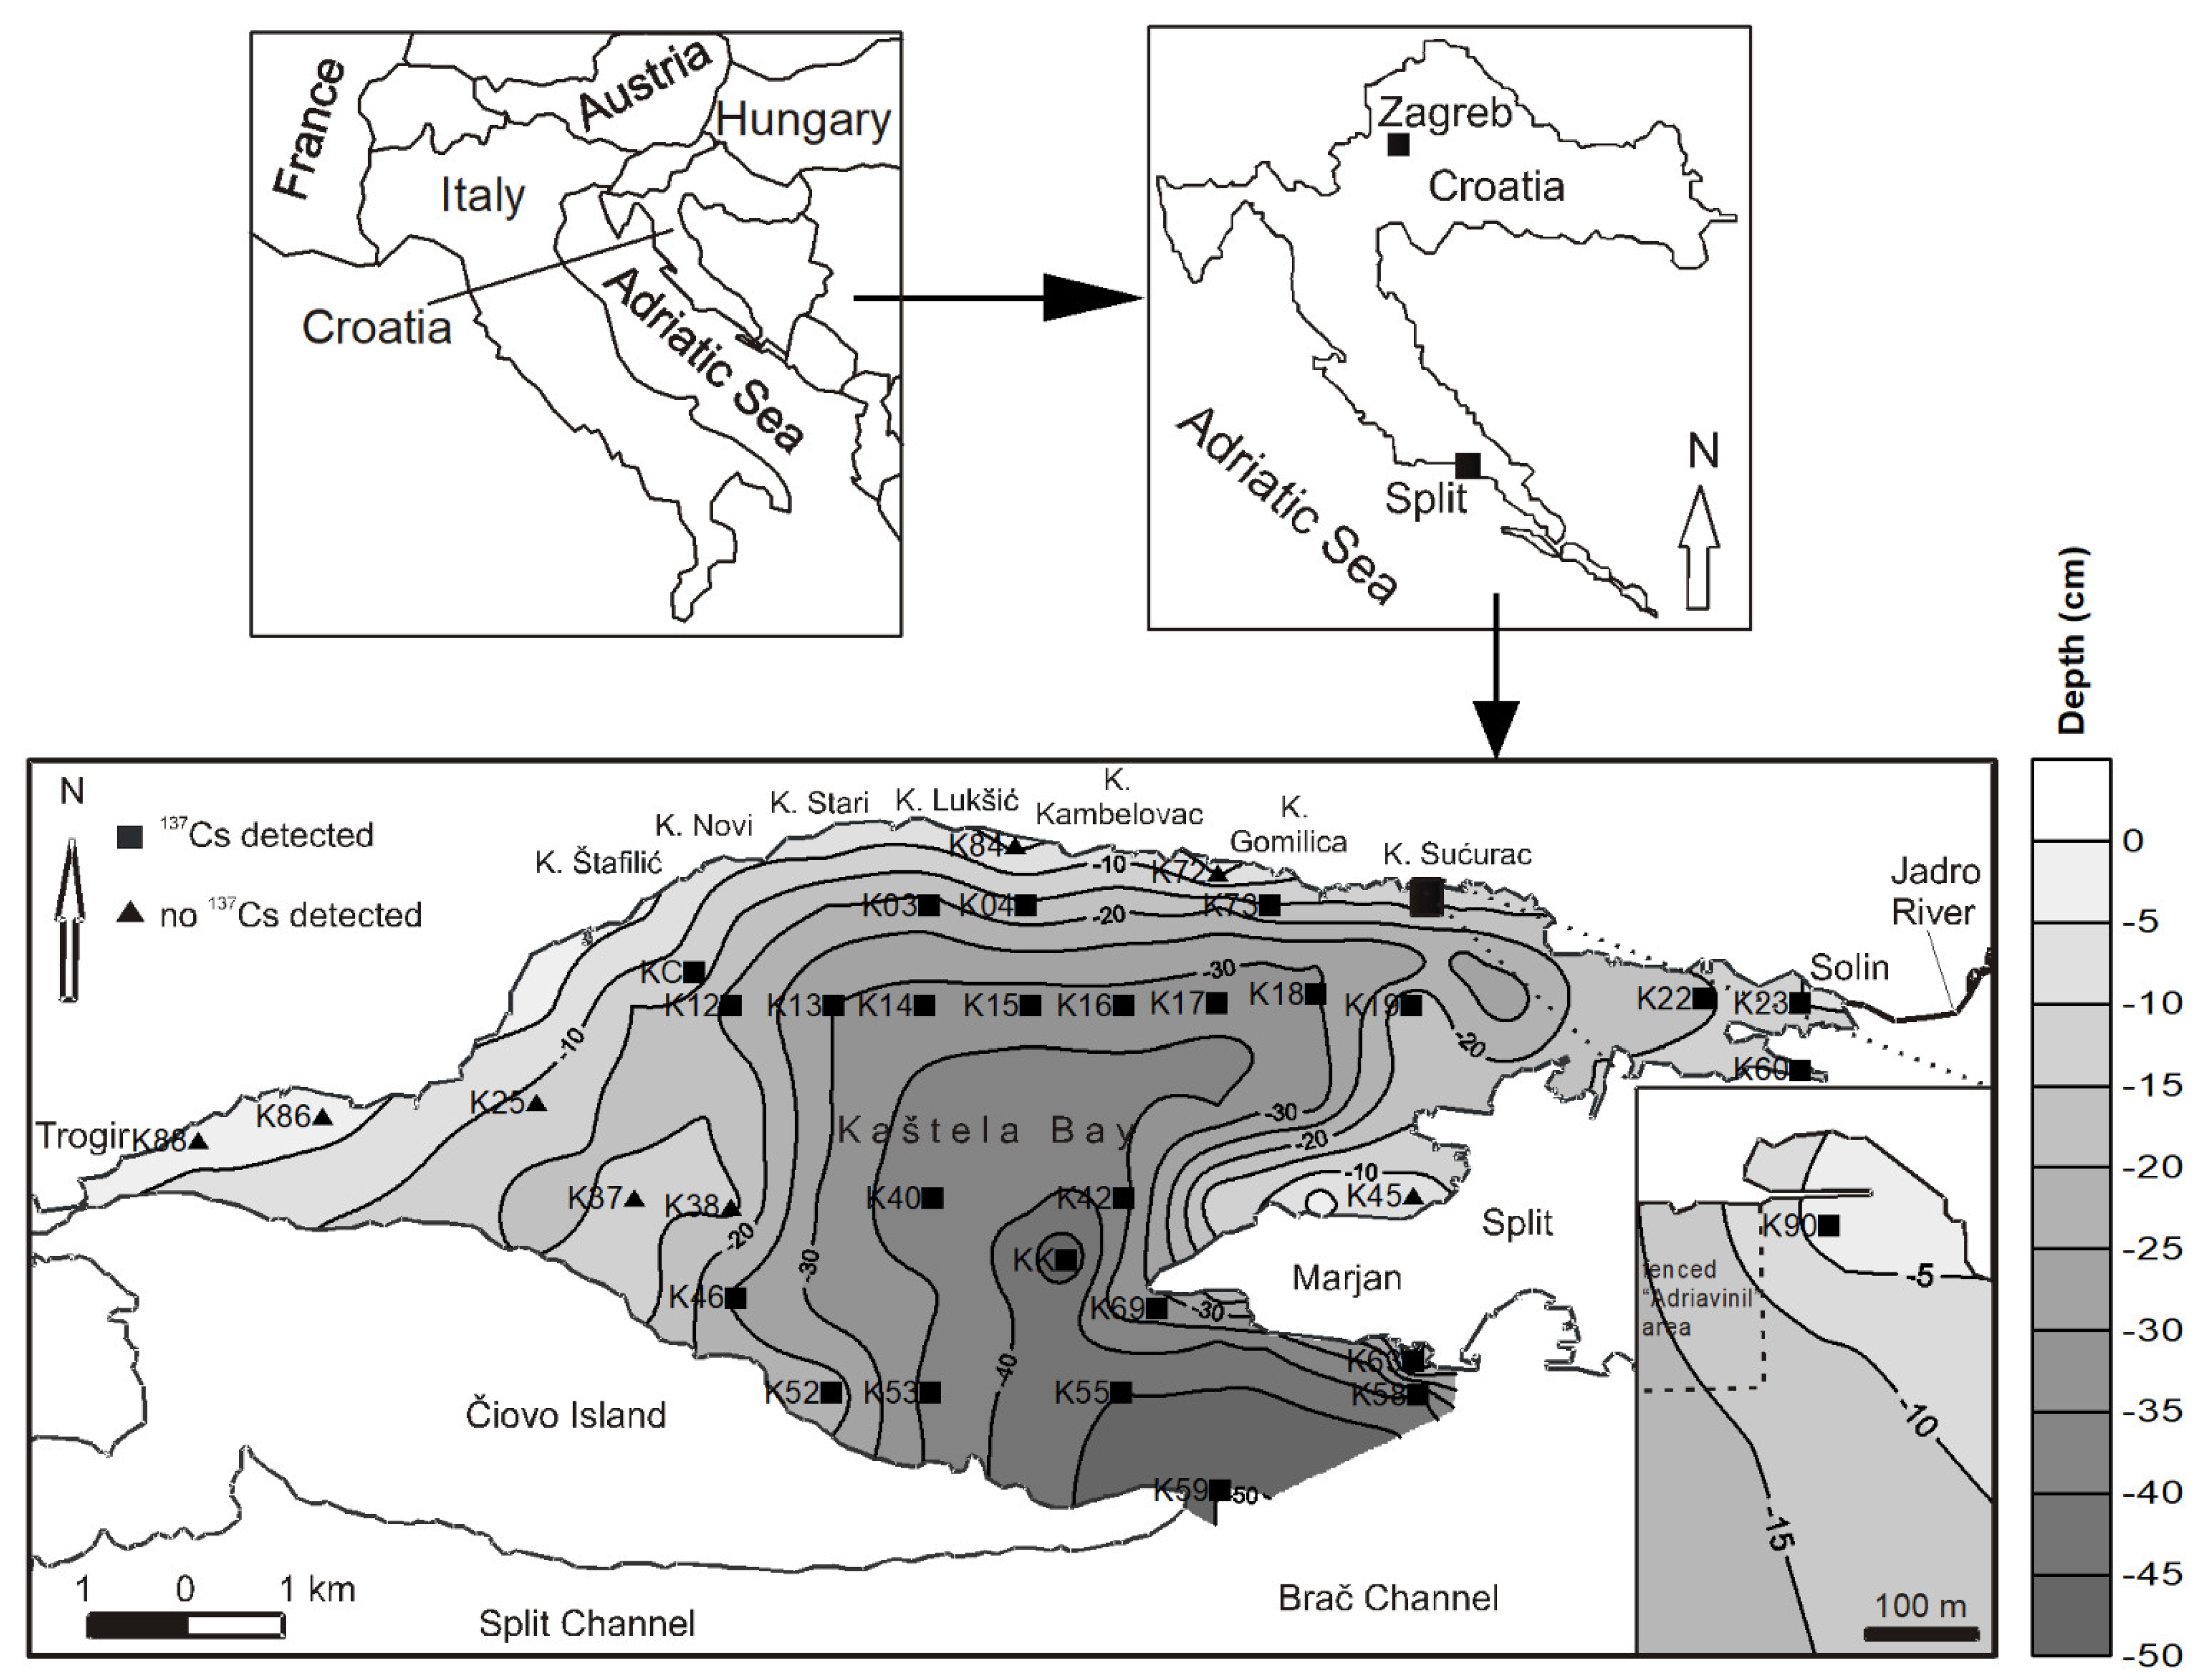
2.1. Study Area

Kaštela Bay is located on the east coast of the central Adriatic Sea, next to the city of Split (Figure 1). It is a semi-enclosed bay, and it represents one of the larger bays on the east Adriatic coast. In its west part, it is connected to Trogir Bay through the narrow Trogir Channel between the mainland and the Čiovo Island, while in the southeast, it is connected to the Split and Brač Channels through a wide passage between the Split peninsula and Čiovo Island. Despite their connection, Kaštela Bay, the Split, and Brač Channels are separate marine basins defined by different ecological characteristics and terrestrial influences [22]. The Bay is 14.8 km long and 6.6 km wide [41]. Its total area is approximately 60 km2, and the average depth is 23 m, with a maximum depth of 45–50 m at the Bay’s entrance, and the volume is estimated to be about 1.4 km3 [26,32,35]. According to the bathymetric and morphological characteristics, two clearly different parts of the Bay can be differentiated: the deeper central–east part and the shallower west part [22] (Figure 1). The only permanent surface stream that flows into the Bay is the Jadro River, bringing the majority of the freshwater into the Bay [35,42].
Kaštela Bay and its surroundings are a part of the large Cretaceous–Tertiary sedimentary basin of the Outer Dinarides. The area is generally built of two types of sediments. The hinterland of the Bay and the Čiovo Island are built of upper Cretaceous limestones, while the coastal area is mostly built of flysch and flysch-like rocks deposited in Eocene [22,43,44,45].

2.2. Sampling

The sampling of the marine sediment was performed at 95 sampling stations between June 2005 and May 2008. Thirty-five stations were selected as representative of the sedimentation processes in the distinctive parts of Kaštela Bay. The morphological characteristics of the sea bottom and expected terrestrial input, including anthropogenic material, were taken into account (Figure 1, Table 1). At each station, the sediment was sampled using a gravity corer at least three times to collect a sufficient number of samples for analysis. The corer characteristics were as follows: length, 1 m; diameter, 41 mm; working depth, to 150 m. Sampling using a gravity corer was not possible at some stations due to the sediment characteristics. It was mostly the case with sandy sediments in shallower parts of the Bay. At these stations, the sampling was performed by autonomous diving, and the samples were taken by a plastic hand corer with the following characteristics: length, 0.5 m; outer diameter, 90 mm; inner diameter, 82 mm. The sediment collection was only operated once for each hand corer sample as the diameter of the hand corer is large enough to acquire a sufficient number of sediment for the subsequent analyses.
The samples were collected to a depth of 0.5 m whenever possible and the sediment cores were sliced according to the corresponding depth. From zero to 0.3 m, the cores were sliced into 5-cm-long segments and from 0.3 to 0.5 m into 10-cm-long segments, i.e., the 0.5-m-long core consists of eight segments or subsamples. The subsamples were placed into labelled plastic bags and transported to the laboratory.

2.3. Gamma–Spectrometry

The samples were dried in a drier at 105 °C overnight, ground in a mill with small agate spherules or crushed in a mortar with a pestle, homogenised, placed into plastic containers of 125 cm3 volume, and weighed. The containers were then sealed. Radiometric analyses were performed for all of the collected samples by the gamma spectrometry technique using hyper-pure germanium semiconductor detectors (HPGe) with relative efficiencies of 25.3% (coaxial detector) and 25.4% (InSpector 2000) coupled with multichannel analysers with 8192 channels (Canberra Industries). The resolution of the coaxial detector at 1332.5 keV (60Co) was 1.75 keV and of InSpector 1.80 keV. The spectra were collected for 80,000 s and analysed with the Genie 2000 software package (Canberra Industries). 137Cs activity was determined from the peak at 661.66 keV. All of the activities were recalculated to the same reference date (6 June 2005).
The point sources of 109Cd, 137Cs (Canberra Industries), and 60Co (Amersham Buchler GmbH & CoKG) were used to obtain the energy and resolution calibrations. Efficiency calibration was performed using the IAEA–313 (stream sediment) and the IAEA–314 (stream sediment) reference materials and a standard reference material of CBSS 2 type (Czech Metrological Institute), whose density and matrix composition corresponded to the composition of the average sediment. An interlaboratory comparison soil reference material (Environmental Resource Associates, MRAD–8) and a standard reference material NIST 4357 (ocean sediment) were used for quality control measurements.

2.4. Determination of Grain Size Composition

The grain size composition of the sediment was determined instrumentally only for the sliced subsamples of the cores taken at the KC and KK stations. These two stations were selected to represent different sedimentary environments, where KC stands for the shallow parts of the Bay, and KK stands for the deep parts. Granulometric analysis was performed using a combination of sieving and Casagrande’s areometric method [22]. The sediment was first wet-sieved on a sieve with a 0.063 mm mesh. The finer fraction that passed through the sieve was analysed by the areometric method. The fraction that remained on the sieve was dried and sieved through sieves with the following meshes: 0.125, 0.5, 1, 2, and 4 mm. Shepard’s [46] and Folk’s [47] classifications were used to determine sediment type.
The grain size composition was also visually estimated on-site for each collected core as a whole. Gravel, sand, and fine-grained particles (comprising clay and silt) were differentiated. The grain size was not estimated for each sliced subsample. Only the specific characteristics of the subsamples were recorded if observed.

2.5. Determination of Organic Matter Mass Fractions

The organic matter mass fractions were determined in all of the collected samples. The sediment was oven-dried at 105 °C overnight, then ground in a mill with agate spherules or in an agate mortar and homogenised. The fractions were determined from loss on ignition at 375 °C.

2.6. Statistical Analysis

The data were statistically analysed using a box and whisker plot to detect extreme values or outliers. The relationship between the organic matter content and 137Cs activities was determined using a scatter plot. The Pearson’s correlation coefficient and determination coefficient are given along with the scatter plot. The correlation coefficient was statistically significant at p < 0.05. The software package, Statistica 7.0 (StatSoft, Inc.), was used for statistical analyses.

3. Results

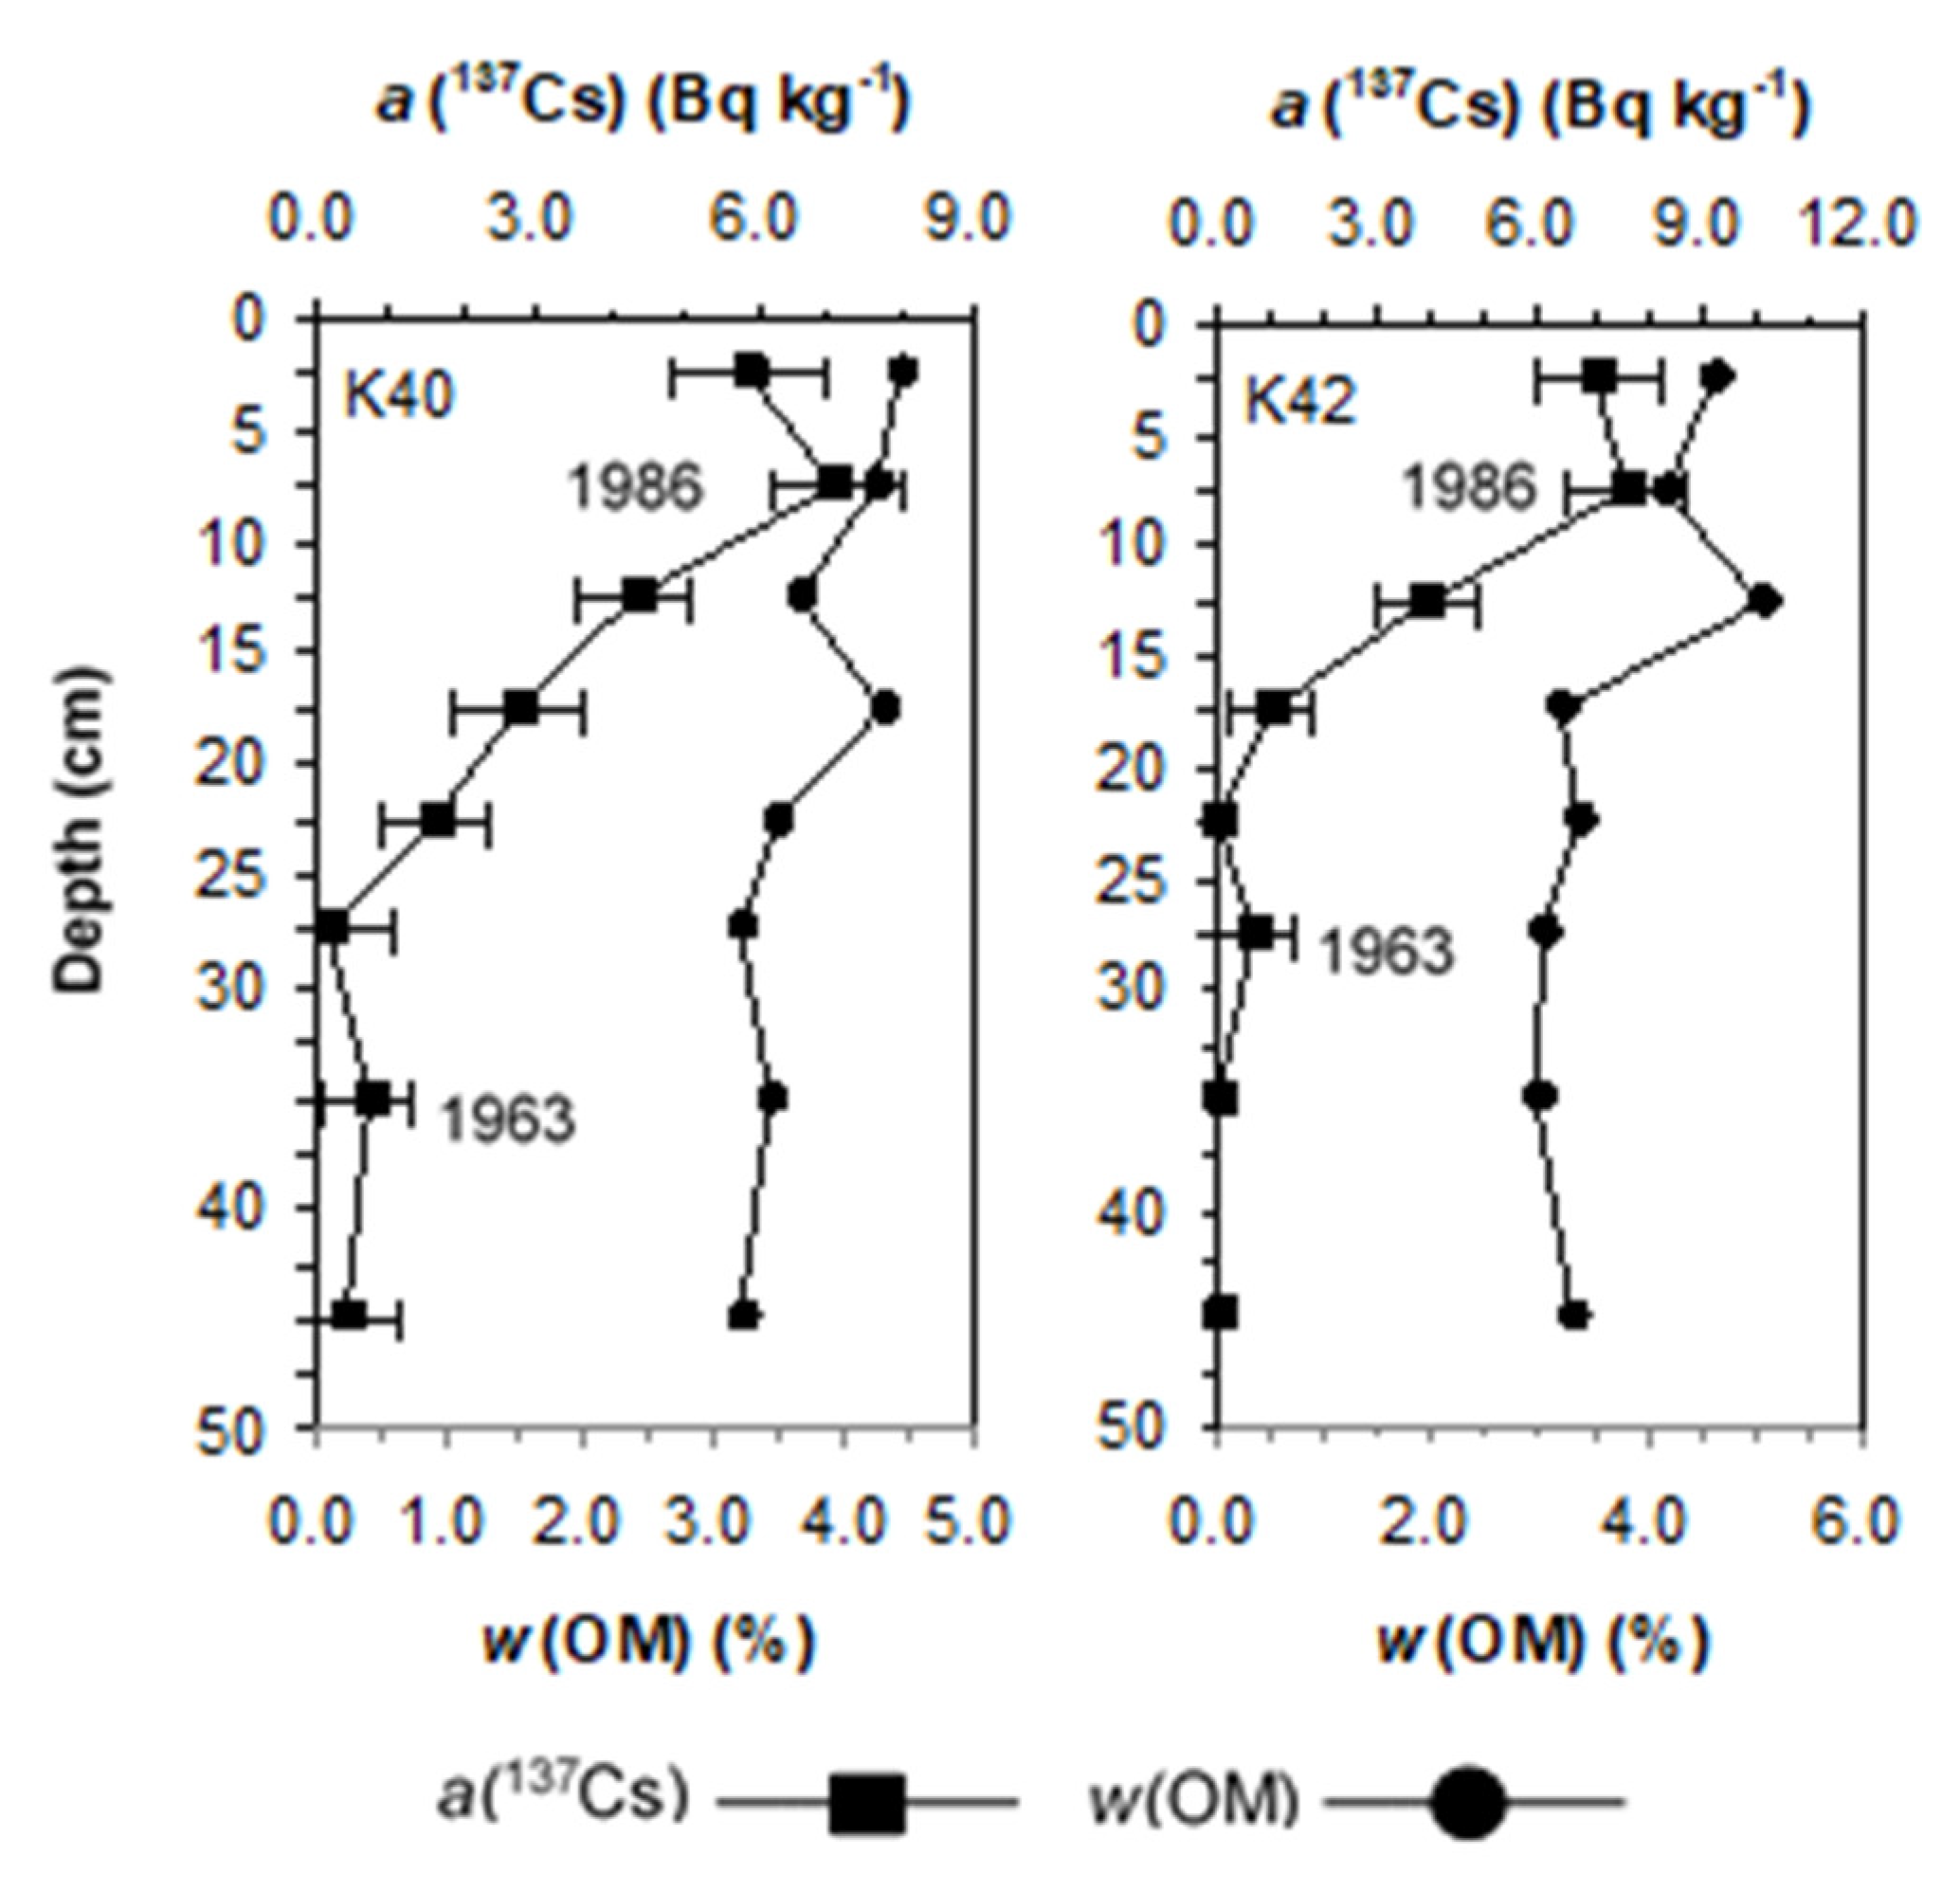
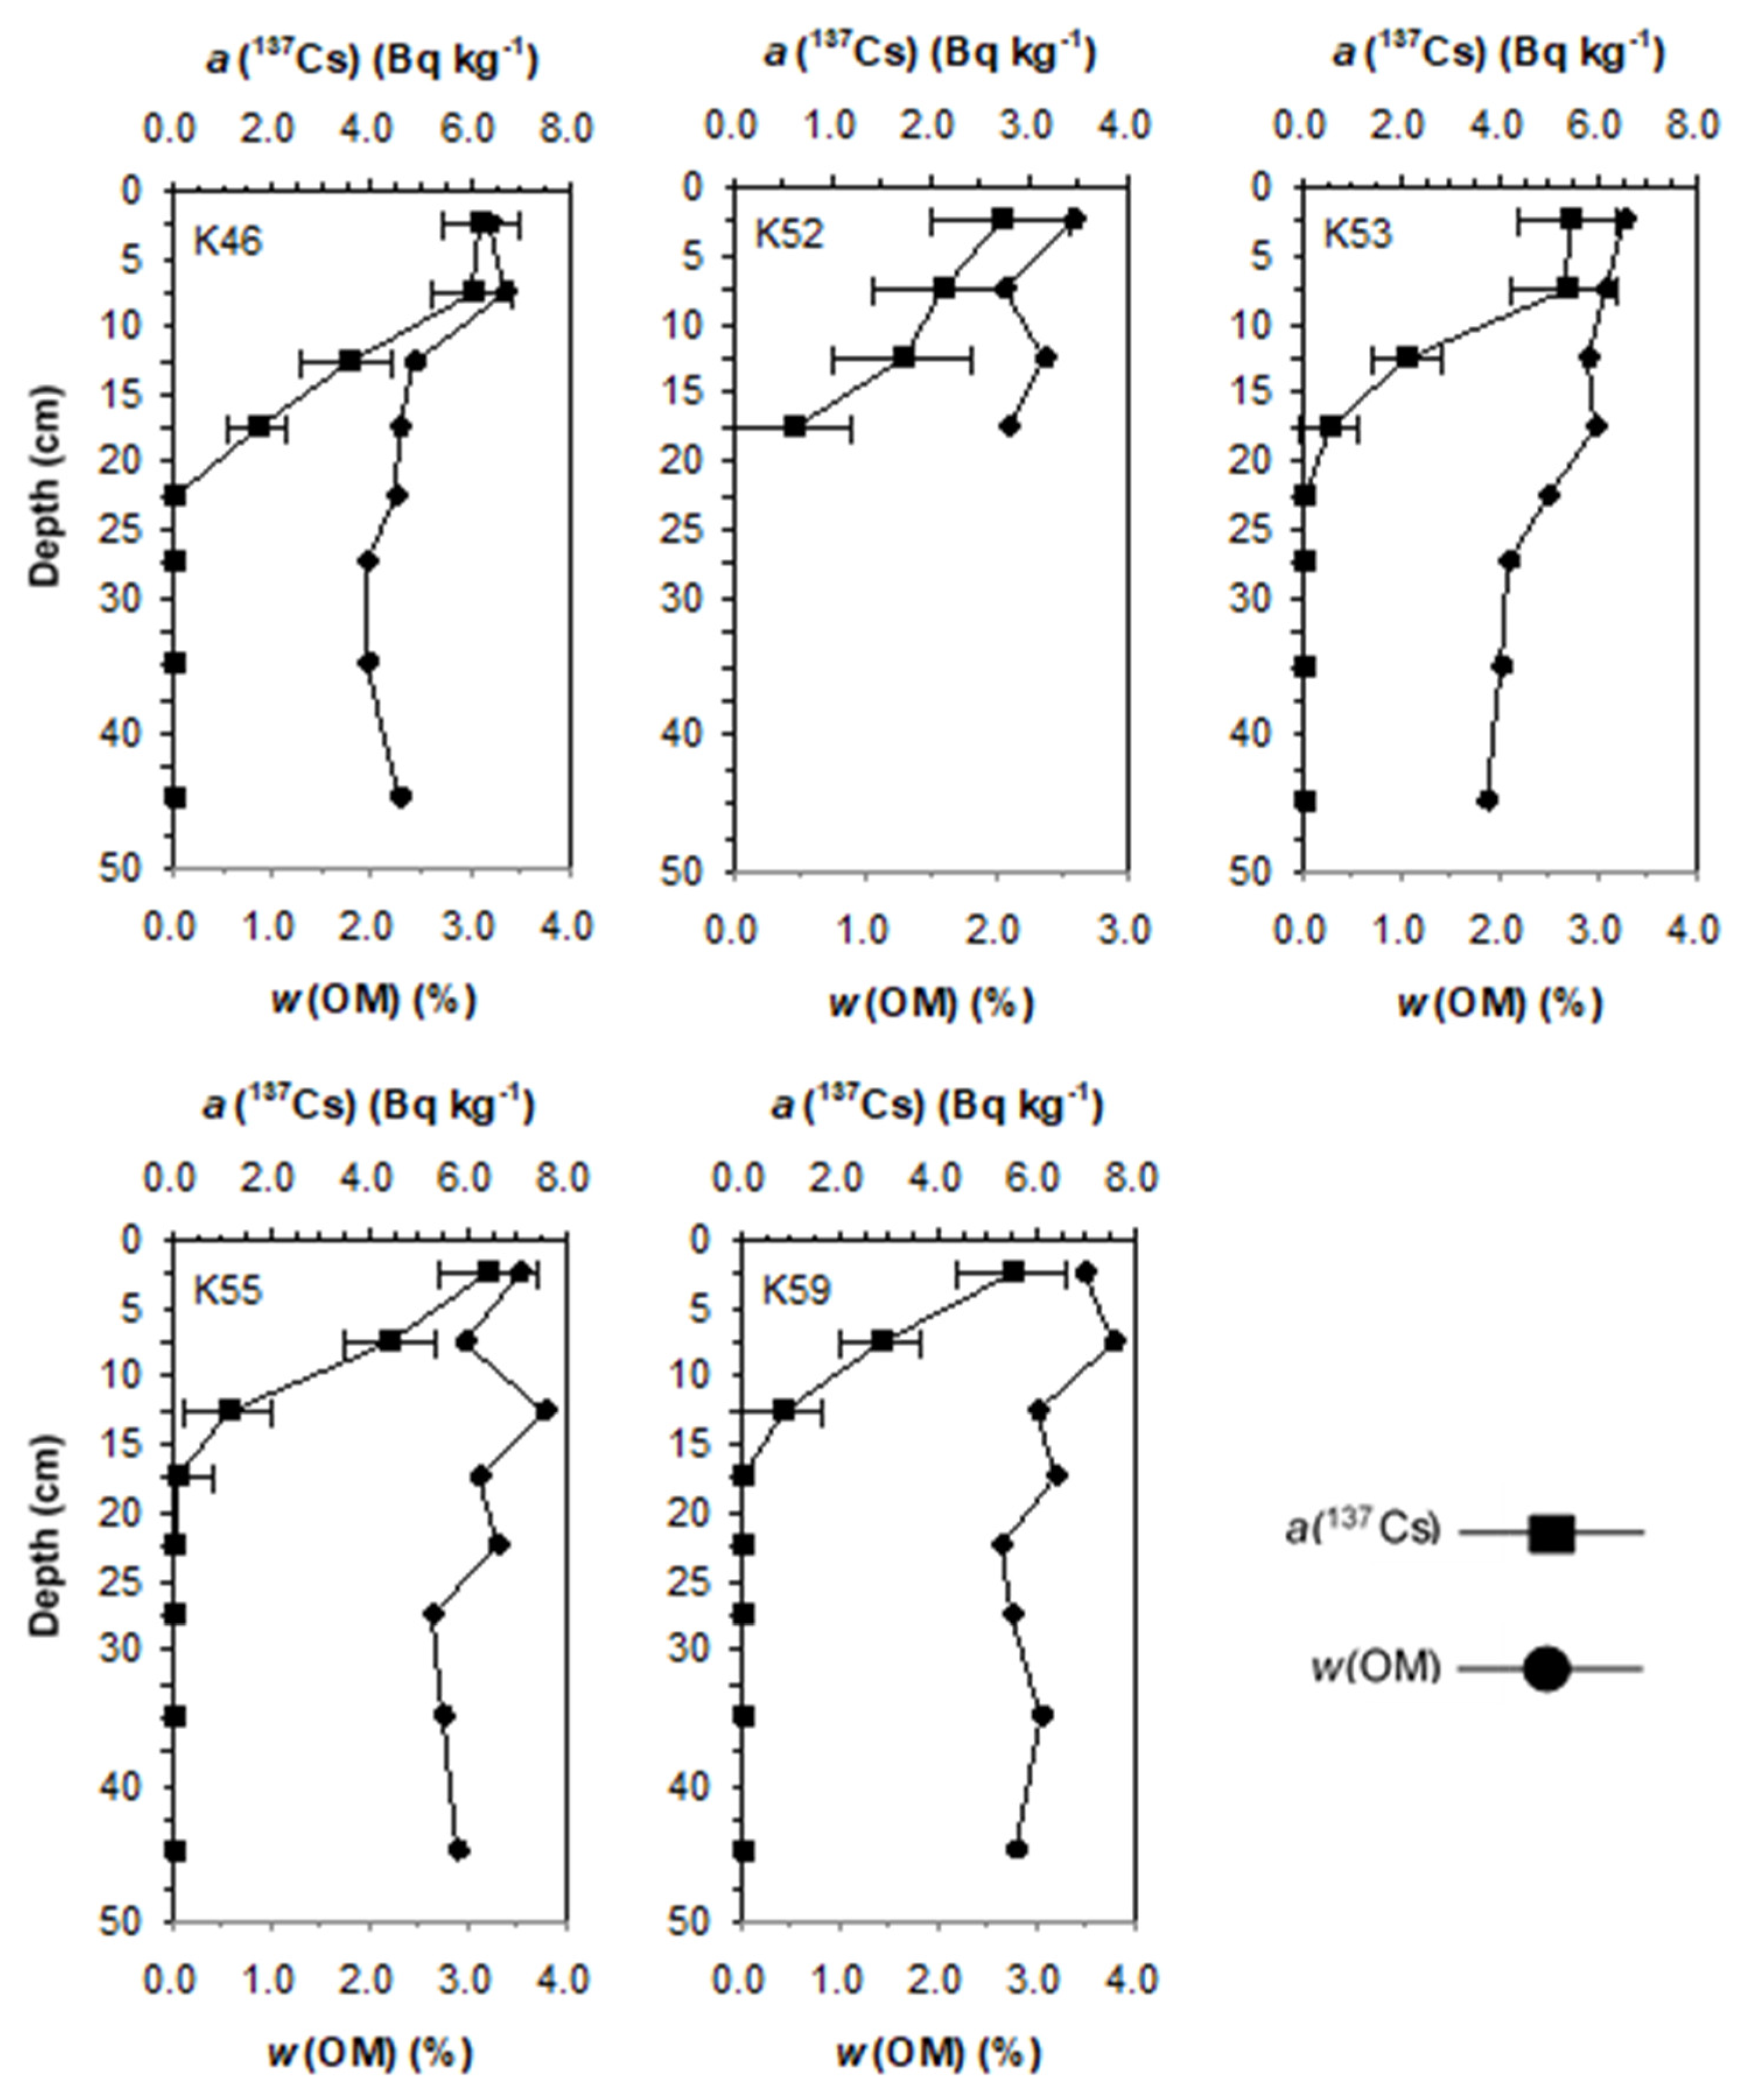
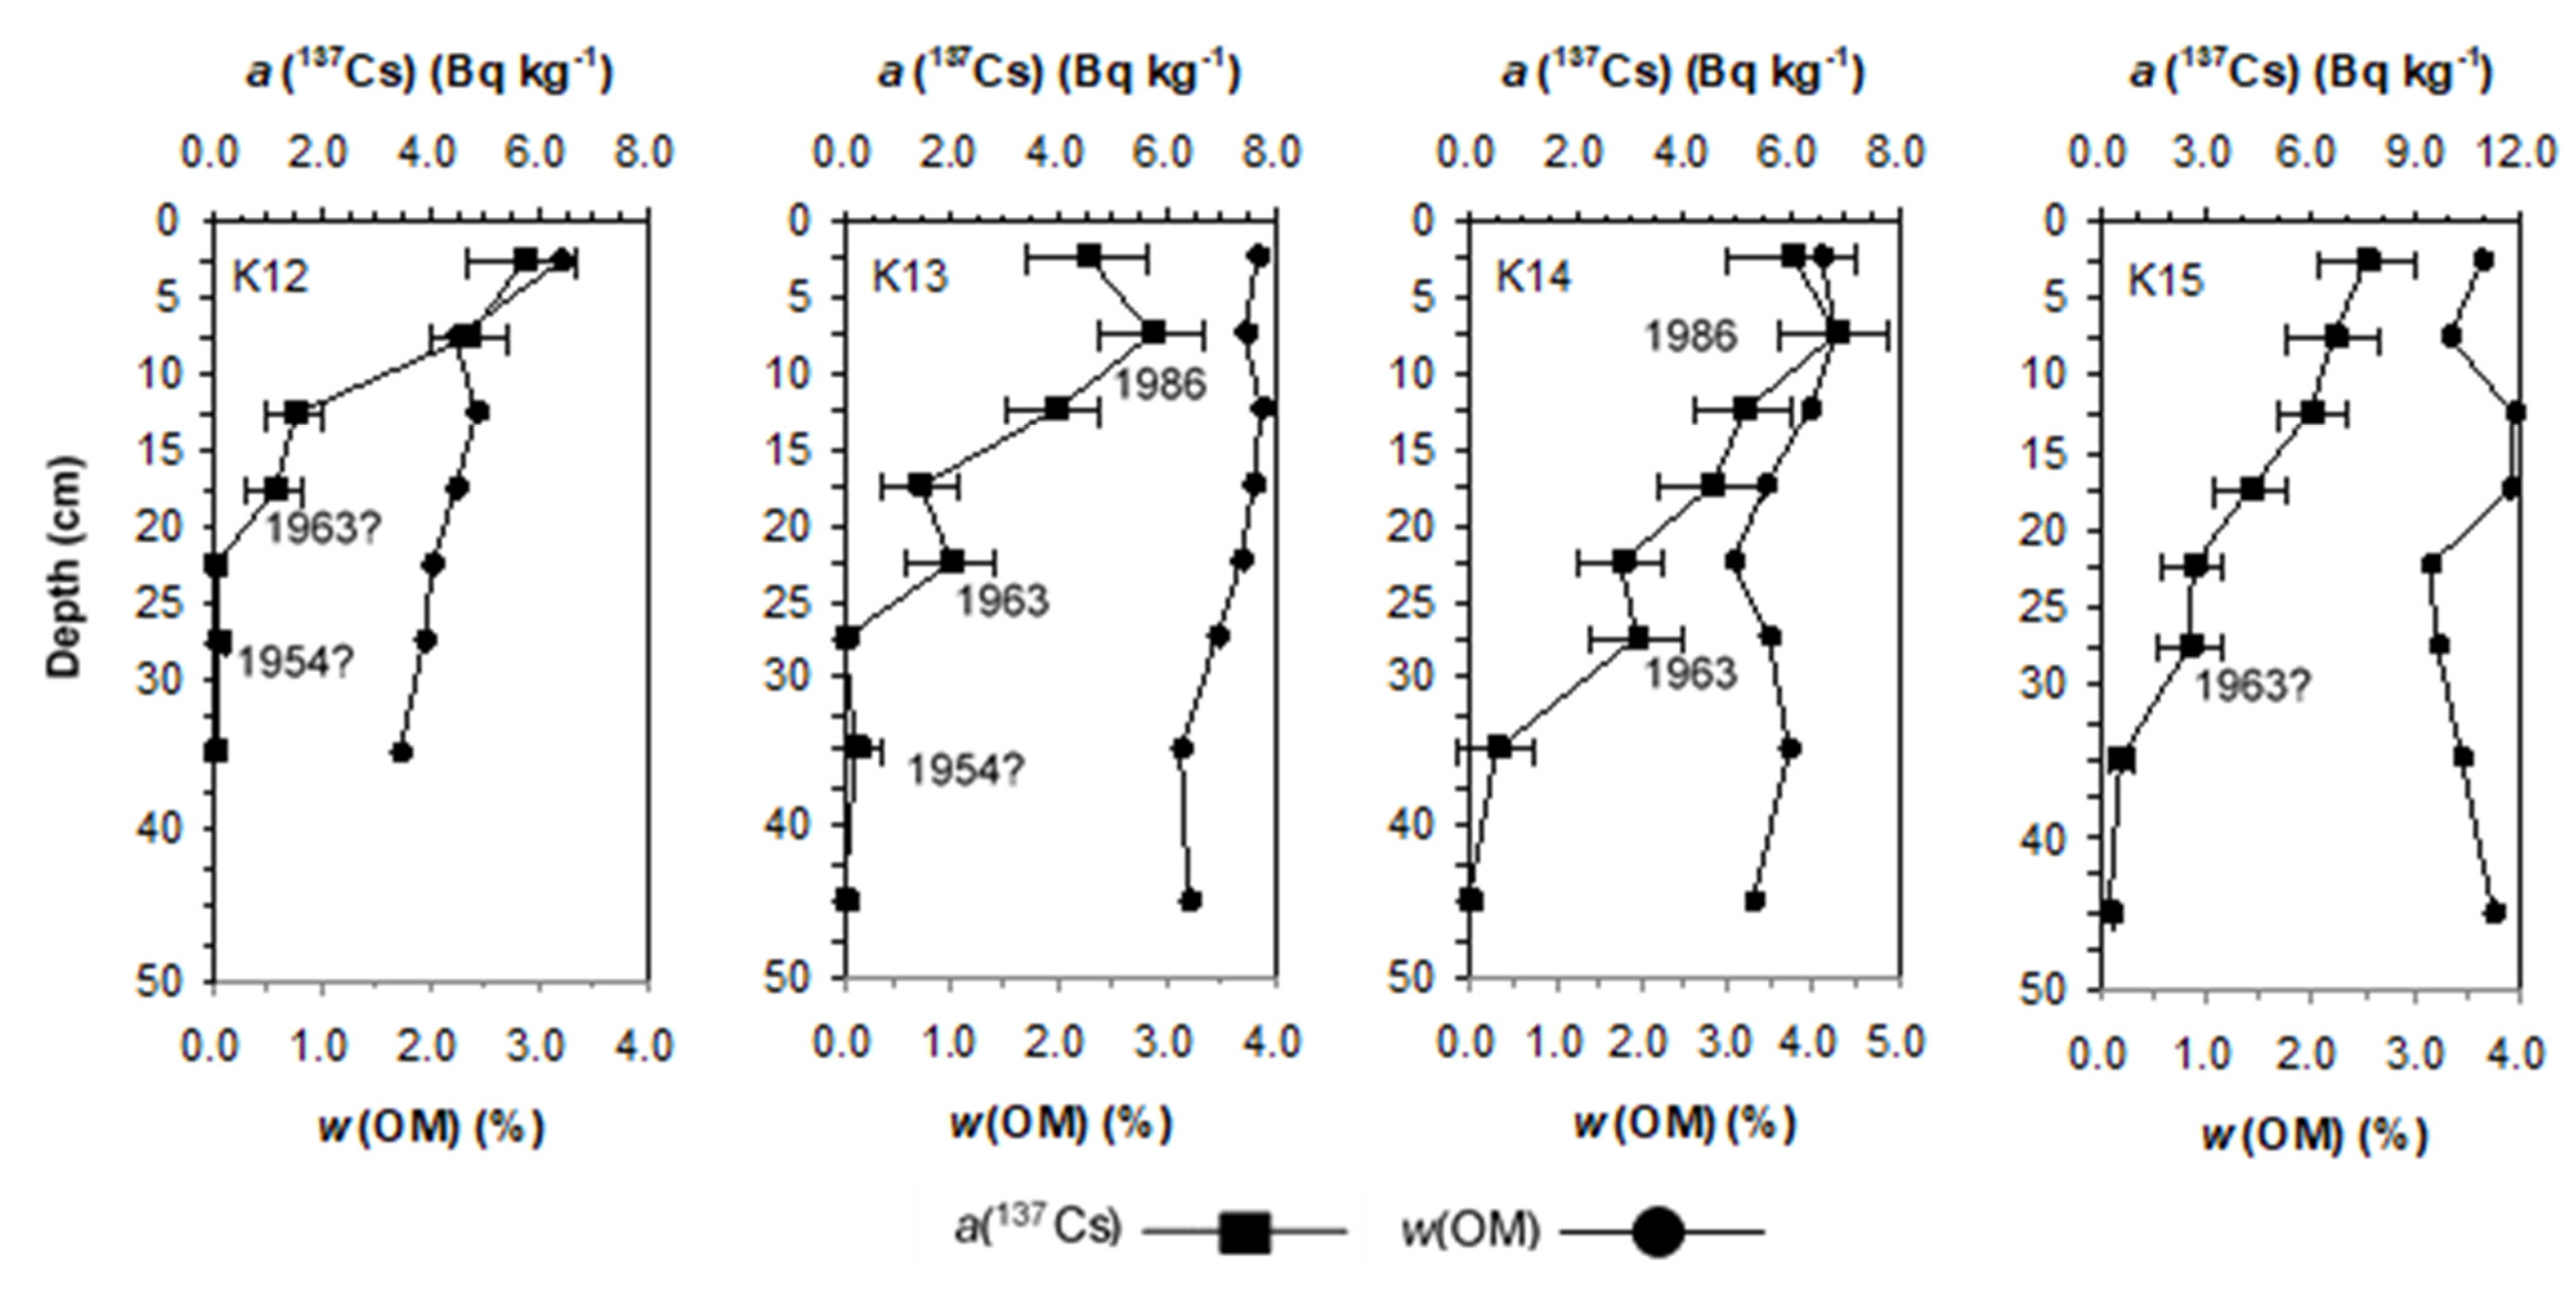
3.1. 137Cs Massic Activities in Sediment and 137Cs Depth Profiles

The 137Cs activities were below the minimum detectable activity (MDA) at the following stations: K25, K37, K38, K45, K72, K84, K86, and K88 (Figure 1). The 137Cs profiles were not prepared for them. MDAs were in the 0.3–0.7 Bq kg−1 range. At other stations, where the 137Cs activities were above the MDA, the profiles were prepared, and they are presented in Figure 2, Figure 3, Figure 4, Figure 5, Figure 6, Figure 7, Figure 8 and Figure 9. The highest 137Cs activities were found in the K2302, K2303, and K2304 samples (9.8 Bq kg−1) (Figure 5 and Figure 10), and they were denoted as outliers. However, they were not excluded from further statistical analyses. The basic statistical parameters of 137Cs activities with and without outliers are presented in Table 2. There is no large difference between the two data sets because there are only three outliers, and their values are moderately elevated.
Almost all of the profiles are disturbed to some degree, but they provide useful information about the sedimentation processes. Only the profiles at the K40 and K42 stations (Figure 2) show the typical, undisturbed, ideal shape with two characteristic 137Cs peaks, reflecting the atmospheric deposition pattern.
Less pronounced 137Cs peaks that are assumed to represent the sediment surface of 1963 were observed in the profiles from the K40 and K42 stations at depths of 30–40 cm and 25–30 cm, respectively (Figure 2). More pronounced peaks, representing the sediment surface of 1986, were observed at a depth of 5–10 cm in profiles at both stations. It was observed in both profiles that 137Cs originating from the Chernobyl accident was more significant than the input from nuclear weapons testing, even when taking the half-life of 137Cs into account and the fact that the large part of 137Cs from the weapons testing decayed until the sampling time in this research. Higher 137Cs fallout activities in Croatia due to the Chernobyl accident than due to nuclear weapons testing were reported by other authors as well [48].
Undisturbed 137Cs profiles, showing a globally decreasing pattern but without characteristic 137Cs peaks, representing the sediment surfaces of 1963 and 1986, were observed at K46, K52, K53, K55, and K59 stations (Figure 3). Although it would be expected to observe a decrease in 137Cs activities in the shallowest segments (0–5 cm), it was not observed in the profiles presented in Figure 3. In addition to the sedimentation processes, this might be attributed to the segment slices being too wide for the upper 5 cm of the core, which failed to register the possible 137Cs activity decrease in the surface sediment.
The profiles with (possible) 137Cs peaks representing the sediment surface of 1963 and some with peaks representing the sediment surface of 1986 are presented in Figure 4. A peak representing the sediment surface of 1986 was observed at a 5–10 cm depth in the K13 profile. Another peak was observed at a 20–25 cm depth. It was earlier assumed by Lovrenčić Mikelić et al. [22] that this peak represented the sediment surface of 1963. A weak peak was also observed at a 30–40 cm depth. It might represent a signal from 1954, but it is not certain due to the low 137Cs activity and associated measurement uncertainty. The same applies to a very weak peak at the 25–30 cm depth in the K12 profile. The profiles similar to the K13 profile were observed at the K12, K14, and K15 stations, but their peaks from 1963 were less pronounced than in K13. A possible 1963 peak was found at the 15–20 cm depth at the K12 station and at the 25–30 cm depth at the K14 and K15. The peaks found at the K12 and K15 stations were considerably flattened, but the similarity and continuity between the four profiles in Figure 4 were observed. The 1963 peak is sequentially more flattened from the K13 to the K15 profile, and it sequentially occurs in deeper segments from K12 to K15.
A pronounced 137Cs activity increase was observed in the K16 profile from a 30–25 cm to a 20–15 cm depth (Figure 5). It was assumed that the 137Cs peak at a 20–15 cm depth represented the sediment surface of 1986 and that after 1986, faster sediment deposition occurred. This was represented by four upper segments at a 20–0 cm depth. A somewhat similar profile was observed at the K17 station (Figure 5), where relatively uniform 137Cs activities were determined in the four upper segments (0–20 cm depth). A profile that was almost identical to K17 was observed at the K23 station, where rather uniform 137Cs activities were determined at a 5–20 cm depth (Figure 5).
Deep 137Cs peaks representing the sediment surface of 1986 and implying increased sedimentation rates were observed in the K18 and K22 profiles (Figure 6). These peaks were observed at a 20–25 cm depth at the K18 station and at a 15–20 cm depth at K22. Increasing 137Cs activities in the upper segments were also observed at both stations. It occurred in the upper 15 cm of K18 and in the upper 10 cm of the K22 profile. However, it would be expected to observe decreasing 137Cs activities in the upper segments according to the global 137Cs atmospheric deposition. The observed increase implies subsequent input after 1986.
The profiles with uniform 137Cs activities in the upper 10 cm, suggesting sediment homogenisation, are shown in Figure 7. Attention should also be paid to the high measurement uncertainties associated with the activities determined for the K04 and K19 profiles. Such uncertainties are a consequence of low activities. It is clear that the 137Cs activities in these two profiles are significantly lower than in the other profiles in Figure 7. Although high uncertainties limit the assumption of the uniformity of activities to some extent, significantly low activities still provide useful information about sedimentation processes.
Untypical profiles reflecting anomalies in sedimentation processes were observed at the KC and KK stations (Figure 8). 137Cs activities in the KC profile were generally low, and the associated measurement uncertainties were higher than in the KK profile. However, the uncertainties were uniform along the whole profile, allowing individual activities to be comparable along the whole profile. A significant decrease in 137Cs activity was observed between the 15–10 cm and 10–5 cm depth in the KC profile. The opposite trend related to 137Cs activity variation was observed in the KK profile, implying different processes. At this station, a significant increase in activity was recorded between the 25–20 cm and the 20–15 cm depth.
Another group of untypical, irregular profiles is presented in Figure 9, showing the profiles at the K60, K63, and K90 stations. The sediment at the K60 station is homogenised almost along the whole profile. A significant change in the 137Cs activity was only observed at a 0–5 cm depth. The profile at the K63 station is very irregular at a 40 cm depth. The activities are very low or under MDA. The activities in the upper 30 cm of the K90 core were low and considerably uniform. Significantly higher activity was only observed at a 30–40 cm depth, suggesting some sedimentation anomaly.

3.2. Sediment Grain Size

The results of the granulometric analyses of the sediments from the KK and KC stations are presented in Table 3. It is clearly observable that sediments of different grain sizes are deposited at these two stations. Namely, clayey silt [46] or mud [47] is deposited at the KK station, while silty sand [46] or gravelly muddy sand [47] is deposited at KC. The sediment at both stations was classified as the same sediment type in all of the subsamples of the respective core.
The grain size composition of the sediments visually determined on-site is presented in Table 4. Seventeen stations only had fine-grained (clay and silt) sediment. The other half of the profiles were mostly sandy or sandy with clay/silt or, occasionally, gravel. The upper segments of some of the profiles were coarser-grained than the rest of the profiles (K19, K52, and K63). On the contrary, at the K03 station, the lower segments were somewhat coarser-grained than the others. Possible bioturbation was observed at the K22, K25, K72, and K84 stations, with records of found organisms or shell debris. The K86 profile was under an anthropogenic influence, as the occurrence of shell assemblages was observed. Cement was found in the K23 profile, while fly ash was found in K73.

3.3. Organic Matter in Sediment

The basic statistical data for the organic matter found in the studied sediments are given in Table 5. Extreme values were found in the following segments: K6001, K9001, K9002, K9003, K9004, K9005, K9006, and K9007. These values were elevated and were in the 8.93–20.2% range. The most significant difference between the data with and without the extreme values is the maximum value. It was 20.2% for all of the samples but only 5.63% when the extreme values were excluded. Without the extreme values, the highest organic matter contents were found in the K1801, K4203, K6002, K6003, K6005, and K6006 subsamples (Figure 2, Figure 6, Figure 9 and Figure 10). The results for data sets for only the samples with detected 137Cs (i.e., 137Cs activity above the MDA) and excluded extreme values for organic matter and for data sets for only samples with no detected 137Cs (i.e., 137Cs activity below the MDA) are given separately in Table 5. The differences between the two data sets are clear. Mean value, median, and maximum are significantly lower in the samples with no detected 137Cs: 1.84, 1.85, and 2.43 times, respectively. The relative measurement uncertainties for organic matter fractions were less than 3%, for k = 2 for normal distribution. They were too low to be shown in Figure 2, Figure 3, Figure 4, Figure 5, Figure 6, Figure 7, Figure 8 and Figure 9.

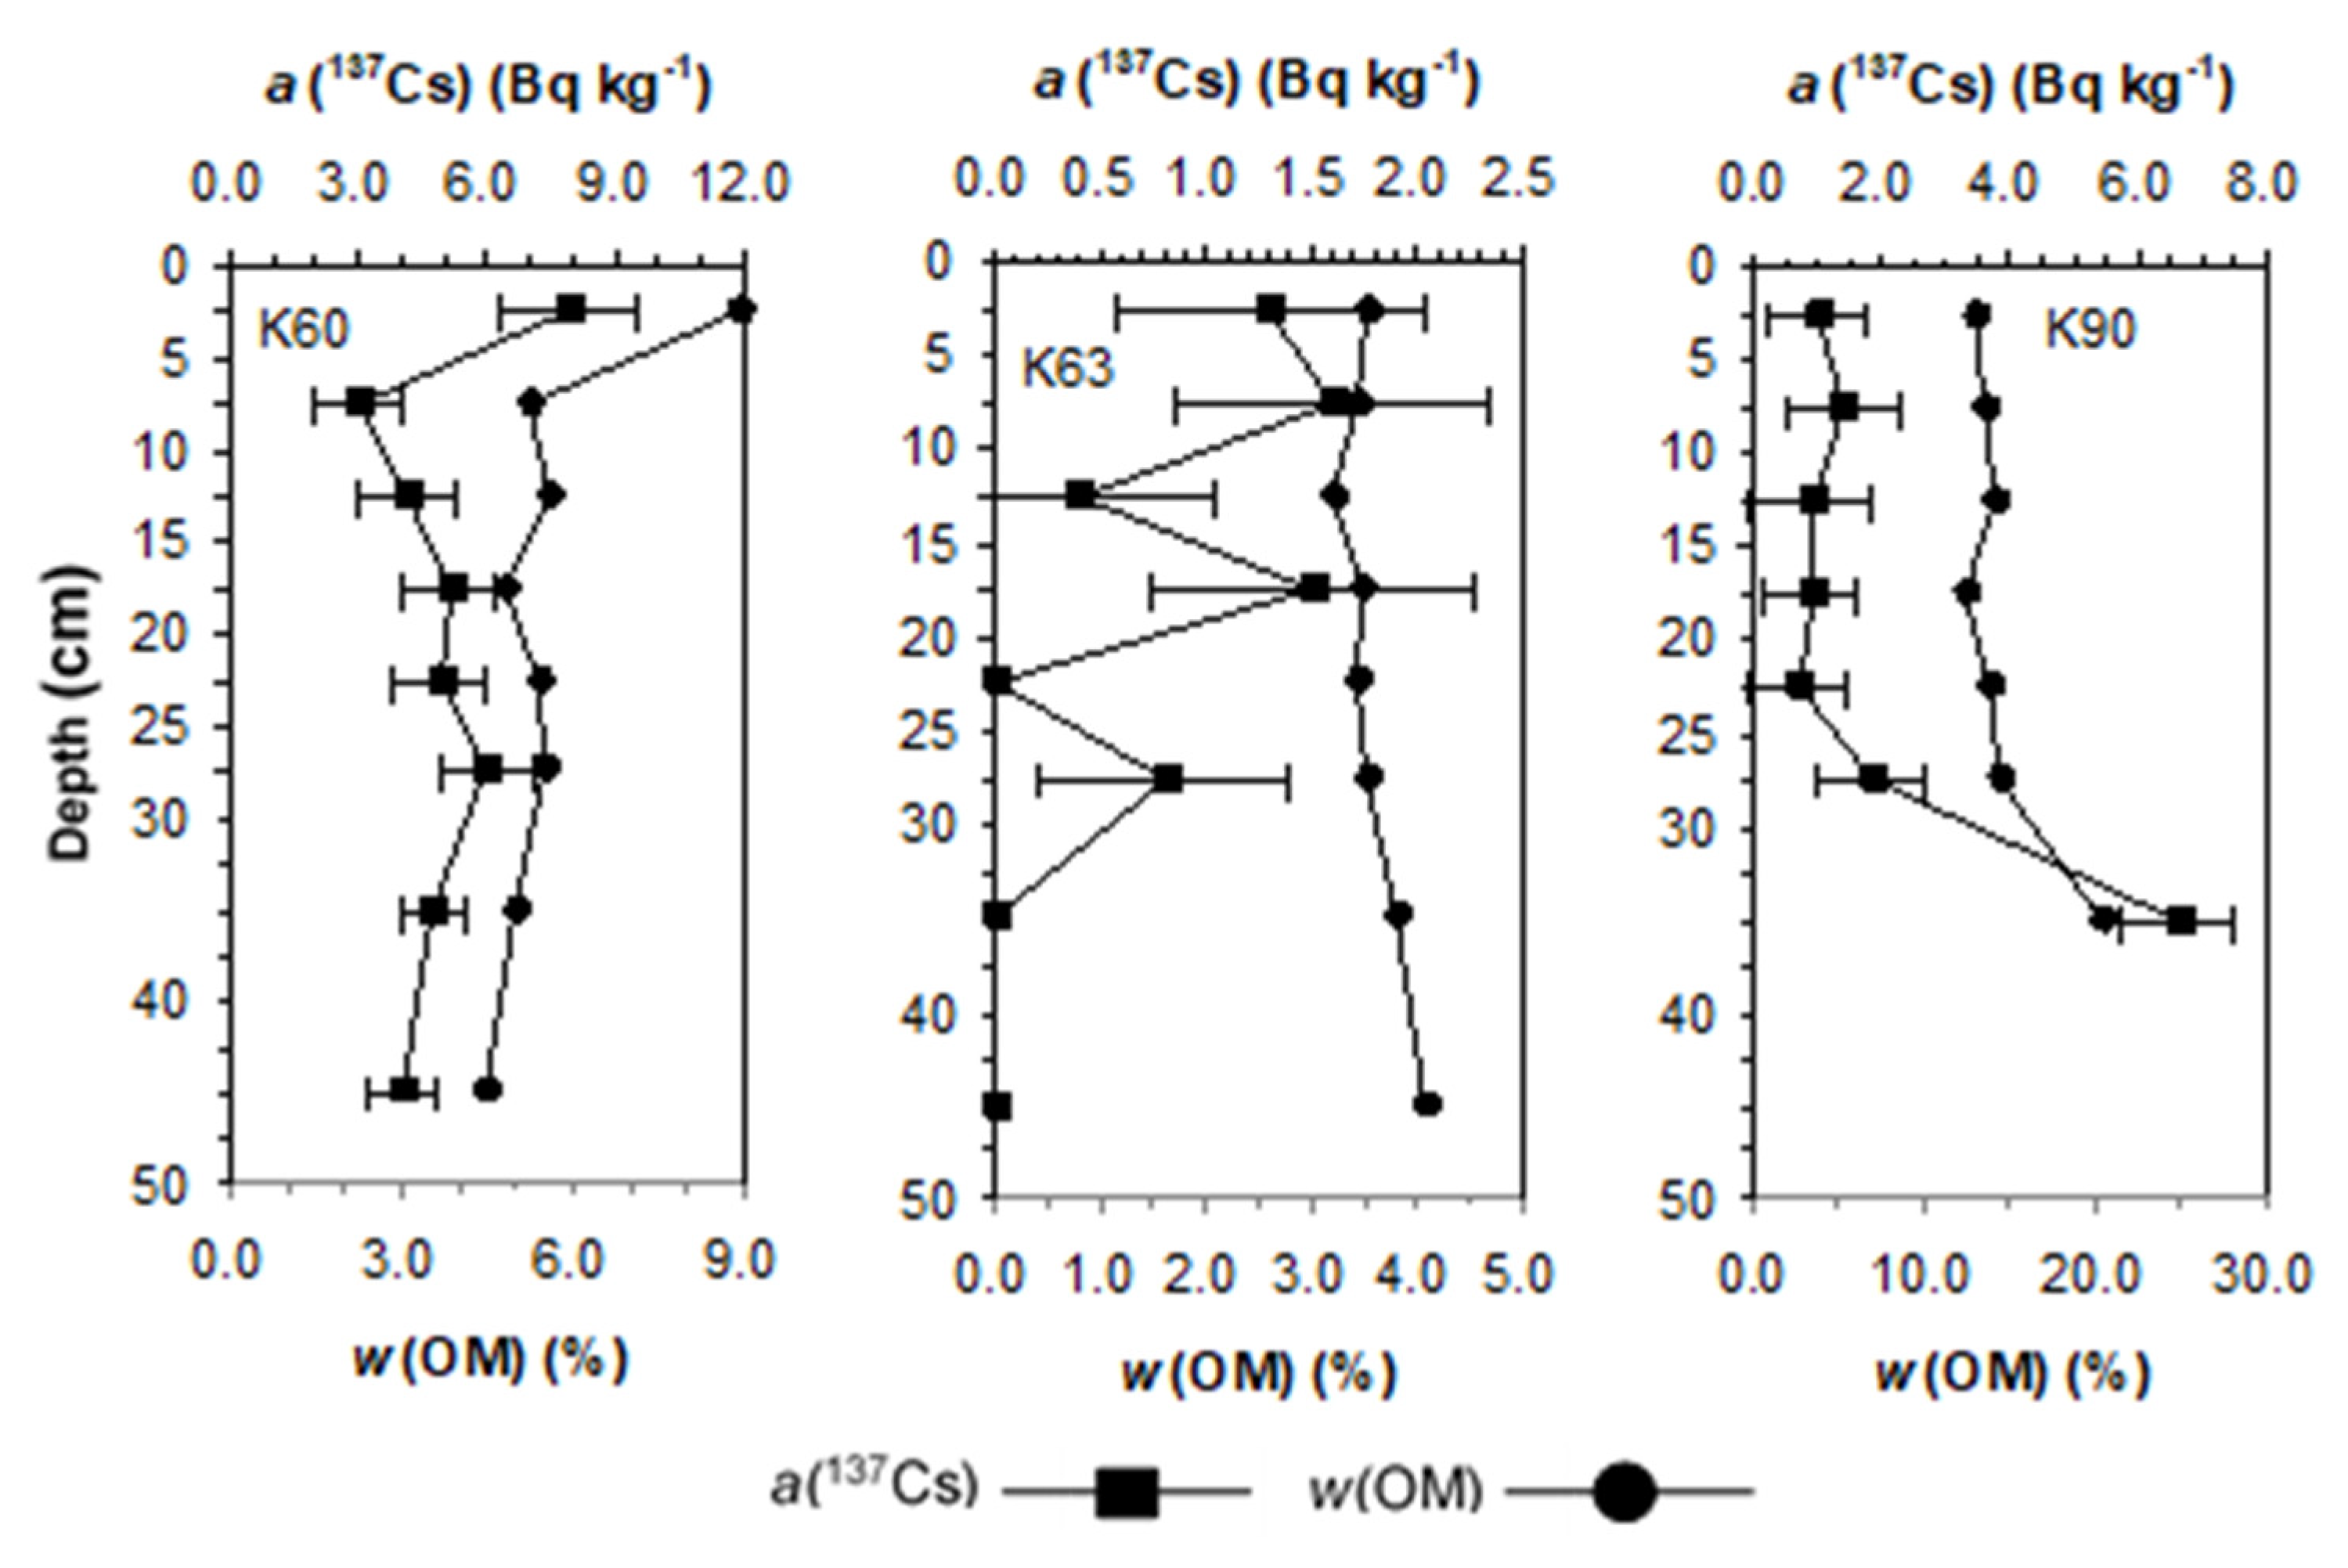
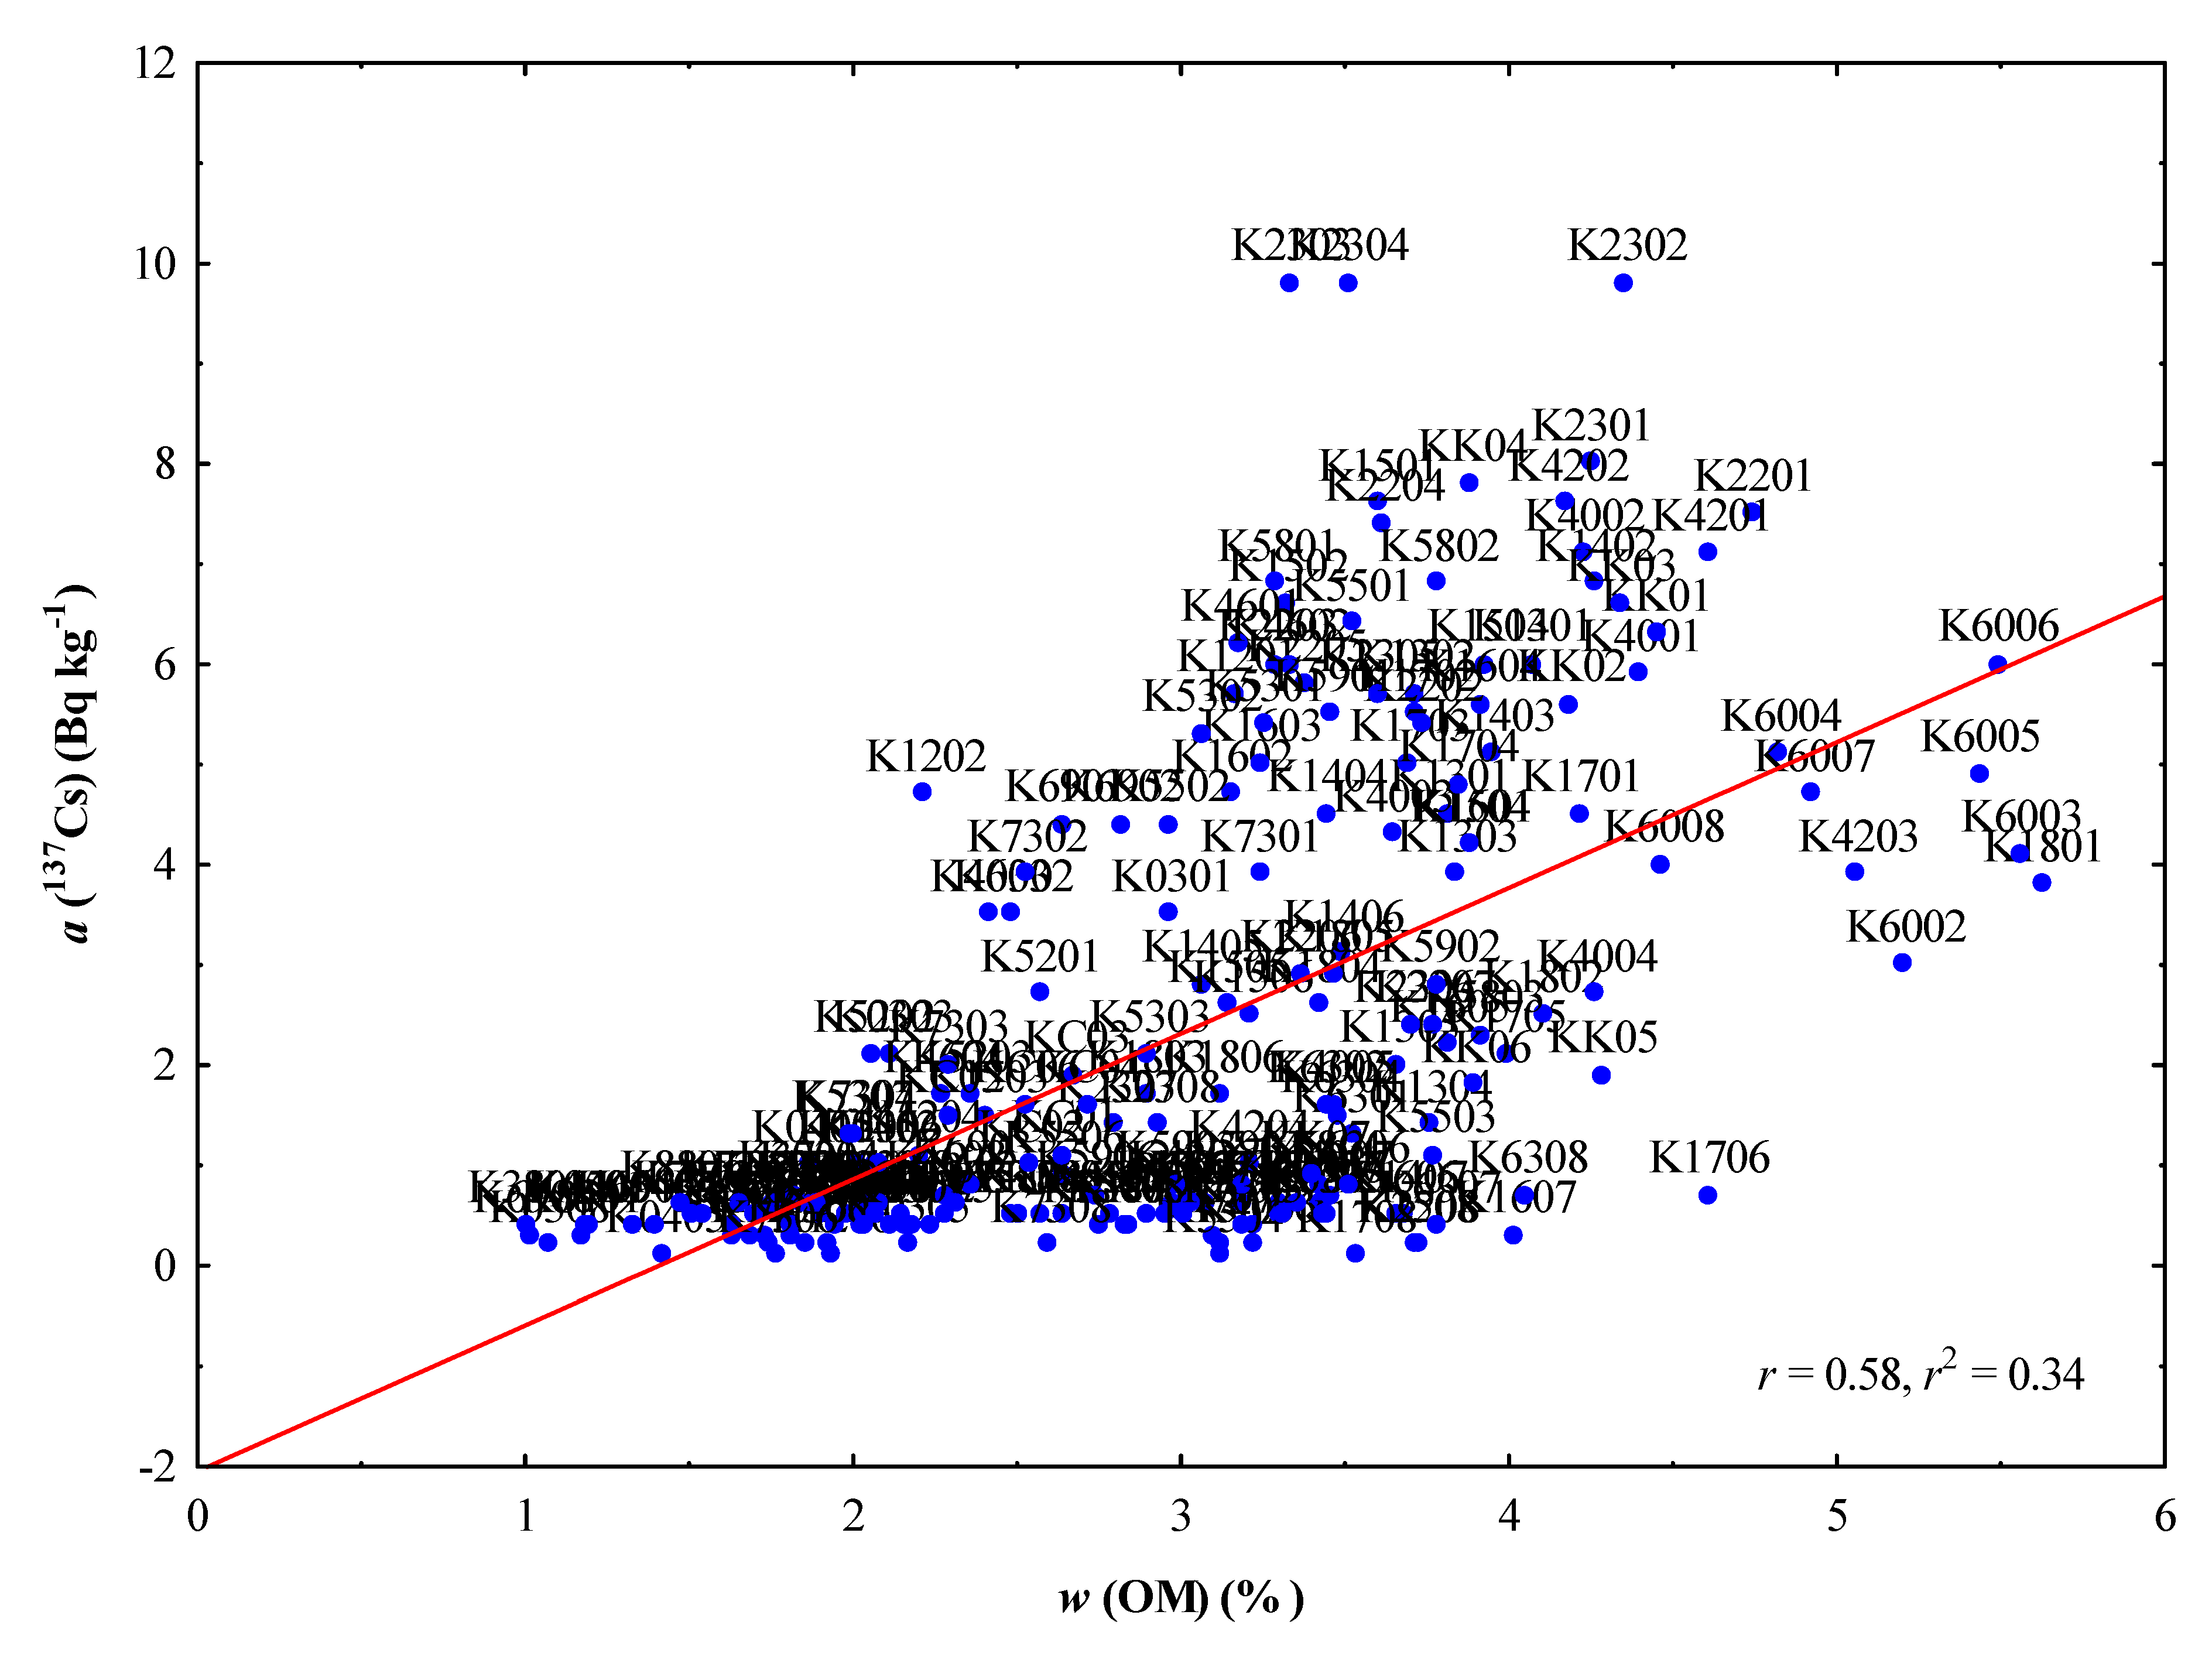
3.4. Organic Matter Mass Fractions vs. 137Cs Massic Activities

The relationship between the organic matter mass fractions (with the extreme values excluded) and 137Cs activities is presented in Figure 10. A linear relationship is observed, with a real significant positive correlation (r = 0.58). The obtained p-value was less than 0.05.

4. Discussion

4.1. Types of Sedimentation, Processes and Influences Reflected by 137Cs Depth Profiles

4.1.1. Undisturbed, Uniform, and Regular Sedimentation

The profiles from the K40 and K42 stations (Figure 2) suggest that the sediment was not resuspended, mixed, or disturbed in any way. Considering the sea bottom depths at these stations (38.0 m at the K40 and 37.0 m at the K42) (Table 1), sediment mixing due to waves was not expected because the sea bottom is below the wave base during stormy weather (WBDSW), which is estimated to be 20 m in Kaštela Bay [23]. Furthermore, no evidence of bioturbation was found (Table 4).
The sedimentary environment at these two stations can be regarded as a low-energy and protected environment in which the uniform sedimentation of fine-grained particles may be dominant. Uniform and fine-grained sedimentation is expected in deeper marine environments. It was observed by other authors as well [13,16]. It is also supported by the observation of the uniform grain size composition. This uniformity can be assumed at the K40 and K42 stations, as no specific comments regarding the grain size variability are given in Table 4. It is in accordance with the granulometry results from a previous study encompassing Kaštela Bay. There, predominantly fine-grained sediment (clay + silt content: mean value approx. 99%) was determined at all depths of the analysed bottom sediment at the B station (35.4 m sea bottom depth) close to the K42 station (37.0 m sea bottom depth) of the current study [49]. Such undisturbed sedimentation is neither too slow nor too fast, allowing for the formation of typical 137Cs profiles with two distinctive peaks. It favours the deposition of fine-grained sediment and organic matter with bound 137Cs (Figure 2, Table 4). Almost all of the organic matter fractions at these two profiles were higher than the median value for the samples with detected 137Cs and excluded extreme values (Table 5). The highest value was found in the K4203 subsample (5.07%) (Figure 2 and Figure 10). Comparable organic matter content in the sediment from this area was determined earlier by Bogner and Matijević [49] at their B station (5.89–8.86%, mean value: 7.23%). The elevated organic matter content may be associated with anthropogenic nutrient input and global climatic changes, which led to increased primary production in the 1980s [49]. Relatively high 137Cs activities (maximum of 7.1 Bq kg−1 at K40 and 7.6 Bq kg−1 at K42) are in accordance with relatively high organic matter content and fine-grained sediment (Table 2, Table 4 and Table 5). This is also in accordance with the fact that fine-grained sediments tend to bind more 137Cs than coarse-grained ones [13]. Pearson’s correlation coefficient (r = 0.58, Figure 10) suggests a somewhat significant role of organic matter in 137Cs binding and deposition. Indeed, this was previously found for Kaštela Bay sediments, where a statistically significant positive correlation between 137Cs activity and organic matter content was established [22]. The significant association of 137Cs with the organic matter in the sediments was determined by other authors as well [10,16,50,51,52]. However, organic matter is not the only influencing factor. Another important factor is presumably the presence of clay minerals because of their high sorption capacity and because fine-grained particles in marine environments typically comprise both organic matter and clay minerals [10,15,16,51,52,53].

4.1.2. Undisturbed, Slow Sedimentation

The absence of the characteristic 137Cs peaks in the undisturbed profiles presented in Figure 3 demonstrates slow but undisturbed or continuous sedimentation (slower than at the K40 and K42 stations), i.e., there was no resuspension, mixing, or scouring. In the case of slow sedimentation, the 137Cs peak is missing in the profile because the initial sediment containing 137Cs is deposited over a longer period allowing the effect of 137Cs dilution in the deposited sediment and its gradual incorporation into sea bottom sediment.
It is worth noting that all of these stations were located in the deeper southern part of the Bay at depths greater than the WBDSW (22.0–50.0 m). Undisturbed sedimentation is more expected in deeper parts of the Bay than in the shallow parts due to the diminished influence of the physical reworking of the sediment caused by waves and currents. Deeper parts are low-energy environments suitable for the deposition of fine-grained sediment under the condition that there is a sufficient supply of such sediment.
Slower sedimentation may be associated with lower content of fine-grained particles carrying 137Cs. This is supported by the occurrence of sand in the K46 and K52 profiles (Table 4). Additionally, the relatively low organic matter contents in all five profiles shown in Figure 3 (1.86–3.79%) also imply lower content of fine-grained particles in comparison with the K40 and K42 profiles. However, sand has not been visually observed in the field in K53, K55, and K59 profiles (Table 4). The K55 and K59 are shorter than the K46, K52, and K53 profiles. 137Cs was only detected in the three upper segments of the K55 and K59 profiles. This suggests even slower sedimentation of the fine-grained sediment at these two stations than in the other three. The main influencing factors, in this case, would be the sea bottom depth and the energy level of the water or the supply of sedimentary material. Although organic matter content, and probable fine-grain size particles content, were higher in the K55 and K59 profiles (2.64–3.79%) than in the other three profiles (1.86–3.33%) (Figure 3), the sedimentation at the K55 and K59 stations was slower. It is due to the significantly greater sea bottom depth at K55 and K59 (Figure 1, Table 1) and the lower energy level of the water with decreased fine sediment supply. The relationships between the energy level of the water, the supply of the fine-grained particles, and sedimentation rates have been described by Tissot and Welte [54]. The K53 profile can be regarded as an intermediate case between the K46 and K52 profiles on the one side and the K55 and K59 on the other side. Its sea bottom is deep enough that fine-grained sediment may be deposited, and 137Cs was detected in the four upper segments, such as in the K46 and K52 profiles, but it is not too deep to limit the supply of fine-grained particles. Stations K55 and K59, on the other hand, mainly display profiles of clay and silt.

4.1.3. Eastward Increasing Sedimentation Rate in Profiles in Sequence

More or less distinguishable peaks representing the sediment surface of 1963 observed in profiles in Figure 4 show an eastward increasing sedimentation rate, from K12 to K15. It may be a result of increased sediment supply. Along with the material from the coast, significant amounts of sediment may originate from the eastern part of the Bay. The eastern part of the Bay was under strong anthropogenic pressure that increased the fine particles load to this part of the Bay [32,43,49,55]. The Jadro River is also a source of sediment for the easternmost part of the Bay.
Although the fine-grained sediment was visually determined in the field (Table 4) at all four stations, differences were found in the organic matter content, suggesting differences in grain size. The organic matter content was significantly lower at the K12 station (mean value: 2.24%) than at the other three stations (mean values: 3.57%, 3.66%, and 3.53% at the K13, K14, and K15, respectively). Lower organic matter content suggests lower content of fine-grained particles in the sediment. This is in accordance with the distribution of surficial sediments of Kaštela Bay established earlier, where muddy sediments are significantly less represented in the western part of the Bay [56]. The K12 station is the closest to the non-muddy areas of the Bay. The organic matter content is also in accordance with the sea bottom depths at these stations. While the K13, K14, and K15 are at almost the same depth of approximately 30 m, the K12 station is at a 22 m depth (Table 1). The K13, K14, and K15 stations may be regarded as low-energy environments suitable for the sedimentation of fine-grained sediment, while the energy level at K12 would be higher and less suitable for fine-grained sediment deposition. The higher energy level and lower sediment supply (at least of fine-grained sediment) at the K12 station resulted in significantly lower sedimentation rates compared to the other three stations. The lower sedimentation rate at the K12 than at the K13 station was determined previously by Lovrenčić Mikelić et al. [22].
Another observation that needs to be addressed is the progressive eastward flattening of the 1963 peak from K13 to K15. This is attributed to 137Cs dilution by the increased eastward load of fine-grained sediment. It is not attributed to post-depositional diffusion because such eastward regularity would not be expected. Rather, similar diffusion with similar profiles would be expected.
The profile of the K16 station (Figure 5) was significantly different from the profiles in Figure 4, and it was not assigned to a sequence starting from the K12 profile, notwithstanding the vicinity of the K15 station.

4.1.4. Fast Sedimentation and/or Sediment Mixing

The profiles observed at the K16, K17, and K23 stations (Figure 5) suggest fast sedimentation of fine-grained material and/or sediment mixing. Fast sedimentation in Kaštela Bay would be higher than approximately 1 cm yr−1 [22]. Fine-grained sediment was observed in the field (Table 4), and it is corroborated by the relatively high organic matter content (Figure 5). In the upper six or seven segments of all of the three profiles, the organic matter contents are all higher than the mean value for samples with detected 137Cs and excluded extreme values, and almost all of the values are higher than the median (Table 5). It can be assumed that the K16 profile shows fast sediment deposition, while for K17 and K23, it is not immediately clear which of the processes occurred and which one predominates if both occurred. Fast sedimentation after 1986 at the K16 station, compared to other researched stations in Kaštela Bay, was earlier determined by Lovrenčić Mikelić et al. [22].
In the case of sediment mixing, it should be established if it was a consequence of bioturbation or the influence of waves or currents. In order to determine bioturbation with certainty, it would be necessary to study the macrofaunal communities or traces of them to determine if the organisms could mix the sediment up to 20 cm depth. Andersen et al. [37] found that the bioturbation depth in the muddy sediments of the intertidal zone was only a few centimetres, while Al-Zamel et al. [36] reported a bioturbation depth of 30 cm or more in Kuwait Bay. However, Al-Zamel et al. [36] did not present specific data on the sedimentary environment (e.g., depth, granulometric composition), except for the information that the samples were taken in a shallow subtidal zone. It should be noted that no organisms or their burrows, which are significant for bioturbation, were observed during sampling at the K16, K17, and K23 stations. It suggests that bioturbation was not responsible for 137Cs distribution in the upper 20 cm of sediment at these three stations.
The sea bottom depth of the K17 station is 33.0 m, which is below the WBDSW. Therefore, mixing by waves was excluded. Mixing by currents would be possible if the currents are strong enough. However, the fast sedimentation of a large amount of material is more likely to have occurred at the K17 station. While sediment mixing by the waves was eliminated at the K17 station, mixing induced by waves is possible at the K23 because the sea bottom depth at this station is 10.0 m, i.e., above the WBDSW.
Additionally, sediment mixing at the K23 station is possible due to the influence of a discharge of fluvial sediment from the Jadro River. Other authors also reported the homogenisation of coastal sediments caused by the fluvial discharge [8,16]. Increased sediment input was expected as well at this station, considering its position. It is in the river mouth of the Jadro River, which brings increased amounts of fine-grained particles, including organic matter, with bound 137Cs [13,16,49]. It is supported by higher 137Cs activities compared to the activities at the K16 and K17 stations (Figure 5 and Figure 10). The maximum 137Cs activities at the K16 and K17 stations were approximately 6 Bq kg−1, while at the K23, the maximum 137Cs activity was approximately 10 Bq kg−1. It may be assumed that a significant portion of 137Cs is bound to organic matter, considering their positive correlation presented in Figure 10. Increased 137Cs activities due to the fluvial contribution to marine sediment were also observed in sediments from the Spanish Mediterranean coast, from the Adriatic Sea near the river mouth of the Po River, and from Ise Bay in Japan [8,15,38,39]. Pfitzner et al. [40] also documented the strong influence of fluvial sediment on coastal sediments in Australia. While the K23 profile is influenced by fluvial discharge, the K16 and K17 are most probably not. The K16 and K17 stations may receive sediment from the coast or from other parts of the Bay.
The anthropogenic contribution to faster sedimentation at the K23 station was also probably due to the discharge of large amounts of suspended matter by wastewaters [25] in this part of the Bay. Another aspect of anthropogenic impact detected at this station is the cement found in sediment (Table 4).
It can be concluded that both processes likely occur at the K23 station: increased sediment input and sediment mixing. The profiles at the K17 and K23 stations showed that it is not always possible to unambiguously define sedimentation processes based only on 137Cs profiles. Considering that very similar or almost the same 137Cs profiles can result from different processes, it is necessary to take into account all available data about the sedimentary environment. In some cases, it may be useful to monitor the areas with increased fine-grained sediment input due to the possibility of siltation occurring and to obtain necessary information for suitable sediment management.

4.1.5. Increased Sedimentation and Subsequent Increased Material Input in the Uppermost Profile Segments

Increased sedimentation rates were also observed at the K18 and K22 stations (Figure 6). This was earlier documented in Lovrenčić Mikelić et al. [22]. However, the subsequent input after 1986, recorded in the uppermost segments, was also observed at these two stations. Due to the morphology of the sea bottom of the Bay (Figure 1, Table 1) and the low-energy environment, the K18 station is an adequate site for the sedimentation of this subsequently introduced material. It is possible that the westward transport of sediment from the K18 to K17 and K16 stations occurs along the coast, although it should be confirmed with more data. Some authors reported the closed water mass circulation in the eastern part of the Bay [23,42]. Bogner [23] reported the westward circulation 2 m above the sea bottom induced by the sirocco and mistral winds. Barić [42] reported that closed water mass circulation in the east part of the Bay occurs especially during the summer months when the exchange of water between the east part of the Bay and the rest of the Bay is almost completely non-existent. This could enable westward sediment transport from the K18 station. Sediment depositing at the K18 station could originate from the easternmost part of the Bay and/or from the north coast of the Bay. The sediments deposited by the Jadro River at its mouth and the suspended matter from wastewaters may be the most important influences coming from the easternmost part of the Bay. However, it would be expected that the suspended matter from wastewater predominates due to the distance between the K18 station and the Jadro River mouth and due to the sea bottom morphology. The north coast consists of Eocene flysch that produces a significant number of fine-grained particles by physical weathering and it acts as a source of sediment for the Bay [49]. It can also be a source of 137Cs since it was detected in coastal stream sediments [43].
The 137Cs profile observed at the K22 station was almost identical to the profile from the K18. The subsequent input at this station was attributed to the influence of the Jadro River and to the discharge of large amounts of suspended matter by wastewaters [25]. However, the Jadro River influence is expected to be more significant at this station than at the K18 (if present there). Maximum 137Cs activity in the K22 profile (approx. 8 Bq kg−1) is very close to the maximum activity in the K23 (approx. 10 Bq kg−1) and significantly higher than the maximum activity in the K18 (approx. 4 Bq kg−1). It reflects the fluvial influence on the sediment at the K22 station (Figure 5 and Figure 6, Table 2). The fluvial influence on the increased sediment input and higher 137Cs activities, especially in river mouths, was observed by other authors as well [13,15,16,52].
Figure 6 shows that the organic matter profiles are almost identical at both stations and that increase in 137Cs activity corresponds with an increase in organic matter content in the uppermost segments. This strongly suggests that the increased amounts of organic matter, most probably originating from wastewaters and partly transported by the Jadro River, have bound more 137Cs and were deposited with other fine-grained particles. More suspended material provides more particles for 137Cs binding. The significant association between 137Cs and organic matter is shown in Figure 10. It should be noted that the K1801 segment showed the highest organic matter content (with extreme values excluded) (5.63%). The high organic matter content at these two stations is in accordance with the fine-grained sediment observed in the field (Table 4). Increased organic matter content suggests increased fine-grained particle content as well [49]. Predominantly fine-grained sediment was documented near the K22 station by Bogner and Matijević [49]. Sediment at their A station at a 20 m depth contained, on average, 89% silt and clay particles. The similarity of 137Cs and organic matter profiles in Figure 6 also suggests that 137Cs might have been mobilised from the Jadro River catchment area after 1986 and transported to the Bay together with increased amounts of organic matter. Rubio et al. [52] observed 137Cs mobilisation from the catchment area of the Palmones River and identified it through organic matter and 137Cs profiles.
The profiles of the K18 and K22 stations demonstrated that the same process (i.e., subsequent, increased input) is equally reflected in the different profiles irrespectively of sediment origin. However, it was not possible to obtain any information on the sediment source from the shape of the profile only. In order to do that, the 137Cs activities had to be observed and compared with activities from other profiles, and other parameters (e.g., organic matter) had to be taken into consideration. It is shown that 137Cs in sediments reflects not only processes but also the (increased) presence of substances or particles on which it is preferentially bound.

4.1.6. Post-Depositional Processes

Probable sediment mixing in the upper 10 cm of the homogenised sediment implied by the profiles in Figure 7 cannot be attributed exclusively to the influence of the waves because the sea bottom depths at these stations vary in a range 14.0–41.0 m and some of these stations are located below the WBDSW (Table 1). Sediment mixing below this depth is possible by bioturbation or sea currents. However, no evidence of bioturbation was found in these sediments (Table 4). It is also possible that 137Cs in sediment was mobilised by diffusion or advection processes or that the sectioning thickness was too wide and failed to register finer activity variations. The possibility of the chemical mobilisation of 137Cs in the upper 10 cm of profiles is suggested by organic matter profiles. Although the 137Cs profiles are homogeneous, organic matter profiles are not, which implies that only 137Cs was mobilised (Figure 7). However, more data would be needed to confirm this. Various authors reported different findings about 137Cs mobility in marine sediments. According to some, 137Cs was mobilised and could be transported upwards and downwards in sediments [17,38,40], while others found 137Cs to be insignificantly mobile or strongly bound to sediment [40,57]. According to Børretzen and Salbu [7], 137Cs is progressively fixed to particles of marine sediment as the contact time between sediment and 137Cs increases. This means that 137Cs chemical mobility decreases with time.
Additionally, very low 137Cs activities at the K04 and K19 stations may be explained by selective sediment resuspension and resedimentation. It is possible that fine-grained particles from these two stations were resuspended and redeposited in other parts of the Bay. The lower content of fine-grained particles in the remaining sediment is supported by visual observations in the field, where sediment at the K04 station was characterised as sand and at the K19 as a mixture of gravel, sand, and some clay and silt (Table 4). Since 137Cs is frequently associated with fine-grained particles, 137Cs activities in the remaining coarse-grained sediment are significantly lower. In this way, selective resuspension and resedimentation enable the focusing/accumulation of the fine-grained sediment at localised sites with low–energy sedimentary environments [40].
The profile at the K19 station is significantly different from the other profiles in Figure 7 and it will be additionally discussed. At this station, 137Cs was detected only in the upper 10 cm of the profile, while in the other profiles, 137Cs was also determined in the deeper segments. Based on the absence of 137Cs below the 10 cm depth in the K19 profile, it was suggested that the sedimentary environment at this station might have changed from the erosion site to the accumulation site due to changed sedimentation conditions or input regime. The sedimentary environment at the station could have been changed by the increased input of the suspended matter in the eastern part of the Bay. Indeed, the mild ascending trend of the organic matter content with decreasing depth was observed at the K19 station (Figure 7). However, considering the sea bottom depth (14.0 m), sea bottom morphology, and low 137Cs activities, the sedimentation rate at this station is expected to be very low, with only negligible amounts of suspended matter deposited here. The low 137Cs activities are in accordance with the predominantly coarse-grained sediment at this station (Table 4). The suspended matter would preferably be deposited in a lower-energy environment. At a depth of 14.0 m, the sediment is exposed to the influence of waves and it is likely to be mixed or resuspended. Additionally, the K19 station is located on a submarine elevation, causing it to be even more exposed to waves and currents. Sediment mixing could have also been caused by bioturbation, but there are not enough data to support that possibility. Similar profiles were observed in the Humber estuary by Andersen et al. [37]. They were interpreted as a consequence of erosion and the lack of sedimentation after 1952.
It cannot be unambiguously differentiated whether the sediment in the six profiles presented in Figure 7 was homogenised due to physical reworking or 137Cs was chemically mobilised. Nevertheless, it is implied that the upper 10 cm of the sediment is the most exposed to homogenisation processes. The profiles in Figure 7 showed that both physical and chemical processes can be reflected in the 137Cs vertical distribution in the sediment in the same manner and that these two types of processes are not always possible to differentiate based only on 137Cs profiles. Data about other radionuclides, metals, various markers, traces of organisms, etc., would be necessary to help clearly identify the individual processes.

4.1.7. Post-Depositional Processes or Increased Sand Load, Sediment Sliding or Slumping

The significant decrease in 137Cs activity observed between the 15–10 cm and 10–5 cm depth in the KC profile (Figure 8) may be attributed to possible sediment resuspension and resedimentation. The upper 10 cm of the sediment was resuspended, homogenised, and redeposited partly at the same station and partly in the other parts of the Bay. The finest-grained sediment particles have the longest residence time in the water column and are easily transported to the other parts of the Bay. By removing the fine-grained particles, the sediment redeposited at the same station is depleted with 137Cs. The whole western part of the Bay is generally relatively shallow and the sea bottom depth at the KC station is 12.0 m (Figure 1, Table 1). It is possible that resuspension and resedimentation in this part of the Bay occur due to the influence of waves because the sea bottom is above the WBDSW. Low 137Cs activities in the KC profile were in accordance with the granulometry results, which showed relatively low contents of the fine-grained particles (26.0–31.5%) compared to the contents of the coarse-grained particles (68.5–74.0%) (Table 3). This is in accordance with the sea bottom surface sediment types of Kaštela Bay determined by Alfirević [56], where the KC station is located in exchanging rocky, gravely, and sandy bottom. Other authors also associated the granulometric composition of the sediment in Kaštela Bay with the station location and sedimentation processes [28]. They also concluded that the fine-grained particles are resuspended in shallow parts of the Bay and redeposited in deep parts below the WBDSW. Generally, the sedimentary environment at the KC station is a high-energy environment in which fine-grained particles are not preferably deposited, as discussed in Lovrenčić Mikelić et al. [22].
Another possible explanation of the 137Cs profile at the KC station may be the quick deposition of sediment with significantly increased sand content (Table 3). Parallel to the 137Cs activity decrease from the third to the second segment, a significant sand content increase of 5.0% was observed. The situation was inversed in the upper 10 cm, i.e., the 137Cs activity (slightly) increased and the sand content decreased by 9.0%. These two variations in sand content can be regarded as unusual because variations between other segments were 1.0% maximum (Table 3). Such a strong and inverse influence of sand-sized particle content on 137Cs activities in sediment is not surprising since the sand was the predominating grain size fraction in the sediment (Table 3) and since sand particles are not the preferential bearers of 137Cs [58]. Sediment rich in sand is depleted with 137Cs. This relationship was not observed with other grain size fractions and organic matter at the KC station. No associated disturbance was found in silt- and clay-size particles and organic matter distribution. However, a variation in gravel-size particle content was similar to the 137Cs profile in the first 15 cm of the sediment and inverse to sand content variation. This gravel content variation can be associated with sand content variation because they both represent coarse-grained particles, where the increase in sand content results in a decrease in gravel content and vice versa.
The significant increase in 137Cs activity observed between the 25–20 cm and the 20–15 cm depth in the KK profile was explained by possible sediment sliding or slumping from the KK station, followed by the continuation of sedimentation and subsequent 137Cs input recorded in the uppermost segment (5–0 cm depth). This station is located in a deep submarine depression at a 50.0 m depth (Figure 1, Table 1). It allowed the continuous sedimentation of the fine-grained sediment, as supported by the results presented in Table 3 (clay + silt content: 93.5–96.0%). These results are in accordance with observations of Alfirević [56], according to which the KK station is located in a muddy sea bottom. Sediment sliding or slumping can occur on steep slopes of the depression due to sediment instability. The 137Cs profile at the KK station points to generally continuous sedimentation with occasional disruptions or anomalies in sedimentation. Such an anomaly has not been observed in the organic matter profile (Figure 8). Constant sedimentation conditions and a low-energy environment facilitating the deposition of fine-grained particles at the KK station were earlier discussed by Lovrenčić Mikelić et al. [22].

4.1.8. Physical Reworking Due to Anthropogenic Influence

The profile of the K60 station (Figure 9) suggests strong physical reworking/mixing of the material or extremely fast sedimentation. It was not possible to determine which process was dominant. However, both processes can be a consequence of anthropogenic influence. Together with the irregular shape of the profile, this was also supported by the location of the station in the Bay. It is located in the easternmost part of the Bay in which the influence of the Jadro River is pronounced, large amounts of suspended matter are discharged, and urban and industrial activities are intensive. All of these parameters have an effect on increased sedimentation, but also on strong sediment reworking. It is not possible to estimate the sedimentation rate at this station, but increased sedimentation was expected here due to known sources of sediment in this part of the Bay. Very probable anthropogenic influence is suggested by field observations (Table 4). The sediment at this station was watery mud with an unpleasant odour, which is unusual for Bay sediments. Accordingly, the organic matter fractions were higher at this station than at other stations, with the exception of the K90 station (Figure 9 and Figure 10). The maximum value at the K60 was 8.93%, while other values were very close to the maximum value for all of the samples with extreme values excluded (Table 5). A similarly shaped profile was observed in Kaštela Bay in front of the former “Adriavinil” factory in previous research performed in October 2001 [28]. The profile was 40 cm long. A significantly higher 137Cs activity was found in the uppermost segment compared to the activities in the lower segments, which were rather uniform. 137Cs distribution in this profile was explained by material discharge into the Bay. During this event, large amounts of material were discharged into the sea almost instantaneously, enabling the material to be homogenised.
A very strong possibility of material reworking was observed at the K63 station (Figure 9) and it may be associated with its position in the Bay. This station is located close to the Split peninsula coast at a 14.0 m depth. Although the sea bottom depth was above the WBDSW, it was not expected for waves and currents to mix the sediment up to a 40 cm depth. In addition, this station is located in the immediate vicinity of the city harbour and the city of Split. They are a source of anthropogenic activities, such as dumping or dredging, which may have been a cause of the disturbed 137Cs profile at the station. However, this should be taken with caution due to the low 137Cs activities and large measurement uncertainties. Additionally, plenty of grass and some stones were found at this profile, which may also have disturbed the sediment (Table 4). The uneven grain size across the profile may also be considered an anomaly that reflects the disturbed sedimentation conditions.
The sediment at the K90 station (Figure 9) was very homogenised from the surface up to a 30 cm depth. The shape of this profile was also attributed to anthropogenic influence. This is supported by field observations because the sediment at this station was unusually black (Table 4). Extremely high organic matter content (12–20%), compared to other stations, support possible anthropogenic influences (Figure 9, Table 5). Andersen et al. [37] reported a profile in the Humber estuary very similar to the K90 profile and they associated it with anthropogenic activities. They also reported a profile with uniform 137Cs activities along the whole profile (up to 80 cm depth) and interpreted it as a consequence of very fast sediment deposition. Unlike them, Al-Zamel et al. [36] interpreted the profile with uniform 137Cs activities up to a 50 cm depth as a consequence of strong sediment mixing. It was earlier reported that the material originating from outside of the Bay was discharged into the Bay, especially around the former “Adriavinil” factory [28,33]. However, the exact locations of the discharge and the amount of the discharged material are not known. The K90 station is located in the nearest vicinity of the factory and it was concluded that this discharge was reflected in the K90 profile. Lower 137Cs activities up to a 30 cm depth in the profile were attributed to the discharged material, while the 137Cs activity at a 30–40 cm depth represents autochthonous sediment, very likely deposited in 1986. This means that the material discharge at the K90 station occurred after 1986. It is assumed that 137Cs would also be detected in the sediment below the 40 cm depth. Two sources of material are implied by both 137Cs and organic matter profiles (Figure 9). A very similar profile in front of the factory was observed up to a 40 cm depth in February 2001 by Mikac et al. [28]. It was also interpreted to be a result of the discharge of allochthonous material into the sea after 1986, more precisely between 1986 and 1991.

4.2. Absence of 137Cs in Sediment

Special attention should be given to the stations where no 137Cs was detected, i.e., where the 137Cs activities were below the MDA. All of these stations are located in the shallow parts of the Bay at depths of 1.5–14.0 m (Figure 1, Table 1), where the sediments are coarse-grained and a majority of the sand can be visually inspected in the field (Table 4). This is in accordance with the results of low organic matter content (Table 5). Since all of these stations are at depths above the WBDSW, the sediments there are exposed to the influence of the waves and there is no prominent sedimentation of the fine-grained material and organic matter. The sampled profiles at all of these stations were very short (maximum 15 cm) because it was not possible to collect longer cores with the equipment used due to the low plasticity of the sediment. However, it can be assumed that the granulometric and mineral composition of the sediment at these stations does not change significantly with depth and that 137Cs is not present in the deeper segments. The uniform granulometric composition at the individual stations is shown at the KC and KK stations (Table 3). The homogeneous granulometric and mineral compositions of Kaštela Bay sediment have also been reported by other authors [25,31,49].
Based on the absence of 137Cs in the sediments, it can be suggested that there has not been sedimentation at these stations since at least 1954, that sedimentation has been extremely slow, making it difficult to retain the signal of 137Cs, or that the uppermost part of the sediment column has been eroded away. Thus, sediment accumulation is not a dominant process at these stations. It is also possible that the coarse-grained material is deposited there, while the fine-grained particles with bound 137Cs are carried away by the currents and waves into the deeper parts of the Bay due to the high–energy environment of these stations. Frignani et al. [38] also considered the extremely low sedimentation rate of the fine-grained particles carrying 137Cs as a reason for very low 137Cs activities in the Adriatic Sea sediments. It can additionally be assumed that the dominant processes at the eight stations without 137Cs might be erosion induced by waves or the resuspension of fine-grained particles and their relocation to the deeper parts of the Bay.

4.3. Future Research Direction

The presented study and the data could further be corroborated with additional data on the mineralogical composition of the sediments. More precise grain size data, using granulometry rather than visual inspection for all of the samples, would be beneficial. Determining the presence of sedimentary structures in the samples would also be very useful in supporting the use of 137Cs as a tracer of sedimentation processes. By incorporating additional data, it would be possible to differentiate some processes when the 137Cs profiles are ambiguous.
Knowledge of the sedimentation processes and the sediment dynamics is important for coastal area management and planning because sediments can serve as both a repository and a source of various contaminants/pollutants. Sediment dynamics is directly linked to contaminants/pollutants dynamics. Additionally, it should be taken into account when planning construction projects in coastal areas. This is especially important in areas exposed to anthropogenic pressure.

5. Conclusions

The processes of sedimentation and its associated influences are well recorded in the 137Cs depth profiles and even in the sediments with no detectable 137Cs. The patterns of the 137Cs profiles allow us to distinguish the types of sedimentation and the depositional conditions with respect to various sedimentary environments. It also helps to unveil the input pathways of terrigenous material into Kaštela Bay. The sedimentation conditions and the 137Cs distribution in Kaštela Bay are influenced by sea bottom morphology, sea bottom depth, distance from the coast, terrigenous input, sediment grain size, and the organic matter content.
Sedimentary environments of low and high energy in the Bay can be characterised by the 137Cs distribution and the relevant processes can be further differentiated. Generally, the deeper, central and southern parts of the Bay are low-energy environments, where mostly continuous, undisturbed sedimentation takes place with only occasional sedimentation anomalies. The shallow parts of the Bay are generally high-energy environments, especially the western part of the Bay, where wave-induced erosion or extremely slow deposition of coarse-grained sediment predominate. The resuspension of fine-grained particles is also potentially significant in the shallow parts of the Bay, which is consequently followed by resedimentation in the deeper parts with more favourable sedimentation conditions. It was observed that the upper 10 cm of the sediments from different parts of the Bay are the most exposed to homogenisation, whether as a result of physical sediment reworking or 137Cs chemical mobility.
Fluvial influence is significant in the easternmost part of the Bay near the river mouth of the Jadro River, where sediment mixing and increased input were observed. Anthropogenic influence was registered in the sediments of Kaštela Bay. It was observed as an increased material input into the east part of the Bay, especially in the easternmost part, and as an intensive sediment mixing/homogenisation to the 40–50 cm depth. Anthropogenic influence is very pronounced near the former “Adriavinil” factory, where a discharge of allochthonous material into the sea after 1986 was documented.
It is worth noting that the main sediment deposition areas are not the deepest parts of the Bay, as may be expected, but the moderately deep, central parts and the river mouth. The sediment supply is weaker in the deepest parts of the Bay than in the moderately deep areas, resulting in slower sedimentation in the deepest parts.
Our results demonstrate that by using a sufficient number of carefully selected 137Cs depth profiles, the dynamics of the whole system (in this case, a bay) or of its individual parts can be studied in detail. 137Cs profiles are a suitable means to research sedimentation processes, their relationships, and, in part, sediment origin. Even the absence of 137Cs can offer very useful information about sediment dynamics. It is also very important to be aware that different processes can very often have the same impact on the 137Cs distribution in a sediment profile. Therefore, it is necessary to consider all of the available data about a sedimentary environment, such as the source of the material (known or assumed), the position of the sampling station in relation to the coast or the sea bottom depth, as well as to compare the 137Cs activities of different profiles. Using several profiles positioned in a sequence, conclusions or assumptions regarding material input and its transport direction can be drawn. In various cases, the use of other markers of sedimentation processes will be needed to differentiate between several possible processes. The slicing width of the segments can also have a significant impact on the shape of the profiles and it should be adjusted to the needs of individual research.

Author Contributions

Conceptualization, I.L.M.; methodology, I.L.M. and D.B.; validation, I.L.M.; investigation, I.L.M., N.C., V.O. and K.Š.; resources, D.B.; data curation, I.L.M.; writing—original draft preparation, I.L.M.; writing—review and editing, I.L.M.; visualization, I.L.M.; supervision, I.L.M.; project administration, I.L.M. and D.B.; funding acquisition, D.B. All authors have read and agreed to the published version of the manuscript.

Funding

This research was funded by the Ministry of Science, Education, and Sports of the Republic of Croatia, grant number 098-0982934-2713 (“Radionuclides and trace elements in environmental systems” project). Financial support from the Kaštela town was also received.

Data Availability Statement

Data presented in this study are available on request from the corresponding author. The numerical data are presented in graphical form.

Acknowledgments

The authors would like to thank the crew of the research vessel “Hidra” of the Hydrographic Institute in Split for their assistance in sampling.

Conflicts of Interest

The authors declare no conflict of interest. The funders had no role in the design of the study; in the collection, analyses, or interpretation of data; in the writing of the manuscript, or in the decision to publish results.

References

  1. Masson, O.; Baeza, A.; Bieringer, J.; Brudecki, K.; Bucci, S.; Cappai, M.; Carvalho, F.P.; Connan, O.; Cosma, C.; Dalheimer, A.; et al. Tracking of Airborne Radionuclides from the Damaged Fukushima Dai-Ichi Nuclear Reactors by European Networks. Environ. Sci. Technol. 2011, 45, 7670–7677. [Google Scholar] [CrossRef] [PubMed]
  2. Thakur, P.; Ballard, S.; Nelson, R. Radioactive fallout in the United States due to the Fukushima nuclear plant accident. J. Environ. Monit. 2012, 14, 1317–1324. [Google Scholar] [CrossRef] [PubMed]
  3. Yoshida, N.; Kanda, J. Tracking the Fukushima Radionuclides. Science 2012, 336, 1115–1116. [Google Scholar] [CrossRef] [PubMed]
  4. Ayçik, G.A.; Çetaku, D.; Erten, H.N.; Salihoğlu, I. Dating of Black Sea sediments from Romanian coast using natural 210Pb and fallout 137Cs. J. Radioanal. Nucl. Chem. 2004, 259, 177–180. [Google Scholar] [CrossRef]
  5. Papastefanou, C. Radioactive nuclides as tracers of environmental processes. J. Radioanal. Nucl. Chem. 2006, 267, 315–320. [Google Scholar] [CrossRef]
  6. Saxena, D.P.; Joos, P.; van Grieken, R.; Subramanian, V. Sedimentation rate of the floodplain sediments of the Yamuna river basin (tributary of the river Ganges, India) by using 210Pb and 137Cs techniques. J. Radioanal. Nucl. Chem. 2002, 251, 399–408. [Google Scholar] [CrossRef]
  7. Børretzen, P.; Salbu, B. Fixation of Cs to marine sediments estimated by a stochastic modelling approach. J. Environ. Radioact. 2002, 61, 1–20. [Google Scholar] [CrossRef]
  8. Gascó, C.; Antón, M.P.; Pozuelo, M.; Meral, J.; González, A.M.; Papucci, C.; Delfanti, R. Distributions of Pu, Am and Cs in margin sediments from the western Mediterranean (Spanish coast). J. Environ. Radioact. 2002, 59, 75–89. [Google Scholar] [CrossRef]
  9. Garcia-Orellana, J.; Pates, J.M.; Masqué, P.; Bruach, J.M.; Sanchez-Cabeza, J.A. Distribution of artificial radionuclides in deep sediments of the Mediterranean Sea. Sci. Total Environ. 2009, 407, 887–898. [Google Scholar] [CrossRef]
  10. Park, G.; Lin, X.J.; Kim, W.; Kang, H.D.; Lee, H.L.; Kim, Y.; Doh, S.H.; Kim, D.S.; Yun, S.G.; Kim, C.K. Properties of 137Cs in marine sediments off Yangnam, Korea. J. Environ. Radioact. 2004, 77, 285–299. [Google Scholar] [CrossRef]
  11. Avery, S.V. Fate of Caesium in the Environment: Distribution between the Abiotic and Biotic Components of Aquatic and Terrestrial Ecosystems. J. Environ. Radioact. 1996, 30, 139–171. [Google Scholar] [CrossRef]
  12. Ahn, Y.S.; Mizugaki, S.; Nakamura, F.; Nakamura, Y. Historical change in lake sedimentation in Lake Takkobu, Kushiro Mire, northern Japan over last 300 years. Geomorphology 2006, 78, 321–334. [Google Scholar] [CrossRef]
  13. Kotilainen, A.T.; Kotilainen, M.M.; Vartti, V.-P.; Hutri, K.-L.; Virtasalo, J.J. Chernobyl still with us: 137Caesium activity contents in seabed sediments from the Gulf of Bothnia, northern Baltic Sea. Mar. Pollut. Bull. 2021, 172, 112924. [Google Scholar] [CrossRef] [PubMed]
  14. Kumar, B.; Rai, S.P.; Nachiappan, R.P.; Kumar, U.S.; Singh, S.; Diwedi, V.K. Sedimentation rate in North Indian lakes estimated using 137Cs and 210Pb dating techniques. Curr. Sci. 2007, 92, 1416–1420. [Google Scholar]
  15. Pavičić-Hamer, D.; Barišić, D.; Šimunac, B.; Petrinec, B.; Štrok, M. 137Cs distribution in the northern Adriatic Sea. J. Radioanal. Nucl. Chem. 2016, 309, 989–998. [Google Scholar] [CrossRef]
  16. Petrinec, B.; Franić, Z.; Ilijanić, N.; Miko, S.; Štrok, M.; Smodiš, B. Estimation of sedimentation rate in the middle and south Adriatic Sea using 137Cs. Radiat. Prot. Dosim. 2012, 151, 102–111. [Google Scholar] [CrossRef] [PubMed]
  17. San Miguel, E.G.; Bolívar, J.P.; García-Tenorio, R. Vertical distribution of Th-isotope ratios, 210Pb, 226Ra and 137Cs in sediment cores from an estuary affected by anthropogenic releases. Sci. Total Environ. 2004, 318, 143–157. [Google Scholar] [CrossRef]
  18. Schell, W.R.; Barnes, R.S. Environmental isotope and anthropogenic tracers of recent lake sedimentation. In Handbook of Environmental Isotope Geochemistry: The Terrestrial Environment, 1st ed.; Fritz, P., Fontes, J.C., Eds.; Elsevier: Amsterdam, The Nederlands, 1986; Volume 2/B, pp. 169–206. [Google Scholar]
  19. Yao, S.C.; Li, S.J.; Zhang, H.C. 210Pb and 137Cs dating of sediments from Zigetang Lake, Tibetan Plateau. J. Radioanal. Nucl. Chem. 2008, 278, 55–58. [Google Scholar] [CrossRef]
  20. Li, Y.; Zhang, W.; Lin, B.; Sun, J.; Feng, H. Radionuclides: Properties, Behaviour and Potential Health Effects, 1st ed.; Nova Science Publishers, Inc.: New York, NY, USA, 2020; pp. 83–96. [Google Scholar]
  21. Abril, J.M. Difficulties in interpreting fast mixing in the radiometric dating of sediments using 210Pb and 137Cs. J. Paleolimnol. 2003, 30, 407–414. [Google Scholar] [CrossRef]
  22. Lovrenčić Mikelić, I.; Oreščanin, V.; Škaro, K. Variation of sedimentation rate in the semi-enclosed bay determined by 137Cs distribution in sediment (Kaštela Bay, Croatia). J. Environ. Radioact. 2017, 166, 112–125. [Google Scholar] [CrossRef]
  23. Bogner, D. Superficial Sediments and Impact of Their Physico–Chemical Properties on the Distribution of Heavy Metals in the Kastela Bay (in Croatian). Master’s Thesis, Faculty of Science, Zagreb, Croatia, 27 June 1996. [Google Scholar]
  24. Bogner, D.; Odžak, N.; Juračić, M.; Barić, A.; Tibljaš, D. Heavy metals in sediments of the Kaštela Bay. In Water Pollution IV: Modelling, Measuring and Prediction, 1st ed.; Rajar, R., Brebbia, C.A., Eds.; Computational Mechanics Publications: Southampton, UK, 1997; pp. 87–94. [Google Scholar]
  25. Bogner, D.; Juracic, M.; Odžak, N.; Baric, A. Trace metals in fine grained sediments of the Kaštela Bay, Adriatic Sea. Water Sci. Technol. 1998, 38, 169–175. [Google Scholar] [CrossRef]
  26. Kljaković–Gašpić, Z.; Odžak, N.; Ujević, I.; Zvonarić, T.; Horvat, M.; Barić, A. Biomonitoring of mercury in polluted coastal area using transplanted mussels. Sci. Total Environ. 2006, 368, 199–209. [Google Scholar] [CrossRef] [PubMed]
  27. Kwokal, Ž.; Frančišković-Bilinski, S.; Bilinski, H.; Branica, M. A comparison of anthropogenic mercury pollution in Kaštela Bay (Croatia) with pristine estuaries in Öre (Sweden) and Krka (Croatia). Mar. Pollut. Bull. 2002, 44, 1152–1157. [Google Scholar] [CrossRef]
  28. Mikac, N.; Foucher, D.; Kwokal, Ž.; Barišić, D. Mercury and Radionuclides in Sediments of the Kaštela Bay (Croatia)—Evaluation of the Sediment Pollution History. Croat. Chem. Acta 2006, 79, 85–93. [Google Scholar]
  29. Odžak, N.; Zvonarić, T.; Gašpić, Z.K.; Horvat, M.; Barić, A. Biomonitoring of mercury in the Kaštela Bay using transplanted mussels. Sci. Total Environ. 2000, 261, 61–68. [Google Scholar] [CrossRef]
  30. Tudor, M.; Zvonarić, T.; Horvat, M.; Stegnar, P. Vertical transport of mercury by settling particles in Kaštela Bay. Acta Adriat. 1991, 32, 753–763. [Google Scholar]
  31. Ujević, I.; Odžak, N.; Barić, A. Relationship between Mn, Cr, Pb and Cd concentrations, granulometric composition and organic matter content in the marine sediments from a contaminated coastal area. Fresenius Environ. Bull. 1998, 7, 183–189. [Google Scholar]
  32. Ujević, I.; Odžak, N.; Barić, A. Trace metal accumulation in different grain size fractions of the sediments from a semi-enclosed bay heavily contaminated by urban and industrial wastewaters. Water Res. 2000, 34, 3055–3061. [Google Scholar] [CrossRef]
  33. Orescanin, V.; Barisic, D.; Lovrencic, I.; Mikelic, L.; Rozmaric-Macefat, M.; Pavlovic, G.; Lulic, S. The influence of fly and bottom ash deposition on the quality of Kastela Bay sediments. Environ. Geol. 2005, 49, 53–64. [Google Scholar] [CrossRef]
  34. Barić, A.; Marasović, I.; Gačić, M. Eutrophication phenomenon with special reference to the Kaštela Bay. Chem. Ecol. 1992, 6, 51–68. [Google Scholar] [CrossRef]
  35. Marasović, I.; Ninčević, Ž.; Kušpilić, G.; Marinović, S.; Marinov, S. Long-term changes of basic biological and chemical parameters at two stations in the middle Adriatic. J. Sea Res. 2005, 54, 3–14. [Google Scholar] [CrossRef]
  36. Al-Zamel, A.Z.; Bou-Rabee, F.; Al-Sarawi, M.A.; Olszewski, M.; Bem, H. Determination of the sediment deposition rates in the Kuwait Bay using 137Cs and 210Pb. Nukleonika 2006, 51 (Suppl. S2), S39–S44. [Google Scholar]
  37. Andersen, T.J.; Mikkelsen, O.A.; Møller, A.L.; Pejrup, M. Deposition and mixing depths on some European intertidal mudflats based on 210Pb and 137Cs activities. Cont. Shelf Res. 2000, 20, 1569–1591. [Google Scholar] [CrossRef]
  38. Frignani, M.; Sorgente, D.; Langone, L.; Albertazzi, S.; Ravaioli, M. Behavior of Chernobyl radiocesium in sediments of the Adriatic Sea off the Po River delta and the Emilia-Romagna coast. J. Environ. Radioact. 2004, 71, 299–312. [Google Scholar] [CrossRef]
  39. Lu, X.; Matsumoto, E. Recent sedimentation rates derived from 210Pb and 137Cs methods in Ise Bay, Japan. Estuar. Coast. Shelf Sci. 2005, 65, 83–93. [Google Scholar] [CrossRef]
  40. Pfitzner, J.; Brunskill, G.; Zagorskis, I. 137Cs and excess 210Pb deposition patterns in estuarine and marine sediment in the central region of the Great Barrier Reef Lagoon, north-eastern Australia. J. Environ. Radioact. 2004, 76, 81–102. [Google Scholar] [CrossRef]
  41. Tudor, M. Mercury Distribution and Residence Time in the Sea and Sediment of the Kastela Bay (in Croatian). Ph.D. Thesis, Faculty of Science, Zagreb, Croatia, 1993. [Google Scholar]
  42. Barić, A. Ecological problems of the Kastela Bay and how to solve them (in Croatian). Hrvat. Vodoprivreda 1995, 34, 33–36. [Google Scholar]
  43. Mikelić, I.L.; Oreščanin, V.; Barišić, D. 40K, 226Ra, 232Th, 238U and 137Cs relationships and behavior in sedimentary rocks and sediments of a karstic coastal area (Kaštela Bay, Croatia) and related rocks and sediments’ differentiation. Environ. Sci. Pollut. Res. 2021, 28, 51497–51510. [Google Scholar] [CrossRef]
  44. Lovrenčić Mikelić, I.; Barišić, D. Radiological risks from 40 K, 226Ra and 232Th in urbanised and industrialised karstic coastal area (Kaštela Bay, Croatia). Environ. Sci. Pollut. Res. 2022, 29, 54632–54640. [Google Scholar] [CrossRef]
  45. Marinčić, S.; Magaš, N.; Borović, I. Basic Geological Map of Yugoslavia, Sheet SPLIT. 1:100 000; Federal Geological Institute: Belgrade, SFR Yugoslavia, 1971. [Google Scholar]
  46. Shepard, F.P. Nomenclature based on sand-silt-clay relations. J. Sediment. Petrol. 1954, 24, 151–158. [Google Scholar]
  47. Folk, R.L. The distinction between grain size and mineral composition in sedimentary rock nomenclature. J. Geol. 1954, 62, 344–356. [Google Scholar] [CrossRef]
  48. Franić, Z.; Marović, G.; Lokobauer, N.; Senčar, J. Radiocaesium activity concentrations in milk in the Republic of Croatia and dose assessment. Environ. Monit. Assess. 1998, 51, 695–704. [Google Scholar] [CrossRef]
  49. Bogner, D.; Matijević, A. Variety of physical-chemical characteristics of Holocene sediments from the middle Adriatic Sea. Acta Adriat. 2016, 57, 3–16. [Google Scholar]
  50. Baskaran, M.; Asbill, S.; Santschi, P.; Brooks, J.; Champ, M.; Adkinson, D.; Colmer, M.R.; Makeyev, V. Pu, Cs-137 and excess Pb-210 in Russian arctic sediments. Earth Planet. Sci. Lett. 1996, 140, 243–257. [Google Scholar] [CrossRef]
  51. Papaefthymiou, H.; Papatheodorou, G.; Moustakli, A.; Christodoulou, D.; Geraga, M. Natural radionuclides and 137Cs distributions and their relationships with sedimentological processes in Patras Harbour, Greece. J. Environ. Radioact. 2007, 94, 55–74. [Google Scholar] [CrossRef] [PubMed]
  52. Rubio, L.; Linares-Rueda, A.; Dueñas, C.; Fernández, M.C.; Clavero, V.; Niell, F.X.; Fernández, J.A. Sediment accumulation rate and radiological characterisation of the sediment of Palmones River estuary (southern Spain). J. Environ. Radioact. 2003, 65, 267–280. [Google Scholar] [CrossRef]
  53. Boust, D. Distribution and inventories of some artificial and naturally occurring radionuclides in medium to coarse-grained sediments of the channel. Cont. Shelf Res. 1999, 19, 1959–1975. [Google Scholar] [CrossRef]
  54. Tissot, B.P.; Welte, D.H. Petroleum Formation and Occurrence, 1st ed.; Springer: Berlin/Heidelberg, Germany, 1978; pp. 55–62. [Google Scholar]
  55. Margeta, J. CAMP ”Kaštela bay”, Croatia. In Proceedings of the MAP/METAP Workshop ”Coastal Area Management Programmes: Improving the Implementation”, 1st ed.; UNEP-MAP/PAP: Split, Croatia, 2002; pp. 59–74. [Google Scholar]
  56. Alfirević, S. Contribution on the knowledge of the Kastela Bay geology (in Croatian). Acta Adriat. 1980, 21, 43–53. [Google Scholar]
  57. Ergül, H.A.; Topcuoğlu, S.; Ölmez, E.; Kirbaşoğlu, Ç. Radionuclides in a sediment trap and bottom sediment samples from the eastern Turkish coast of the Black Sea. J. Radioanal. Nucl. Chem. 2006, 268, 133–136. [Google Scholar] [CrossRef]
  58. Wei, T.; Chen, Z.; Duan, L.; Gu, J.; Saito, Y.; Zhang, W.; Wang, Y.; Kanai, Y. Sedimentation rates in relation to sedimentary processes of the Yangtze Estuary, China. Estuar. Coast. Shelf Sci. 2007, 71, 37–46. [Google Scholar] [CrossRef]
Figure 1. Location of the studied area and contour bathymetric map of Kaštela Bay with sampling stations representative of sedimentation processes. Squares denote cores with depth profiles of 137Cs massic activities. Triangles denote cores with no 137Cs detected at any sampled depth (137Cs activities below minimum detectable activity).
Water 14 02655 g001
Figure 2. Undisturbed 137Cs massic activity profiles with peaks representing sediment surfaces of 1963 and 1986 and organic matter mass fraction profiles. Measurement uncertainties are expressed with k = 2 for normal distribution.
Water 14 02655 g002
Figure 3. Undisturbed 137Cs massic activity profiles without recognisable marker peaks and organic matter mass fraction profiles. Measurement uncertainties are expressed with k = 2 for normal distribution.
Water 14 02655 g003
Figure 4. Profiles with (possible) 137Cs peak representing sediment surface of 1963 and with a peak representing sediment surface of 1986, if present, and organic matter mass fraction profiles. Measurement uncertainties are expressed with k = 2 for normal distribution.
Water 14 02655 g004
Figure 5. 137Cs massic activity profiles reflecting increased sediment input and/or sediment mixing and organic matter mass fraction profiles. Measurement uncertainties are expressed with k = 2 for normal distribution.
Water 14 02655 g005
Figure 6. 137Cs massic activity profiles reflecting subsequent 137Cs input after 1986 and organic matter mass fraction profiles. Measurement uncertainties are expressed with k = 2 for normal distribution.
Water 14 02655 g006
Figure 7. 137Cs massic activity profiles with uniform 137Cs activities in surface sediment and organic matter mass fraction profiles. Measurement uncertainties are expressed with k = 2 for normal distribution.
Water 14 02655 g007
Figure 8. 137Cs massic activity profiles reflecting anomalies in sedimentation processes and organic matter mass fraction profiles. Measurement uncertainties are expressed with k = 2 for normal distribution.
Water 14 02655 g008
Figure 9. Disturbed 137Cs massic activity profiles reflecting anthropogenic influence and organic matter mass fraction profiles. Measurement uncertainties are expressed with k = 2 for normal distribution.
Water 14 02655 g009
Figure 10. Scatter plot for 137Cs massic activities vs. organic matter mass fractions. Extreme values for organic matter are excluded.
Water 14 02655 g010
Table 1. Geographical coordinates and sea bottom depths of sampling stations.
Sampling
Station
Latitude (N)Longitude (E)Sea Bottom Depth
(m)
Sampling
Station
Latitude (N)Longitude (E)Sea Bottom Depth
(m)
K0343°32.525′16°21.713′22.0K4643°30.386′ 16°20.206′26.0
K0443°32.535′ 16°22.442′16.0K5243°29.855′ 16°20.938′22.0
K1243°32.009′ 16°20.177′22.0K5343°29.830′ 16°21.703′37.0
K1343°31.993′ 16°20.917′30.0K5543°29.820′ 16°23.165′45.0
K1443°32.000′ 16°21.707′32.0K5843°29.824′ 16°25.315′41.0
K1543°31.986′ 16°22.431′33.0K5943°29.291′ 16°23.884′50.0
K1643°32.002′ 16°23.203′32.0K6043°31.738′ 16°27.988′12.0
K1743°31.980′ 16°23.868′33.0K6343°30.054′ 16°25.344′14.0
K1843°32.040′ 16°24.431′30.0K6943°30.358′ 16°23.344′33.0
K1943°32.008′ 16°25.160′14.0K7243°32.802′ 16°23.795′4.0
K2243°32.006′ 16°27.539′16.0K7343°32.526′ 16°24.171′15.0
K2343°31.990′ 16°27.975′10.0K8443°32.926′ 16°22.404′4.0
K2543°31.445′ 16°18.517′11.5K8643°31.460′ 16°16.724′2.0
K3743°30.911′ 16°19.361′14.0K8843°31.269′ 16°15.954′1.5
K3843°30.868′ 16°20.169′13.5K9043°32.699′ 16°25.117′3.0
K4043°30.915′ 16°21.704′38.0KC43°32.236′16°19.957′12.0
K4243°30.900′ 16°23.185′37.0KK43°30.588′16°22.712′50.0
K4543°30.966′ 16°25.408′8.0
Table 2. Basic statistical parameters of 137Cs massic activities in sediment; for samples with activities above minimum detectable activity; activities are expressed in Bq kg−1; x ¯ , mean value; SD, standard deviation; N, number of results.
Statistical ParameterOtliers Not
Excluded
Otliers
Excluded
x ¯ 2.502.39
Median1.451.40
Minimum0.100.10
Maximum9.808.00
1. quartile0.500.50
3. quartile4.404.25
SD2.442.29
N206203
Table 3. Grain size distribution in sediment at the KC and KK sampling stations [22]; Mz, mean size; Md, median.
SegmentSegment Depth (cm)Gravel
(%)
Sand
(%)
Silt
(%)
Clay
(%)
Mz (μm)Md (μm)
KC010–516.057.523.53.0274.20435.27
KC025–107.566.521.05.0168.79233.26
KC0310–1511.561.520.07.0193.89307.78
KC0415–2010.561.023.55.0180.91250.00
KC0520–2510.060.021.09.0150.38203.06
KC0625–309.059.524.07.5150.38189.46
KK010–50.06.557.536.06.657.29
KK025–100.06.557.536.06.576.35
KK0310–150.06.557.536.06.576.35
KK0415–200.04.560.035.56.356.35
KK0520–250.05.057.537.55.925.92
KK0625–300.06.056.537.56.495.92
KK0730–400.53.557.538.56.135.92
KK0840–500.53.556.539.55.925.92
Table 4. Grain size composition of sediments visually determined on-site; +, presence of the specific grain size; G, gravel; S, sand; CS, clay and silt.
Sampling StationGrain SizeComment
GSCS
K03+++Sediment predominantly sand and clay, gravels found in segments K0307 and K0308
K04 +
K12 +
K13 +
K14 +
K15 +
K16 +
K17 +
K18 +
K19+++Mostly sand and gravel, some clay and silt, upper segments are more coarse-grained
K22 +Possible bioturbation, worm colony found
K23 +Plenty of cement found
K25 + Plenty of shell debris found
K37 +
K38 +
K40 +
K42 +
K45 +
K46 ++Rich in organic matter
K52 ++Upper segments are more coarse-grained
K53 +
K55 +
K58 +
K59 +
K60 +Watery mud, unpleasant odour
K63 ++Upper segments are sandier, plenty of organic matter found (grasses), some stones found
K69 +
K72 + Plenty of shell debris found
K73 ++Fly ash found in segments K7301 and K7308
K84 + Plenty of fine shell debris and a larger shell found
K86 + Plenty of shells, mixed sediment due to shells collecting
K88++
K90 +Black sediment
Table 5. Basic statistical parameters of organic matter mass fractions in sediment; fractions are expressed in %; EV, extreme value; x ¯ , mean value; SD, standard deviation; N, number of results.
Statistical
Parameter
All SamplesAll Samples, EVs ExcludedOnly Samples with Detected 137Cs,
EVs Excluded
Only Samples with No
Detected 137Cs
x ¯ 3.413.023.131.70
Median3.183.133.201.73
Minimum1.011.011.021.01
Maximum20.25.635.632.32
SD2.270.960.910.37
N22221419816
Publisher’s Note: MDPI stays neutral with regard to jurisdictional claims in published maps and institutional affiliations.

