Article

Effective Removal of Pb2+ from Aqueous Solution Using Magnetic Mesoporous Silica Prepared by Rubidium-Containing Biotite Leaching Residues and Wastewater

1
School of Minerals Processing and Bioengineering, Central South University, Changsha 410083, China
2
School of Life Sciences, Central South University, Changsha 410083, China
3
Aerospace Kaitian Environmental Technology Co., Ltd., Changsha 410100, China
*
Authors to whom correspondence should be addressed.
These authors contributed equally to the work.
Water 2022, 14(17), 2652; https://doi.org/10.3390/w14172652
Submission received: 12 July 2022 / Revised: 25 August 2022 / Accepted: 25 August 2022 / Published: 28 August 2022
(This article belongs to the Section Wastewater Treatment and Reuse)

Abstract

:
The rubidium leaching process from biotite generates a large amount of waste materials that should ideally be reused for heavy metal ion adsorption so as not to create environmental problems. Ferric oxide/mesoporous silica (FO/MS) is a novel adsorbent used for heavy metal ion removal with a high removal capacity of Pb2+ (143.47 mg/g within 60 min) that was prepared for the first time by comprehensively utilizing both rubidium-containing biotite leaching residues and wastewater. The incorporation of mesoporous silica prepared by leaching residues could provide a porous framework and channel for depositing ferric oxide. Mesoporous channels have a high specific surface area that improves the adsorption activity and capacity of the material. Additionally, in a pH study, the adsorptive thermodynamic and dynamic analyses, as well as XPS and FTIR analyses, verified the adsorption properties involved in surface complexing and electrostatic binding. The surface complexation process mainly was the interaction of Pb2+ with surface hydroxyl groups. This work provided a novel and effective strategy for preparing waste solid-based heavy metal ion adsorption and expanded technologies for treating acid leaching wastewater. The adsorbents of FO/MS with a high Pb2+ adsorption capacity suggested that, compared with other materials, it is a suitable remediation material for Pb2+ contaminated water.

1. Introduction

Rubidium is mainly found in minerals such as biotite, muscovite, feldspar and kaolin. The two most common technological methods for removing rubidium from carrier minerals are chlorination roasting-water leaching and direct acid leaching. For the chlorination roasting-water leaching process at high temperatures, oxides such as silica, potassium oxide, ferric oxide, alumina and rubidium contained in the ores would be decomposed by highly active hydrogen chloride produced from the action of alkali metal chloride [1]. In the process of direct acid leaching, hydrogen ions quickly destroy the crystal structure of silicate minerals under strong acid conditions. The rubidium trapped inside the silicate is dissolved in the strong acid solution [2]. The waste materials generated by these processes deplete the land’s resources and damage ecological systems.
Treatment options for these solid waste residues and acid water are in high demand, as they would be more economical for rubidium resources and friendlier to the ecological environment. The leaching residue mainly contains quartz and silicate minerals, which are difficult to acidulate without hydrofluoric acid. Zeng et al. [3] synthesized heavy metal adsorbents while leaching rubidium from biotite with oxalic acid. According to their study’s results, rubidium was leached with an efficiency of 96.54%, and the modified leaching residue adsorbent had a maximum Hg2+ adsorption capacity of 357.1 mg/g. Peng et al. [4] adopted rubidium and potassium leaching residues to prepare active zeolites for the adsorption of lead ions. The maximum adsorption capacity of the active zeolites adsorbent was only 25.88 mg/g. Many studies have focused on leaching, extraction or utilization of rubidium; few studies have focused on the co-utilization of elements such as silica, aluminum and iron, which has resulted in the low utilization of associated resources [5]. Moreover, it is still necessary to find ways to recycle acid-leaching wastewater. In the process of acid leaching and extraction, many alkaline and transition metal ions such as Ca2+, Mg2+, Fe2+ and Al3+ would be liberated into the acid-leaching water [3,6]. By using heterogenous activations based on transition metals to activate peroxymonosulfate (PMS) or peroxydisulfate (PDS), novel catalysts are created [7]. Another approach is to use the oxidation-reduction properties of Fe or Mn elements to prepare an Fe-based or Mn-based permeable reactive barrier (PRB) filled with adsorbents [8]. If high-efficiency rubidium extraction and comprehensive utilization of both wastewater and residues could be simultaneously achieved, it would provide new ideas for full resource utilization and environmental protection.
This study proposed a novel process for comprehensively utilizing rubidium-containing biotite rock, including the leaching process and preparation of adsorbents from wastewater and residues for treating Pb2+ polluted wastewater. For the comprehensive utilization of biotite and effective extraction of rubidium, we used sulfuric acid as the direct leaching agent. Investigations were also conducted into iron and rubidium leaching behaviors. Then, mesoporous silica materials were prepared from leaching residues. The iron-based materials were acquired via precipitation from the leaching-acid wastewater. One of the reasons for embedding FO into the structure of mesoporous silica was that its structure is intended to provide a larger specific surface area and more load space for the FO material. Another reason was that the growth of ferric oxide crystals in the mesoporous space would be limited. The specific surface area of this mesoporous material may be high, exposing more active adsorption sites and boosting adsorption efficiency and capacity. Its Pb2+ removal characteristics and associated processes were carefully studied in more detail.

2. Materials and Methods

2.1. Regents and Materials

The rubidium-containing raw biotite rock came from Guangdong province, China. An X-ray fluorescence spectrometer (XRF) was used to detect the elemental composition of the concentrates. The details are shown in Table 1. The H, C, and N elements collectively were 19.42% because XRF cannot quantitatively analyze them. NaOH, HCl, sulfuric acid, cetyl trimethyl ammonium bromide (CTAB) and analytical grade ethanol were provided by Kemiou Chemical Reagent Limited Company, Tianjin, China. The Pb2+ solution was prepared from Pb(NO3)2 that was purchased from the Sinopharm Group Chemical Reagent Limited Company, Beijing, China. The pH value of the solution was adjusted using 0.1 mol/L NaOH and 0.1 mol/L HCl. All water used was ultra-pure deionized water (18.2 MΩ/cm).

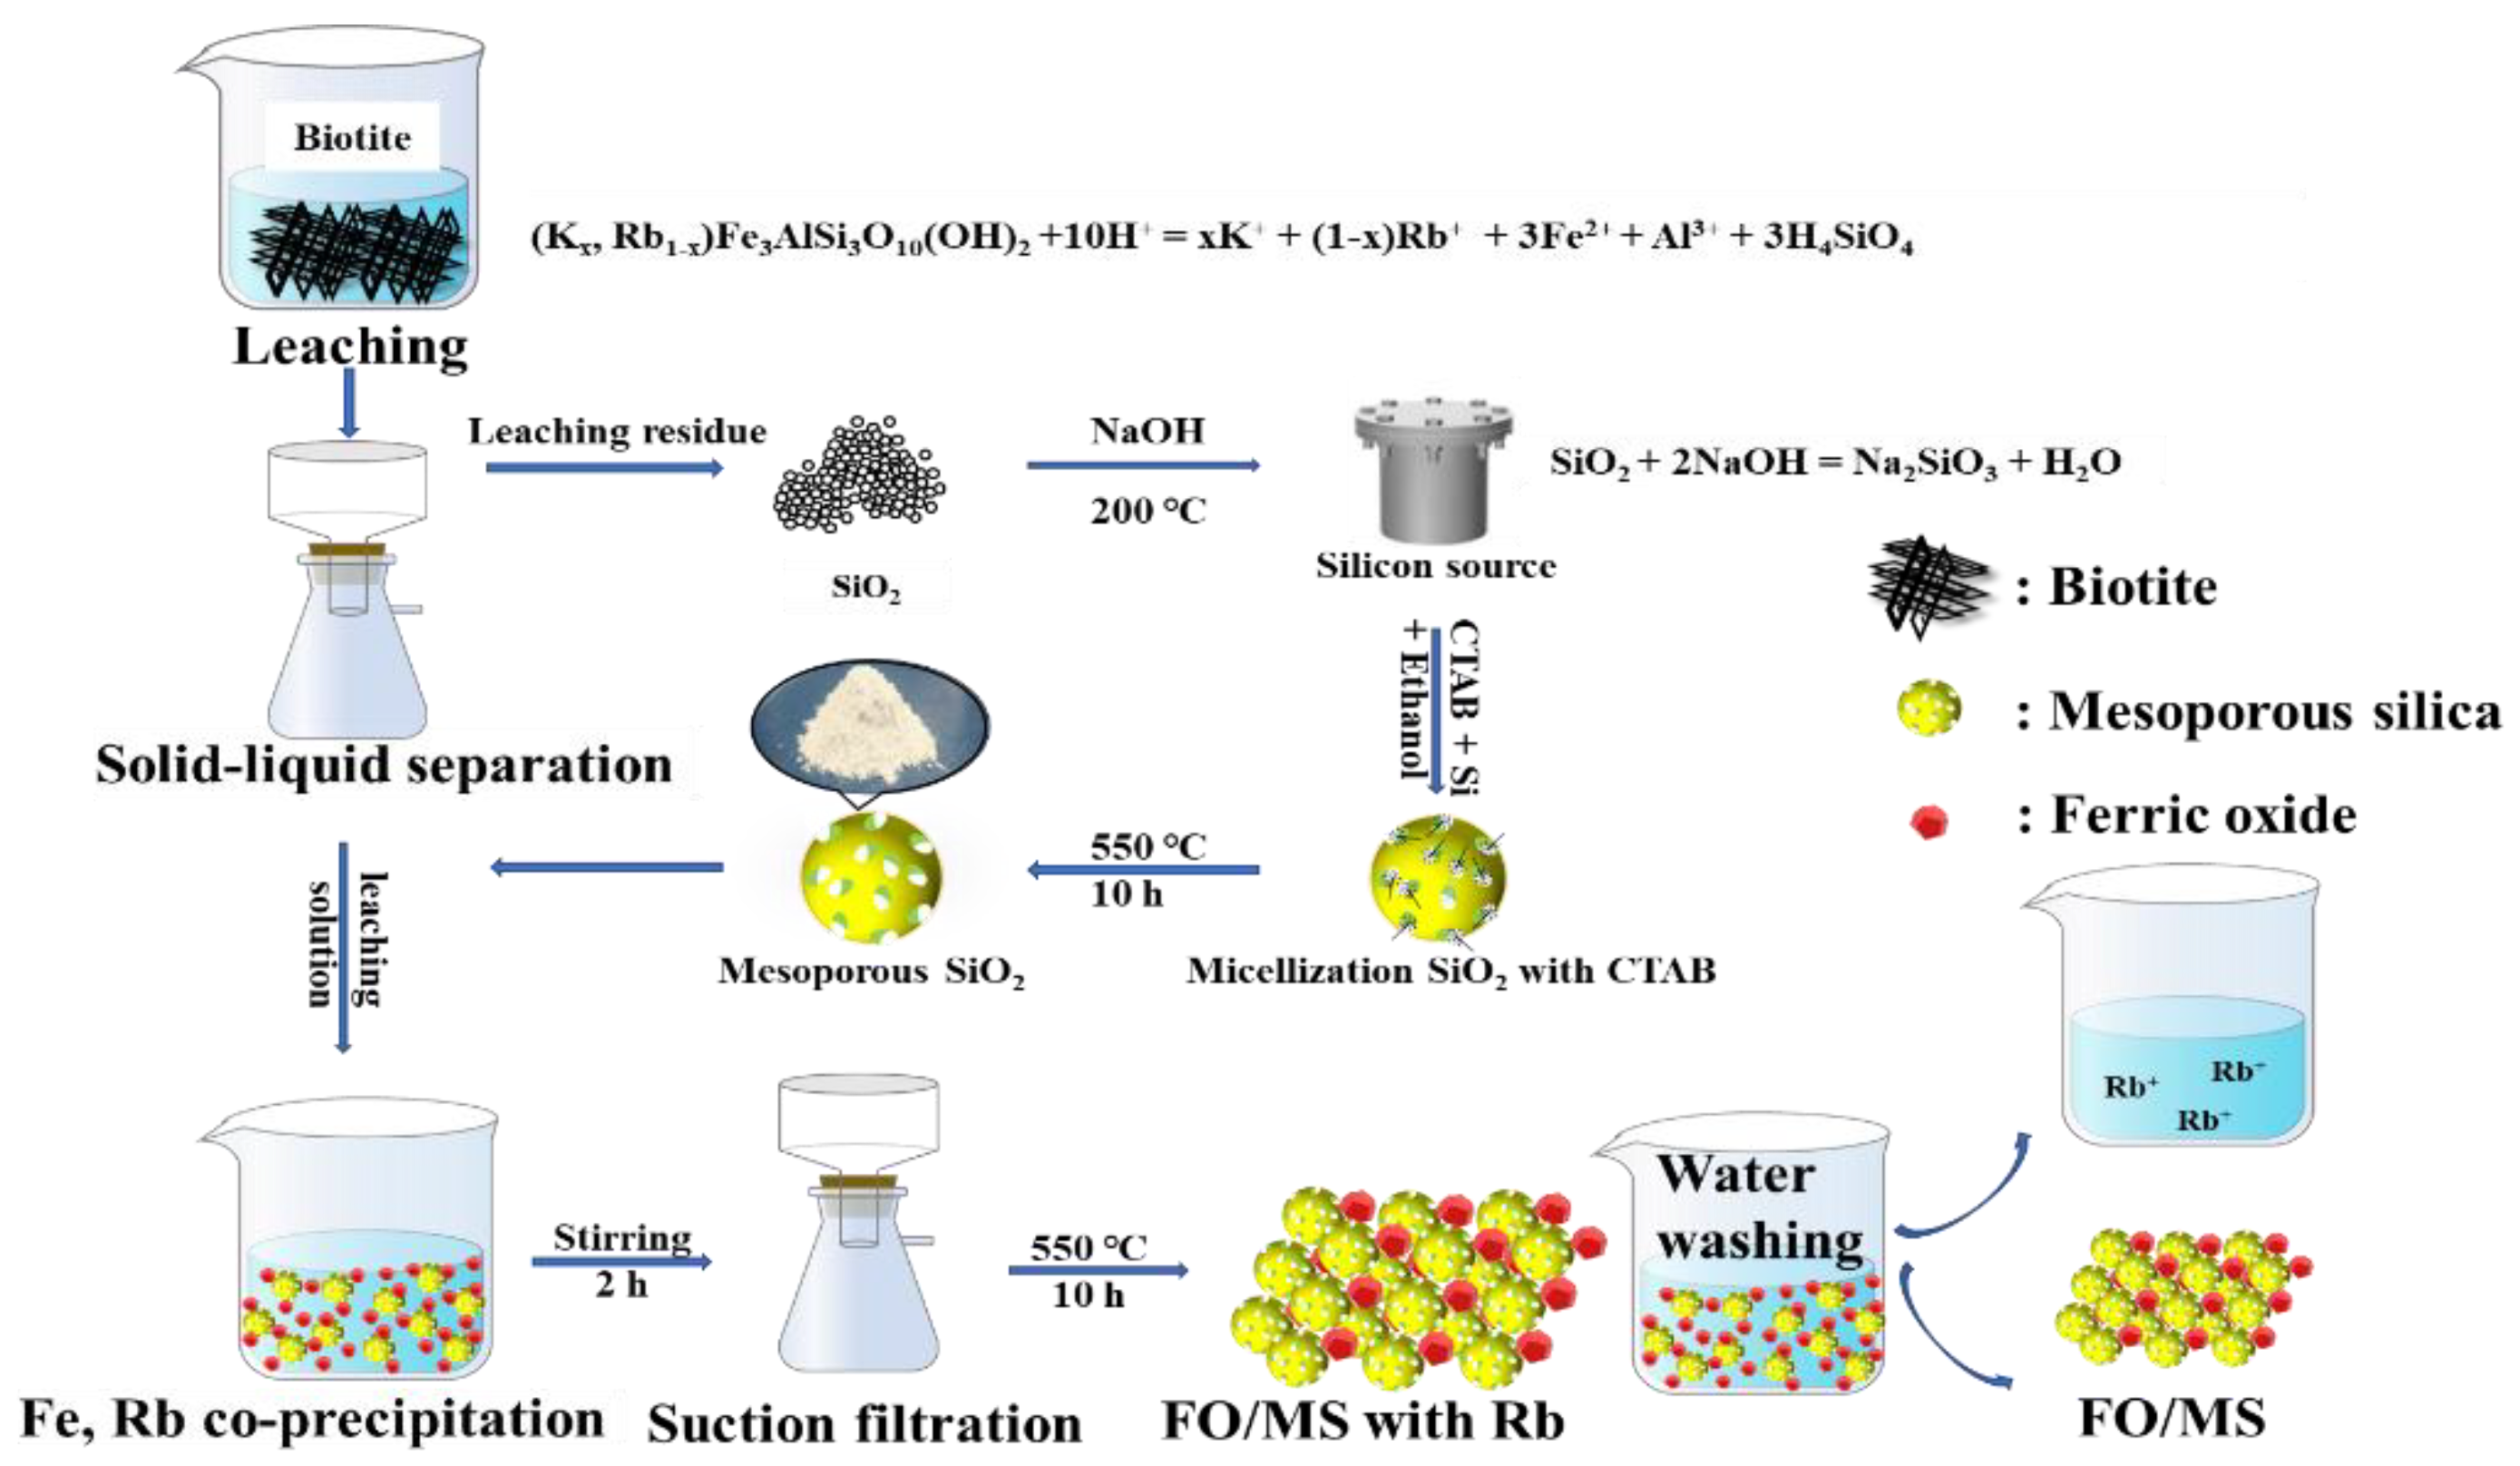
2.2. Direct Acid Leaching of Rubidium with Sulfuric Acid

The pre-enriched concentrate was ground and sieved to −0.15 mm. Samples of 10 g of biotite concentrated rock were added to beakers containing 40 mL of sulfuric acid solutions of different concentrations. After the beakers were sealed, they were stirred and leached at a constant temperature in a water bath with magnetic stirring. After leaching, the rock pulp was immediately vacuum filtered using Buchner funnel filters. The filter residues were cleaned three times and dried at 80 °C for 24 h [9]. The filtrate was collected as the iron source to synthesize mesoporous materials. Inductively coupled plasma-optical emission spectroscopy (ICP-OES) was used to assess the volume and concentration of the filtrate and biotite rock totally digesting solution to determine the effectiveness of the leaching of rubidium and iron (SPECTRO BLUE SOP, Spike Analytical Instruments, Kleve, Germany). The calculation formula for leaching efficiency is shown as Equation (1):
η = c 1 V 1 c 0 V 0 × 100 %
where η is leaching efficiency (%), c1 is the Rb or Fe ion concentration in the filtrate (mg/L), V1 is the volume of the filtrate (L), c0 is Rb or Fe ion concentration of the biotite rock complete digestion solution (mg/L) and V0 is the volume of the biotite rock complete digestion solution (L). The leaching efficiency of Rb and Fe under each condition was calculated using the average of three experimental results.

2.3. Pretreatment of Leaching Residues

The solution with high silica content was prepared from leaching residue using an alkaline hydrothermal reaction [10]. First, 5 g of leaching wastes collected from the leaching experimental samples from test number 14 listed in Table S1 were combined with 10 g of NaOH in a steel autoclave coated with Teflon. The mixture mentioned above received 35 mL of ultrapure water, which was added while stirring at 140 rpm for around 2 min. After the mixture underwent a 10 h static reaction at 200 °C, the silica transformed into a sodium silicate solution. The solution was cooled to room temperature and then filtered. There remained 0.15 g of insolvable matter after drying. The collected sodium silicate was the only silicon source for synthesizing mesoporous materials. Using silicate in tailings to prepare sodium silicate solution as an inorganic silicon source for synthesizing mesoporous silica has become a research hotspot. It has gradually formed a mature synthesis process.

2.4. Synthesis of Ferric Oxide/Mesoporous SiO2 (FO/MS)

The non-hydrothermal gel technique was used to create the FO/MS materials. First, the ratio of CTAB: H2O: Ethanol: Si was typically 1.25 g: 90 mL: 27 mL: 5 mL. Specifically, 1.25 g CTAB as a surfactant and micellar agent was placed in a 500 mL glass beaker with 90 mL of ultrapure water and 27 mL of ethanol, and ultrasonic dispersion was performed until solution clarification was achieved. Then, 5 mL silica-based solution was added, and the mixture was stirred for 5 min. The pH of the combination was maintained at 8.0 and adjusted using 0.1 mol/L NaOH and 0.1 mol/L HCl solutions. The solution was continuously stirred at 25 °C for 3 h. After filtering and washing with ultrapure water, the silica gel of the CTAB micelles that had been precipitated was dried in an oven at 60 °C for 12 h. To obtain mesoporous silica material comparable to the one utilized in [11], the synthesized material was heated to 550 °C at a heating rate of 5 °C/min in an air stream and held at 550 °C for 10 h. The 0.75 g of MS matter were obtained.
Afterward, 5 mL of acid leachate was diluted to 100 mL and used as an iron source solution. A total of 0.5 g of mesoporous silica materials were placed into a 250 mL glass beaker with 100 mL of the above iron source solution. The solution pH was adjusted to 7.0 and continuously stirred at 25 °C for 3 h at 140 rpm. The filtered, ultrapure water-washed composite precipitation was then dried in an oven at 60 °C for 12 h. At this point, 98.5% of the rubidium in the leaching solution was wrapped in cationic hydroxide and precipitate. The synthesized materials were heated to 550 °C at a 5 °C/min heating rate in an air stream and maintained at 550 °C for 10 h to transform them into FO/MS materials, as shown in Figure 1. A total of 1.0 g of FO/MS matter was obtained. FO material without MS was prepared the same way without adding mesoporous silica to the reaction mixture. Moreover, rubidium in the FO/MS or FO materials could be completely washed into an aqueous solution.

2.5. Batch Experiments of Pb2+ Removal

By adding 10 g/L of mother solution, a specific concentration of the Pb2+ solution was created. A 250 mL glass beaker was filled with 100 mL of Pb2+ solution. The beaker was then put in the water bath with magnetic stirring and heated to a certain temperature while the pH of the solution changed. A specified amount of the synthesized mesoporous material was dispersed in the solution at 140 rpm after the solution temperature reached the target value. The solution samples were filtered using a 0.22 μm microporous membrane to remove the solid particles, and the concentration of the target ions in the solution was measured with ICP-OES. All results were repeated three times. The detailed pre-set conditions of the experimental process are listed in Table S2. To further study the recycling performance of the adsorbent, the adsorption-desorption process was repeated five times under the same conditions, and the change value of each adsorption capacity was calculated. The adsorbent treated by Pb2+ was eluted with 0.1 mol/L HCl. The removal efficiency and the capacity of the synthesized mesoporous materials for the lead ions were calculated as Equations (2) and (3) [12].
Removal   Efficiency = C 0 C t C 0   ×   100 %
Removal   Capacity = C 0 C t D   ×   100 %
where D is the amount of adsorbent (g/L), and C0 and Ct are the Pb2+ concentration at the starting time and the adsorption time of t, respectively (measured in mg/L).

2.6. Adsorption Kinetics and Isothermal Studies

The adsorption mechanism is usually studied mainly through complex mathematical fittings, including adsorption kinetics fitting, adsorption isothermal model fitting and adsorption thermodynamics calculation [13]. The pseudo-first-order model (PFOM), pseudo-second-order model (PSOM) and intra-particle diffusion model (IPDM) as well as other adsorption kinetics models were obtained by certain regression methods [14]. The best fit among these models gave indications about the specific adsorption mechanism. Based on those, the adsorption rate, adsorption energy and adsorption path could be obtained [15]. The PFOM, PSOM and IPDM were used for fittings as seen in Equations (4)–(6), respectively.
PFOM :   Q t = Q e   1 e 1 / k 1 t
PSOM :   t Q t = 1 k 2 Q e 2 + t Q e
IPDM :   Q t = k 3 t 0.5 +   d
where Qe is the equilibrium adsorption capacity (mg/g), Qt is the adsorption capacity at t point (mg/g), t is the adsorption time (min) and the time point of solid-liquid mixing was taken as the initial adsorption time. k1, k2, k3 and d are the adsorption constants.
The Langmuir, Freundlich and Temkin models were adopted to determine more specific information about the Pb2+ isotherm adsorption behaviors, and as seen in Equations (7)–(9), respectively.
Langmuir   model :   Q e = Q m K L C e 1 + K L C e
Freundlich   model :   ln Q e = lnK F + 1 n ln C e
Temkin   model :   Q e = B T   lnA T + B T   ln C e
where Qm is the maximum adsorption capacity (mg/g), Ce is the equilibrium residual concentration (mg/L), KL is the Langmuir constant, and both n and KF are Freundlich constants. AT and BT are Temkin constants.
The Gibbs free energy changes, enthalpy changes and entropy changes were calculated using the vant Hoff equation [16].
G 0 = RTln Q e C e
∆G0 = ∆H0 − T∆S0
where ∆G0, ∆H0 and ∆S0 are the Gibbs free energy, enthalpy change and entropy change, respectively. R is the gas constant (8.3143 J/mol∙K) and T is the reaction temperature (K).

2.7. Characterizations

X-ray fluorescence spectrometry (XRF) was utilized to analyze the mineral and mesoporous material samples and determine their respective chemical compositions and contents (Axiosm AX, Malvern Panalytical. B. V, Almelo, The Netherlands). The N2 adsorption-desorption curves of unprocessed minerals and leftover slags were recorded using automated specific surface area measuring equipment. The Brunauer-Emmett-Teller (BET) technique was used to determine the surface areas in the P/P0 range of 0.001–1.0, and the Barrett-Joyner-Halenda (BJH) method was used to examine the areas and pore architectures. (Autosorb-1, Quanta chrome Instruments, Boynton Beach, FL, USA) [17]. The phase composition, microstructure and microstructure modification of the minerals and materials were investigated using scanning electron microscopy and energy dispersive spectroscopy (SEM-EDS, S-3400N, Hitachi, Tokyo, Japan). To learn more about the phase composition and crystallization of the materials, X-ray diffraction (XRD, Cu Kα radiation, λ = 0.15406 nm) analysis was performed using a scanning range of 2θ = 5−80°. High-angle annular dark field scanning transmission electron microscopy (TEM, Tecnai G2 F20, FEI instrument, Hillsboro, OR, USA) was used to investigate microstructure and microstructure modification of the minerals and materials. Some physicochemical properties of the minerals and materials were also determined. X-ray photoelectron spectroscopy (XPS, ESCALAB 250Xi, Thermo Fisher-VG Scientific, Waltham, MA, USA) was used to determine the valences of the surface components. The samples were compressed into pellets using KBr at a mass proportion of 1/100, and the functional groups were confirmed using Fourier Transform Infrared Spectroscopy (FTIR, Nicolet IS 50, Thermo, Waltham, MA, USA). After calibrating it with the binding energy of C1s, which was 284.8 eV, XPS Peak 4.1 was utilized to examine all spectra.

3. Results and Discussion

3.1. Behaviors of Rubidium and Iron in Their Leaching Environments

3.1.1. Influence of the Concentration of Sulfuric Acid on Rubidium and Iron Extraction Processes

The experiments for leaching rubidium with different concentrations of sulfuric acid were implemented using magnetic stirring at 140 rpm and 80 °C for 3 h. The leaching conditions are listed in Table S1 as numbers 1 to 5. The leaching results are shown in Figure S1A. During the process of direct leaching with sulfuric acid, the leaching behaviors of rubidium and iron were, for the most part, synchronized with one another [18]. The leaching efficiency of the rubidium in the leaching process grew from 32.8% at 0.5 mol/L of H2SO4 to 92.6% at 3 mol/L of H2SO4, and then it raised slightly to 93.61% at 4 mol/L. of H2SO4. In addition, the iron leaching efficiency reached 95.6% at 4 mol/L of H2SO4. The higher the sulfuric acid concentration, the more hydrogen ions existed in the solution. The crystal structure of the minerals loaded rubidium and iron could be more easily eroded by hydrogen ions so the leaching efficiency was gradually increased [19].

3.1.2. Influence of the Temperature of the Leaching Process on the Recovery of Rubidium and Iron

To explore the influence of the leaching temperature on the leaching efficiency, the temperature of the relevant experiments was controlled from 20 °C to 90 °C. The leaching conditions are listed in Table S1 as numbers 6 to 11. Figure S1B shows that the leaching efficiencies of rubidium and iron gradually increased with temperature rise. Rubidium leaching efficiency was 15.6% at 20 °C and gradually increased to 93.5% at the maximum of 80 °C. Additionally, at 20 °C, the iron leaching rate was 16.5% and reached 95.6% at the maximum of 80 °C.

3.1.3. Influence of the Amount of Leaching Time Spent on the Iron and Rubidium Extraction

The length of leaching time affected the integrity of the leaching behaviors. The leaching conditions are listed in Table S1 as numbers 12 to 17. As shown in Figure S1C, in the first 120 min, the leaching efficiency of rubidium was higher than that of iron. The leaching efficiency of rubidium increased from 66.8 to 93.4%, and the iron leaching efficiency was improved from 56.8 to 95.5%, with the leaching time ranging from 30 min to 180 min. The leaching behaviors tended to be at equilibrium after 120 min, and the leaching efficiency of iron was slightly higher than that of rubidium. Thus, the optimum conditions for leaching rubidium were determined to be 4.0 mol/L sulfuric acid treatment for 90 min at 80 °C.

3.1.4. XRD Analysis of Leaching Residue Slags

The leaching residue was collected from the leaching experimental samples under test number 14 conditions listed in Table S1. As shown in Figure S1D, the raw rock mainly contained biotite and a small amount of quartz before leaching, and the residue slags of acid leaching mainly consisted of quartz. The diffraction peaks located at 8.79°, 26.18° and 36.8° are the main diffraction peaks of biotite. For the leaching residue, the pure phase of quartz was produced, and the main diffraction peaks appeared at 26.18° and 20.85°. The XRD pattern of the leaching residue was almost entirely quartz diffraction peaks, and there were no miscellaneous peaks except for the diffraction peaks of biotite crystals that were not destroyed in the leaching process. The results of the semi-quantitative analysis based on the XRD diffraction peaks showed that before leaching, there was 56.9% biotite and 43.1% quartz, but after leaching, there was 6.7% biotite and 93.3% quartz.

3.2. Pb2+ Removal Experiments Using the Mesoporous Materials

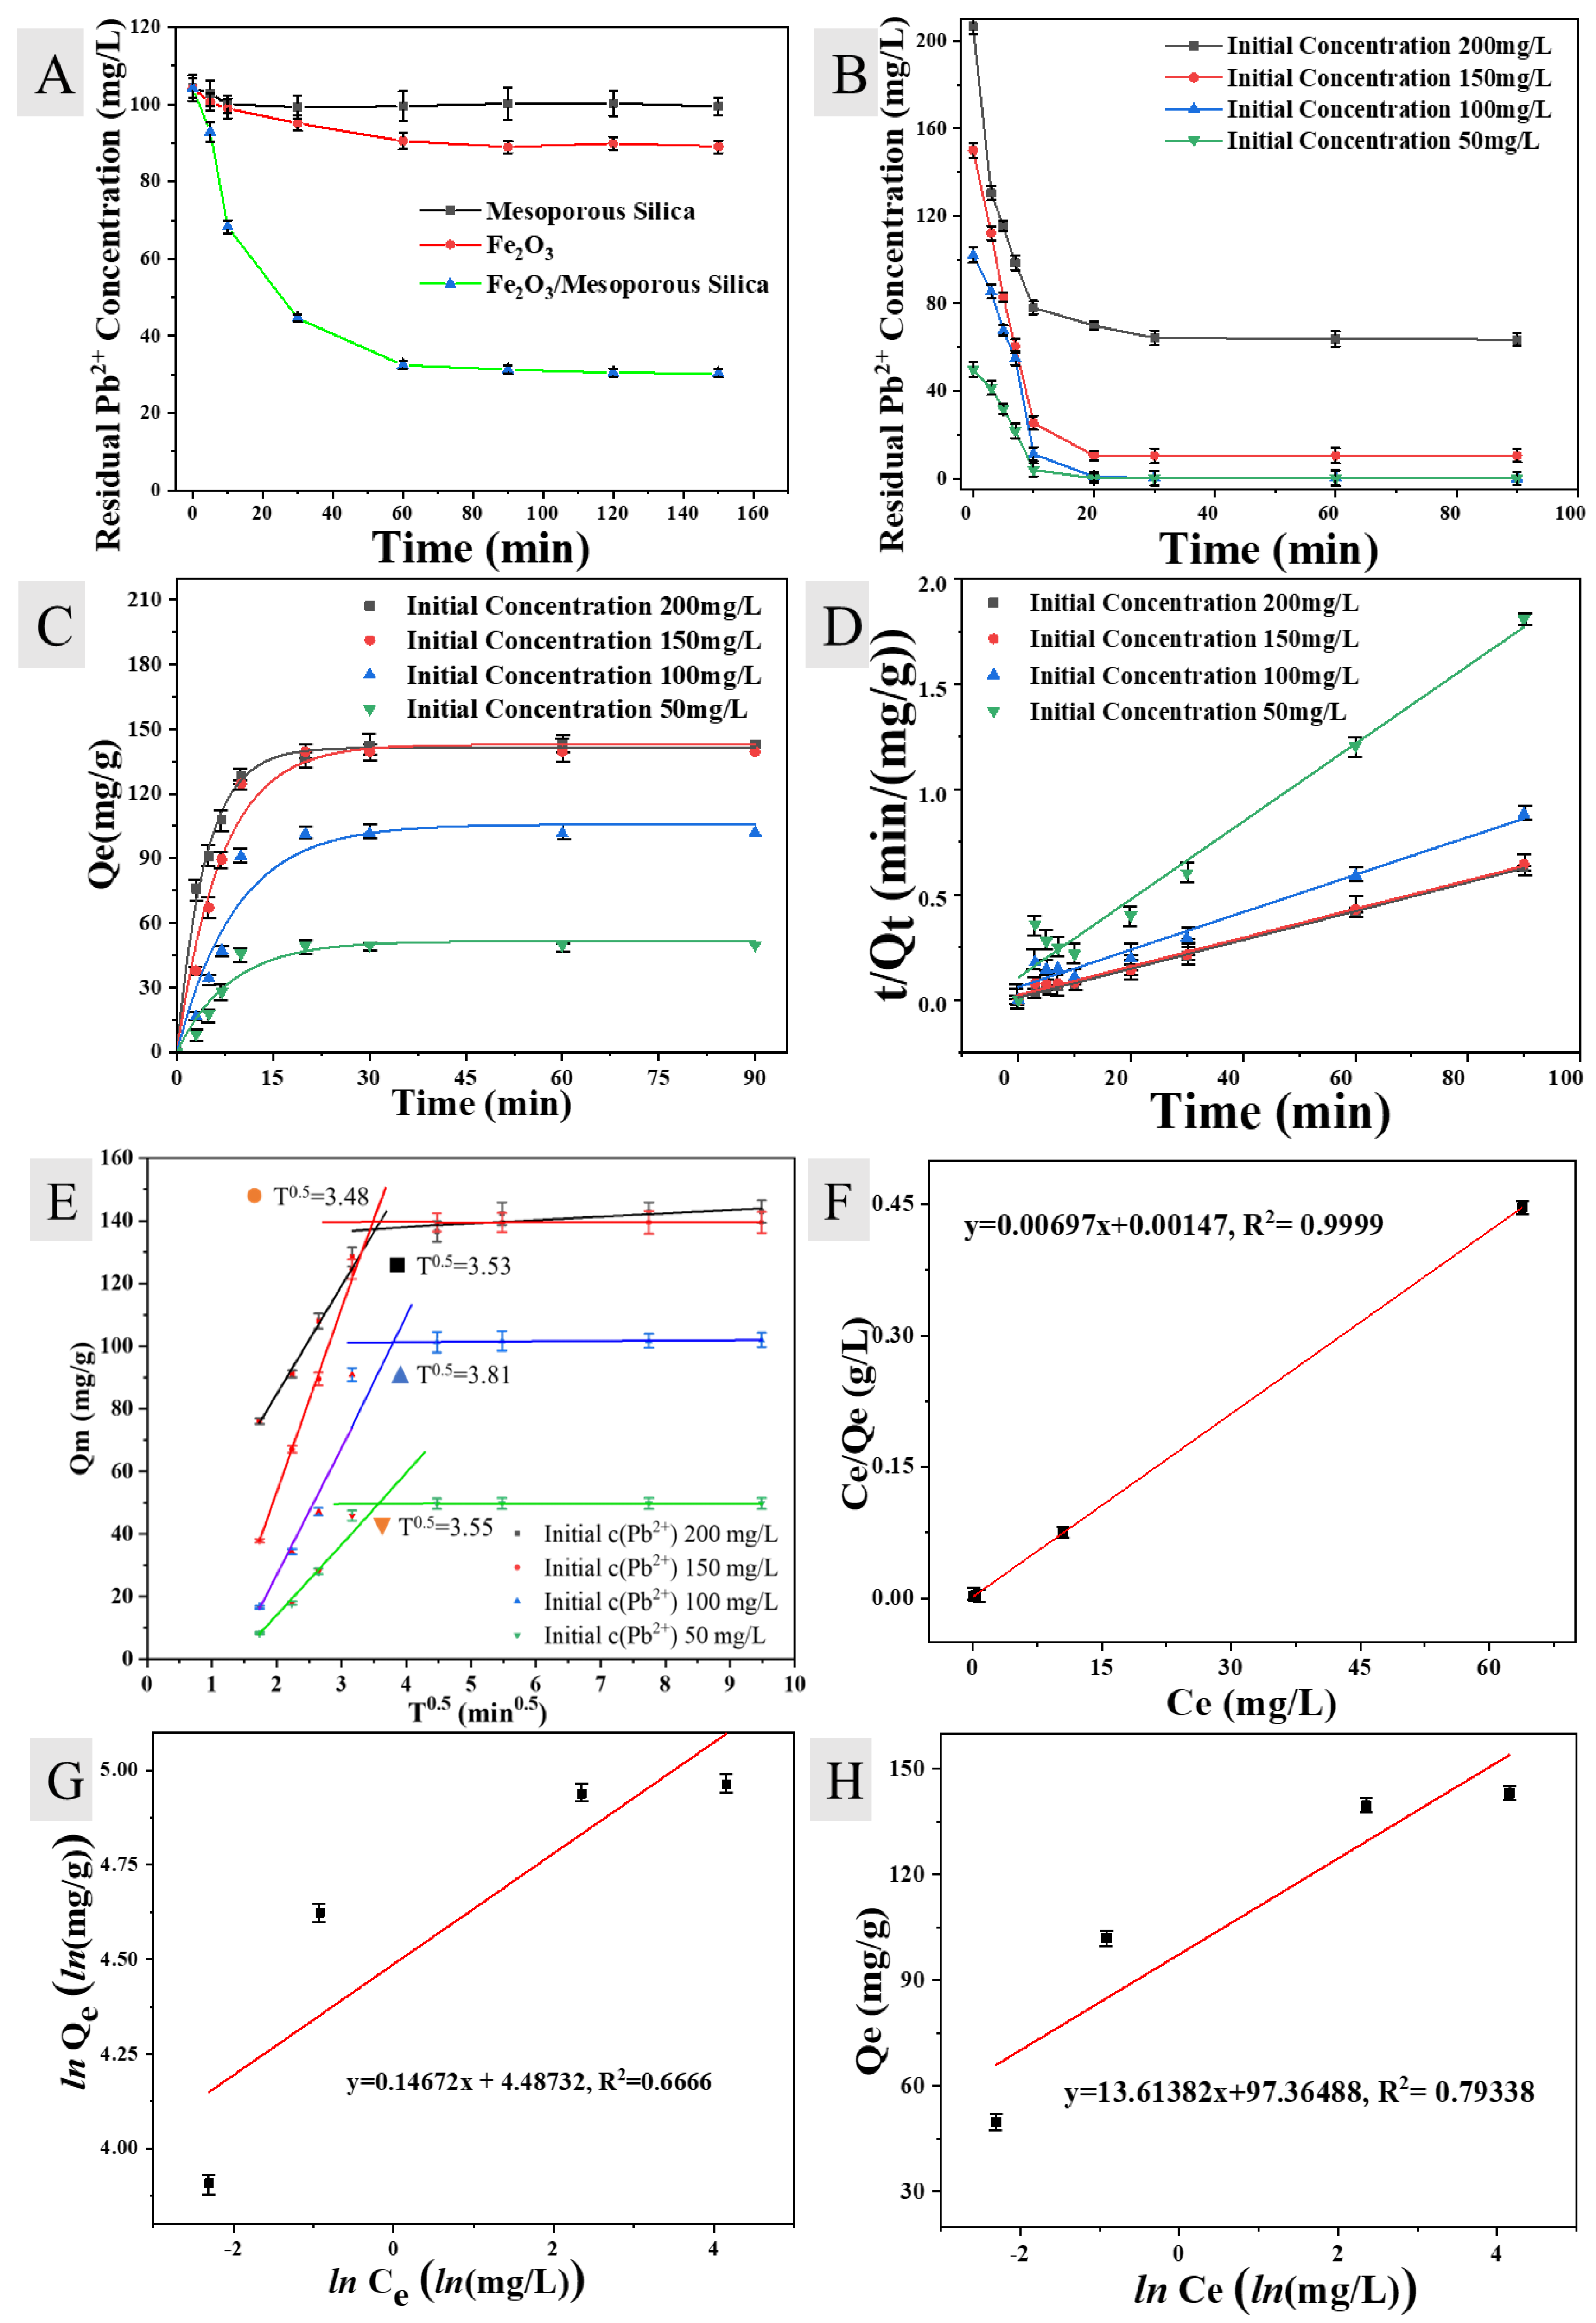
3.2.1. Effect of Different Adsorbents on the Amount of Lead Removed

The experimental circumstances are given in Table S2 as numbers 1 through 3, and they may be used to interpret the effectiveness of Pb2+ removal by FO, MS and FO/MS. As can be shown in Figure 2A, the raw mesoporous silica had a very low capacity for adsorbing Pb2+ ions. The adsorption efficiency of the acid leaching precipitation was slightly improved, and the adsorption capacity was 28.5 mg/g. The adsorption efficiency of FO/MS for Pb2+ was obviously improved, and the adsorption capacity was approximately 148.5 mg/g. Therefore, the FO/MS materials have great potential for use as Pb2+ removal adsorbents.

3.2.2. Effect of the Initial Pb2+ Concentration on the Amount of Lead Removed

To examine the impact of the starting concentration on the removal effectiveness, the initial Pb2+ concentration ranged from 50 to 200 mg/L. The experimental settings, which ranged from 4 to 7, are given in Table S2, and the adsorption findings are displayed in Figure 2B. Both the residual Pb2+ concentrations were decreased to 0.5 mg/L after 30 min, which complied with the discharge limit for Pb2+ in Chinese wastewater (1.0 mg/L) (GB/8978-1996). With the initial Pb2+ concentration rising from 50 to 100 mg/L, Pb2+ removal capabilities rose from 49.71 to 101.65 mg/g at the adsorption equilibrium point. Under these circumstances, the active sites of mesoporous material for adsorbing heavy metal Pb2+ were excessive compared to the concentration of Pb2+ in the solution. The Pb2+ removal capabilities improved from 139.5 to 148.98 mg/g when the initial Pb2+ concentrations reached 150 and 200 mg/L, respectively. This may be explained by the rising mass transfer driving force under conditions of high Pb2+ concentration from the aquatic solution to the adsorbent surface [20].

3.2.3. Determination of the Kinetic Model for the Adsorption Process

The fitting of PFOM, PSOM and IPDM kinetic models are shown in Figure 2C–E, respectively, and the parameters are listed in Table 2. According to the results, the obtained R2 values for the fitted parameters of the adsorption kinetics were too close; hence, they cannot be easily analyzed independently. Akaike’s information criterion (AIC) was used to statistically compare the models [21]. The fitting results showed that both the fitting coefficients of the PSOM and IPDM were better than that of the PFOM. The AIC value of PFOM, PSOM and IPDM were −48.12, −40.25 and −44.43, respectively. The calculated equilibrium removal capabilities from PSOM were closer to the experimental results. When the initial Pb2+ concentration was lower, the adsorption sites were more numerous relative to each other. As a result of IPDM, the removal of Pb2+ was faster. The intersection point of two fitted curves was obtained by piecewise fitting of the adsorption and equilibrium processes using IPDM [22]. The straight line of IPDM consisted of two portions. The first portion expressed the diffusion process controlled by external surfaces. This meant that the adsorbate in the solution interacted with the surface of the adsorbent. The second portion depicted the intra-particle diffusion [23]. When the initial Pb2+ concentration was 50, 100, 150 and 200 mg/L, the T0.5 values of the intersection points were 3.53, 3.48, 3.81 and 3.55, respectively. It is worth noting that the fitting coefficient of the intra-particle diffusion model was high in the initial 30 min, so there was an internal diffusion process of Pb2+ from the adsorbent surface to the internal surface at the same time as the adsorption in the initial process [24].

3.2.4. Fitting of the Adsorption Isotherm Model

The fitting results of the Langmuir, Freundlich and Temkin models are shown in Figure 2F–H. The obtained adsorption parameters are listed in Table 3. It can be seen that the fitting coefficients of the Freundlich and Temkin models were lower than that of the Langmuir model. The good fitting coefficient of the Langmuir model indicated that the Pb2+ adsorptions were adsorbed on the surface of the adsorbent as a monolayer [25]. The large specific surface area made more active sites on the surface of FO/MS materials. This surface adsorption was only single molecular layer adsorption. The maximal Pb2+ adsorption capacity was calculated as 143.47 mg/g using the Langmuir model, suggesting that the prepared FO/MS compared with the other materials listed in Table 4, was a good enough remediation material for Pb2+ contaminated water.

3.2.5. Effect of Initial pH Value on Pb2+ Removal Efficiency

The pH value of the solution was an important factor for determining the migration, solidification, adsorption and desorption of heavy metal ions. The experiments were carried out in pH range from 2 to 6. The experimental conditions are listed in Table S2 as numbers 8 to 11. As shown in Figure S2A, after reacting for 90 min, the Pb2+ removal capacity was 144.08 mg/g for a pH value of 6, and the Pb2+ removal capacity was 2.01 mg/g for a pH value of 2. In general, with increases in pH value, the degree of deprotonation and surface electronegativity increased, consequently improving the removal efficiency and capacity of adsorbents for heavy metals.
The lead ion forms shown in Figure S2B existed in solutions with different pH values and were calculated using Visual MINTEQ 2.30. According to Section 3.3.1, the surface of the material contained large amounts of silicon hydroxyl and iron hydroxyl. The surface -Si-OH and -Fe-OH was found to be significant on the adsorbent with a high adsorption capacity. It influenced the electrostatic binding of ions to the corresponding -OH groups [33]. The different lead species in pH ranged from 2 to 6 and are shown in Figure S2B. When the solution pH value was lower than 2, the hydroxyl groups on the material’s surface were fully protonated. The protonated hydroxyl groups could decrease the number of active sites available for Pb2+ ions; therefore, effective adsorption could not be produced. Here, the pH value was below 6, which indicated that the interaction of electrostatic attraction between FO/MS and Pb2+ could readily occur [34]. Most of the lead was present in the solution as Pb2+ at an initial concentration of 100 mg/L The Pb2+ was exchanged with the protons on the surface of the adsorbent. Then, some of the Pb2+ was combined with the hydroxyl groups to form Pb(OH)+ at a pH value of 6.In addition to the electrostatic action, there were Van der Waals forces to promote the interaction of Pb(OH)+ with the -Si-OH and -Fe-OH groups in the adsorption process [35].

3.2.6. Effect of Temperature on Pb2+ Removal Efficiency

One of the important factors affecting the adsorption efficiency of heavy metals is temperature [35]. The experimental settings are provided in Table S2 in numbers 12 to 14, and Figure 3A displays the experiment’s findings on the impact temperature has on Pb2+ removal. The adsorption behaviors were similar at different temperatures. Figure 3B shows the pseudo-second-order kinetic model fitting results of the adsorption process at different temperatures. The Pb2+ removal capacities were 150.6 mg/g at 25 °C and slightly reduced to 149.9 mg/g at 45 °C. In the first 30 min of the adsorption process, the increase in temperature was beneficial to the acceleration of the adsorption rate. The thermodynamic parameters of Pb2+ adsorption behaviors were studied based on the experimental data. As shown in Figure 3C, the Gibbs free energy, enthalpy and entropy changes were calculated using the vant Hoff equation, and the fitting results are listed in Table 5. It can be easily calculated that ∆H0 was −3.78 kJ/mol and ∆S0 was 0.1324 kJ/(mol∙K). The results indicated that the adsorption process was a spontaneous exothermic process.

3.2.7. Effect of Recycling on Pb2+ Removal Efficiency

To make the process economical and feasible, adsorbent cycles of adsorption-desorption-related experiments were designed and carried out. Figure S3 shows the five sequential adsorption-desorption cycles with HCl solution as the desorbing agent for Pb2+. As shown in Figure S3A, with the number of cycles increasing, the residual Pb2+ concentration in the solution increased gradually, indicating that the adsorption efficiency of Pb2+ gradually deteriorated. Five cycles of related adsorption-desorption experiments were carried out to calculate the variation trend of adsorption capacity by pseudo-second-order kinetic fitting results, as shown in Figure S3B. The adsorption capacity calculated by kinetic fitting parameters decreased with increased adsorption cycles. The adsorbent used for the first time had an adsorption capacity of 142.4 mg/g and gradually reduced to 107.6 mg/g for five cycles. The reason for the gradual decrease in adsorption capacity could be that part of ferric oxide was dissolved in the desorption process by pickling, and the active sites of the material were gradually reduced. Overall, the adsorbent still had a high adsorption capacity after five rounds of recycled adsorption-desorption. The results suggested that the activities of the FO/MS nanomaterial could be maintained at a high level after recycling, which showed that FO/MS is reliable for Pb2+ removal from wastewater.

3.2.8. Selective Removal of Pb2+ from Multiple Heavy Metals Coexisting Solution

The adsorption selectivity of Pb2+ when coexisting with multiple heavy metals from wastewater was further studied. Under natural conditions, both Zn2+ and Cd2+ usually coexist with Pb2+, and certain concentrations of Ca2+ and Mg2+ were unavoidable ions. Their similar positive charge and higher concentrations may lead to competitive adsorption with Pb2+ [36]. Pb2+ selective removal experiments were implemented with 100 mg/L Pb2+ solutions coexisting with Cd2+ (Figure S4A), Zn2+ (Figure S4B), Ca2+ (Figure S4C) or Mg2+ (Figure S4D). Coexisting ions with different concentrations were prepared from nitrate. As shown in Figure S4A–D, Pb2+ removal efficiencies were relative stable when Cd2+, Zn2+, Ca2+ and Mg2+ concentrations increased from 50 mg/L to 150 mg/L. The results demonstrated that the FO/MS materials had high selectivity for Pb2+.
In general, adsorbents could preferentially adsorb cations with lower hydration energies because the metal ions must be separated from a large amount of hydrated water before entering the channels with smaller adsorbents. Therefore, the adsorption must destroy the hydrates formed between the heavy metal ions and the water molecules before complexing with the surface hydroxyl groups. Firstly, the hydration state and hydration energy of the heavy metal ions must be considered. Pb2+ had the lowest hydration energy (1425 kJ/mol) when compared with Ca2+ (1505 kJ/mol), Mg2+ (1830 kJ/mol), Zn2+ (1995 kJ/mol) and Cd2+ (1755 kJ/mol), suggesting that it was more preferentially adsorbed than those divalent cations. Moreover, heavy metal ions with large ionic radiuses are favorable for adsorption to the surface of the adsorbent. The radiuses of Ca2+, Mg2+, Cd2+ and Zn2+ are 0.100, 0.072, 0.095 and 0.074 nm, respectively, while the radius of Pb2+ is 0.119 nm. The larger ionic radius allowed Pb2+ to be easily adsorbed [37].

3.3. Characterization and Pb2+ Removal Mechanism
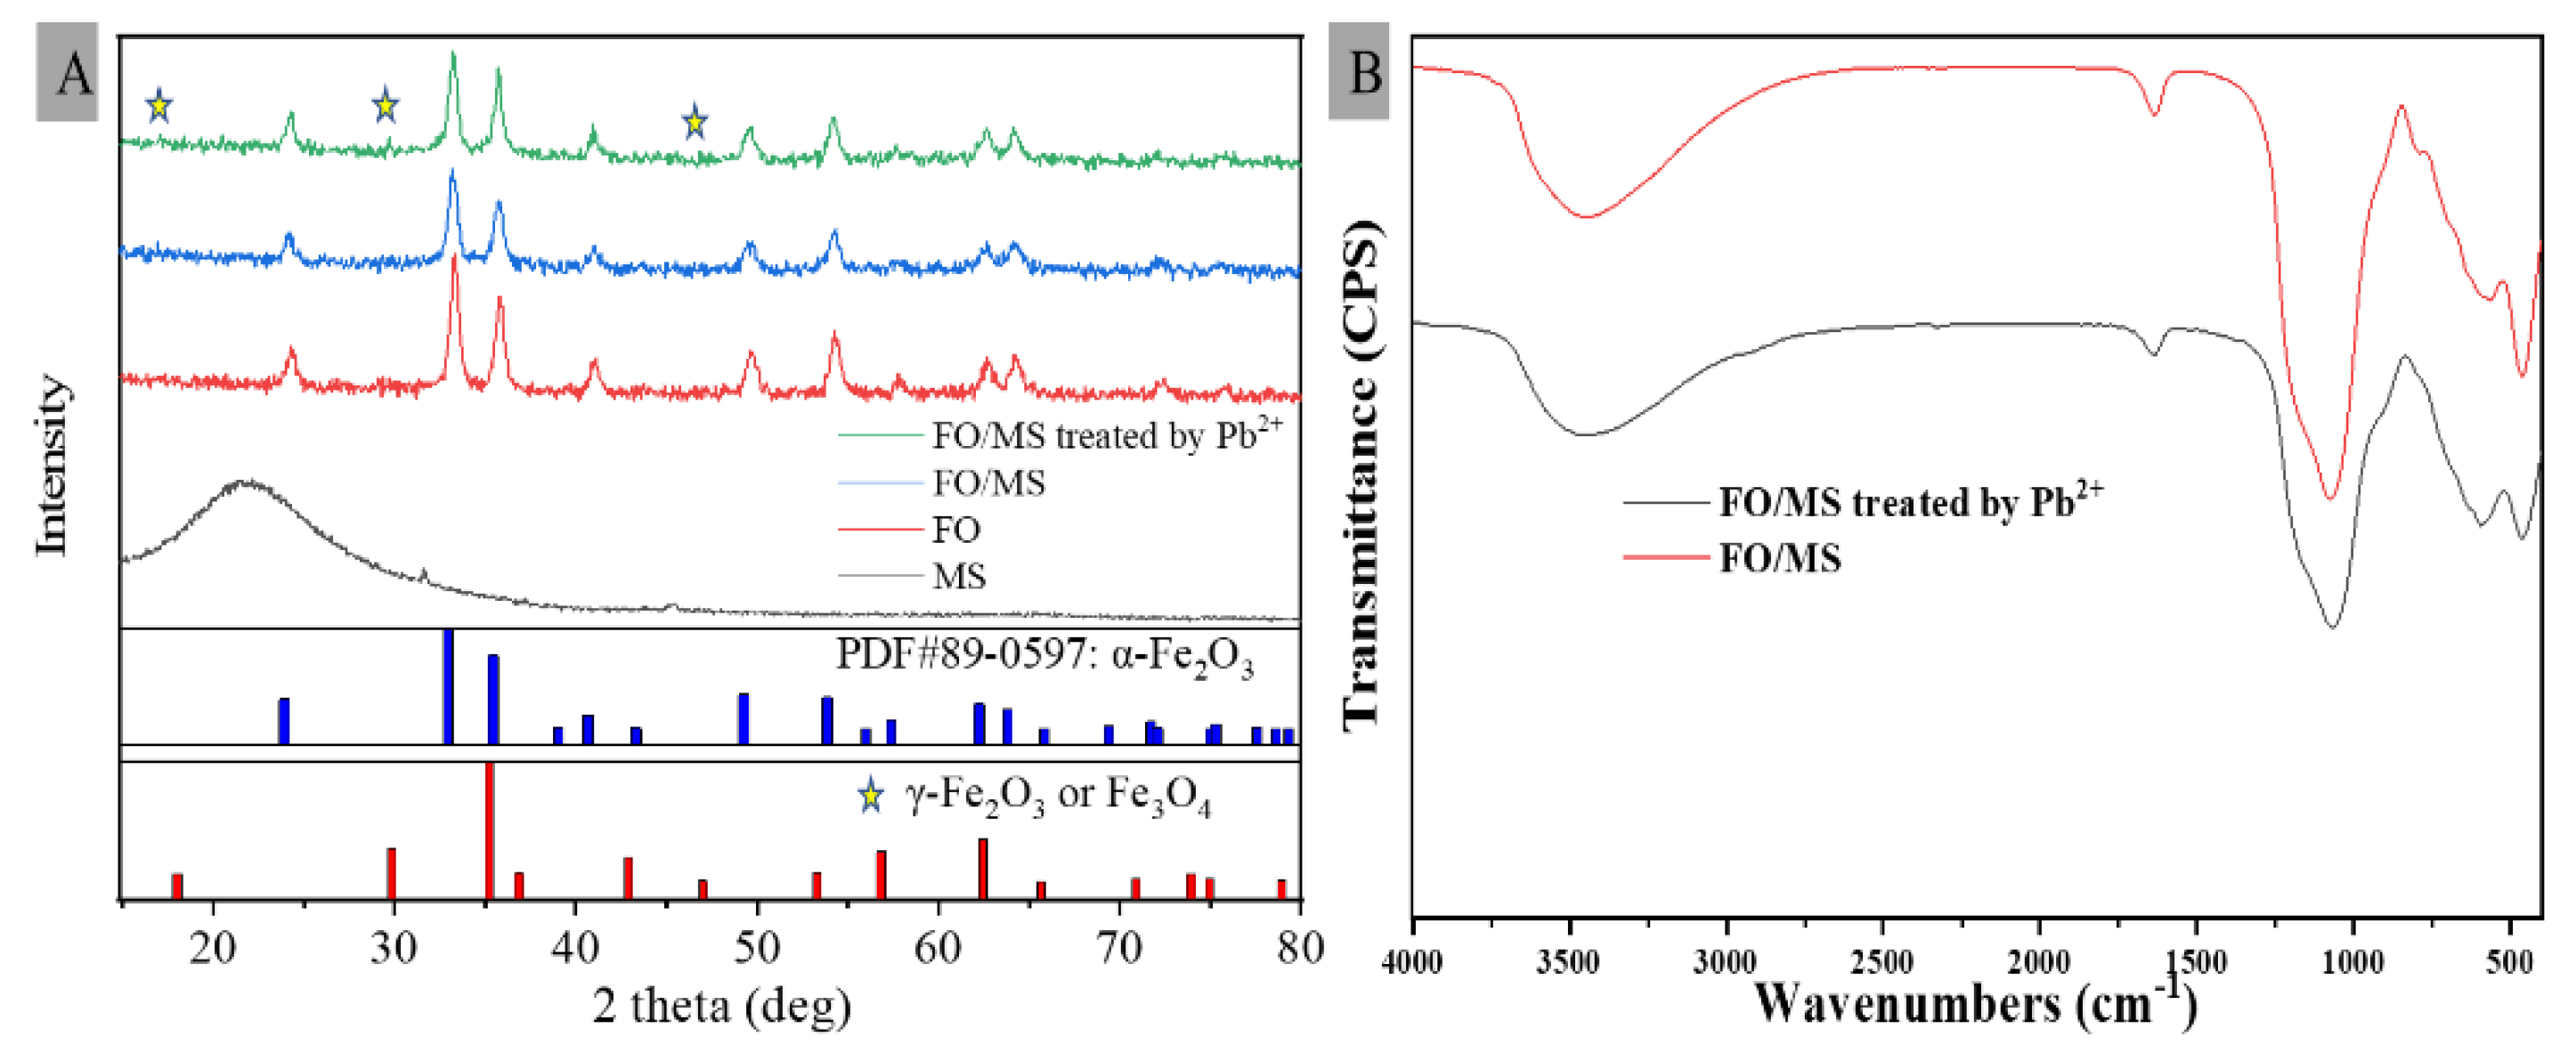
3.3.1. XRD Analysis

The XRD diffractogram of the as-prepared samples is shown in Figure 4A. There were no obvious diffraction peaks in the XRD diffractogram of the MS materials. Only one peak package suggested that they were composed of mesoporous SiO2 [38]. The XRD diffractograms of the FO and FO/MS materials only had a diffraction peak of α-Fe2O3. Other phase diffraction peaks were not found in the diffractogram, which might be due to the formation of mesoporous materials at high temperatures [39]. The diffractogram showed a weak diffraction peak at 30.1 as maghemite (γ-Fe2O3) or magnetite (Fe3O4) [40]. Meanwhile, there was no crystal phase of lead in the XRD diffractogram of FO/MS treated by Pb2+. Because the amount of lead adsorbed was not much, any changes might not be visible in the XRD diffractogram. This indicated that the adsorption process was physisorption, not chemisorption.

3.3.2. FTIR Analysis

The possible functional groups of the adsorbent FO/MS materials were inferred via FT-IR techniques (Figure 4B). An intense and wide band located at 3440 cm−1 was observed in the materials before and after treatment with Pb2+, which could be assigned to the stretching vibrations such as -OH, -Fe-OH and -Si-OH [41]. The sources of the hydroxyl groups were crystal water or physiosorbed water. The peak at 1630 cm−1 indicated that the material contained free water molecules [42]. Furthermore, the bands at 1086 cm−1 show asymmetric -Si-O-Si- stretching vibration and the bands at 464 cm−1 show asymmetric -Si-O-Si- bending vibrations [43]. Due to the material’s abundance of surface oxygenic functional groups, coordination complexes with heavy metals might be created by lone pairs of electrons entering the vacant orbitals of metal ions. After being treated with Pb2+, the peak intensities at 1086 and 464 cm−1 became weak due to the weakening of the -Fe-OH and -Si-OH bending vibrations. The -Si-OH and -Fe-OH groups could react with the adsorbed cations, which meant that this band would weaken [44].

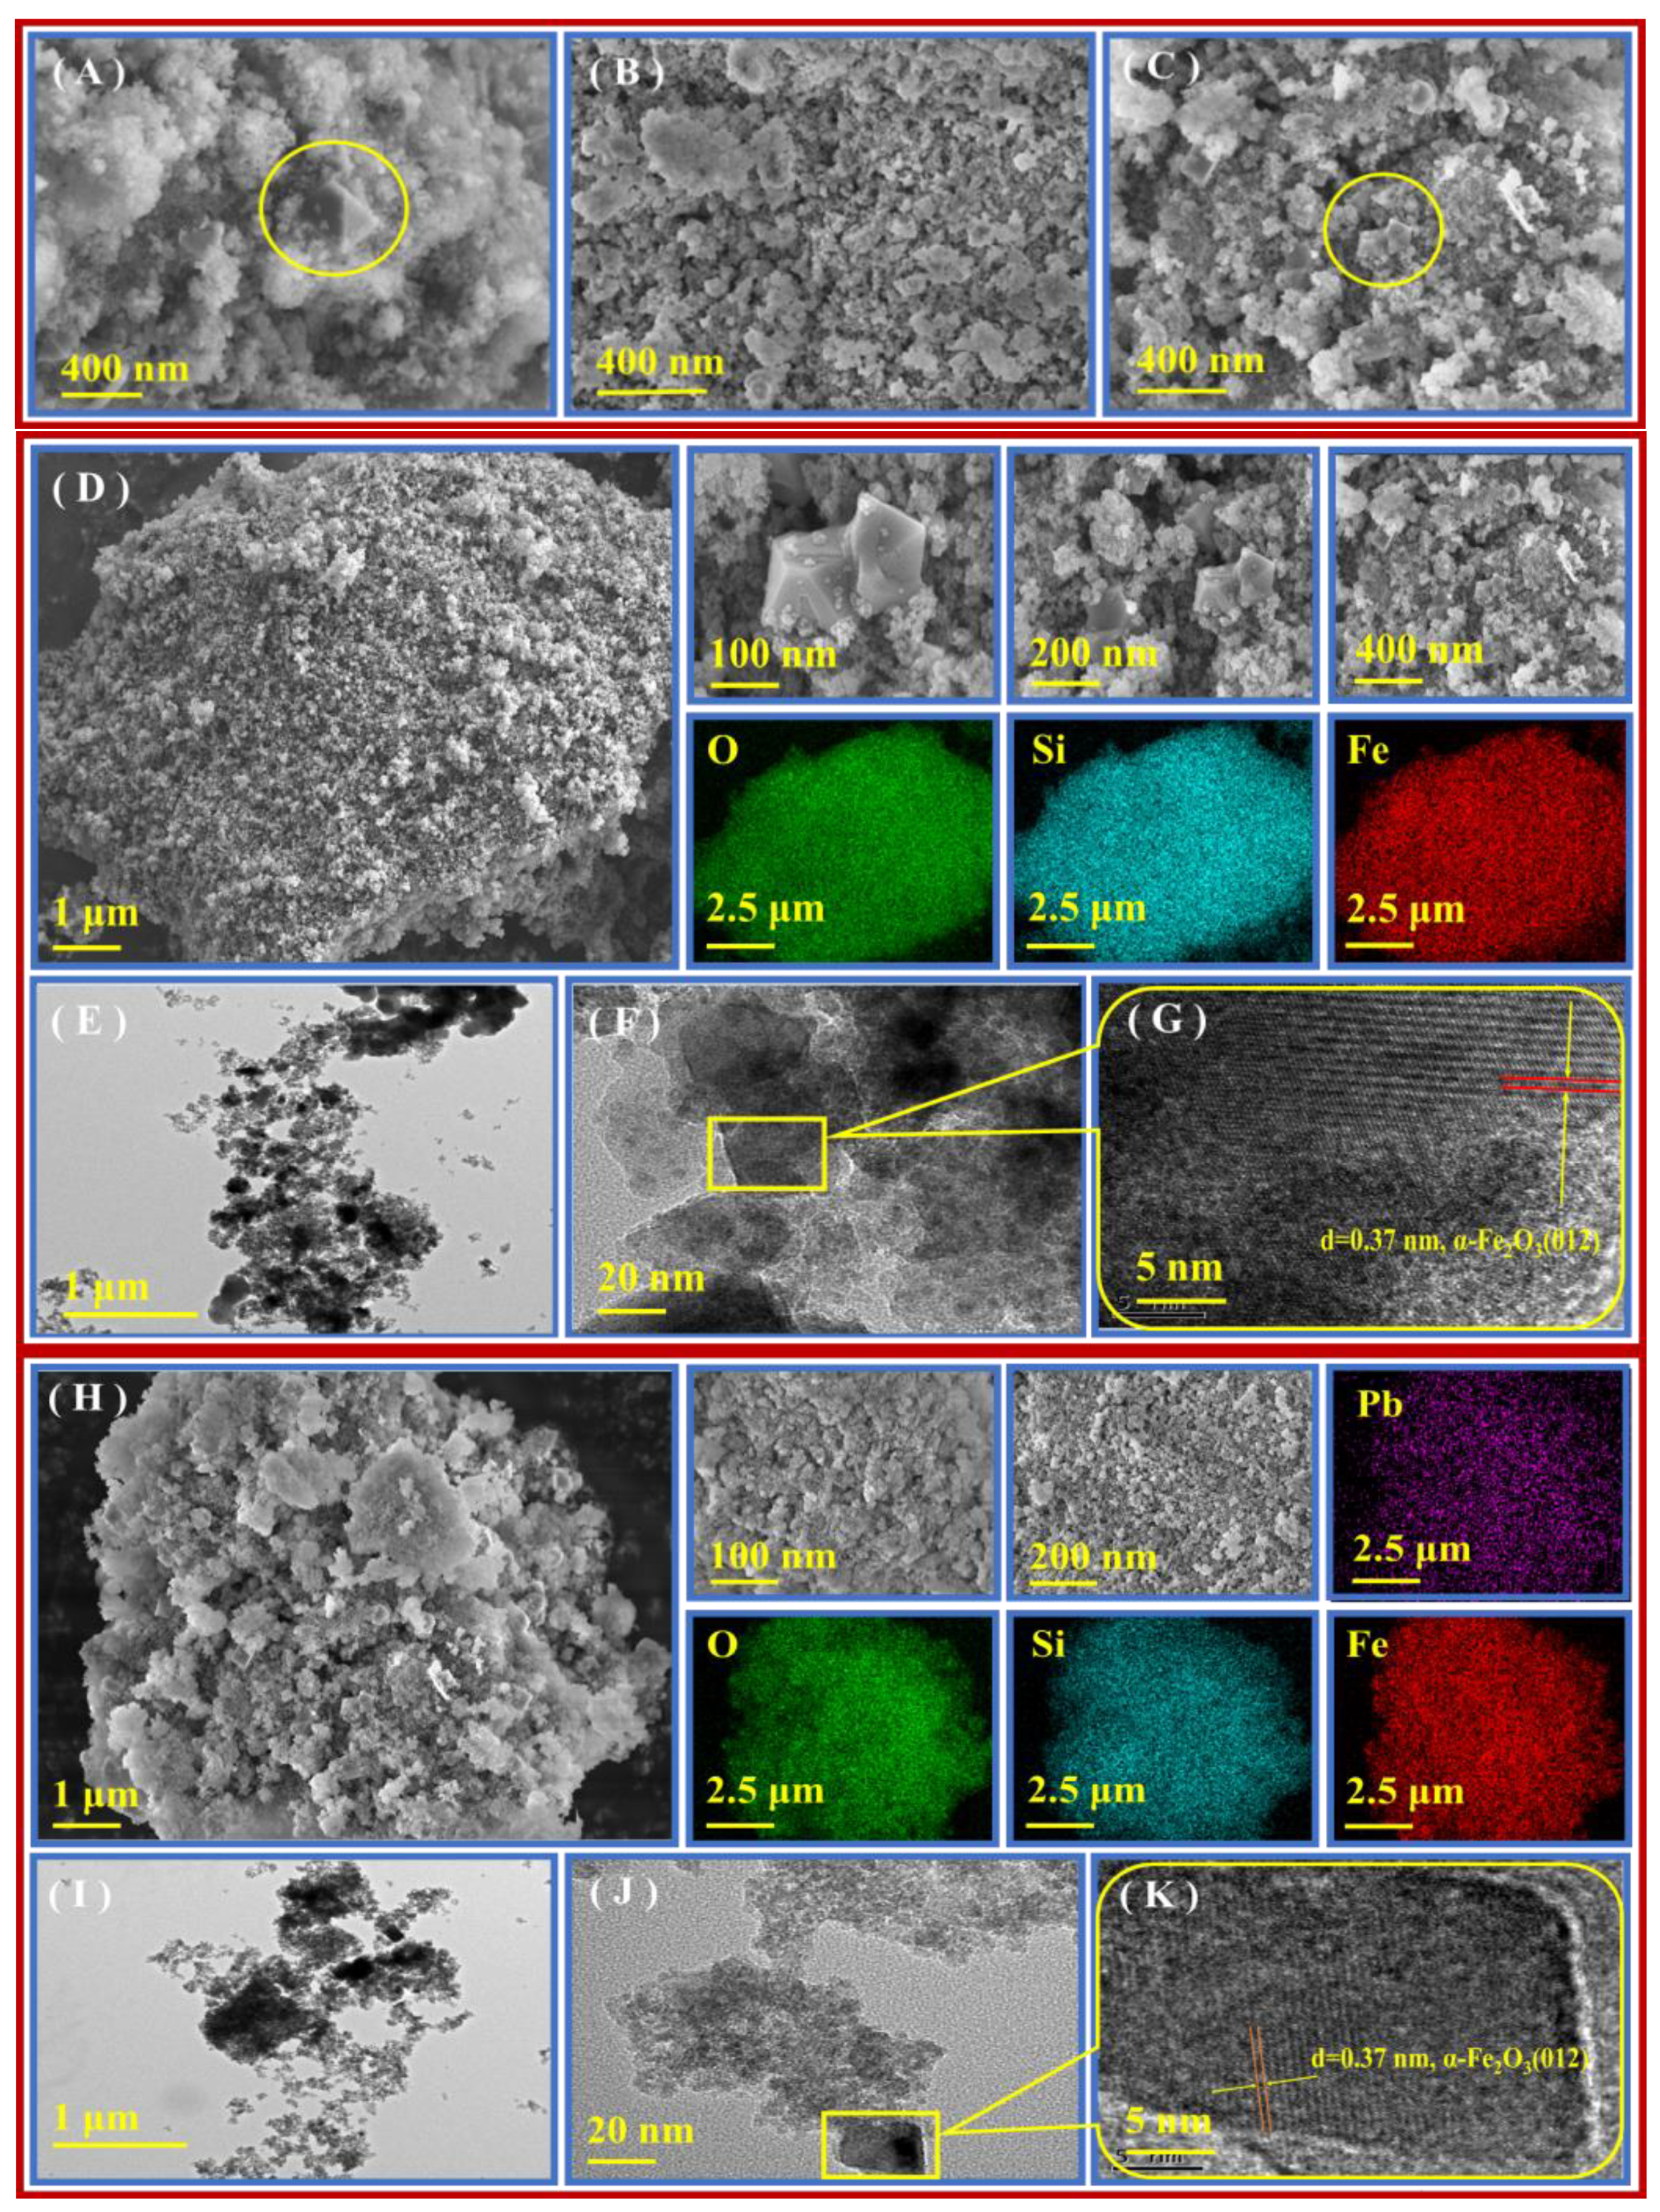
3.3.3. Microstructure Analysis

In the precipitation process, the ferric oxide material was obtained without adding mesoporous silica as the material support frame. The surface morphology and distribution of elements of ferric oxide, mesoporous silica and the FO/MS materials are presented in Figure 5. As depicted in Figure 5A, in the process of preparing the material, other precipitates could be formed and coated onto the surface of the ferric oxide material, forming relatively dense flocs. The surface morphology of the mesoporous silica is clearly shown in Figure 5B. It was distinctly observed that the mesoporous surface was uniform in distribution. This loose and porous crystal structure provided a good framework and carrier for compositing ferric oxide [45]. The surface morphology of FO/MS was exhibited in Figure 5C. The ferric oxide and mesoporous silica were homogeneously distributed, and there were still many mesoporous areas. The reasons for embedding FO into the structure of mesoporous silica included that the mesoporous silica structure was intended to provide a larger specific surface area and more load space for the FO material. Additionally, the growth of ferric oxide crystal in the mesoporous space could be limited. The SEM-EDS results showed that the particle size becomes smaller and more embedded in the mesoporous structure. In addition, the TEM images and the elemental mapping images of the adsorbent materials (Figure 5D,G,H,K) show that the elements Fe, O and Si were evenly distributed on the surface of the FO/MS, and Pb was also evenly distributed on the surface of the FO/MS treated with Pb2+.

3.3.4. Specific Surface Areas Analysis
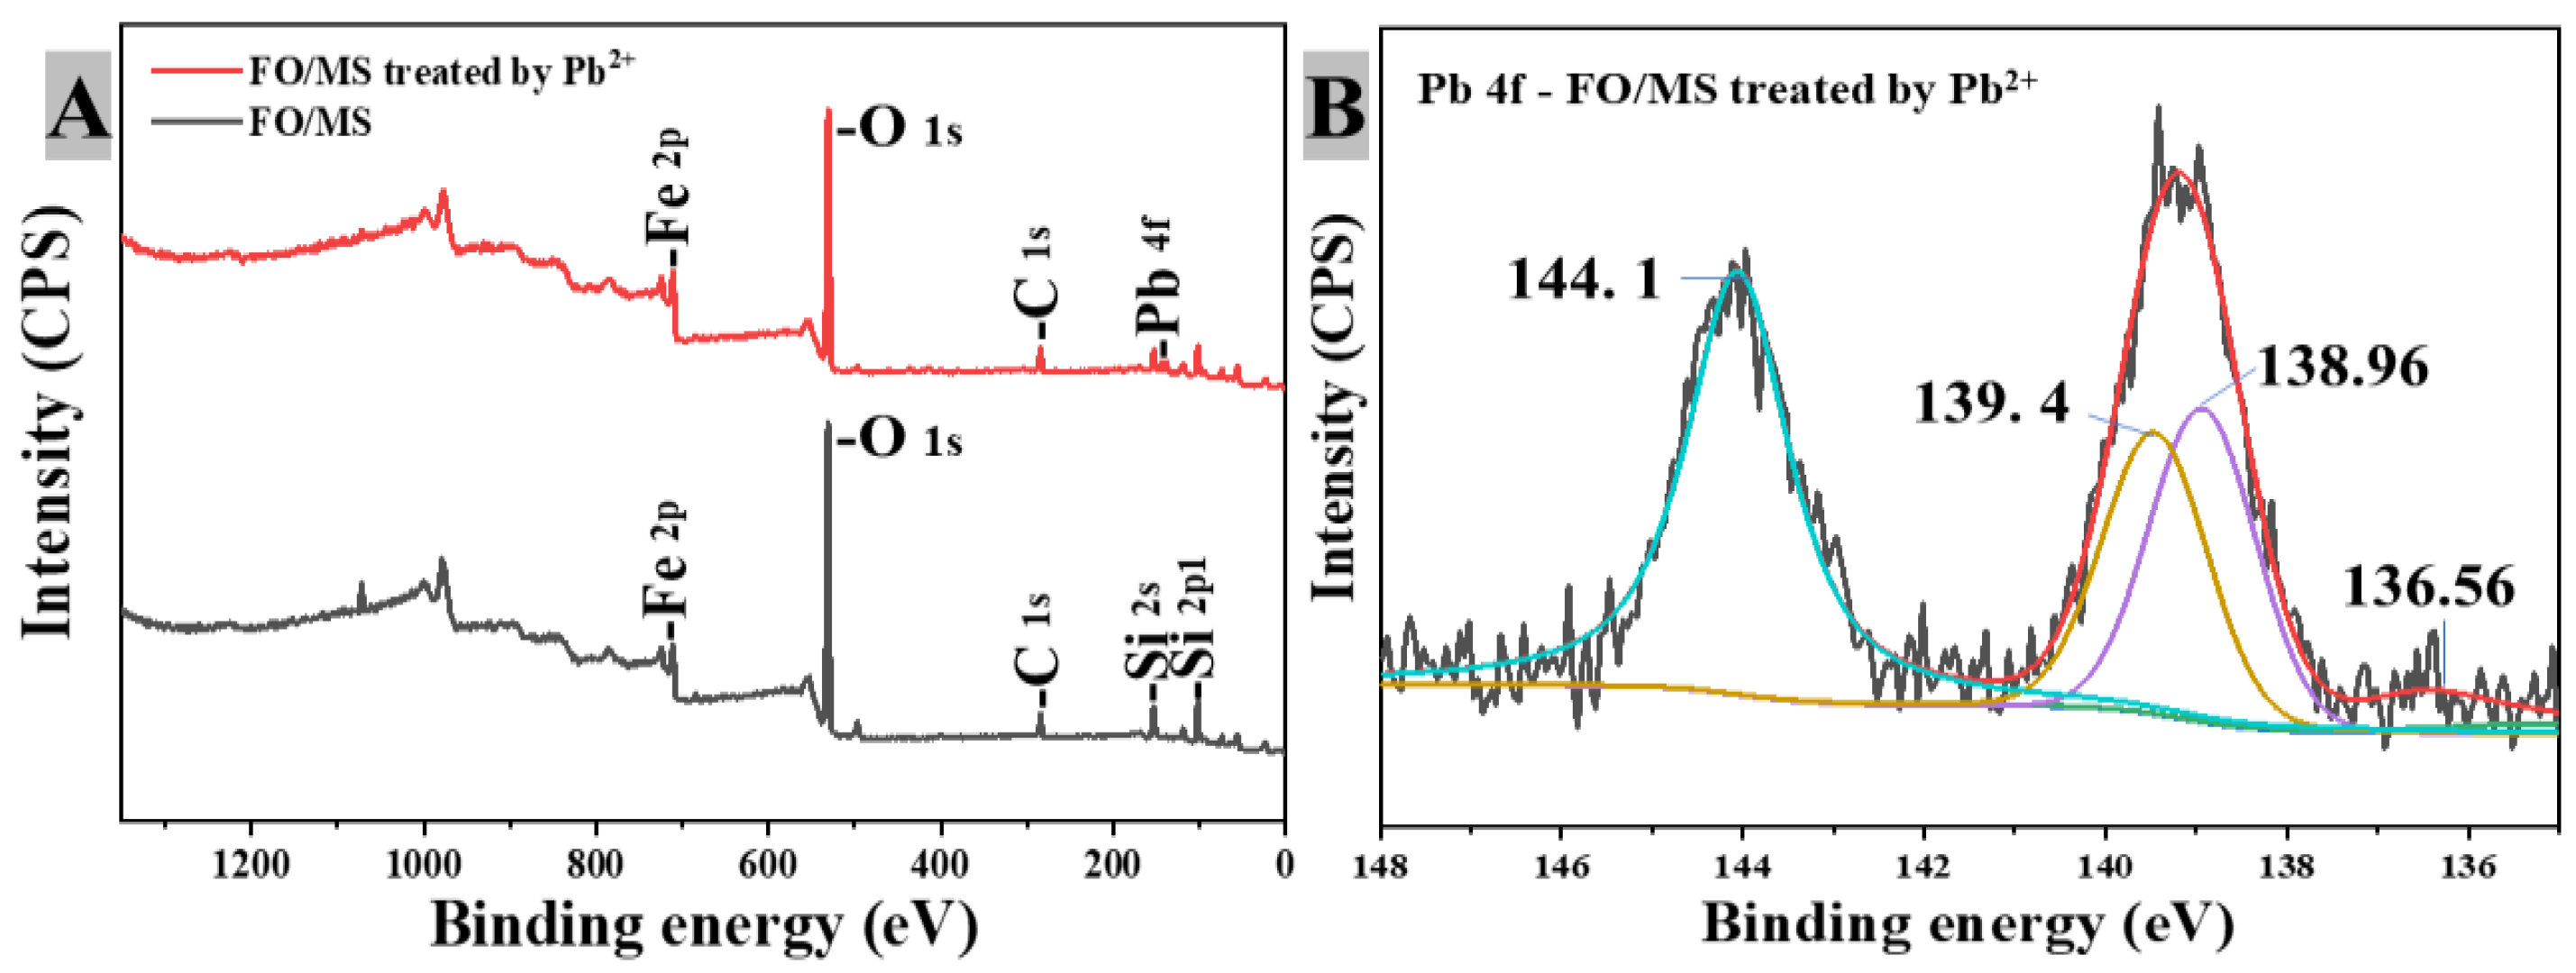
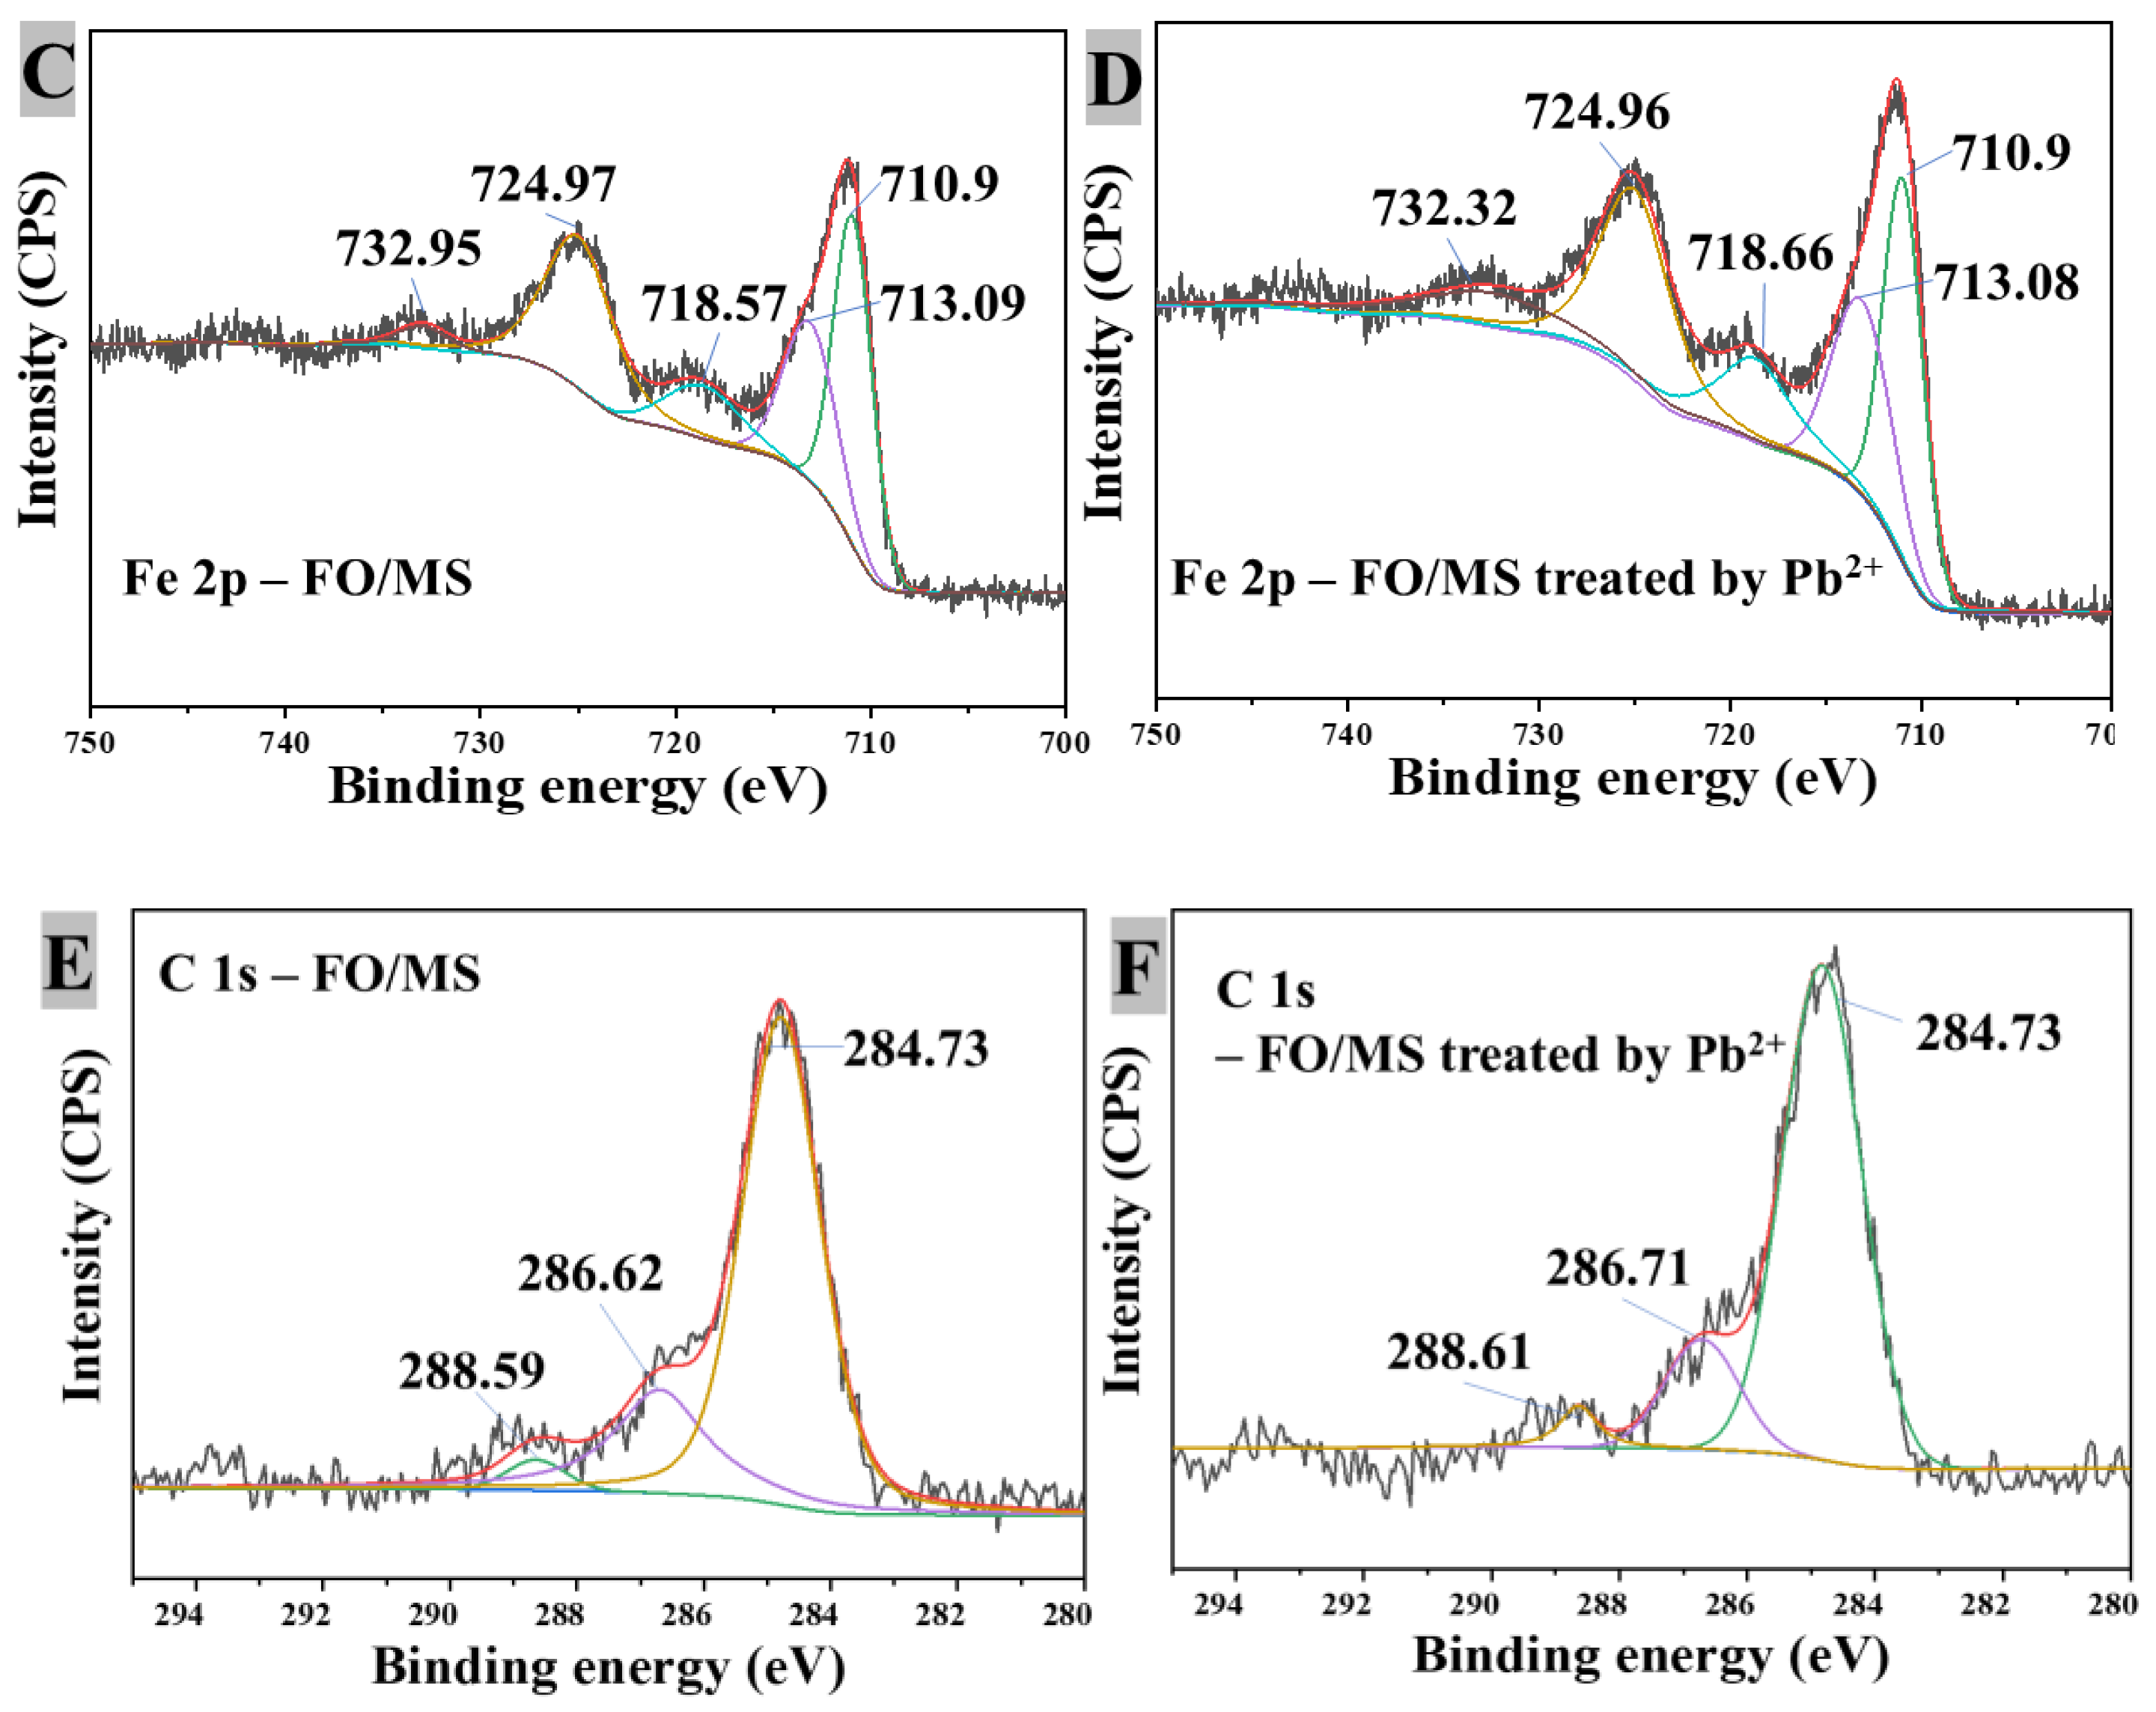
The detailed data on the specific surface area and pore size of the material tested using the BET method are shown in Table 6. The N2 adsorption-desorption curve and the pore size distribution are shown in Figure S5A. The specific surface area of the mesoporous silica reached 517.4 m2/g and the average pore size was 2 nm. The specific surface area of ferric oxide was 34.5 m2/g and the average pore size was 2 nm as shown in Figure S5B. In addition, the specific surface area of the mesoporous silica composite with ferric oxide was 146.12 m2/g, and the average pore size increased to 1 nm as depicted in Figure S5C. Although mesoporous silica has a high specific surface area and the surface of silica is easily hydroxylated, under acidic conditions, the adsorption of heavy metal ions on the mesoporous silica material is weak or it cannot be adsorbed onto the surface of the material. It could be found that the ferric oxide material had a certain adsorption effect on heavy metal ions and it did not obtain a large specific surface, thus, it was unable to expose more active sites for Pb2+ adsorption. As shown in Figure S5D, the specific surface area of FO/MS treated with Pb2+ was reduced to 89.96 m2/g, and the average pore size was 1 nm, which was attributed to the heavy metal ions occupying certain surface mesoporous channels [46].

3.3.5. XPS Analysis

The elemental oxidation status of the materials was characterized using XPS to further examine the rules governing the formation of their microstructure before and after Pb2+ treatment [47]. Peaks of C 1s (at 285.0 eV), O 1s (at 529.5 eV), Fe 2p (at 718 eV), Si 2s (at 150.5 eV) and Si 2p (at 100.1 eV) were found, as illustrated in Figure 6A. There were peaks of Pb 4f7/2 (139 eV), Pb 4d5/2 (412 eV) and Pb 4d3/2 (434 eV) in the survey spectra of FO/MS treated with Pb2+. These findings demonstrated that Pb2+ had been adsorbed onto the FO/MS surface. As seen in Figure 6B, the Pb 4f spectrum of FO/MS subjected to Pb2+ treatment was separated into three peaks with respective binding energies of 136.56 eV, 138.96 eV and 143.77 eV. The -Si-OH and Fe-OH groups especially reacted with Pb2+, which meant that the production of -Pb-OH was attributed to peaks at 138.96 and 143.77 eV.
Figure 6C,D clearly shows the XPS spectra of iron. The FO/MS satellites Fe 2p1/2 and Fe 2p3/2 were placed at 710.9, 713.07 and 718.57 eV, respectively [48]. The Pb2+-treated Fe 2p1/2 and Fe 2p3/2 satellites of the FO/MS are situated at 710.9, 713.08 and 718.66 eV, respectively. This showed that Pb2+ adsorption caused a notable positive shift in Fe 2p, particularly the satellite peak shift at 718.4 eV, which was likely caused by the conversion of hematite into magnetite or maghemite. The binding energy of Fe 2p clearly differed from FO/MS, indicating that the structure of the treated Fe-O bond was changed [49]. As shown in Figure 6E,F, the C 1s spectra of the materials before and after treatment with Pb2+ were made up of three chemical states: C = O (288 eV), C-O (286 eV), and C-C (284 eV) [50]. The chemical state of C did not change after interacting with the Pb2+ solution, although their relative intensities changed. The carbon present in the samples came from the incompletely burned organic template and was brought in by calibration instruments. After the reaction with the Pb2+ solution, the chemical state of C did not change, but its relative intensity was different.

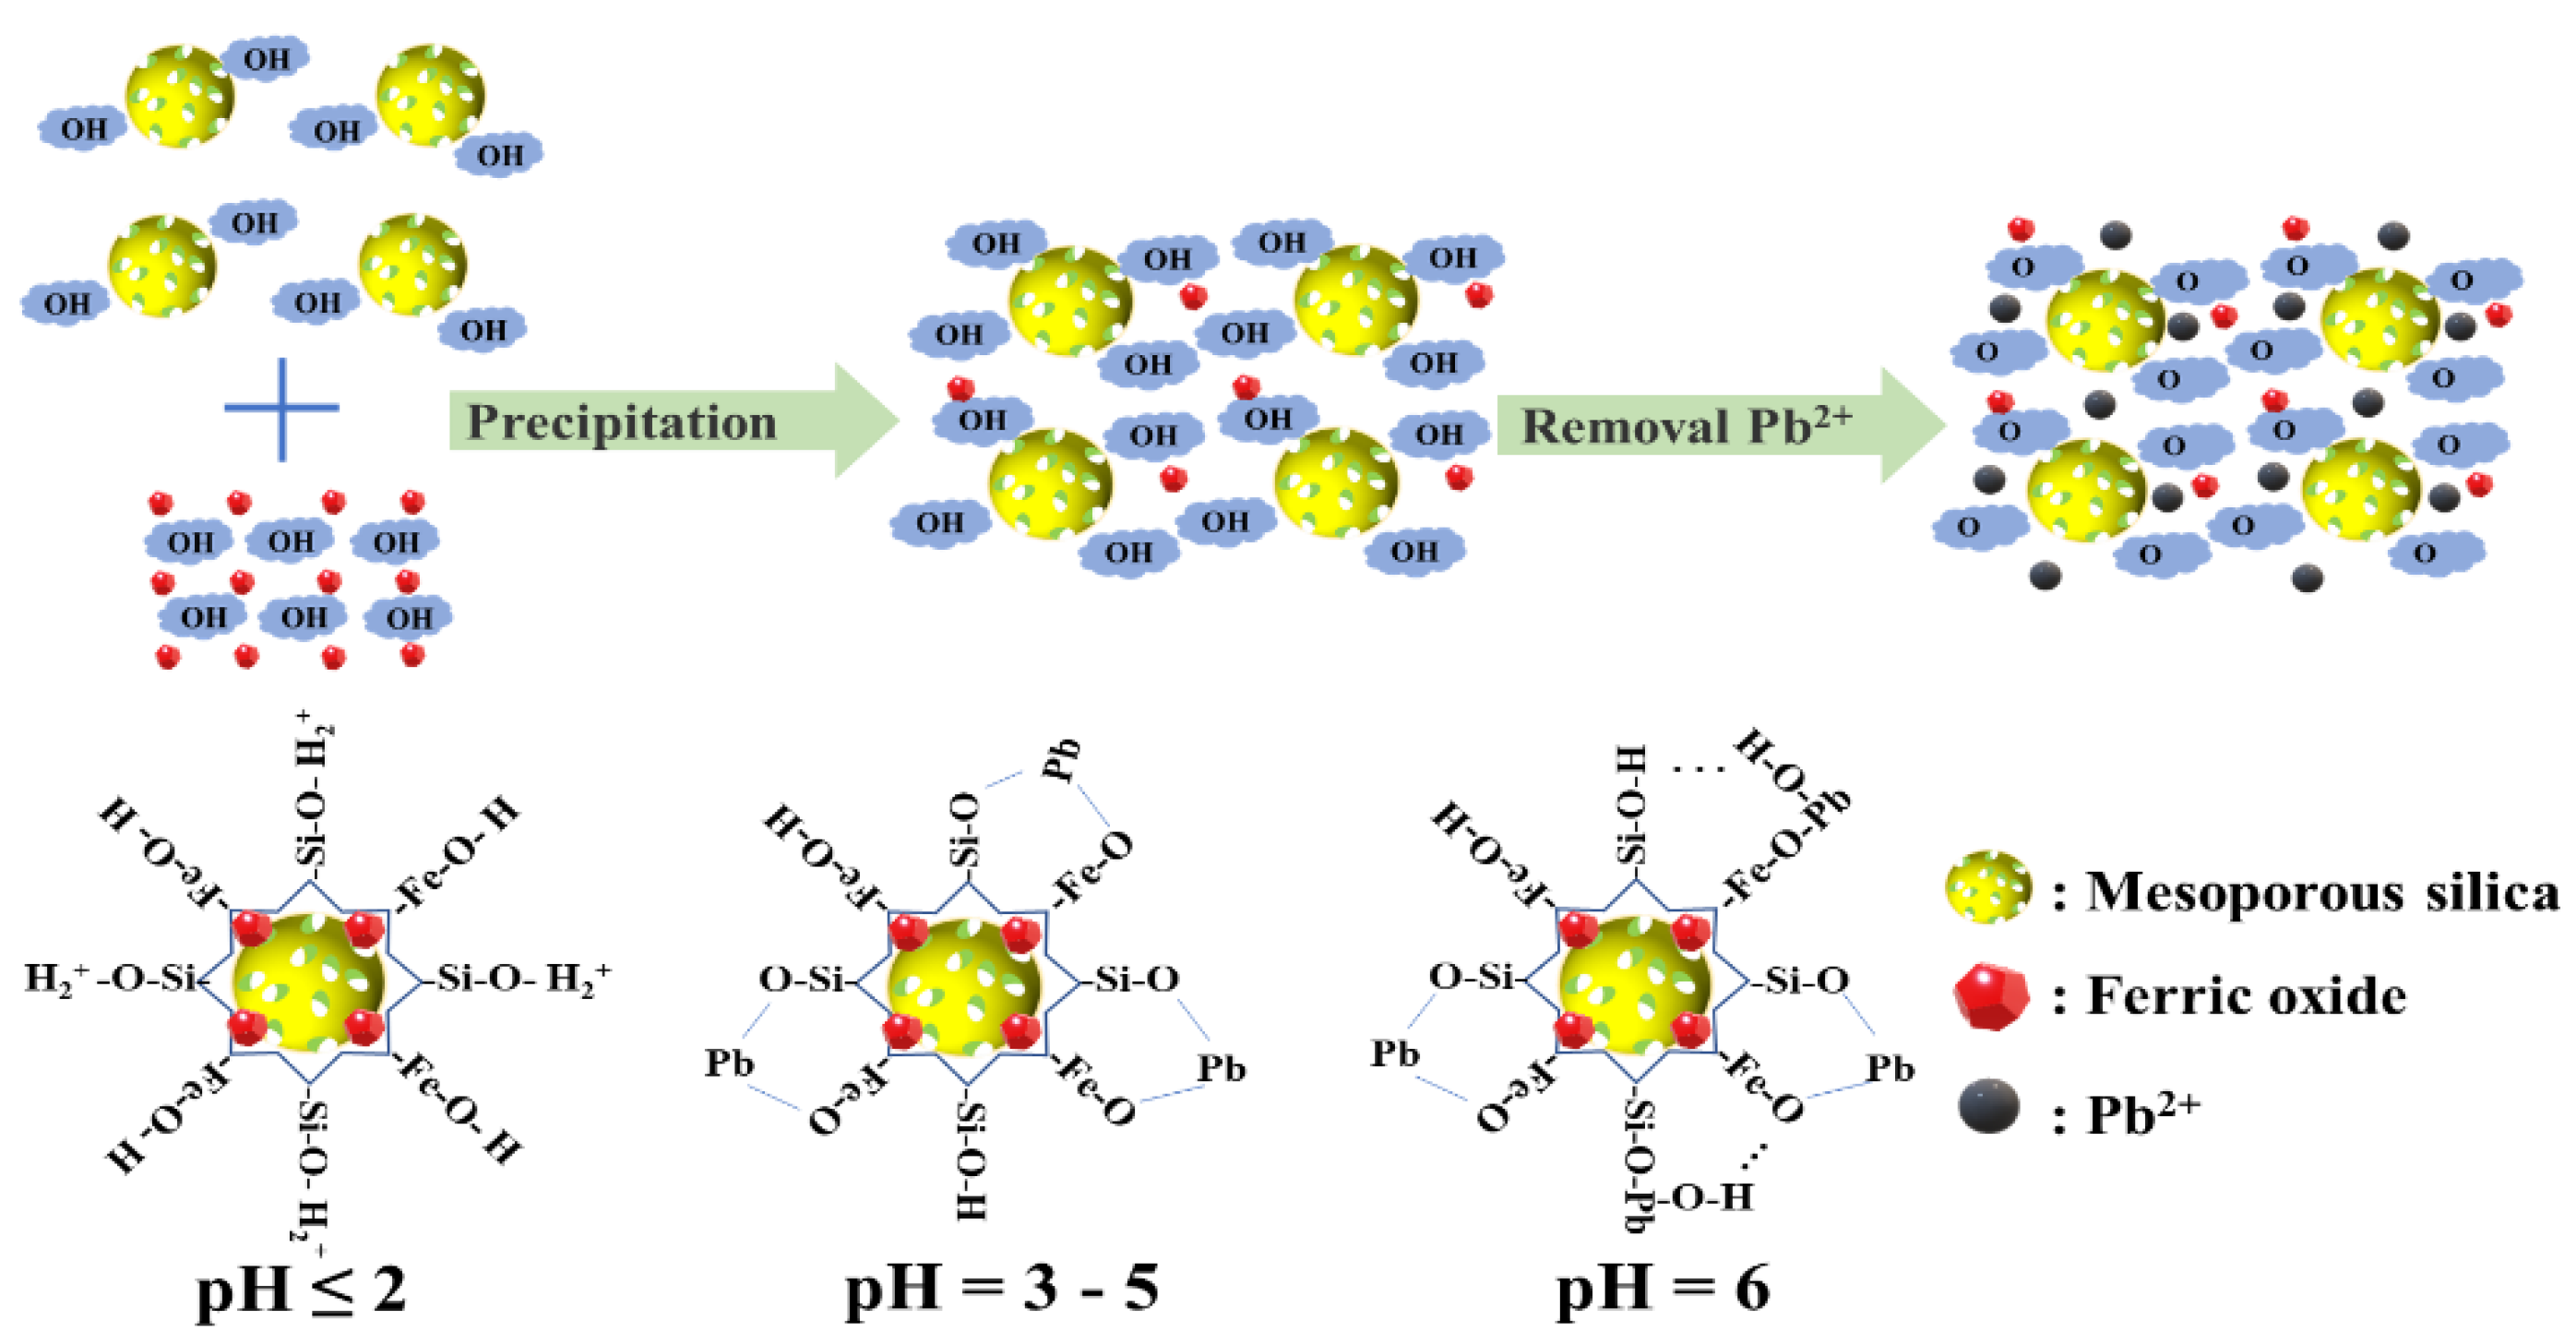
3.3.6. Pb2+ Removal Mechanism

According to the above analysis and characterization, there was a possible mechanism for Pb2+ removal, as described in Figure 7. Firstly, mesoporous silica prepared via biotite leaching slag had a high specific surface area and mesoporous channel microstructure. Mesoporous silica and ferric oxide were co-precipitated to form a composite material denoted as FO/MS. Then, many hydroxyl-functional groups were exposed on the surface of FO/MS materials as active sites for the adsorption of heavy metal ions. The adsorption was mainly through complexation and electrostatic interactions between the surface hydroxyl group and the heavy metal ions. When the pH value of the solution was lower than 2, the hydroxyl group on the surface of the FO/MS material was protonated and positively charged. An electrostatic repulsion occurred between the protonated hydroxyl group and Pb2+. When the pH dropped below 6, most of the lead was present in the solution as Pb2+, which indicated that the electrostatic attraction and complexation between FO/MS and Pb2+ could readily happen. The Pb2+ in the solution was exchanged with protons on the surface of the adsorbent. Moreover, some of the Pb2+ combined with the hydroxyl group to form Pb(OH)+ for a pH value of 6. In addition to the electrostatic action, there were Van der Waals forces to promote the interaction of Pb(OH)+ with the -Si-OH and -Fe-OH groups in the adsorption process.

4. Conclusions

In our work, a thorough approach to using biotite that contained rubidium was suggested. The optimized leaching rates of Rb and Fe from biotite with sulfuric acid reached 93.4 and 95.6%, respectively. Rubidium resources were well extracted and enriched. Mesoporous silica was prepared via leaching residue, and ferric oxide prepared via acid wastewater was co-precipitated to prepare the composite material FO/MS. With a maximum adsorption capacity of 143.47 mg/g, as calculated from the Langmuir model, the composite materials FO/MS successfully removed 99.5% Pb2+ from the aqueous solution with an initial concentration of 100 mg/L due to its wide specific surface area and its abundance of hydroxyl functional groups. Ion exchange, electrostatic adsorption and surface complexation composed the Pb2+ removal processes, whereas surface complexation could be the main contributor.

Supplementary Materials

The following supporting information can be downloaded at: https://www.mdpi.com/article/10.3390/w14172652/s1, Figure S1: Effect of sulfuric acid concentration (A), temperature (B), reaction time (C) and phase analysis (D) on the leaching of rubidium; Figure S2: Effect of initial pH values (A) on removal efficiency, lead existed form in the different solution pH values (B) ; Figure S3: Effect of recycling on residual Pb2+ concentration (A), pseudo-second-order kinetic fitting results of different cycles (B), effect of recycling on adsorption capacity (C) (Adsorbent concentration was designated 1.0 g/L, temperature was 25℃, initial pH value was 5) ; Figure S4: Metals removal efficiencies in Zn2+ coexistent with 100 mg/L Pb2+(A), Cd2+ coexistent with 100 mg/L Pb2+(B), Ca2+ coexistent with 100 mg/L Pb2+(C) and Mg2+ coexistent with 100 mg/L Pb2+ (Adsorbent concentration was designated 1.0 g/L, temperature was 25℃, initial pH value was 5) ; Figure S5: The N2 adsorption-desorption curves by BET method (A: Fe2O3 materials, B: mesoporous silica material, C: FO/MS materials, D: FO/MS materials treated by Pb2+); Table S1: Leaching experimental conditions; Table S2: Pre-set experimental conditions for Pb2+ removal.

Author Contributions

Y.L., Z.H. (Zhengwei Han) and Q.Z. conceived the experiments and analyzed the results; Z.H. (Zhengwei Han) and S.W. conducted the experiments; W.S., H.Z. and Z.H. (Zhiguo He) conducted the review and editing. All authors have read and agreed to the published version of the manuscript.

Funding

The authors gladly acknowledge the financial assistance from the postdoctoral research funding of Central South University and the National Key Research and Development Program of China (No.2020YFC1807602).

Institutional Review Board Statement

Not applicable.

Informed Consent Statement

Not applicable.

Data Availability Statement

Not applicable.

Conflicts of Interest

The authors declare no conflict of interest. The funders had no role in the design of the study; in the collection, analyses, or interpretation of data; in the writing of the manuscript, or in the decision to publish the results.

References

  1. Xing, P.; Wang, C.; Chen, Y.; Ma, B. Rubidium extraction from mineral and brine resources: A review. Hydrometallurgy 2021, 203, 105644. [Google Scholar] [CrossRef]
  2. Ma, X.; Ma, H.; Yuan, J. Kinetics and Mechanism of Leaching Potassium from Biotite in H2SO4 Solution. ChemistrySelect 2020, 38, 11955–11960. [Google Scholar] [CrossRef]
  3. Zeng, Q.; Li, S.; Sun, W.; Hu, L.; Zhong, H.; He, Z. Eco-friendly leaching of rubidium from biotite-containing minerals with oxalic acid and effective removal of Hg2+ from aqueous solution using the leaching residues. J. Clean. Prod. 2021, 306, 127167. [Google Scholar] [CrossRef]
  4. Xing, P.; Wang, C.; Ma, B.; Chen, Y. Removal of Pb(II) from aqueous solution using a new zeolite-type absorbent: Potassium ore leaching residue. J. Environ. Chem. Eng. 2018, 6, 7138–7143. [Google Scholar] [CrossRef]
  5. Xing, P.; Wang, C.; Ma, B.; Wang, L.; Zhang, W.; Chen, Y. Rubidium and Potassium Extraction from Granitic Rubidium Ore: Process Optimization and Mechanism Study. ACS Sustain. Chem. Eng. 2018, 6, 4922–4930. [Google Scholar] [CrossRef]
  6. Luo, Z.; Yang, J.; Ma, H.; Liu, M.; Ma, X. Recovery of magnesium and potassium from biotite by sulfuric acid leaching and alkali precipitation with ammonia. Hydrometallurgy 2015, 157, 188–193. [Google Scholar] [CrossRef]
  7. Li, M.; Huang, F.; Hu, L.; Sun, W.; Li, E.; Xiong, D.; Zhong, H.; He, Z. Efficient activation of peroxymonosulfate by a novel catalyst prepared directly from electrolytic manganese slag for degradation of recalcitrant organic pollutes. Chem. Eng. J. 2020, 401, 126085. [Google Scholar] [CrossRef]
  8. Song, J.; Huang, G.; Han, D.; Hou, Q.; Gan, L.; Zhang, M. A review of reactive media within permeable reactive barriers for the removal of heavy metal(loid)s in groundwater: Current status and future prospects. J. Clean. Prod. 2021, 319, 128644. [Google Scholar] [CrossRef]
  9. Zeng, Q.; Huang, L.; Ouyang, D.; Hu, Y.; Zhong, H.; He, Z. Process optimization on the extraction of rubidium from rubidium-bearing biotite. Miner. Eng. 2019, 137, 87–93. [Google Scholar] [CrossRef]
  10. Lu, C.; Yang, H.; Wang, J.; Tan, Q.; Fu, L. Utilization of iron tailings to prepare high-surface area mesoporous silica materials. Sci. Total Environ. 2020, 736, 139483. [Google Scholar] [CrossRef]
  11. Meléndez-Ortiz, H.; García-Cerda, L.; Olivares-Maldonado, Y.; Castruita, G.; Mercado-Silva, J.; Perera-Mercado, Y. Preparation of spherical MCM-41 molecular sieve at room temperature: Influence of the synthesis conditions in the structural properties. Ceram. Int. 2012, 38, 6353–6358. [Google Scholar] [CrossRef]
  12. Al-Ghouti, M.A.; Da’Ana, D.A. Guidelines for the use and interpretation of adsorption isotherm models: A review. J. Hazard. Mater. 2020, 393, 122383. [Google Scholar] [CrossRef]
  13. Figueira, P.; Lopes, C.; Daniel-Da-Silva, A.; Pereira, E.; Duarte, A.; Trindade, T. Removal of mercury (II) by dithiocarbamate surface functionalized magnetite particles: Application to synthetic and natural spiked waters. Water Res. 2011, 45, 5773–5784. [Google Scholar] [CrossRef]
  14. Mohmood, I.; Lopes, C.; Lopes, I.; Tavares, D.; Soares, A.; Duarte, A.; Trindade, T.; Ahmad, I.; Pereira, E. Remediation of mercury contaminated saltwater with functionalized silica coated magnetite nanoparticles. Sci. Total Environ. 2016, 557–558, 712–721. [Google Scholar] [CrossRef]
  15. Elwakeel, K.Z.; Guibal, E. Selective removal of Hg(II) from aqueous solution by functionalized magnetic-macromolecular hybrid material. Chem. Eng. J. 2015, 281, 345–359. [Google Scholar] [CrossRef]
  16. Gupta, V.K. Removal of lindane and malathion from wastewater using bagasse fly ash—A sugar industry waste. Water Res. 2002, 36, 2483–2490. [Google Scholar] [CrossRef]
  17. Song, S.; Lopez-Valdivieso, A.; Hernandez-Campos, D.; Peng, C.; Monroy-Fernandez, M.; Razo-Soto, I. Arsenic removal from high-arsenic water by enhanced coagulation with ferric ions and coarse calcite. Water Res. 2006, 40, 364–372. [Google Scholar] [CrossRef]
  18. Hu, P.; Zhang, Y.; Liu, T.; Huang, J.; Yuan, Y.; Yang, Y. Separation and recovery of iron impurity from a vanadium-bearing stone coal via an oxalic acid leaching-reduction precipitation process. Sep. Purif. Technol. 2017, 180, 99–106. [Google Scholar] [CrossRef]
  19. Hu, P.; Zhang, Y.; Liu, T.; Huang, J.; Yuan, Y.; Zheng, Q. Highly selective separation of vanadium over iron from stone coal by oxalic acid leaching. J. Ind. Eng. Chem. 2016, 45, 241–247. [Google Scholar] [CrossRef]
  20. Vernon, J.D.; Bonzongo, J.C.J. Volatilization and sorption of dissolved mercury by metallic iron of different particle sizes: Implications for treatment of mercury contaminated water effluents. J. Hazard. Mater. 2014, 276, 408–414. [Google Scholar] [CrossRef] [PubMed]
  21. Falyouna, O.; Eljamal, O.; Maamoun, I.; Tahara, A.; Sugihara, Y. Magnetic zeolite synthesis for efficient removal of cesium in a lab-scale continuous treatment system. J. Colloid Interf. Sci. 2020, 571, 66–79. [Google Scholar] [CrossRef] [PubMed]
  22. Li, S.; Li, S.; Wen, N.; Wei, D.; Zhang, Y. Highly effective removal of lead and cadmium ions from wastewater by bifunctional magnetic mesoporous silica. Sep. Purif. Technol. 2021, 265, 118341. [Google Scholar] [CrossRef]
  23. Singh, S.K.; Townsend, T.G.; Mazyck, D.; Boyer, T.H. Equilibrium and intra-particle diffusion of stabilized landfill leachate onto micro- and meso-porous activated carbon. Water Res. 2012, 46, 491–499. [Google Scholar] [CrossRef] [PubMed]
  24. He, S.Y.; Han, C.Y.; Wang, H.; Liu, C.X.; Shan, Y.; Luo, Y.M. Kinetic Study of Arsenic(V) Absorption with Al2O3 Functionalized SBA-15. Adv. Mater. Res. 2013, 726–731, 2191–2197. [Google Scholar] [CrossRef]
  25. Ma, W.; Meng, F.; Cheng, Z.; Xin, G.; Duan, S. Synthesis of macroporous silica biomass nanocomposite based on XG/MgSiO3 for the removal of toxic ions. Bioresour. Technol. 2015, 186, 356–359. [Google Scholar] [CrossRef]
  26. Venkateswarlu, S.; Yoon, M. Core–Shell Ferromagnetic Nanorod Based on Amine Polymer Composite (Fe3O4@DAPF) for Fast Removal of Pb(II) from Aqueous Solutions. ACS Appl. Mater. Interfaces 2015, 7, 25362–25372. [Google Scholar] [CrossRef]
  27. Ramos-Guivar, J.A.; Taipe, K.; Schettino, M.A., Jr.; Silva, E.; Torres, M.A.M.; Passamani, E.C.; Litterst, F.J. Improved Removal Capacity and Equilibrium Time of Maghemite Nanoparticles Growth in Zeolite Type 5A for Pb(II) Adsorption. Nanomaterials 2020, 10, 1668. [Google Scholar] [CrossRef]
  28. Chen, W.; Lu, Z.; Xiao, B.; Gu, P.; Yao, W.; Xing, J.; Asiri, A.M.; Alamry, K.A.; Wang, X.; Wang, S. Enhanced removal of lead ions from aqueous solution by iron oxide nanomaterials with cobalt and nickel doping. J. Clean. Prod. 2019, 211, 1250–1258. [Google Scholar] [CrossRef]
  29. Yin, W.; Dai, D.; Hou, J.; Wang, S.; Wu, X.; Wang, X. Hierarchical porous biochar-based functional materials derived from biowaste for Pb(II) removal. Appl. Surf. Sci. 2018, 465, 297–302. [Google Scholar] [CrossRef]
  30. Zhang, F.; Tang, X.; Huang, Y.; Keller, A.A.; Lan, J. Competitive removal of Pb2+ and malachite green from water by magnetic phosphate nanocomposites. Water Res. 2018, 150, 442–451. [Google Scholar] [CrossRef]
  31. Chen, D.; Shen, W.; Wu, S.; Chen, C.; Luo, X.; Guo, L. Ion exchange induced removal of Pb(ii) by MOF-derived magnetic inorganic sorbents. Nanoscale 2016, 8, 7172–7179. [Google Scholar] [CrossRef]
  32. Ma, Z.; Guan, Y.; Liu, H. Synthesis and characterization of micron-sized monodisperse superparamagnetic polymer particles with amino groups. J. Polym. Sci. Part A Polym. Chem. 2005, 43, 3433–3439. [Google Scholar] [CrossRef]
  33. Mishra, S.; Verma, N. Surface ion imprinting-mediated carbon nanofiber-grafted highly porous polymeric beads: Synthesis and application towards selective removal of aqueous Pb(II). Chem. Eng. J. 2017, 313, 1142–1151. [Google Scholar] [CrossRef]
  34. Ahmad, R.; Mirza, A. Facile one pot green synthesis of Chitosan-Iron oxide (CS-Fe2O3) nanocomposite: Removal of Pb(II) and Cd(II) from synthetic and industrial wastewater. J. Clean. Prod. 2018, 186, 342–352. [Google Scholar] [CrossRef]
  35. Oyetade, O.A.; Skelton, A.A.; Nyamori, V.; Jonnalagadda, S.B.; Martincigh, B. Experimental and DFT studies on the selective adsorption of Pb 2+ and Zn 2+ from aqueous solution by nitrogen-functionalized multiwalled carbon nanotubes. Sep. Purif. Technol. 2017, 188, 174–187. [Google Scholar] [CrossRef]
  36. Zarime, N.; Zuhairi, W.Y.W.; Krishna, S. Adsorption of Nickel and Zinc by Residual Soils. Am. J. Environ. Sci. 2014, 10, 523–529. [Google Scholar] [CrossRef]
  37. Yu, C.; Shao, Z.; Hou, H. A functionalized metal–organic framework decorated with O− groups showing excellent performance for lead(ii) removal from aqueous solution. Chem. Sci. 2017, 8, 7611–7619. [Google Scholar] [CrossRef]
  38. Bérubé, F.; Kaliaguine, S. Calcination and thermal degradation mechanisms of triblock copolymer template in SBA-15 materials. Microporous Mesoporous Mater. 2008, 115, 469–479. [Google Scholar] [CrossRef]
  39. Boukoussa, B.; Hakiki, A.; Moulai, S.; Chikh, K.; Kherroub, D.E.; Bouhadjar, L.; Guedal, D.; Messaoudi, K.; Mokhtar, F.; Hamacha, R. Adsorption behaviors of cationic and anionic dyes from aqueous solution on nanocomposite polypyrrole/SBA-15. J. Mater. Sci. 2018, 53, 7372–7386. [Google Scholar] [CrossRef]
  40. Xu, H.; Ni, K.; Li, X.; Fang, G.; Fan, G. Structural transformation of Pd-α-Fe2O3 and Pd-γ-Fe2O3 catalysts and application in the CO oxidation reaction. RSC Adv. 2017, 7, 51403–51410. [Google Scholar] [CrossRef] [Green Version]
  41. Lu, H.; Wen, C.; Gao, S.; Dong, Y.; Zhang, M.; Li, B.; Hu, W.; Dong, J. Incorporation of nanoscale zero-valent iron particles in monodisperse mesoporous silica nanospheres: Characterization, reactivity, transport in porous media. Colloids Surf. A Physicochem. Eng. Asp. 2018, 553, 28–34. [Google Scholar] [CrossRef]
  42. Yang, F.; Zhang, S.; Sun, Y.; Cheng, K.; Li, J.; Tsang, D.C. Fabrication and characterization of hydrophilic corn stalk biochar-supported nanoscale zero-valent iron composites for efficient metal removal. Bioresour. Technol. 2018, 265, 490–497. [Google Scholar] [CrossRef]
  43. Mikhailov, M.N.; Kazansky, V.B.; Kustov, L.M. Intensities of IR stretching bands as a criterion of the strength of Lewis acid sites in ZSM-5 zeolites with bivalent cations. Catal. Lett. 2007, 116, 81–86. [Google Scholar] [CrossRef]
  44. Zeng, Q.; Huang, Y.; Huang, L.; Hu, L.; Sun, W.; Zhong, H.; He, Z. High adsorption capacity and super selectivity for Pb(Ⅱ) by a novel adsorbent: Nano humboldtine/almandine composite prepared from natural almandine. Chemosphere 2020, 253, 126650. [Google Scholar] [CrossRef]
  45. Tanaka, S.; Kaneti, Y.V.; Septiani, N.L.W.; Dou, S.X.; Bando, Y.; Hossain, M.S.A.; Yamauchi, Y. A Review on Iron Oxide-Based Nanoarchitectures for Biomedical, Energy Storage, and Environmental Applications. Small Methods 2019, 5, 1800512. [Google Scholar] [CrossRef]
  46. Jabeen, H.; Kemp, K.; Chandra, V. Synthesis of nano zerovalent iron nanoparticles—Graphene composite for the treatment of lead contaminated water. J. Environ. Manag. 2013, 130, 429–435. [Google Scholar] [CrossRef]
  47. Deng, S.; Zhang, G.; Liang, S.; Wang, P. Microwave Assisted Preparation of Thio-Functionalized Polyacrylonitrile Fiber for the Selective and Enhanced Adsorption of Mercury and Cadmium from Water. ACS Sustain. Chem. Eng. 2017, 5, 6054–6063. [Google Scholar] [CrossRef]
  48. Yamashita, T.; Hayes, P. Analysis of XPS spectra of Fe2+ and Fe3+ ions in oxide materials. Appl. Surf. Sci. 2008, 254, 2441–2449. [Google Scholar] [CrossRef]
  49. Penke, Y.K.; Anantharaman, G.; Ramkumar, J.; Kar, K.K. Aluminum Substituted Cobalt Ferrite (Co−Al−Fe) Nano Adsorbent for Arsenic Adsorption in Aqueous Systems and Detailed Redox Behavior Study with XPS. ACS Appl. Mater. Interfaces 2017, 9, 11587–11598. [Google Scholar] [CrossRef] [PubMed]
  50. Huang, Y.; Tang, J.; Gai, L.; Gong, Y.; Guan, H.; He, R.; Lyu, H. Different approaches for preparing a novel thiol-functionalized graphene oxide/Fe-Mn and its application for aqueous methylmercury removal. Chem. Eng. J. 2017, 319, 229–239. [Google Scholar] [CrossRef]
Figure 1. Utilization of biotite to prepare high-surface area FO/MS materials.
Water 14 02652 g001
Figure 2. Comparison of adsorption efficiencies of FO, MS and FO/MS (A) Initial Pb2+ concentration was 105 mg/L at 25 °C with a pH value of 5 and the concentration of adsorbent was 0.5 g/L, the effect of initial Pb2+ concentration in removal capacity. (B) Adsorption kinetics fitting; (C) PFOM; (D) PSOM; (E) IPDM and isothermal adsorption studies; (F) Langmuir; (G) Freundlich; (H) Temkin.
Water 14 02652 g002
Figure 3. Effect of temperature on removal efficiency (A), the pseudo-second-order kinetic model fitting results at different temperatures (B) and the fitting results of the thermodynamic model (C).
Water 14 02652 g003
Figure 4. The XRD pattern (A) and the FT−IR spectra (B) of the as-prepared samples.
Water 14 02652 g004
Figure 5. The SEM graphs of ferric oxide (A), mesoporous silica materials (B), FO/MS materials (C), SEM-EDS and mapping (D), TEM (EG) of FO/MS materials, SEM-EDS and mapping (H) and TEM (IK) of FO/MS materials treated using Pb2+.
Water 14 02652 g005
Figure 6. Surveyed XPS spectra of FO/MS and FO/MS incubated with Pb2+ solution (A), Pb 4f spectra of FO/MS incubated with Pb2+ solution (B). Fe 2p (C,D) and C 1s (E,F) spectra of FO/MS and FO/MS incubated with Pb2+ solution.
Water 14 02652 g006aWater 14 02652 g006b
Figure 7. Plausible Pb2+ removal mechanisms via FO/MS.
Water 14 02652 g007
Table 1. Chemical elemZent composition of biotite concentrated rock.
ElementsOFeMgAlSiRbSKCaTiOthers
Contents26.14.430.616.3736.70.410.684.480.190.5719.42
Table 2. Fitted parameters of adsorption kinetics and isothermal adsorption studies.
Initial Pb2+ Concentration (mg/L)50100150200
Pseudo-first-order modelQe (mg/g)51.5105.76142.87141.46
R20.940230.928260.974920.99359
Pseudo-second-order modelQe (mg/g)54.11112.23146.84146.41
R20.968660.964050.992150.99887
Intra-particle diffusion modelQe (mg/g)45.8190.91124.56128.46
R20.969340.902930.996620.99233
Table 3. Fitted parameters of Freundlich, Langmuir and Temkin models of Pb2+ removal by leaching residues.
ModelLangmuirFreundlichTemkin
ParametersQmKLR2nKFR2ATBTR2
Values143.474.740.9996.82119.940.666127413.160.793
Table 4. The maximum Pb2+ adsorption capacity of other reported materials.
MaterialsQm (mg/g)Removal
Efficiency (%)
Initial Concentration (mg/L)Equilibrium Time (min)References
NPZEO326599.9505[26]
Fe3O4@DC83.399.58085[27]
Co-Fe2O313698.5100120[28]
Ni-Fe2O397.599.510080[28]
FBM/700133.6199.95090[29]
FSP(Fe3O4)20299.55065[30]
FeIII-MOF-534599.7100105[31]
CoFe2O451982030[32]
FO/MS143.4799.710060This work
Table 5. Kinetic parameters of Pb2+ removal at different temperatures.
Temperature (°C)Pseudo Second-Order Model
Qe (mg/g)k2R2
25150.600.0011840.99559
35151.750.0006090.98861
45149.930.0005270.98621
Table 6. The specific surface area and pore size of the material via BET method.
MaterialsBET Specific Surface Area (m2/g)Average Pore Size (nm)
Fe2O334.52
Mesoporous silica517.42
FO/MS146.121
FO/MS treated with Pb2+89.961
Publisher’s Note: MDPI stays neutral with regard to jurisdictional claims in published maps and institutional affiliations.

