1. Introduction
The semi-humid regions of China cover 15% of the country’s territory and receive between 400 and 800 millimetres of precipitation annually. The rainfall is unevenly distributed throughout the year, with the majority falling in the summer and for brief periods [
1]. Due to the concentration of heavy rainfall in short periods, the traditional model of rapid rainwater drainage, which relies on grey infrastructure such as pumping stations and stormwater pipe networks, has become difficult to adapt to the needs of modern urban development [
2]. Simultaneously, the city’s water consumption exceeds the amount of local water resources in Qian’an, which has become a water-scarce city, and water-resource-based population pressure has become prominent [
3]. Therefore, Qian’an City in Hebei Province has declared its status as a pilot sponge city, and aims to effectively address the issues, alleviate resource-based water scarcity, and reduce the risk of water disasters [
4]. In 2014, Qian’an was established as one of the first pilot sponge cities. It was the only one in the Beijing–Tianjin–Hebei region to discover effective methods for addressing urban water issues by constructing a sponge city [
5,
6]. Additionally, Hebei Province ranks 12th in the nation in terms of GDP, while Qian’an City ranks first in Hebei Province’s economy. The total number of sponge city construction projects in Qian’an City is 187, with a total investment of CNY 2406 billion, which accounts for approximately 2.5% of the city’s total GDP over the past two years [
7]. Investments in constructing sponge cities in Qian’an still require careful consideration. Therefore, it is essential to evaluate the planning and design process for sponge city construction in semi-humid areas from a cost- effectiveness standpoint.
A growing number of domestic and international simulation studies for various hydrological processes have demonstrated that low impact development (LID) practices effectively control urban stormwater runoff and reduce water pollution. LIDs such as sunken green space, bioretention ponds, permeable pavements, and green roofs are commonly used in the design of LIDs for urbanised areas [
8,
9,
10]. Various types of research have been conducted on these facilities from various perspectives. Zahmatkesh et al. evaluated the effect of bioretention ponds and permeable pavement on the urban stormwater runoff in New York City under various precipitation scenarios [
11]. Herrera et al. used hydrological models to simulate the performance of green roofs in semi-arid climates and estimate their runoff coefficients demonstrating the efficacy of a LID facility [
12]. Zheng et al. evaluated the runoff control capacity of a single LID based on different rainfall return periods, rainfall ephemeris, and footprint. They then used the Stormwater Flood Management Model (SWMM) to simulate the runoff reduction effect of each LID on different rainfall processes under different footprints [
13]. Li et al. combined the SWMM and NSGA-II to determine the optimal distribution of three LIDs (rain gardens, permeable pavement, and green roofs) in the study area [
14]. Liu et al. investigated the efficacy of various LIDs and their combinations regarding varying rainfall return periods. It was shown that a single LID had limited runoff abatement capacity, particularly during more significant rainfall events, whereas combined LID scenarios had more effective hydrological performance [
15]. Recent research has revealed essential information about the effectiveness of the implementation of LID facilities or the cost-effectiveness of a single LID. For example, Wang et al. studied the hydrological performance and cost effectiveness of different structures of bioretention facilities under different climatic conditions [
16], and Rehan et al. analysed and compared the life cycle costs of two types of permeable pavement with two types of conventional impermeable pavement [
17]. However, the systematic assessment of the hydrological effects caused by the implementation of sponge cities or a particular LID scheme has been rarely considered [
18,
19,
20,
21]. The failure to further study hydrological performance and its combined benefits, and the neglect of pre-construction cost investments and long-term maintenance costs [
22,
23], can result in a greater pressure to build, operate, and manage [
24,
25]. Simultaneously, a lack of detailed calculations of the cost-effectiveness of the planning and design of LID system implementation makes it difficult to objectively assess the economic rationality of implementing sponge measures, given that various LID scenarios have varying hydrological effectiveness and costs. A comprehensive assessment of hydrological performance and cost-effectiveness is essential in planning and designing LID scenarios and selecting facilities for sponge city construction [
26].
The planning and design of LID schemes in the construction of sponge cities needs to be tailored to local conditions. To achieve widespread localised application of LID facilities, it is necessary to expand and improve the theoretical system of LID system design, taking into account the regional hydrogeological conditions, and to propose a set of effective measures to alleviate the stormwater problems faced by China’s urbanisation process. As the cost of sponge city construction gradually increases, the analysis of the costs and benefits associated with LID facilities is becoming increasingly important in order to make reasonable construction decisions. Zhou et al. constructed a hydrological model using the Ximen area of Pingxiang City, Jiangxi Province, as an example, to analyse the hydrological performance and cost effectiveness of sponge city construction, and the research results are an important reference for sponge city construction in areas with abundant water [
27]. Li et al. used a scenario analysis to study the cost-effectiveness of typical LID facilities in Chinese cities and to compare the construction differences between sponge cities in northern and southern cities [
28]. There is a lack of relevant assessment and research on sponge city construction in semi-humid areas at home and abroad. It is yet to be established, how to best address the water problems that exist in cities in semi-humid areas with a lower cost investment. There is a need to establish a multi-objective, synergistic, and optimal configuration of LID facility types, scale, location, and cost according to the current problems of each city.
The evaluation of sponge city construction has included a number of quantitative and qualitative indicators. Lee and Kim used a flood-prone area in the Bupyeong borough of Incheon, Korea as a study site to simulate the cost-effectiveness of three LID measures compared to conventional stormwater pipe infrastructure, concluding that localised use of LID facilities was more effective [
29]. Dos Santos et al. evaluated the use of LID facilities in the low-income settlement of Sao Carlos, Brazil, and compared to two other scenarios, the cost of LID scenario is lower, and this study contributes to the decision-making process of sustainable stormwater management in developing countries [
30]. Forasté et al. measured the cost-effectiveness of stormwater management schemes using four case studies and found that LID facilities performed better at a lower cost than traditional methods [
31]. Compared to technical studies, there are relatively few quantitative studies on the evaluation of the benefits of sponge city construction and its indicators and the existing studies only focus on one case study, lacking a process of evaluating and optimising LID systems with multiple scenario simulations for comparison.
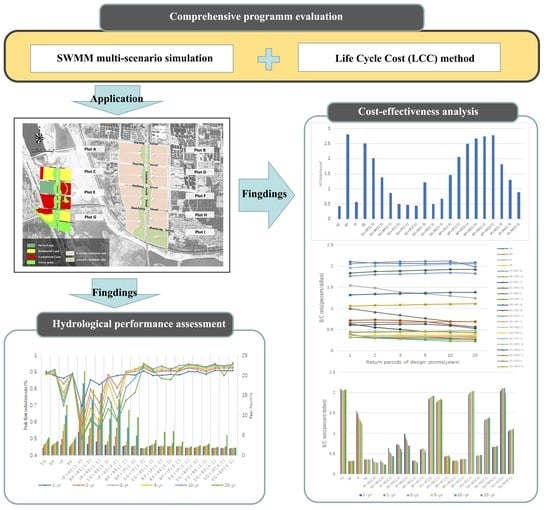
Using the green space of Yanshan South Road in Qian’an City as an example, this paper introduced the life cycle cost (LCC) analysis method. It used the SWMM model to conduct multi-scenario simulations of various LID combinations based on detailed basic information. Finally, the method of cost- effectiveness analysis was examined to evaluate the cost-effectiveness of various LID combination options. An integrated framework for analysis, planning, modelling simulation, and computational evaluation was proposed. The differences in rainwater collection capacity brought about by various LID facility combination layouts and the cost-effectiveness of various LID facilities in a semi-humid area were investigated. It provides a complete picture of the economics and effectiveness of implementing LID facilities and a scientific foundation for constructing and managing sponge cities in semi-humid regions.
2. Study Area and Materials
The research area is in the southern section of Yanshan Road in the Hedong New Town Area of Qian’an. The road width is approximately 20 m, the horizontal width of the one-sided road green space is between 60 m and 510 m, the north–south length is approximately 3 km, the total area is approximately 2.94 km
2, and there is a catchment zoning area of 0.63 km
2 for managing external runoff. According to the zoning map of waterlogging risk in Qian’an, the project site and surrounding blocks contain areas prone to waterlogging [
32].
According to the Qian’an Urban–Rural Master Plan Central Urban Stormwater Planning Plan, the research municipality’s stormwater pipeline network extends from the intersection of Yangshan South Road and Huian Avenue to the intersection of Binhu East Road and Yangshan South Road, the southernmost point of the site. At the intersection of Qian’an South Road, the East–West pipeline divides it into four sections. The diameters of the pipes are 1200, 1600, 1600, and 2600 by 2000 mm, and their respective slopes are 0.5%, 1.45%, 1.75%, and 0.8%. Therefore, in addition to the pipe network surrounding the site, the entire catchment area contains nine plots (
Figure 1).
Important urban land, such as administrative office, business, commercial, sports, and residential land, border the site’s location. According to the waterlogging risk zoning map of Qian’an City, the project site and surrounding blocks contain waterlogging-prone areas. In addition, according to the special planning of Qian’an Sponge City, the site is the most recent key construction project of Qian’an Sponge City, responsible for collecting and acquiring rainwater runoff within and around the site and is an essential channel for achieving stormwater management.
3. Research Methods
The study was divided into two primary phases: hydrological performance evaluation and life cycle cost evaluation. The schematic diagram is shown in
Figure 2. First, the study site’s soil texture is predominantly sandy, and the rate of rainwater infiltration is high [
33]. Infiltration can therefore be the primary function of LIDs to reduce urban flooding. Second, to address the issue of water scarcity in Qian’an, collecting and utilising rainwater is crucial when building sponge cities [
34]. We chose four standard measures from two functional types of LID facilities, including three types of infiltration LID facilities (sunken green space (SG), bioretention ponds (BP), and infiltration ponds (IP)) and one type of storage LID facility (reservoirs (RE)). In total, 22 scenarios were compared in either a single setup or two different combinations. Using peak flow reduction as the primary indicator, the SWMM model was employed to simulate the hydrological performance of each LID scenario under various rainfall return periods. The LCC of each LID scenario was determined based on construction, operation, and maintenance costs. In the end, the optimal LID scenario for the site was determined based on the flood reduction effect and LCC of each scenario.
3.1. LID System Design and SWMM Simulation
3.1.1. LID System Design
Based on achieving the rainwater runoff control objective, four types of LID facilities: sunken green space, bioretention pond, infiltration pond, and reservoir, for a total of four schemes, were established separately (
Table 1). The four LID facilities were then paired with the ratios 1:3, 1:1, and 3:1 of the total runoff reduction target, yielding 18 schemes (
Table 2). In addition, each scheme’s LID facility construction area is appended to the table.
3.1.2. Design Storm Scenarios
The drainage capacity of the site is designed to resist a 20-year rainstorm in accordance with the
Standard for design of outdoor wastewater engineering [
35]. In accordance with the
Urban drainage (rainwater) waterlogging prevention comprehensive planning manual in Qian ’an City [
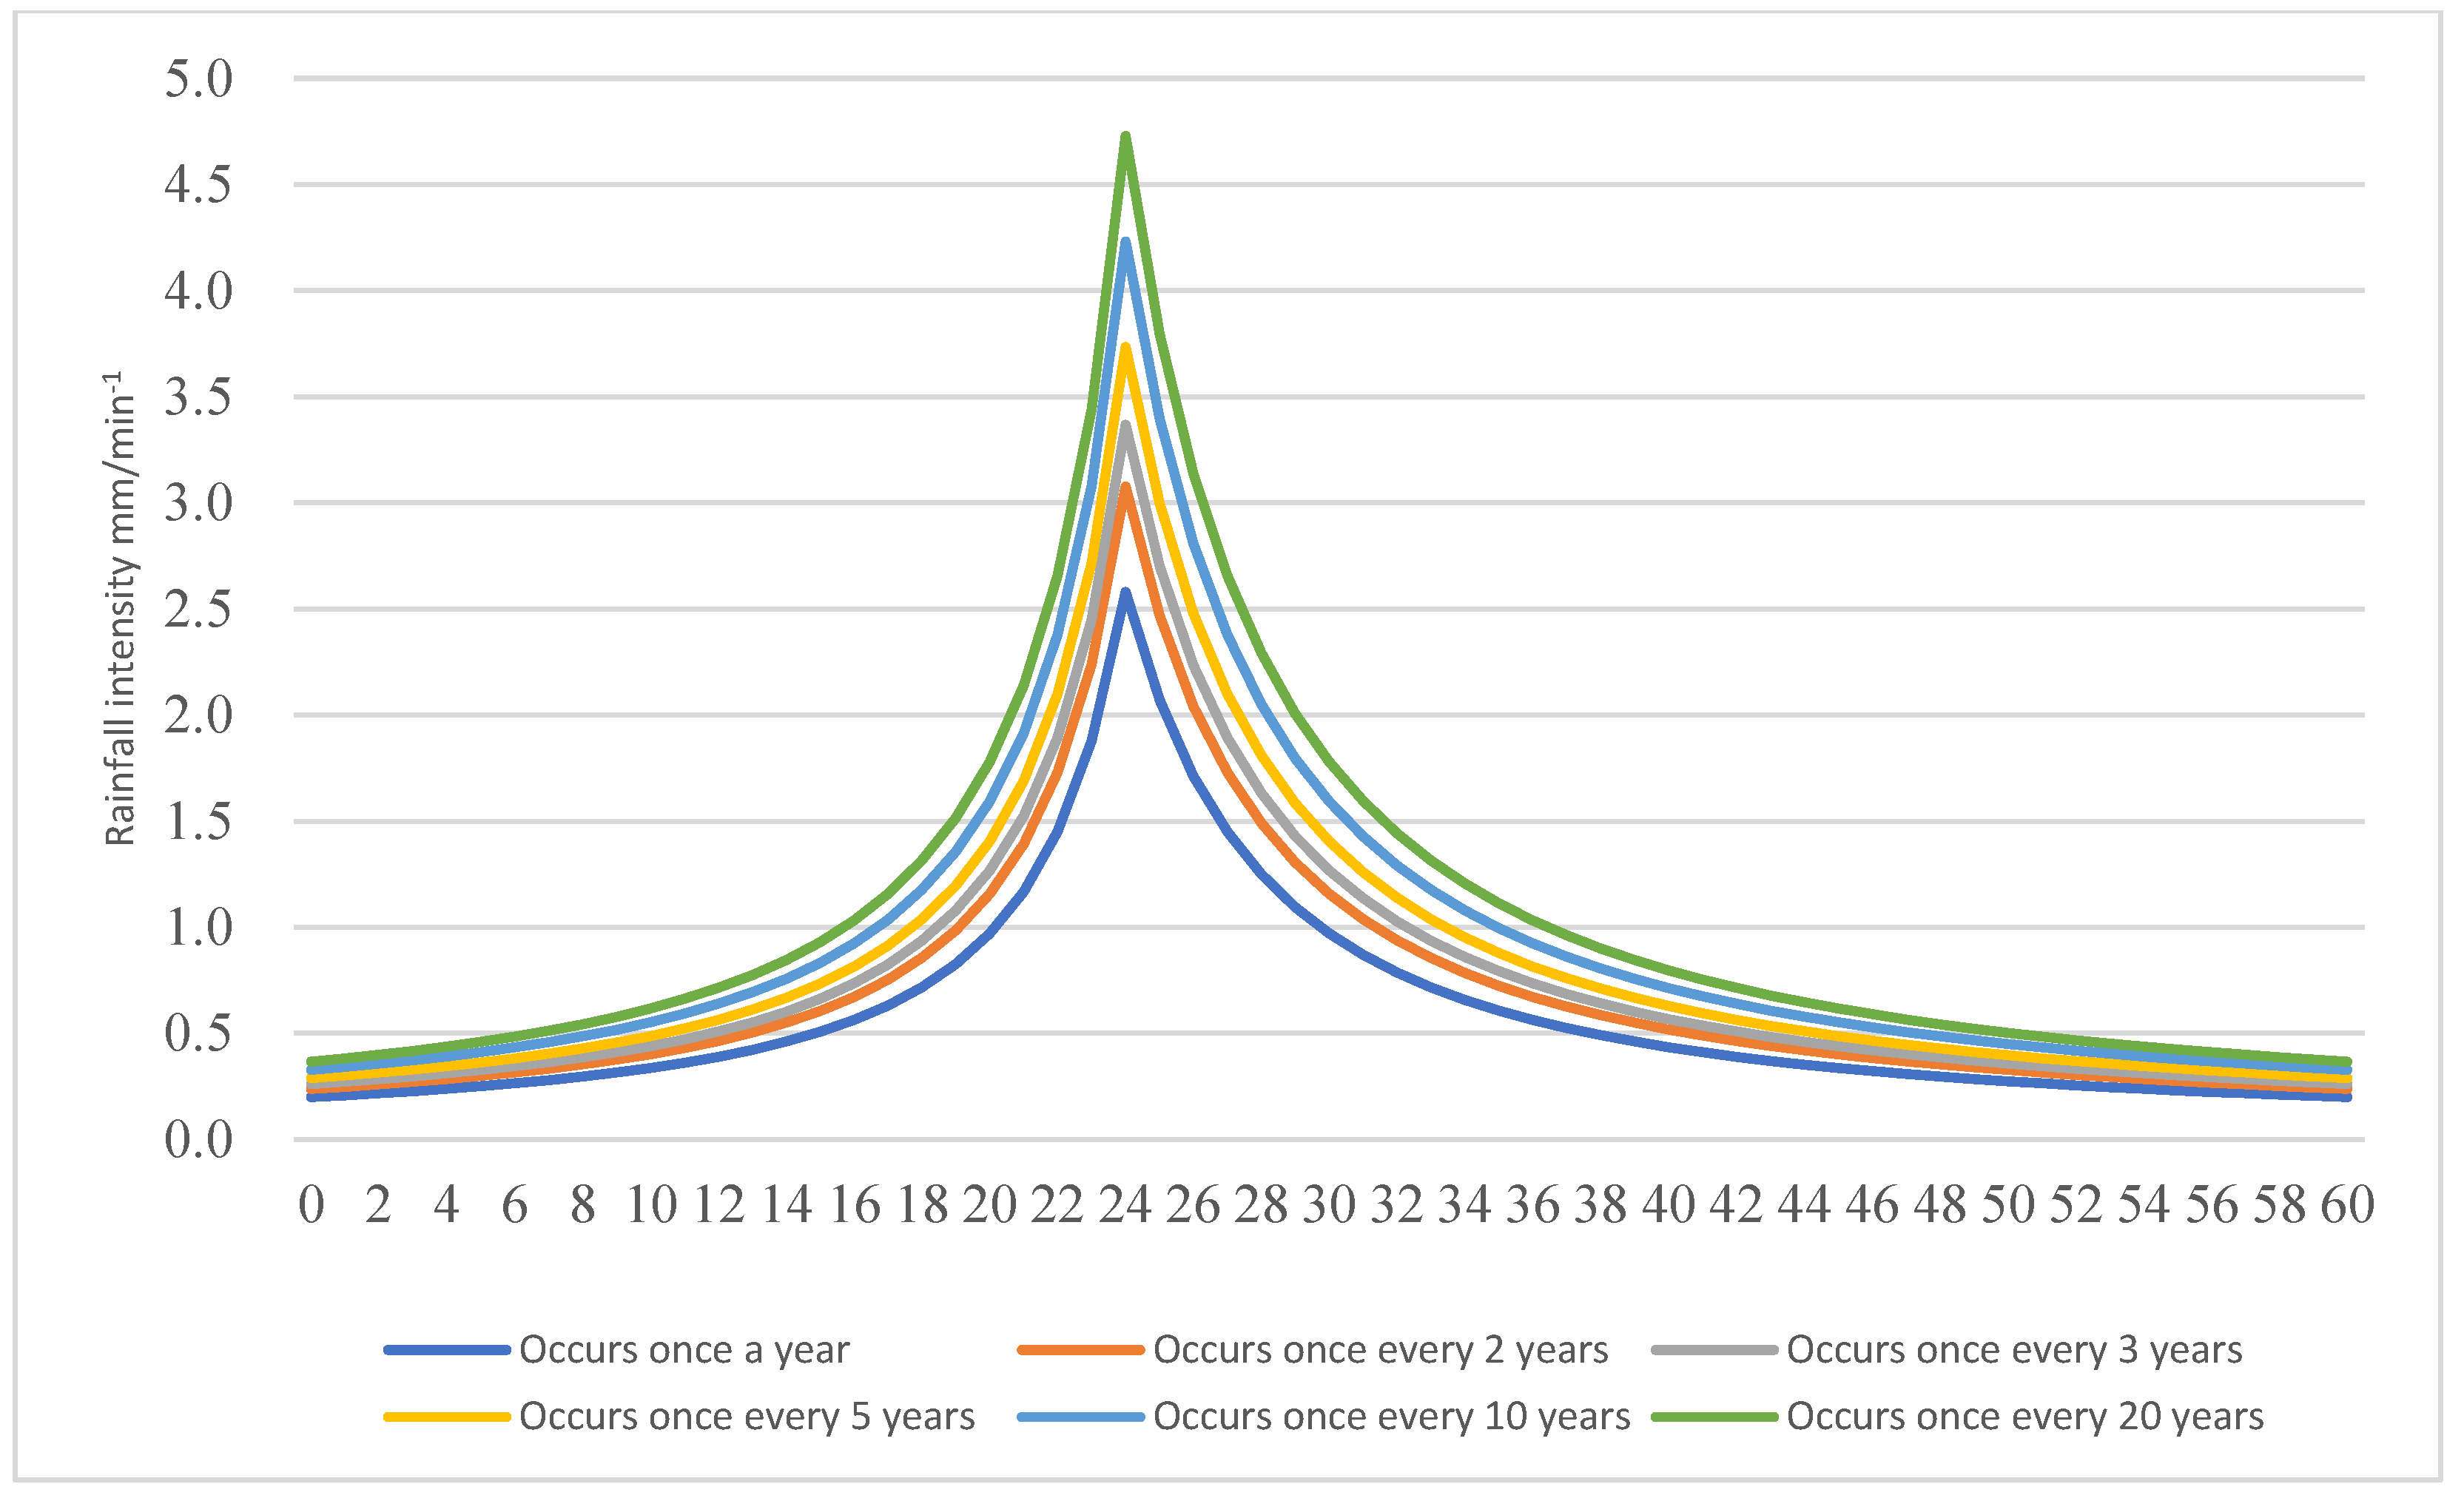
36], the total annual runoff control rate target (design rainfall) for the study area is 85% (design rainfall of 42.6 mm) for the external catchment and 76% (design rainfall of 29.6 mm) for the internal catchment (green area on East Binhu Road). As the site was designed to meet both the 20-year flood discharge standard and the sponge city standard, a series of design storms of different durations and intensities were used to simulate the performance of each scenario using a combination of return periods (1, 2, 3, 5, 10, and 20 years) and durations of 1 h. The formula for rainstorm intensity in Qian’an city is expressed in Equation (1) [
37].
where:
q is the design storm intensity, L/(s·ha); t is the rainfall calendar time, min;
P is the design rainfall return period, a.
The results of calculating the rainfall scenarios with return periods of 1, 2, 3, 5, 10, and 20 years were 36.07 mm, 43.02 mm, 47.08 mm, 52.21 mm, 59.16 mm, and 66.10 mm, respectively. Therefore, the Chicago rainfall pattern was chosen to disassemble the total amount of precipitation. The rainfall duration was 1 h, and its relative position was 0.4. This rainfall pattern matches the characteristics of urban flooding caused by short-duration heavy rainfall in urban areas and accurately reflects the local historical rainfall characteristics [
38]. The simulated synthetic hyetographs in Qian’an are shown in
Figure 3.
3.1.3. Determine the LID System Storage Capacity
When LID facilities are designed with the total runoff as the control objective, the designed storage volume must meet the control volume per unit area. The formula for calculating the designed storage volume using the volume method is as follows [
39]:
where:
v is the designed storage volume (m
3);
H is the design rainfall (mm);
is the comprehensive rainfall-runoff coefficient;
F is the catchment area (hm
2); hm
2 = 1 × 10
4 m
2.
According to the Planning map of rainwater engineering in Qian ’an City Center [
40] and Qian’an City: an sponge city special planning (2015−2030) (revised draft) [
41], combined with the surrounding site pipe network profile. The green areas on the east and west sides of Yanshan South Road and its external catchment area as shown in
Figure 1, divided into nine catchment areas, and each plot includes an internal catchment zone and an external catchment zone. Using the standard H1 = 29.60 mm of internal runoff control rate in the study area, the standard H2 = 42.60 mm of external runoff control rate of the site, the area of each catchment area, and the runoff coefficient of the comprehensive rainwater volume, the runoff coefficient of the comprehensive rainwater volume was calculated. Thus, the total amount of runoff inside and outside the site was 62,578.91 m
3 according to the volume method formula (
Table 3).
3.1.4. SWMM Model Construction
The SWMM model is a dynamic precipitation–runoff simulation model used primarily in urban areas to simulate single precipitation events or long-term water quantity and quality [
42]. It can also simulate regional hydrological, hydraulic, and water quality conditions [
43,
44,
45]. The SWMM model has also been used extensively in China, and its research results have provided technical assistance for flood mitigation and drainage planning in China’s urban areas.
The SWMM model uses various methods to simulate surface infiltration. The Horton infiltration model is commonly used for urban areas [
46], where the maximum infiltration rate was set to 19.71 mm/min. The minimum rate of infiltration was established at 0.50 mm/min. According to the SWMM user manual, the attenuation constant was 4 h
−1 and the Manning coefficients for permeable paving, impermeable paving, shared green space, and rainwater pipes were set to 0.4, 0.014, 0.6, and 0.013, respectively. The specific parameters of LID facilities are outlined in
Table 4. All other parameters are set according to the current situation and relevant specifications.
3.2. Cost- Effectiveness Analysis
The cost-effectiveness analysis of LID facilities in sponge cities contributes to a better understanding of sponge city investment, operation, and maintenance and improves sponge city construction and management. Life cycle cost analysis is commonly used to evaluate the feasibility of LID facilities, considering all costs and benefits of the project from a system perspective [
47,
48]. Furthermore, as demonstrated by Equation (3), the present value of benefit (PVB) and the present value of cost (PVC) are utilised to evaluate cost-effectiveness [
49].
where:
PVB is the net present value of the implementation of a policy or measure, that is, its economic benefit or some representation;
PVC is its cost, which typically includes a few initial and operational costs; and
B/C value is a comprehensive value used to measure the “economy-effectiveness” of a policy measure. If an equal investment is assumed, the greater the value, the greater the effectiveness [
27]. This method, therefore, enables the evaluation of a measure’s optimisation and decisions, the key to selecting appropriate indicators to quantify benefits and costs and applying suitable methods to calculate them. In this study,
PVB utilised the peak flow reduction efficiency method, while
PVC utilised the life-cycle cost method.
The term “LCC” refers to the total cost of an engineering project, from material production to design and construction to operation and maintenance [
50]. LCC facilitates a more comprehensive evaluation of the economics of engineering schemes. This paper introduces the LCC method to the cost analysis of sponge measures to guide rational investment and cost-effectiveness control of sponge cities. The method for calculating the LCC of sponge measures adopted in this paper was as follows:
where,
is the PVC of LID facility
x in year
t;
is the construction cost, planning and design cost, and other unit initial cost of the LID facility
x;
is the present value factor of the discount rate
r in year
t;
is the annual cost of operation and maintenance in particular year
t;
is the present value factor of discount rate
r in the end of design life year
n;
is the salvage value (
SV) of the LID facility in the end year
t of its designed life.
It is not reasonable to compare total PVC values due to the disparate regional contexts and diverse life cycles of various LID facilities. Thus, the PVC in Equation (3) was expressed in terms of the unit annual average cost (UAAC).
For a single LID facility scenario, UAAC
x was calculated as:
For LID-combined LID facilities scenarios,
UAACc was calculated as:
In Equations (7) and (8),
x is a specific LID facility,
is the design life of the LID facility
x, m is the number of LID facilities in the combined LID facilities scenarios, and
is the area percentage of each LID facility in combined LID facilities scenarios [
51].
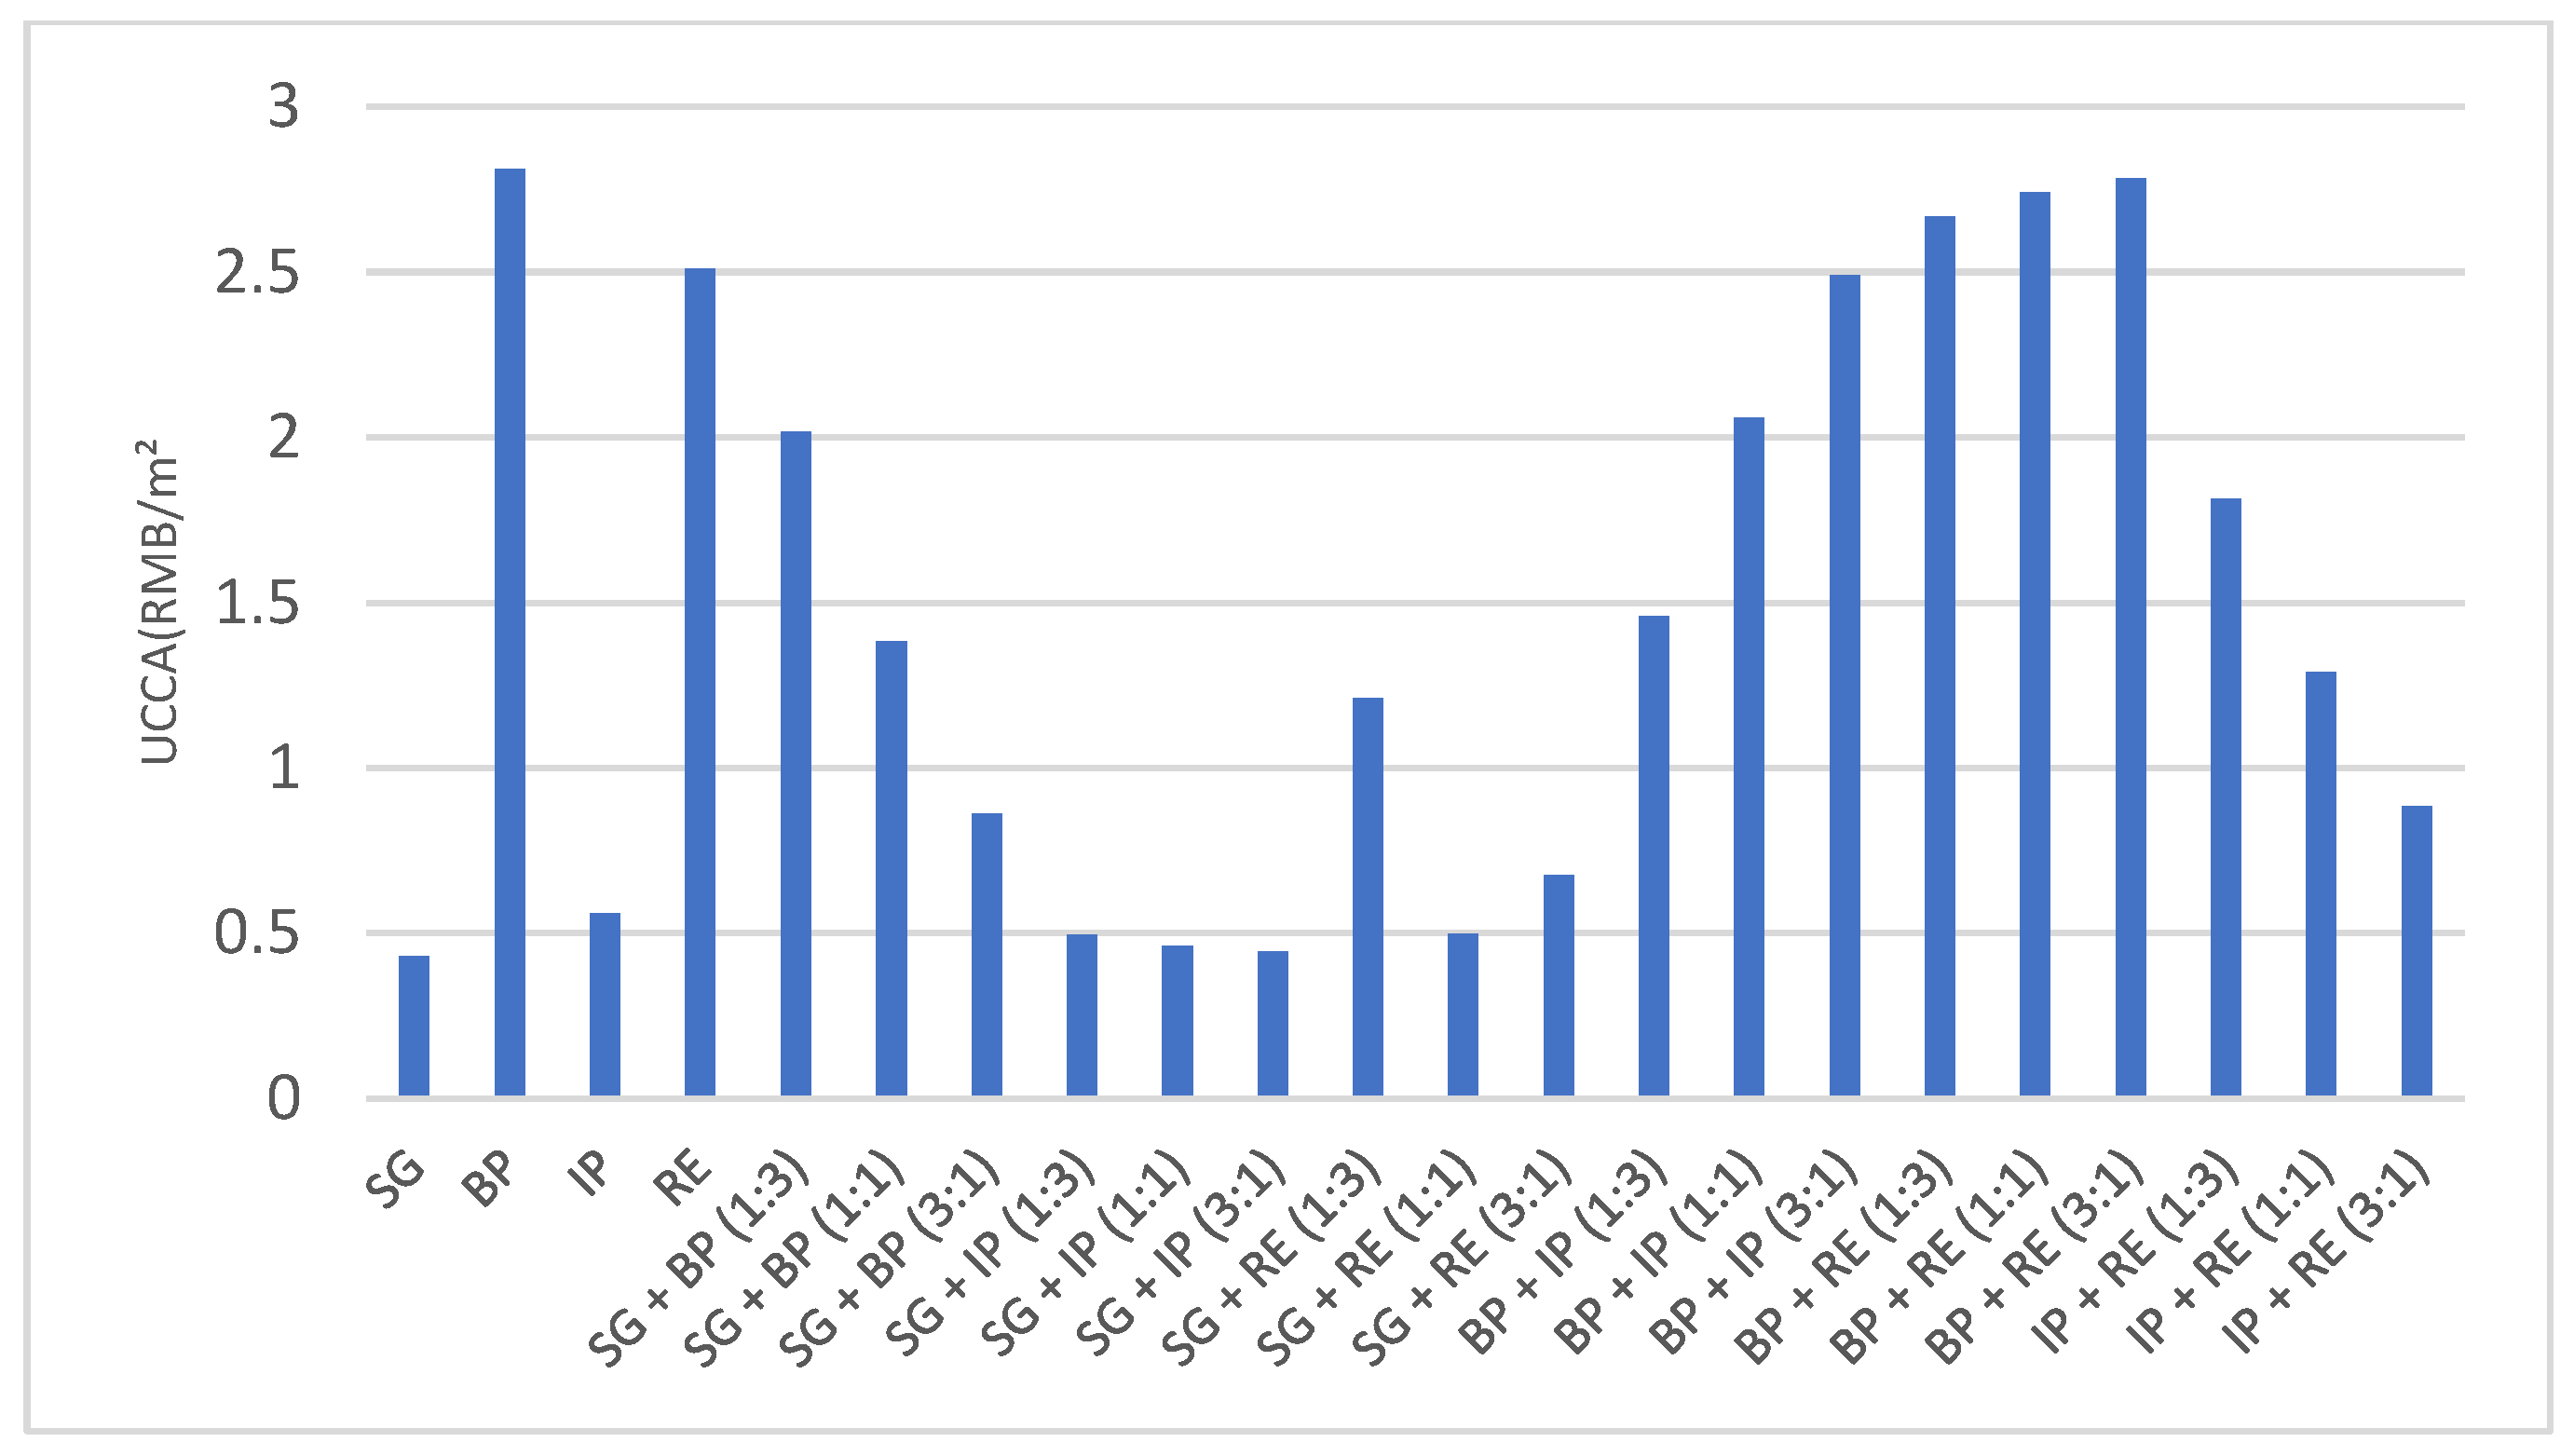
The UAAC for each LID scenario is calculated using Equations (4) through (8). The assumed service life of the four LID facility types examined in this paper was 20 years [
52]. In China, the suggested discount rate (r) was 5% [
53]. The initial and maintenance costs per capita were calculated according to the proposal for the local sponge city construction project in Qian’an.
Table 5 and
Figure 4 displays the values of several LID facilities.
4. Results
4.1. Hydrological Performance of the LID System
The hydrological performance index can evaluate the efficacy of different LID scenarios. According to China’s sponge city construction experience, waterlogging is caused by stormwater runoff that exceeds the design flow of drainage pipes in low-lying areas [
54], with peak flow being a significant indicator of urban flooding [
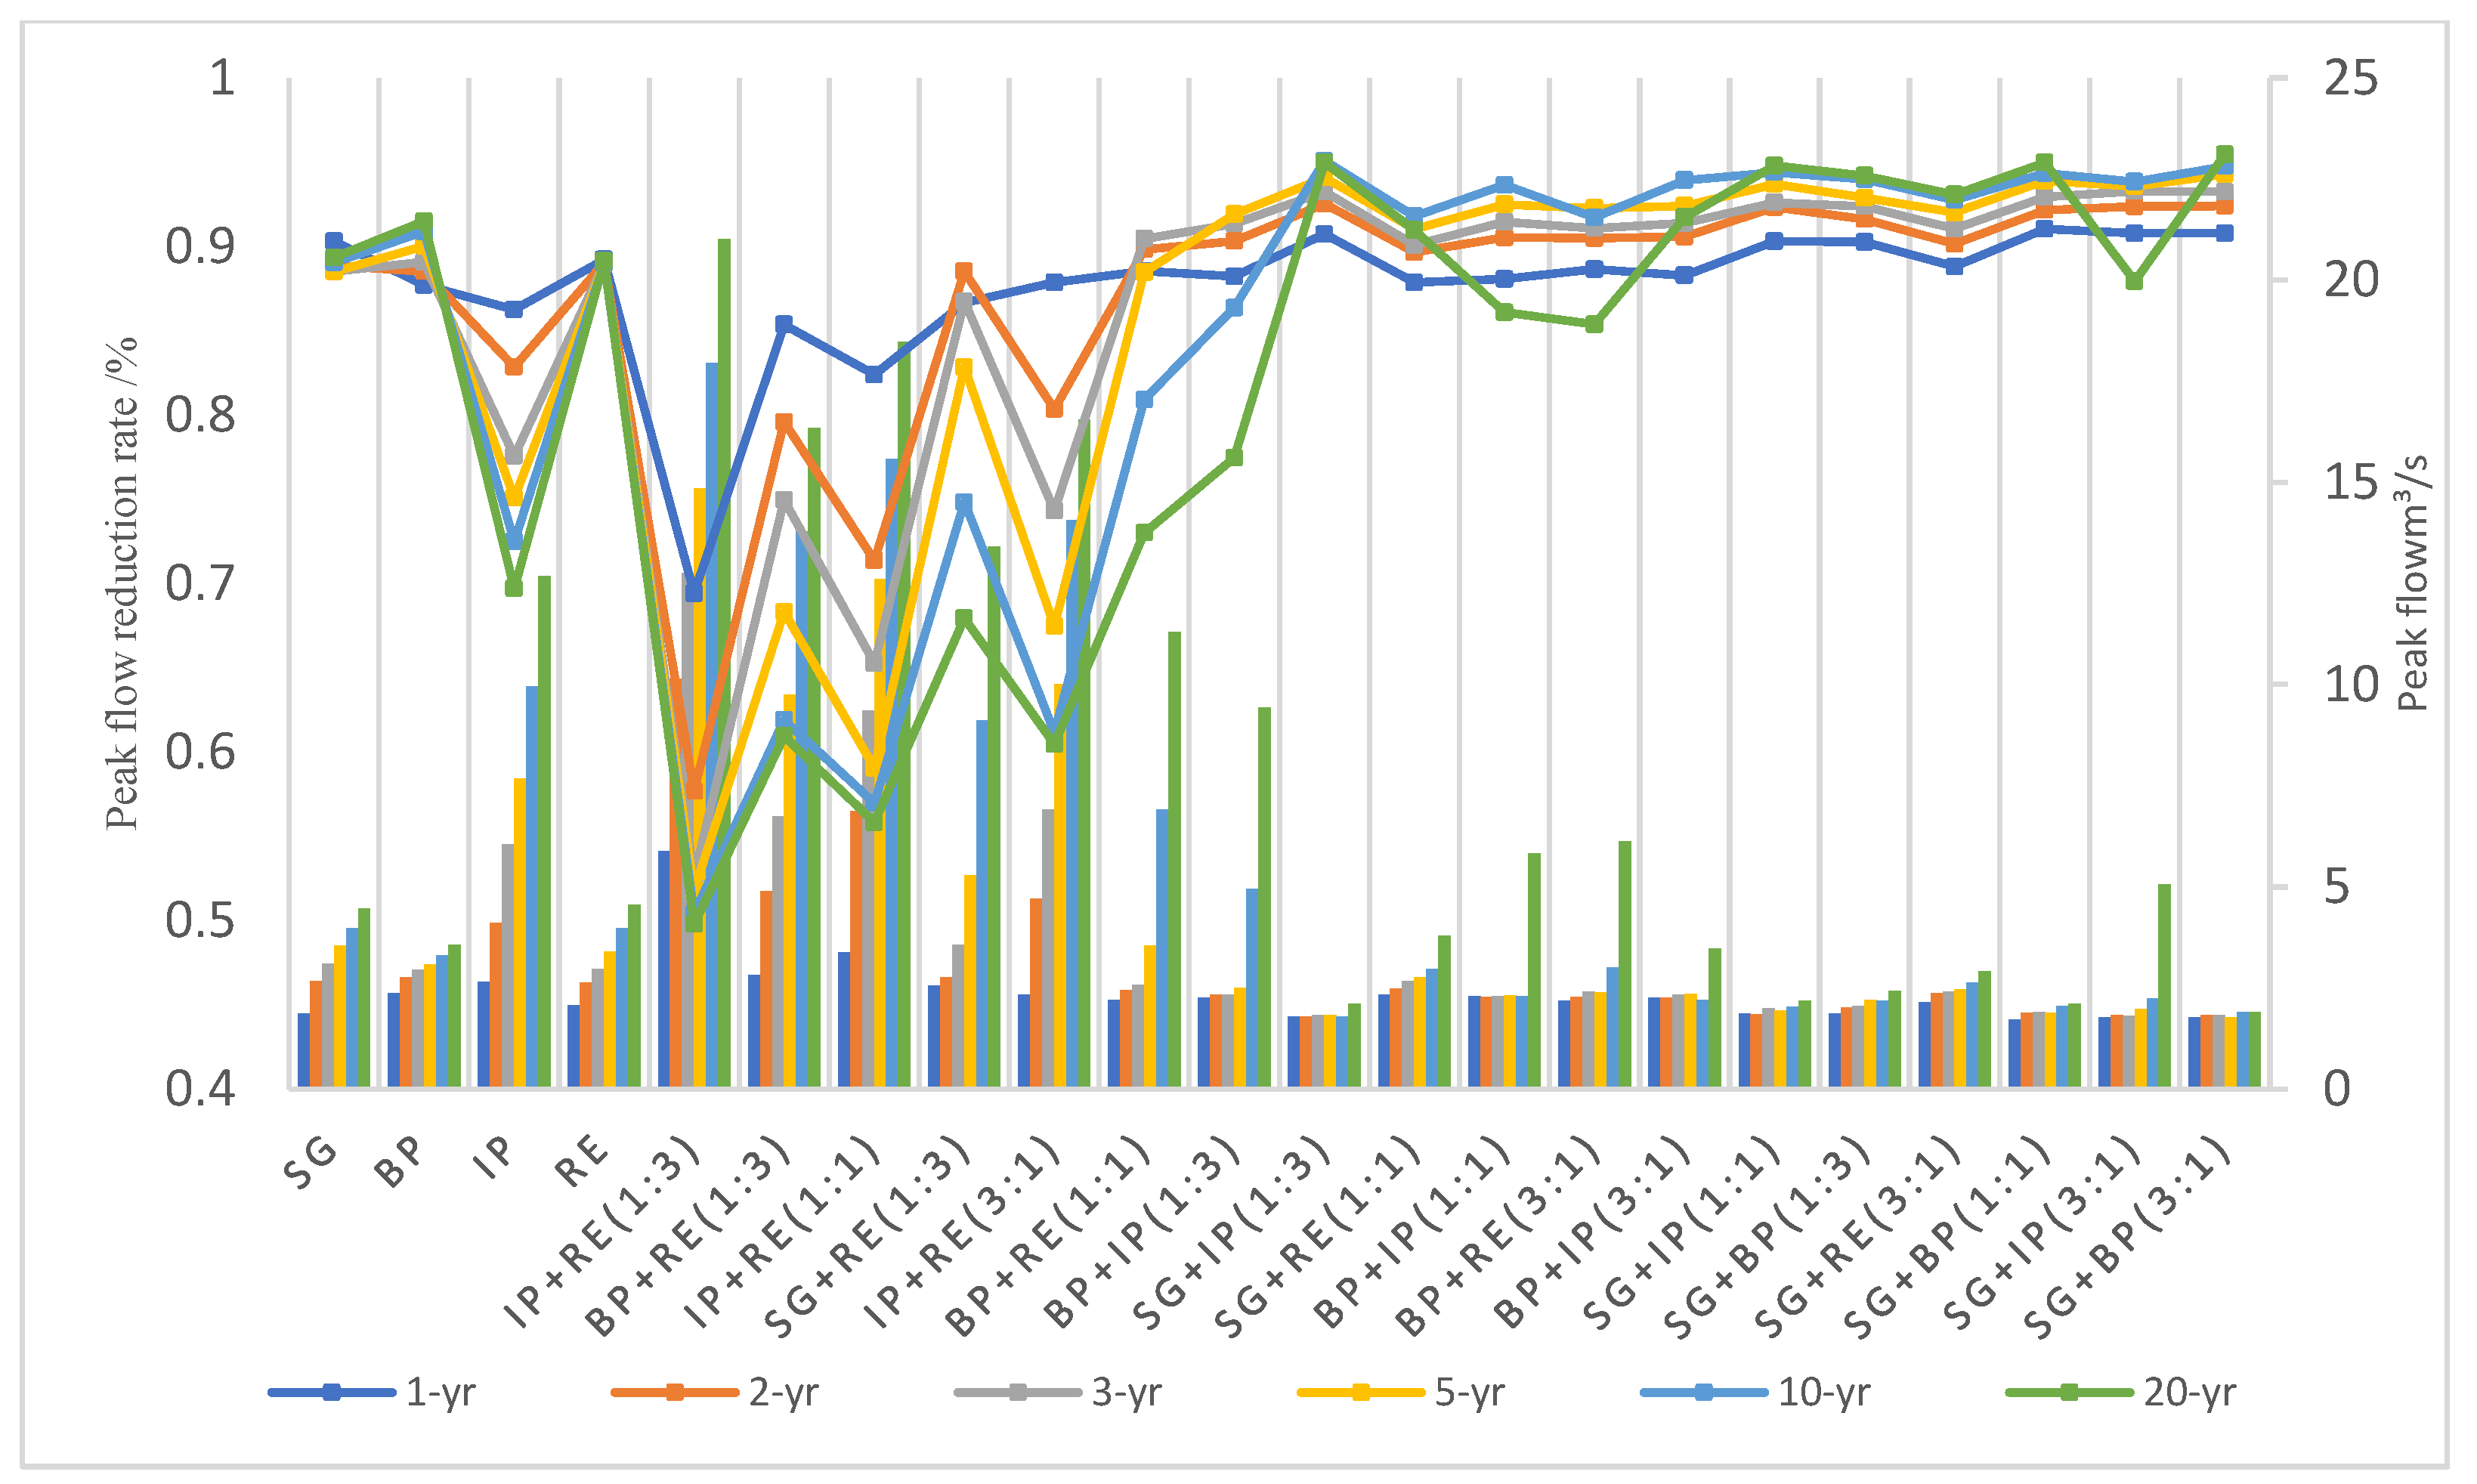
55]. The LID system can effectively reduce the peak flow of precipitation during construction. It reduces the instantaneous drainage pressure of the pipe network and prevents waterlogging at its source. In this study, the reduction in peak flow was regarded as an essential indicator of hydrological performance.
The peak flow reduction of a single LID facility under the 1-year and 2-year rainfall scenarios, SG and RE, was the greatest at 90.31% and 89.02%, respectively, as shown in
Figure 5. The peak flow reduction rate of the BP was greatest in the 3-year, 5-year, 10-year, and 20-year rainfall scenarios, at 89.07%, 90.02%, 90.88%, and 91.49%, respectively.
All scenarios involving combined LID facilities can potentially reduce peak flow and alleviate urban flooding issues. In 1-year, 2-year, 3-year, 5-year, 10-year and 20-year rainfall scenarios, the scenarios of SG + BP (1:1), SG + IP (1:3), SG + IP (3:1), SG + BP (3:1), SG + IP (1:3), SG + BP (3: 1) had the highest peak flow reduction rate, which was 91.03%, 92.53%, 93.27%, 94.28%, 95.08% and 95.46%, respectively. Overall, the combined LID scheme has better hydrologic performance than the single LID facility scenarios.
The hydrological performance of the LID scenarios was simulated for 1, 2, 3, 5, 10, and 20-year rainfall return periods, and according to the
Standard for design of outdoor wastewater engineering [
35] the design return period for small- and medium-sized urban drainage facilities must meet the 3-year return period and the design return period for flood control must meet the 20-year return period. For the 3-year return period, the top five hydrological performance options are SG + IP (3:1) > SG + IP (1:3) > SG + BP (3:1) > SG + BP (1:1) > SG + IP (1:1). For the 20-year return period, the top five hydrological performance options are SG + BP (3:1) > SG + IP (1:3) > SG + BP (1:1) > SG + IP (1:1) > SG + BP (1:3).
4.2. Cost-Effectiveness of the LID System
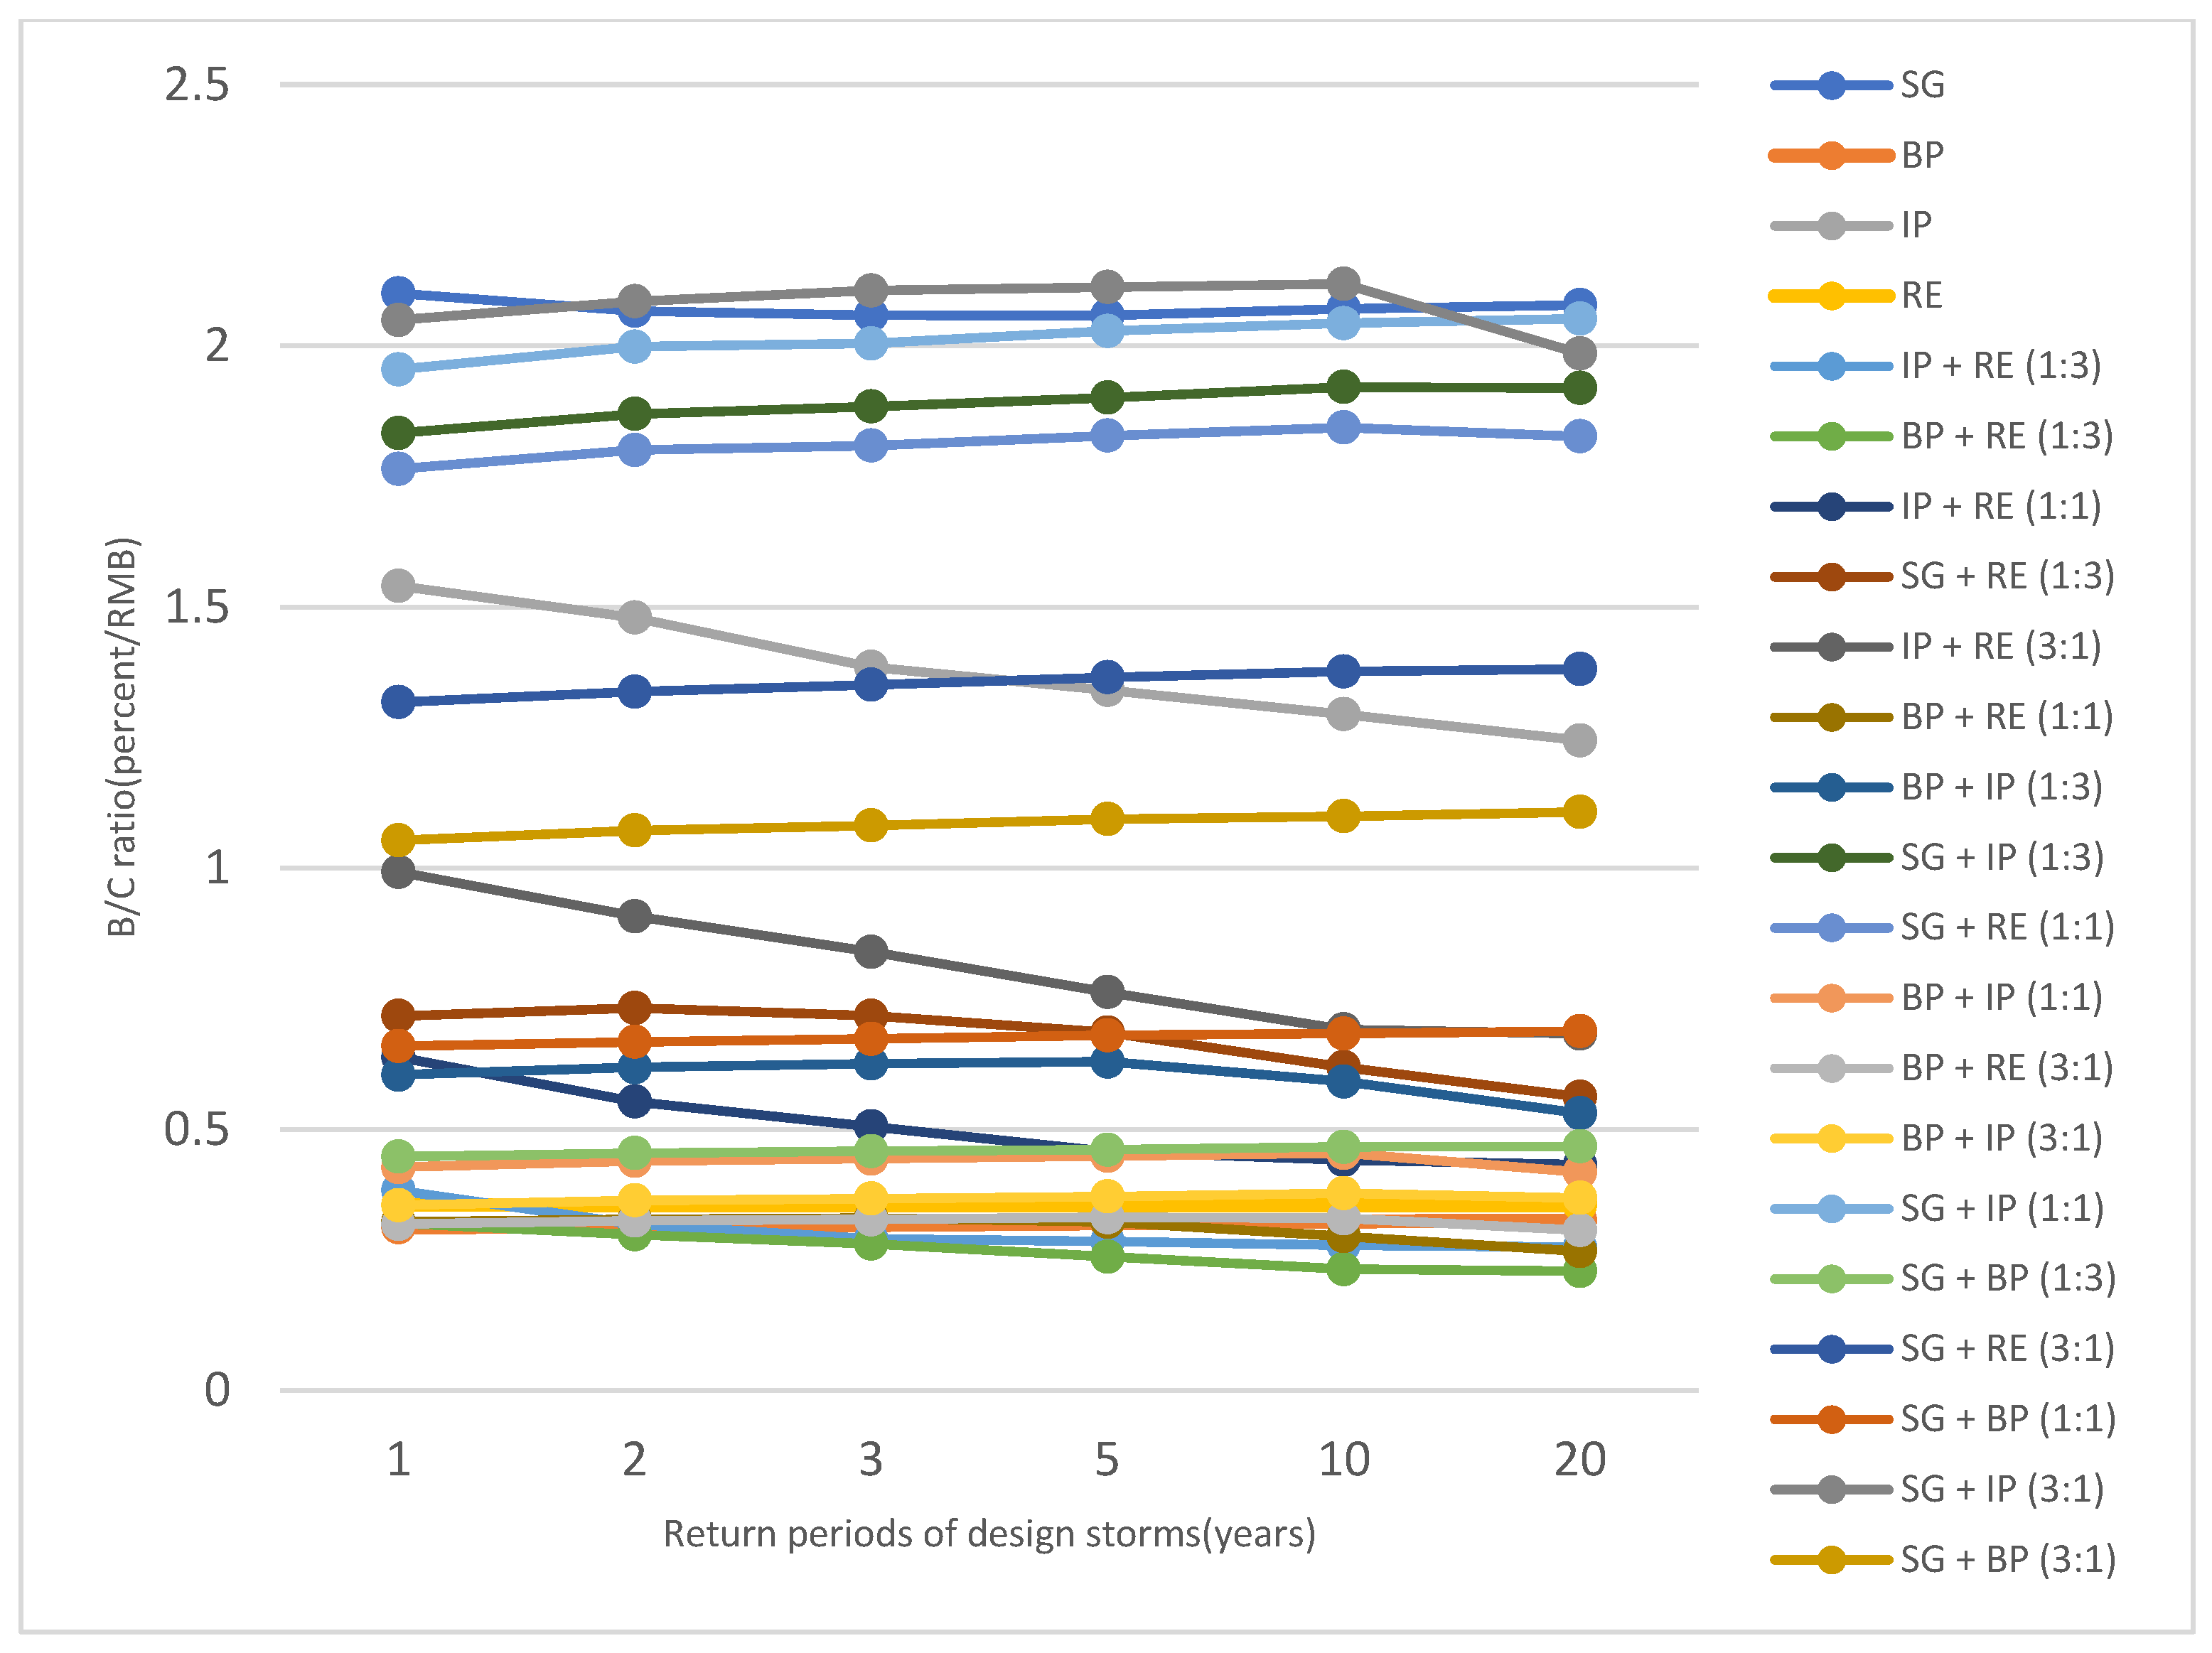
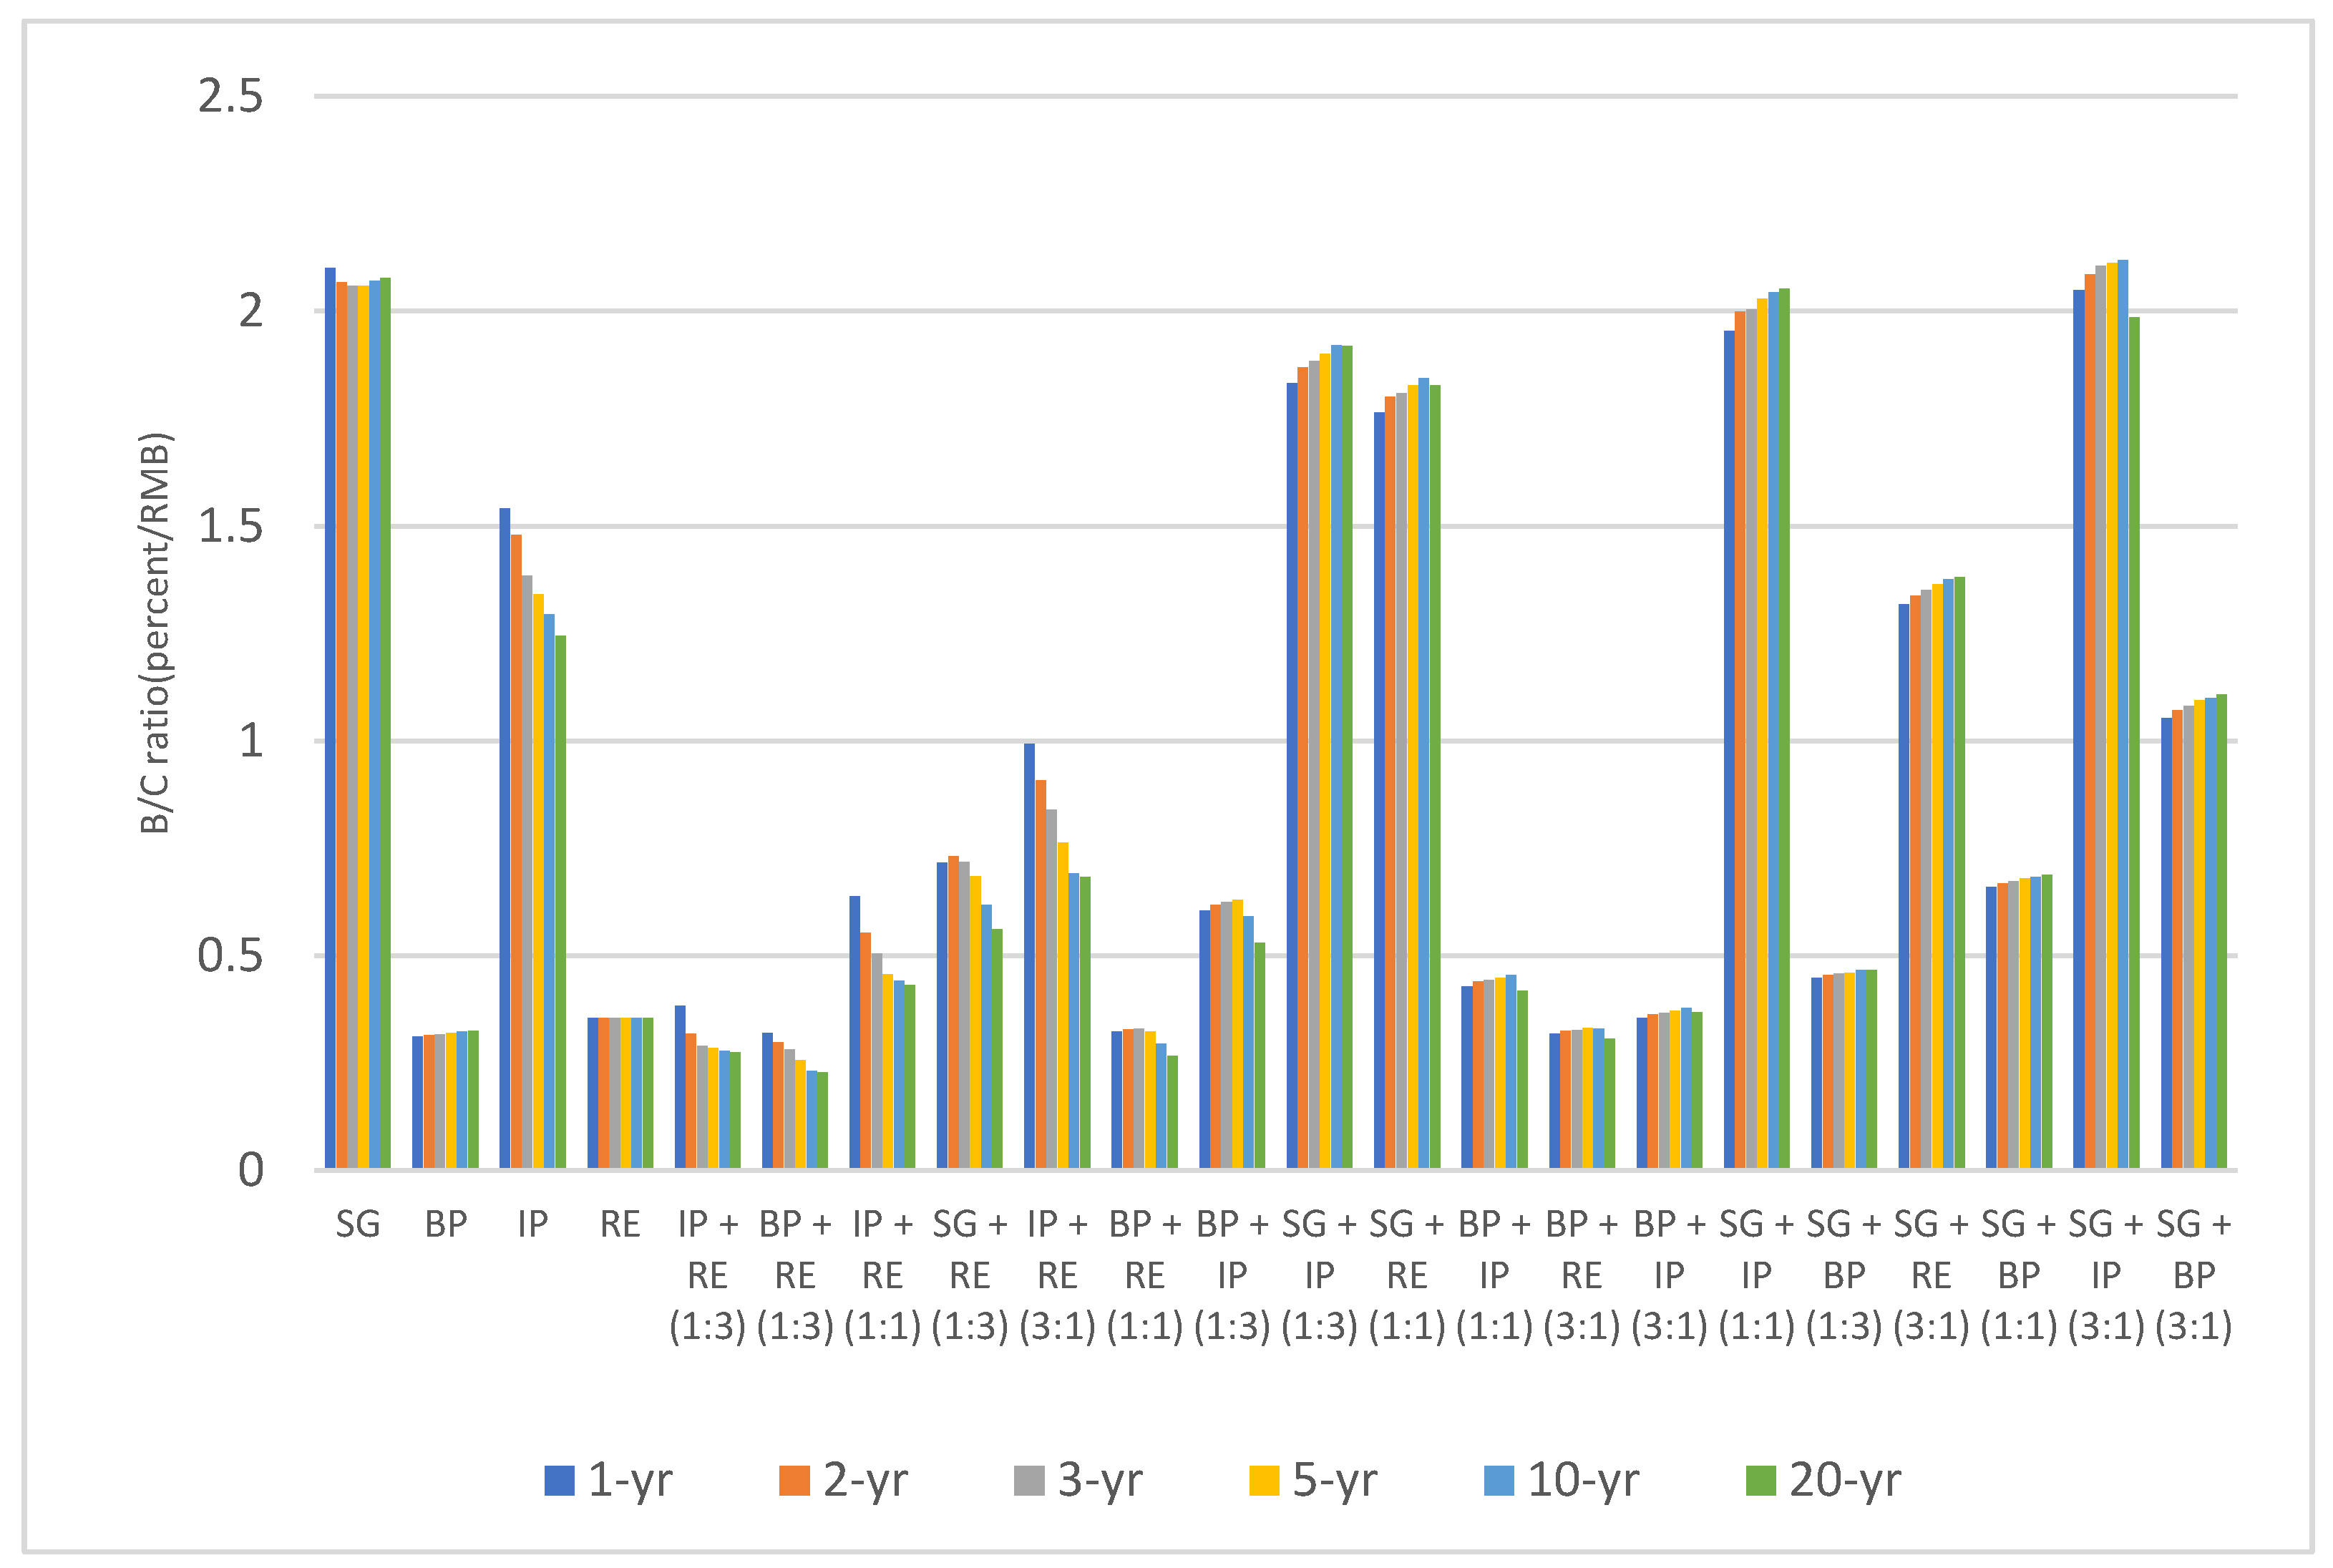
Figure 6 and
Figure 7 depict the B/C of various LID facility scenarios under six rainfall events, with the B/C value representing the unit cost’s effect on flood control. For scenarios involving a single LID facility, the order of cost-effectiveness is SG > IP > RE > BP, which decreased from 2.1 to 0.31, and decreased as the rainfall period increased. For the combined LID facility scenarios, the cost-effectiveness of SG + IP (3:1) was highest under the 1-year, 2-year, 3-year, 5-year, and 10-year rainfall scenarios, while the cost-effectiveness of SG + IP (1:1) was the highest under the 20-year rainfall scenario.
Among all LID schemes, the cost-effectiveness of SG was higher under the 1-year and 20-year rainfall scenarios, at 0.31 and 0.30, respectively. Under the 2-year, 3-year, 5-year, and 10-year rainfall scenarios, SG + IP (3:1) was more cost-effective, around 2.1. Similarly, according to the
Standard for design of outdoor wastewater engineering [
35], this paper focuses on the cost-effectiveness of the 3-year return period and 20-year return period scenarios for all return periods. For the 3-year return period, the top five cost effective options are SG + IP (3:1) > SG > SG + IP (1:1) > SG + IP (1:3) > SG + RE (1:1). The top five cost effective options under the 20-year return period are SG > SG + IP (1:1) > SG + IP (3:1) > SG + IP (1:3) > SG + RE (1:1). Generally, the cost benefits of SG, SG + IP (3:1), SG + IP (1:1), SG + IP (1:3), and SG + RE (1:1) were at the forefront.
5. Discussion
The outcomes demonstrated that LID facilities could effectively mitigate a flooding catastrophe in the study area because LID structures contributed to infiltration, retention, purification, and precipitation storage. The LID changed as the rainfall return period changed. As the rainfall return period grew longer, the effectiveness of various LID schemes to reduce peak flow gradually diminished. Finally, under the heavy rainfall event, the regulating function of the LID facilities in each scenario reached its maximum value, and the effect of reducing peak flow began to approach its maximum value. This research confirmed the efficacy of the LID structures for flood control and disaster mitigation.
Among the infiltration LID facility scenarios, the SG of a single LID and the combination scenarios of SG + IP (3:1), SG + IP (1:1), and SG + IP (1:3) had relatively high B/C values, which represented a substantial cost advantage. In the infiltration–storage LID facility scenarios, the SG + RE (1:1) was more cost-effective and could be used extensively to construct sponge cities in water-scarce cities. While regulating and storing rainwater, it considers both its collection and utilisation.
Both BP and RE demonstrated excellent hydrological performance. However, their life cycle costs were relatively high compared to other LID facilities, resulting in lower B/C values for BP and RE-based LID options. Therefore, if the cost of maintaining the BP is low, the BP and RE are the superior option.
Against the backdrop of massive investment, the construction of a sponge city in Qian’an requires a scientific and effective approach to targeting the water problems that exist in the city. Therefore, we screened out suitable LID facility types and layouts, comprehensively assessed the hydrological performance and cost effectiveness of different LID scenarios, and arrived at the best and locally appropriate construction solution, a process that will be of great help in the construction of sponge cities in semi-humid areas of China. This paper proposed an optimised framework for a LID design system using the Yanshan South Road green space as the research object. The comprehensive consideration of the hydrological performance and cost-effectiveness of different scenarios helps to determine the best solutions or assess the economic-effectiveness of LID scenarios to make robust decisions. The multi-objective, collaborative, and optimal configuration of the type, scale, and location of the LID facilities is based on the results of the feedback assessment. This supports the objective of alleviating urban water problems such as urban flooding and water scarcity, with less cost investment. This research serves as a reference for other semi-humid regions in China and even countries and regions with similar climates worldwide.
6. Conclusions
The following are the primary conclusions of the sponge city hydrological simulation data analysis and LCC analysis.
(1) The LID scenarios were all capable of controlling peak surface runoff flows and mitigating urban flooding to some degree. For single LID scenarios, SG and RE were more effective at reducing peak flows during low rainfall return periods, whereas BP was more effective during high rainfall return periods. For combined LID scenarios, the peak flow reduction rates were the highest for the SG-BP (1:1), SG-IP (1:3), SG-IP (3:1), SG-BP (3:1), SG-IP (1:3), and SG-BP (3:1) scenarios under 1-, 2-, 3-, 5-, 10- and 20-year rainfall return periods, at 91.03%, 92.53%, 93.27%, 94.28%, 95.08%, and 95.46%, respectively. The analysis results for both the combined and single scenarios revealed that the runoff reduction control rate for the sponge measures decreased as the design storm return period increased.
(2) According to the results of the cost-effectiveness analysis of each LID scenario, the “economy-effectiveness” of various sponge measures decreased as the design storm return period increased. However, the cost-effectiveness of the SG was greater for each design storm scenario, i.e., the SG was the most effective per unit investment, and the scale of investment in the construction of SG can be increased in the sponge city of Qian’an. In addition, in semi-humid areas where water scarcity is a common issue, it is imperative to store rainwater runoff while considering the collection and use of rainwater. Therefore, infiltration–storage solutions are frequently used in constructing sponge cities in semi-humid areas, and SG and RE can be considered.
(3) The objective of sponge city construction in China is to reduce urban flooding, and peak flow reduction is a crucial indicator for achieving this objective. Therefore, after the construction of the first batch of sponge city pilot cities, and based on the detailed information of the local sponge city construction project investment in Qian’an City, we explored low-cost and high-efficiency construction solutions for the construction of a sponge city in Qian’an City. At the same time, China’s semi-humid areas cover an area of about 1.44 million square kilometres, or 15% of the national territory, and contain 77 cities in 11 provinces. It is hoped that the results of this study will be applied to provide a valuable reference for the construction of sponge cities in other semi-humid areas of China. In addition, regions around the world such as North America and Western Europe also have similar climatic conditions and the same water problems as China’s semi-humid regions, and this paper will also be of great value to such regions.
There are some limitations in the study, the results of the simulations of the LID schemes using SWMM software must be checked against the later runoff detection results to ensure the accuracy of the simulations, but due to current equipment constraints and legislation, this study was unable to carry out a data check. In addition, this paper only lists the cost-effectiveness of 22 LID schemes, and it is hoped that future research will be able to apply genetic algorithms and other methods to propose more refined LID scenarios for cost-effectiveness studies.
Author Contributions
Conceptualization, M.W.; methodology, M.W.; software, M.W., X.W. and C.Y.; validation, M.W.; formal analysis, M.W.; investigation, M.W.; resources, M.W.; data curation, M.W.; writing—original draft preparation, M.W., X.W. and C.Y.; writing—review and editing, M.W.; visualization, M.W.; supervision, X.G.; project administration, X.G.; funding acquisition, X.G. All authors have read and agreed to the published version of the manuscript.
Funding
This research was funded by the Beijing Municipal Social Science Foundation (grant number 21JCC094), the National Natural Science Foundation of China (grant number 31800606), and Beijing Scientific Research and Postgraduate Education Jointly Construction (grant number 2015BLUREE01).
Institutional Review Board Statement
This study does not involve human subjects, animals, plants or cells.
Informed Consent Statement
The study did not involve human subjects.
Data Availability Statement
The datasets generated during and/or analysed during the current study are available from the corresponding author on reasonable request.
Acknowledgments
We hereby thank the Beijing Municipal Social Science Foundation, the National Natural Science Foundation of China for financial and Beijing Scientific Research and Postgraduate Education Jointly Construction support for this research.
Conflicts of Interest
The authors declare no conflict of interest.
Abbreviations
| SWMM | storm flood management model |
| LID | low impact development |
| LCC | life cycle cost |
| SG | sunken green space |
| IP | infiltration ponds |
| BP | bioretention ponds |
| RE | reservoirs |
| UCCA | unit annual average cost |
| PVB | present value of benefit |
| PVC | present value of cost |
References
- Kang, J.Q.; Ge, X.Y. Method for Designing Exogenous Runoff Sponge Green Space in Semi-humid Region—A Case Study of the Green Space of East Binhu Road in Qian’an City. Landsc. Archit. 2019, 26, 77–82. [Google Scholar]
- Lin, C.S. The Research on Rainwater Harvesting Green Space Design in Semi-Humid Region. Master’s Thesis, Beijing Forestry University, Beijing, China, 2017. [Google Scholar]
- Wang, Z.S.; Xu, J.Y.; Xiong, F.; Zhang, H.X.; Li, W.F. Sponge city planning and construction in typical water-deficient areas of The Beijing-Tianjin-Hebei region. Beijing Plan. Rev. 2016, 4, 54–57. [Google Scholar]
- Wu, Y.J. Study on the Performance Audit of Sponge City Construction under PPP Mode-Taking the Construction of Qian’an Sponge City as an Example; Heibei University: Baoding, China, 2020. [Google Scholar]
- Wen, S.M.; Xu, S.L.; Zeng, S.Y.; Dong, X.; Liu, X. Assessment of eco-environmental benefits of LID systems in sponge city. Water Wastewater Eng. 2020, 56, 251–255. [Google Scholar]
- Li, S.S. Planning and construction of rainwater harvesting ecological green space system—Based on the construction concept of sponge city in Qian’an City. Hebei Water Resour. 2019, 5, 24–25. [Google Scholar]
- Chen, Z.T.; Tang, Q.H.; Liang, C. Performance evaluation of sponge city construction in Qian’an city. Hebei Water Resour. 2021, 11, 33–37. [Google Scholar]
- Shafique, M.; Kim, R. Retrofitting the low impact development practices into developed urban areas including barriers and potential solution. Open Geosci. 2017, 9, 240–254. [Google Scholar] [CrossRef]
- Braswell, A.S.; Winston, R.J.; Hunt, W.F. Hydrologic and water quality performance of permeable pavement with internal water storage over a clay soil in Durham. North Carolina. J. Environ. Manag. 2018, 224, 277–287. [Google Scholar] [CrossRef]
- Kim, S.; An, K. Exploring psychological and aesthetic approaches of bio-retention facilities in the urban open space. Sustainability 2017, 9, 2067. [Google Scholar] [CrossRef]
- Zahmatkesh, Z.; Burian, S.J.; Karamouz, M.; Tavakol-Davani, H.; Goharian, E. Low-impact development practices to mitigate climate change effects on urban stormwater runoff: Case study of New York City. J. Irr. Drain. Eng. 2015, 141, 04014043. [Google Scholar] [CrossRef]
- Herrera, J.; Flamant, G.; Gironás, J.; Vera, S.; Bonilla, C.A.; Bustamante, W.; Suárez, F. Using a Hydrological Model to Simulate the Performance and Estimate the Runoff Coefficient of Green Roofs in Semiarid Climates. Water 2018, 10, 198. [Google Scholar] [CrossRef]
- Zheng, Z.H.; Duan, X.H.; Zhao, F. Storm water management model-based study on application of low impact development facilities. Water Resour. Hydropower Eng. 2018, 49, 32–40. [Google Scholar]
- Li, Y.; Mo, S.H.; Yang, Y.Y.; Liu, D. Optimize proportions of LID facilities with NSGA-II. WaterWaste Eng. 2021, 57, 475–481. [Google Scholar]
- Liu, W.; Chen, W.; Peng, C. Assessing the effectiveness of green infrastructures on urban flooding reduction: A community scale study. Ecol. Model. 2014, 291, 6–14. [Google Scholar] [CrossRef]
- Wang, Z.; Zhou, S.; Wang, M.; Zhang, D. Cost-benefit analysis of low-impact development at hectare scale for urban stormwater source control in response to anticipated climatic change. J. Environ. Manag. 2020, 264, 110483. [Google Scholar] [CrossRef]
- Rehan, T.; Qi, Y.; Werner, A. Life-cycle cost analysis for traditional and permeable pavements. Constr. Res. Congr. 2018, 2018, 422–431. [Google Scholar]
- Liu, Y.; Ahiablame, L.M.; Bralts, V.F.; Engel, B.A. Enhancing a rainfall-runoff model to assess the impacts of BMPs and LID practices on storm runoff. J. Environ. Manag. 2015, 147, 12–23. [Google Scholar] [CrossRef] [PubMed]
- Liu, Y.; Bralts, V.F.; Engel, B.A. Evaluating the effectiveness of management practices on hydrology and water quality at watershed scale with a rainfall runoff model. Sci. Total Environ. 2015, 511, 298–308. [Google Scholar] [CrossRef]
- Mao, X.; Jia, H.; Yu, S.L. Assessing the ecological benefits of aggregate lid-BMPS through modelling. Ecol. Model. 2017, 353, 139–149. [Google Scholar] [CrossRef]
- Qin, H.P.; Li, Z.X.; Fu, G. The effects of low impact development on urban flooding under different rainfall characteristics. J. Environ. Manag. 2013, 129, 577–585. [Google Scholar] [CrossRef]
- Xia, J.; Zhang, Y.; Xiong, L.; He, S.; Wang, L.; Yu, Z. Opportunities and challenges of the Sponge City construction related to urban water issues in China. Sci. China Earth Sci. 2017, 60, 652–658. [Google Scholar] [CrossRef]
- Köster, S. How the Sponge City becomes a supplementary water supply infrastructure. Water-Energy Nexus 2021, 4, 35–40. [Google Scholar] [CrossRef]
- Li, H.; Ding, L.; Ren, M.; Li, C.; Wang, H. Sponge City Construction in China: A Survey of the Challenges and Opportunities. Water 2017, 9, 594. [Google Scholar] [CrossRef]
- Li, F.; Zhang, J. A review of the progress in Chinese Sponge City programme: Challenges and opportunities for urban stormwater management. Water Supply 2022, 22, 1638–1651. [Google Scholar] [CrossRef]
- Liu, Y.; Theller, L.O.; Pijanowski, B.C.; Engel, B.A. Optimal selection and placement of green infrastructure to reduce impacts of land use change and climate change on hydrology and water quality: An application to the trail creek watershed, Indiana. Sci. Total Environ. 2016, 553, 149–163. [Google Scholar] [CrossRef]
- Zhou, G.N.; Mei, C.; Liu, J.H.; Wang, H.; Shao, W.W.; Li, Z.J.; Wang, D.; Fu, J.N. Analysis on hydrological response and cost-benefit of sponge city construction in Ximen District of Pingxiang City. Water Resour. Hydropower Eng. 2019, 50, 10–17. [Google Scholar]
- Li, D.L.; Jia, S.F.; Lv, A.F.; Zhu, W.B. Regional difference of cost effectiveness of low impact development (LID) technical facilities in Chinese cities. Prog. Geogr. 2017, 36, 1402–1412. [Google Scholar]
- Jinhee, L.; Hyunwoo, K. Analysis of stormwater runoff reduction effect through applying low impact development practices in a flood prone area: Case of Incheon, South Korea. Korea Spat. Plan. Rev. 2019, 102, 49–67. [Google Scholar]
- dos Santos, M.F.N.; Barbassa, A.P.; Vasconcelos, A.F. Low impact development strategies for a low-income settlement: Balancing flood protection and life cycle costs in Brazil. Sustain. Cities Soc. 2021, 65, 102650. [Google Scholar] [CrossRef]
- Forasté, J.A.; Goo, R.; Thrash, J.; Hair, L. Measuring the cost-effectiveness of LID and conventional stormwater management plans using life cycle costs and performance metrics. In Low Impact Development Technology: Implementation and Economics: LID: Implementation and Economics; ASCE: Reston, VA, USA, 2015; pp. 54–73. [Google Scholar]
- Feng, C.M.; Li, N.; Bai, Y. Analysis and countermeasures of water resources in Qian’an, China. Agric. Technol. 2015, 35, 72–73+108. [Google Scholar]
- Feng, P.; Wei, Z.Z.; Li, J.Z. Hydrologic Type Regions Delineation of Haihe River Basin Based on Remote Sensing Data of Underlying Surface Cover. J. Nat. Resour. 2013, 28, 1350–1360. [Google Scholar]
- Li, X.B.; Zheng, L.H.; Zhan, W.S. Development and sustainable utilization of water resources in Qian’an, China. Water Sci. Eng. Technol. 2005, 3, 25–26. [Google Scholar]
- Shanghai Construction and Transportation Commission. GB 50014−2021; Standard for Design of Outdoor Wastewater Engineering; China Planning Press: Beijing, China, 2021; pp. 11–12. [Google Scholar]
- Hebei Urban and Rural Planning and Design Institute. Qian’an City Urban Drainage (Rainwater) Waterlogging Prevention Comprehensive Planning Manual; Hebei Urban and Rural Planning and Design Institute: Shijiazhuang, China, 2014. [Google Scholar]
- Department of housing and urban rural development of Hebei Province. Technical Specification for Sponge City Construction Engineering; China Building Materials Industry Press: Beijing, China, 2016; p. 46. [Google Scholar]
- Xie, H.N.; Ge, X.Y. Research on Runoff Control Efficiency of Exogenous Rainwater Harvesting Greenbelt Under the Background of Climate Change: A Case Study of Binhu East Road Area of Qian’an City. Landsc. Archit. 2021, 28, 89–95. [Google Scholar]
- MHURD (Ministry of Housing and Urban-Rural Development). Technical Guide for Sponge Cities-Construction of Low Impact Development; Government Printing Office: Beijing, China, 2014; pp. 49–50.
- Shanghai Tongji Urban Planning and Research Institute. Planning Map of Rainwater Engineering in Qian’an City Center; Shanghai Tongji Urban Planning and Research Institute: Shanghai, China, 2013. [Google Scholar]
- Beijing Tsinghua Tongheng Planning and Design Institute Co., Ltd. Qian’an City: An Sponge City Special Planning (2015−2030) (Revised Draft); Beijing Tsinghua Tongheng Planning and Design Institute Co.: Beijing, China, 2016; p. 9. [Google Scholar]
- Rossman, L.A. Storm Water Management Model User’s Manual, Version 5.0; National Risk Management Research Laboratory, Office of Research and Development, US Environmental Protection Agency: Washington, DC, USA, 2010. [Google Scholar]
- Zhu, J.; Liu, J.; Cui, H.; Zhou, L.Q. Application of SWMM Model in Urban Flood Control Calculation of City Built in Piedmont Plain of Southwest China. Water Resour. Power 2013, 31, 38–41. [Google Scholar]
- Li, X.; Shi, Y.T.; Li, G.J. Simulation study on stormwater controlling system of the old town based on SWMM and LID. Water Wastewater Eng. 2015, 51, 152–156. [Google Scholar]
- Chang, X.D.; Xu, Z.X.; Zhao, G.; Du, L.G. Urban rainfall-runoff simulations and assessment of low impact development facilities using SWMM model—A case study of Qinghe catchment in Beijing. J. Hydroelectr. Eng. 2016, 35, 84–93. [Google Scholar]
- Rui, X.F.; Jiang, C.Y.; Chen, Q.J.; Ding, X.Y. Principle analysis and application of storm water management model on stimulating rainfall-runoff. Adv. Sci. Technol. Water Resour. 2015, 35, 1–5. [Google Scholar]
- Santos, J.; Ferreira, A. Life-cycle cost analysis system for pavement management at project level. Int. J. Pavement Eng. 2013, 14, 71–84. [Google Scholar] [CrossRef]
- Spatari, S.; Yu, Z.; Montalto, F.A. Life cycle implications of urban green infrastructure. Environ. Pollut. 2011, 159, 2174–2179. [Google Scholar] [CrossRef]
- Liao, Z.; Chen, H.; Huang, F.; Li, H. Cost–effectiveness analysis on LID measures of a highly urbanized area. Desalin. Water Treat. 2015, 56, 2817–2823. [Google Scholar] [CrossRef]
- Farreny, R.; Gabarrell, X.; Rieradevall, J. Cost-efficiency of rainwater harvesting strategies in dense Mediterranean neighbourhoods. Resour. Conserv. Recycl. 2011, 55, 686–694. [Google Scholar] [CrossRef]
- Mei, C.; Liu, J.; Wang, H.; Yang, Z.; Ding, X.; Shao, W. Integrated assessments of green infrastructure for flood mitigation to support robust decision-making for sponge city construction in an urbanized watershed. Sci. Total Environ. 2018, 639, 1394–1407. [Google Scholar] [CrossRef] [PubMed]
- Liu, Y.; Engel, B.A.; Flanagan, D.C.; Gitau, M.W.; McMillan, S.K.; Chaubey, I.; Singh, S. Modeling framework for representing long-term effectiveness of best management practices in addressing hydrology and water quality problems: Framework development and demonstration using a Bayesian method. J. Hydrol. 2018, 560, 530–545. [Google Scholar] [CrossRef]
- Hu, M. Urban Rainwater Utilization and Its Role in Reducing of Urban Waterlogging Problems: A Case Study in Nanjing, China. Master’s Thesis, Nanjing University, Nanjing, China, 2012. [Google Scholar]
- Wang, F.; Yan, Z.H.; Huang, W.L.; Zhou, Q.R. Causes and Solutions of Urban Rainstorm Waterlogging. China Water Wastewater 2012, 28, 15–17+20. [Google Scholar]
- Wu, J.X. Research on Design Strategy of Sponge City in the Residential Area above the Subway. Master’s Thesis, Guangdong University of Technology, Gaungdong, China, 2021. [Google Scholar]
| Publisher’s Note: MDPI stays neutral with regard to jurisdictional claims in published maps and institutional affiliations. |
© 2022 by the authors. Licensee MDPI, Basel, Switzerland. This article is an open access article distributed under the terms and conditions of the Creative Commons Attribution (CC BY) license (https://creativecommons.org/licenses/by/4.0/).


