
Realizing Sustainable Development of Yellow River Basin by Horizontal Eco-Compensation Based on Integrated Water Rights (IWRs) Transactions

1
School of Environment, Beijing Normal University, Beijing 100875, China
2
Northwest Institute of Plateau Biology, Chinese Academy of Sciences, Qinghai 810008, China
3
Institutes of Science and Development, Chinese Academy of Sciences, Beijing 100190, China
*
Author to whom correspondence should be addressed.
Water 2022, 14(17), 2646; https://doi.org/10.3390/w14172646
Submission received: 15 July 2022
/
Revised: 20 August 2022
/
Accepted: 23 August 2022
/
Published: 27 August 2022
(This article belongs to the Special Issue The Interrelationship between Climate Change, Human Activities and Hydrological Processes)
Abstract
:Horizontal/interregional eco-compensation is an important policy to promote regional ecological and environmental cooperation and realize sustainable development for river basins. To solve these problems, a horizontal compensation framework based on integrated water rights (IWRs) transaction has been established. Taking the Yellow River basin as an example, the IWRs scheme realizes sustainable development, to a certain extent, improving the current issues of shortages, the low utilization efficiency of water resources, and weak water environmental carrying capacity. Evidence for this improvement includes: (1) an increased revenue of USD 244.71; (2) the water use efficiency in the middle and upper streams (Qinghai, Gansu, Ningxia, Neimenggu, Shanxi) and the overall river basin being obviously improved (the maximum improvement value is 0.1273 m3/USD); (3) the overload situation of water resource carrying status being relieved in some subareas (Ningxia, Neimenggu, Henan, Shandong) and improved in the whole basin (from 0.6366 to 0.6124); (3) the water environmental carrying rate (COD and NH4+-N) of the middle and upper streams (Qinghai, Gansu, Ningxia, Neimenggu, Shanxi) and the whole river basin obviously decreasing (with maximum decreasing values of 0.43 and 1.14, respectively).
1. Introduction
Watershed water systems are an important part of ecological service systems and can provide a variety of essential material bases and eco-environmental service guarantees for human survival and sustainable development [1,2,3]. Due to the obvious spatial heterogeneity of human activities, the river basin is often divided by independent administrative areas, which increases the complexity of river basin system management [4] and inevitably leads to conflict, especially in relation to economic development and ecological environment protection between the upstream and downstream areas. To solve these conflicts and internalize the environmental externalities generated [5], the concept of eco-compensation was introduced into watershed management in the late 1990s [6,7,8], and widely adopted across river basins [9].
Horizontal/interregional eco-compensation is an important policy to promote regional ecological and environmental cooperation and realize sustainable development for river basins [10]. However, the existing studies and pilot projects have several limitations. Firstly, there is the horizontal/interregional eco-compensation of the watershed water system to be considered, which generally refers to the compensation for a water supply service which has typical transregional flow properties [11], or compensation for water quality reaching a standard which is regarded as a significant enough to quantify a monetary value in China [12,13,14]. Considering the complexity of the water system, there lacks compensation for the simultaneous “quality” and “quantity” of water. Moreover, at present, the water rights trading market still mainly refers to the transaction of water usage, which is independent and disjointed from the water pollutant discharge trading market. It is necessary to integrate the transaction of water use and pollutant discharge rights and to realize the unification of the dual attributes of quantity and quality in the water utilization process [15]. Secondly, although many scholars have paid special attention to the compensation standard or the ecological value assessment of river basins [16], such as ecosystem service function value, the total cost of ecological construction protection, development opportunity cost, willingness to pay, water resource value (direct market value), water footprint, etc., unified standards and scientific methods [17] are lacking, and in practical application or pilot projects, the compensation amount is determined through a direct negotiation between upstream and downstream areas [18] or “Patted head” consultation by higher government departments, which lacks a theoretical basis [19]. For example, bilateral and cross-border compensation for water quality is essentially a “gambling agreement” rather than real compensation. To some extent, it only encourages and guides the behavior of water resource protection, but fails to form a continuous positive feedback mechanism. Thirdly, it should be considered that eco-compensation refers to a pro-market approach [20]; market mechanism is the most effective means to transform environmental externalities and nonmarket values into real financial incentives [16] by distribution or adjustments to environmental benefits and economic benefits among relevant stakeholders to protect ecological and natural resources, such as the nature of public goods, and maintaining, improving or restoring ecosystem service functions [21,22,23]. However, most eco-compensation in China is vertical eco-compensation, and the source of funds is mainly (more than 90%) from top–down government subsidies or government transfer payments [24,25], which increase the annual financial burden. Moreover, marketization and spontaneous transactions are still insufficient [26,27], which is not conducive to ensuring long-term and stable operation and sustainability [28].
The Yellow River is one of the important “mother rivers” and an important ecological barrier in China. As a typical resource-based water shortage area, the average water resources in the Yellow River basin only account for 2.5% of the total water resources in the whole nation, but the basin provides 35.6% of the national grain output [29] and feeds approximately 30% of the national population. Because the Yellow River basin spans nine provinces, there are significant differences in the endowments of water resources, and the water use structure and water use efficiency differ among areas of the upper and lower streams. The efficiency of water resource utilization in some areas of the middle and upper streams with abundant water resources is low, and the phenomena of water resource shortages and waste coexist. In addition, the overexploitation and utilization of water resources has also led to the deterioration of water quality (9.2% of the river water quality is still inferior to the fifth category in 2019). However, the allocation of water use rights in the Yellow River basin is mainly based on demand. Additionally, because water resources and water pollution discharge management belong to different departments (Ministry of Water Resources and Ministry of Ecology and Environment), the trading markets of water use rights and pollutant discharge rights are independent of each other. The right of pollutant discharge is also purchased through the pollutant discharging license and there is no overall pollutant discharge arrangement in the basin. Moreover, the current allocation of water usage and pollutant discharge rights which are based on demand fails to consider the fairness and efficiency of the utilization of resources and the environment in the basin, resulting in unsustainable resources and the environment.
In recent years, eco-compensation has gradually become the core of China’s environmental protection strategy [30]. Driven by relevant policies, pilot practices of horizontal eco-compensation in river basins have been actively carried out in all parts of China. In view of the abovementioned problems in horizontal eco-compensation mechanisms and the necessity for carrying out research on the Yellow River basin to tackle the issues of shortages, low utilization efficiency of water resources, and weak water environmental carrying capacity, this paper introduces the concept of IWRs in view of the concept of eco-compensation (that is, eco-payment for the water resource’s direct market value during utilization) to realize the unification of the quantity and quality of water resources in river basins. On this basis, a watershed horizontal eco-compensation mechanism based on the “quasi-market” transaction of IWRs is proposed (government-led water use rights and water pollutant discharge rights transaction). Taking the Yellow River basin as a case study, and under the principles of fairness and efficiency, the economic benefits, resources and environmental endowment of river basins are optimally allocated to different areas in the basin, and an eco-compensation scheme (IWRs transactions between areas) is obtained in order to balance the benefits of social economy and ecological environment in the basin to improve the marginal revenue of water resource utilization in river basins. This framework can provide a reference for horizontal eco-compensation for large-scale river basins with water shortages.
2. Materials and Methodology
2.1. Study Area
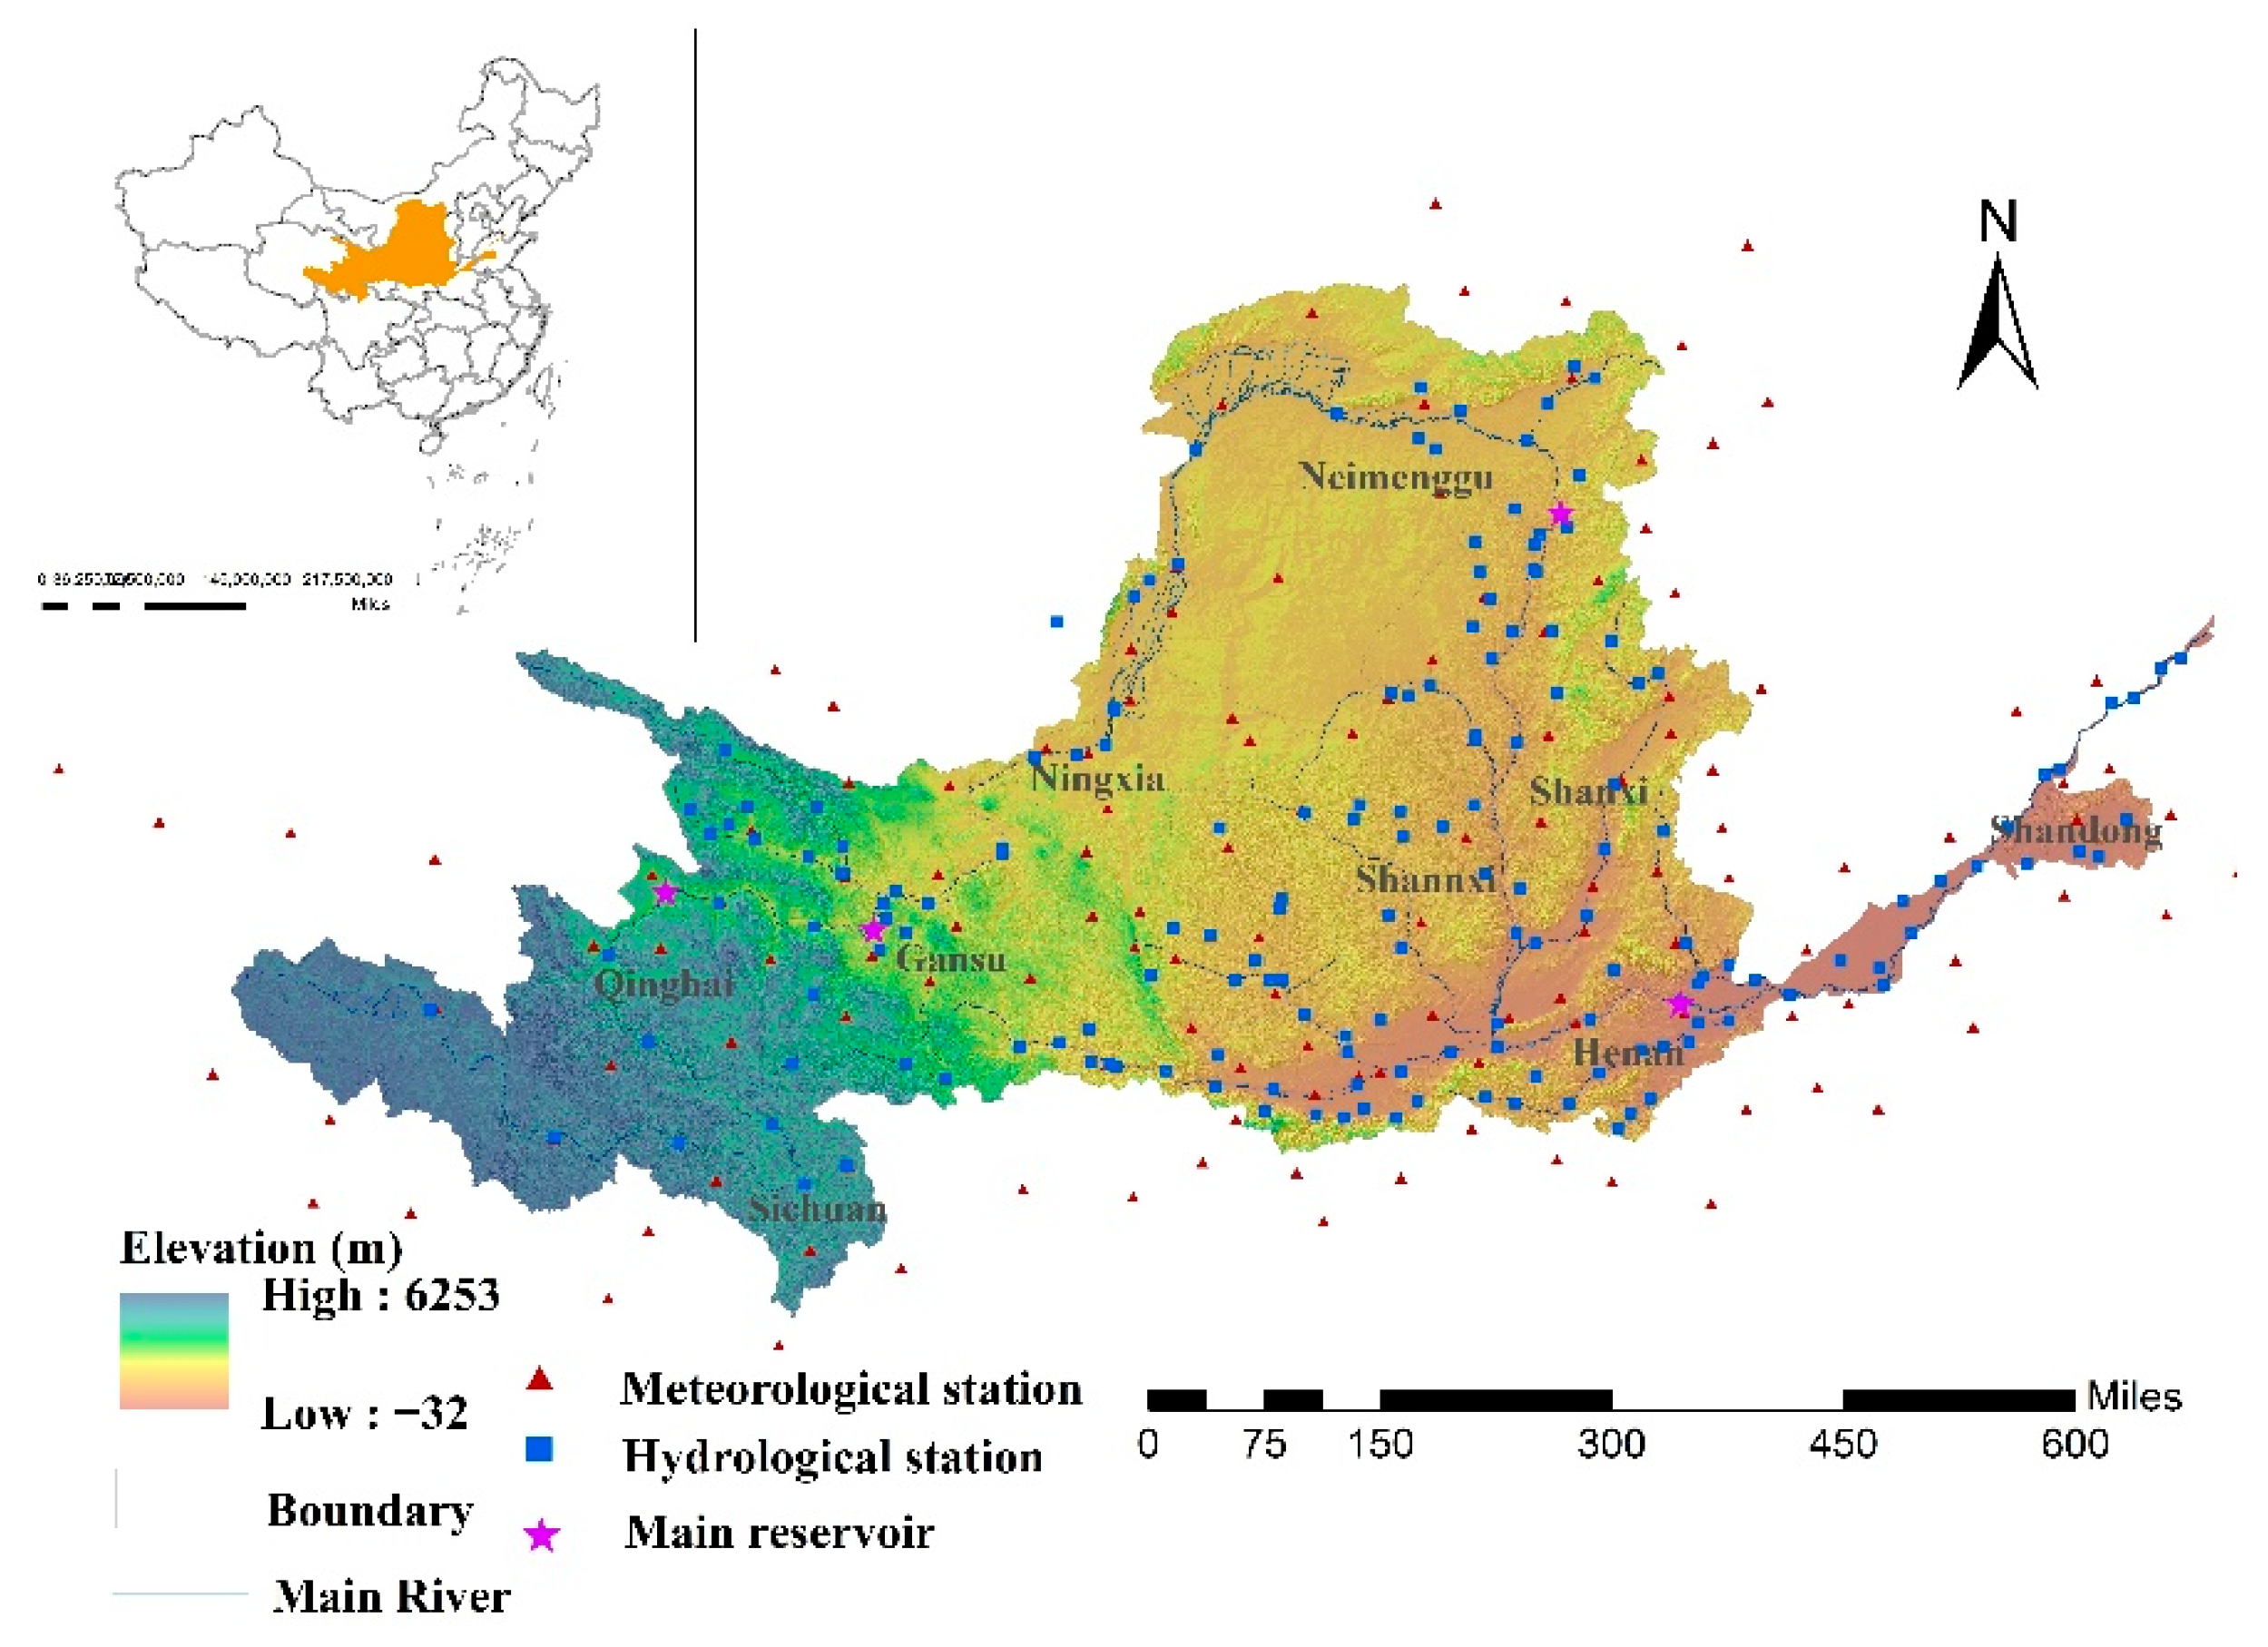
The Yellow River basin is located between 95°53′ E and 119°05′ E and between 32°08′ N and 41°48′ N, spanning four geomorphic units from west to east, namely, the Qinghai–Tibet Plateau, the Inner Mongolia Plateau, the Loess Plateau, and the Huang-Huai-Hai Plain. It flows through nine areas (provinces or autonomous areas), including Qinghai, Sichuan, Gansu, Ningxia, Inner Mongolia, Shanxi, Shaanxi, Henan, and Shandong. The main stream of the Yellow River is 5687 km long, with a total basin area of 813,100 km2. During the decade from 2011 to 2020, the total water resources of the Yellow River basin showed a fluctuating trend, with an average water volume of 72.499 × 10⁸ m3 (Water Resources Bulletin). By 2019, the proportion of first- and second-class water quality reached 56.3%, but 9.2% of water bodies were still in the inferior five classes (China Environmental Statistics Yearbook). The total population in the Yellow River basin was 421 million in 2020, accounting for nearly one-third (29.82%) of the total population of China. The total economic scale (GDP) was CNY 25.39 trillion in 2020, accounting for nearly a quarter (24.99%) of the national GDP. Location, river distribution, and other information regarding the Yellow River basin are shown in Figure 1. In addition, because of the small amount of water resources and water consumption, the Sichuan area is not considered in this paper.
2.2. Methods and Data
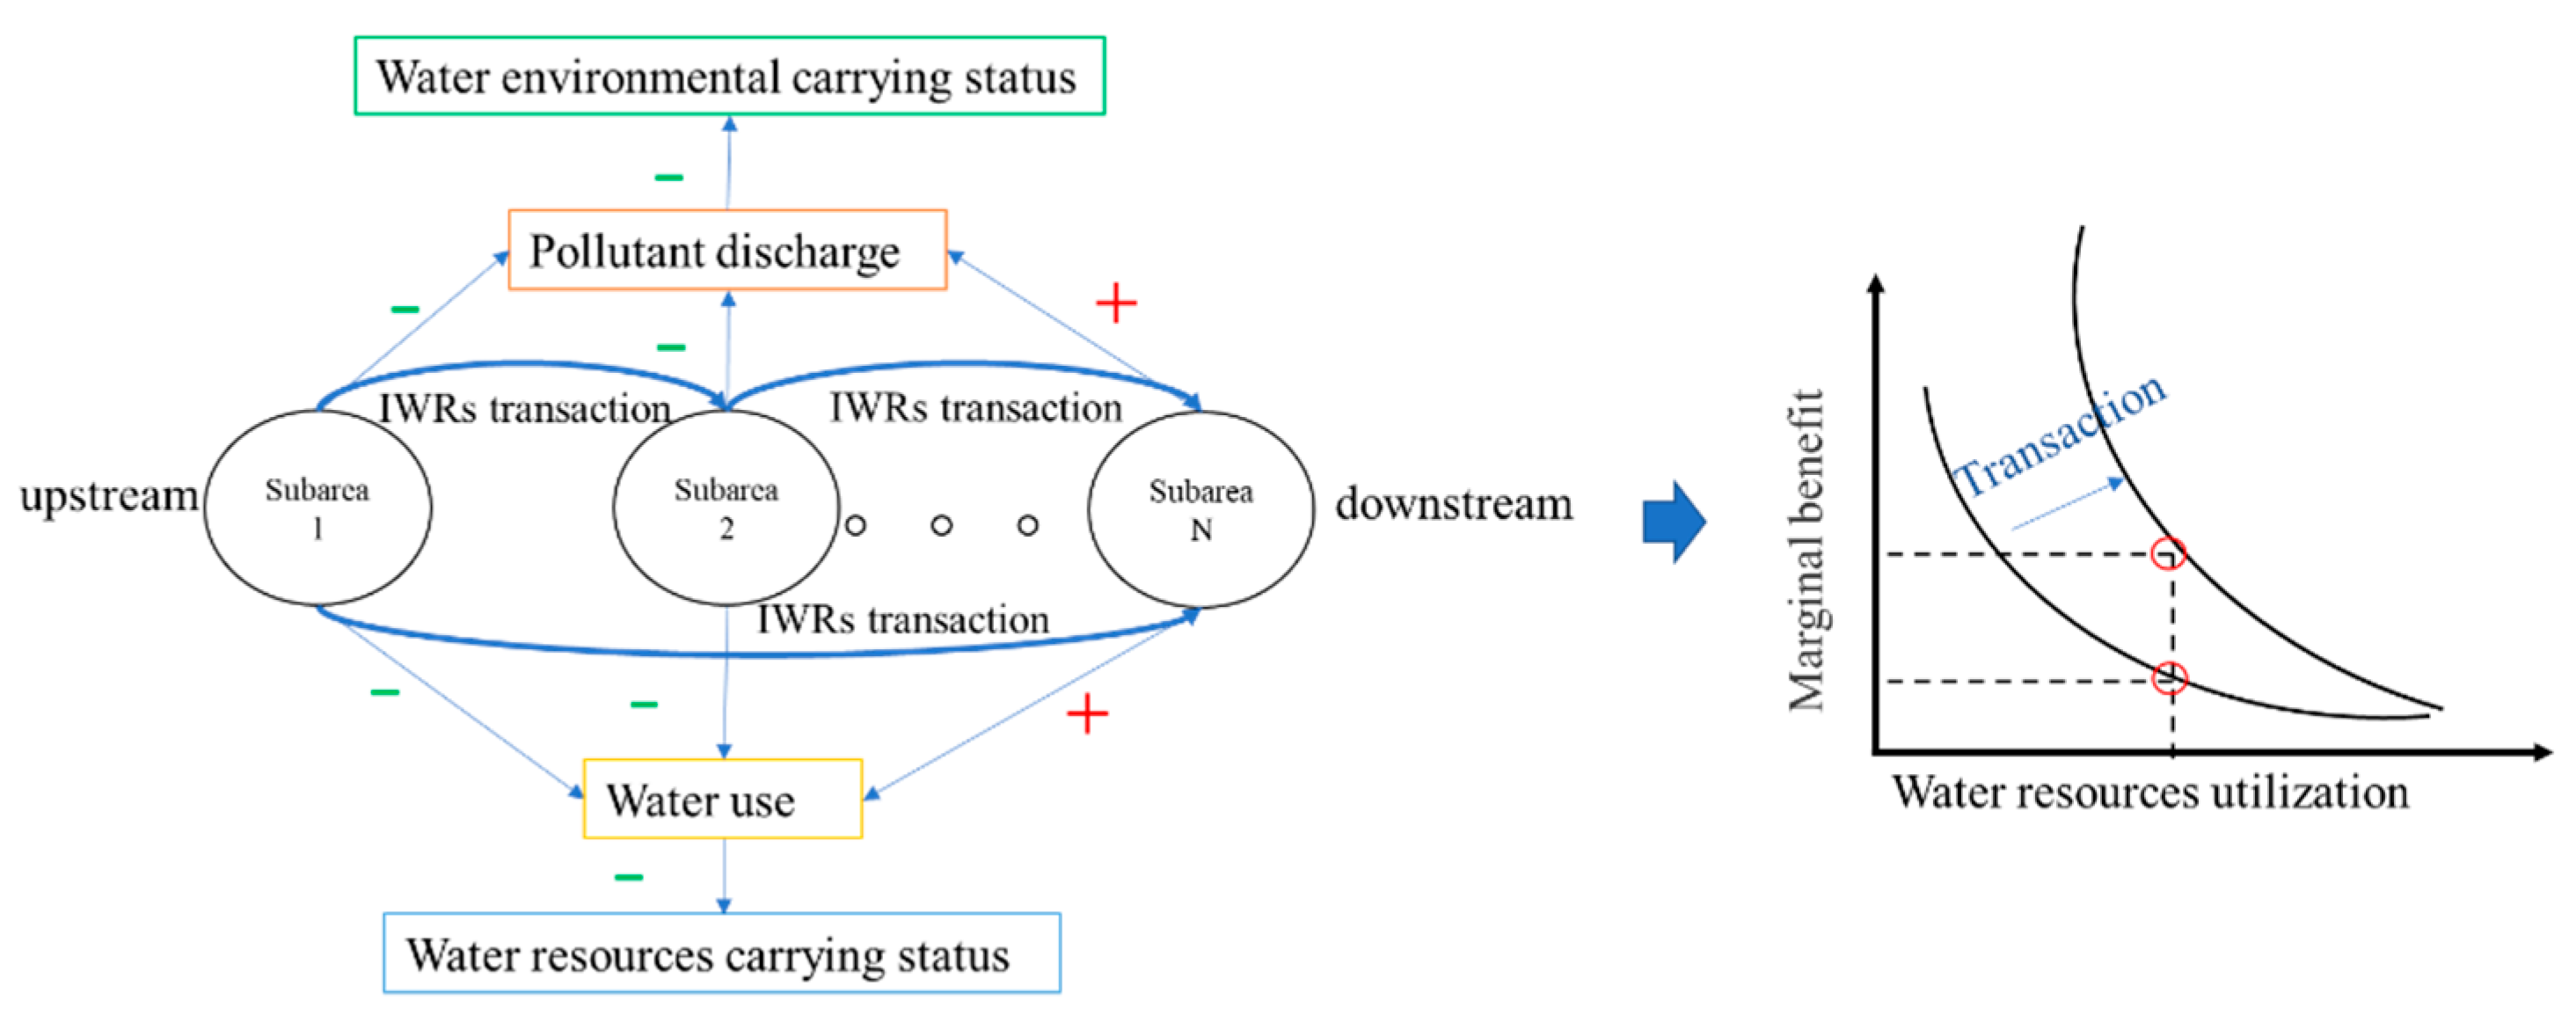
This paper establishes a quasi-market transaction framework of IWRs in the Yellow River basin, that is, the primary market of water rights and pollutant discharge rights (transactions led by local governments), which can provide the basis for future secondary market transactions (transactions led by water and pollutant discharge units such as enterprises and individuals) and increase the marginal benefits (economy, resources, environment) of water resource utilization (See Figure 2). The framework consists of three sections. Section 1: Considering the influence of water use from upstream to downstream, a runoff simulation model is established. By setting different water consumption scenarios (WUS module in SWAT), we obtain the relationship (influence matrix) between upstream water use and downstream water resources and water environmental capacity. Section 2: An IWRs transaction scheme based on multi-objective optimization using the NSGA-II optimization method is constructed, including two steps. At first step, under the principle of fairness, the water rights and pollutant discharge rights of the basin are allocated for the first time according to the water resources and water environmental capacity (initial water rights and pollutant discharge rights); that is, areas with high resources and environmental endowments are allocated more water rights and pollutant discharge rights. Then, considering factors such as water use efficiency and transaction amount, the multi-objective optimization of the genetic algorithm is adopted to obtain an IWRs transaction scheme (secondary allocation) and calculate the economic benefit and resource and environment sustainability (carrying status). Section 3: The revenue, water use efficiency, water resources, and environmental carrying status of the Yellow River basin after the transaction are evaluated. Due to limited space, some tables will be displayed in the Supplementary Material.
2.2.1. Influence Matrix of Water Use Based on Runoff Simulation
(1) Runoff simulation model
In this paper, SWAT (Soil and Water Assessment Tool), a semi-distributed and processed-based hydrological model, was used to establish the runoff simulation model of the Yellow River basin. With several characters, such as a physical mechanism based on conventional data, large-scale river basin application, high calculation efficiency, etc., SWAT is widely used to simulate hydrological conditions in changing environments and in water management practices [31,32,33]. In this paper, ArcSWAT 2012.10_3.19 in Arcgis10.3.1 was used for model simulation, and WGS_1984_UTM_zone_48N was selected as the projected coordinate system.
(2) Database establishment
The data required by the model are divided into spatial data and attribute data. Spatial data mainly include DEM, river network map, land use map, soil map, and distribution of meteorological stations and hydrological stations. The attribute data mainly include the land use attribute database, soil attribute database, meteorological database, etc. The runoff of hydrological stations required verification. The input data of the runoff simulation is shown in Table S1 in the Supplementary Material.
Because the Yellow River basin spans nine areas, the processes of water storage and the discharge of large reservoirs will affect the runoff simulation of the basin. According to the annual water storage capacity in the dynamic statistics table of large reservoirs in the “Yellow River Water Resources Bulletin”, the introduction of the “Yellow River Water Control Project”, and referring to the research of Xu et al. (2021), the relevant data for four main large reservoirs were established (see Table S2 in Supplementary Material). Among them, the average monthly discharge of reservoirs was set by referencing the monthly average data of runoff from 2015 to 2019 (see Table S6 in Supplementary Material). This value will change greatly with the rainfall season, but the calculation is in years, and thus it will have little influence when the model calibration is accurate.
Water resource consumption and utilization (WUS) is a management tool to remove water from river basins. This document is used to simulate the amount of water used for basin irrigation or urban/industrial use. In this paper, the water use data were established according to the average water intake in different months in the water supply scheme of the “Yellow River Diversion” from 2015 to 2019 (see Table S3 in Supplementary Material).
(3) Model calibration
There are many parameters related to the water quantity process in the SWAT model, and their influences on the accuracy of the model simulation results can be high or low. Therefore, the parameters affecting the water quantity simulation should be screened. In this paper, 10 parameters related to the water simulation process were selected for calibration of the model by sorting out the literature [34,35,36,37], consulting the input and output document manuals of the SWAT model, and considering expert suggestions. See Table S4 in the Supplementary Material for the meaning, initial values, and ranges of the parameters.
In this paper, the distributed model parameter optimization tool coupled with the soil and water assessment tool (DMPOTSWAT) was used to calibrate the model automatically. Developed by Dr Feng in Research Centre for Eco-Environmental Sciences, CAS, it is combined with the parallel computing software package Ray on Python, adopts the dynamic dimension search (DDS) algorithm, and can implement distributed procedures for multisite calibration (https://github.com/QingyuFeng/dmpotswat, accessed on 20 November 2021). The determination coefficient (R2) and Nash–Sutcliffe efficiency coefficient (NSE) [38,39] were selected to evaluate the simulation effect of the model. The closer R2 and NSE are to 1, the better the simulation effect and the higher the credibility of the model. When the NSE is close to 0, the simulation results are close to the average level of the measured values, and the overall results are credible. Additionally, due to the efficient operation of the DMPOTSWAT, the sensitivity analysis of parameters is not necessary.
(4) Influence simulation of runoff under different water use scenarios
The different water use scenarios were set by WUS (water resource consumption and utilization) to obtain the influence of water consumption change in the upstream area on the runoff in the downstream area, and thus the matrix of the corresponding change in the total water resources and water environmental capacity in the downstream area was gained. In detail, from the upstream to downstream areas (i.e., Qinghai to Gansu, and Henan to Shandong), we set the monthly average water use in the WUS file as 10%, 20% and 50% higher or lower than that in the original model, calculated the influence of water use change in each area on the runoff of downstream areas one by one, and obtained the average influence relationship (matrix) of upstream water consumption on downstream changes. The annual average water use of an upstream area decreased by 100 million cubic meters, and the total water resources of downstream areas increased by an average of several hundred million cubic meters. According to the one-dimensional water quality model, the increased water environmental capacity (in tons) on the downstream provinces affected by the upstream area was identified. It should be noted that the change in water quantity in the area will also have an impact on the water environmental capacity in the area itself.
2.2.2. IWRs Transaction Scheme Based on Multi-Objective Optimization
(1) NSGA-II optimization method
In this paper, the nondominated sorting genetic algorithm II (NSGA-II) is used to solve the problem, and the ’Gamultiobj’ function was used to express it on the MATLAB platform. A genetic algorithm is a global search algorithm based on natural selection and genetic theory. According to the fitness function of the predetermined target, each individual is evaluated, and a better group and the best individual are continuously obtained according to the survival of the fittest principle. The Pareto optimal solution obtained by this algorithm has a uniform distribution, good convergence and robustness, and a good optimization effect. NSGA-II is a new idea for solving multi-objective optimization problems that are widely used.
The gamultiobj function (a multi-objective function based on a genetic algorithm) is a multi-objective algorithm based on NSGA-II, which is used to create a group of points in the Pareto frontier. The format of the gamultiobj function in the MATLAB toolbox is as follows:
where is the objective function, is the number of variables x, is the upper bound constraint of the variable, is the lower bound constraint of the variable, and are parameters of linear inequality constraint , and and are parameters of linear equality constraint .
(2) Decision variable
In this paper, 112 variables were set up, and the transaction volumes of agricultural water rights () and industrial water rights () in eight areas (provinces/autonomous areas) of the Yellow River basin are represented by X1–X56, and the transaction volumes of chemical oxygen demand (COD) pollutant discharge rights () and ammonia nitrogen (NH4+-N) pollutant discharge rights () are represented by X57–X112 (see Table S5 in Supplementary Material). The subscript ATA means transaction from subarea to subarea.
(3) Multi-objective functions
Considering the economic benefits, resource and environmental carrying status, the overall “maximum total revenue”, “minimum water resources carrying rate” and “minimum water environmental carrying rate” after the transaction are set as three subobjectives, namely:
As follows:
Objective function 1: Economic benefits
After the transaction, the total revenue of the basin is the maximum. The economic objective function that maximizes the economic benefits can be expressed as Equation (2).
where the is the total revenue of the subarea, the is the revenue of water use in the subarea, the is the expenditure of pollutant discharge in the subarea, the is the revenue of water right transaction in the subarea, and the is the revenue of pollutant discharge right transaction in the subarea.
Objective function 2: Water resource carrying status
After the transaction, the water resource carrying status of the basin is the best, which is quantified by the water resource carrying rate. The water resource carrying objective function that minimizes the water resource carrying rate can be expressed as Equation (3).
where the is the water resource carrying rate of the river basin, the is the water use of the subarea, is the water resources of the subarea, is the water use before transaction in the subarea, is the water rights transacted in the subarea, is the water resources before transacted in the subarea, and is the transaction coefficient of water rights (the influence coefficient of regional water use on water resources in downstream areas).
Objective function 3: Water environmental carrying status
After the transaction, the water environmental carrying status of the basin is the best, which is quantified by the water environmental carrying rate. The water environmental carrying objective function that minimizes the water environmental carrying rate can be expressed as Equation (4).
where and are the water environmental carrying rate of COD and NH4+-N, respectively, and are the pollutant discharge of COD and NH4+-N after transaction in the subarea, and are the pollutant discharge before transaction in the subarea, and are the water environmental capacity of COD and NH4+-N after transaction, and are the water environmental capacity of COD and NH4+-N before transaction, is the transaction coefficient of COD pollutant discharge rights (the influence coefficient of regional water use on COD water environmental capacity in its downstream area), and is the transaction coefficient of NH4+-N pollutant discharge rights (the influence coefficient of regional water use on NH4+-N water environmental capacity in its downstream area).
(4) Constraints
In this paper, there are six specific constraints, including the upper limit of water use and pollutant discharge transaction, the constraint of transaction principle/direction, the constraint of the maximum amount of water use and pollutant discharge in the whole basin after the transaction, and the constraint of not reducing the revenue after the transaction. These are as follows:
a. Upper and lower limits of water rights transaction constraints
The maximum tradable water right of each subarea (province/autonomous area) is the initial water right (water use before transaction) minus the minimum water consumption of this subarea (province/autonomous area), and the minimum water consumption is the sum of domestic water and ecological environment water. The minimum value of tradable water rights is zero. These are expressed in Equations (5) and (6).
b. Upper and lower limits of pollutant discharge transaction constraints
The maximum tradable pollutant discharge right of each subarea (province/autonomous area) is the initial pollutant discharge right (water pollutant discharge before transaction) minus the minimum pollutant discharge amount; the minimum tradable pollutant discharge right is zero. These are expressed in Equations (7)–(9).
c. Transaction principles/direction constraints
Water needs to be transacted from subareas with low water use efficiency to subareas with high water use efficiency, that is, the revenue generated by each transaction volume after the transaction is non-negative. It can be expressed as Equation (10).
where is the water use efficiency, representing the economic benefit generated by each unit of water consumption, and is the water use efficiency of the current subarea minus the downstream area of this subarea.
d. Water use constraints after transaction
The total water use after the transaction (water use before the transaction and the water rights transacted) is non-negative and does not exceed the total water resources. It can be expressed as Equation (11).
e. Pollutant discharge constraints after transaction
The total water pollutant discharge after a transaction (the amount of pollution before transaction and the pollutant discharge rights transacted) is non-negative and does not exceed the water environmental capacity. These are expressed in Equations (12) and (13).
f. Revenue constraints
The after-transaction earnings of each subarea (revenue of water use − expenditure of pollutant discharge + revenue of water right transaction + revenue of pollutant discharge right transaction) should not be less than the before-transaction earnings. This can be ex-pressed as Equation (14).
where the total revenue before the transaction is expressed by the GDP in this paper.
2.2.3. Efficiency and Sustainability Evaluation
Using the present situation (original) as a reference, the water use efficiency and its impact on the sustainable water resources carrying rate and water environment carrying rate of different regions and river basins as a whole were evaluated under different scenarios (original, fairness, efficiency, fairness, and efficiency) to judge whether the schemes under the scenarios of fairness or efficiency were more reasonable.
3. Results and Discussion
3.1. Influence Matrix
3.1.1. Runoff Simulation
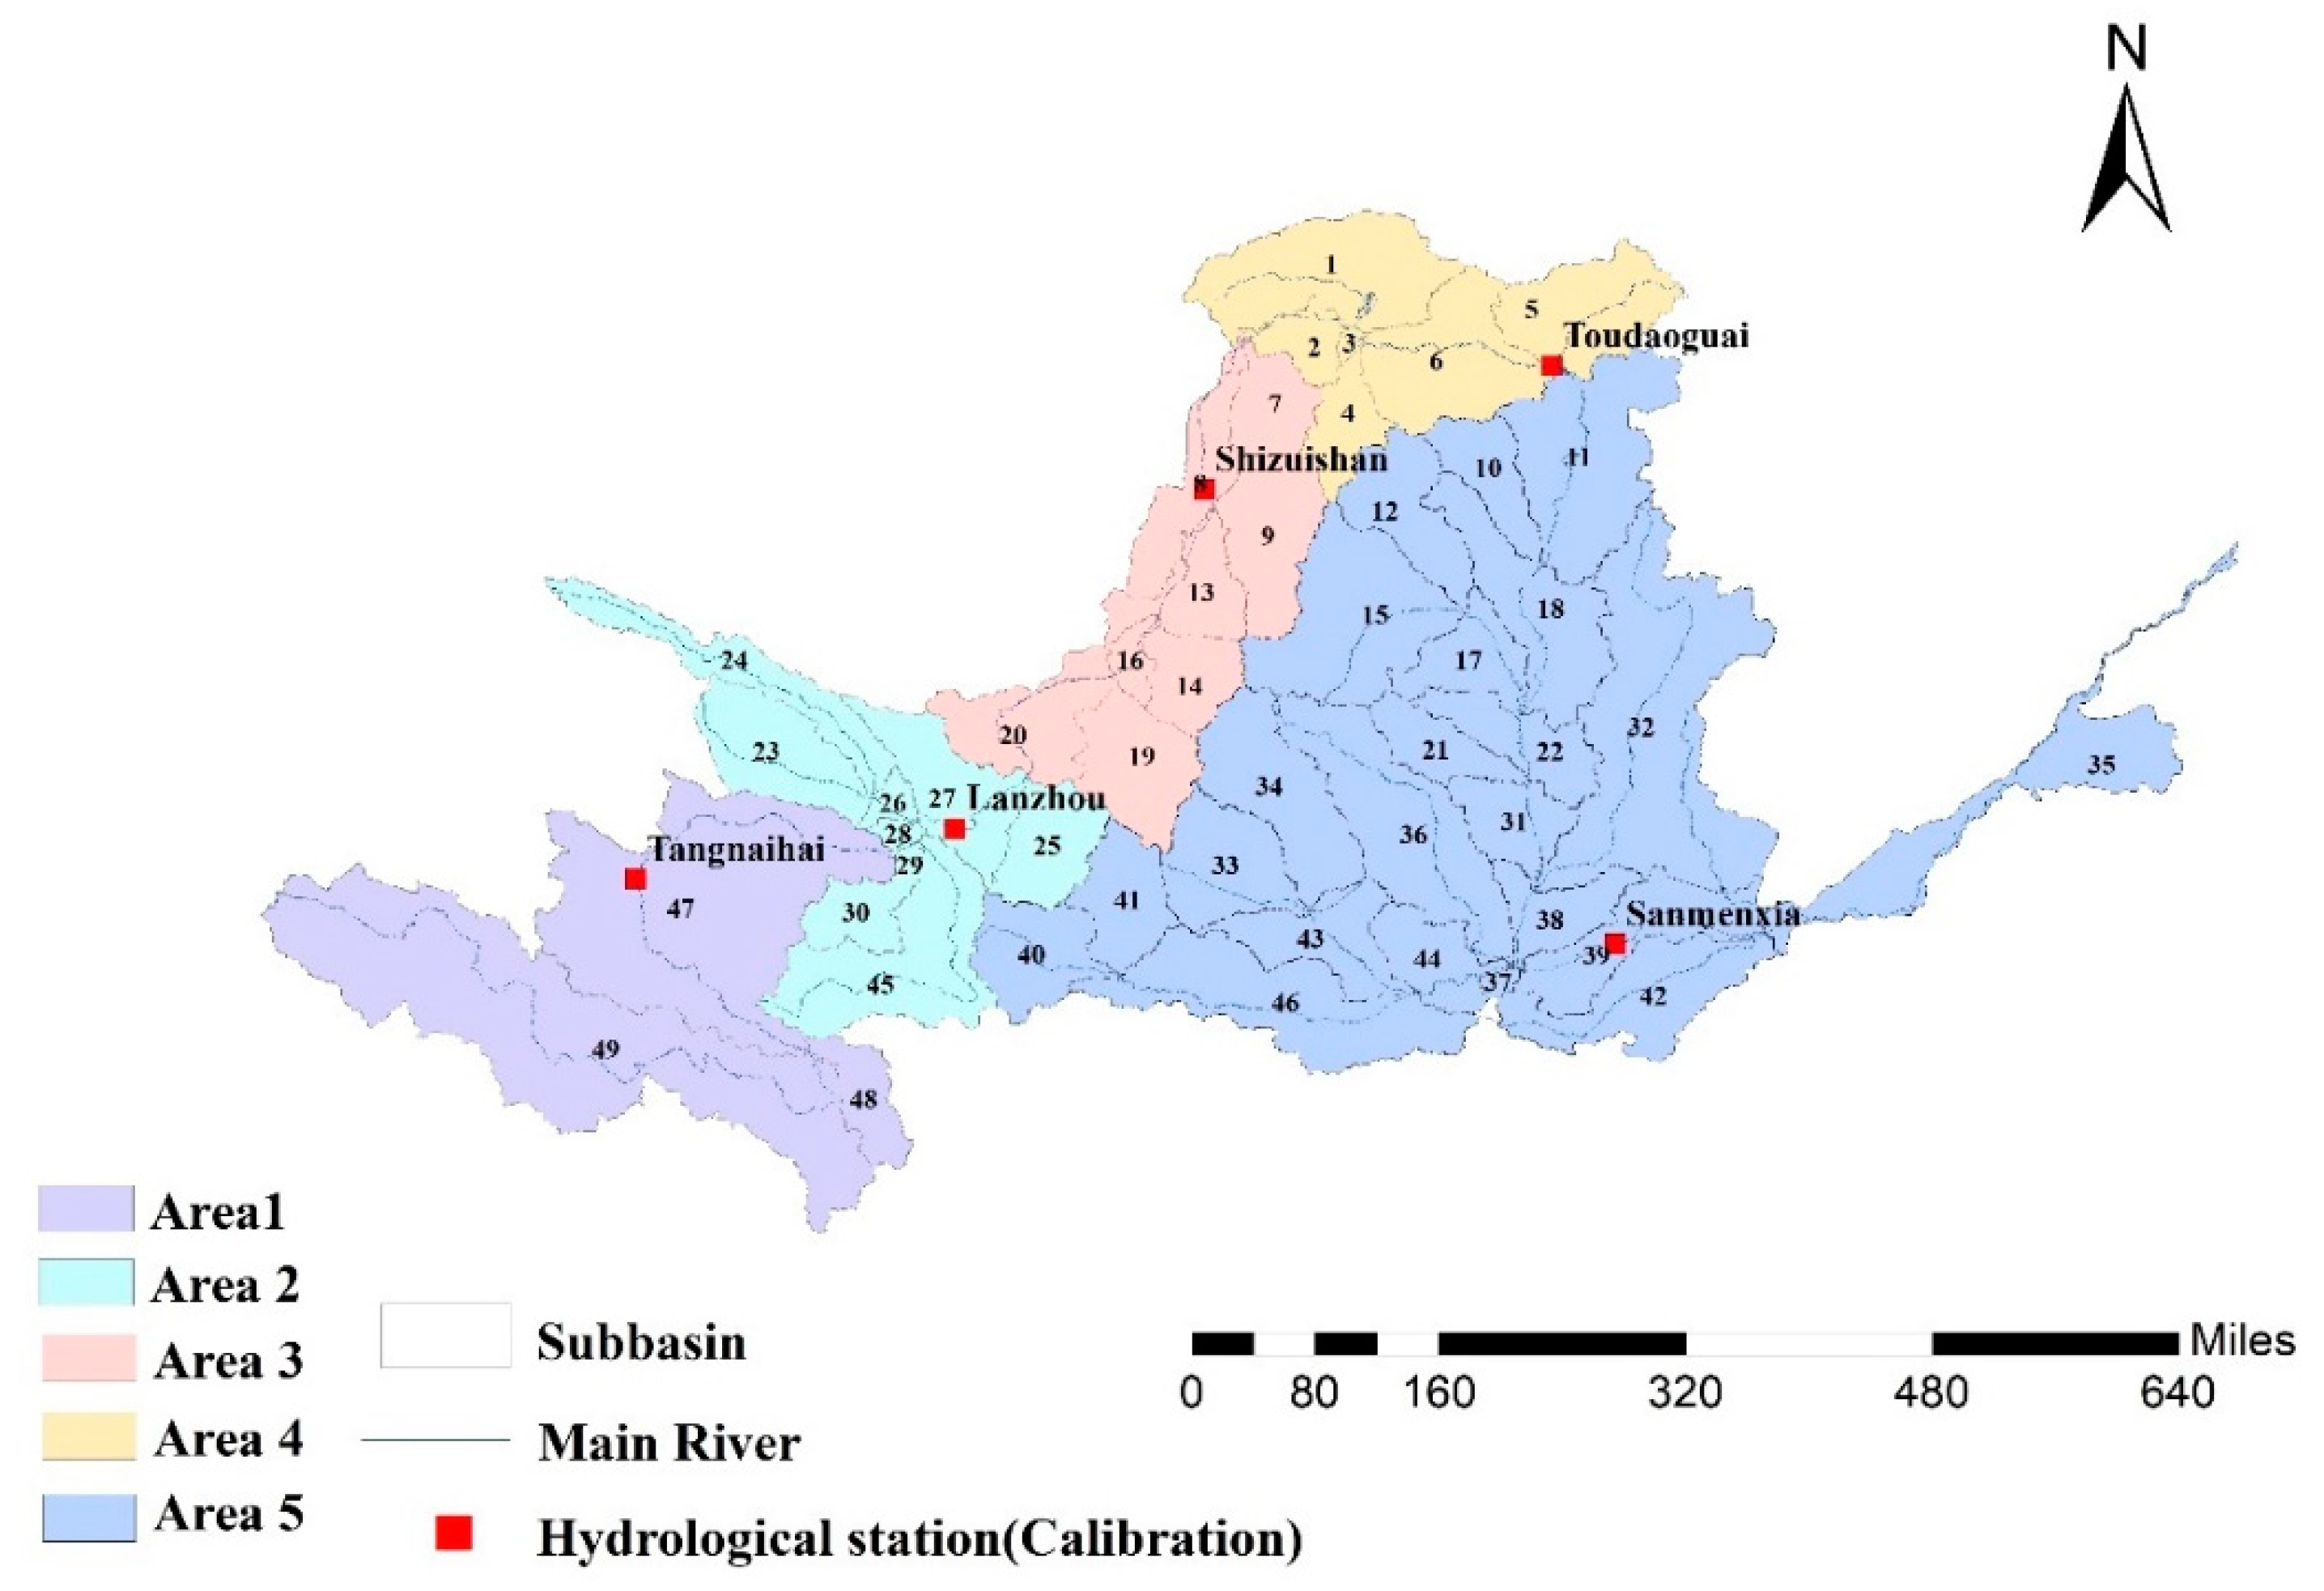
In this paper, the Yellow River basin was divided into 49 sub-basins, and the measured monthly runoff values of five hydrological stations from 2009 to 2019 were selected to correct the measured values of hydrological stations. Because the basin spans many areas, a grouping calibration was adopted. The grouping of parameter calibration is shown in Figure 3.
According to the results of the calibrations (the number of iterations is 500), the R2 coefficient and NSE coefficient of different regions and corresponding sub-basins are distinct. Table 1 shows that the R2 values were over 0.5 for all stations; the NSE values of the Tangnaihai, Toudaoguai and Shizuishan stations were over or close to 0.5, and the NSE values of the Lanzhou and Sanmenxia station were over or close to 0.3, indicating that the model is reliable in general for the large-scale and complex watershed.
3.1.2. Influence Matrix of IWRs
The simulation results (see Table 2) show that the change in water use in the upper reaches does lead to a change in water resources and water carrying capacity in the lower reaches, and from the spatial distribution, the affected water resource change gradually decreases from upstream to downstream. To be specific, per 108 m3 change in upstream water use, the maximum variation in downstream water resources is 0.63 × 10⁸ m3, and the minimum variation is 0.22 × 10⁸ m3. Moreover, per 108 m3 change in upstream water consumption, the downstream water environmental capacity (COD) changes with a maximum of 7.76 × 10² tons and a minimum of 0.66 × 10² tons. The change in the downstream water environmental capacity (NH4+-N) is 0.70 × 10² tons at maximum and 0.07 × 10² tons at minimum.
3.2. Transaction Scheme of the IWRs
3.2.1. Initial Allocation on the Basis of Fairness Principle
According to the principle of fairness, the initial IWRs were allocated; that is, the subareas with more water resources and water environmental capacity were allocated more IWRs. The allocation scheme is shown in Table 3. It can be seen that Qinghai and Gansu have more initial water use rights, exceeding 50% of the total, and Shandong and Ningxia have less initial water rights than other subareas. The subarea with the largest initial pollutant discharge rights allocation is Henan, and the area with the least is Shaanxi.
3.2.2. Secondary IWRs Allocation by Multi-Objective Optimization (Transaction)
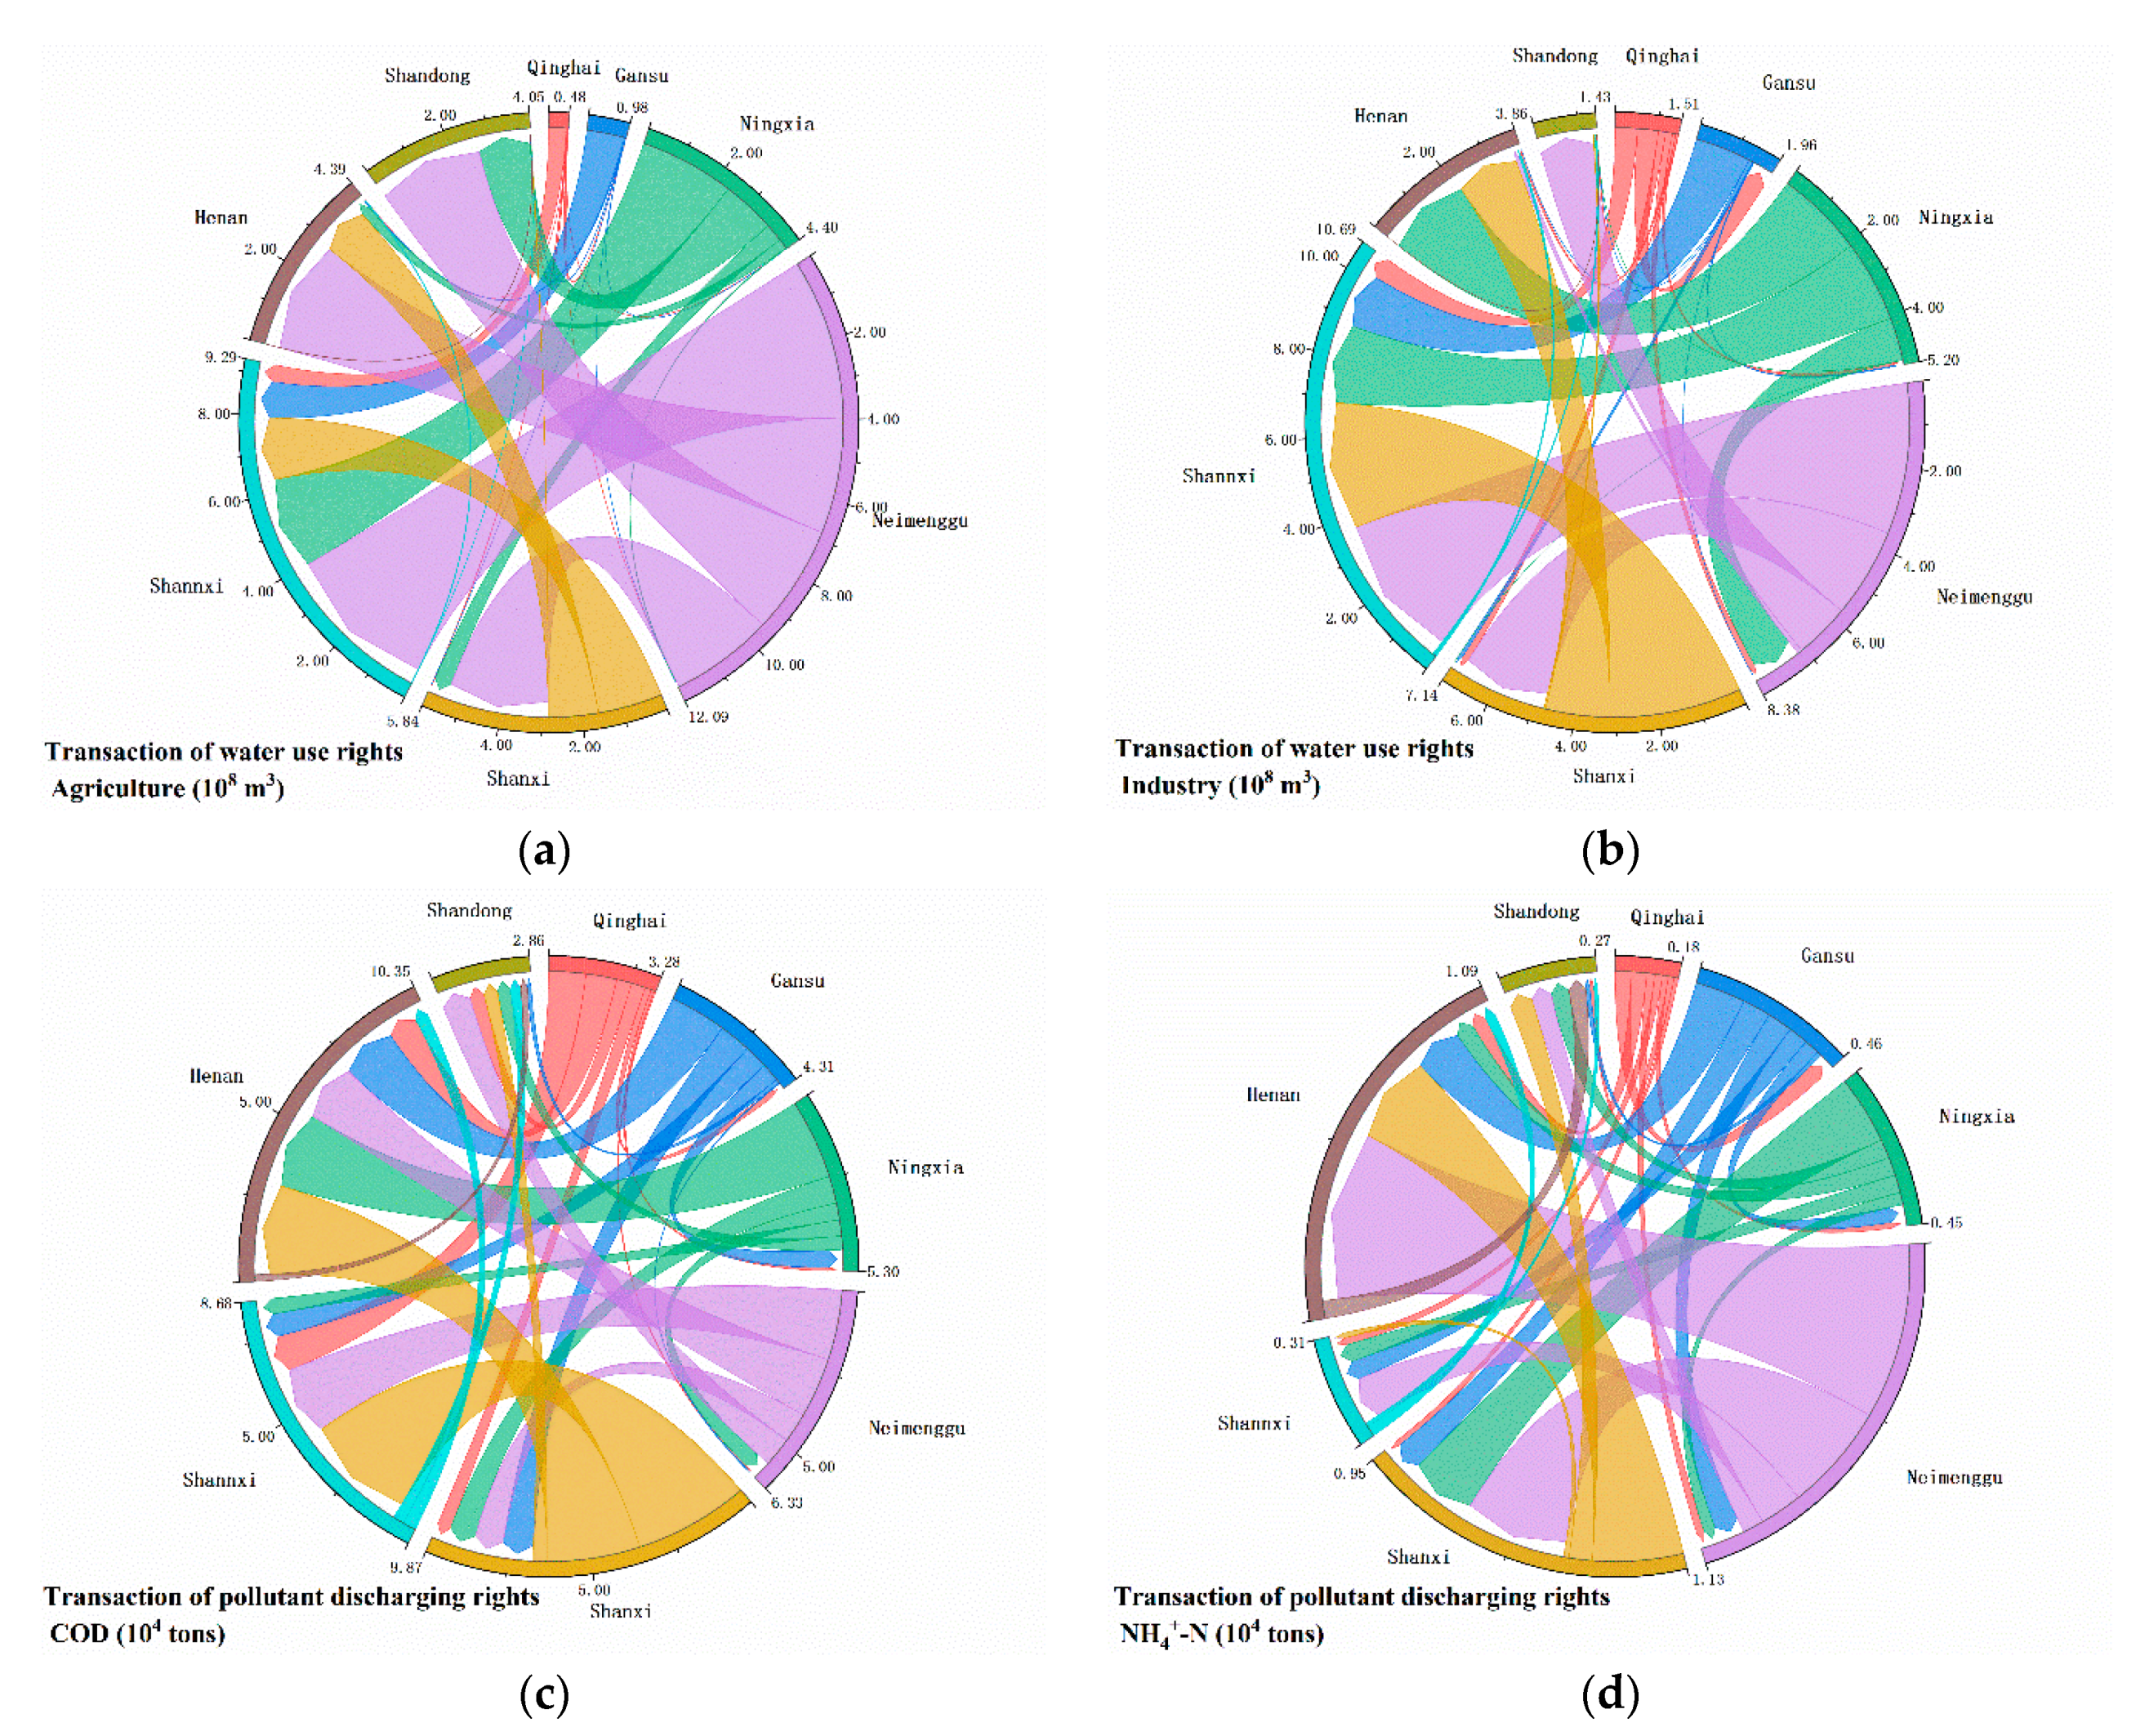
As shown in Figure 4, the optimized scheme of IWRs transacted in the Yellow River basin shows that the total amount of water use rights transaction in the Yellow River basin is 40.85 × 10⁸ m3, including 20.76 × 10⁸ m3 agricultural water use rights and 20.09 × 10⁸ m3 industrial water use rights, indicating that the potential of agricultural water rights transacted is slightly greater. Specifically, in the scheme of agricultural water rights transaction (see Figure 4a), the subareas in the upper reaches (Qinghai, Gansu, Ningxia and Neimenggu) are mainly transacted to subareas in the middle and lower reaches where the grain-producing areas of the Yellow River are mainly distributed, which is beneficial to the Yellow River basin. The biggest seller of agricultural water use rights is Neimenggu, which has the highest water efficiency (water per unit revenue). The total amount of water use rights transacted to the middle and lower reaches of the river is 12.09 × 10⁸ m3, accounting for 60% of the total agricultural water rights in the basin. The biggest buyer is Shaanxi, mainly because its unit revenue water consumption is the smallest, with a total purchase of 9.29 × 10⁸ m3 water rights, accounting for nearly 45% of the total. The transactions of the other three regions are similar, accounting for about 20% of the total agricultural water use rights. Moreover, in Shanxi, 3.01 × 10⁸ m3 is transacted in, and 2.84 × 10⁸ m3 is transacted out. It seems like ‘middlemen earn the difference’.
In the scheme of industrial water use rights transaction (see Figure 4b), except for the source area (Qinghai) and the estuary area (Shandong), synchronous transactions exist on buying and selling for the other six areas which are guided by water use efficiency. The largest selling subarea is still Neimenggu, followed by Ningxia and Shanxi, with industrial water use rights of 7.19 × 10⁸ m3, 5.09 × 10⁸ m3 and 4.73 × 10⁸ m3, respectively. The largest buyer is still Shaanxi, with a total purchase of 10.59 × 10⁸ m3, which is more than 50% of the total industrial water rights.
The situation of pollutant discharge transaction in the Yellow River basin is more complicated than that of water use rights (see Figure 4c,d). The total amount of COD pollutant discharge transaction is 25.49 × 10⁴ tons, and the total amount of NH4+-N pollutant discharge transaction is 2.43 × 10⁴ tons. From upstream to downstream, the amount of COD pollutant discharge transaction in each region gradually increases, and the largest seller is Shanxi, with 6.75 × 10⁴ tons transacted out. The largest buyer is Henan, with 10.14 × 10⁴ tons of COD transacted in, followed by Shaanxi, with 7.95 × 10⁴ tons transacted in. In the scheme of NH4+-N pollutant discharge transaction, Neimenggu is the biggest seller, and the NH4+-N pollutant discharge rights transaction is 1.00 × 10⁴ tons, while Henan is the biggest buyer, and the transacted NH4+-N pollutant discharge rights comprise 1.04 × 10⁴ tons, accounting for almost 85% of the total in the river basin.
3.3. Revenue, Efficiency and Sustainability Evaluation
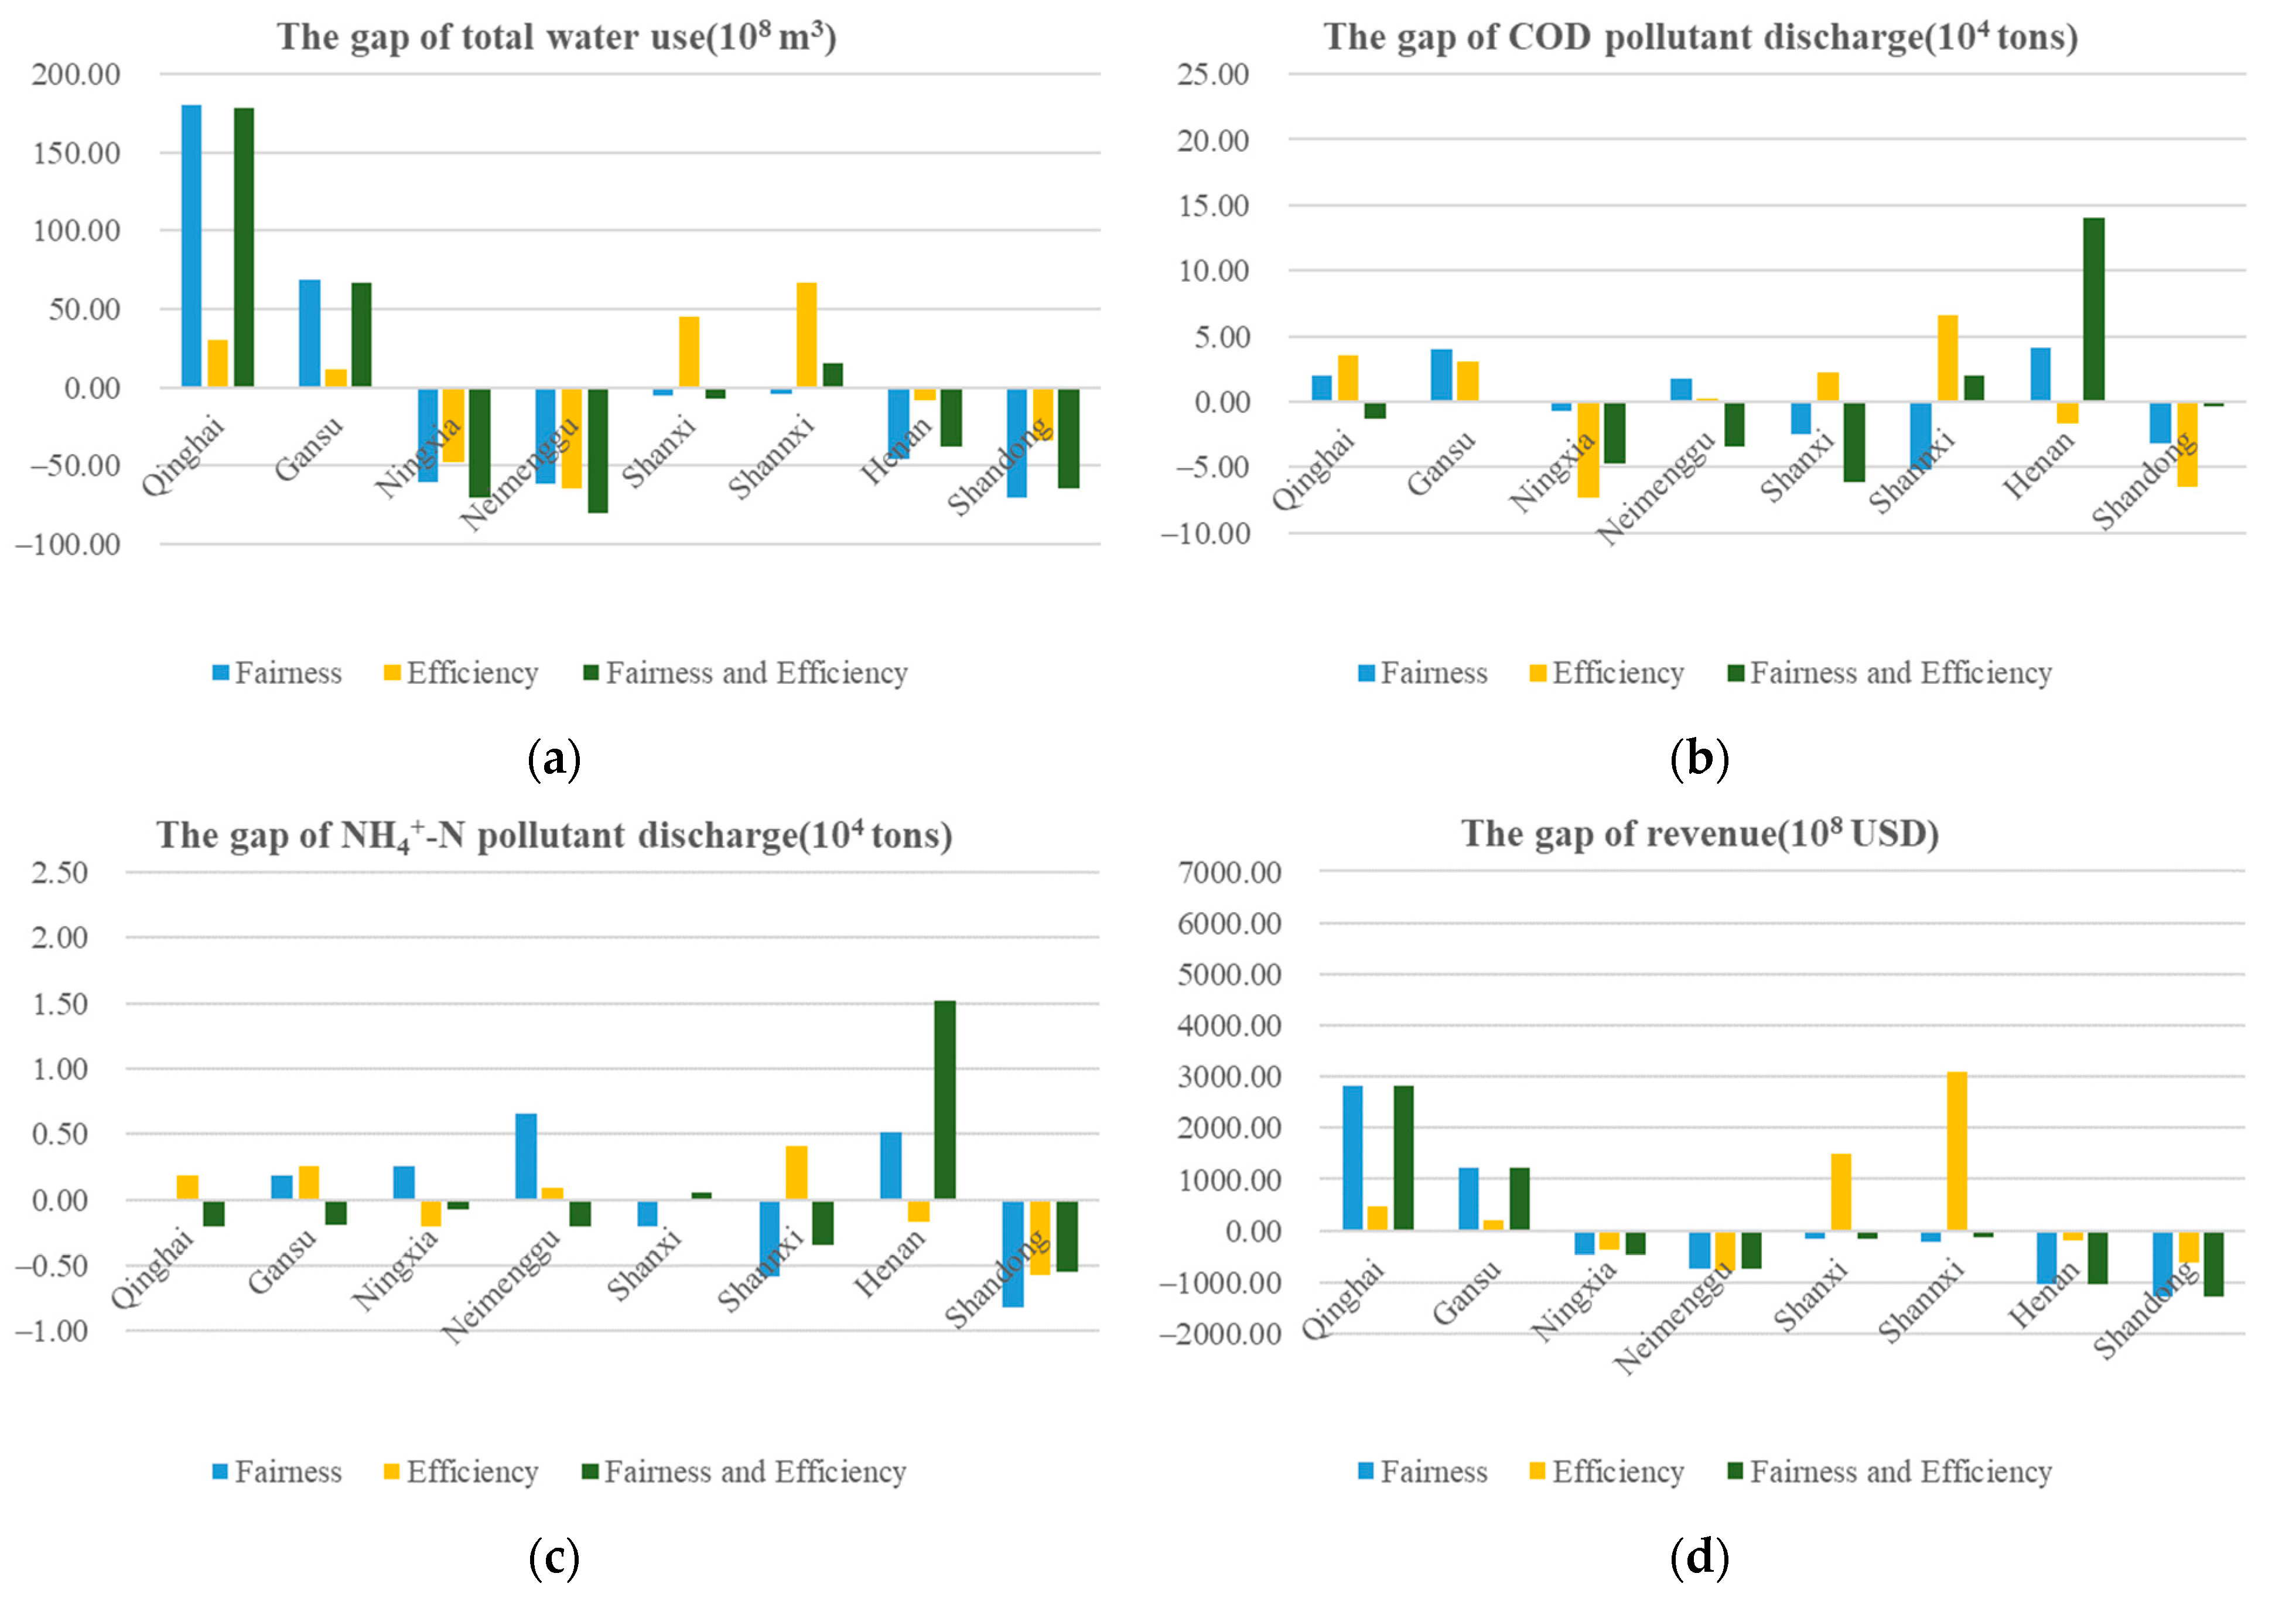
As shown in Figure 5, in general, comparing the ‘original’ scenario (current situation), the upstream Qinghai and Gansu regions gain more water use rights under the scenarios of fairness, and fairness and efficiency, while the water use rights of subareas with higher water demand (Ningxia, Inner Mongolia, Henan and Shandong) are reduced. In the pollution discharge rights allocation scheme, the rights in most areas are reduced compared with the current situation, while the COD pollution discharge rights in the Henan area are greatly increased under the fairness and efficiency scenarios. After the IWRs are redistributed among subareas, the efficiency scenario involves transferring the revenue to the subareas with high water use efficiency as much as possible, and the revenue is about 3342.48 × 108 USD more than that of the original scenario. Under the scenarios of fairness, and fairness and efficiency, the revenue of Qinghai and Gansu in the upper reaches is greatly improved. By reducing the revenue of the lower reaches, the newly increased revenues are USD 144.54 and USD 244.71 × 10⁸, respectively, especially in Shandong and Henan, which is in line with the original intention of ecological compensation, that is, transferring the income of areas with better economic development to areas that need more funds for ecological protection.
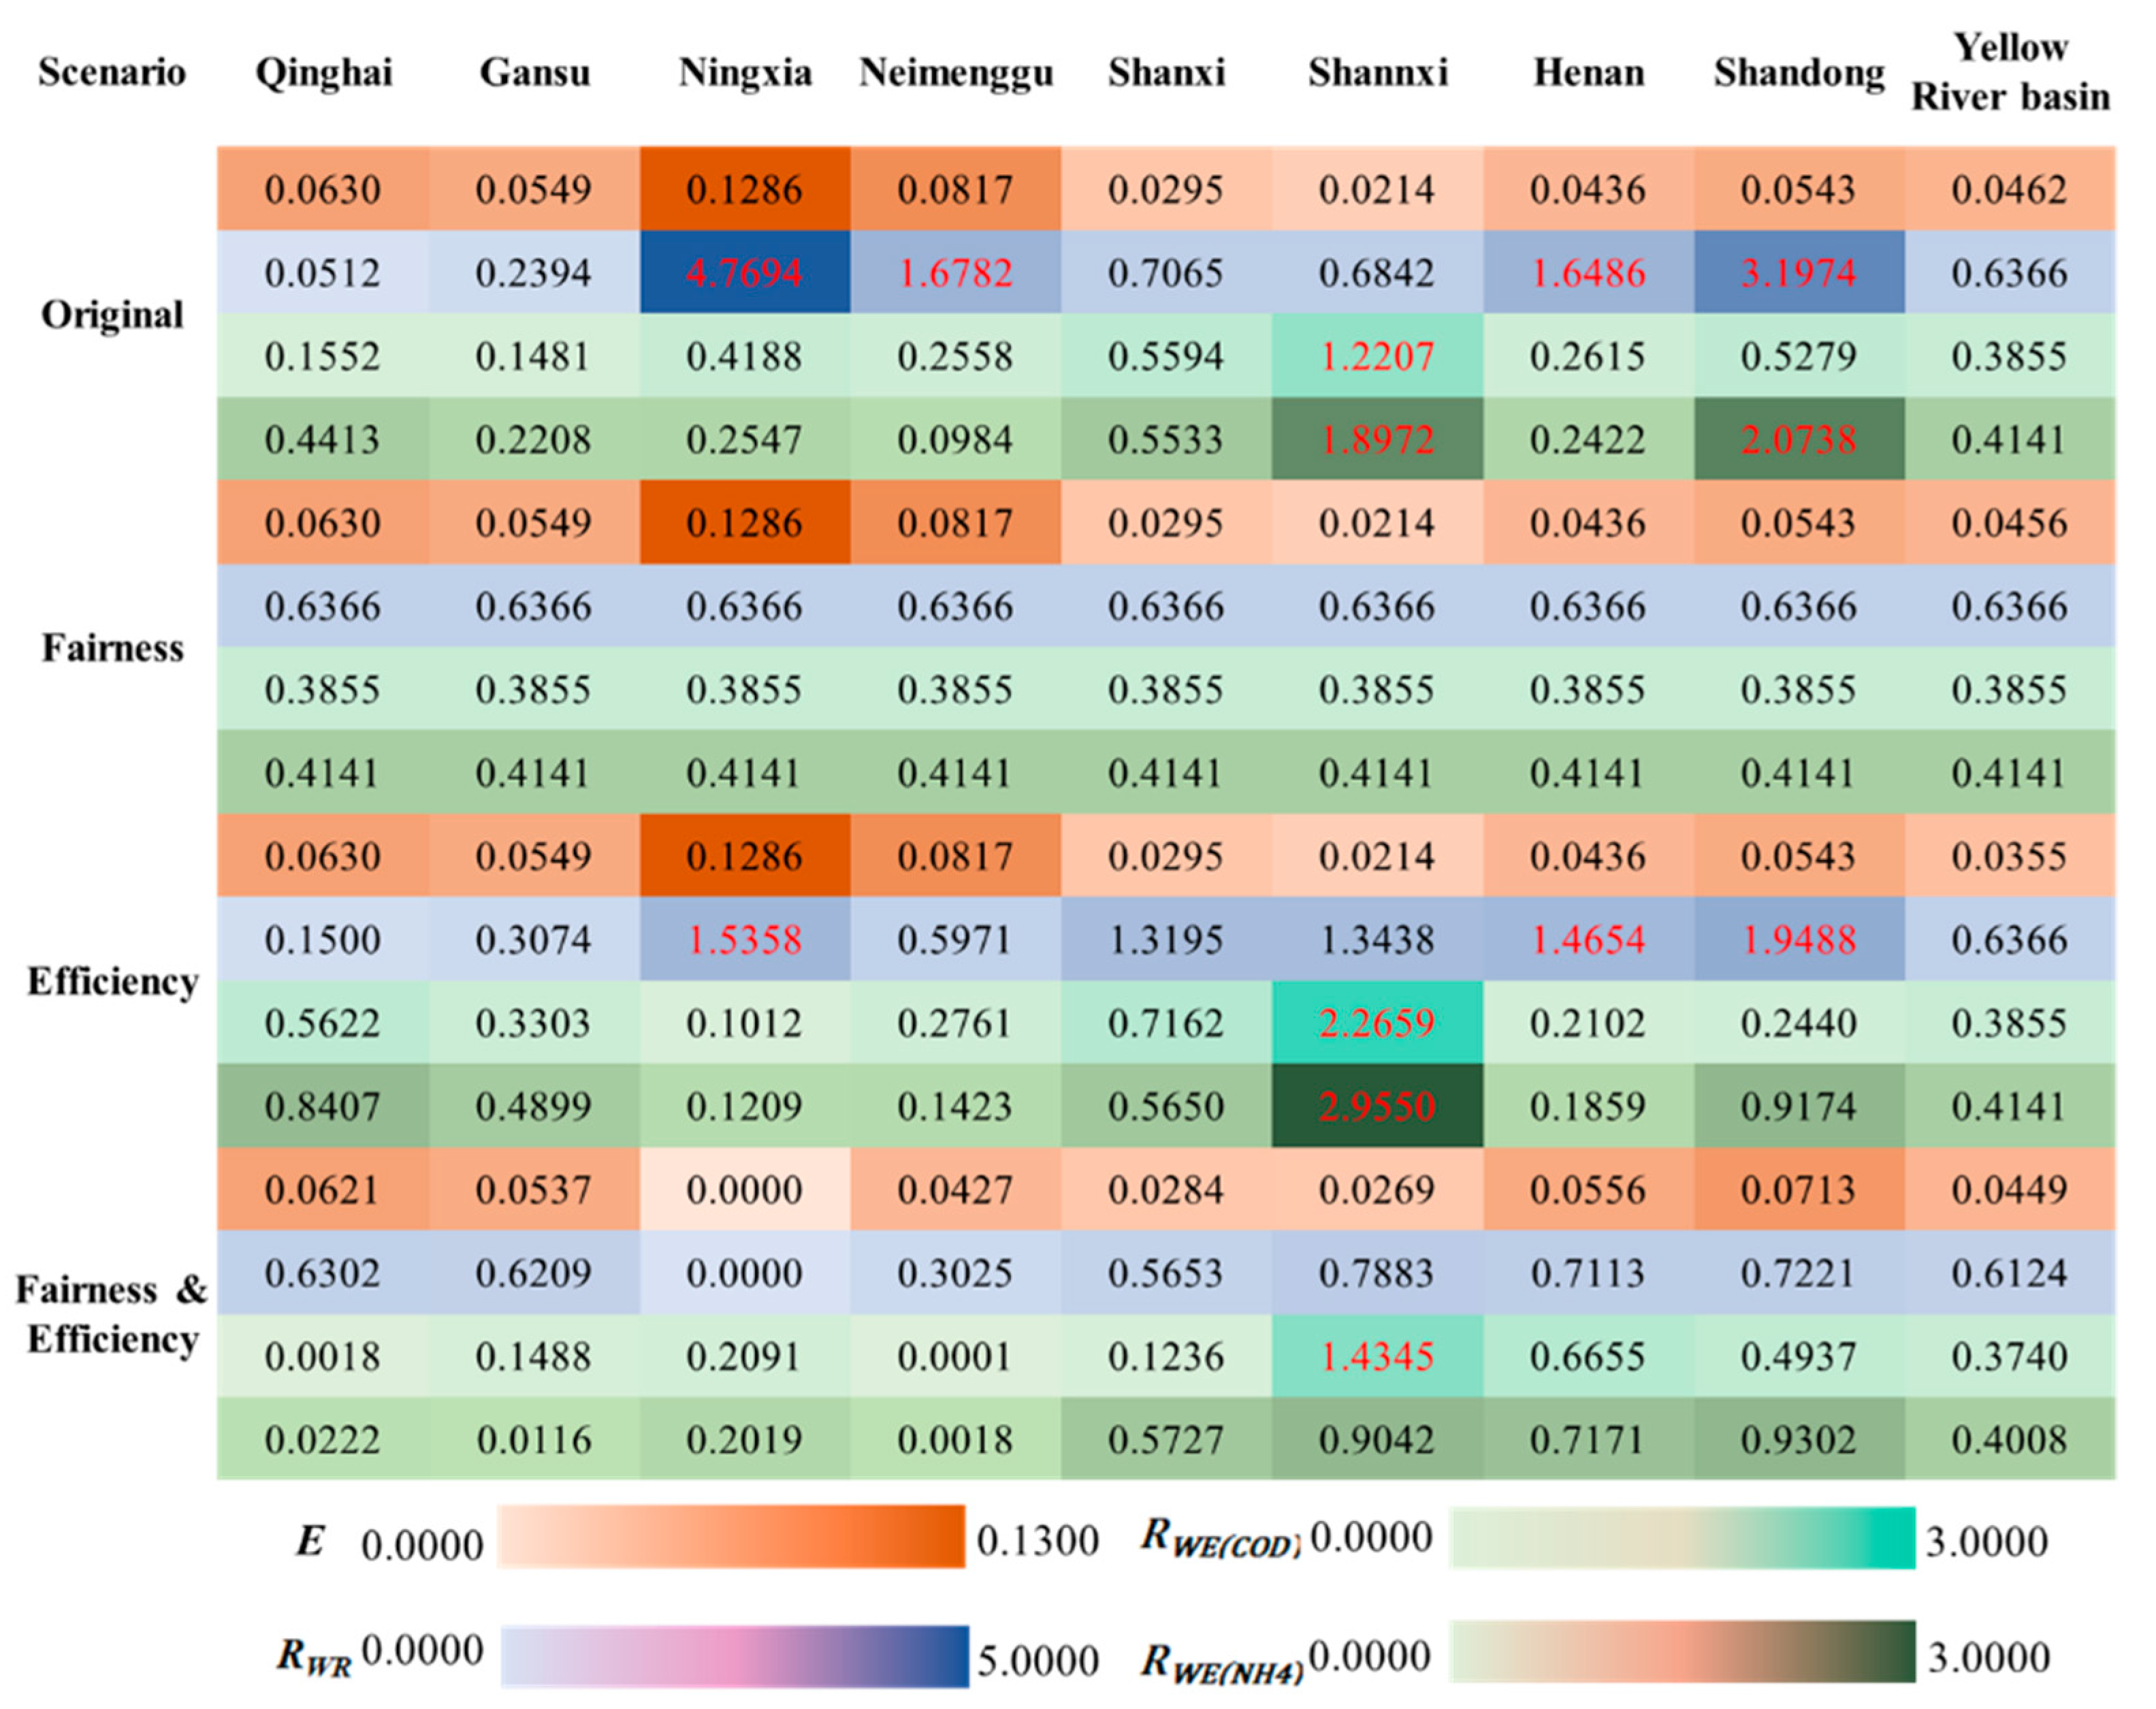
The results of the efficiency evaluation (see Figure 6 and Figure 7) show that although the water use efficiency of each area is the same as that of the current situation (‘original’ scenario) under the ‘efficiency’ or ‘fairness’ scenarios (assuming that the water use efficiency of each area remains unchanged during IWRs allocation), the overall water use efficiency of the basin improves, especially under the ‘efficiency’ scenario (from 0.0462 to 0.0355 m3/USD). Under the ‘fairness and efficiency’ scenario, the water use efficiency in the middle and upper streams (Qinghai, Gansu, Ningxia Neimenggu, Shanxi) and the overall river basin obviously improve (the maximum improvement value is 0.1273 m3/USD), but the water use efficiency of Henan and Shandong in the lower streams of the river decline to some extent due to the greater amount of water use rights transacted.
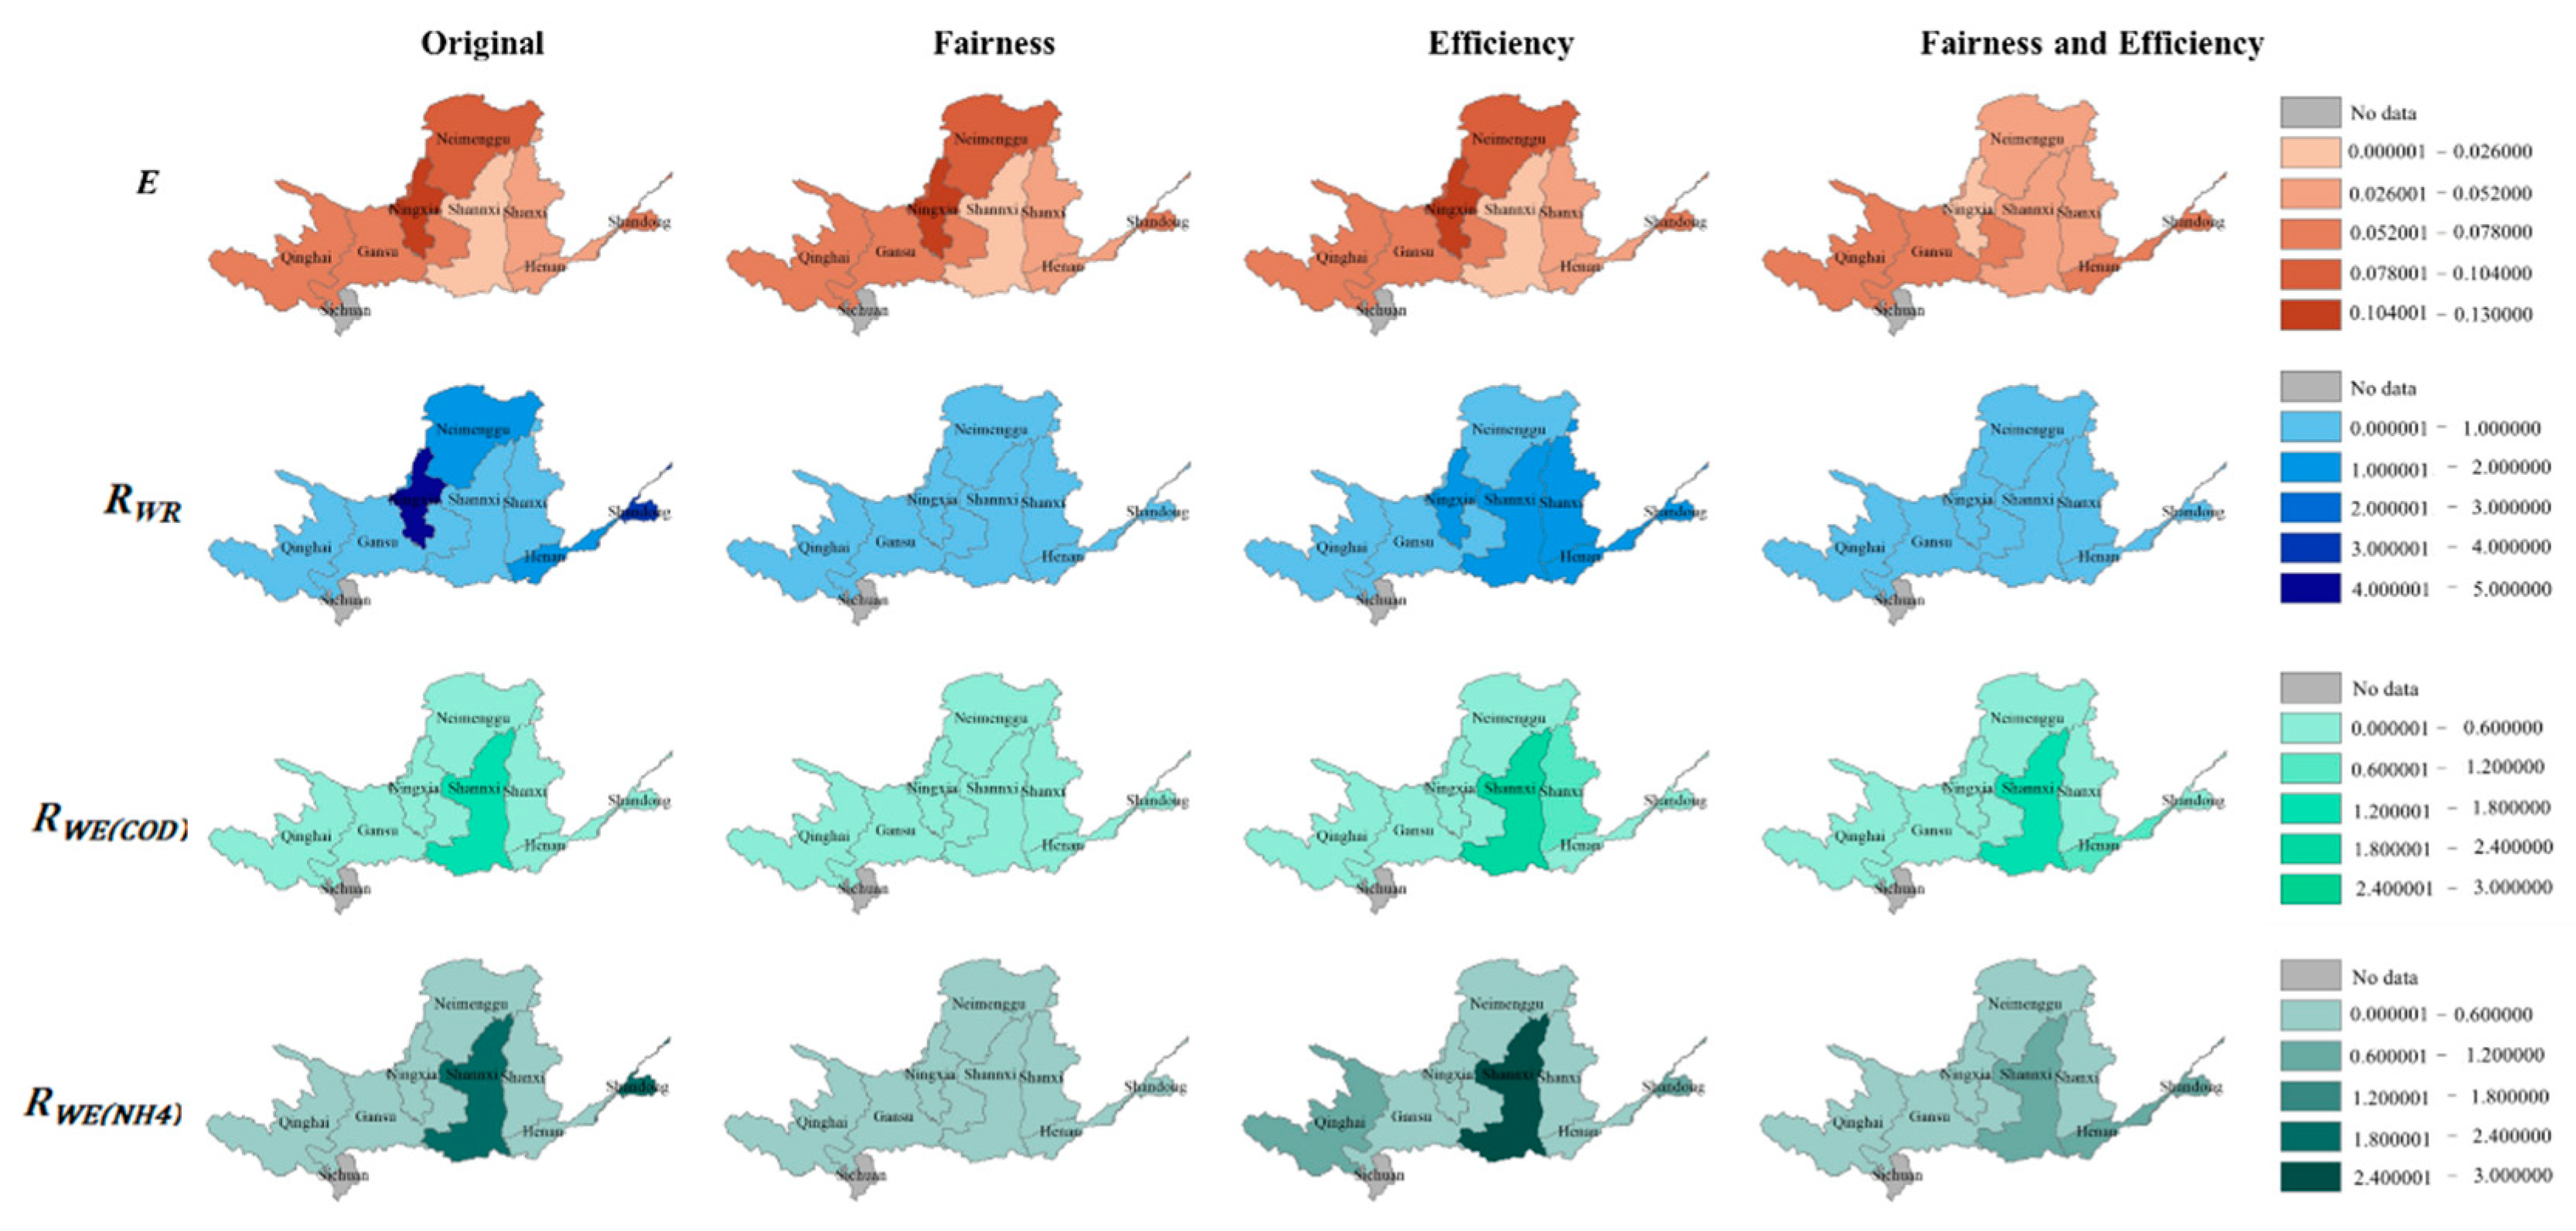
The evaluation results of the water resources carrying status show that there are four subareas with water resource carrying status overload (Ningxia, Neimenggu, Henan and Shandong) in the current situation (‘original’ scenario). In the ‘efficiency’ scenario, although the overloading rates of each subarea are balanced, the number of overloaded subareas increases. Because water use right is distributed according to the amount of water resources in the ‘fairness’ scenario, the carrying rate of each subarea and the whole basin are the same and not overloaded. In the ‘fairness and efficiency’ scenario, not only is the overload situation in some areas relieved (Ningxia, Neimenggu, Henan, Shandong), but the water resources carrying situation in the whole basin is also improved (from 0.6366 to 0.6124). This is attributed to the increase in the available water resources downstream affected by the decrease in upstream water consumption in this paper.
The assessment of water environmental carrying status shows that, except for the ‘fairness’ scenario, which distributes pollutant discharge rights according to environmental capacity with no overloading area, there are still some areas overloaded in the other three scenarios. Among them, in the ‘efficiency’ scenario, the water environmental carrying status (COD and NH4+-N) of Shannxi is seriously overloaded because more water and sewage are transported to the high-efficiency Shannxi areas. Under the scenario of ‘fairness and efficiency,’ through the IWRs transaction, the water environmental carrying rate (COD and NH4+-N) of some middle and upper streams (Qinghai, Gansu, Ningxia, Neimenggu, Shanxi) and the whole river basin decrease (the maximum decreasing values are 0.43 and 1.14, respectively), but the carrying status of the lower streams is not improved compared with the ‘original’ scenario because of more pollutant discharge. However, those overloaded subareas can take active pollution reduction measures to prevent the water environment from overloading.
Generally, the ‘fairness’ scenario has the best carrying status for the water resources and environment of the basin, and each subarea develops its economy according to its own natural endowment (water resources and water environment capacity), but the water use efficiency is not improved much compared with the current situation. The ‘efficiency’ scenario allocates allowable water use and pollutant discharge according to the current water efficiency; this can greatly improve the overall revenue of the basin, but has a poor impact on the sustainability of the basin, making the water resources and environment overload in the basin more serious. For the ‘fairness and efficiency’ scenario, on the one hand, the IWRs are allocated according to the principle of fairness in the initial allocation, giving priority to the resource carrying situation of the river basin to make the resource carrying situation better; on the other hand, through the secondary allocation (transaction), the water use efficiency of different areas is considered such that the benefits of the basin can be maximized as much as possible, and the sustainable development of the basin can be realized, which improves the current situation of water allocation and pollutant discharge rights on demand, to some extent.
However, this paper is only a preliminary study on the horizontal eco-compensation method of river basin-integrated water rights transactions, and there are still some limitations to be improved in further research. (1) The calculation results of water consumption per unit of GDP and the amount of water use are used instead of the total revenue of the subareas, and should be calculated specifically according to the actual situation in future research. (2) Only the rough scheme of IWRs allocation is obtained, without considering the feasibility in the actual water transfer process and the construction cost of water conservancy projects, etc. (3) Because the principle of fairness is based not only on the endowment of water resources and the environment, but also on regional population, economic output value, area, etc., different scenarios will be set up in the follow-up study, and the parameters (such as water price, pollution fee, minimum water consumption, etc.) will be refined to further explore what conditions or scenarios are reasonable for the IWRs allocation (transaction) scheme.
4. Conclusions
In this paper, a watershed horizontal eco-compensation mechanism based on the “quasi-market” transaction of IWRs is proposed. The dual attributes of water system quantity and quality are unified, and under the principles of fairness and efficiency, the redistribution of water use and sewage in the basin improves the economic benefits and the carrying capacity of resources and environment in the basin, providing a reference for exploring the eco-compensation mechanism of large-scale river basins.
With the IWRs scheme, the total amount of agricultural and industrial water use rights transactions and the COD and NH4+-N pollutant discharge transactions are obtained as 20.76 × 10⁸ m3, 20.09 × 10⁸ m3, 25.49 × 10⁴ tons and 2.43 × 10⁴ tons, respectively. Additionally, the scheme realizes the sustainable development of the Yellow River basin, to a certain extent, and improves the current issues of shortage, low utilization efficiency of water resources, and weak water environmental carrying capacity. Evidence for this improvement includes: (1) increased revenue to USD 244.71; (2) the water use efficiency in the middle and upper streams (Qinghai, Gansu, Ningxia, Neimenggu, Shanxi) and the overall river basin being obviously improved (maximum improvement value of 0.1273 m3/USD); (3) the overload situation of water resource carrying status in some subareas being relieved (Ningxia, Neimenggu, Henan, Shandong) and improved in the whole basin (from 0.6366 to 0.6124); (4) the water environmental carrying rate (COD and NH4+-N) of the middle and upper streams (Qinghai, Gansu, Ningxia, Neimenggu, Shanxi) and the whole river basin obviously decreasing (with maximum decreasing values of 0.43 and 1.14, respectively).
Supplementary Materials
The following supporting information can be downloaded at: https://www.mdpi.com/article/10.3390/w14172646/s1, Table S1: Database; Table S2: Parameters of four large reservoirs in Yellow River basin; Table S3: Average monthly water use by area; Table S4: Parameters for calibration; Table S5: Decision variables; Table S6: The average monthly discharge of reservoirs from 2015 to 2019.
Author Contributions
Conceptualization, Y.X. (Yuxi Xie) and W.Z.; Data curation, Y.X. (Yinglan Xue) and Y.Z.; Formal analysis, Y.X. (Yuxi Xie); Methodology, Y.X. (Yuxi Xie), W.Z. and Y.X. (Yinglan Xue); Software, Y.X. (Yinglan Xue); Supervision, W.Z.; Visualization, Y.X. (Yuxi Xie) and Y.Z.; Writing—original draft, Y.X. (Yuxi Xie). All authors have read and agreed to the published version of the manuscript.
Funding
This research was funded by National Natural Science Foundation of China, China(No.U20A2088); Major Science and Technology Program for Water Pollution Control and Treatment, China (No.2018ZX07111003). And The APC was funded by Major Science and Technology Program for Water Pollution Control and Treatment, China (No.2018ZX07111003).
Institutional Review Board Statement
Not applicable.
Informed Consent Statement
Not applicable.
Data Availability Statement
Not applicable.
Conflicts of Interest
We declare that we have no known competing financial interests or personal relationships that could have appeared to influence the work reported in this paper.
References
- Daily, G.C. Nature’s Services: Societal Dependence on Natural Ecosystems; Island Press: Washington, DC, USA, 1997. [Google Scholar]
- Costanza, R.; Arge, A.R.; Groot, R.D.; Farber, S.; Grasso, M.; Hannon, B.; Limburg, K.; Naeem, S.; O’Neill, R.V.; Paruelo, J.; et al. The value of the world’s ecosystem services and natural capital. Ecol. Econ. 1997, 25, 3–15. [Google Scholar] [CrossRef]
- Cheng, Y. Models of Payment for Watershed Ecological Service in China—A Case Study on Jinhua River, Zhejiang Province. Ph.D. Thesis, Chinese Academy of Agricultural Science, Beijing, China, 2006. (In Chinese). [Google Scholar] [CrossRef]
- Liu, Y.; Bi, J. Review on theories and payment standards of ecological compensation in watersheds. J. Econ. Water Resour. 2018, 36, 10–15. (In Chinese) [Google Scholar] [CrossRef]
- Bellver-Domingo, A.; Hernandez-Sancho, F.; Molinos-Senante, M. A review of payment for ecosystem services for the economic internalization of environmental externalities: A water perspective. Geoforum 2016, 70, 115–118. [Google Scholar] [CrossRef]
- Zbinden, S.; Lee, D.R. Paying for environmental services: An analysis of participation in Costa Rica’s PSA program. World Dev. 2005, 33, 255–272. [Google Scholar] [CrossRef]
- Zhuang, D. Study on ecological compensation standards and ecological compensation mechanism of River Basins. Environ. Dev. 2019, 31, 219–220. (In Chinese) [Google Scholar]
- Xiao, M. Study on the Ecological Compensation System of Jialing River Basin. Ph.D. Thesis, Hebei GEO University, Shijiazhuang, China, 2019. (In Chinese). [Google Scholar]
- Cheng, Y.; Wu, D.; Bian, Y. A systematic approach of determining compensation and allocation for river basin water environment based on total pollutants contro. J. Environ. Manag. 2020, 271, 110896. [Google Scholar] [CrossRef]
- Lin, Y.; Dong, Z.; Zhang, W.; Zhang, H. Estimating inter-regional payments for ecosystem services: Taking China’s Beijing-Tianjin-Hebei region as an example. Ecol. Econ. 2019, 168, 106514. [Google Scholar] [CrossRef]
- Xu, J.; Xiao, Y.; Xie, G.; Liu, J.; Qin, K.; Wang, Y.; Zhang, C.; Lei, G. How to coordinate cross-regional water resource relationship by integrating water supply services flow and interregional ecological compensation. Ecol. Indic. 2021, 126, 107595. [Google Scholar] [CrossRef]
- Liu, G.; Wen, Y.; Zhang, H. Comparative study on standardized accounting methods for watershed eco-compensation. Adv. Sci. Technol. Water Resour. 2011, 6, 5–10. (In Chinese) [Google Scholar] [CrossRef]
- He, T.; Lu, Y.; Cui, Y.; Luo, Y.; Wang, M.; Meng, W.; Zhang, K.; Zhao, F. Detecting gradual and abrupt changes in water quality time series in response to regional payment programs for watershed services in an agricultural area. J. Hydrol. 2015, 525, 457–471. [Google Scholar] [CrossRef]
- Liu, Y.; Mao, D. Integrated assessment of water quality characteristics and ecological compensation in the Xiangjiang River, south-central China. Ecol. Indic. 2020, 110, 105922. [Google Scholar] [CrossRef]
- Wei, X. Construction of the primary market of river basin water integrated transaction with consideration of water rights and emission rights-Taking the catering and accommodation industry in Dali City of Erhai River Basin as an example. Ph.D. Thesis, Beijing Normal University, Beijing, China, 2018. (In Chinese). [Google Scholar]
- Wang, W.; Wu, F.; Yu, H. Optimal design of the ecological compensation mechanism in transboundary river basins under the Belt and Road Initiative. Sustain. Prod. Consum. 2022, 32, 173–183. [Google Scholar] [CrossRef]
- Li, W.A.; Tla, B.; Xz, B.; Han, H.A.; Xiao, C.C. Global research trends and gaps in ecological compensation studies from 1990 to 2020: A scientometric review. J. Nat. Conserv. 2022, 65, 126097. [Google Scholar]
- Martin-Ortega, J.; Ojea, E.; Roux, C. Payments for Water Ecosystem Services in Latin America: A literature review and conceptual model. Ecosyst. Serv. 2013, 6, 122–132. [Google Scholar] [CrossRef]
- Zhao, H.; Zhang, Y.; Wang, X. Research on calculating methods of watershed ecological compensation standard in China. Environ. Sci. Manag. (In Chinese). 2014, 39, 151–154. [Google Scholar] [CrossRef]
- Hausknost, D.; Grima, N.; Singh, S.J. The political dimensions of Payments for Ecosystem Services (PES): Cascade or stairway? Ecol. Econ. 2017, 131, 109–118. [Google Scholar] [CrossRef]
- Wunder, S. Payments for Environmental Services: Some Nuts and Bolts; CIFOR Occasional Paper No. 42.; Centre for International Forestry Research: Bogor, Indonesia, 2005; Available online: http://hdl.handle.net/10919/66932 (accessed on 10 November 2021).
- Engel, S.; Pagiola, S.; Wunder, S. Designing payments for environmental services in theory and practice: An overview of the issues. Ecol. Econ. 2008, 65, 663–674. [Google Scholar] [CrossRef]
- Engel, S.; Palmer, C. Payments for environmental services as an alternative to logging under weak property rights: The case of Indonesia. Ecol. Econ. 2008, 65, 799–809. [Google Scholar] [CrossRef]
- Ouyang, Z.Y.; Zheng, H.; Yue, P. Establishment of ecological compensation mechanisms in China: Perspectives and strategies. Acta Ecol. Sin. 2013, 33, 686–692. (In Chinese) [Google Scholar] [CrossRef]
- Dou, H.S.; Li, X.B.; Li, S.K.; Dang, D.L.; Li, X.; Lyu, X.; Li, M.Y.; Liu, S.Y. Mapping ecosystem services bundles for analyzing spatial trade-offs in Inner Mongolia, China. J. Clean Prod. 2020, 256, 120444. [Google Scholar] [CrossRef]
- Jin, L.; Wu, L. Achievements, Challenges and Transformation of China’s Ecological Compensation. Environ. Prot. 2018, 046, 7–13. (In Chinese) [Google Scholar]
- Jin, L. How should the compensation mechanism for ecological protection be “supplemented”? China Rep. 2019, 6, 56–57. (In Chinese) [Google Scholar]
- Sheng, J.; Qiu, W.; Han, X. China’s PES-like horizontal eco-compensation program: Combining market-oriented mechanisms and government interventions. Ecosyst. Serv. 2020, 45, 101164. [Google Scholar] [CrossRef]
- Peng, J. The Generating mechanism, value embodiment and path reconstruction of the water-energy-food nexus in the Yellow River basin. Contemp. Econ. Manag. 2021, 43, 76–81. (In Chinese) [Google Scholar] [CrossRef]
- Salzman, J.; Bennett, G.; Carroll, N.; Goldstein, A.; Jenkins, M. The global status and trends of Payments for Ecosystem Services. Nat. Sustain. 2018, 1, 136–144. [Google Scholar] [CrossRef]
- Delavar, M.; Morid, S.; Morid, R.; Farokhnia, A.; Karimi, P. Basin-wide water accounting based on modified swat model and wa+ framework for better policy making. J. Hydrol. 2020, 585, 124762. [Google Scholar] [CrossRef]
- Tan, M.L.; Gassman, P.; Yang, X.; Haywood, J. A review of swat applications, performance and future needs for simulation of hydro-climatic extremes. Adv. Water Resour. 2020, 143, 103662. [Google Scholar] [CrossRef]
- Wang, Q.; Qi, J.; Li, J.; Cole, J.; Zhang, X. Sensitivity of nitrate loading projection to freeze-thaw cycle representation. Water Res. 2020, 186, 116355. [Google Scholar] [CrossRef]
- Zhang, R. The study of the Yellow River valley runoff in Ningxia Hui autonomous region based on SWAT model. Ph.D. Thesis, Southwest University, Chongqing, China, 2014. (In Chinese). [Google Scholar]
- Jing, Y.; Wang, L.; Wei, X. Impacts of climate change on runoff of Jinghe river cased on SWAT model. NONGYE JIXIE XUEBAO 2017, 48, 9. (In Chinese) [Google Scholar] [CrossRef]
- Ji, G. Geographical calculation of runoff change and drought and flood disasters dynamics in the Yellow River Basin under future climate change. Ph.D. Thesis, East China Normal University, Shanghai, China, 2020. (In Chinese). [Google Scholar] [CrossRef]
- Xu, Z.; Zhang, S.; Yang, X. Water and sediment yield response to extreme rainfall events in a complex large river basin: A case study of the Yellow River Basin, China. J. Hydrol. 2021, 597, 126183. [Google Scholar] [CrossRef]
- Engel, B.; Storm, D.; White, M.; Arnold, J.; Arabi, M. A hydrologic/water quality model application protocol. J. Am. Water Resour. Assoc. 2007, 43, 1223–1226. [Google Scholar] [CrossRef]
- Moriasi, D.N.; Arnold, J.G.; Van Liew, M.W.; Bingner, R.L.; Harmel, R.D.; Veith, T.L. Model evaluation guidelines for systematic quantification of accuracy in watershed simulations. Trans. ASABE 2007, 50, 885–900. [Google Scholar] [CrossRef]
Figure 1.
Location, river distribution, and other information of the Yellow River basin.

Figure 2.
The IWRs transaction can increase marginal benefits (economy, resources, environment).

Figure 3.
Grouping of parameter calibration.

Figure 4.
IWRs transaction scheme. (a): Transaction of agricultural water use rights. (b): Transaction of industrial water use rights. (c): Transaction of COD pollutant discharging rights. (d): Transaction of NH4+-N pollutant discharging rights.
Figure 4.
IWRs transaction scheme. (a): Transaction of agricultural water use rights. (b): Transaction of industrial water use rights. (c): Transaction of COD pollutant discharging rights. (d): Transaction of NH4+-N pollutant discharging rights.

Figure 5.
The gap of total water use, pollutant discharge and revenue under different scenarios. (a): The gap of total water use. (b): The gap of COD pollutant discharge. (c): The gap of NH4+-N pollutant discharge. (d): The gap of revenue.
Figure 5.
The gap of total water use, pollutant discharge and revenue under different scenarios. (a): The gap of total water use. (b): The gap of COD pollutant discharge. (c): The gap of NH4+-N pollutant discharge. (d): The gap of revenue.

Figure 6.
Calculation results of water use efficiency, water resource carrying rate, and water environment carrying rate in different scenarios.
Figure 6.
Calculation results of water use efficiency, water resource carrying rate, and water environment carrying rate in different scenarios.

Figure 7.
Spatial distribution of water use efficiency, water resource carrying rate, and water environment carrying rate in different scenarios.
Figure 7.
Spatial distribution of water use efficiency, water resource carrying rate, and water environment carrying rate in different scenarios.


Table 1.
Calibration results.
| Station | Location | Sub-Basins | R2 | NSE | Parameters * | |||||||||
|---|---|---|---|---|---|---|---|---|---|---|---|---|---|---|
| ALPHA_BF | GW_DELAY | GWQMN | REVEP_MN | ESCO | SLOPE | CH_KII | CH_NII | SOL_AWC | SOL_K | |||||
| Tangnaihai | 47 | 47, 48, 49 | 0.74 | 0.69 | 0.05 | 22.97 | 2676.48 | 338.17 | 0.96 | −0.06 | 230.37 | 0.18 | 0.15 | 0.21 |
| Lanzhou | 27 | 23, 24, 25, 26, 27, 28, 29, 30, 45 | 0.70 | 0.30 | 0.07 | 0.89 | 2729.83 | 391.50 | 0.96 | 0.03 | 216.09 | 0.19 | 0.19 | 0.42 |
| Shizuishan | 8 | 7, 8, 9, 13, 14, 16, 19, 20 | 0.71 | 0.49 | 0.16 | 30.69 | 4226.46 | 330.69 | 0.95 | −0.10 | 169.60 | 0.07 | 0.11 | −0.06 |
| Toudaoguai | 6 | 1, 2, 3, 4, 5, 6 | 0.61 | 0.60 | 0.75 | 30.00 | 1913.34 | 181.35 | 0.85 | −0.01 | 164.42 | 0.19 | 0.04 | 0.31 |
| Sanmenxia | 39 | 32, 33, 34, 35, 36, 37, 38, 39, 40, 41, 42, 43, 44, 46 | 0.56 | 0.31 | 0.40 | 30.00 | 1660.01 | 250.00 | 0.99 | −0.02 | 247.04 | 0.14 | −0.08 | 0.18 |
* For detailed explanation of parameters, see Table S4 in Supplementary Material.
Table 2.
Influence matrix of upstream water use on downstream IWRs.
| Water Resource Amount (108 m3) | Qinghai | Gansu | Ningxia | Neimenggu | Shanxi | Shannxi | Henan | Shandong |
| Qinghai | / | / | / | / | / | / | / | / |
| Gansu | 0.63 | / | / | / | / | / | / | / |
| Ningxia | 0.55 | 0.52 | / | / | / | / | / | / |
| Neimenggu | 0.48 | 0.44 | 0.45 | / | / | / | / | / |
| Shanxi | 0.20 | 0.18 | 0.18 | 0.17 | / | / | / | / |
| Shannxi | 0.20 | 0.18 | 0.18 | 0.17 | / | / | / | / |
| Henan | 0.38 | 0.35 | 0.36 | 0.33 | 0.22 | 0.22 | / | / |
| Shandong | 0.38 | 0.35 | 0.36 | 0.33 | 0.22 | 0.22 | 0.34 | / |
| Total | 2.82 | 2.02 | 1.53 | 1.00 | 0.44 | 0.44 | 0.34 | / |
| Water environmental capacity COD (102 tons) | Qinghai | Gansu | Ningxia | Neimenggu | Shanxi | Shannxi | Henan | Shandong |
| Qinghai | 3.68 | / | / | / | / | / | / | / |
| Gansu | 7.08 | 1.58 | / | / | / | / | / | / |
| Ningxia | 6.66 | 6.34 | 1.98 | / | / | / | / | / |
| Neimenggu | 3.72 | 3.50 | 3.67 | 0.98 | / | / | / | / |
| Shanxi | 1.99 | 1.85 | 1.91 | 1.69 | 0.66 | / | / | / |
| Shannxi | 1.99 | 1.85 | 1.91 | 1.69 | 0.66 | 0.66 | / | / |
| Henan | 7.76 | 7.33 | 7.55 | 6.93 | 4.63 | 4.63 | 4.42 | / |
| Shandong | 6.62 | 6.25 | 6.44 | 5.94 | 3.92 | 3.92 | 6.08 | / |
| Total | 39.50 | 28.70 | 23.46 | 17.23 | 9.87 | 9.21 | 10.50 | / |
| Water environmental capacity NH4+-N (102 tons) | Qinghai | Gansu | Ningxia | Neimenggu | Shanxi | Shannxi | Henan | Shandong |
| Qinghai | 0.24 | / | / | / | / | / | / | / |
| Gansu | 0.37 | 0.08 | / | / | / | / | / | / |
| Ningxia | 0.45 | 0.43 | 0.13 | / | / | / | / | / |
| Neimenggu | 0.59 | 0.55 | 0.58 | 0.07 | / | / | / | / |
| Shanxi | 0.19 | 0.17 | 0.18 | 0.16 | 0.07 | / | / | / |
| Shannxi | 0.19 | 0.17 | 0.18 | 0.16 | 0.07 | 0.07 | / | / |
| Henan | 0.70 | 0.66 | 0.68 | 0.63 | 0.42 | 0.42 | 0.33 | / |
| Shandong | 0.14 | 0.13 | 0.13 | 0.12 | 0.08 | 0.08 | 0.13 | / |
| Total | 2.87 | 2.19 | 1.88 | 1.14 | 0.64 | 0.57 | 0.46 | / |
Table 3.
Initial IWRs allocated according to principle of fairness.
| Indicator (Unit) | Water Resources (108 m3) | Water Environmental Capacity-(104 tons) | Initial Water Use Rights (108 m3) | Initial Pollutant Discharge Rights-(104 tons) | ||
|---|---|---|---|---|---|---|
| COD | NH4+-N | COD | NH4+-N | |||
| Qinghai | 307.89 | 8.55 | 0.46 | 196.02 | 3.30 | 0.19 |
| Gansu | 172.59 | 16.72 | 0.92 | 109.88 | 6.44 | 0.38 |
| Ningxia | 14.70 | 23.21 | 1.58 | 9.36 | 8.95 | 0.65 |
| Neimenggu | 59.50 | 13.39 | 2.11 | 37.88 | 5.16 | 0.87 |
| Shanxi | 73.81 | 14.15 | 1.46 | 46.99 | 5.46 | 0.60 |
| Shannxi | 101.54 | 6.27 | 0.39 | 64.65 | 2.42 | 0.16 |
| Henan | 45.39 | 32.93 | 3.03 | 28.90 | 12.69 | 1.25 |
| Shandong | 27.41 | 22.79 | 0.49 | 17.45 | 8.78 | 0.20 |
| Yellow River basin | 802.83 | 138.02 | 10.45 | 511.12 | 53.20 | 4.33 |
Publisher’s Note: MDPI stays neutral with regard to jurisdictional claims in published maps and institutional affiliations. |
© 2022 by the authors. Licensee MDPI, Basel, Switzerland. This article is an open access article distributed under the terms and conditions of the Creative Commons Attribution (CC BY) license (https://creativecommons.org/licenses/by/4.0/).
Share and Cite
MDPI and ACS Style
Xie, Y.; Zeng, W.; Xue, Y.; Zhuo, Y. Realizing Sustainable Development of Yellow River Basin by Horizontal Eco-Compensation Based on Integrated Water Rights (IWRs) Transactions. Water 2022, 14, 2646. https://doi.org/10.3390/w14172646
AMA Style
Xie Y, Zeng W, Xue Y, Zhuo Y. Realizing Sustainable Development of Yellow River Basin by Horizontal Eco-Compensation Based on Integrated Water Rights (IWRs) Transactions. Water. 2022; 14(17):2646. https://doi.org/10.3390/w14172646
Chicago/Turabian StyleXie, Yuxi, Weihua Zeng, Yinglan Xue, and Yue Zhuo. 2022. "Realizing Sustainable Development of Yellow River Basin by Horizontal Eco-Compensation Based on Integrated Water Rights (IWRs) Transactions" Water 14, no. 17: 2646. https://doi.org/10.3390/w14172646
Note that from the first issue of 2016, this journal uses article numbers instead of page numbers. See further details here.