
Numerical Analysis of the Influence of Foundation Replacement Materials on the Hydrothermal Variation and Deformation Process of Highway Subgrades in Permafrost Regions


Abstract
:1. Introduction
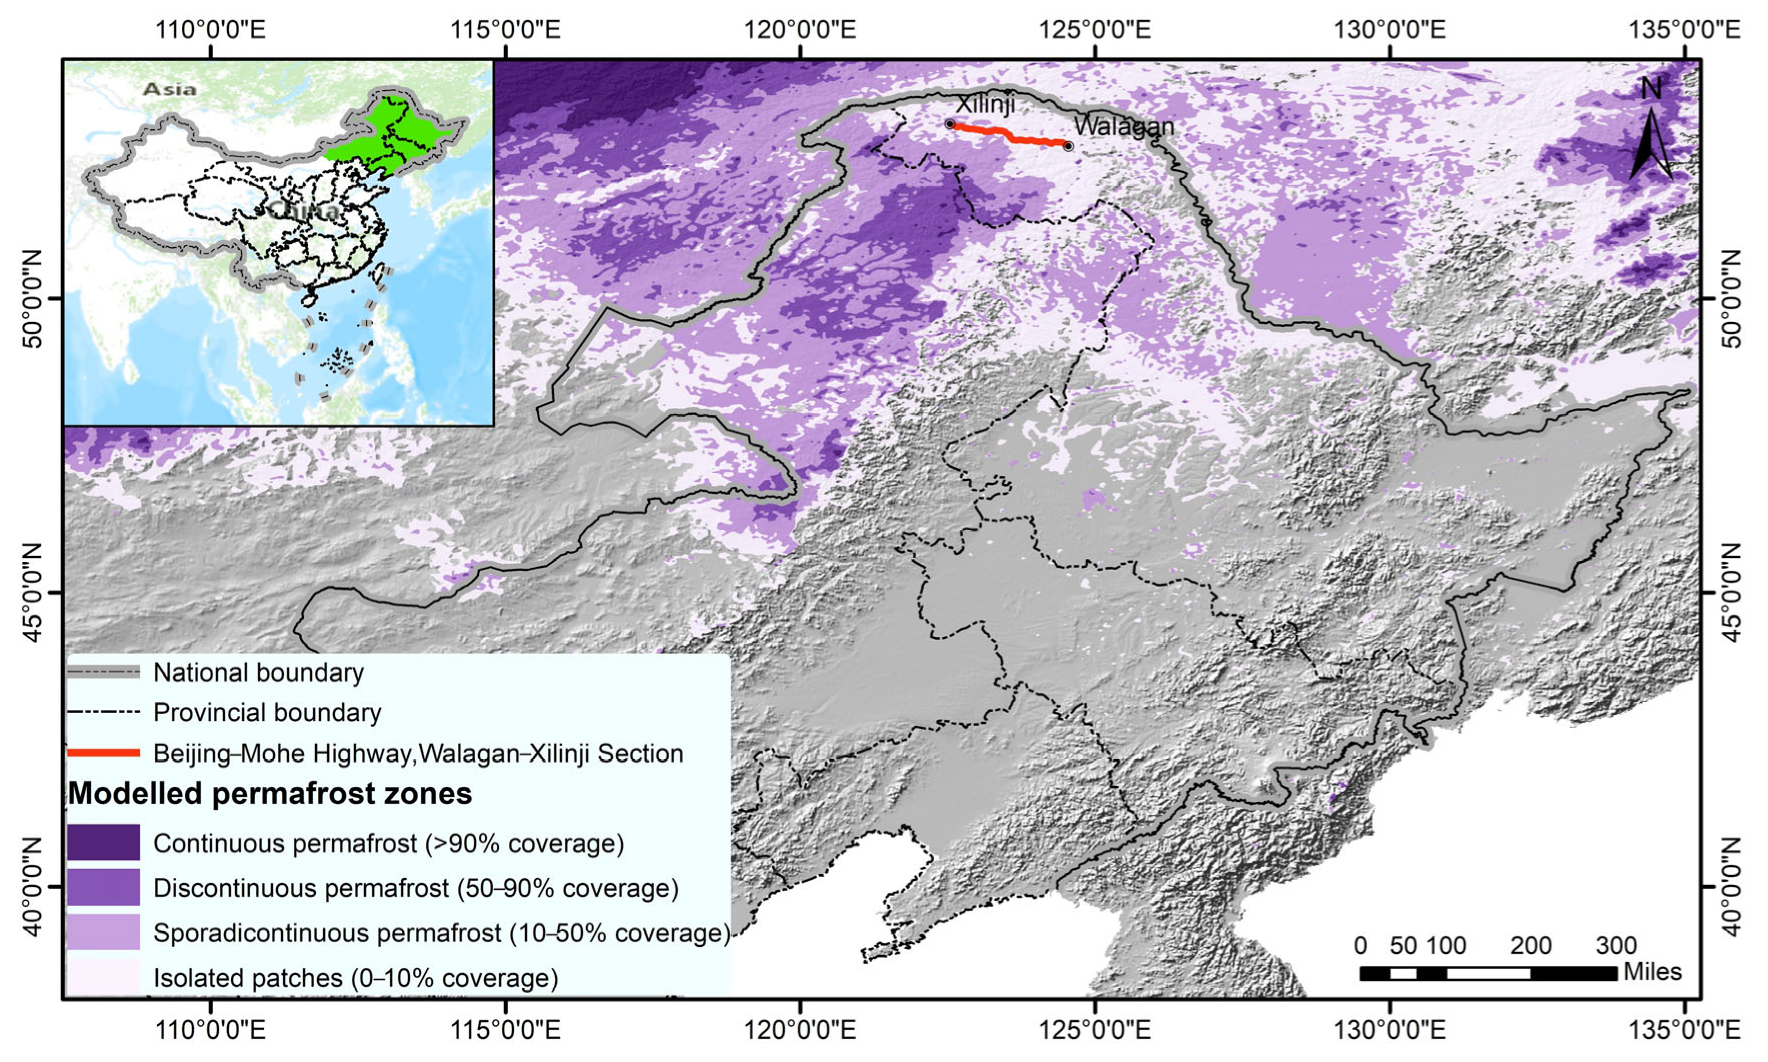
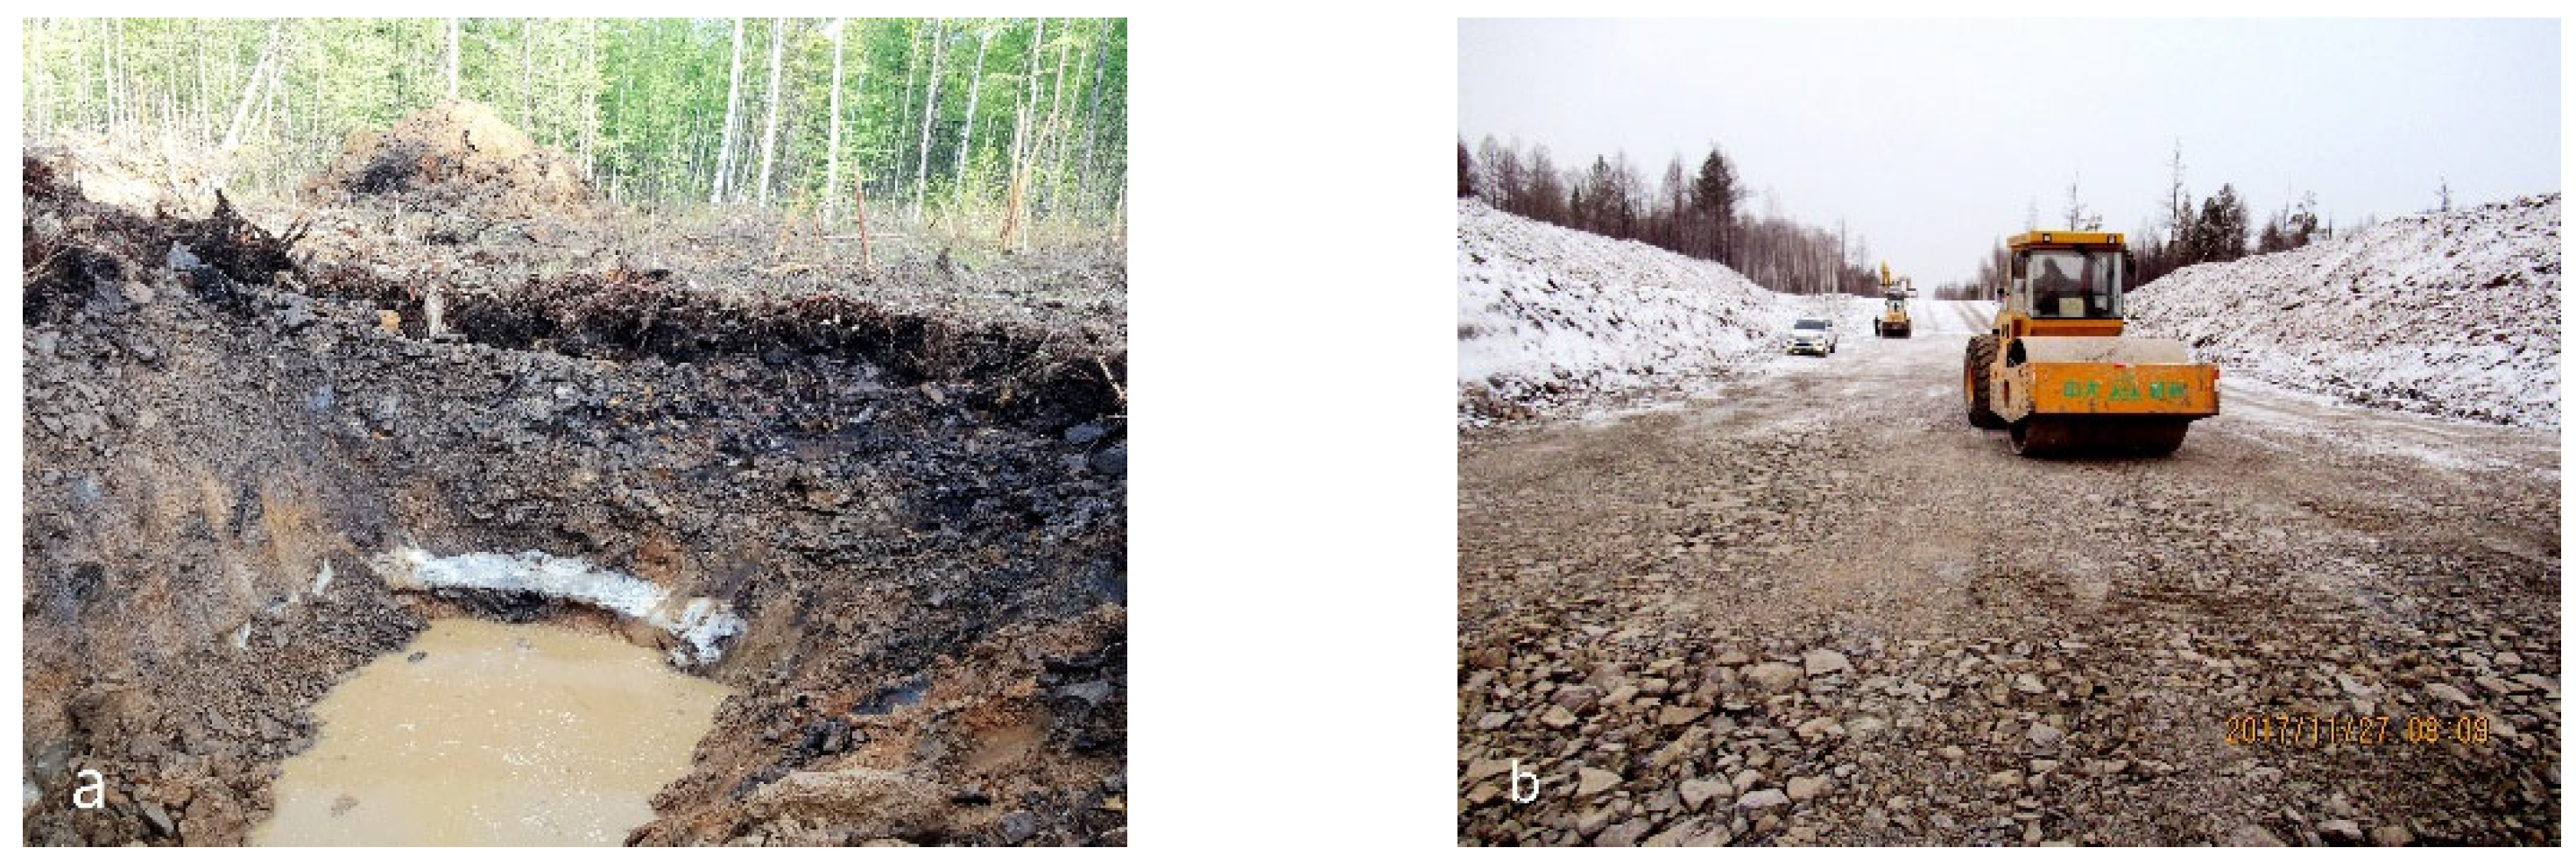
2. Study Area
3. Model Description
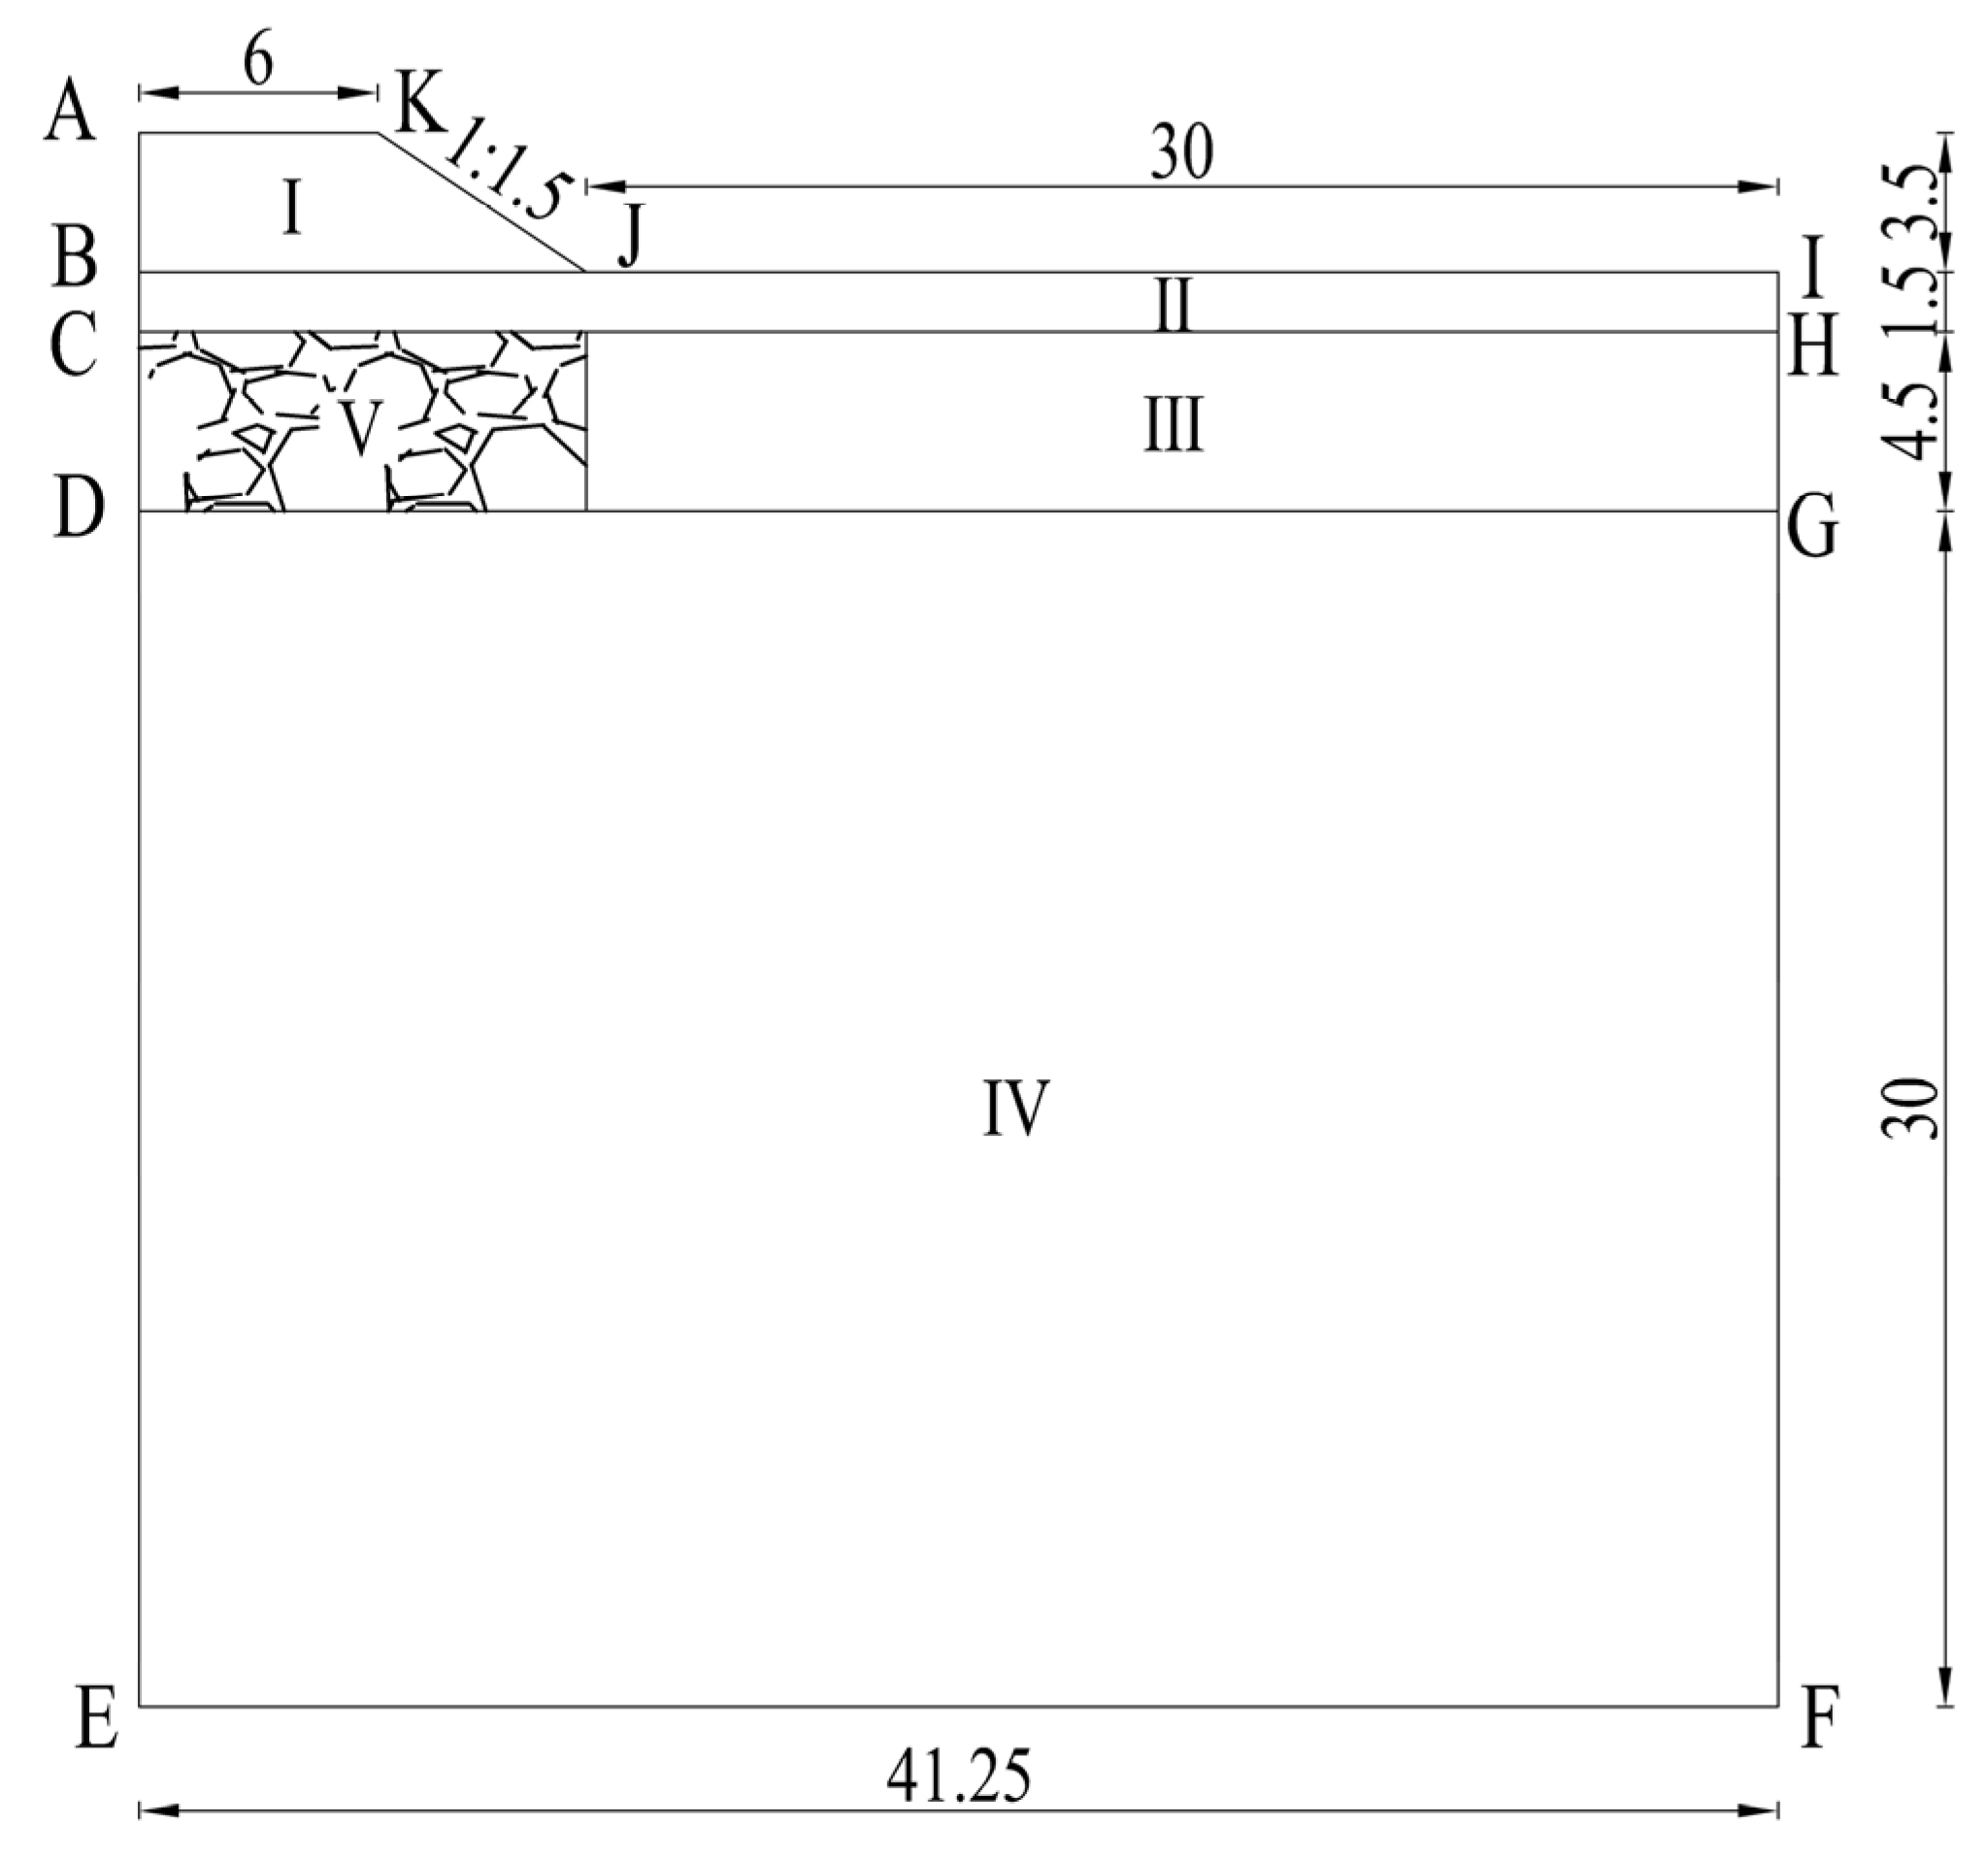
3.1. Geometric Model
3.2. Mathematical Model
3.3. Parameters of the Soil Layers
3.4. Boundary Conditions
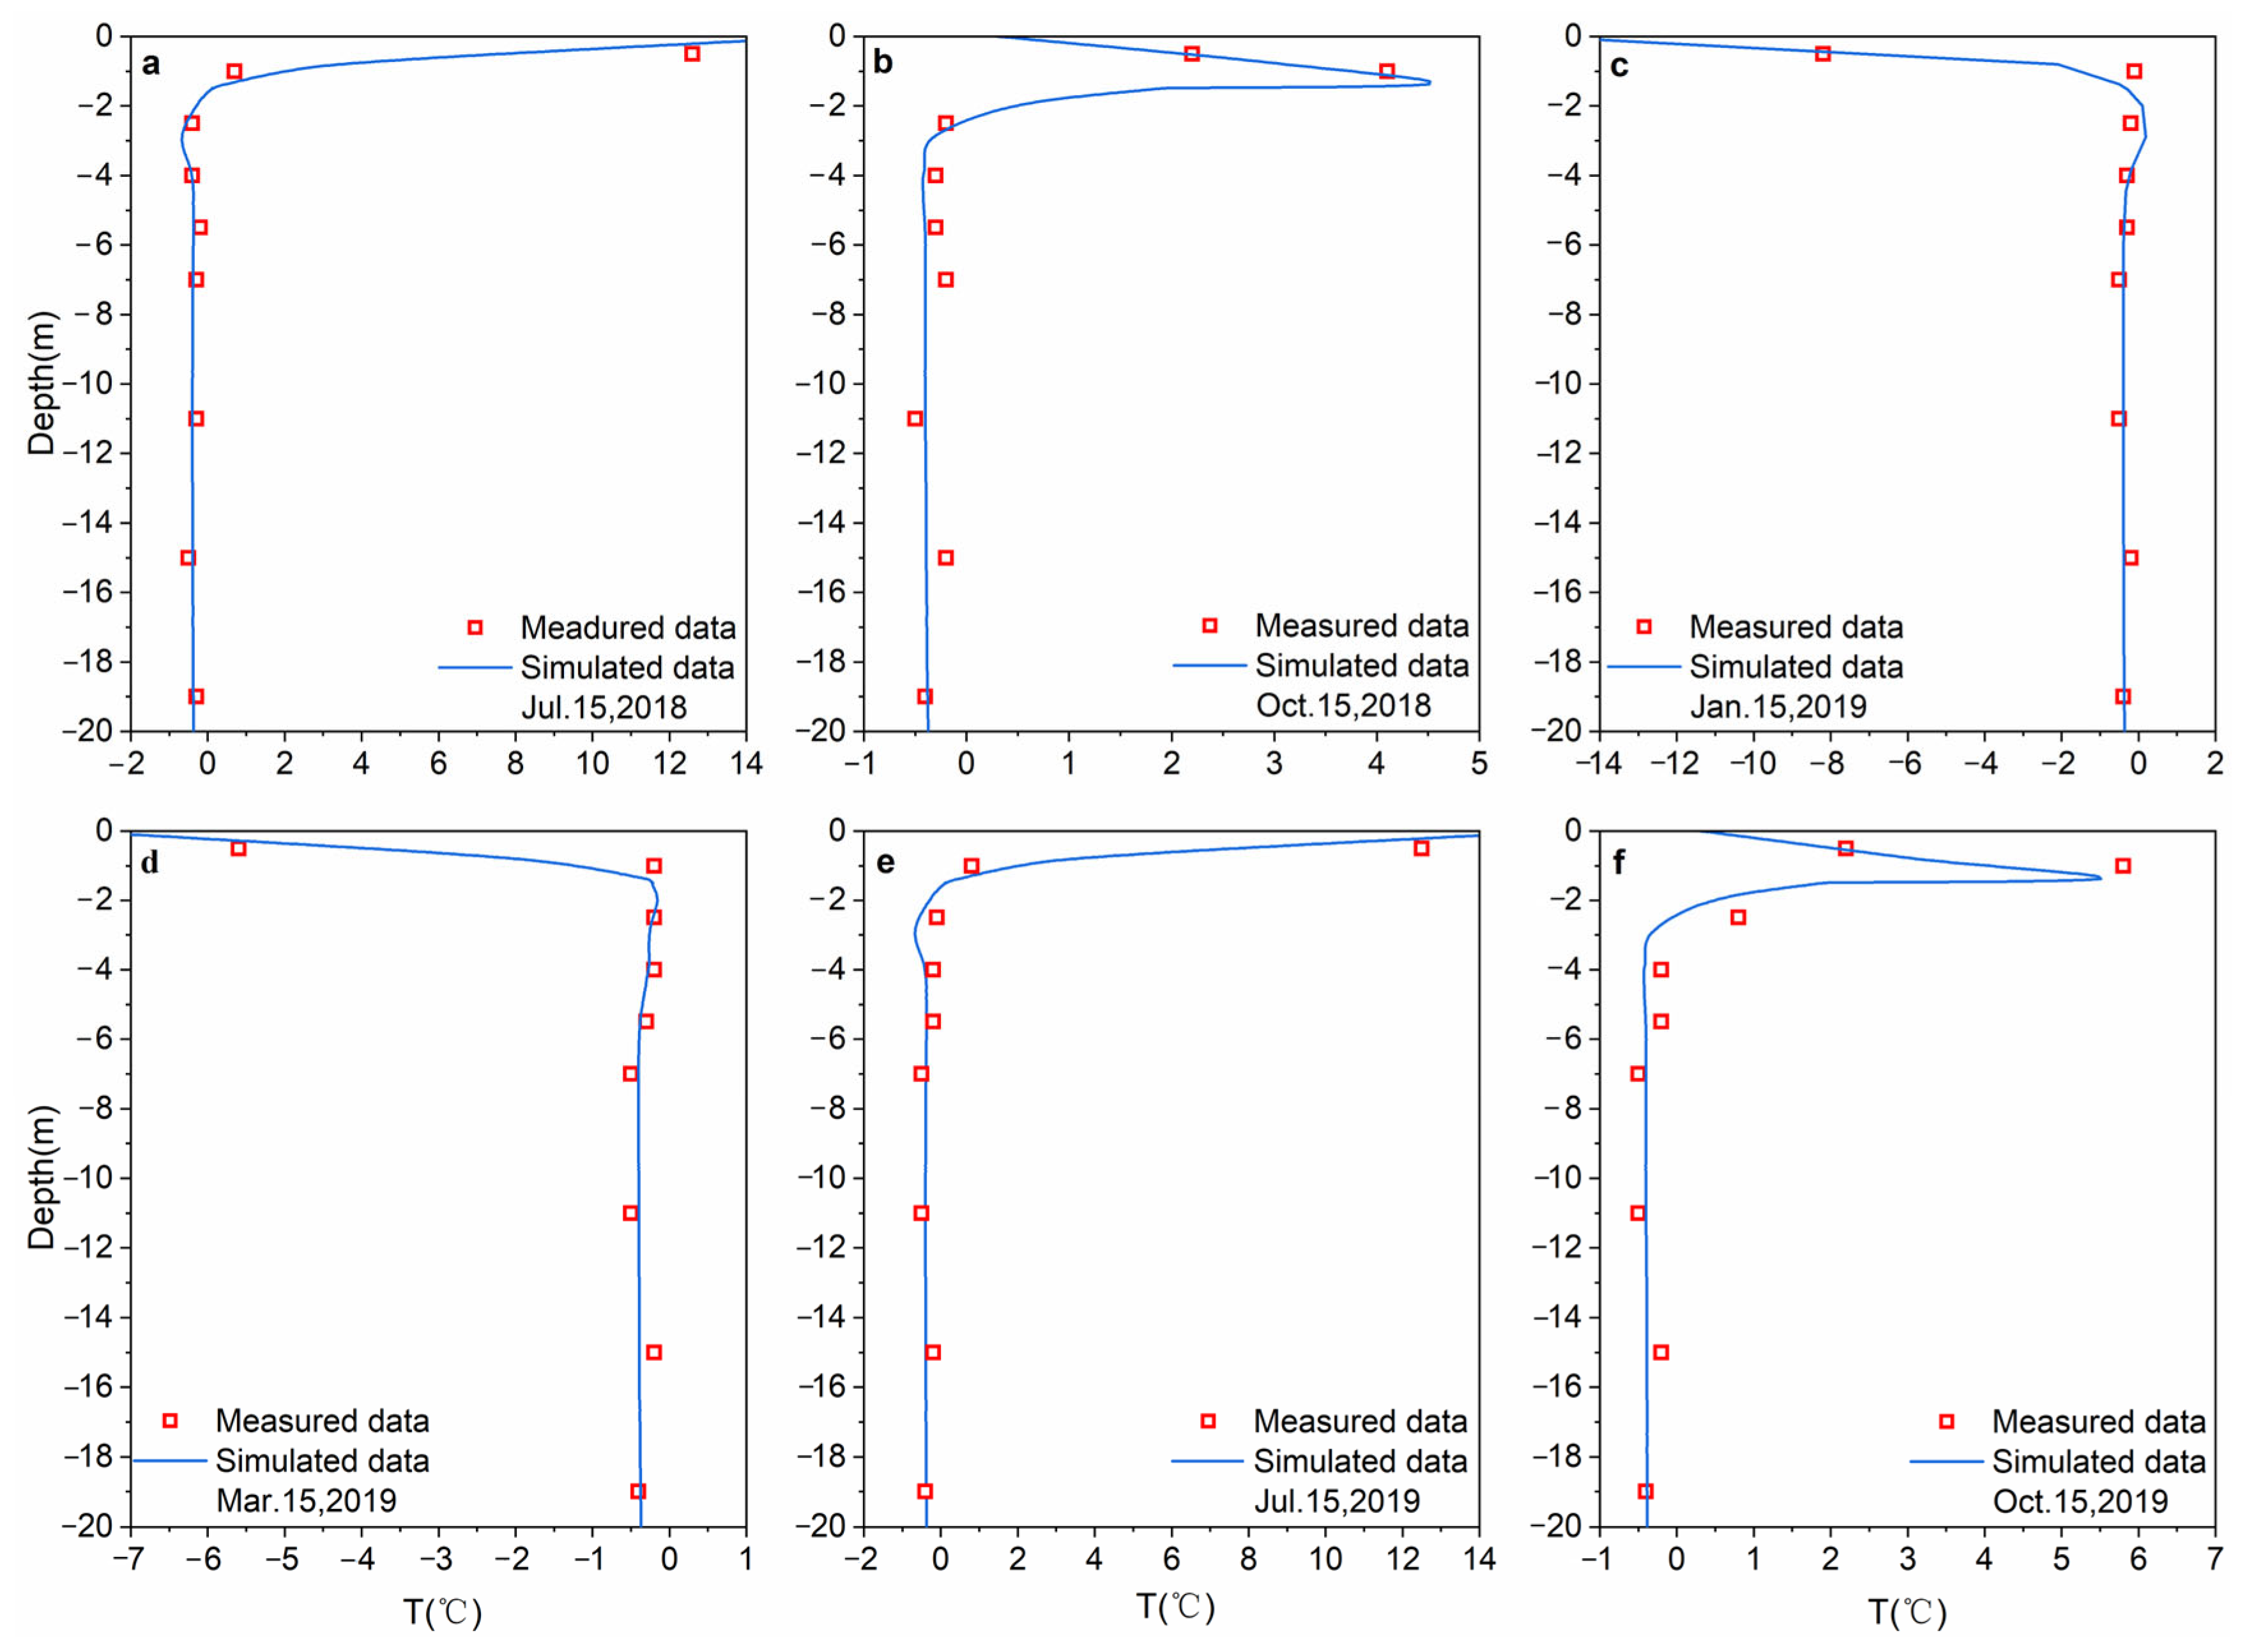
3.5. Initial Conditions and Model Verification
4. Results
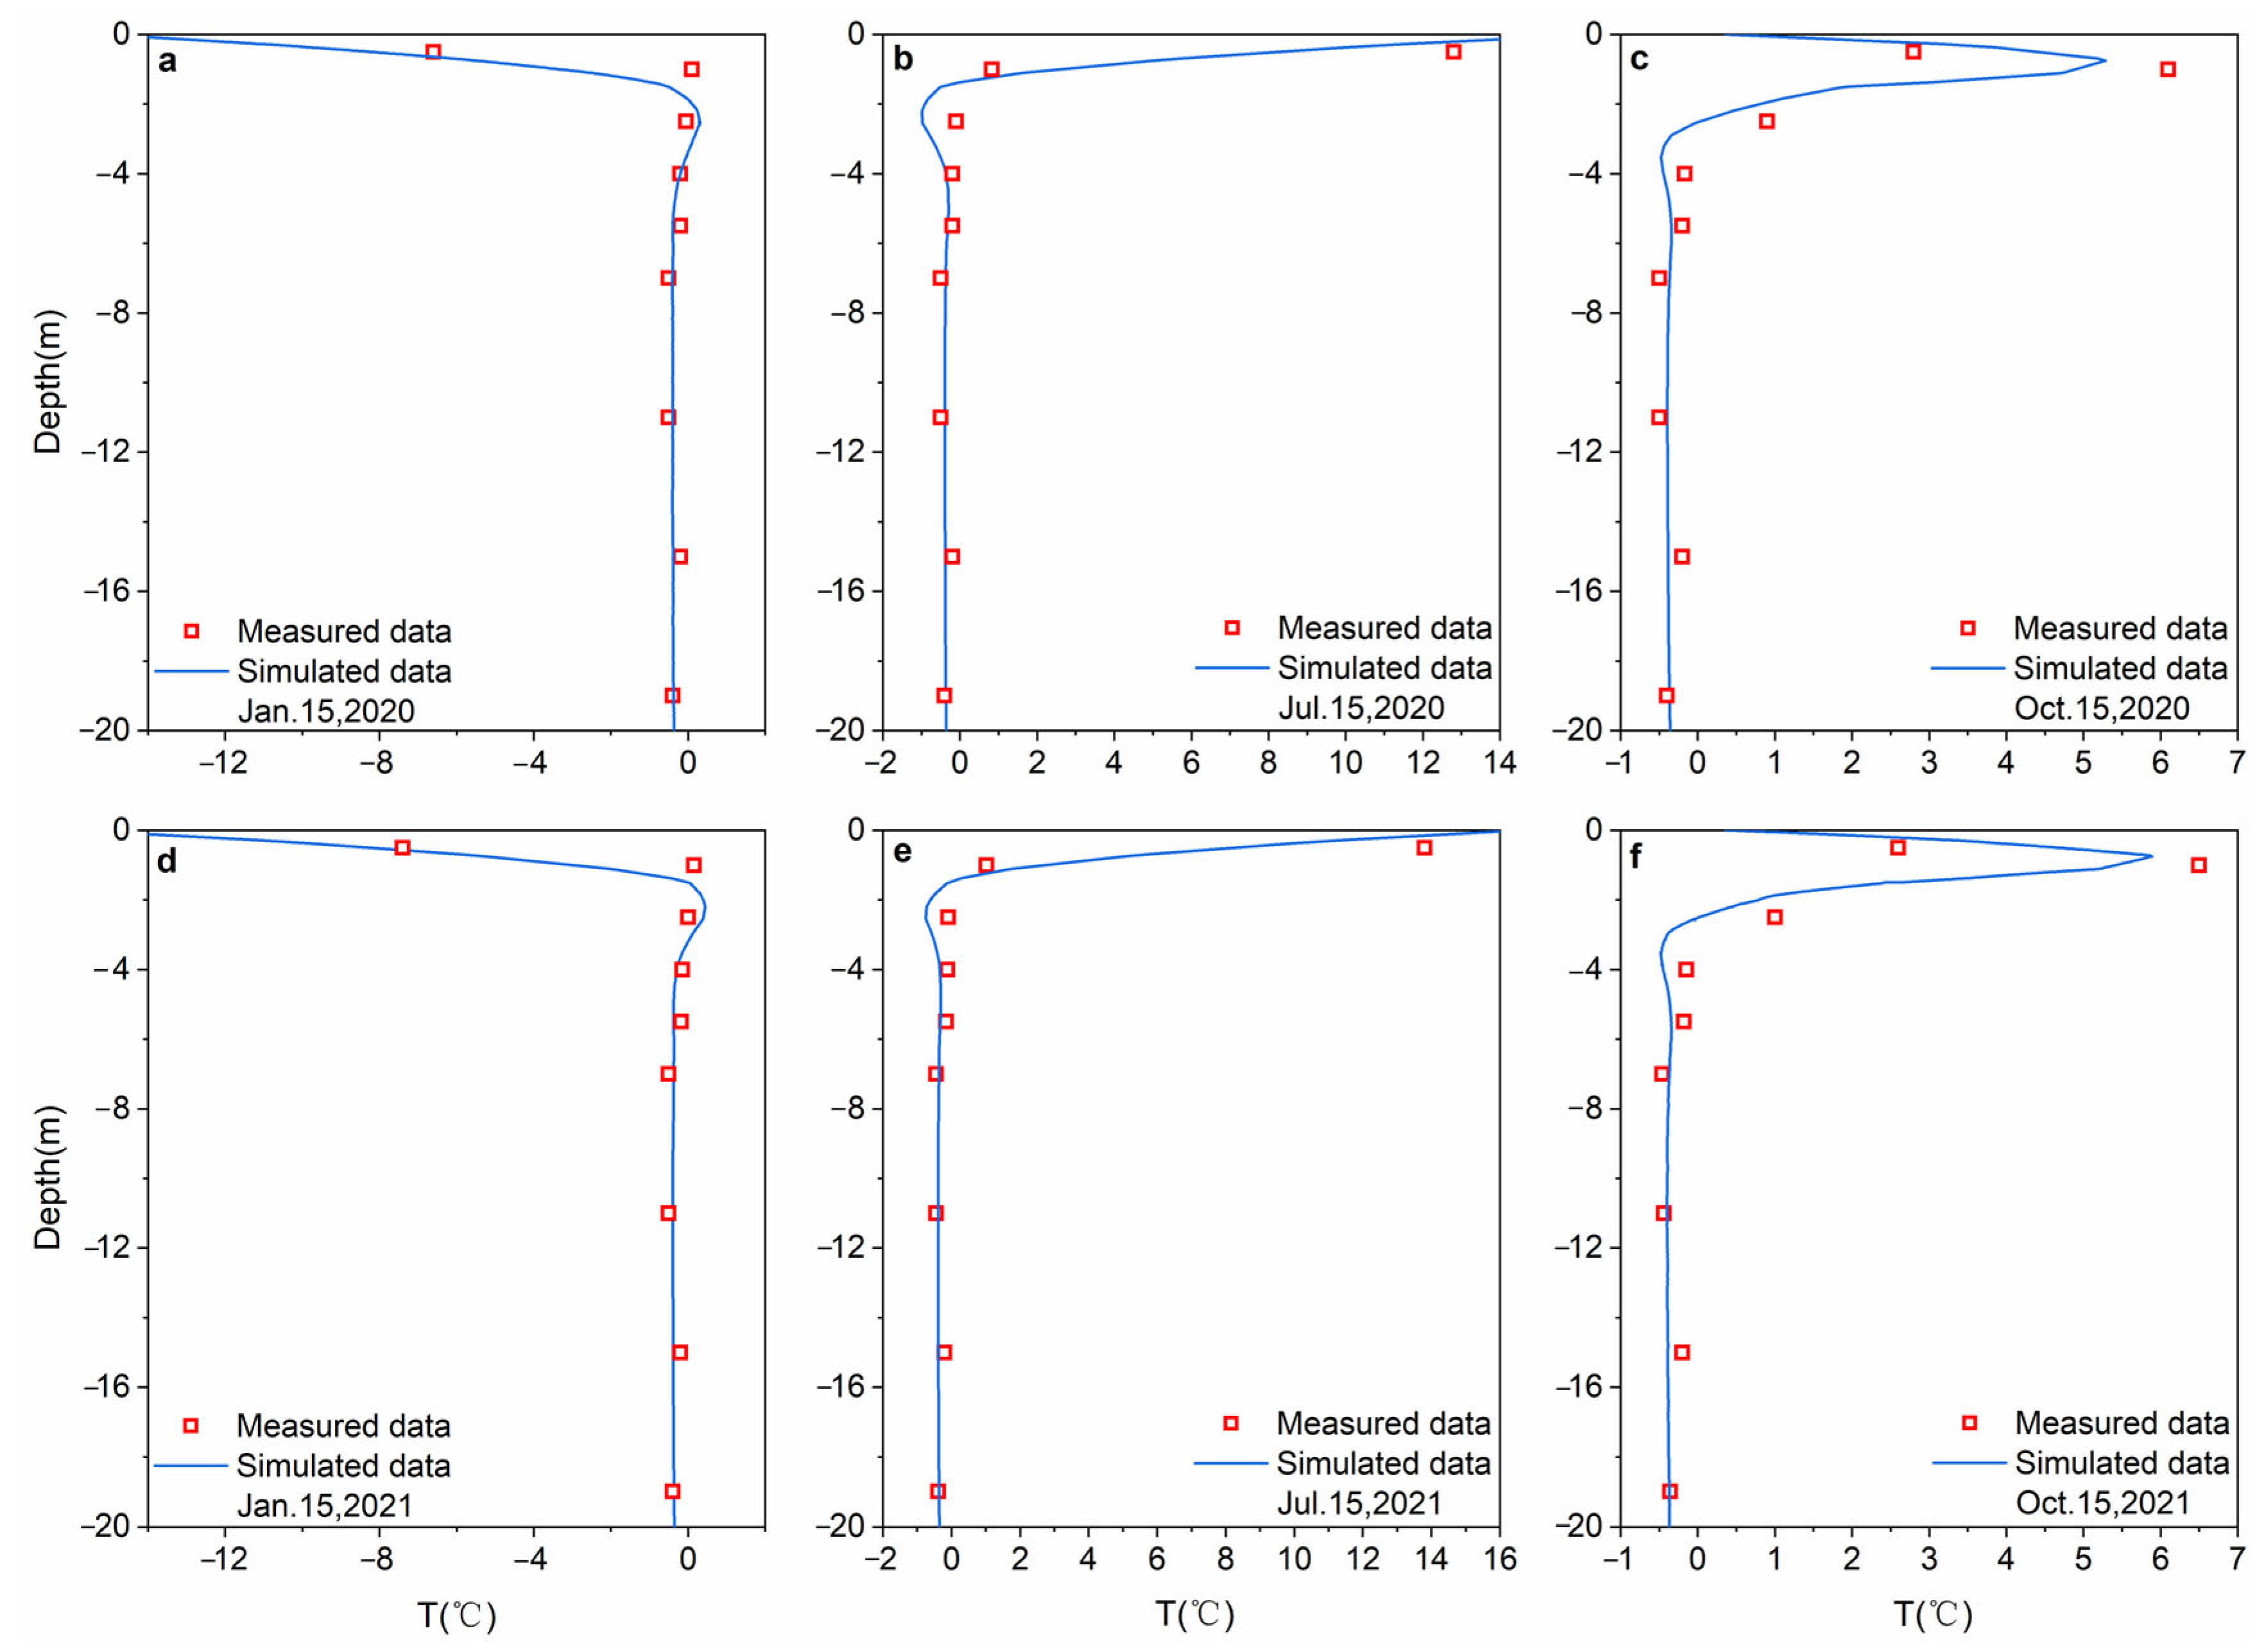
4.1. Verification of the Temperature Field after Subgrade Completion
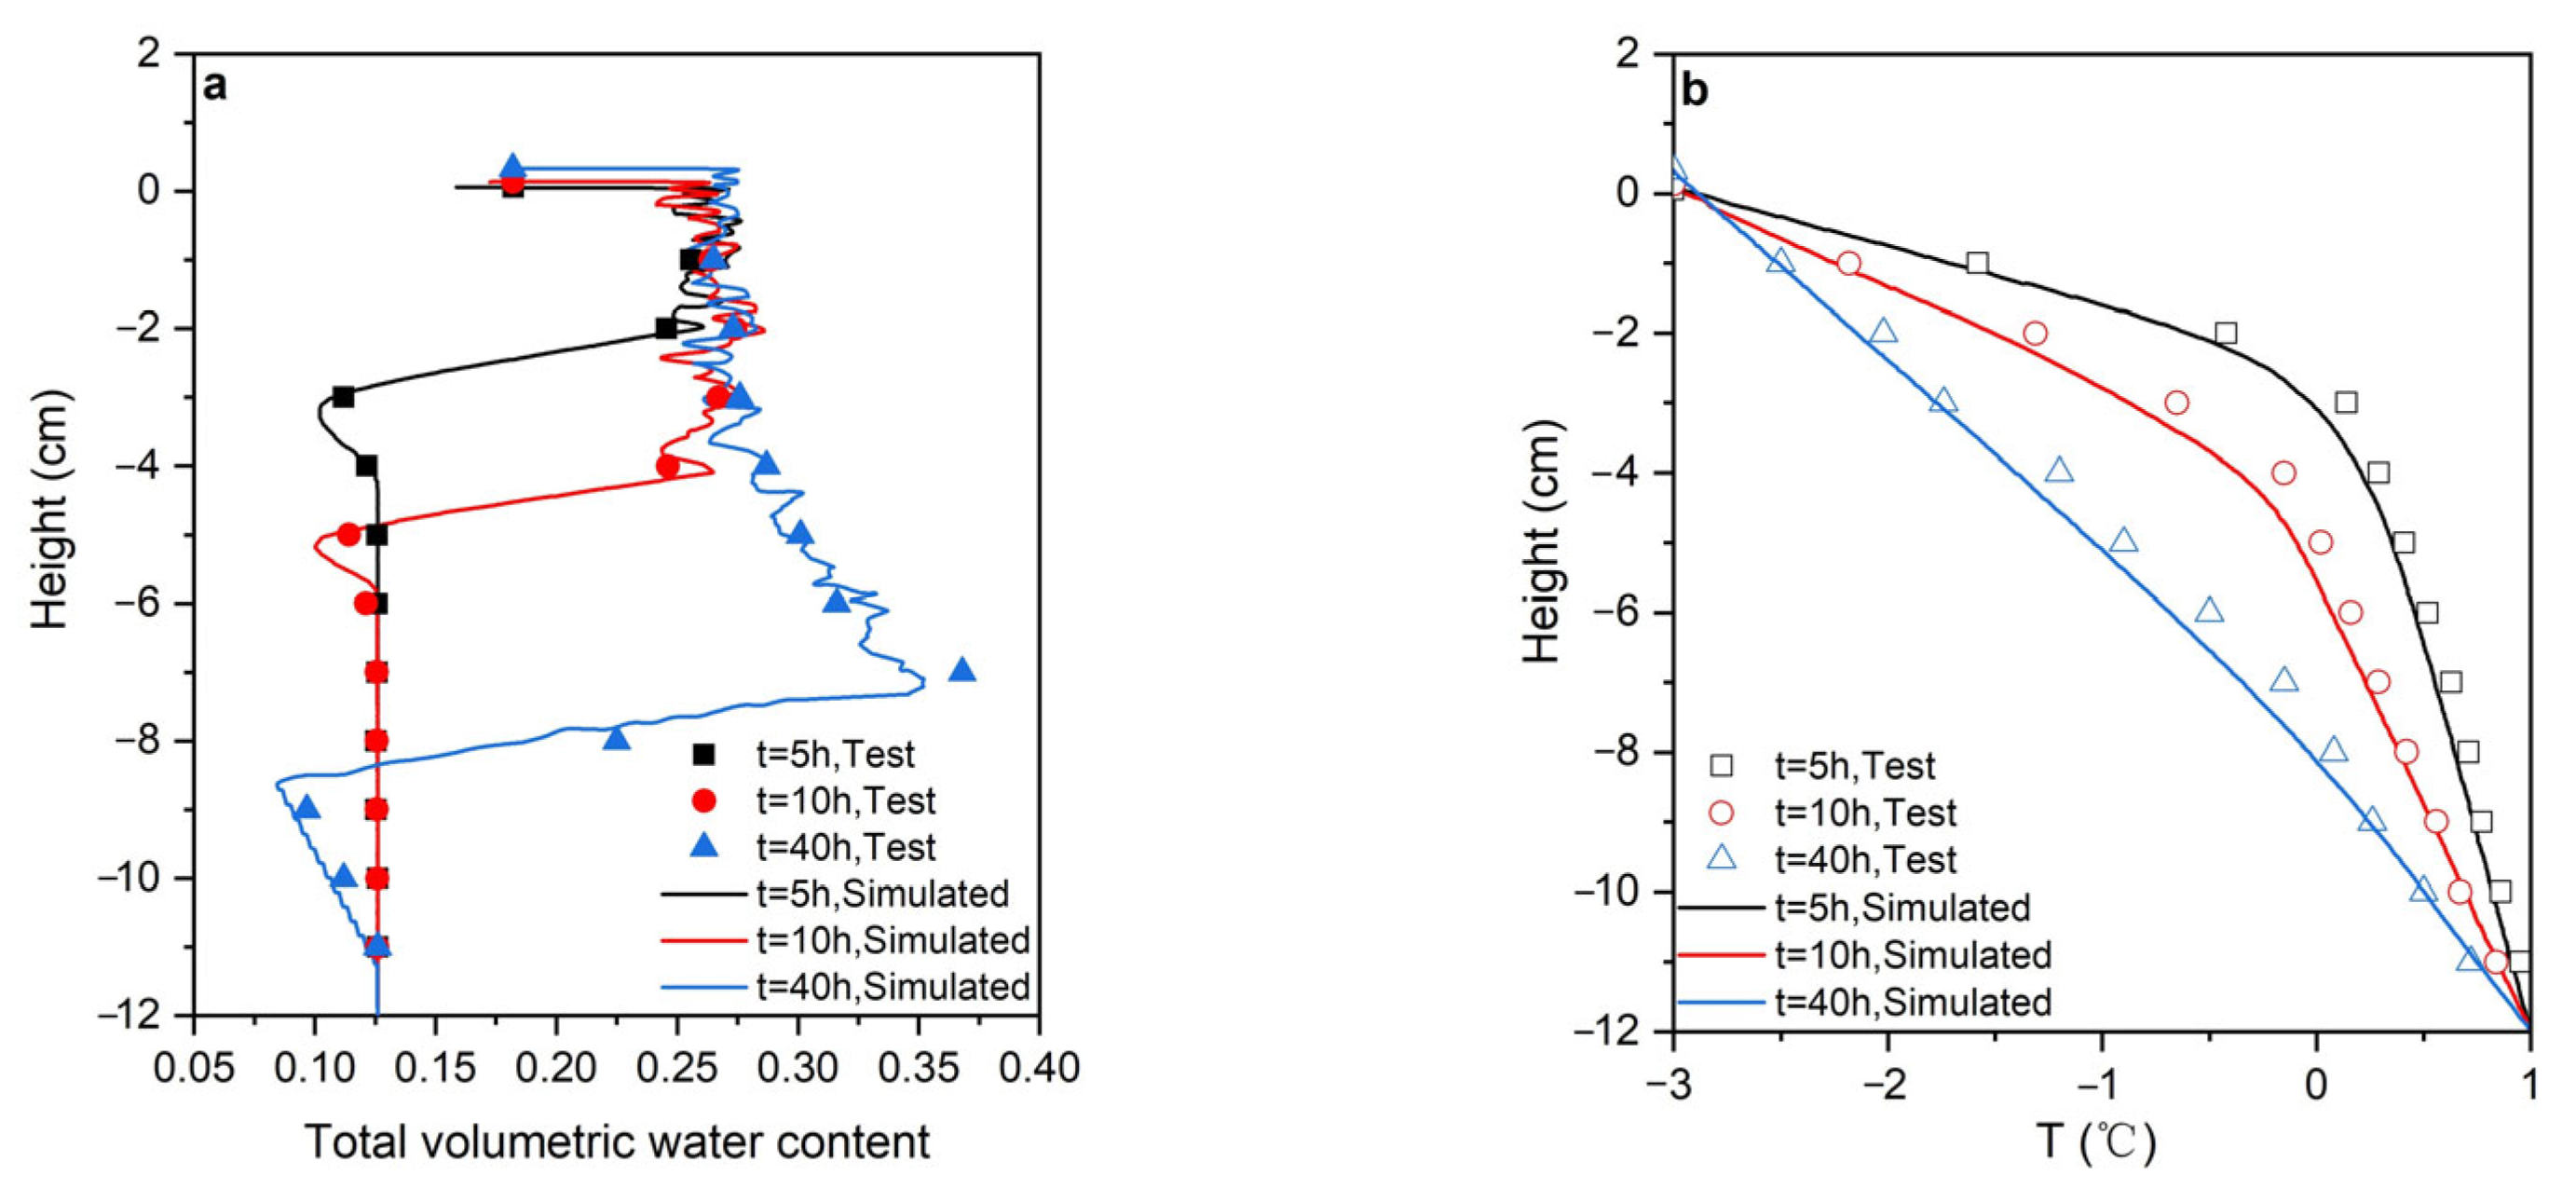
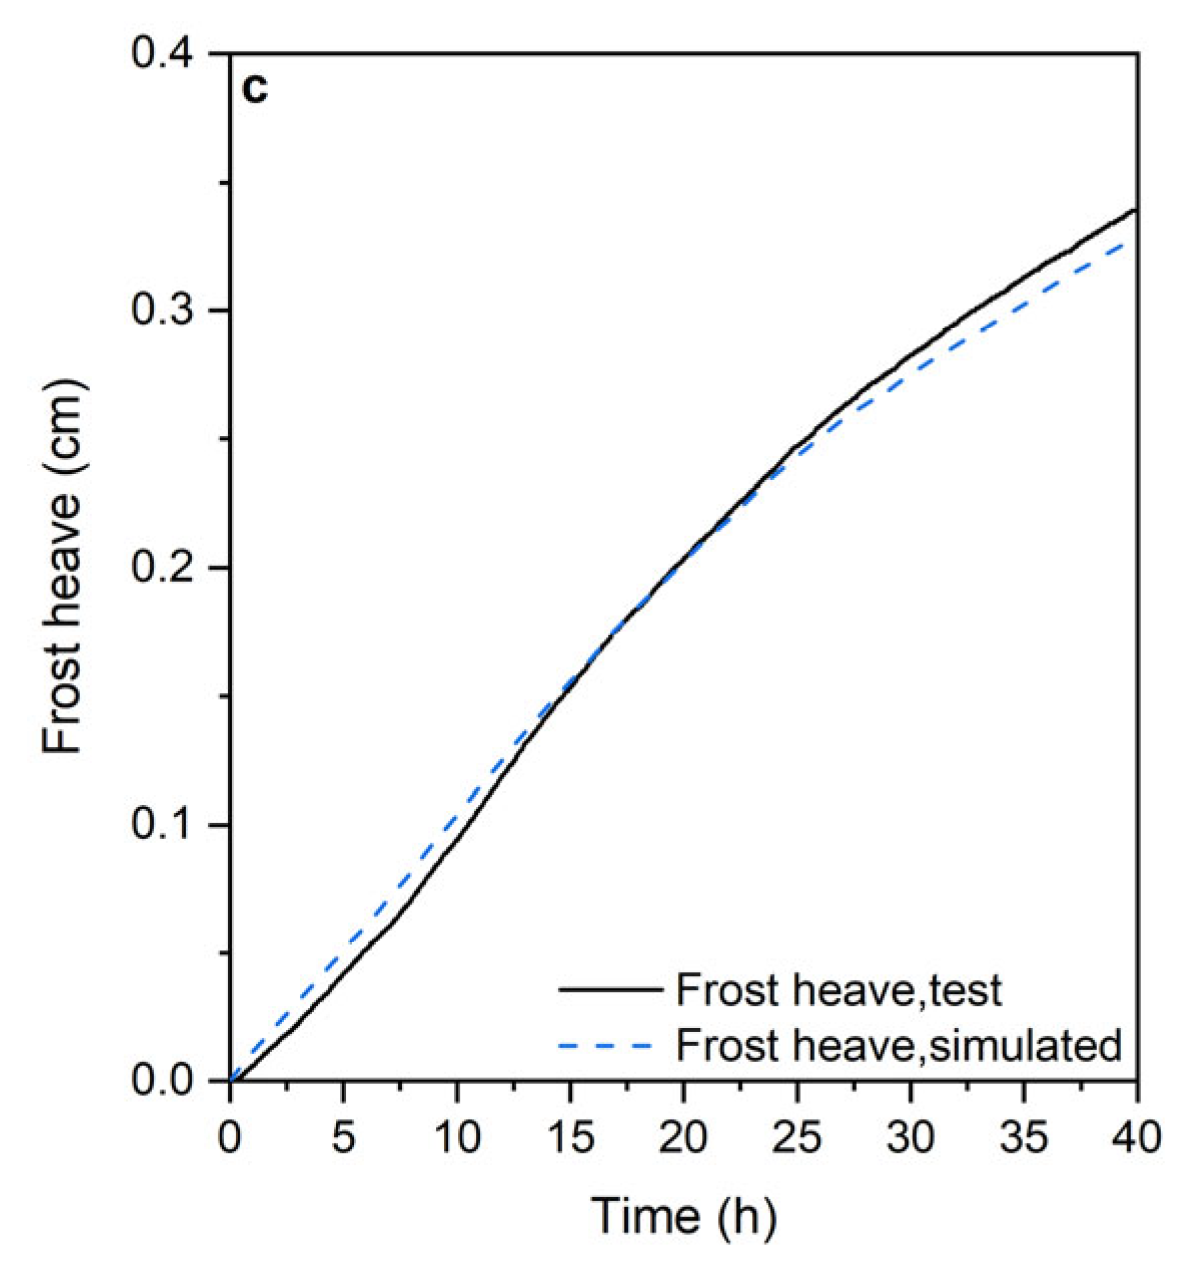
4.2. Laboratory Test Verification
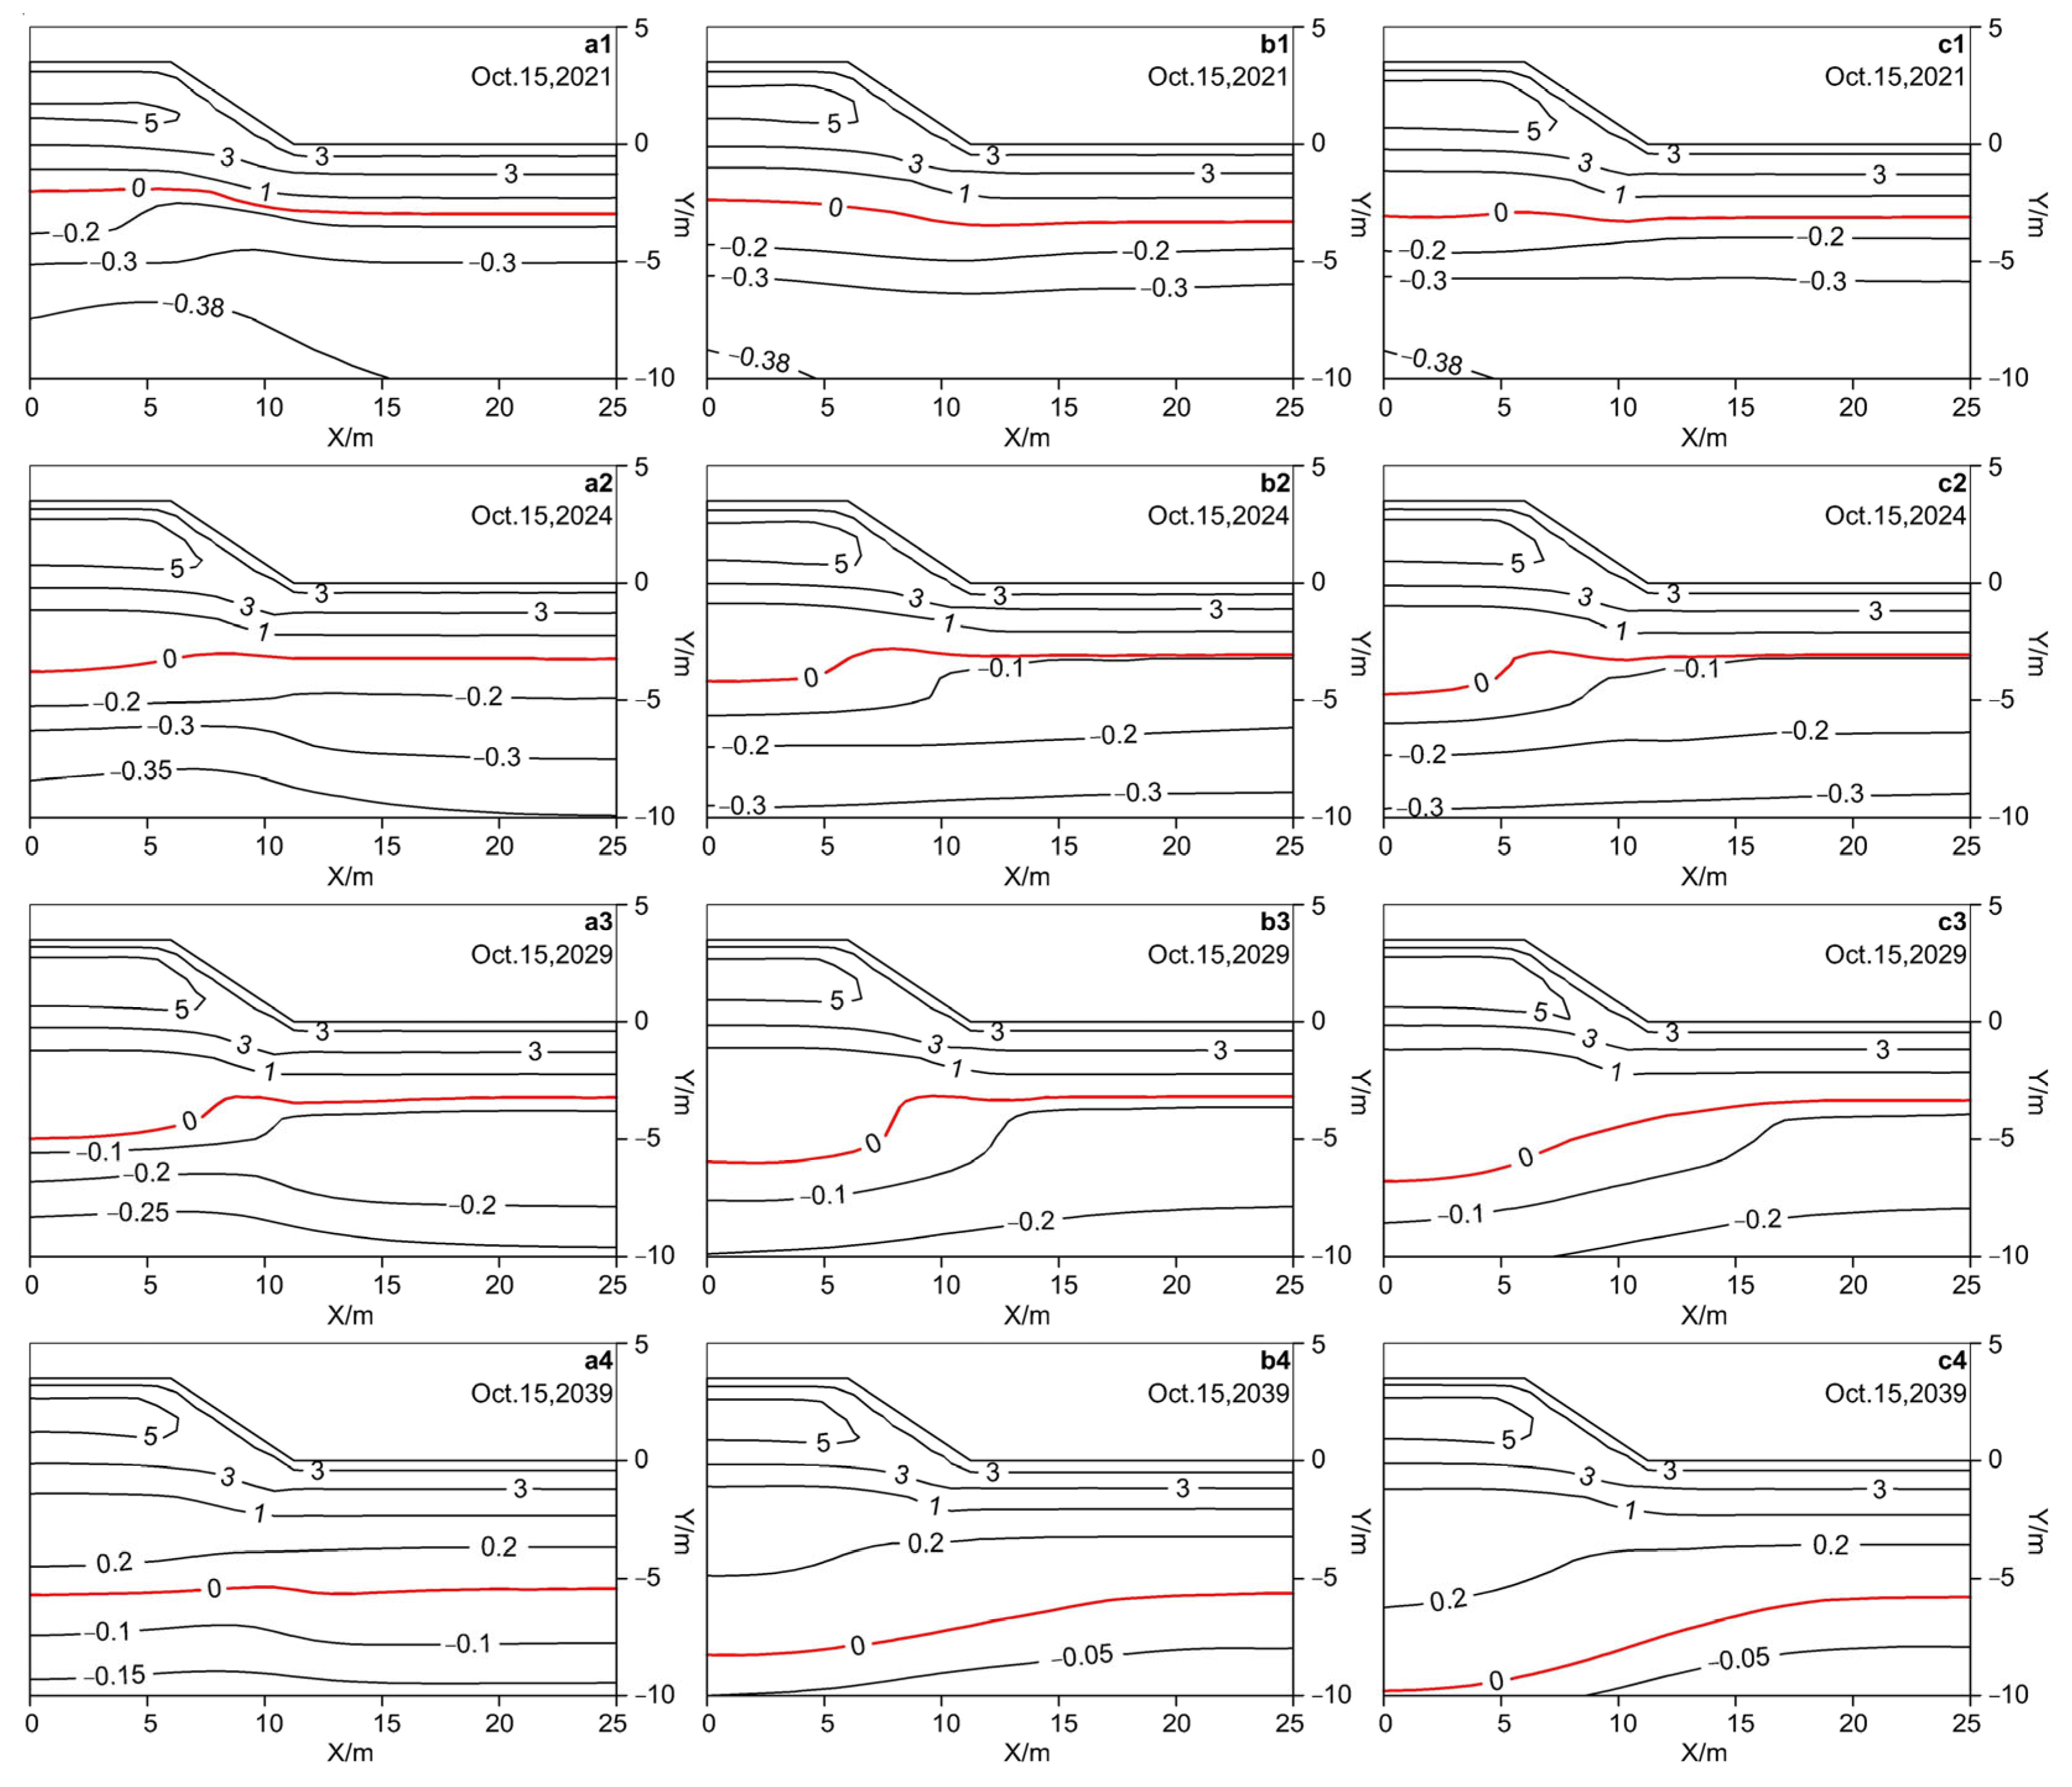
4.3. Analysis of the Variation in Thermal Conditions in Different Subgrade Structures
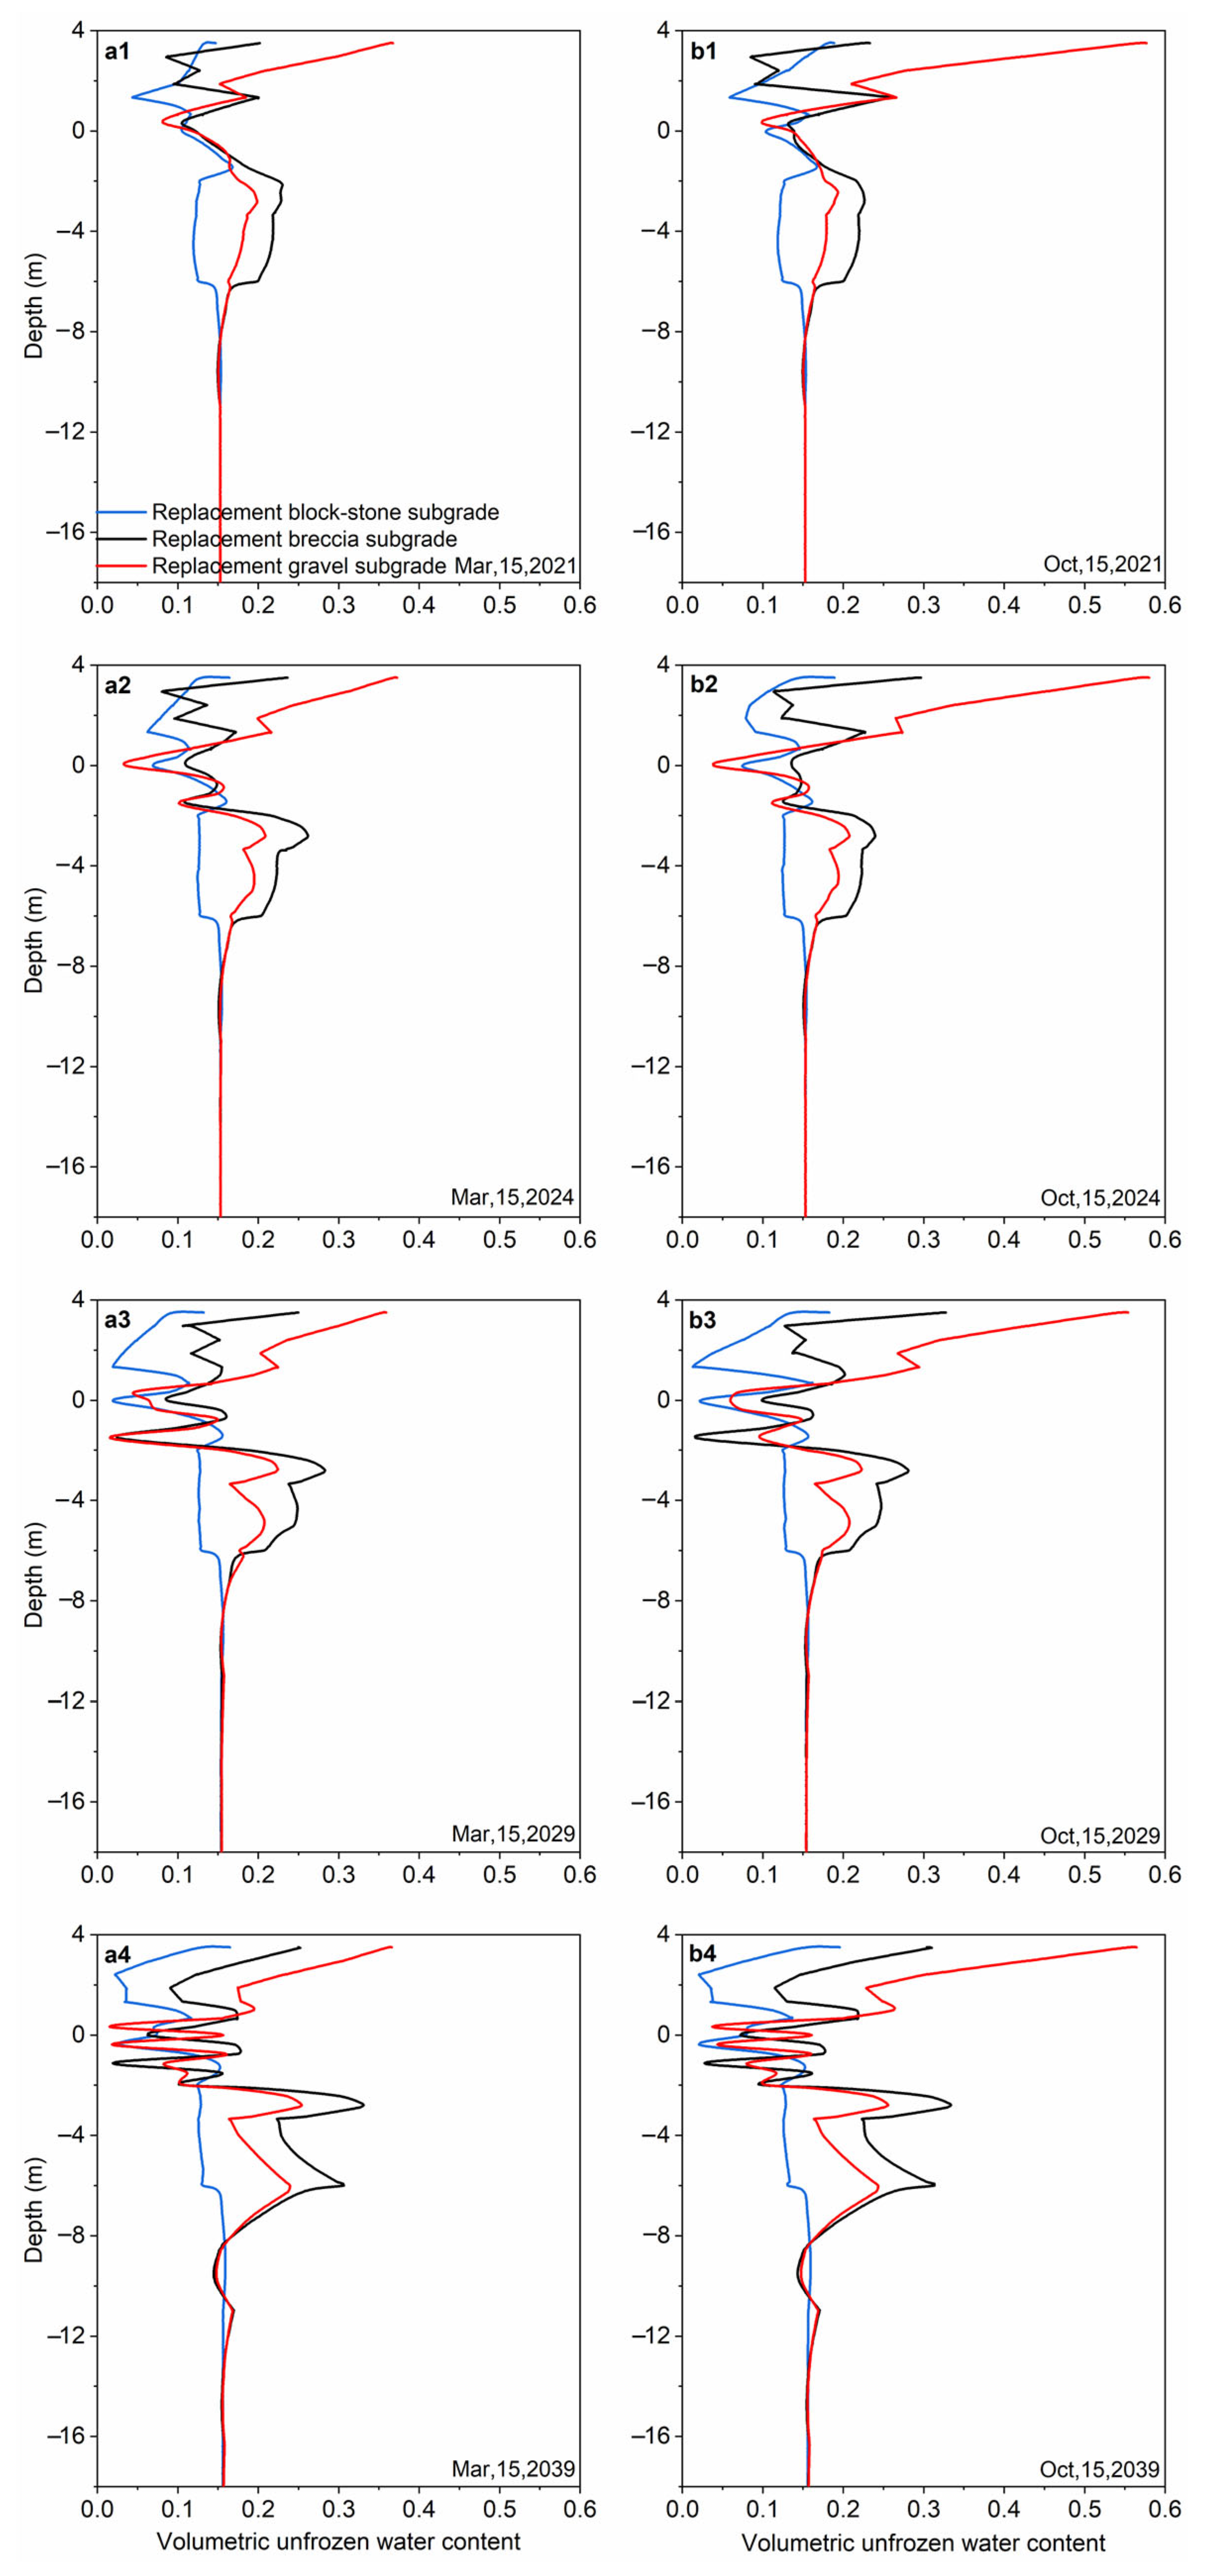
4.4. Analysis of the Variation in Liquid Water Content in Different Subgrade Structures
4.5. Deformation Analysis of Different Subgrade Structures
5. Discussion
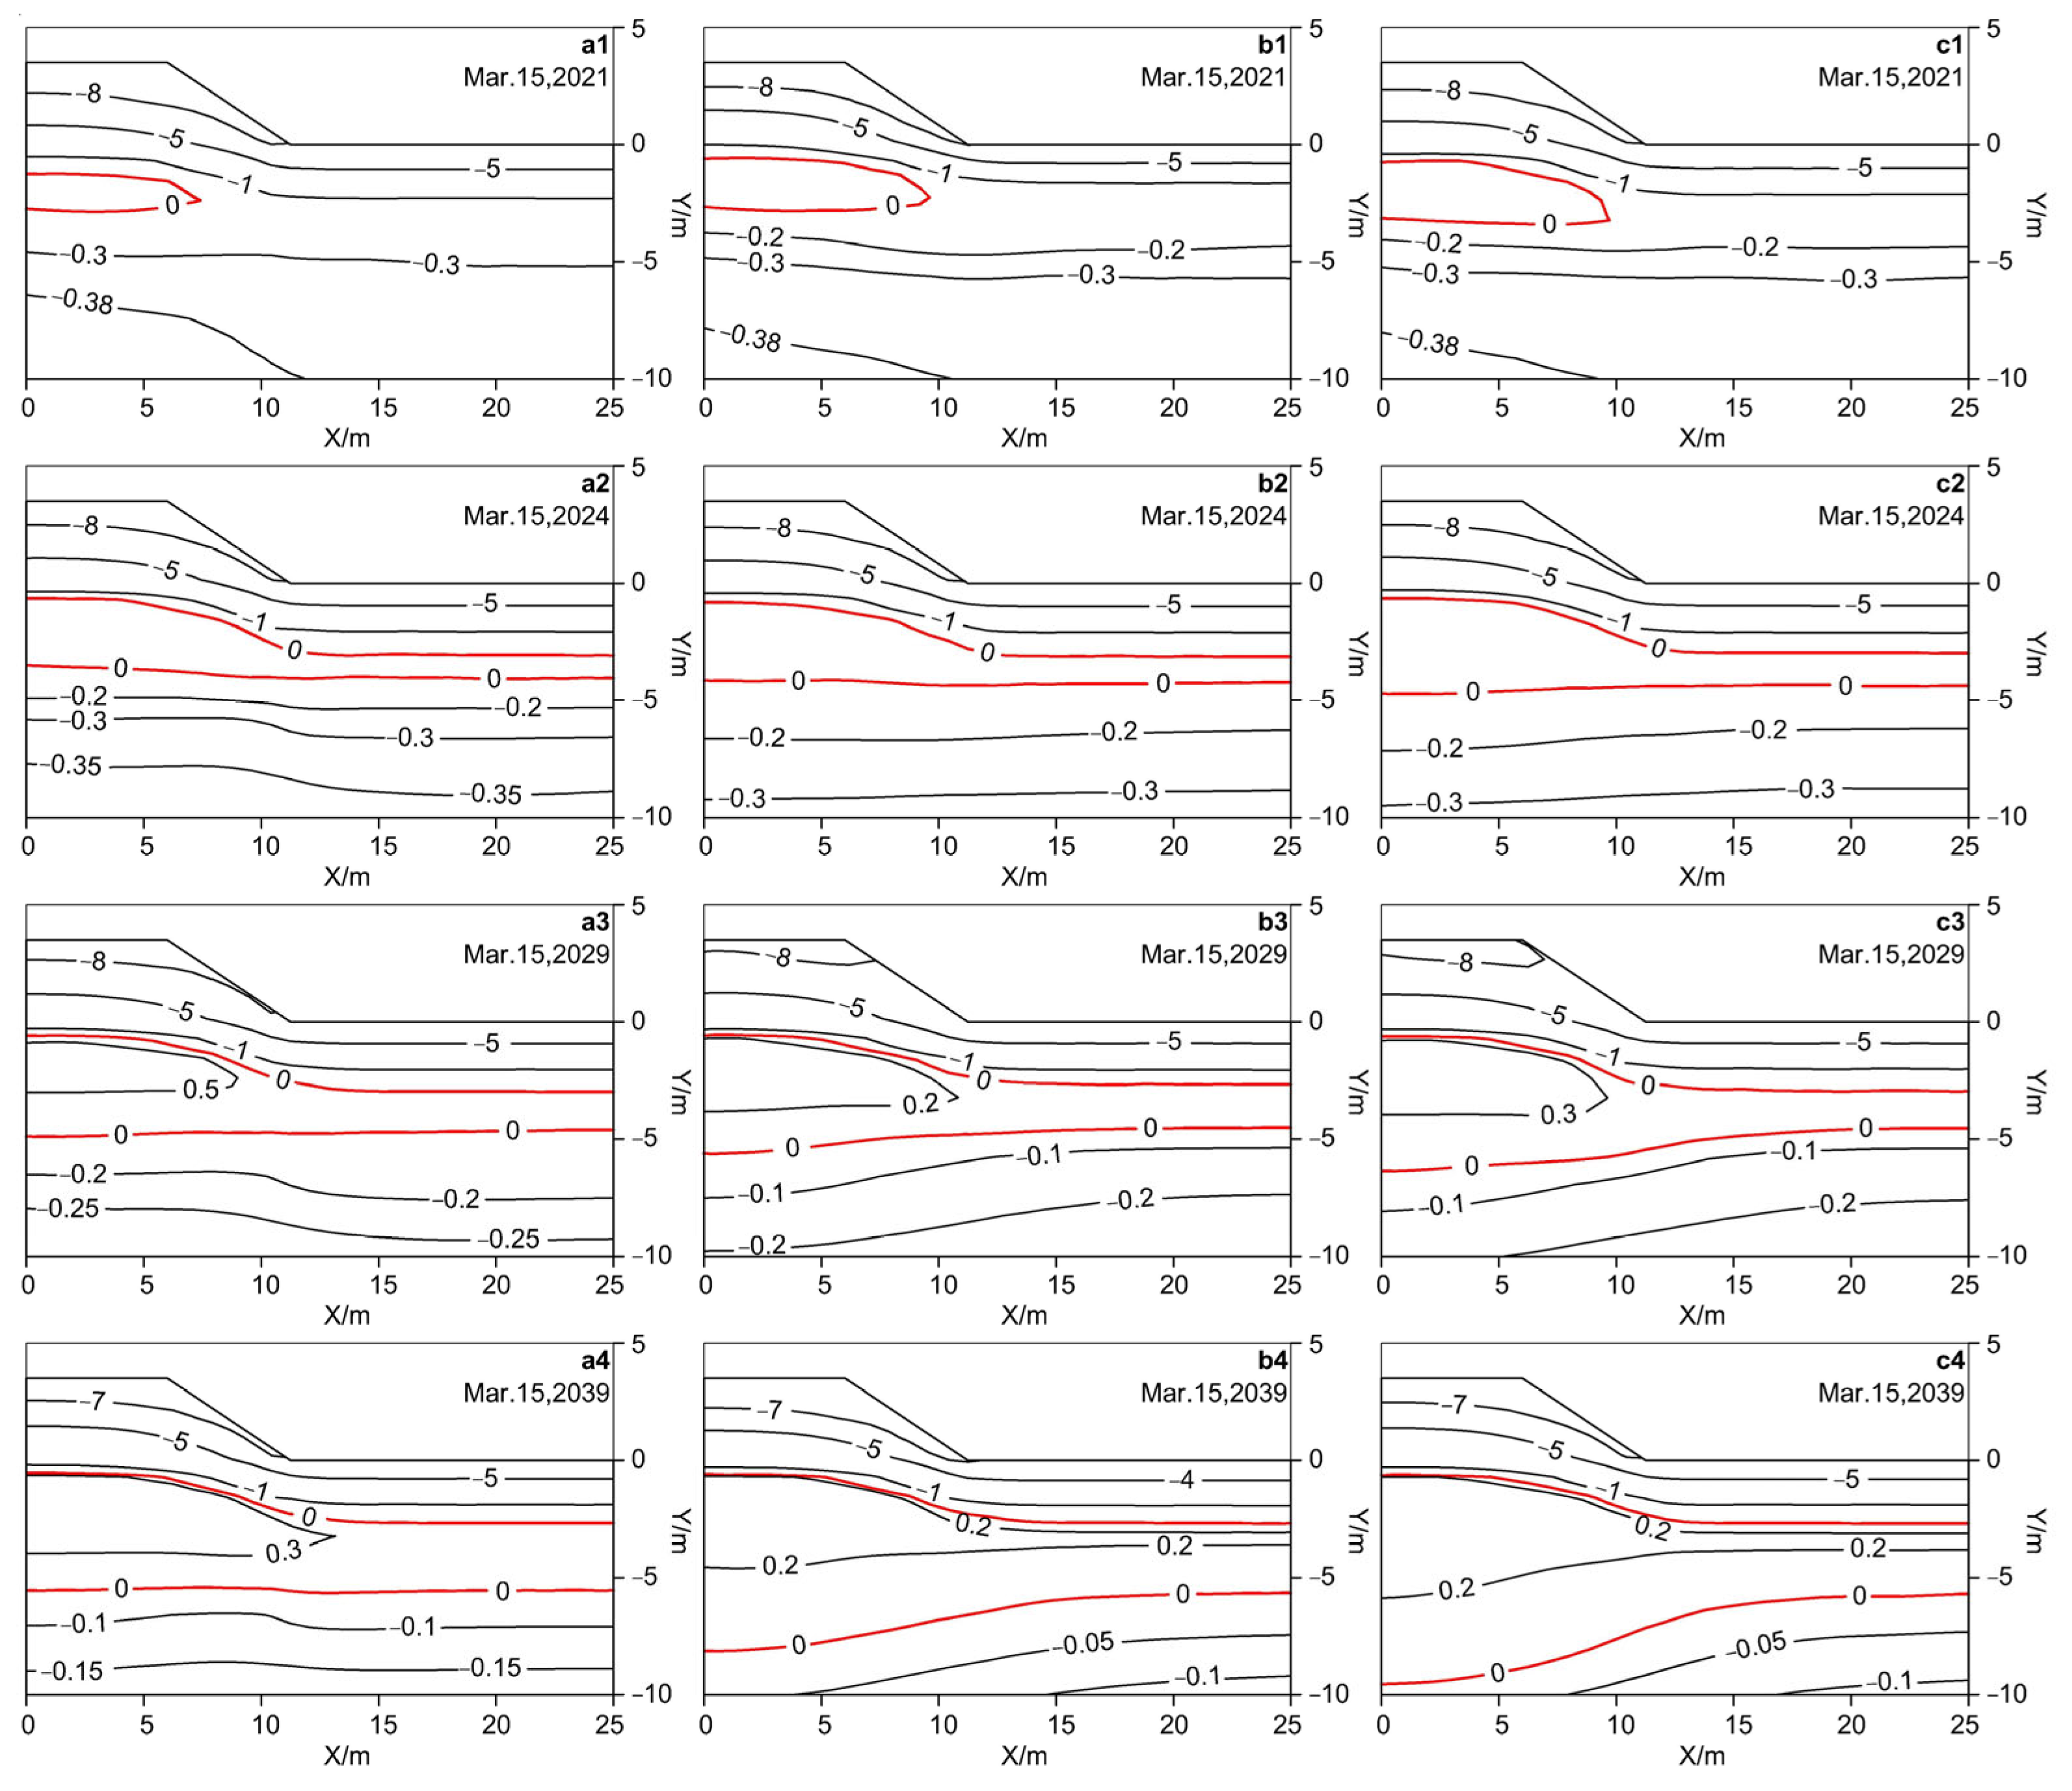
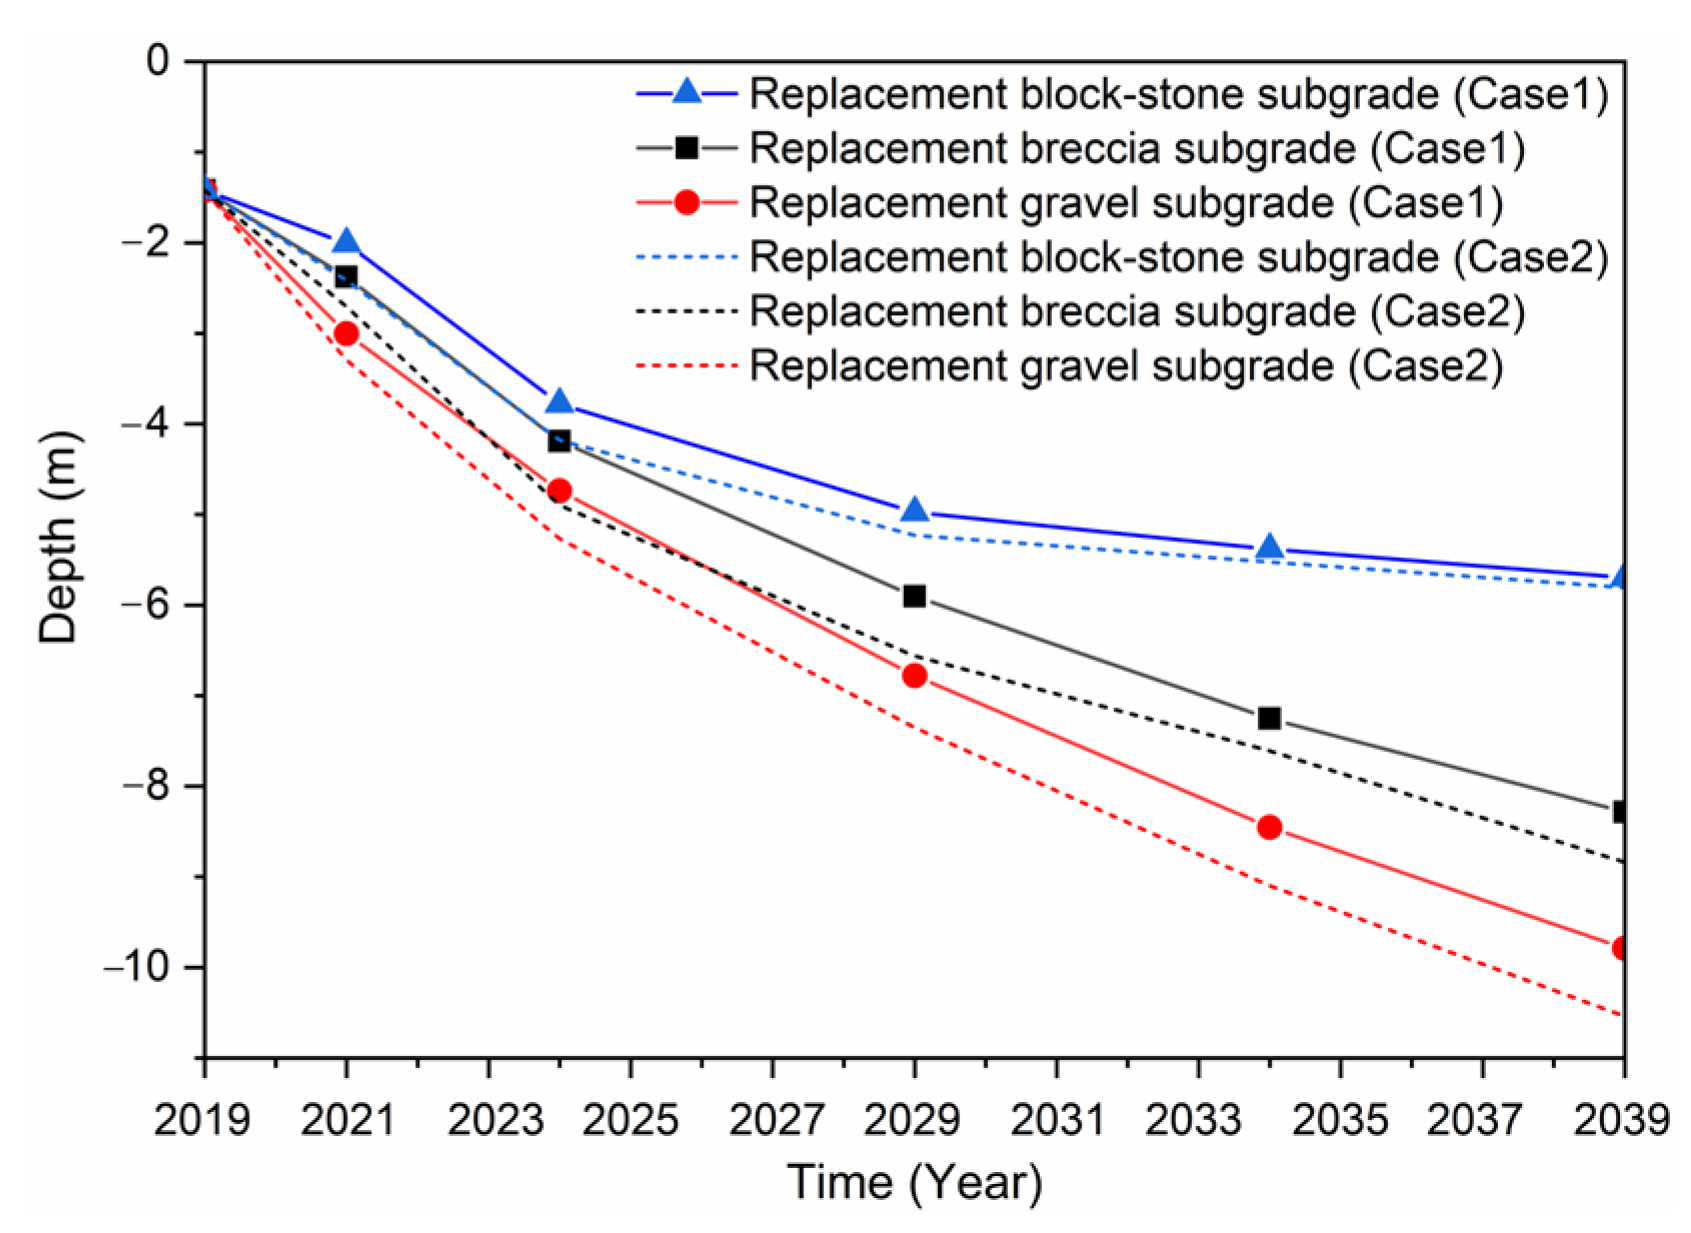
5.1. Comparison of Permafrost Table Changes in Three Subgrade Structures in Case 1 and Case 2
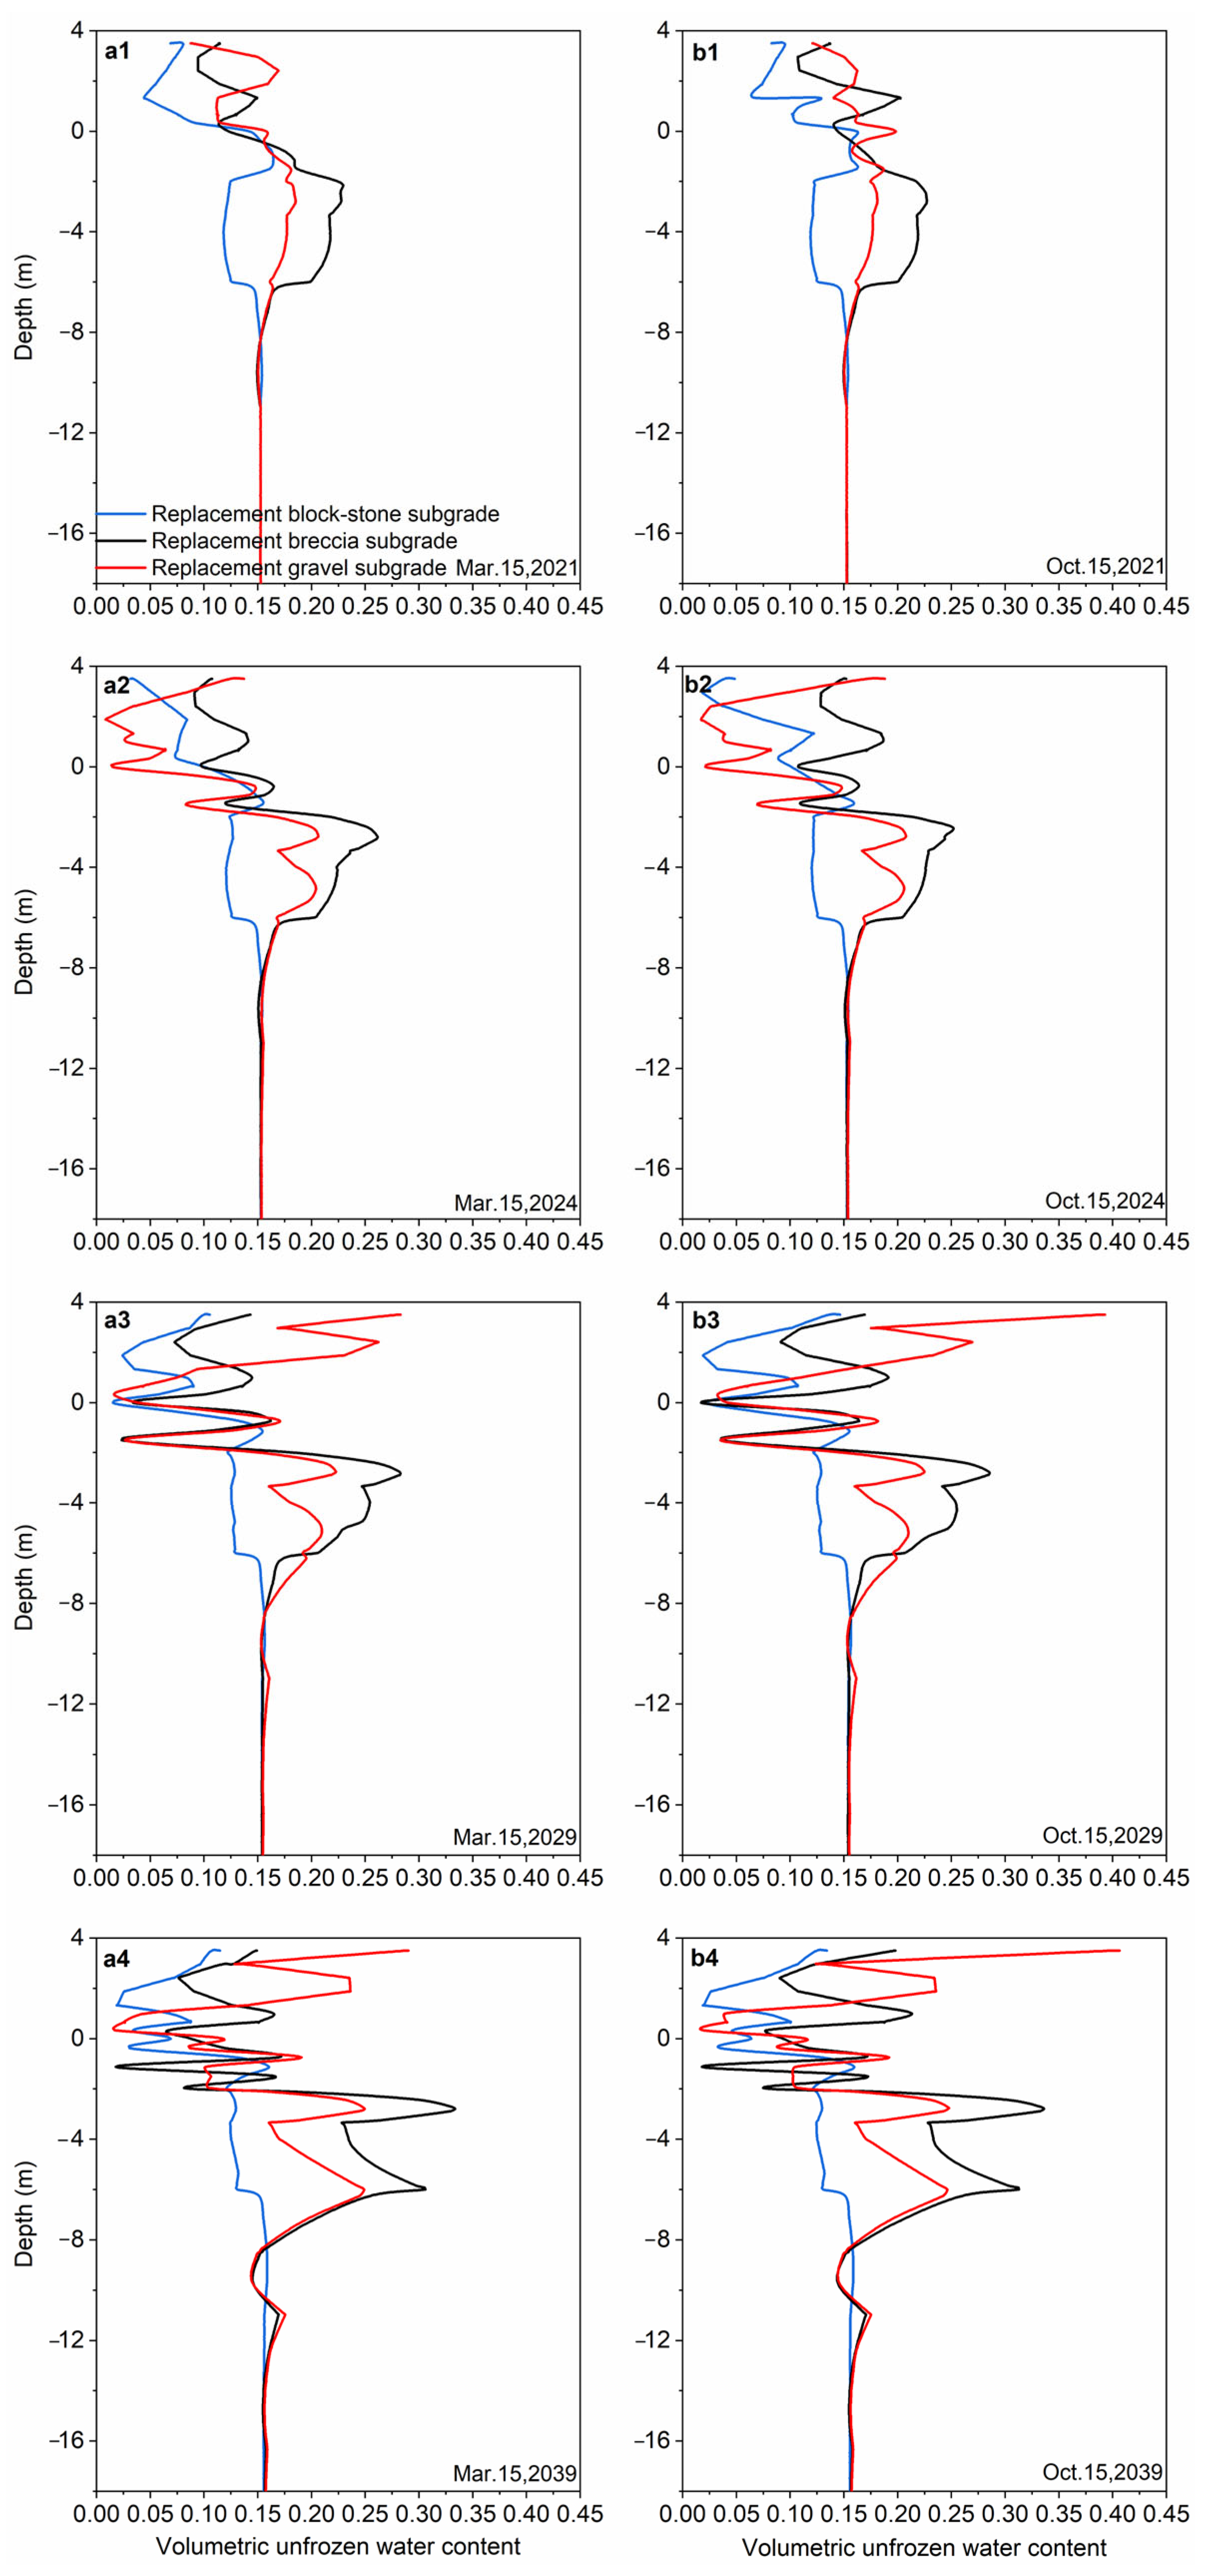
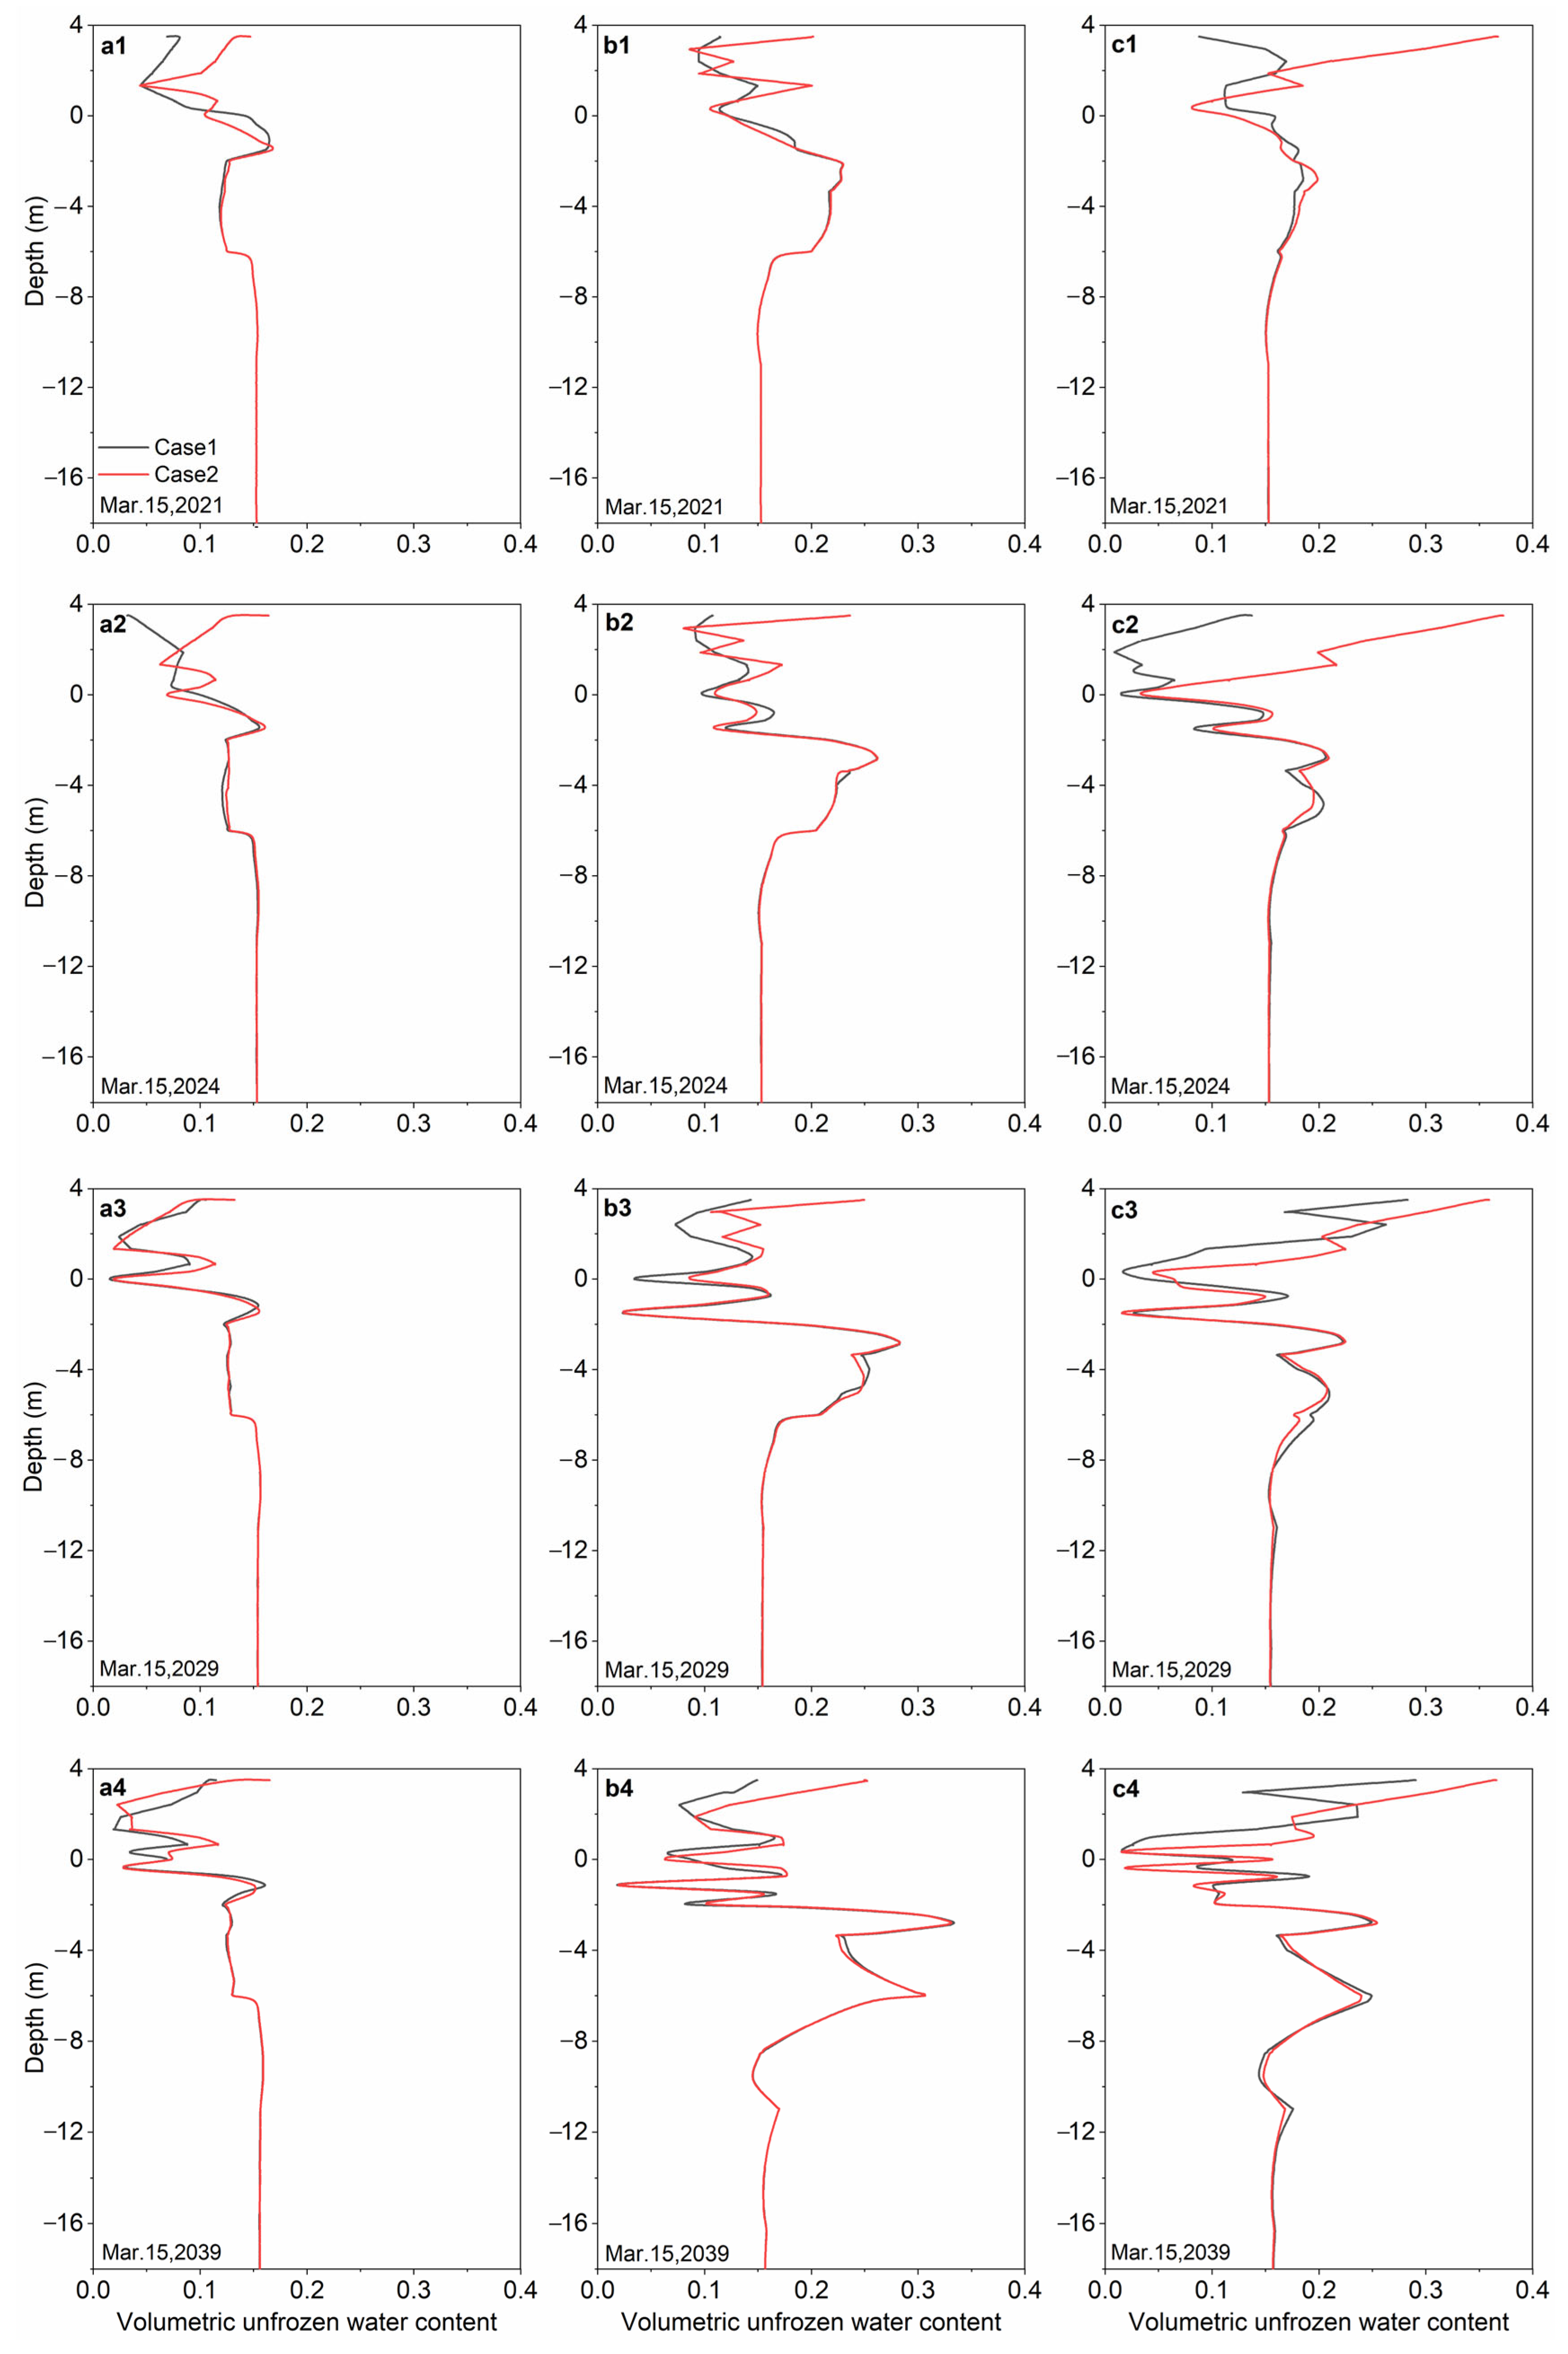
5.2. Comparison of the Volumetric Liquid Water Content of the Three Subgrade Structures in Case 1 and Case 2
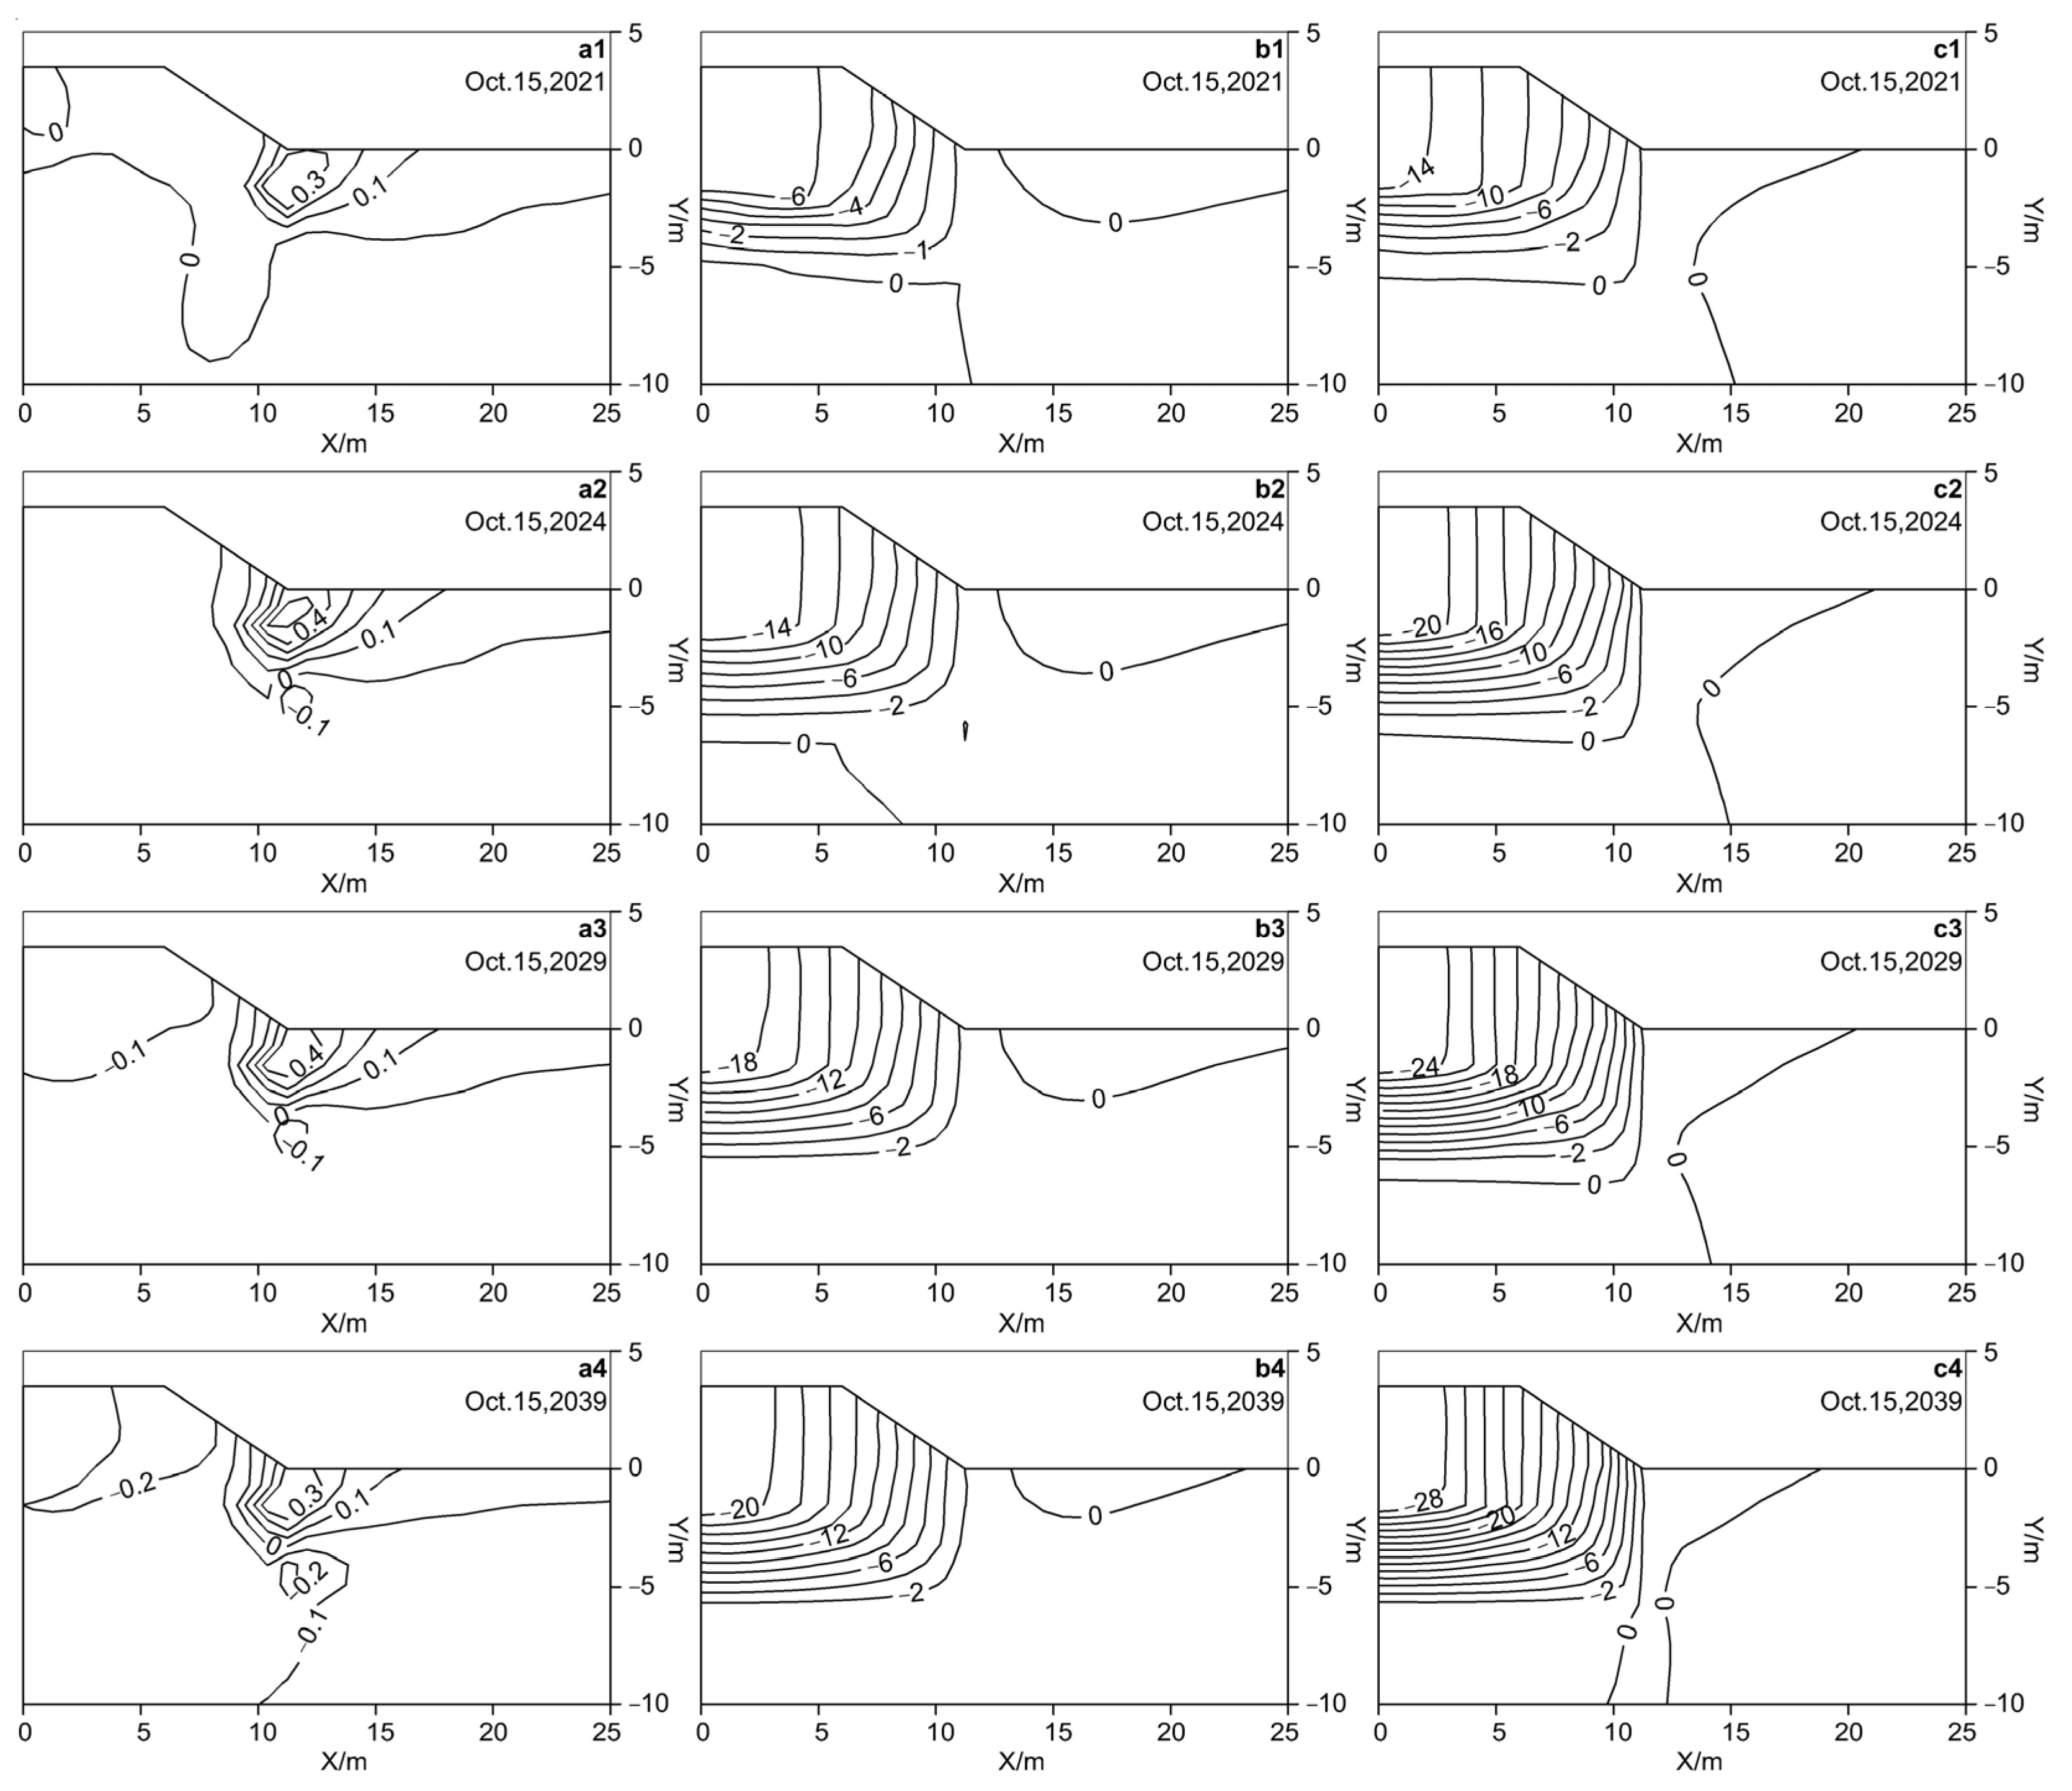
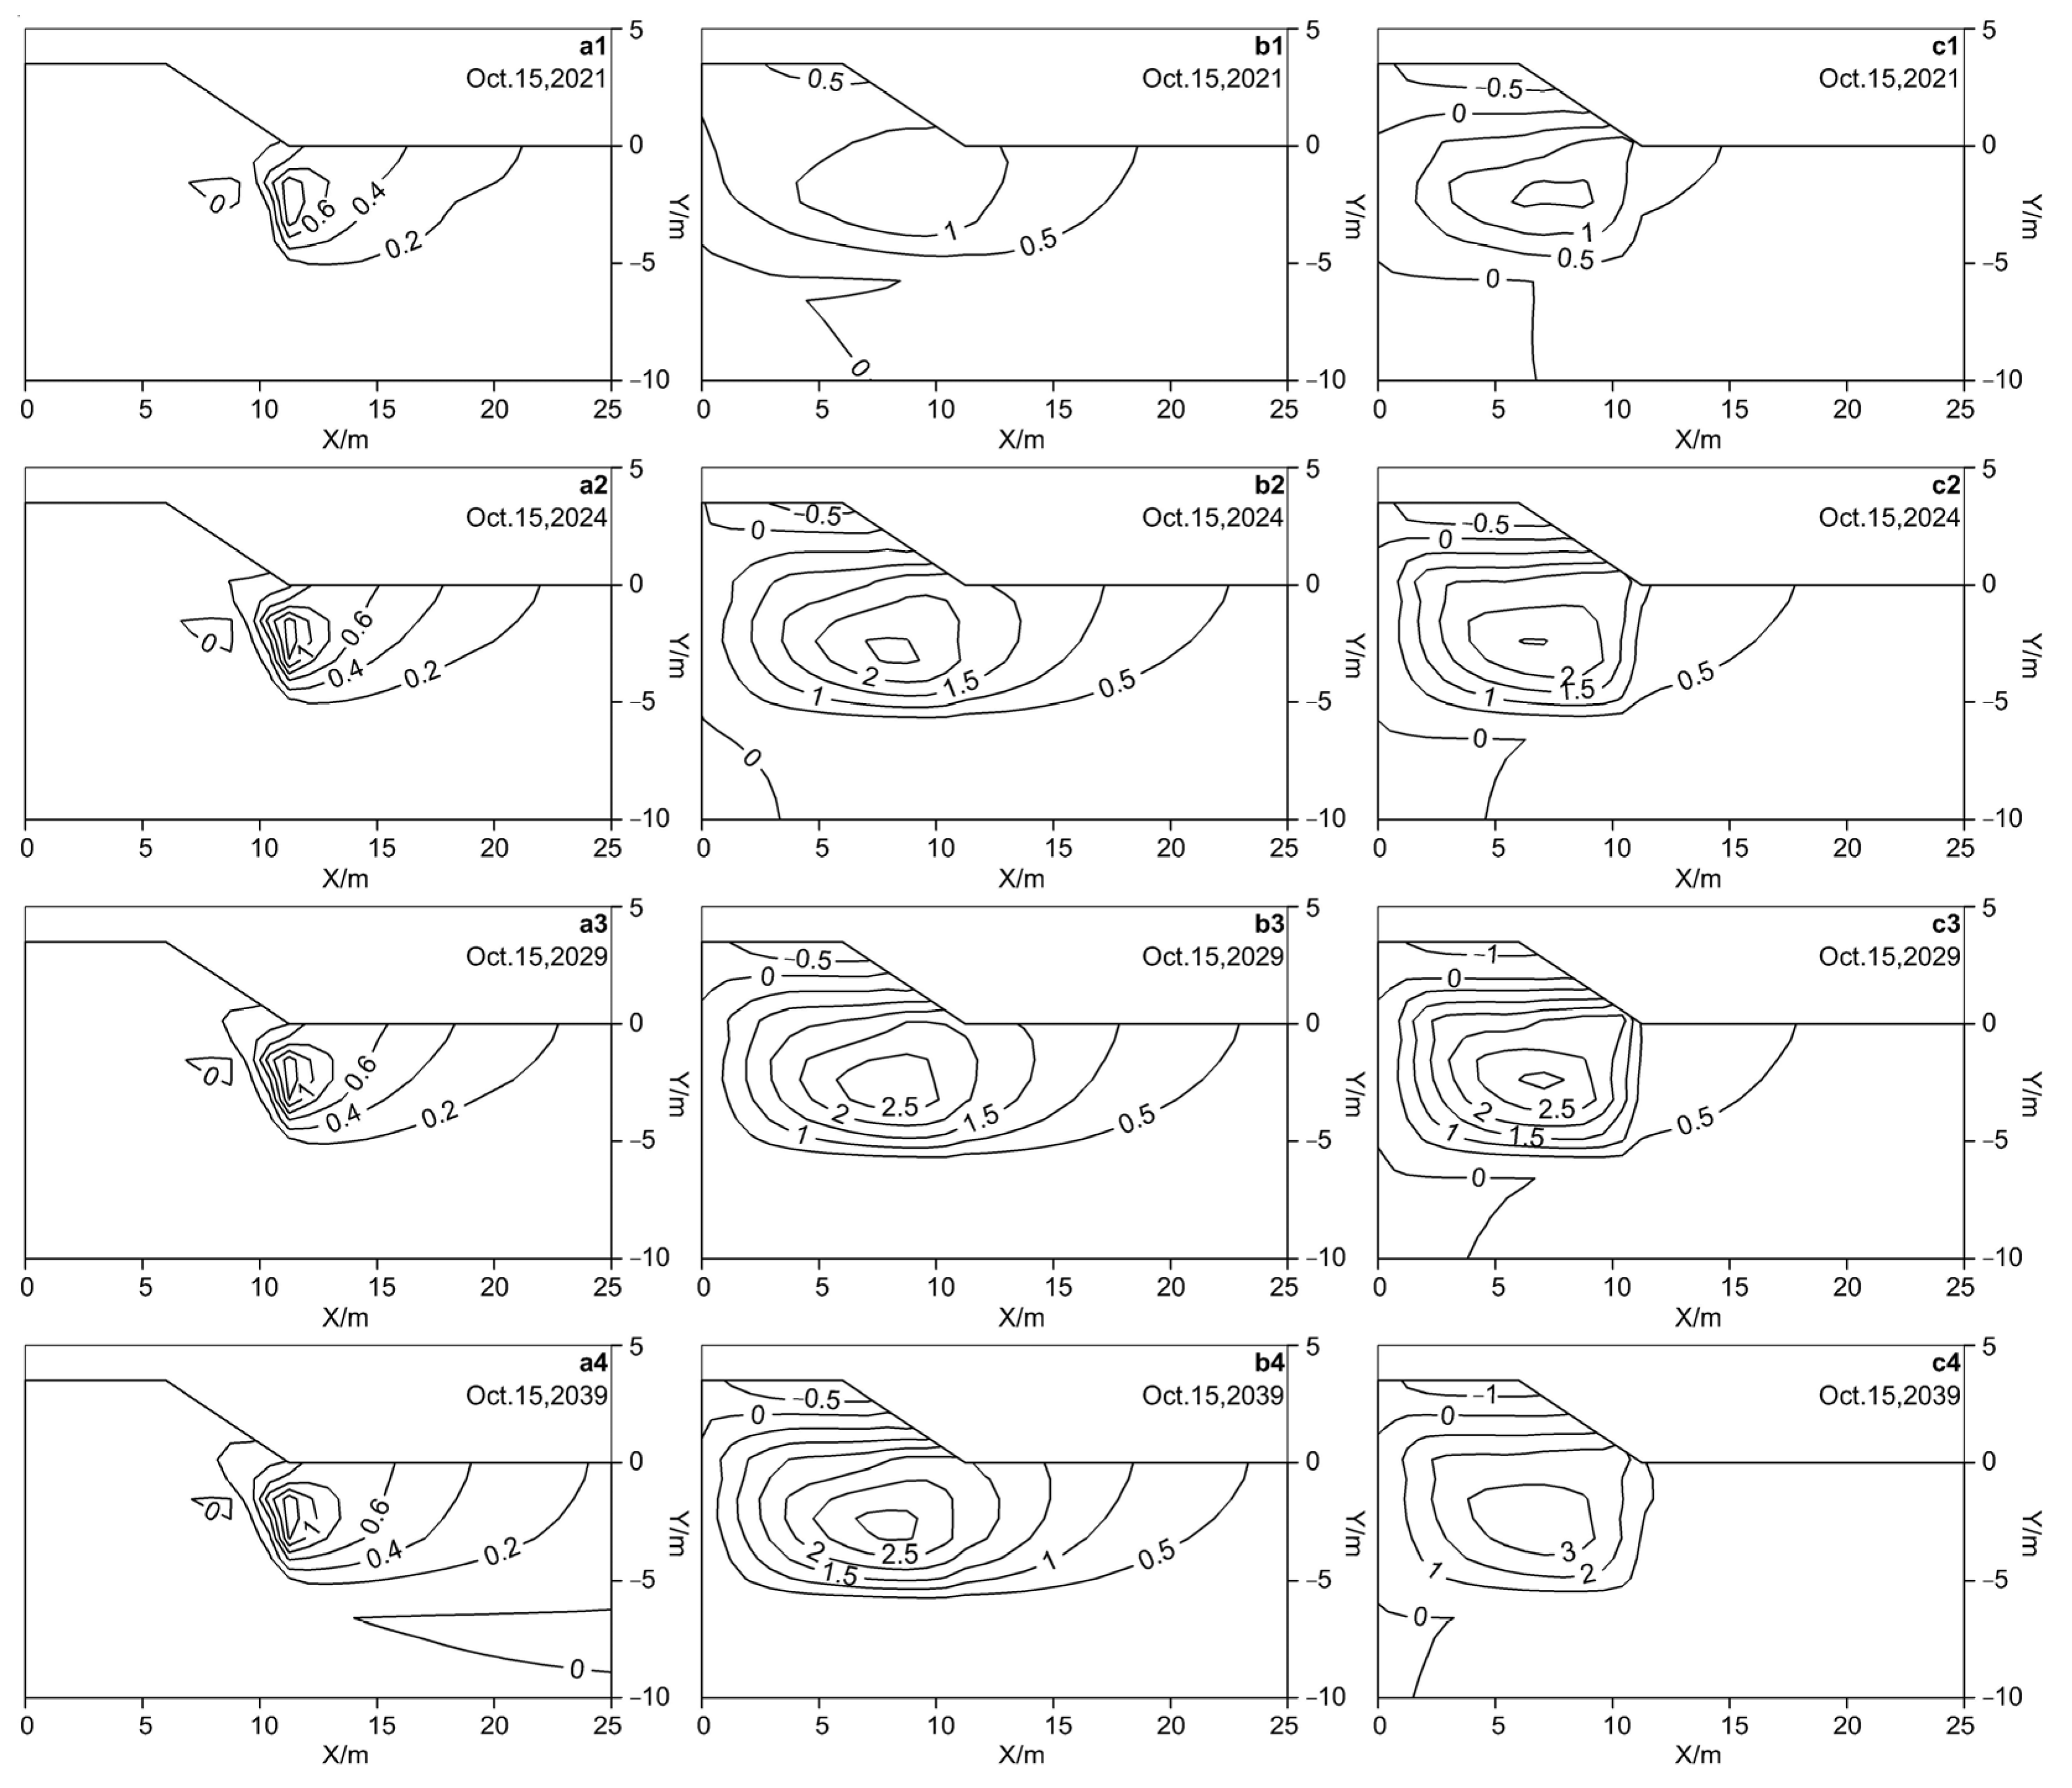
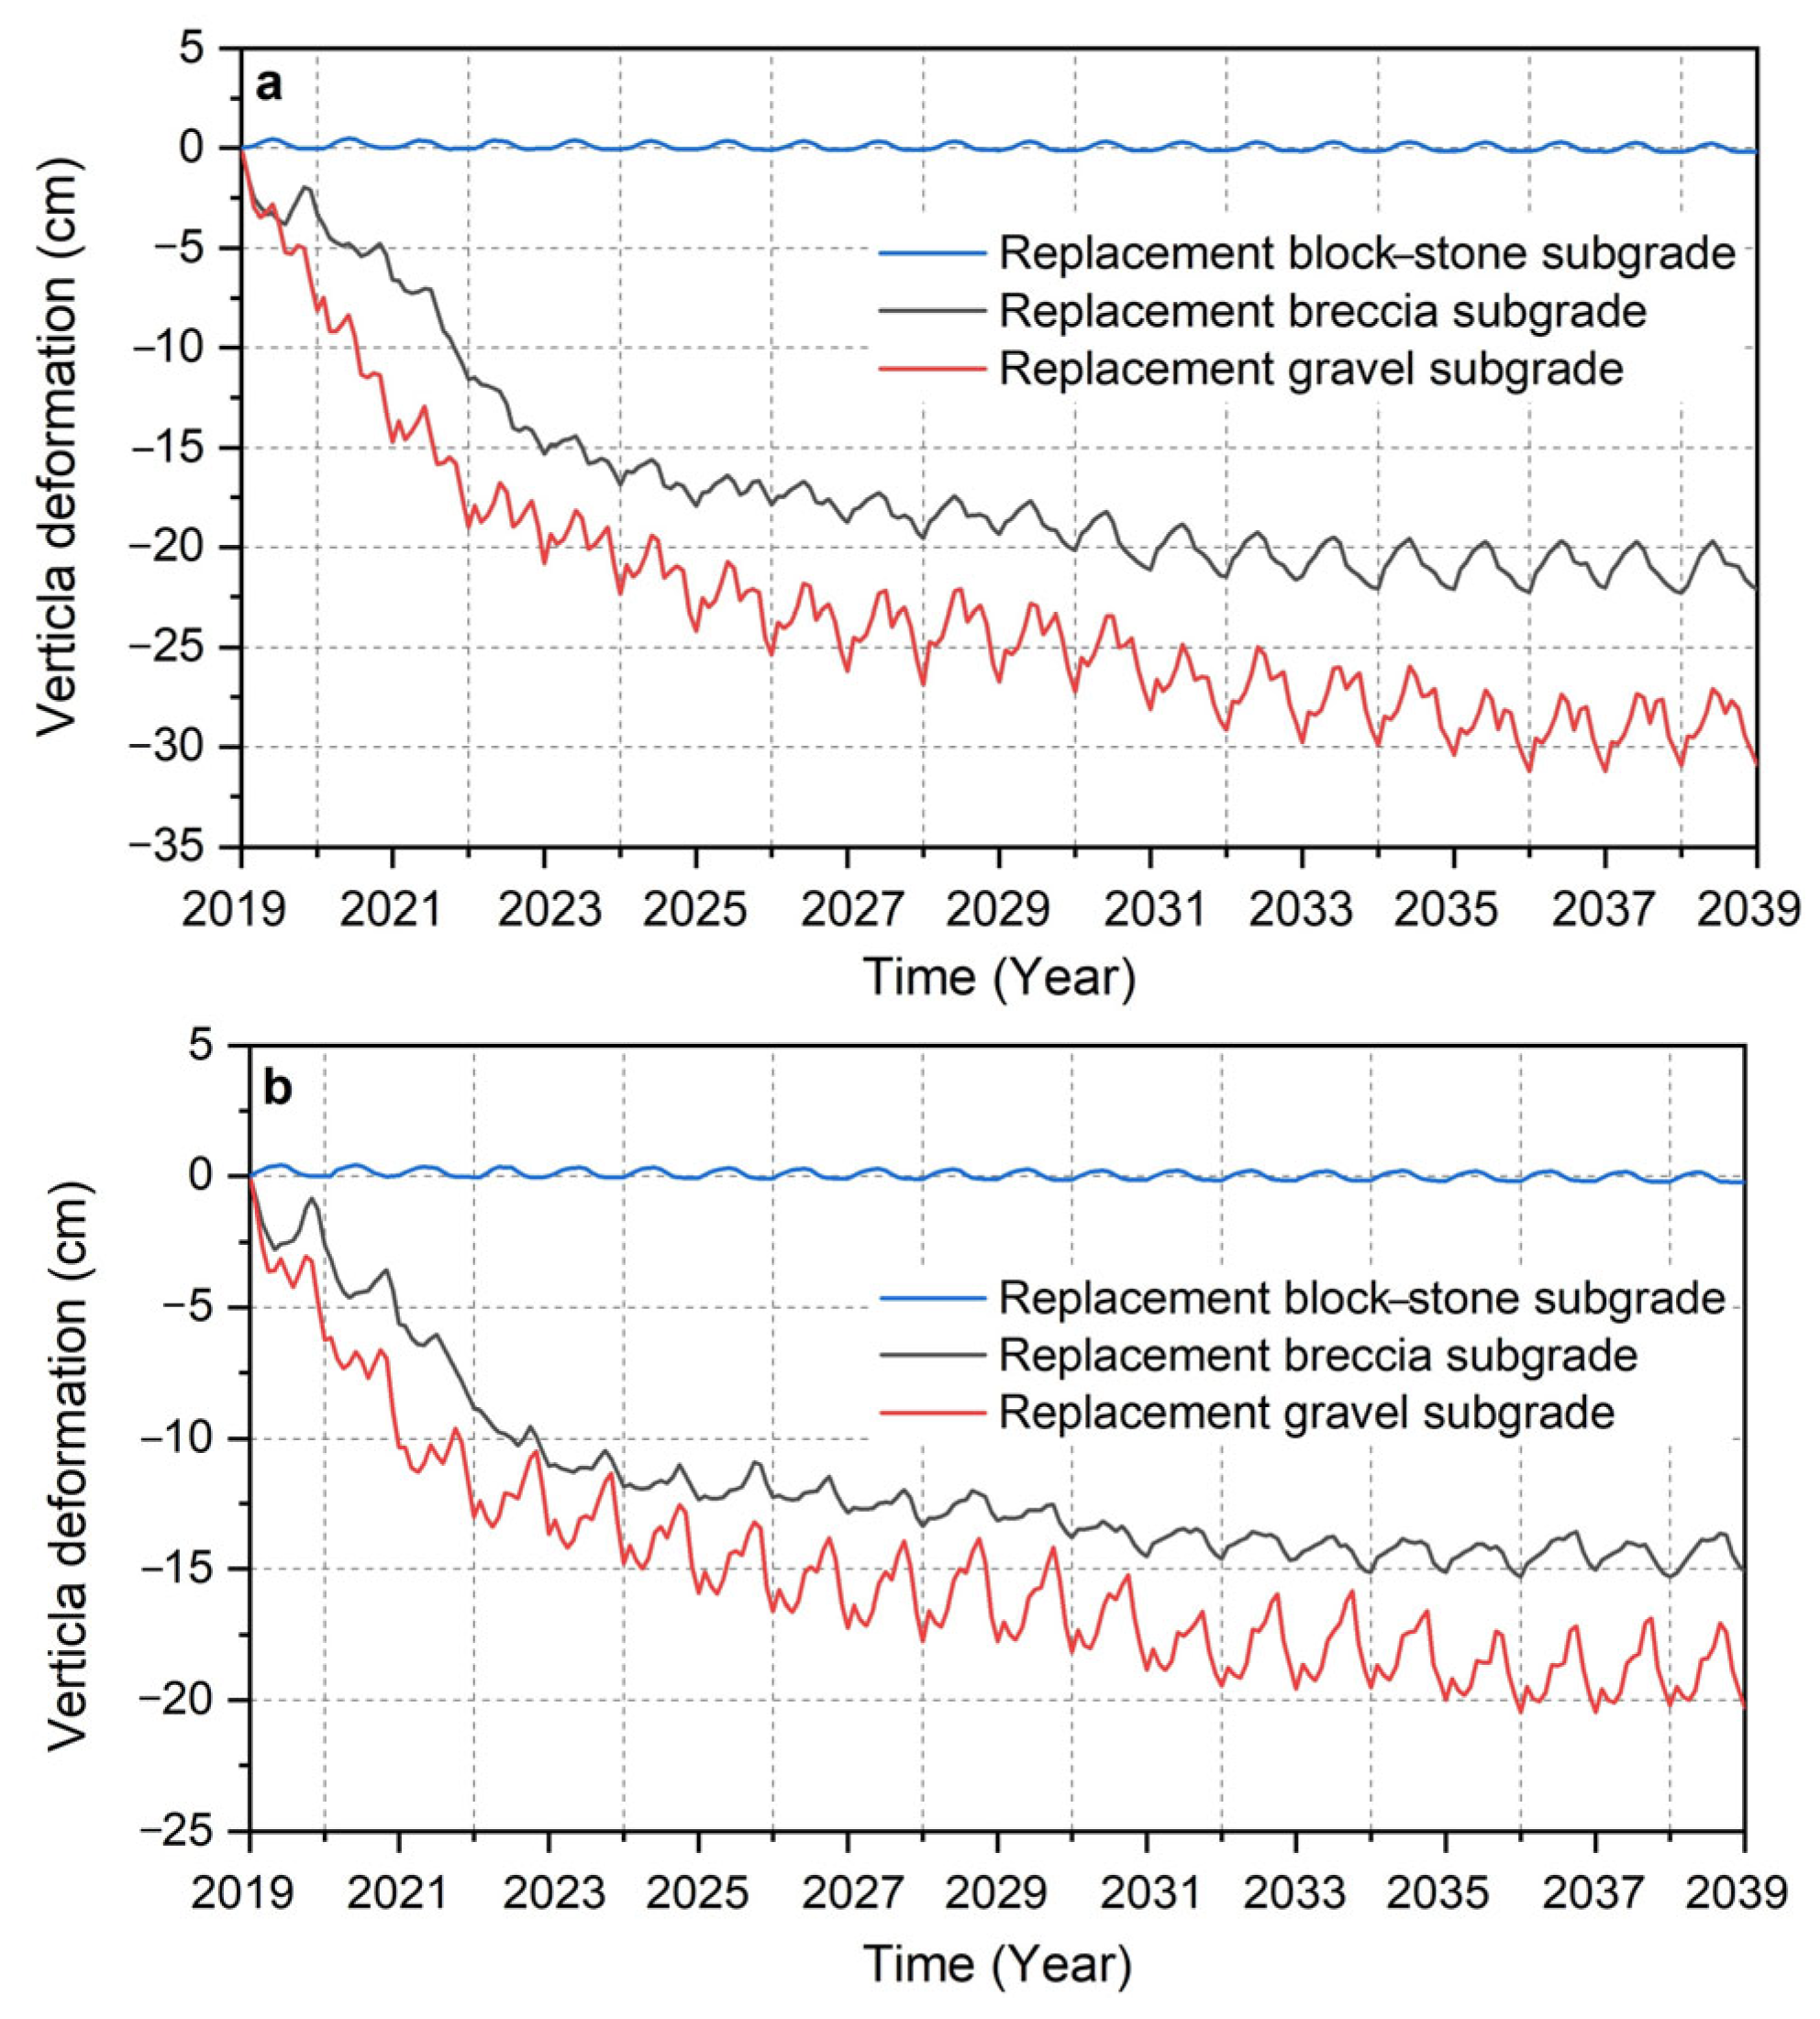
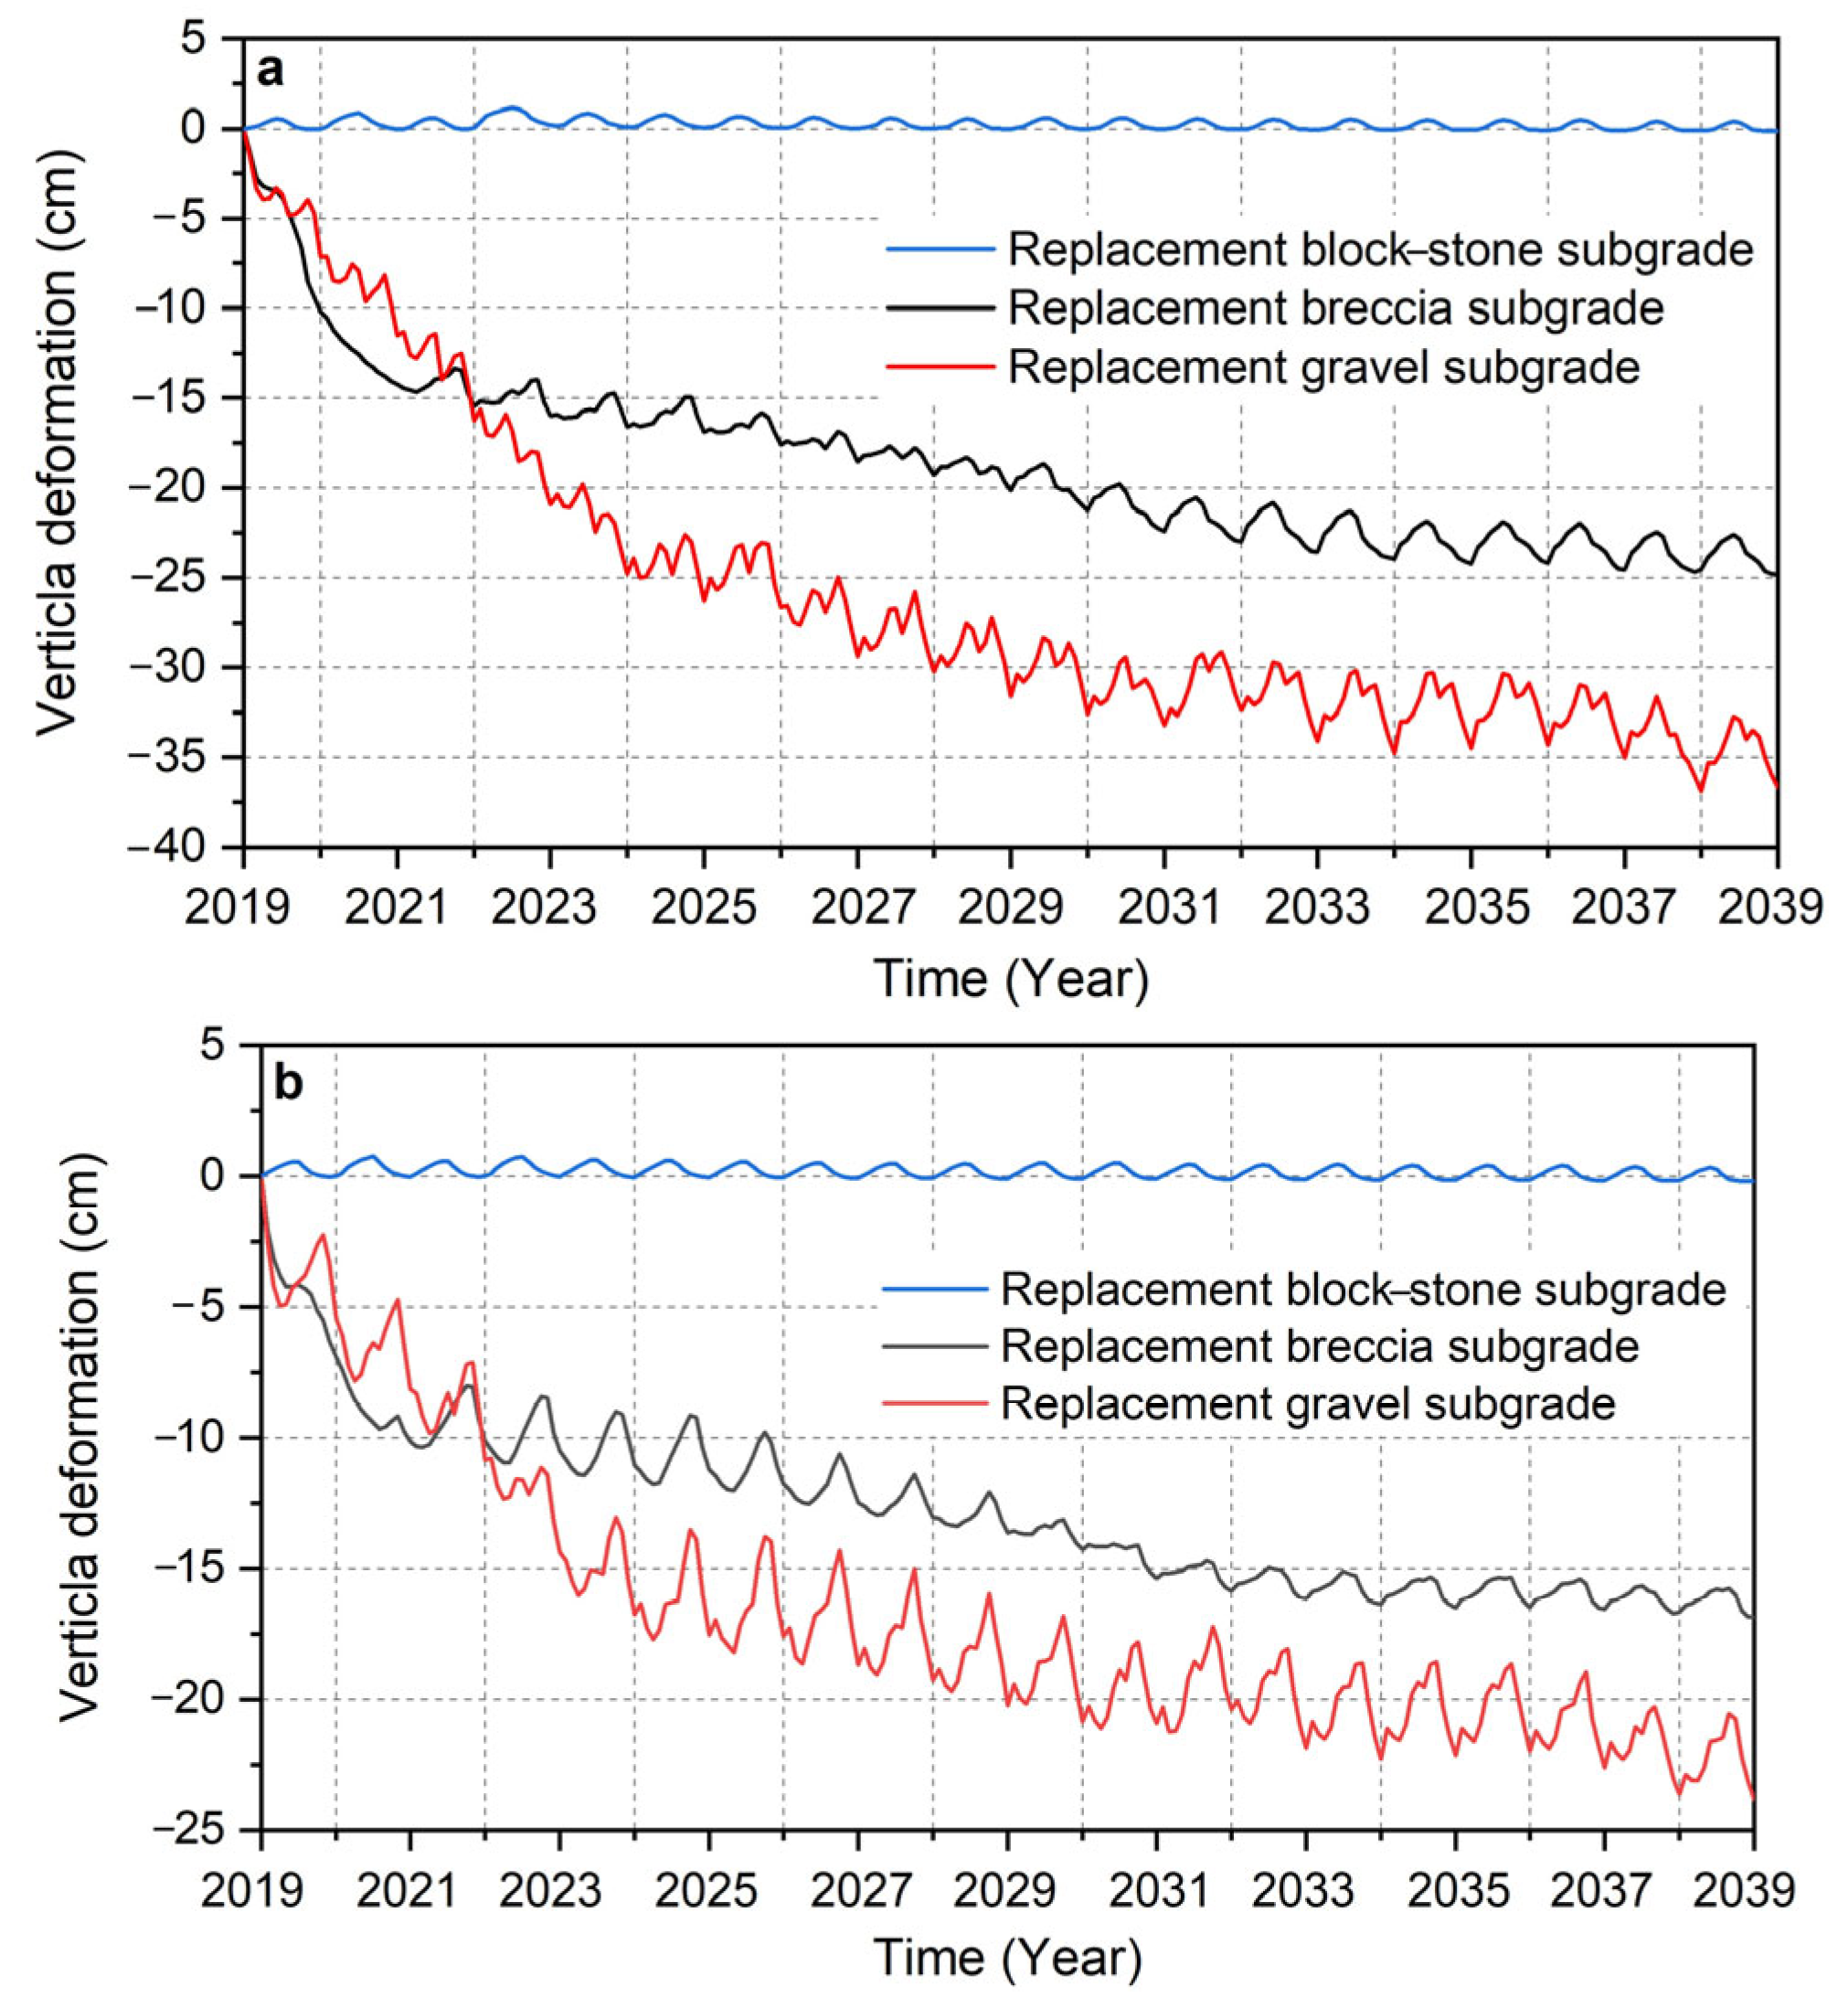
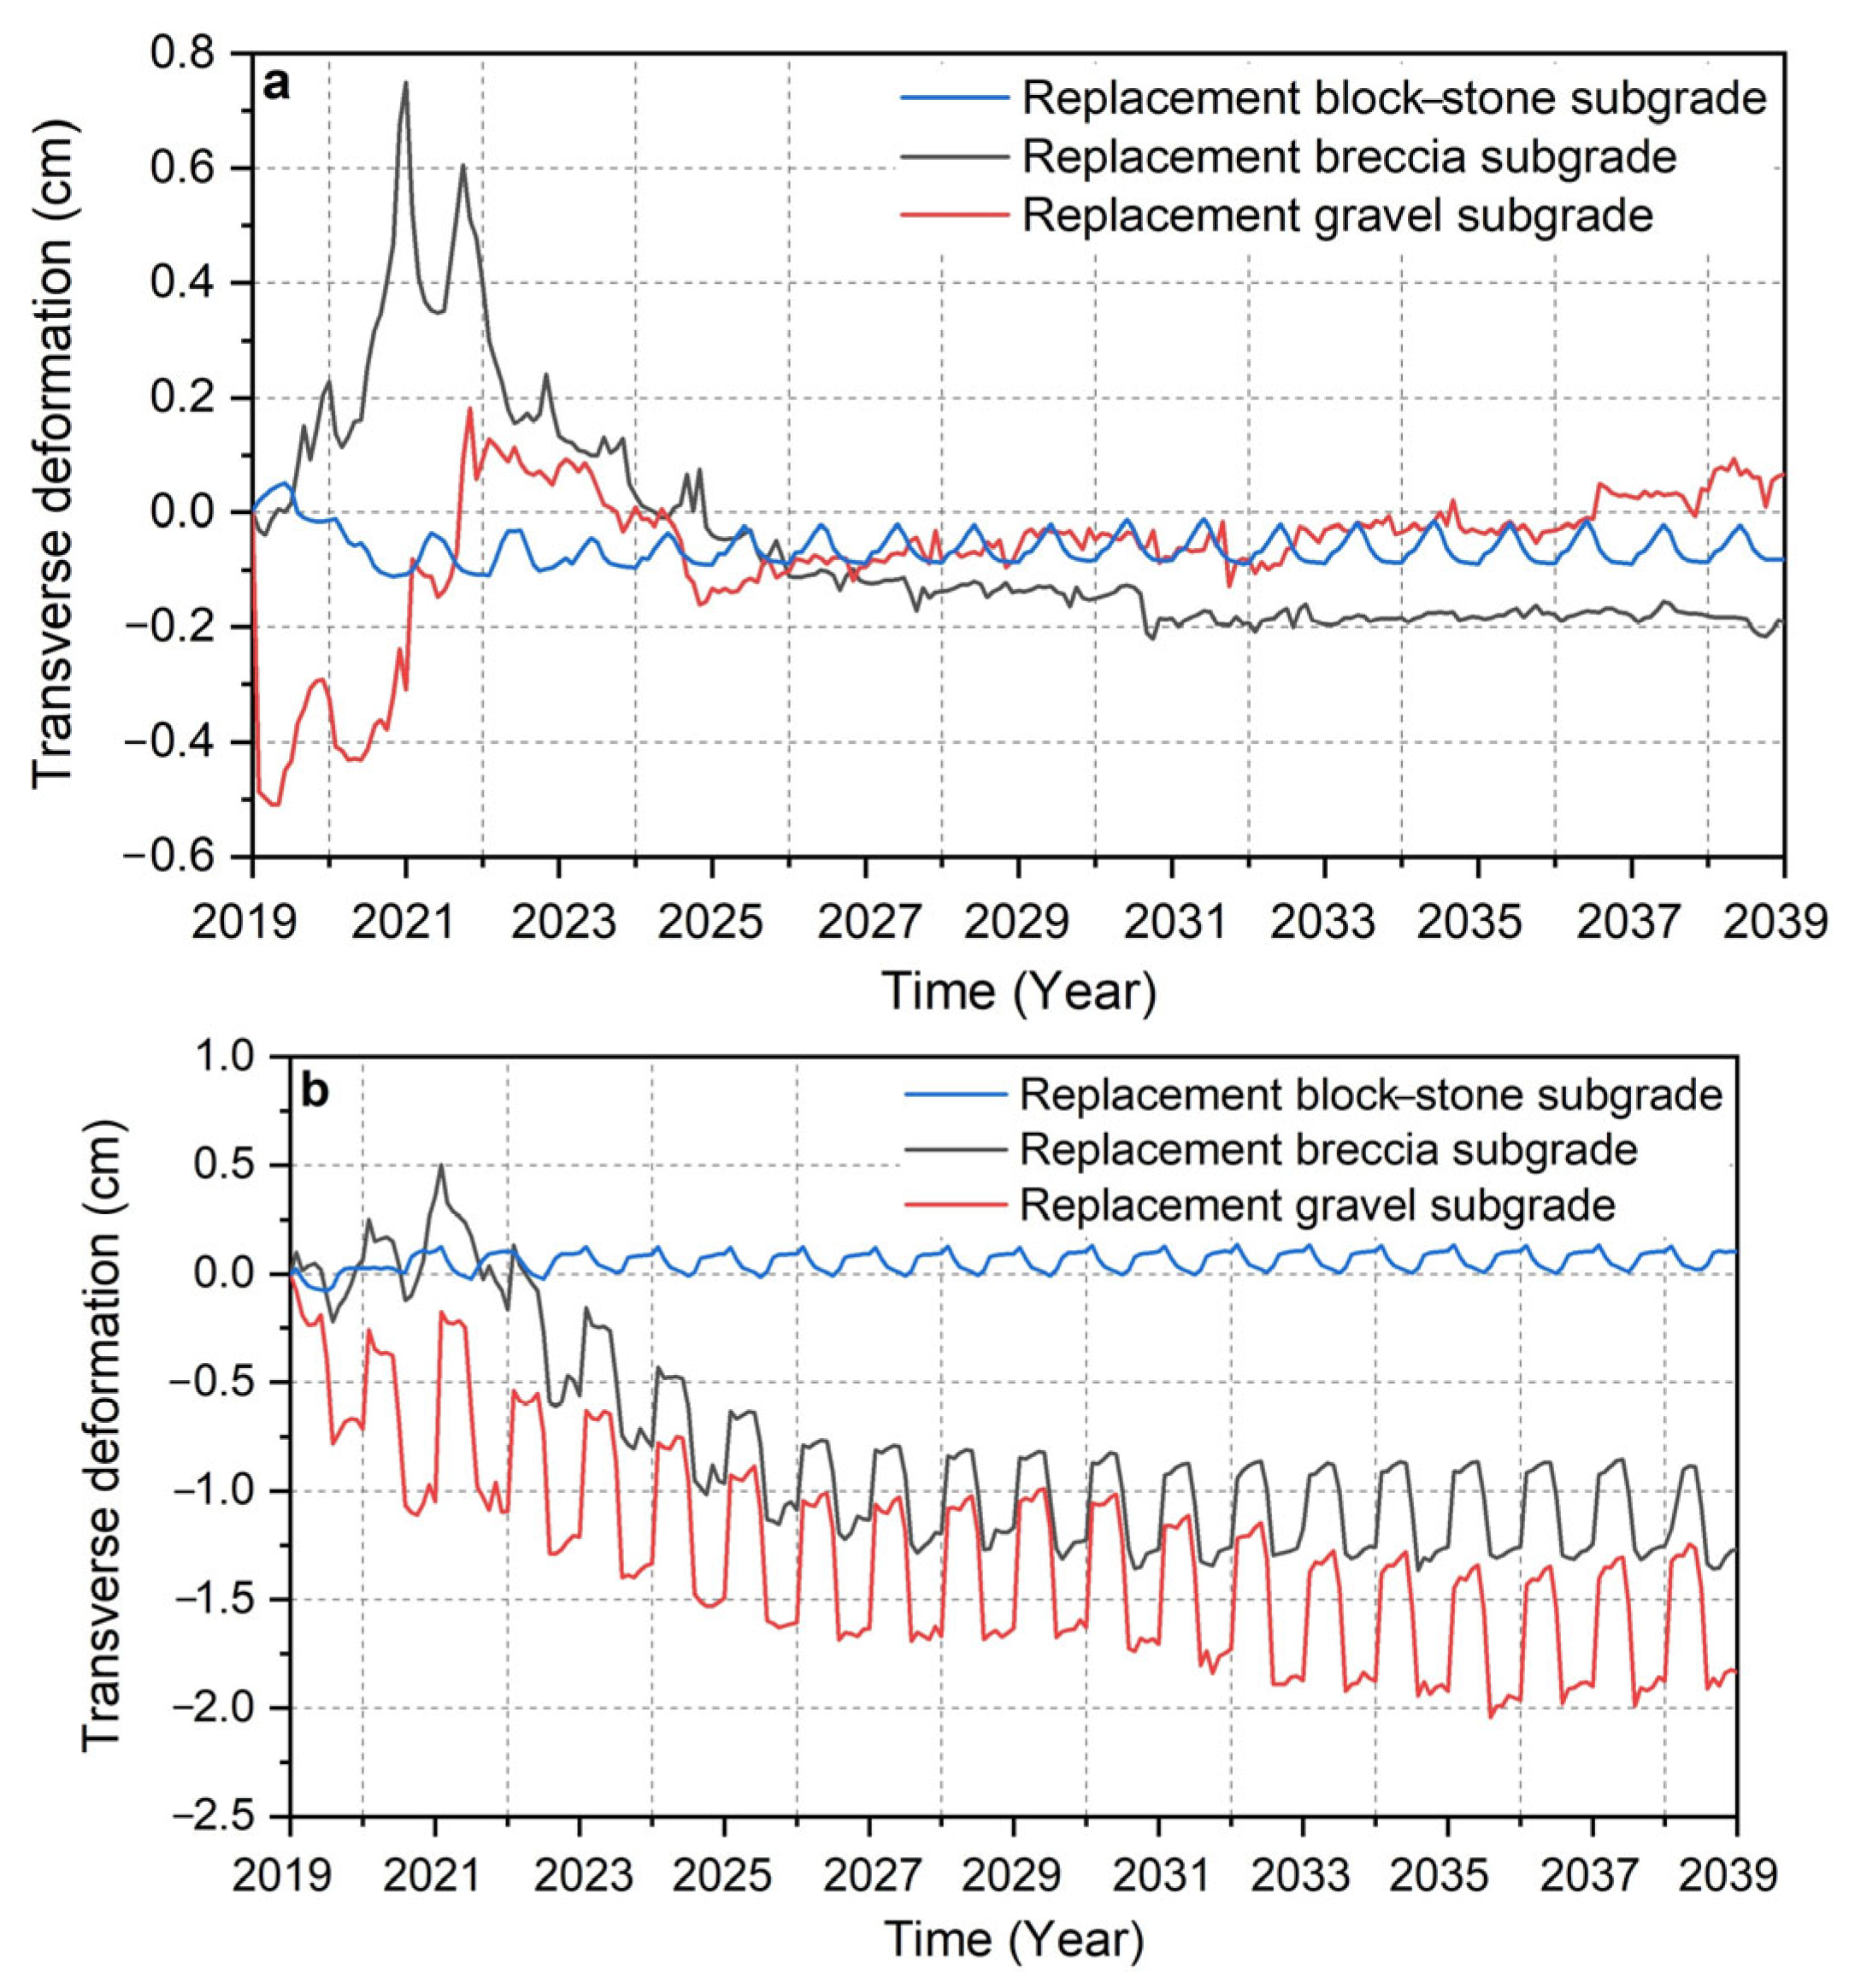
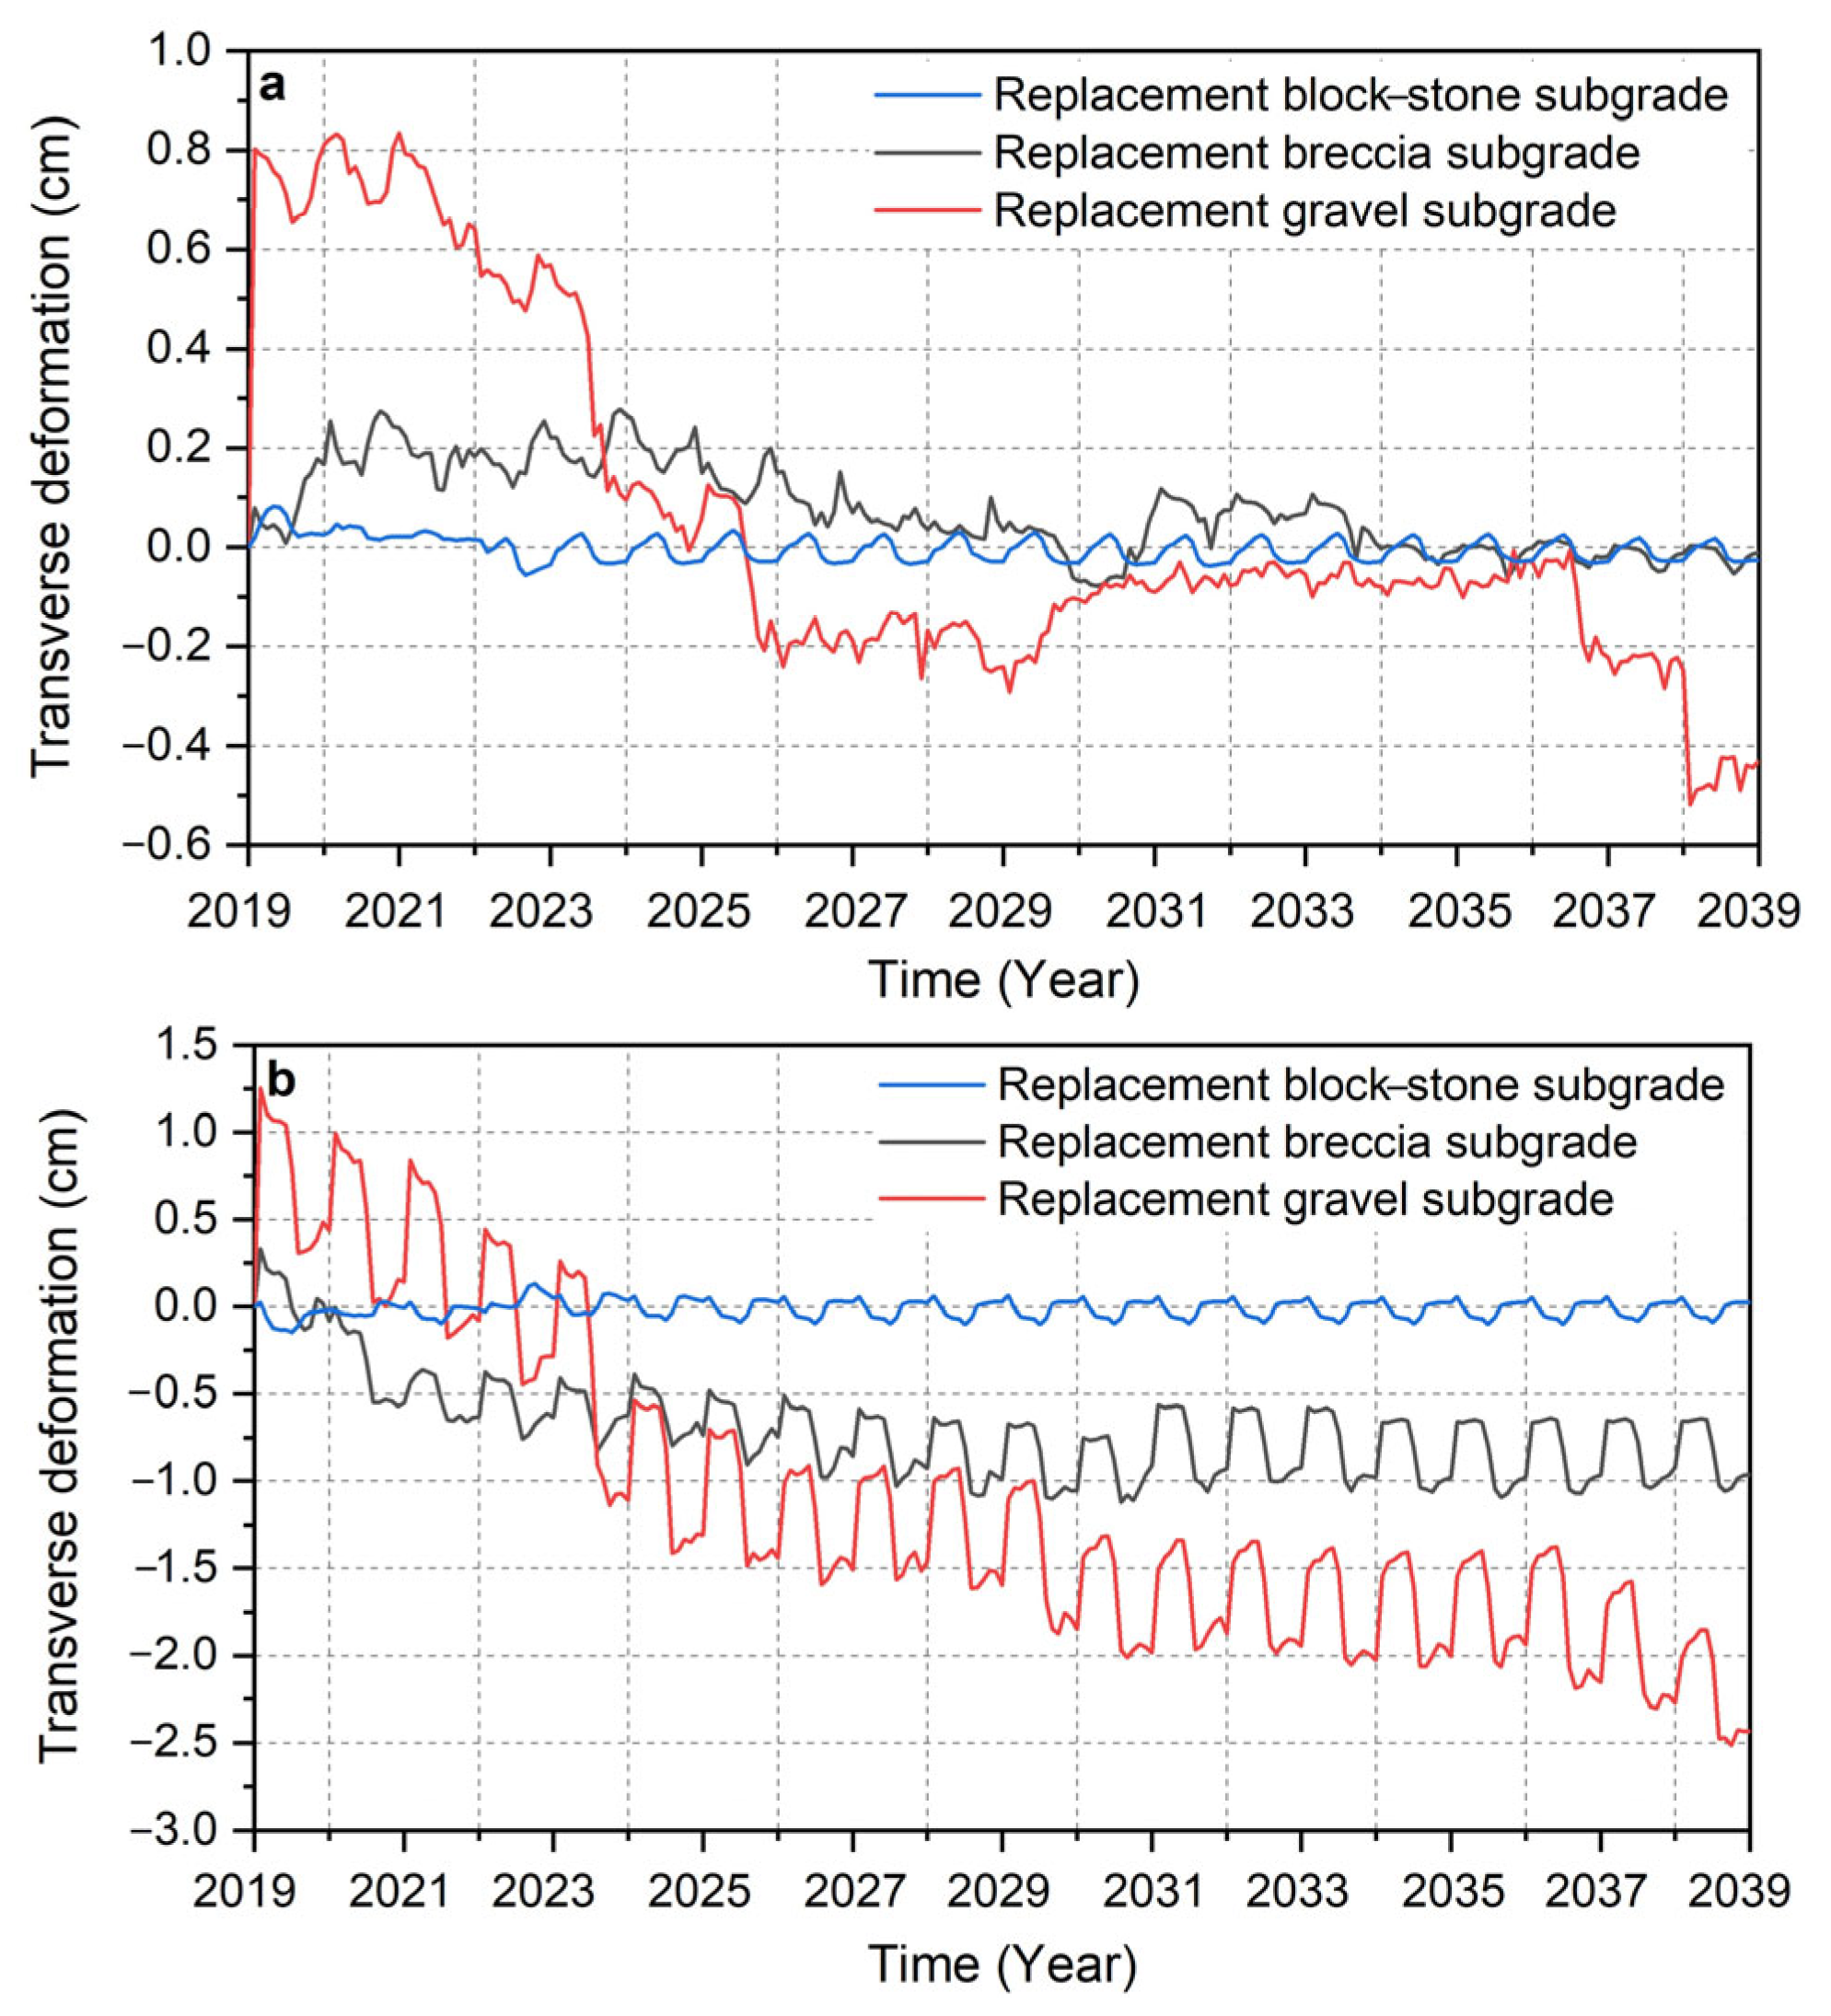
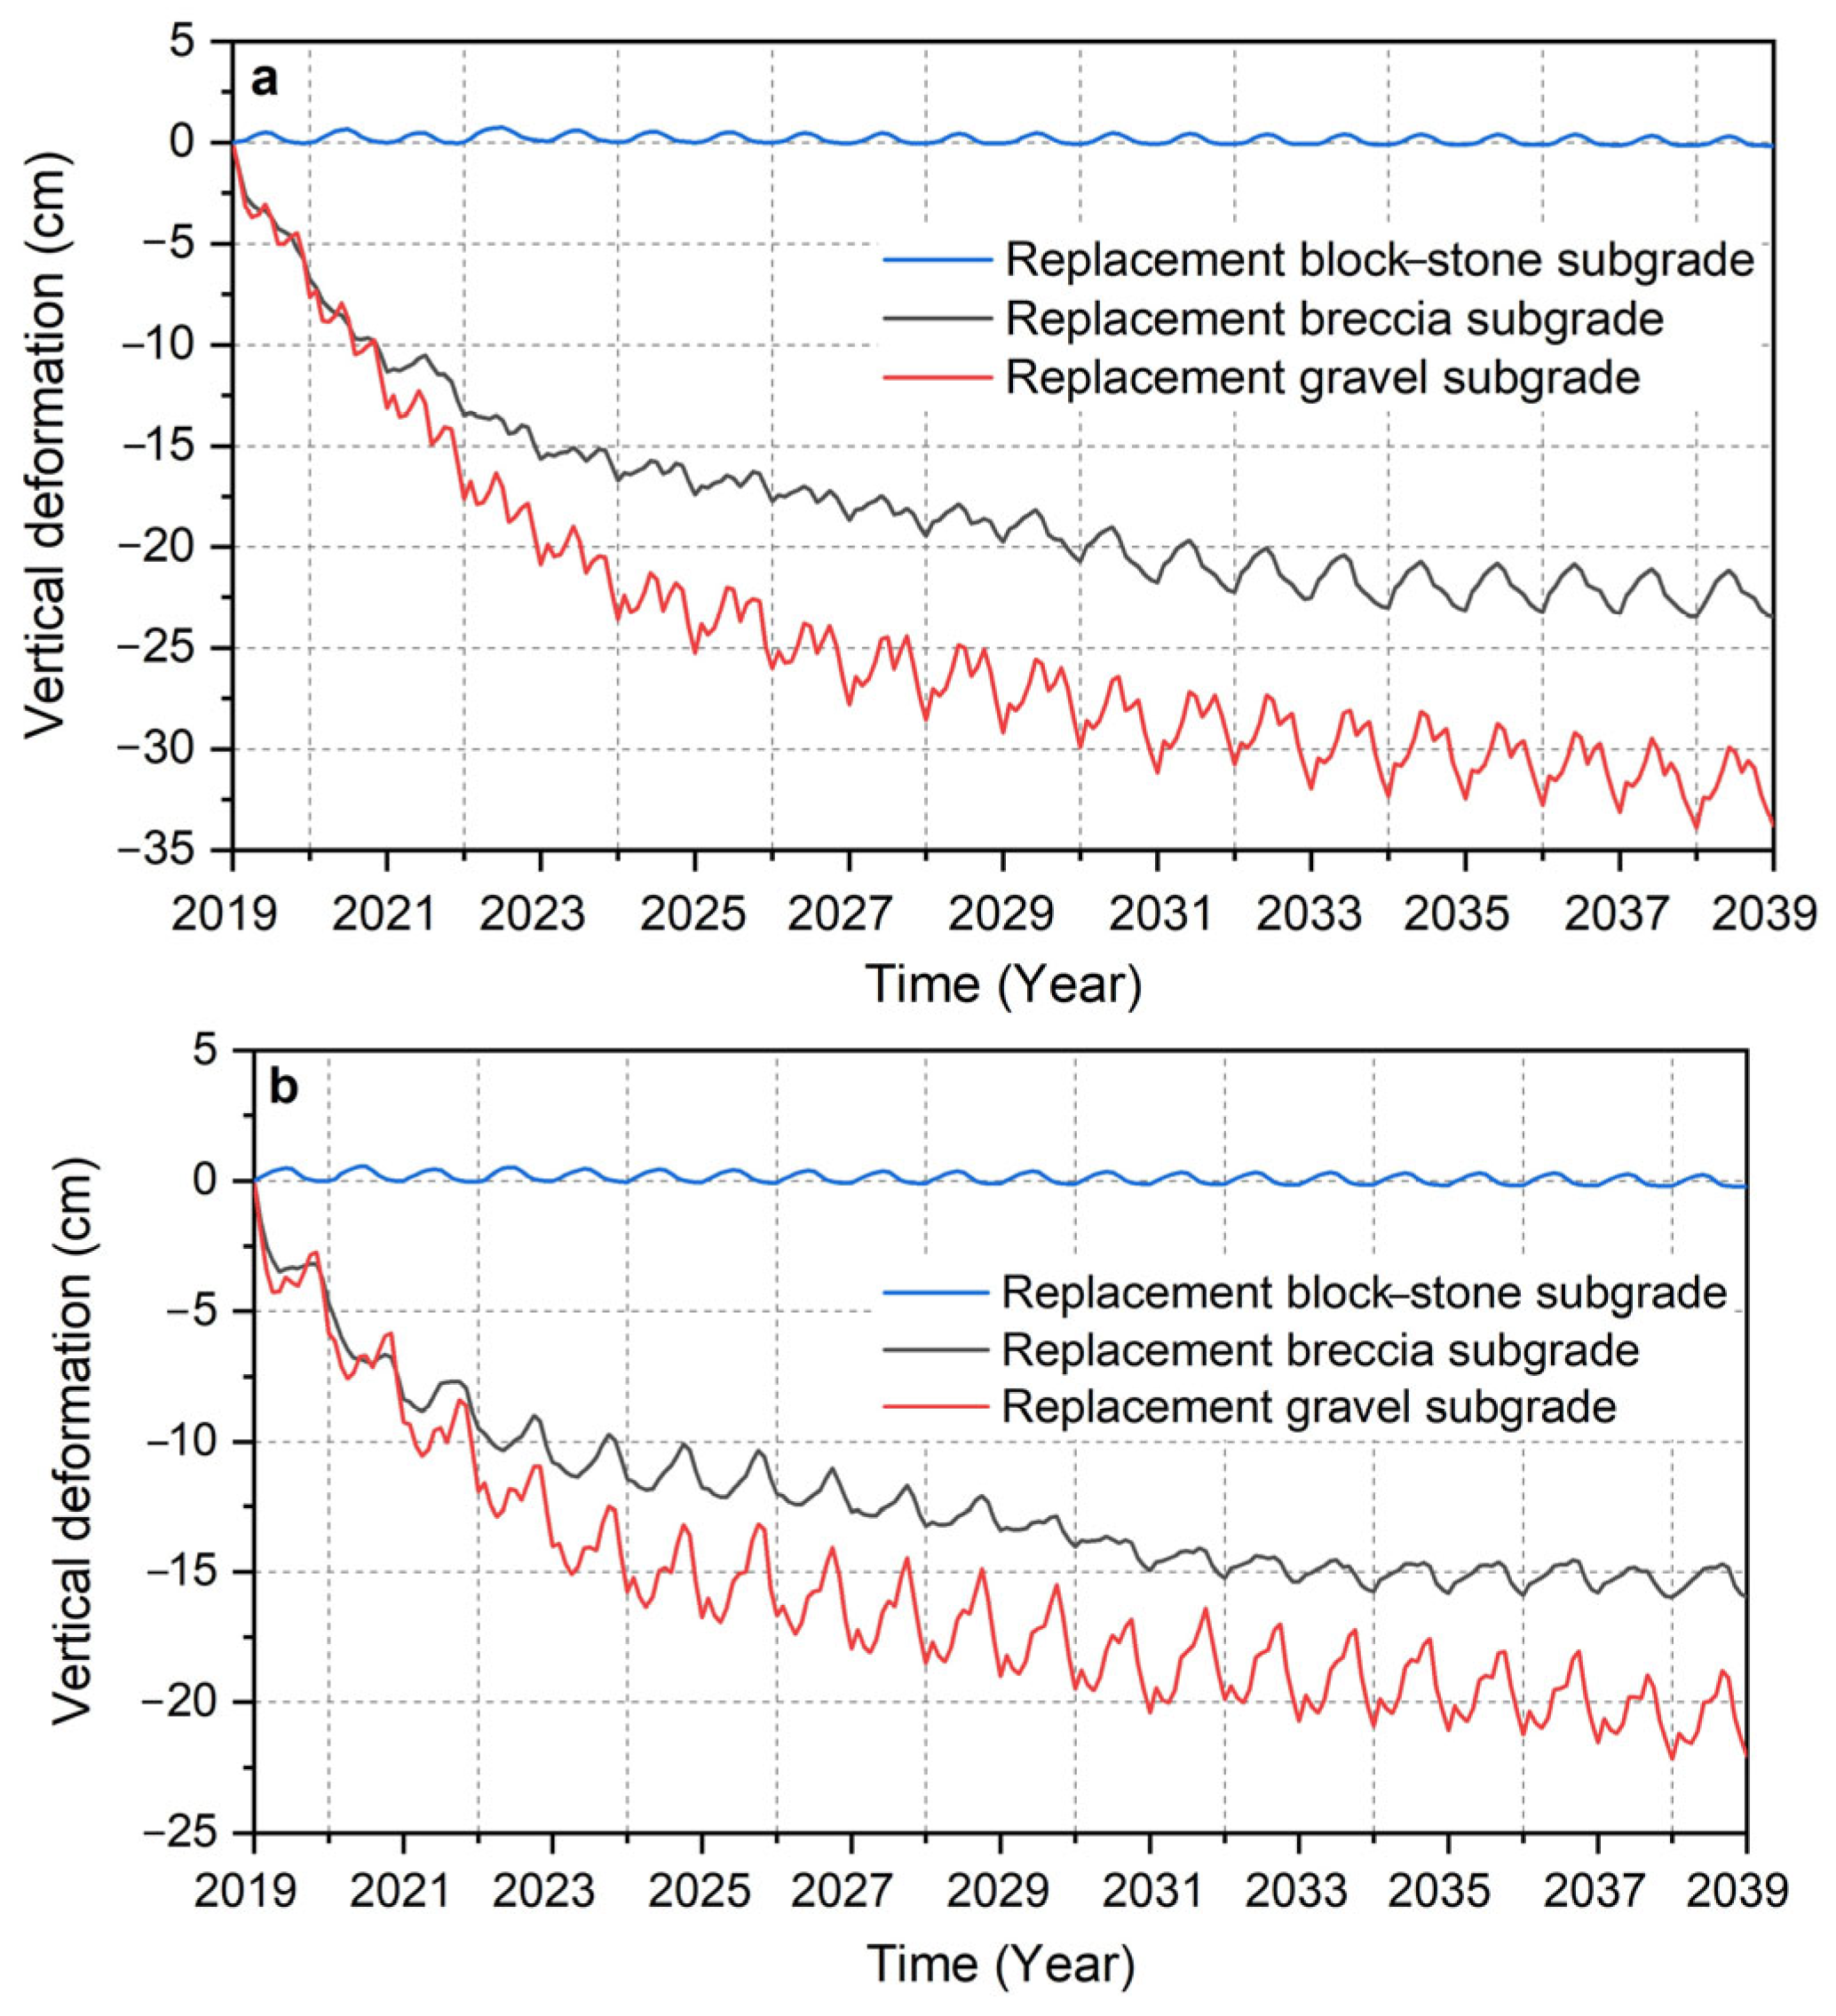
5.3. Comparison of the Deformation at the Road Centerline and the Shoulder of the Three Subgrade Structures in Case 1 and Case 2
6. Conclusions
- (1)
- The replacement block–stone subgrade structure has a higher permafrost table in warm seasons and a thinner thawed interlayer in cold seasons. Compared with the replacement breccia layer and the replacement gravel layer, the replacement block–stone layer can effectively reduce the total heat entering the deep foundation in warm seasons. Its good thermal regulation performance reduces the impact of seasonal temperature changes on subgrade temperature to improve the permafrost table.
- (2)
- The low thermal conductivity of the block–stone layer reduces the temperature gradient between the block–stone layer and the active layer. In addition, the very small matrix potential of the block–stone layer leads to a very small driving force of water migration. The reduction in the driving force of water migration reduces the water supply from the thawed interlayer to the active layer, which reduces the liquid water content in the active layer and finally, reduces the transverse and vertical deformations of the subgrade.
- (3)
- The replacement block–stone layer can effectively resist the local uneven deformation of the foundation, so the settlement of the replacement block–stone subgrade structure is the smallest. After the thawing of the permafrost in the breccia layer and the gravel layer, the strength of these two replacement materials decreases rapidly, and it is difficult for them to resist the uneven deformation of the foundation. Therefore, the cumulative settlement of the two subgrades is relatively large. In addition, the liquefaction characteristics of the gravel lead to a greater settlement of the replacement gravel subgrade than that of the replacement breccia subgrade.
- (4)
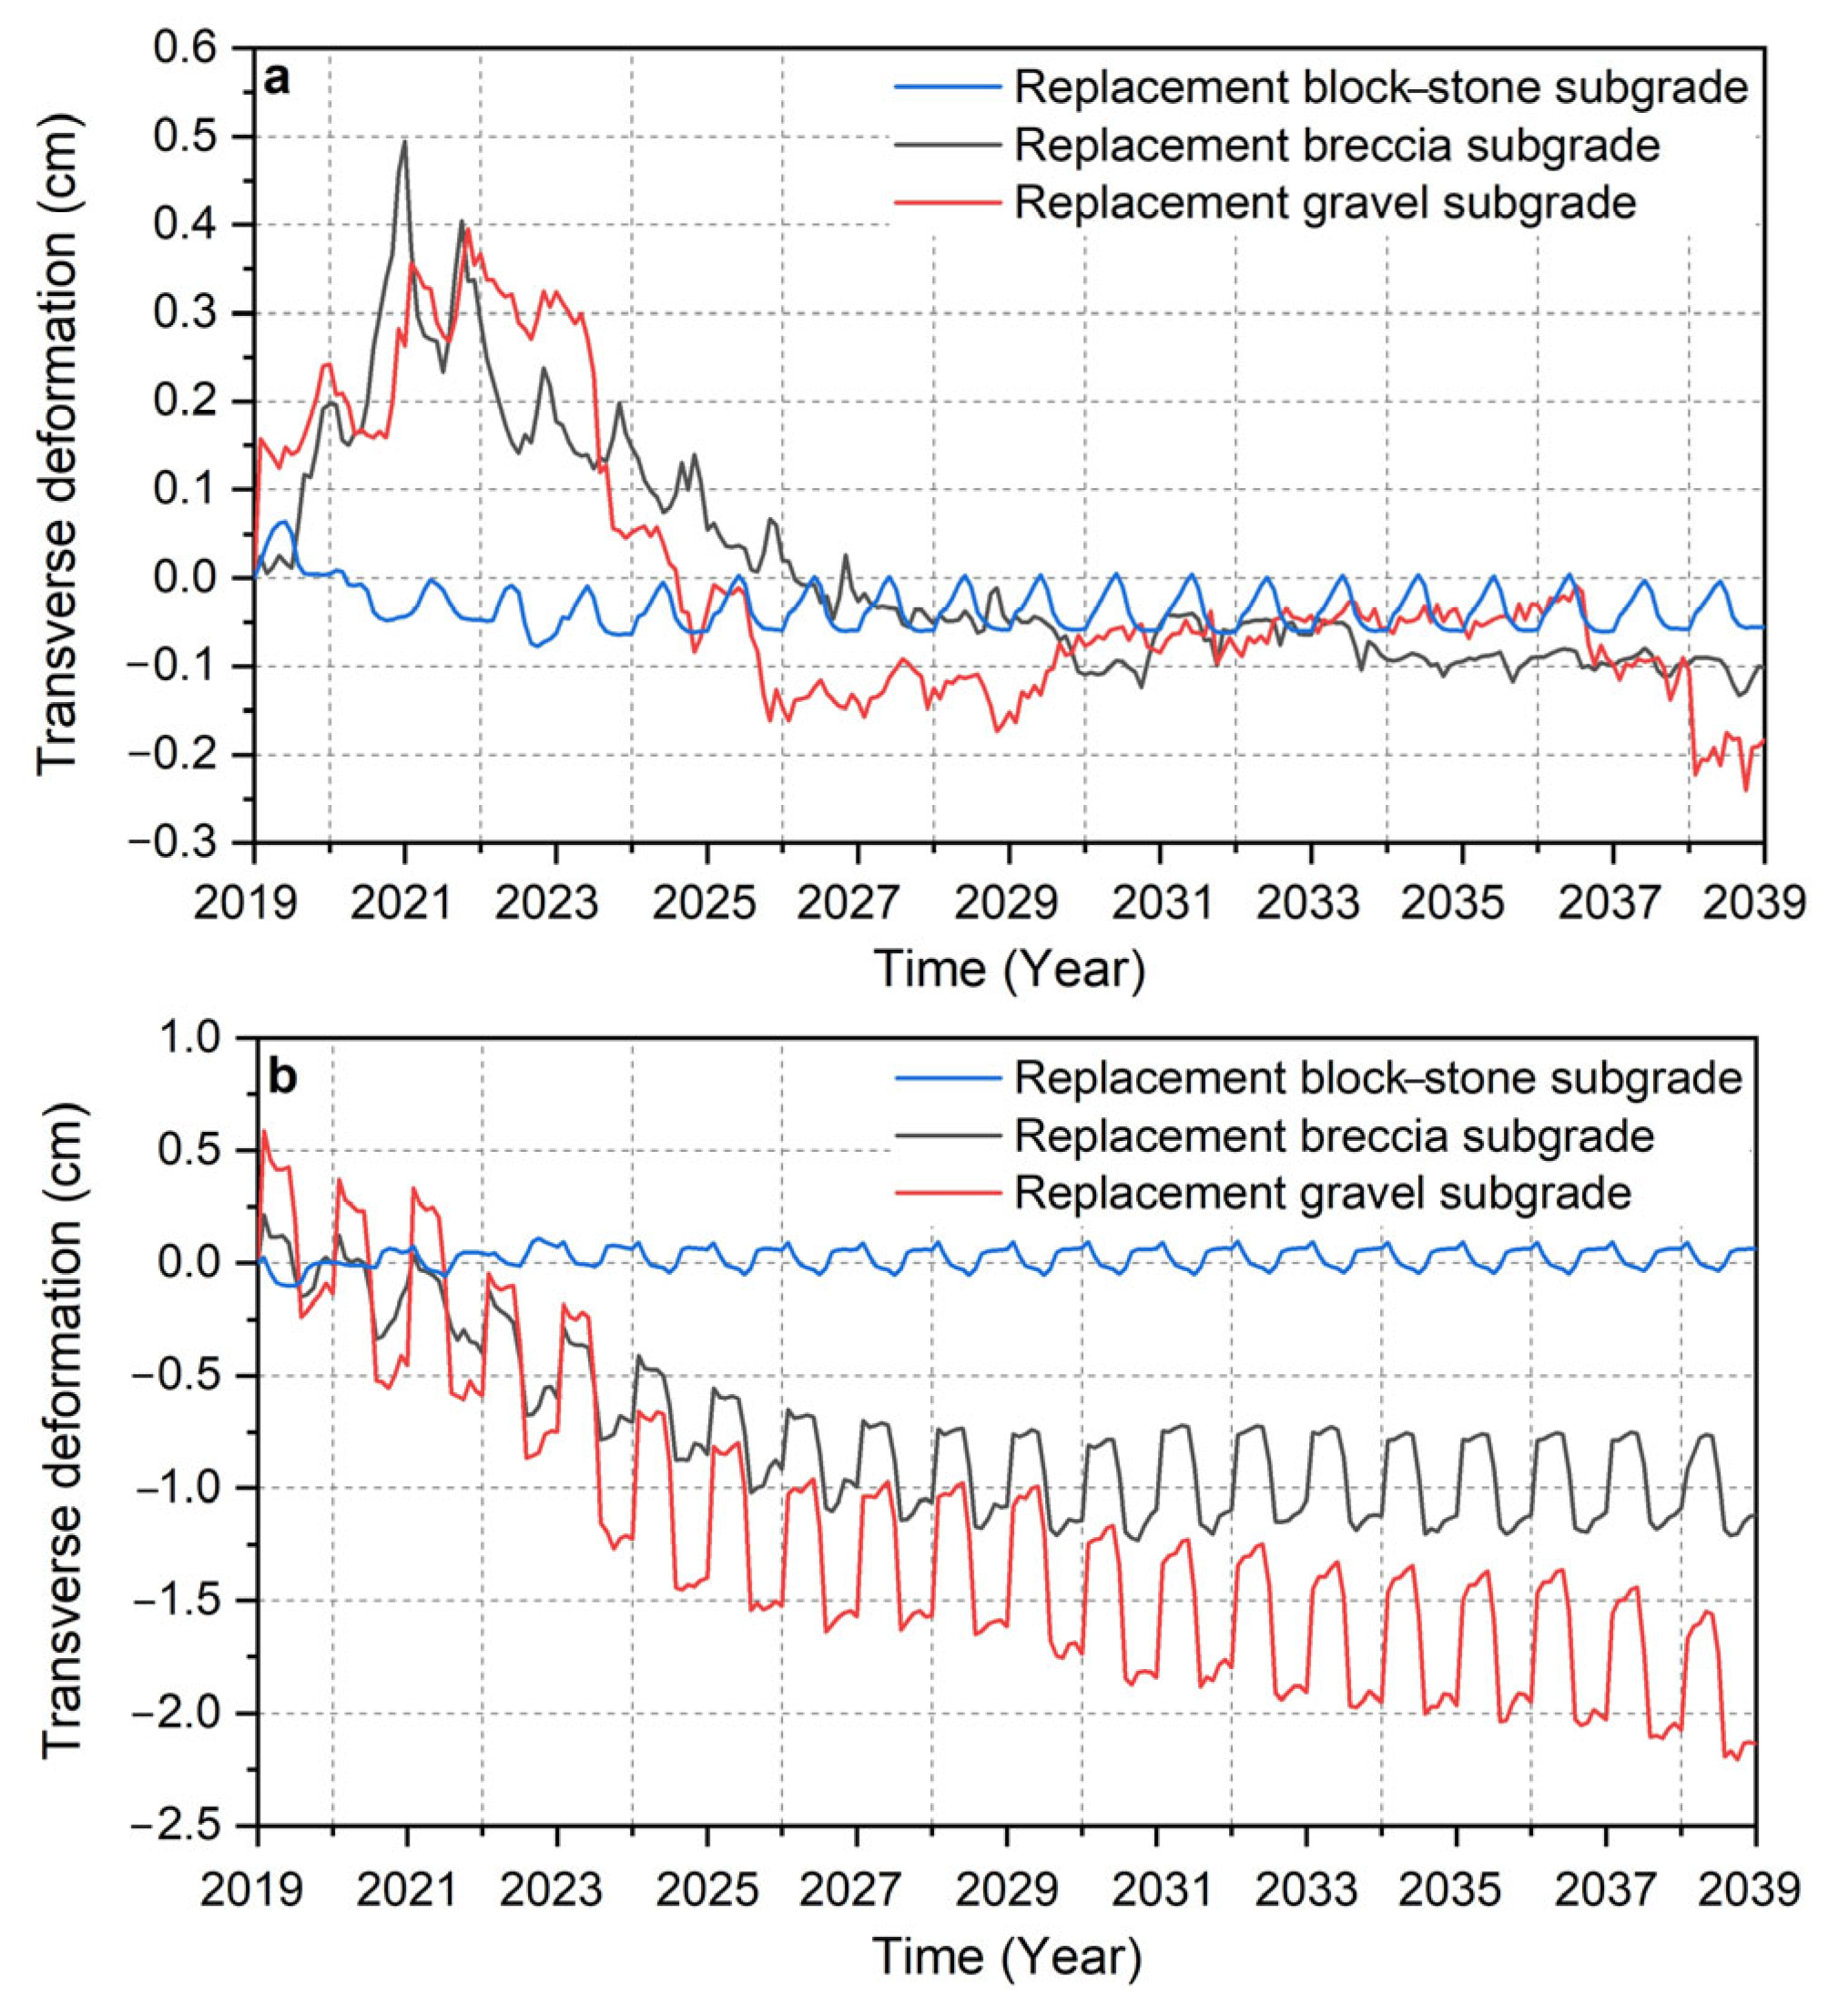
- In cold seasons, when the water in the active layer freezes, two forms of dispersed ice crystals and continuous ice lenses form, which have different retardation effects on water migration. We discussed these effects and corrected the subgrade deformation. The results show that from 2019 to 2039, the maximum cumulative settlement and the maximum transverse deformation of the replacement block–stone subgrade are –0.211 cm and +0.111 cm, respectively. The maximum cumulative settlement and the maximum transverse deformation of the replacement breccia subgrade are –23.467 cm and −1.209 cm, respectively. The maximum cumulative settlement and the maximum transverse deformation of the replacement gravel subgrade are –33.793 cm and –2.207 cm, respectively. The replacement block–stone subgrade structure can not only reduce the cumulative settlement and frost heave but also reduce the transverse deformation and longitudinal cracks to improve the overall stability of the subgrade. In contrast, the vertical and transverse deformation of the replacement breccia subgrade and the replacement gravel subgrade are too large, and even the subgrade fill layer will undergo transverse deformation in the opposite direction, which will cause sliding failure. Therefore, these two subgrade structures cannot be used in permafrost regions.
Author Contributions
Funding
Institutional Review Board Statement
Informed Consent Statement
Data Availability Statement
Acknowledgments
Conflicts of Interest
References
- Gruber, S. Derivation and analysis of a high-resolution estimate of global permafrost zonation. Cryosphere 2012, 6, 221–233. [Google Scholar] [CrossRef]
- Obu, J. How Much of the Earth’s Surface is Underlain by Permafrost? J. Geophys. Res. Earth Surf. 2021, 126, e2021JF006123. [Google Scholar] [CrossRef]
- Wu, Q.; Zhang, Z.; Liu, Y. Long-term thermal effect of asphalt pavement on permafrost under an embankment. Cold Reg. Sci. Technol. 2010, 60, 221–229. [Google Scholar] [CrossRef]
- Zhang, Z.; Wu, Q. Thermal hazards zonation and permafrost change over the Qinghai-Tibet Plateau. Nat. Hazards 2012, 61, 403–423. [Google Scholar] [CrossRef]
- Kondratiev, V.G. Geocryological problems of railroads on permafrost. In Proceedings of the 10th International Symposium on Cold Regions Development, Anchorage, AK, USA, 2–5 June 2013; pp. 191–203. [Google Scholar] [CrossRef]
- Addison, P.E.; Lautala, P.; Oommen, T.; Vallos, Z. Embankment stabilization techniques for railroads on permafrost. In Proceedings of the 2016 Joint Rail Conference, Columbia, SC, USA, 12–15 April 2016; p. V001T01A008. [Google Scholar] [CrossRef]
- Stephani, E.; Fortier, D.; Shur, Y.; Fortier, R.; Doré, G. A geosystems approach to permafrost investigations for engineering applications, an example from a road stabilization experiment, Beaver Creek, Yukon, Canada. Cold Reg. Sci. Technol. 2014, 100, 20–35. [Google Scholar] [CrossRef]
- Cheng, G. A roadbed cooling approach for the construction of Qinghai–Tibet Railway. Cold Reg. Sci. Technol. 2005, 42, 169–176. [Google Scholar] [CrossRef]
- IPCC; Masson-Delmotte, P.; Zhai, A.; Pirani, S.L.; Connors, C.; Péan, S.; Berger, N.; Caud, Y.; Chen, L.; Goldfarb, M.I.; et al. Climate Change 2021: The Physical Science Basis. In Contribution of Working Group I to the Sixth Assessment Report of the Intergovernmental Panel on Climate Change; Cambridge University Press: Cambridge, UK, 2021. [Google Scholar]
- Zhou, Z.; Ma, W.; Zhang, S.; Du, H.; Mu, Y.; Li, G. Multiaxial creep of frozen loess. Mech. Mater. 2016, 95, 172–191. [Google Scholar] [CrossRef]
- Maslikova, O.Y.; Debolsky, V.K.; Ionov, D.N.; Gritsuk, I.I.; Sinichenko, E.K. Strength of frozen soils during thawing. J. Phys. Conf. Ser. 2020, 1687, 012039. [Google Scholar] [CrossRef]
- Yongjie, L.; Shaopu, Y.; Jianxi, W. Research on pavement longitudinal crack propagation under non-uniform vehicle loading. Eng. Fail. Anal. 2014, 42, 22–31. [Google Scholar] [CrossRef]
- Liu, M.; Niu, F.; Ma, W.; Fang, J.; Lin, Z.; Luo, J. Experimental investigation on the enhanced cooling performance of a new crushed-rock revetment embankment in warm permafrost regions. Appl. Therm. Eng. 2017, 120, 121–129. [Google Scholar] [CrossRef]
- Liu, J.J.; Xie, J. Numerical simulation of thermo-hydro-mechanical coupling around underground pipelines in patchy permafrost region. Rock Soil Mech. 2013, 34, 444–450. [Google Scholar]
- Qian, J.; Yu, Q.; You, Y.; Hu, J.; Guo, L. Analysis on the convection cooling process of crushed-rock embankment of high-grade highway in permafrost regions. Cold Reg. Sci. Technol. 2012, 78, 115–121. [Google Scholar] [CrossRef]
- Zhang, M.; Zhang, X.; Li, S.; Lu, J.; Pei, W. Effect of Temperature Gradients on the Frost Heave of a Saturated Silty Clay with a Water Supply. J. Cold Reg. Eng. 2017, 31, 04017011. [Google Scholar] [CrossRef]
- Jin, H.; Yu, Q.; Lü, L.; Guo, D.; He, R.; Yu, S.; Sun, G.; Li, Y. Degradation of permafrost in the Xing’anling Mountains, northeastern China. Permafr. Periglac. Process. 2007, 18, 245–258. [Google Scholar] [CrossRef]
- Li, S.; Lai, Y.; Zhang, M.; Yu, W. Seasonal differences in seismic responses of embankment on a sloping ground in permafrost regions. Soil Dyn. Earthq. Eng. 2015, 76, 122–135. [Google Scholar] [CrossRef]
- Pei, W.; Zhang, M.; Li, S.; Lai, Y.; Jin, L. Thermo-mechanical stability analysis of cooling embankment with crushed-rock interlayer on a sloping ground in permafrost regions. Appl. Therm. Eng. 2017, 125, 1200–1208. [Google Scholar] [CrossRef]
- Jilin, Q.; Yu, S.; Jianming, Z.; Zhi, W. Settlement of embankments in permafrost regions in the Qinghai-Tibet Plateau. Nor. Geogr. Tidsskr. 2007, 61, 49–55. [Google Scholar] [CrossRef]
- Shan, W.; Ma, M.; Guo, Y.; Zhang, C. Numerical analysis of the influence of block-stone embankment filling height on the water, temperature, and deformation distributions of subgrade in permafrost regions. Water 2022, 14, 1382. [Google Scholar] [CrossRef]
- Zhang, H.; Zhang, J.; Zhang, Z.; Chen, J.; You, Y. A consolidation model for estimating the settlement of warm permafrost. Comput. Geotech. 2016, 76, 43–50. [Google Scholar] [CrossRef]
- Gandahl, R. Some aspects of the design of roads with boards of plastic foam. In Proceedings of the 3rd International Conference on Permafrost, Edmonton, AB, Canada, 1 January 1978; pp. 792–797. [Google Scholar]
- Jan, L. Permafrost. In Fourth International Conference, Final Proceedings; National Academy of Sciences, Ed.; National Academy Press: Washington, DC, USA, 1983; p. 1524. ISBN 0-309-03435-3. [Google Scholar]
- Zhang, M.; Zhang, J.; Lai, Y. Numerical analysis for critical height of railway embankment in permafrost regions of Qinghai-Tibetan plateau. Cold Reg. Sci. Technol. 2005, 41, 111–120. [Google Scholar] [CrossRef]
- Yu, W.; Liu, W.; Chen, L.; Yi, X.; Han, F.; Hu, D. Evaluation of cooling effects of crushed rock under sand-filling and climate warming scenarios on the Tibet Plateau. Appl. Therm. Eng. 2016, 92, 130–136. [Google Scholar] [CrossRef]
- Yu, W.; Lai, Y.; Zhang, X.; Zhang, S.; Xiao, J. Laboratory investigation on cooling effect of coarse rock layer and fine rock layer in permafrost regions. Cold Reg. Sci. Technol. 2004, 38, 31–42. [Google Scholar] [CrossRef]
- Li, G.; Li, N.; Kang, J. Preliminary study on cooling effect mechanisms of Qinghai-Tibet railway embankment with open crushed-stone side slope in permafrost regions. Cold Reg. Sci. Technol. 2006, 45, 193–201. [Google Scholar] [CrossRef]
- Chang, Y.; Yu, Q.; You, Y.; Guo, L. Formation mechanism of longitudinal cracks in expressway embankments with inclined thermosyphons in warm and ice-rich permafrost regions. Appl. Therm. Eng. 2018, 133, 21–32. [Google Scholar] [CrossRef]
- Goering, D.J. Experimental investigation of air convection embankments for permafrost-resistant road design. In Proceedings of the Seventh International Conference on Permafrost, Yellowknife, NT, Canada, 1 January 1998; pp. 319–326. [Google Scholar]
- Goering, D.J. Passively Cooled Railway Embankments for Use in Permafrost Areas. J. Cold Reg. Eng. 2003, 17, 119–133. [Google Scholar] [CrossRef]
- Ma, W.; Feng, G.; Wu, Q.; Wu, J. Analyses of temperature fields under the embankment with crushed-rock structures along the Qinghai-Tibet Railway. Cold Reg. Sci. Technol. 2008, 53, 259–270. [Google Scholar] [CrossRef]
- Mu, Y.; Ma, W.; Liu, Y.; Sun, Z. Monitoring investigation on thermal stability of air-convection crushed-rock embankment. Cold Reg. Sci. Technol. 2010, 62, 160–172. [Google Scholar] [CrossRef]
- Mu, Y.; Ma, W.; Wu, Q.; Sun, Z.; Liu, Y. Cooling processes and effects of crushed rock embankment along the Qinghai-Tibet Railway in permafrost regions. Cold Reg. Sci. Technol. 2012, 78, 107–114. [Google Scholar] [CrossRef]
- Guo, Y.; Shan, W.; Zhang, C.; Hu, Z.; Wang, S.; Gao, J. Monitoring of permafrost degradation along the Bei’an-Heihe Expressway in China. Bull. Eng. Geol. Environ. 2021, 80, 1–10. [Google Scholar] [CrossRef]
- Liu, Y.; Wu, Q.; Zhang, J.; Sheng, Y. Deformation of Highway Roadbed in Permafrost Regions of the Tibetan Plateau. J. Glaciol. Geocryol. 2002, 1, 10–15. [Google Scholar] [CrossRef]
- Peng, H.; Ma, W.; Mu, Y.H.; Jin, L.; Zhu, D.P. Analysis of disease investigation and long-term deformation characteristics of common fill embankment of the Qinghai-Tibet Highway. Rock Soil Mech. 2015, 36, 2049–2056. [Google Scholar] [CrossRef]
- Hartikainen, J.; Mikkola, M. General thermodynamical model of freezing soil with numercal application. In Ground Freezing 97: Frost Action in Soils: Proceedings of an International Symposium; Knutsson, S., Ed.; BALKEMA: Rotterdam, The Netherlands, 1997; pp. 101–105. [Google Scholar]
- Wu, W.Z.; Ma, W. Strength and Creep of Frozen Soil; Lanzhou University Press: Lanzhou, China, 1994. [Google Scholar]
- Liu, Z.; Yu, X. Coupled thermo-hydro-mechanical model for porous materials under frost action: Theory and implementation. Acta Geotech. 2011, 6, 51–65. [Google Scholar] [CrossRef]
- Obu, J.; Westermann, S.; Bartsch, A.; Berdnikov, N.; Christiansen, H.H.; Dashtseren, A.; Delaloye, R.; Elberling, B.; Etzelmüller, B.; Kholodov, A.; et al. Northern Hemisphere permafrost map based on TTOP modelling for 2000–2016 at 1 km2 scale. Earth-Sci. Rev. 2019, 193, 299–316. [Google Scholar] [CrossRef]
- Shan, W.; Xu, Z.; Guo, Y.; Zhang, C.; Hu, Z.; Wang, Y. Geological methane emissions and wildfire risk in the degraded permafrost area of the Xiao Xing’an Mountains, China. Sci. Rep. 2020, 10, 21297. [Google Scholar] [CrossRef] [PubMed]
- Zhang, T.; Youwu, Z.; Dongxin, G.; Guoqing, Q.; Guodong, C.; Shude, L. Geocryology in China. Arct. Antarct. Alp. Res. 2001, 33, 245. [Google Scholar] [CrossRef]
- Gao, W.; Yao, Y.; Gao, D.; Wang, H.; Song, L.; Sheng, H.; Cai, T.; Liang, H. Responses of N2O emissions to spring thaw period in a typical continuous permafrost region of the Daxing’an Mountains, northeast China. Atmos. Environ. 2019, 214, 116822. [Google Scholar] [CrossRef]
- Liu, M.; Feng, F.; Cai, T.; Tang, S. Soil Microbial Community Response Differently to the Frequency and Strength of Freeze–Thaw Events in a Larix gmelinii Forest in the Daxing’an Mountains, China. Front. Microbiol. 2020, 11, 1164. [Google Scholar] [CrossRef]
- Li, X.; Jin, H.; He, R.; Huang, Y.; Wang, H.; Luo, D.; Jin, X.; Lanzhi, L.; Wang, L.; Li, W.; et al. Effects of forest fires on the permafrost environment in the northern Da Xing’anling (Hinggan) mountains, Northeast China. Permafr. Periglac. Process. 2019, 30, 163–177. [Google Scholar] [CrossRef]
- Jin, H.; Sun, G.; Yu, S.; Jin, R.; He, J. Symbiosis of marshes and permafrost in Da and Xiao Hinggan Mountains in northeastern China. Chin. Geogr. Sci. 2008, 18, 62–69. [Google Scholar] [CrossRef]
- Saito, H.; Šimůnek, J.; Mohanty, B.P. Numerical Analysis of Coupled Water, Vapor, and Heat Transport in the Vadose Zone. Vadose Zone J. 2006, 5, 784–800. [Google Scholar] [CrossRef]
- Zhang, M.; Pei, W.; Li, S.; Lu, J.; Jin, L. Experimental and numerical analyses of the thermo-mechanical stability of an embankment with shady and sunny slopes in permafrost regions. Appl. Therm. Eng. 2017, 127, 1478–1487. [Google Scholar] [CrossRef]
- Li, S.; Zhan, H.; Lai, Y.; Sun, Z.; Pei, W. The coupled moisture-heat process of permafrost around a thermokarst pond in Qinghai-Tibet Plateau under global warming. J. Geophys. Res. Earth Surf. 2010, 119, 836–853. [Google Scholar] [CrossRef]
- Liu, M.; Ma, W.; Niu, F.; Luo, J.; Yin, G. Thermal performance of a novel crushed-rock embankment structure for expressway in permafrost regions. Int. J. Heat Mass Transf. 2018, 127, 1178–1188. [Google Scholar] [CrossRef]
- Chen, L.; Yu, W.; Lu, Y.; Liu, W. Numerical simulation on the performance of thermosyphon adopted to mitigate thaw settlement of embankment in sandy permafrost zone. Appl. Therm. Eng. 2018, 128, 1624–1633. [Google Scholar] [CrossRef]
- Bing, H.; Ma, W. Laboratory investigation of the freezing point of saline soil. Cold Reg. Sci. Technol. 2011, 67, 79–88. [Google Scholar] [CrossRef]
- Li, X.; Ma, W.; Mu, Y.; Dong, J.; Chen, L. Wind field and thermal performances of an expressway constructed with two separated crushed-rock embankments in high-altitude permafrost zones. Transp. Geotech. 2021, 27, 100447. [Google Scholar] [CrossRef]
- Lai, Y.M.; Zhang, M.Y.; Li, S.Y. Theory and Application of Cold Regions Engineering; Science Press: Beijing, China, 2009. [Google Scholar]
- Li, S.; Lai, Y.; Zhang, M.; Dong, Y. Study on long-term stability of Qinghai-Tibet Railway embankment. Cold Reg. Sci. Technol. 2009, 57, 139–147. [Google Scholar] [CrossRef]
- Guo, Y.; Xu, S.; Shan, W. Development of a frozen soil dielectric constant model and determination of dielectric constant variation during the soil freezing process. Cold Reg. Sci. Technol. 2018, 151, 28–33. [Google Scholar] [CrossRef]
- Liu, H.B.; Zhang, H.Z.; Wang, J. Effect of freeze-thaw and water content on mechanical properties of compacted clayey soil. Rock Soil Mech. 2018, 39, 158–164. [Google Scholar] [CrossRef]
- Sun, B.; Xu, X.; Lai, Y.; Li, D. Determination of Thermal Diffusivity and Conductivity on Ballast. J. Glaciol. Geocryol. 2002, 6, 790–795. [Google Scholar] [CrossRef]
- Zhang, S.; Teng, J.; He, Z.; Liu, Y.; Liang, S.; Yao, Y.; Sheng, D. Canopy effect caused by vapour transfer in covered freezing soils. Geotechnique 2016, 66, 927–940. [Google Scholar] [CrossRef]
- Teng, J.D.; He, Z.Y.; Zhang, S.; Sheng, D.C. Moisture transfer and phase change in unsaturated soils: Physical mechanism and numerical model for two types of “canopy effect”. Chin. J. Geotech. Eng. 2016, 38, 1813–1821. [Google Scholar] [CrossRef]
- Cao, Y.; Zhang, L.; Xu, L.; Han, L. Monitoring techniques for construction safety reliability of permafrost subgrade for Qinghai-Tibet Railway. J. Eng. Geol. 2006, 14, 841–846. [Google Scholar] [CrossRef]
- Wu, J. Technical Indicators and the Construction Technology Research of Highway Reconstruction in Da Xing’an Mountains; Chang’an University: Xi’an, China, 2016. [Google Scholar]
- Li, Z.; Li, G.; Meng, Z.; Qin, K.; Song, G.; Jin, L.; Kan, X.; Wang, J.; Zhang, X. Petrofacies classification, characteristics and formation mechanism of breccias in Chalukou giant molybdenum deposit of Da Hinggan Mountains. Miner. Depos. 2014, 33, 607–624. [Google Scholar] [CrossRef]
- Hotovitch, H.A.; Zhang, C. Frozen Soil Mechanics; Science Press: Beijing, China, 1985. [Google Scholar]
- Xu, X.Z.; Wang, J.C.; Zhang, L. Frozen Soil Physics; Science Press: Beijing, China, 2009. [Google Scholar]
- Li, S.; Zhang, M.; Tian, Y.; Pei, W.; Zhong, H. Experimental and numerical investigations on frost damage mechanism of a canal in cold regions. Cold Reg. Sci. Technol. 2015, 116, 1–11. [Google Scholar] [CrossRef]
- Lai, Y.; Pei, W.; Zhang, M.; Zhou, J. Study on theory model of hydro-thermal-mechanical interaction process in saturated freezing silty soil. Int. J. Heat Mass Transf. 2014, 78, 805–819. [Google Scholar] [CrossRef]
- Li, N.; Chen, B.; Chen, F.; Xu, X. The coupled heat-moisture-mechanic model of the frozen soil. Cold Reg. Sci. Technol. 2000, 31, 199–205. [Google Scholar] [CrossRef]
- Zhou, J.; Li, D. Numerical analysis of coupled water, heat and stress in saturated freezing soil. Cold Reg. Sci. Technol. 2012, 72, 43–49. [Google Scholar] [CrossRef]
- Michalowski, R.L.; Zhu, M. Frost heave modelling using porosity rate function. Int. J. Numer. Anal. Methods Geomech. 2006, 30, 703–722. [Google Scholar] [CrossRef] [Green Version]
- Wang, Y.; Wang, D.; Ma, W.; Wen, Z.; Chen, S.; Xu, X. Laboratory observation and analysis of frost heave progression in clay from the Qinghai-Tibet Plateau. Appl. Therm. Eng. 2018, 131, 381–389. [Google Scholar] [CrossRef]
- Peppin, S.S.L.; Style, R.W. The Physics of Frost Heave and Ice-Lens Growth. Vadose Zone J. 2013, 12, vzj2012.0049. [Google Scholar] [CrossRef]
- Zhou, Y.; Zhou, G.Q.; Wang, Y.J. Separate ice frost heave model for coupled moisture and heat transfer in saturated soils. Chin. J. Geotech. Eng. 2010, 32, 1746–1751. [Google Scholar]
- Dullien, F.A.L. Porous media: Fluid transport and pore structure. Soil Sci. 1979, 132, 316. [Google Scholar] [CrossRef]
- Rahmani, H.; Naeini, S.A. Influence of non-plastic fine on static iquefaction and undrained monotonic behavior of sandy gravel. Eng. Geol. 2020, 275, 105729. [Google Scholar] [CrossRef]
- Farzalizadeh, R.; Hasheminezhad, A.; Bahadori, H. Shaking table tests on wall-type gravel and rubber drains as a liquefaction countermeasure in silty sand. Geotext. Geomembr. 2021, 49, 1483–1494. [Google Scholar] [CrossRef]
- EL Shamy, U.; Sizkow, S.F. Coupled smoothed particle hydrodynamics-discrete element method simulations of soil liquefaction and its mitigation using gravel drains. Soil Dyn. Earthq. Eng. 2021, 140, 106460. [Google Scholar] [CrossRef]
- Yu, F.; Zhang, M.; Lai, Y.; Liu, Y.; Qi, J.; Yao, X. Crack formation of a highway embankment installed with two-phase closed thermosyphons in permafrost regions: Field experiment and geothermal modelling. Appl. Therm. Eng. 2017, 115, 670–681. [Google Scholar] [CrossRef]
- Tao, X. Study of Formation Mechanism and Evolution Law of Longitudinal Cracks in Permafrost Region Subgrade; China University Mining and Technology: Beijing, China, 2017. [Google Scholar]
- Chou, Y.-L.; Sheng, Y.; Wei, Z.-M.; Ma, W. Calculation of temperature differences between the sunny slopes and the shady slopes along railways in permafrost regions on Qinghai-Tibet Plateau. Cold Reg. Sci. Technol. 2008, 53, 346–354. [Google Scholar] [CrossRef]


| Parameters | Expression |
|---|---|
| Surface tension | |
| Saturated vapor density | |
| Enhancement factor | |
| Relative humidity | |
| Water head | |
| Equivalent specific heat of the soil | |
| Latent heat of water evaporation | |
| Effective thermal conductivity Volumetric vapor content Vapor diffusion | |
| Unfrozen water flux | |
| Vapor flux |
| Soil Layers | λs (W/m·K) | Cs (J/kg·K) | Ks (m/s) | ρ (kg/m3) | θ0 (%) | n0 | a | b |
|---|---|---|---|---|---|---|---|---|
| Embankment fill | 2.116 | 1028.6 | 8.522 × 10⁻⁶ | 1940 | 14.2 | 0.233 | 0.082 | −0.28 |
| Peat clay | 1.215 | 1404.7 | 3.043 × 10⁻⁶ | 1300 | 18.6 | 0.438 | 0.123 | −0.20 |
| Breccia | 1.741 | 1226.6 | 7.496 × 10⁻⁶ | 1710 | 21.2 | 0.481 | 0.133 | −0.25 |
| Moderately weathered andesite | 2.022 | 1161.4 | 5.137 × 10⁻⁶ | 1800 | 15.2 | 0.352 | 0.107 | −0.18 |
| Gravel | 2.253 | 981.2 | 4.525 × 10⁻⁵ | 2080 | 14.7 | 0.313 | 0.085 | −0.29 |
| Block–stone layer | 2.642 | 923.0 | 8.404 × 10⁻⁴ | 2700 | 10.2 | 0.350 | 0.067 | −0.21 |
| Soil Layers | a1 (MPa) | b1 | a2 | b2 | a3 (o) | b3 | a4 (MPa) | b4 | c1 (MPa) | d1 (MPa) | e1 (MPa) | c2 | c3 (o) | d2 (o) | e2 (o) | c4 | c5 (MPa) | d3 (MPa) | e3 (MPa) |
|---|---|---|---|---|---|---|---|---|---|---|---|---|---|---|---|---|---|---|---|
| Embankment fill | 48.43 | 27.26 | 0.35 | −0.007 | 15 | 0.75 | 0.014 | 0.032 | −31 | −5.0 | 48.43 | 1.1 | −3 | −2 | 15 | 1.1 | −0.013 | −0.008 | 0.014 |
| Peat clay | 4.52 | 2.16 | 0.40 | −0.008 | 12 | 0.67 | 0.068 | 0.108 | −4 | −0.4 | 4.52 | 1.2 | −6 | −4 | 12 | 1.2 | −0.025 | −0.016 | 0.068 |
| Breccia | 6.27 | 2.84 | 0.38 | −0.006 | 18 | 0.55 | 0.046 | 0.065 | −6 | −0.6 | 6.27 | 1.2 | −7 | −5 | 18 | 1.2 | −0.031 | −0.028 | 0.046 |
| Moderately weathered andesite | 40.11 | 22.41 | 0.25 | −0.004 | 26 | 0.84 | 0.140 | 0.149 | −21 | −4.1 | 40.11 | 1.2 | −4 | −3 | 26 | 1.2 | −0.047 | −0.035 | 0.140 |
| Gravel | 5.38 | 2.56 | 0.42 | −0.004 | 8 | 0.08 | 0.001 | 0.046 | −96 | −13.2 | 5.38 | 1.1 | −15 | −8 | 8 | 1.1 | −0.098 | −0.079 | 0.001 |
| Block–stone layer | 86 | 24 | 0.30 | −0.001 | 30 | 0.86 | 0 | 0.005 | −16 | −0.2 | 86 | 1.1 | −1 | −0.4 | 30 | 1.1 | −0.001 | −0.001 | 0 |
| Variables | T0 (°C) | A (°C) |
|---|---|---|
| Natural ground surface: IJ | 0.29 | 16.24 |
| Side slope of the subgrade: JK | 0.52 | 18.11 |
| Top surface of the subgrade: AK | 1.13 | 19.62 |
| Subgrade Structures | Cumulative Settlement at the Road Centerline (cm) | Cumulative Settlement at the Shoulder (cm) | Maximum Transverse Deformation at the Road Centerline (cm) | Maximum Transverse Deformation at the Shoulder (cm) |
|---|---|---|---|---|
| Replacement block–stone subgrade structure | −0.153 | −0.211 | −0.077 | +0.111 |
| Replacement breccia subgrade structure | −23.467 | −15.971 | +0.495 | −1.209 |
| Replacement gravel subgrade structure | −33.793 | −22.068 | +0.395 | −2.207 |
Publisher’s Note: MDPI stays neutral with regard to jurisdictional claims in published maps and institutional affiliations. |
© 2022 by the authors. Licensee MDPI, Basel, Switzerland. This article is an open access article distributed under the terms and conditions of the Creative Commons Attribution (CC BY) license (https://creativecommons.org/licenses/by/4.0/).
Share and Cite
Shan, W.; Ma, M.; Guo, Y.; Zhang, C. Numerical Analysis of the Influence of Foundation Replacement Materials on the Hydrothermal Variation and Deformation Process of Highway Subgrades in Permafrost Regions. Water 2022, 14, 2642. https://doi.org/10.3390/w14172642
Shan W, Ma M, Guo Y, Zhang C. Numerical Analysis of the Influence of Foundation Replacement Materials on the Hydrothermal Variation and Deformation Process of Highway Subgrades in Permafrost Regions. Water. 2022; 14(17):2642. https://doi.org/10.3390/w14172642
Chicago/Turabian StyleShan, Wei, Min Ma, Ying Guo, and Chengcheng Zhang. 2022. "Numerical Analysis of the Influence of Foundation Replacement Materials on the Hydrothermal Variation and Deformation Process of Highway Subgrades in Permafrost Regions" Water 14, no. 17: 2642. https://doi.org/10.3390/w14172642