
Reoligotrophication of a High-Nitrogen Reservoir with Phosphorus Removal and Implications for Management
by
Xiaoyu Zhang
1,2,
Lin Ding
2,
Yue Liu
2,
Haixia Liu
2,
Boyu Xuan
1,2,
Jian Zhao
2,* and
Yuan Li
1,* 1
College of Chemical Engineering, Beijing University of Chemical Technology, Beijing 100029, China
2
Chinese Research Academy of Environmental Sciences, Beijing 100012, China
*
Authors to whom correspondence should be addressed.
Water 2022, 14(17), 2629; https://doi.org/10.3390/w14172629
Submission received: 4 July 2022
/
Revised: 21 August 2022
/
Accepted: 24 August 2022
/
Published: 26 August 2022
(This article belongs to the Special Issue Lake Eutrophication: Causes, Monitoring and Restoration)
Abstract
:Nitrogen pollution in the oligotrophic Chaihe Reservoir leads to reconsideration of whether nitrogen control is necessary. Does this mean that eutrophication control has the potential to create “cleaner lakes that are dirtier lakes?” The Chaihe Reservoir is a typical case of a water body with high nitrogen and low algal populations. The relationship between the chlorophyll a (Chla) and nutrients (total nitrogen [TN] and total phosphorus [TP]) in the reservoir was analyzed using the filtering trajectory method (FTM). The results showed that the Chaihe Reservoir recovered to an oligotrophic state after the TP concentration greatly decreased, but it faces a new dilemma of nitrogen pollution. This provides further empirical support for the role of phosphorus in controlling the nitrogen cycle and fate in freshwater ecosystems. The contour plot and Chla-TN/TP diagram indicated that a higher TN/TP contributed to a reduction in Chla. The thresholds for TP and TN in the reservoir were proposed using the double probability method (DPM). It is recommended to remove nitrogen at the end of a drinking water supply system due to the nitrogen pollution of the Chaihe Reservoir. The TN threshold for buffering control provides a quantitative basis for implementing a nutrient management plan.
1. Introduction
Controlling inputs of phosphorus and nitrogen is critical for maintaining desirable water quality and ecosystem integrity in freshwater and coastal marine ecosystems [1,2,3]. Nitrogen and phosphorus cycles in lakes are closely related. Ecosystem experiments in lakes and rivers have shown that increasing phosphorus can improve nitrogen removal [4,5,6]. Finlay et al. [7] suggested that reducing phosphorus inputs across a range of lakes could significantly increase nitrate pollution. Another study titled “Cleaner Lakes Are Dirtier Lakes” made a detailed and comprehensive analysis of this issue [8]. It was found that the concentration of chlorophyll a (Chla) and the total phosphorus (TP) decreased with recovery from eutrophication, while the concentration of total nitrogen (TN) increased. We defined these lakes as high-nitrogen and low-algal types (TN > 2000 μg/L, Chla < 8 μg/L). Because phosphorus control leads to nitrogen pollution, the implications of nitrogen and phosphorus restriction and nutrient management require further discussion.
Nitrogen pollution in reservoirs and unproductive lakes has received an increasing amount of attention in recent years [9,10,11]. A new dilemma of nitrogen pollution may happen during eutrophication recovery. Nitrogen pollution in oligotrophic reservoirs poses a major threat to the safety of water supplies. Denitrification and nitrogen burial are the primary pathways of nitrogen removal, and eutrophic reservoirs or lakes have higher nitrogen removal capacities than oligotrophic reservoirs or lakes. Müller et al. [11] studied the nitrogen removal rate of 21 lakes in Switzerland, and they revealed that phosphorus management alone for oligotrophic lakes only slightly increased the nitrogen output, unless it was accompanied by nitrogen management. There has been a long debate on whether nitrogen control is necessary for lake eutrophication management [12,13,14]. Schindler et al. [12] proposed that lake eutrophication cannot be controlled by reducing the nitrogen input based on a 37-year whole-lake experiment. However, Conley et al. [13] indicated that controlling only P inputs to freshwaters would exacerbate eutrophication problems in estuarine and coastal marine ecosystems. Paerl et al. [14] indicated that controlling both N and P inputs will help control harmful algal blooms (HABs) in some lakes and also reduce N export to downstream N-sensitive ecosystems. Whether nitrogen control is required in low-productivity lakes and reservoirs and what nutrient threshold can solve the comprehensive problems of eutrophication management and nitrogen pollution are questions that urgently require answers.
Nitrogen pollution caused by phosphorus reduction was confirmed during the reoligotrophication of the Chaihe Reservoir. In this study, the Chaihe Reservoir in Liaoning Province (Figure 1) was utilized as an example to analyze the response relationship of Chla-TN and Chla-TP using the filtering trajectory method. This study aims to analyze the asynchronism of nitrogen and phosphorus in the eutrophication recovery of the Chaihe Reservoir and clarify the causes of nitrogen pollution during the reoligotrophication of the reservoir from the perspective of mechanism, and finally put forward the nutrient control objectives and management strategies of the Chaihe Reservoir. The following questions were considered: (1) Is nitrogen pollution related to phosphorus reduction during the reoligotrophication of the reservoir? (2) Is it necessary to implement nitrogen control by considering the downstream area near the marine zone of the Chaihe Reservoir? What measures should be taken to solve nitrogen pollution in the reservoir? (3) What nutrient control targets should be formulated to solve freshwater–marine eutrophication?
2. Materials and Methods
2.1. Study Area
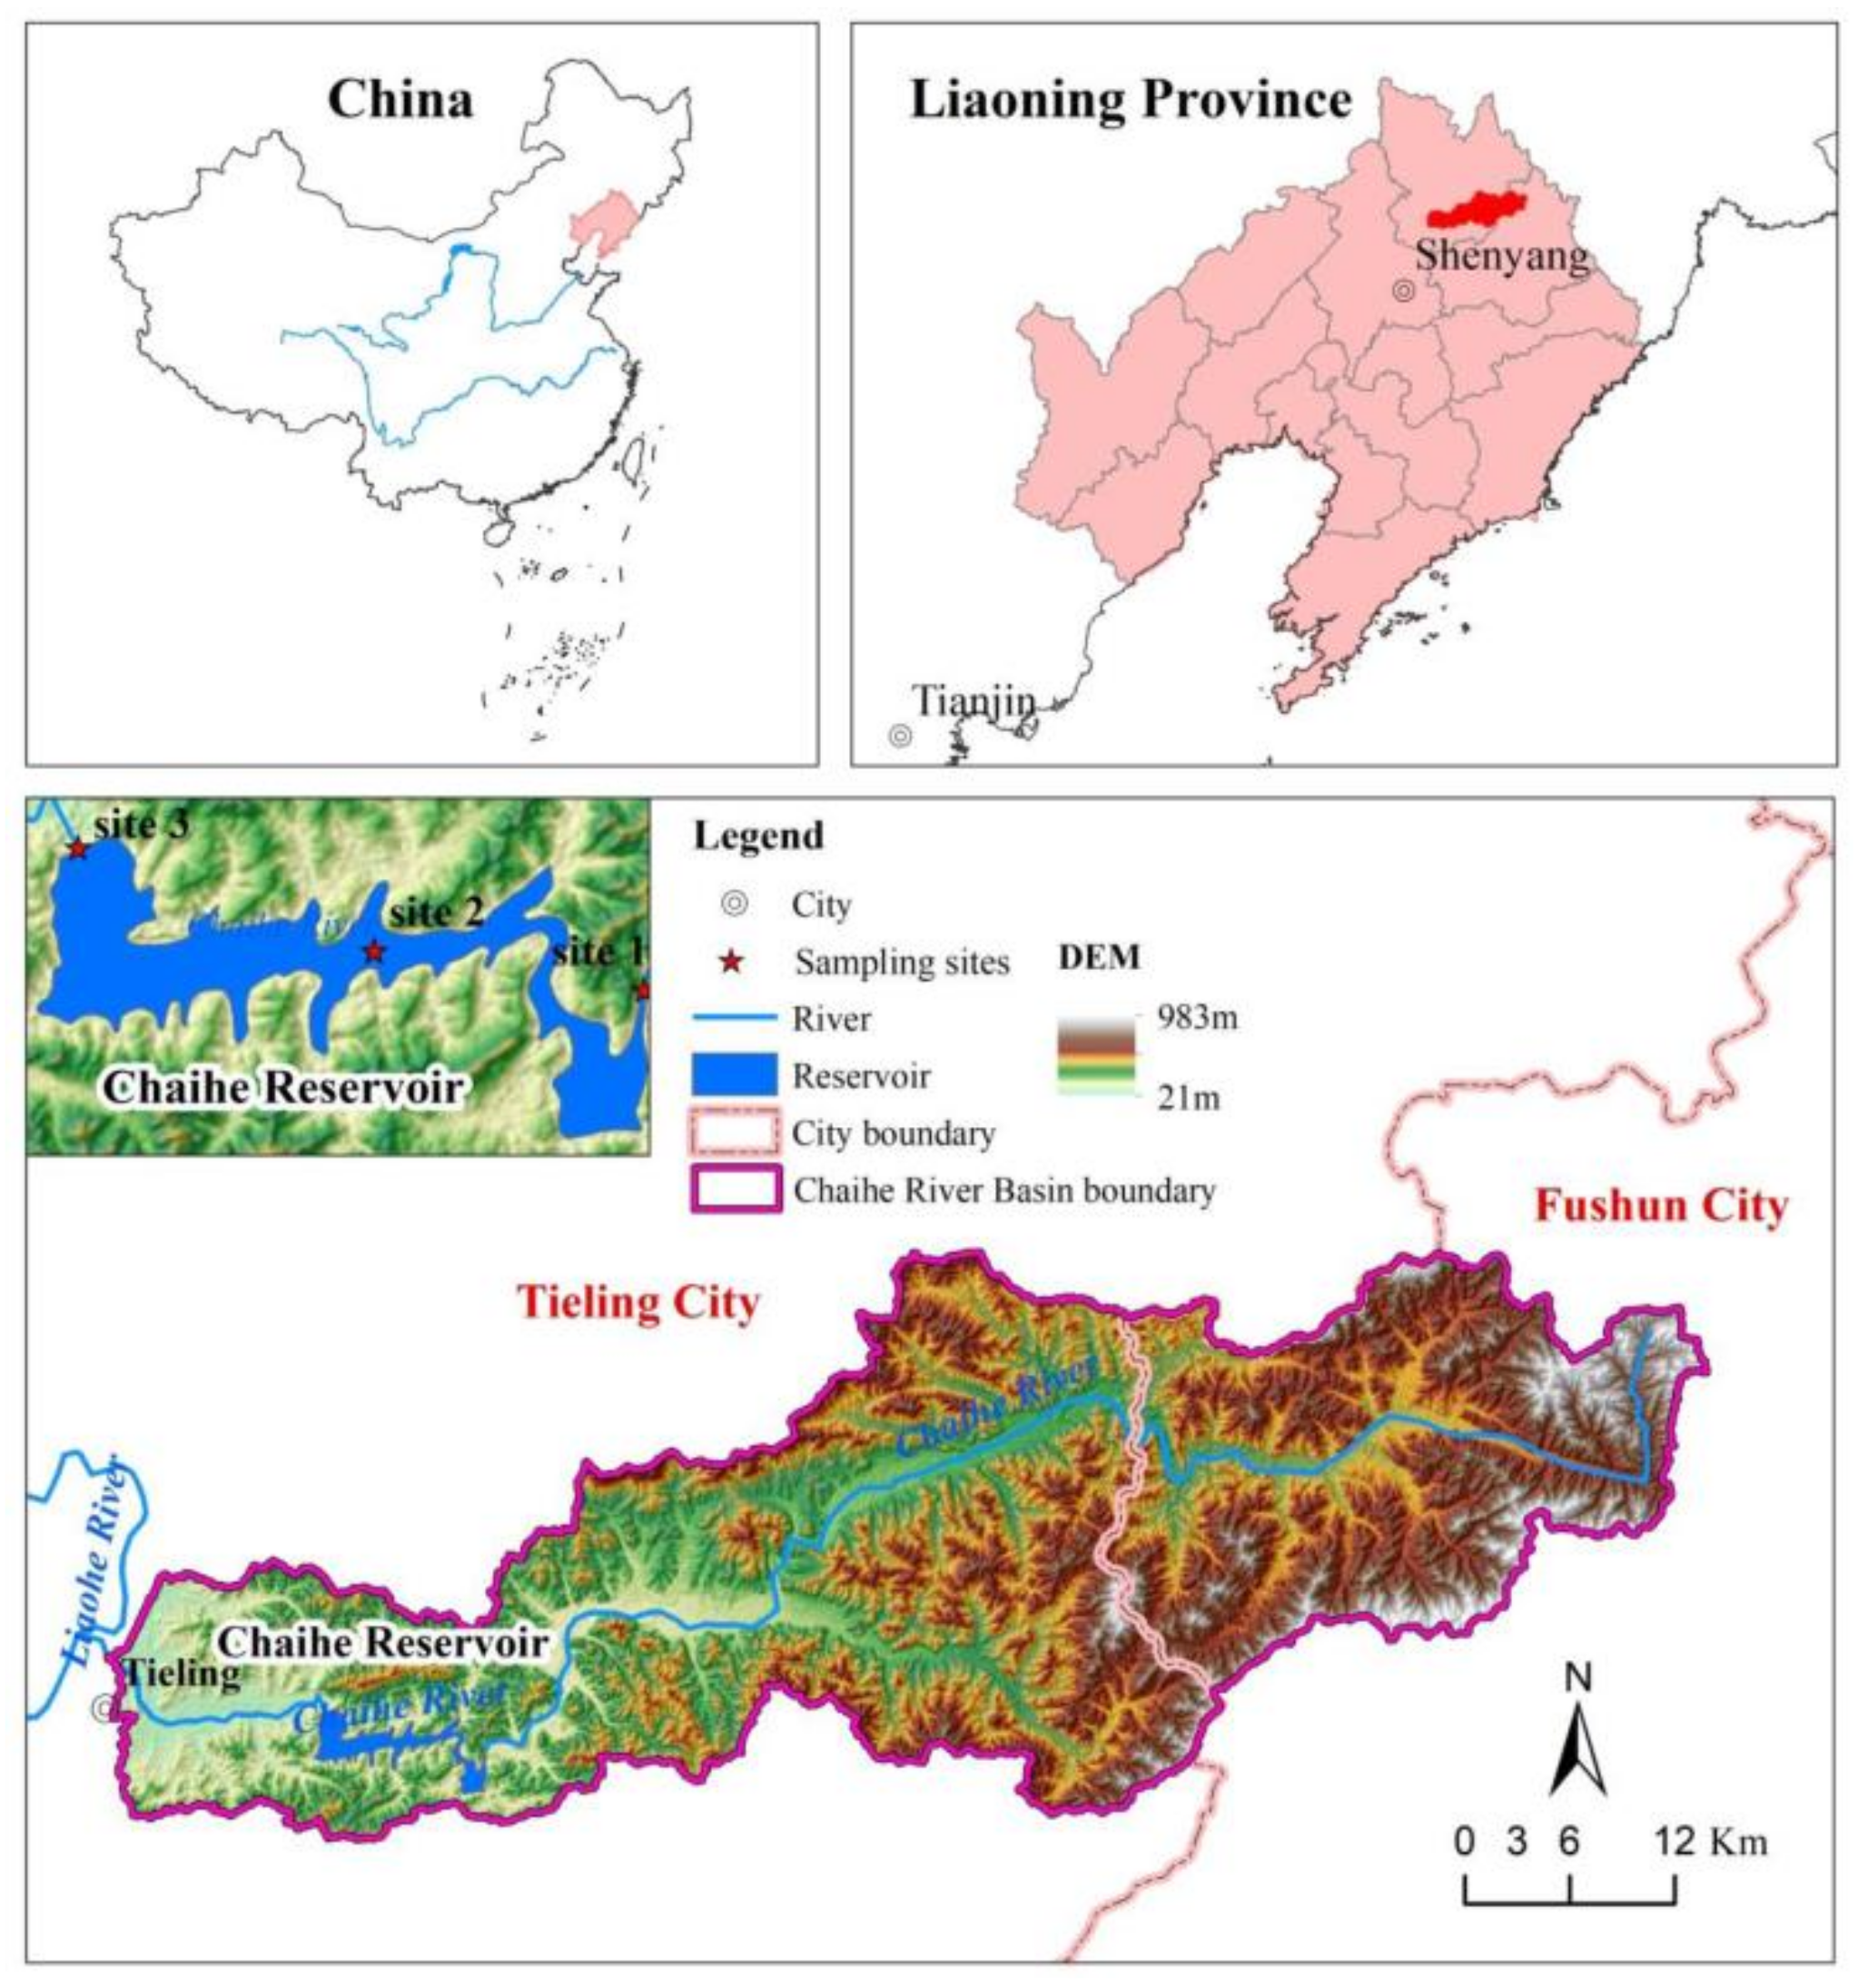
The Chaihe Reservoir (124°12′ E, 42°16′ N) is located near Tieling City in the Liaoning Province of northeast China. The reservoir is located in the lower reaches of the Chaihe River, a tributary of the Liaohe River, and it has a maximum storage capacity of 636 million m3, controlling an area of 1355 km2. The Chaihe Reservoir was constructed in 1957 and expanded in 1998. The water quality data of nitrogen, phosphorus and chlorophyll in the reservoir have been collected since 1996, and the hydraulic data began after the reservoir was expanded in 1998. The reservoir accounts for 90% of the total area of the Chai River basin and provides 7.38 million m3 for household use every year. It is a large-scale water conservancy project with flood control and irrigation as the primary functions. These are combined with power generation and fish farming. After 2003, the Chaihe Reservoir became the water supply source for Tieling City. The study area shown in Figure 1 consists of the reservoir and its upstream watershed. The Chaihe River basin is primarily utilized for agricultural cultivation. Therefore, non-point source pollution in the reservoir catchment area is the primary cause of reservoir eutrophication.
2.2. Sampling and Procedures
In this study, the annual mean monitoring data from 1996 to 2021 (including Chla, TP, and TN) were provided by the Tieling Environmental Protection Monitoring Station. The datasets from 1996 to 2021 were used to investigate the interannual variability in Chla–nutrient relationships in the Chaihe Reservoir. Samples were taken monthly from May to November. As shown in Figure 1, there are three sampling sites in the Chaihe Reservoir. Specifically, these sites are located in the reservoir entrance (site 1), central Chaihe Reservoir (site 2) and under the dam (site 3). Water samples were collected by mixing the surface (1 m below the surface) with a Van Dorn bottle (5 L). TN, TP and Chla content were determined according to the Standard Methods for Examination of Water and Wastewater [15]. The TN/TP ratios were calculated using the concentrations of total phosphorus and total nitrogen.
2.3. Data Analysis
2.3.1. Changed Weight Trophic Level Index Method (TLICW)
The changed weight trophic level index method (TLICW) was used to evaluate the trophic status of the Chaihe Reservoir. TLICW is a comprehensive trophic level index obtained by comparing the apparent trophic level index (TLIEX) and the potential trophic level index (TLIIM) [16]. The weight of the two indicators is a zero or one variable configuration, and the TLICW is equal to the max value between the TLIEX and the TLIIM.
(i) The TLICW was calculated as follows:
where α and β are the weight coefficients, and α + β = 1 when there is no synergistic effect of nitrogen and phosphorus. When phosphorus is limited, α = 1 and β = 0 (the Chla-TN positive correlation is poor). When nitrogen is limited, α = 0 and β = 1 (the Chla-TP positive correlation is poor). Thus, TILIM = min [TLI (TP), TLI (TN)].
TLICW = max (TLIEX, TLIIM),
TLIEX = TLI (Chla),
TLIIM = αTLI (TP) + βTLI (TN),
(ii) The equations for calculating the trophic level index of a single variable are:
TLI (Chla) = 50 + 25l g (Chla/10),
TLI (TP) = 50 + 25l g [f (TP)/10],
TLI (TN) = 50 + 25l g [f (TN)/10].
(iii) The parameters α and β are obtained using the following equations:
where is the adjusted R-squared for the Chla-TP linear model; is the adjusted R-squared for the Chla-TN linear model.
(iv) The eutrophication evaluation was graded with continuous values from 0 to 100 (Table 1). In the same trophic class, a higher TLICW has a more severe eutrophication degree.
2.3.2. Filtering Trajectory Method (FTM)
In this study, the FTM was used to establish the empirical relationships of Chla and TP (TN) concentrations and identify the evolution pathways of Chla-TP and Chla-TN for the Chaihe Reservoir. As described in our previous papers, the FTM used the locally weighted scatterplot smoothing (Loess) to construct a multiperiod filtering of the variables. This is equivalent to a nonlinear, temporal, sequential correlation and improves the single qualitative description of a single trajectory. This method constructs a multi-index temporal causality diagram that integrates the traditional nontemporal scatterpoint correlation and the expression of the single-index time process trend analysis [17].
2.3.3. Contour Plot
A contour plot can visualize three-dimensional data in a two-dimensional plot. In this study, we used the contour plot to explore the relationship between the three variables (TP, TN and Chla) on a single chart. This allowed us to view combinations of TP and TN that produce desirable Chla values. In the computer program OriginPro 2021, a contour plot was obtained in four steps. (1) The data were entered in a worksheet in the XYZ format; (2) XYZ interpolation was performed to smooth the contour plot using the Thin Plate Spline (TPS) algorithm; (3) these data were interpolated in polar coordinates. (4) XY coordinate mapping was performed.
2.3.4. Double Probability Method (DPM)
The TP-carrying concentration (TPa) was calculated using the DPM to settle the nutrient target of the Chaihe Reservoir. The DPM selects the algal production efficiency of the total phosphorus (ETP) as the primary reference indicator, and the ETP is defined by the ratio of Chla to the TP concentration (ETP=Chla/TP). The TPa was calculated as follows:
where ETP (t) is the phosphorus use efficiency that meets the requirements of the design dependability (Pd); t is the number of years from the beginning to the calculation time point, t = 10, 11,…, n; Pn is the design dependability for all data prior to the calculation time point; P10 is the design dependability of the data in the recent 10 years at the calculation time point; TPa is the TP-carrying capacity; and Chla-a is the Chla standard value that was chosen due to the requirement of the functioning zone.
ETP (t) = max [ETP (Pn = Pd), ETP (P10 = Pd)],
P = m/(n+1),
TPa = Chla-a/ETP (t).
For the TN-carrying concentration (TNa), 10 times the TPa was chosen as the theoretical value of the TN threshold, and any value less than this amount may lead to nitrogen limitation. The TN threshold of the buffering control (TNb) was actually estimated by TNb = 30 TPa in order to prevent entering the lower limit of the suitable area for cyanobacteria, rather than the upper limit required for actual algal control. The TNa and TNb were calculated as follows:
where TPa is the TP-carrying concentration; TNa is the TN-carrying concentration in nitrogen-limited systems; TNb is the TN threshold of the buffering control when phosphorus was limited.
TNa = 10 TPa,
TNb = 30 TPa.
3. Results
3.1. Interannual Variations of TP, TN, Chla and the Trophic Status
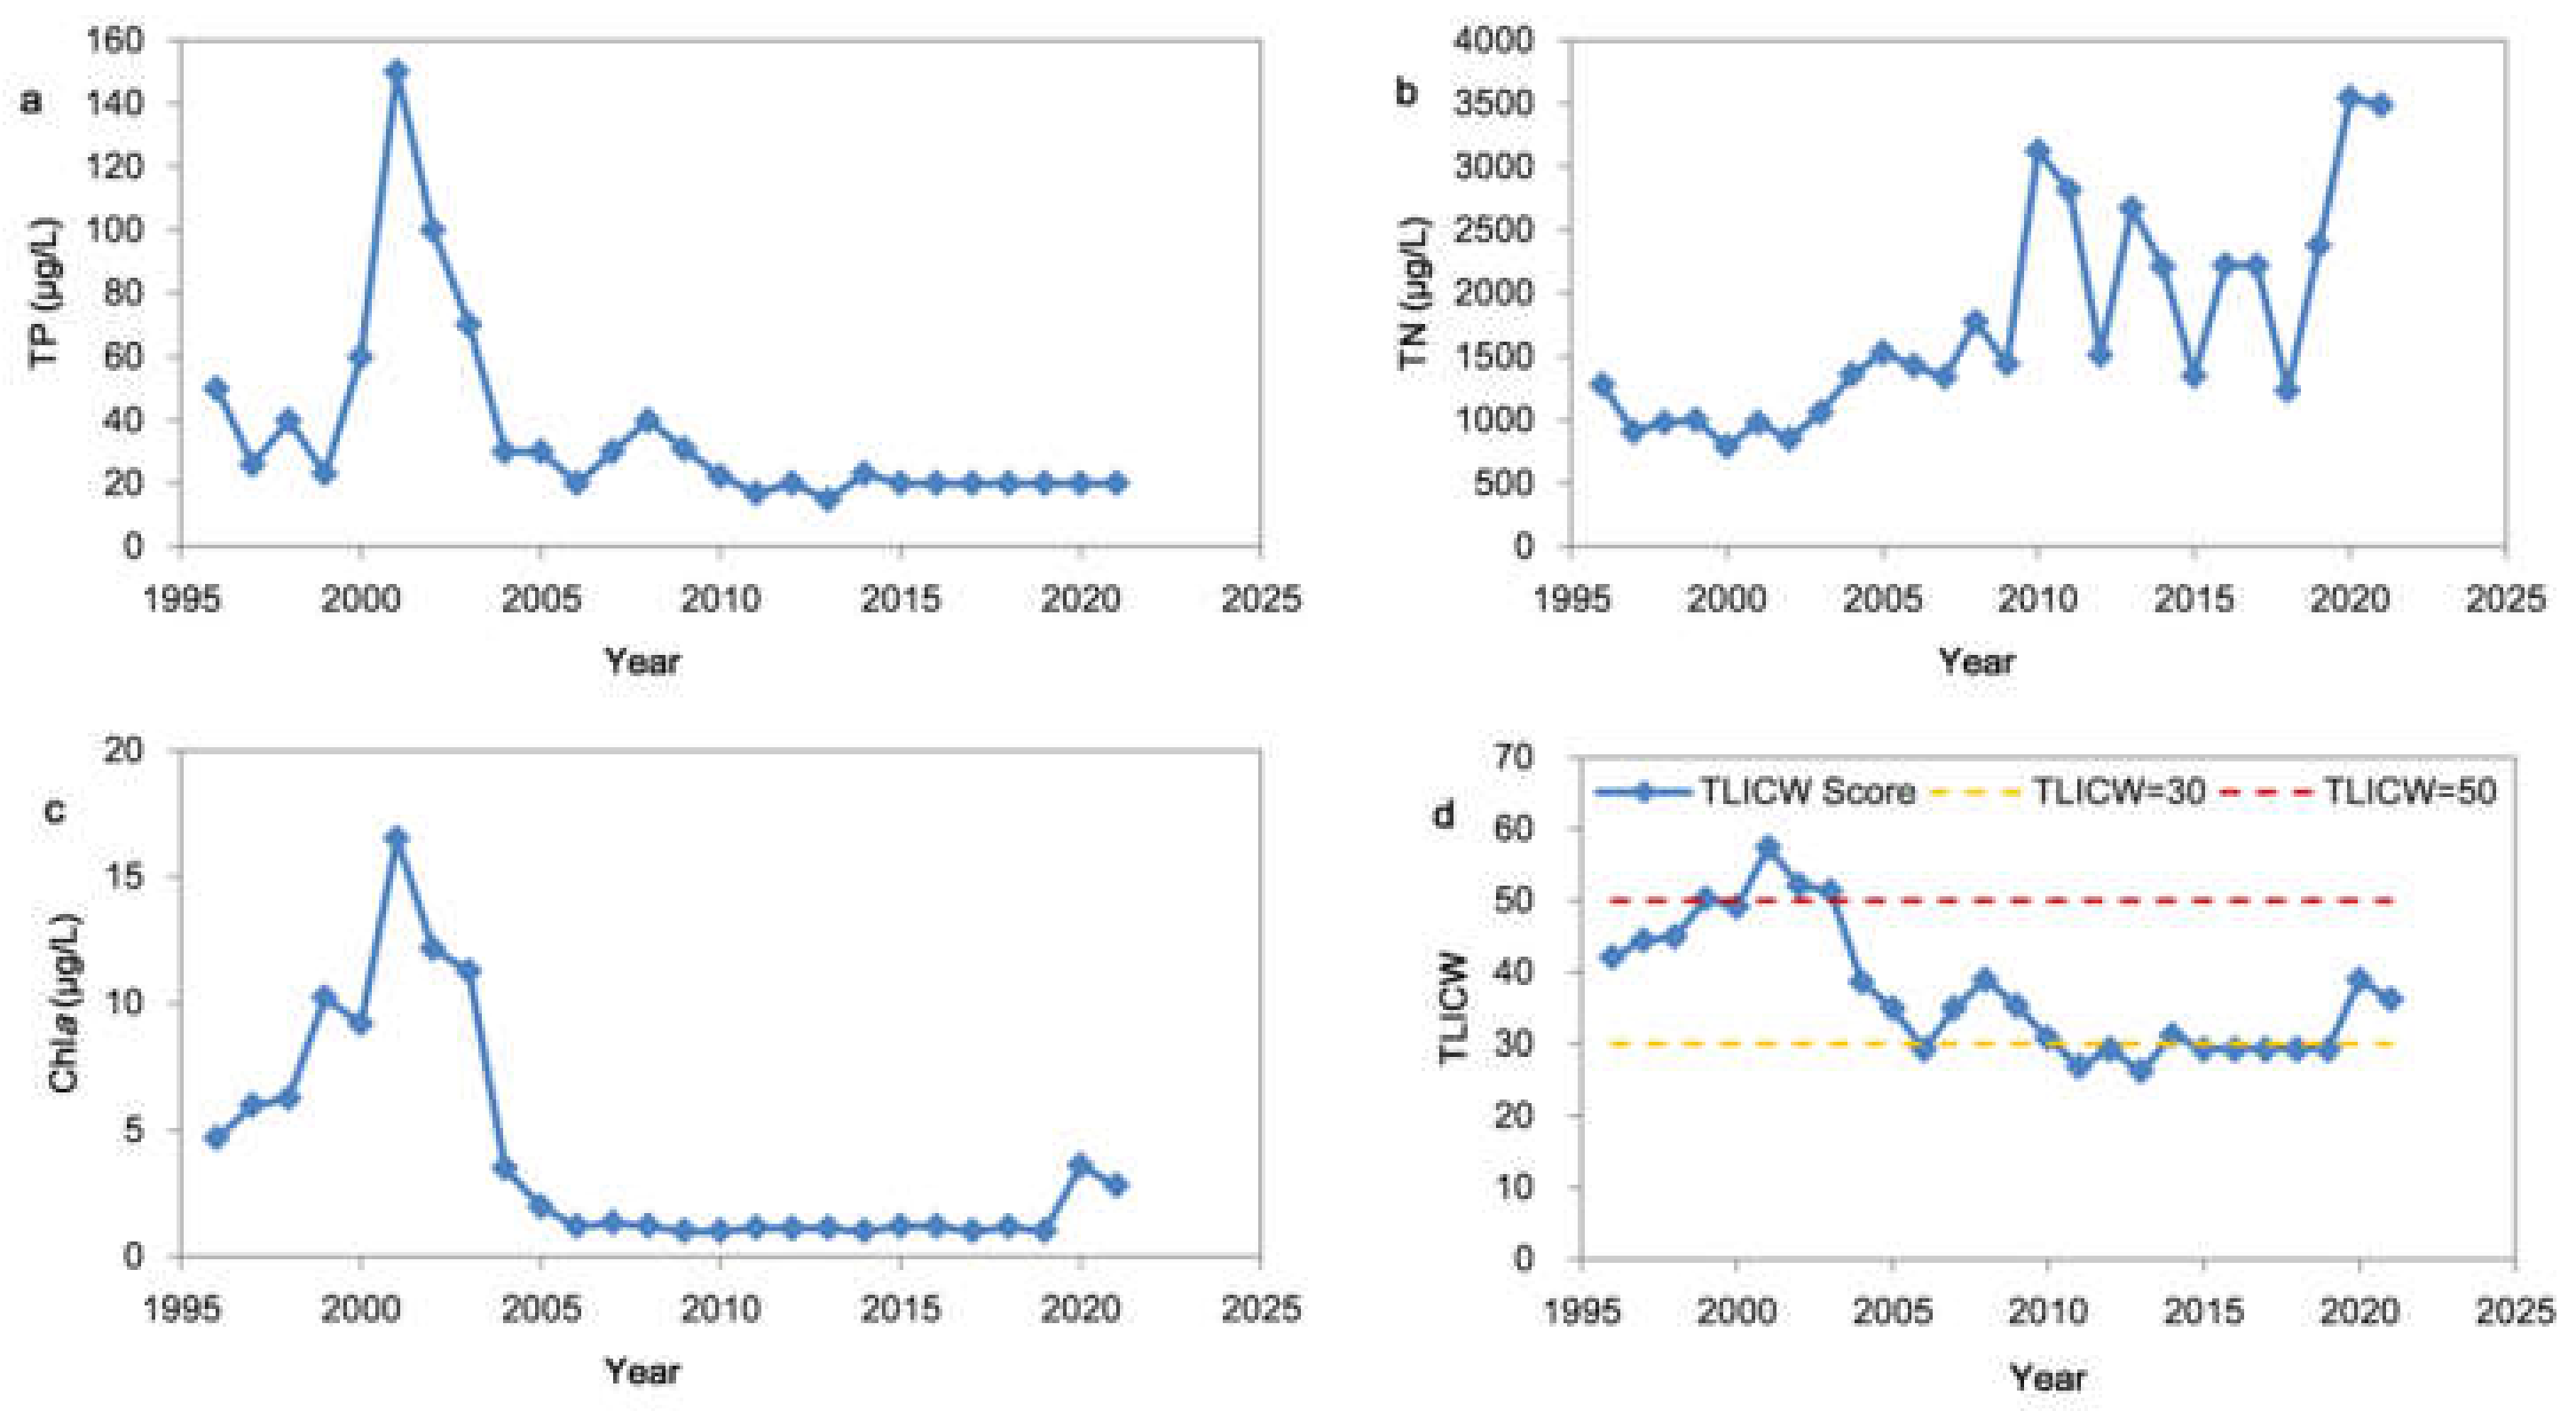
According to the interannual variations of the TP, TN and Chla, the Chaihe Reservoir can be divided into two stages: (1) the eutrophication stage from 1996 to 2001 when the TP concentration increased rapidly, the TN concentration concentrations were relatively constant (except for 1996) and the Chla increased sharply and reached the peak; and (2) the reoligotrophication stage from 2002 to 2021 when the Chla decreased rapidly with a decrease in TP concentration and remained stable at approximately 1 μg/L for 10 years (Figure 2a–c). However, the TN concentration gradually increased from 1500 μg/L to 3500 μg/L.
In the calculation of the TLICW, we established the relationship between Chla-TP and Chla-TN, where Chla = 0.0312 × TP1.2876 (r2 = 0.5782). However, there was no positive correlation between Chla-TN, and the weight of TLI (TN) was β = 0. This did not affect the value of the TLICW. The results showed that the TLICW was below 30 for 10 consecutive years from 2009 to 2019, indicating that the reservoir was in the oligotrophication state (Figure 2d). However, it switched to a mesotrophic state in 2020, and this was consistent with the rebound of Chla.
In general, after nearly 20 years of treatment, the TP concentration in the reservoir recovered to be approximately 20 μg/L after 2005, reaching the Class II standard for surface water. Chla was less than 5 μg/L, indicating that the reservoir was recovering from eutrophication. However, the concentration of TN and TP changed incongruously. The TLIcw was basically consistent with the changes in the Chla and TP.
3.2. Relationships between Chla and TP (TN)
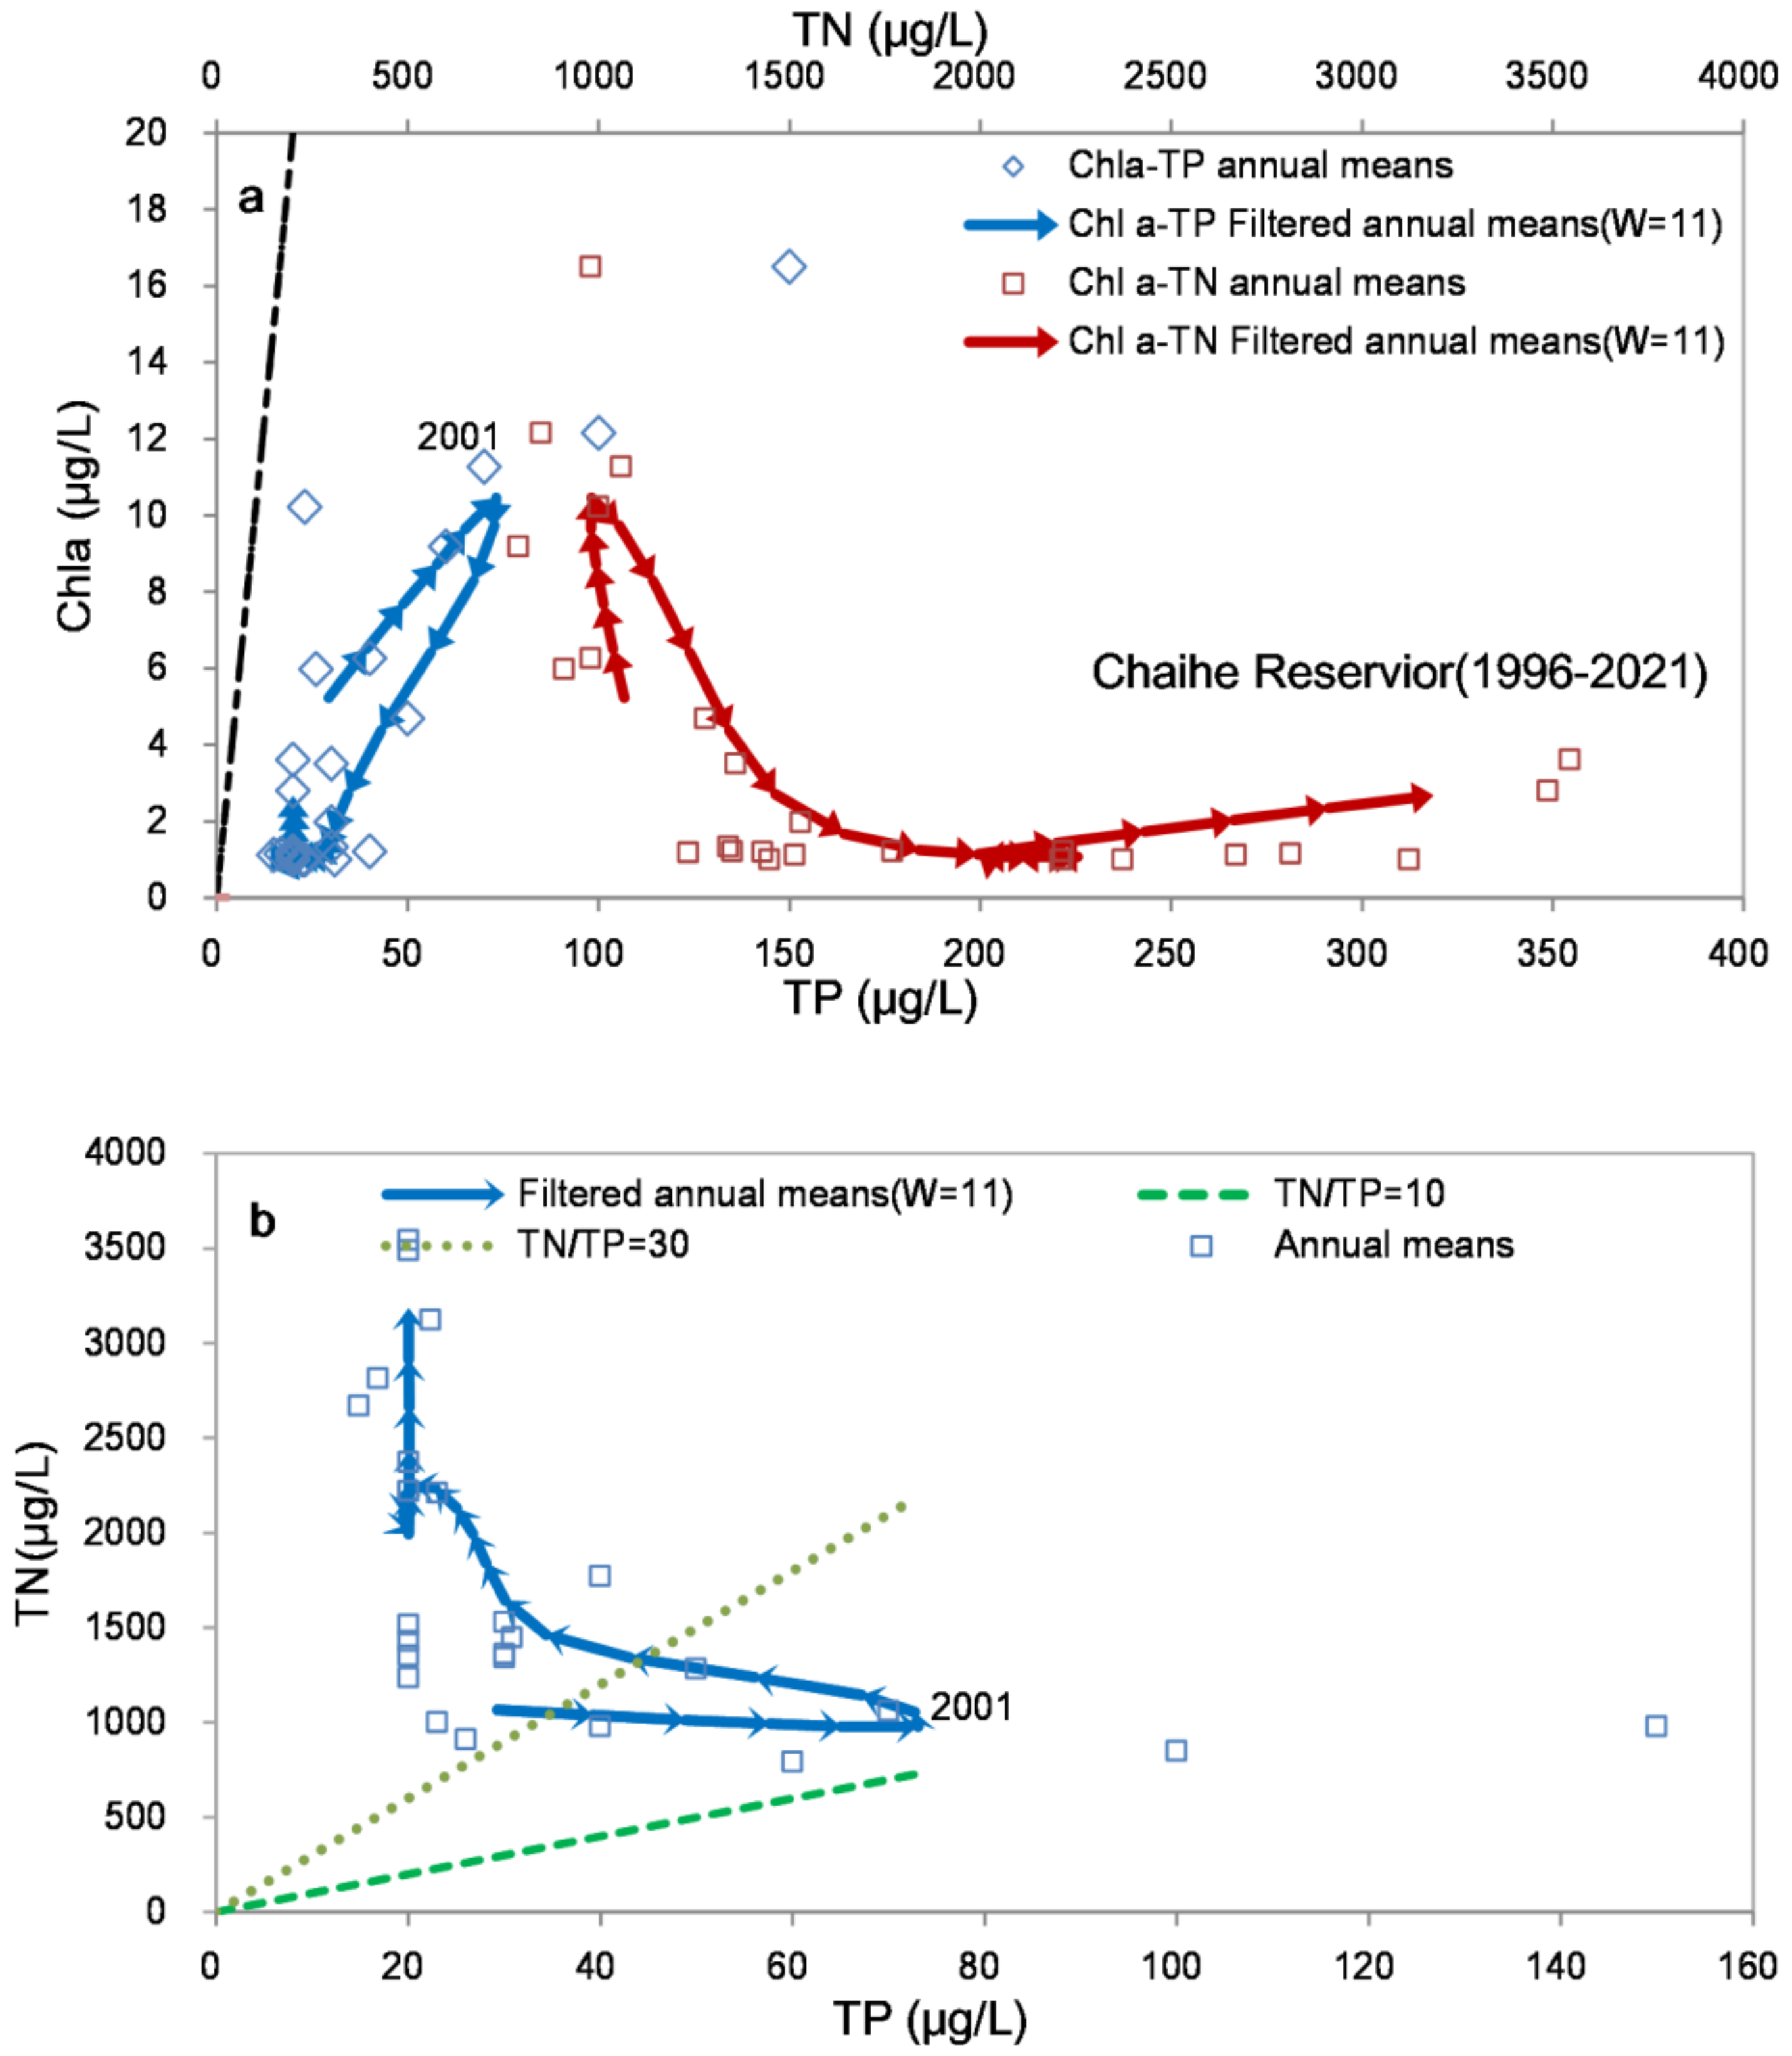
The evolution trajectories of the Chaihe Reservoir indicated the right-lateral path of Chla-TP and Chla-TN (Figure 3a). There was a positive correlation between Chla and TP. Moreover, the increase in TN concentration did not affect Chla, suggesting that TP rather than TN was the key factor driving the change in Chla. In addition, there was a higher Chla yield for any given TP concentration during the eutrophication stage than in the reoligotrophication stage, suggesting that other factors in addition to TP reduction were beneficial for oligotrophication and for reducing the phosphorus use efficiency (Chla/TP).
The TN/TP ratio decreased when the TP increased during the eutrophication stage, while the TN/TP ratio increased due to TN increasing with the decrease in TP during the reoligotrophication stage (Figure 3b). This result indicated that the Chaihe Reservoir shifted to a strong P-limitation due to the higher TN/TP ratio.
3.3. Chla Response to Hydraulic Factors and Changes in Nutrient Concentrations
3.3.1. Chla Response to Hydraulic Factors
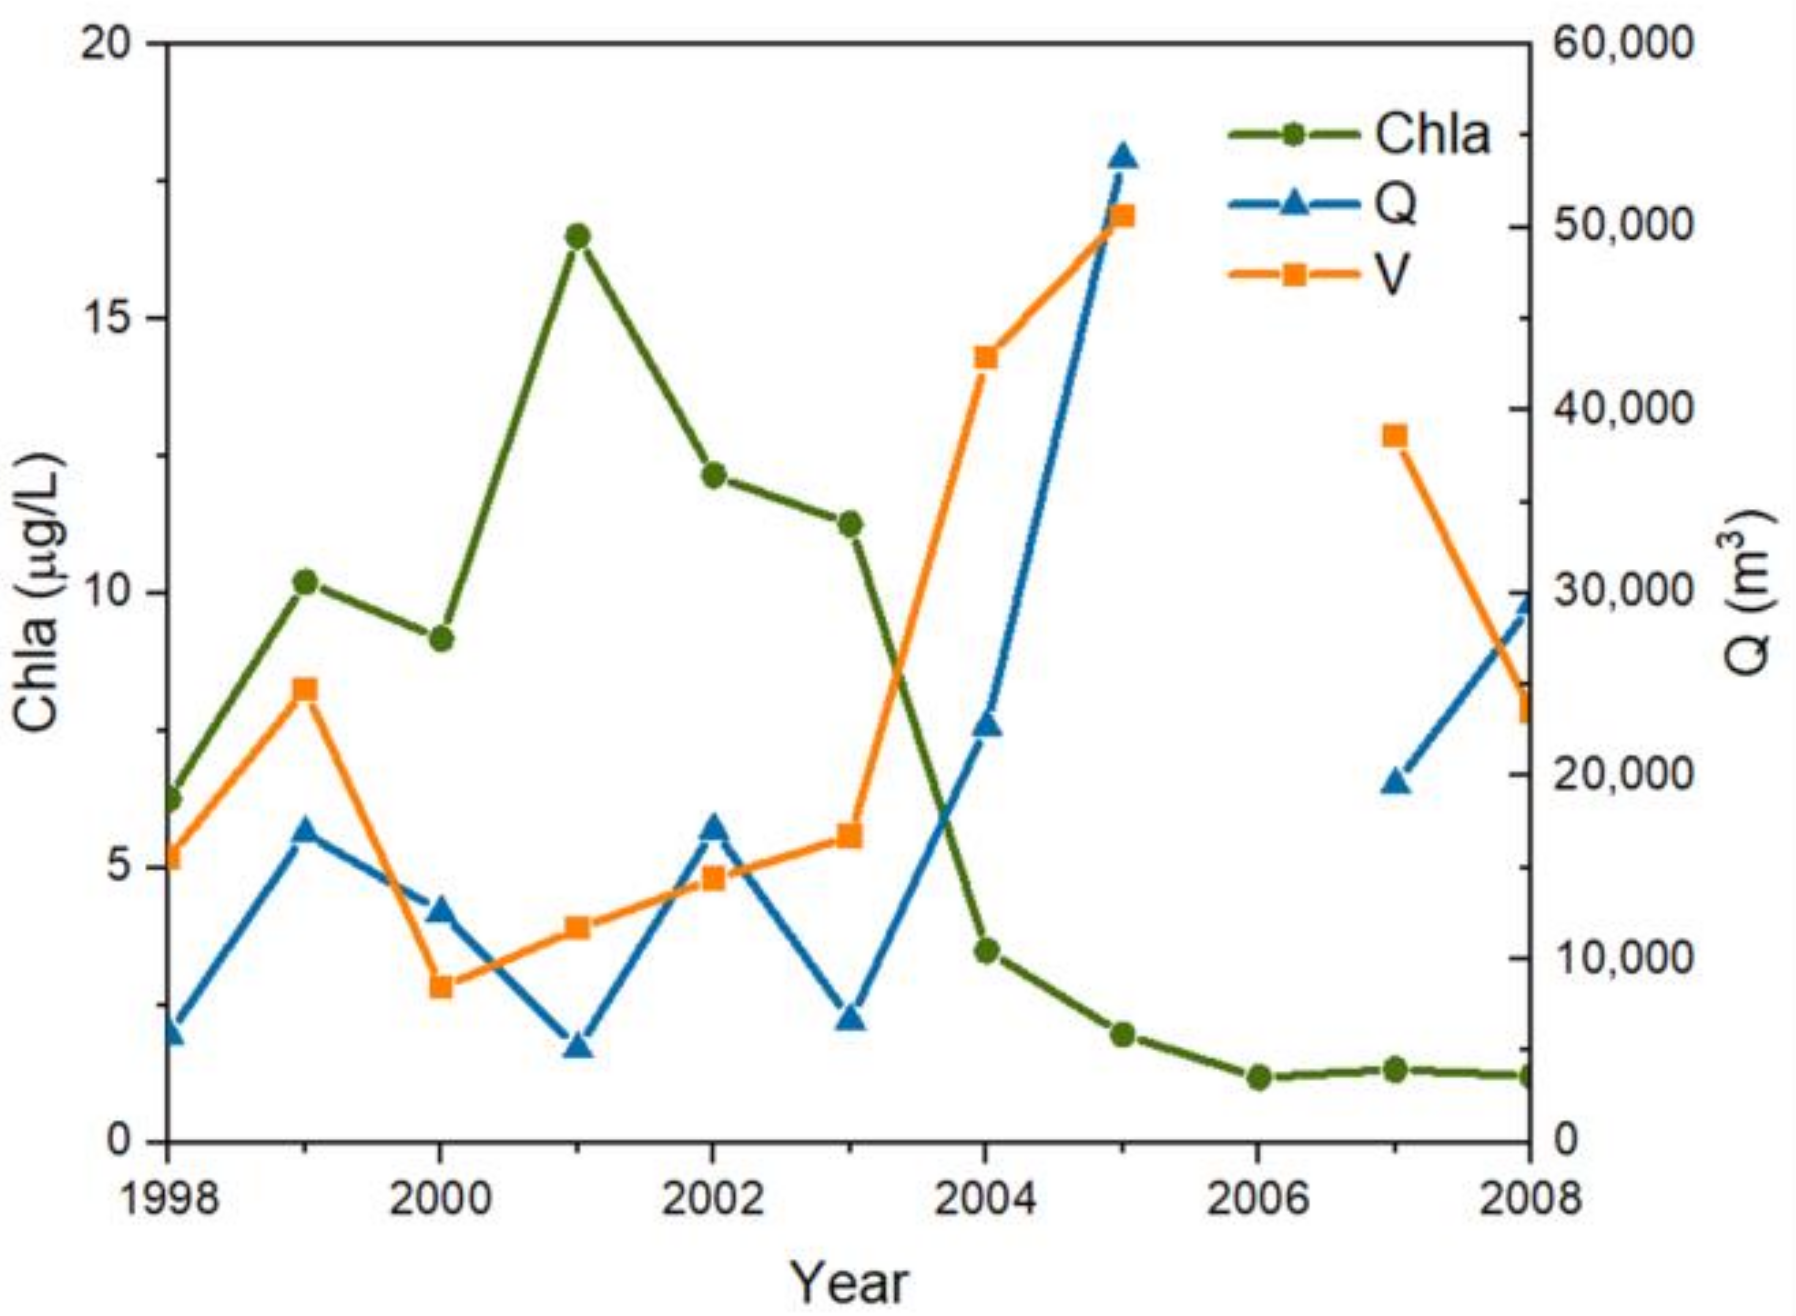
The lowest water volume of the Chaihe Reservoir occurred in 2000 (Figure 4), and this was due to the drought of the century in Tieling that exacerbated the eutrophication of the reservoir. Since 2003, the Chaihe Reservoir has increased the function of the urban water supply. Hence, the outflow of the reservoir increased sharply, and the quantity of outflow (Q) increased to 53,790 m3 in 2003, which was nearly 10 times larger than the lowest value of 5126 m3 before (Figure 4). The effect of hydraulic flushing to reduce the water residence time may have caused a rapid improvement in the Chla.
3.3.2. Chla Response to Changes in Nutrient Concentrations
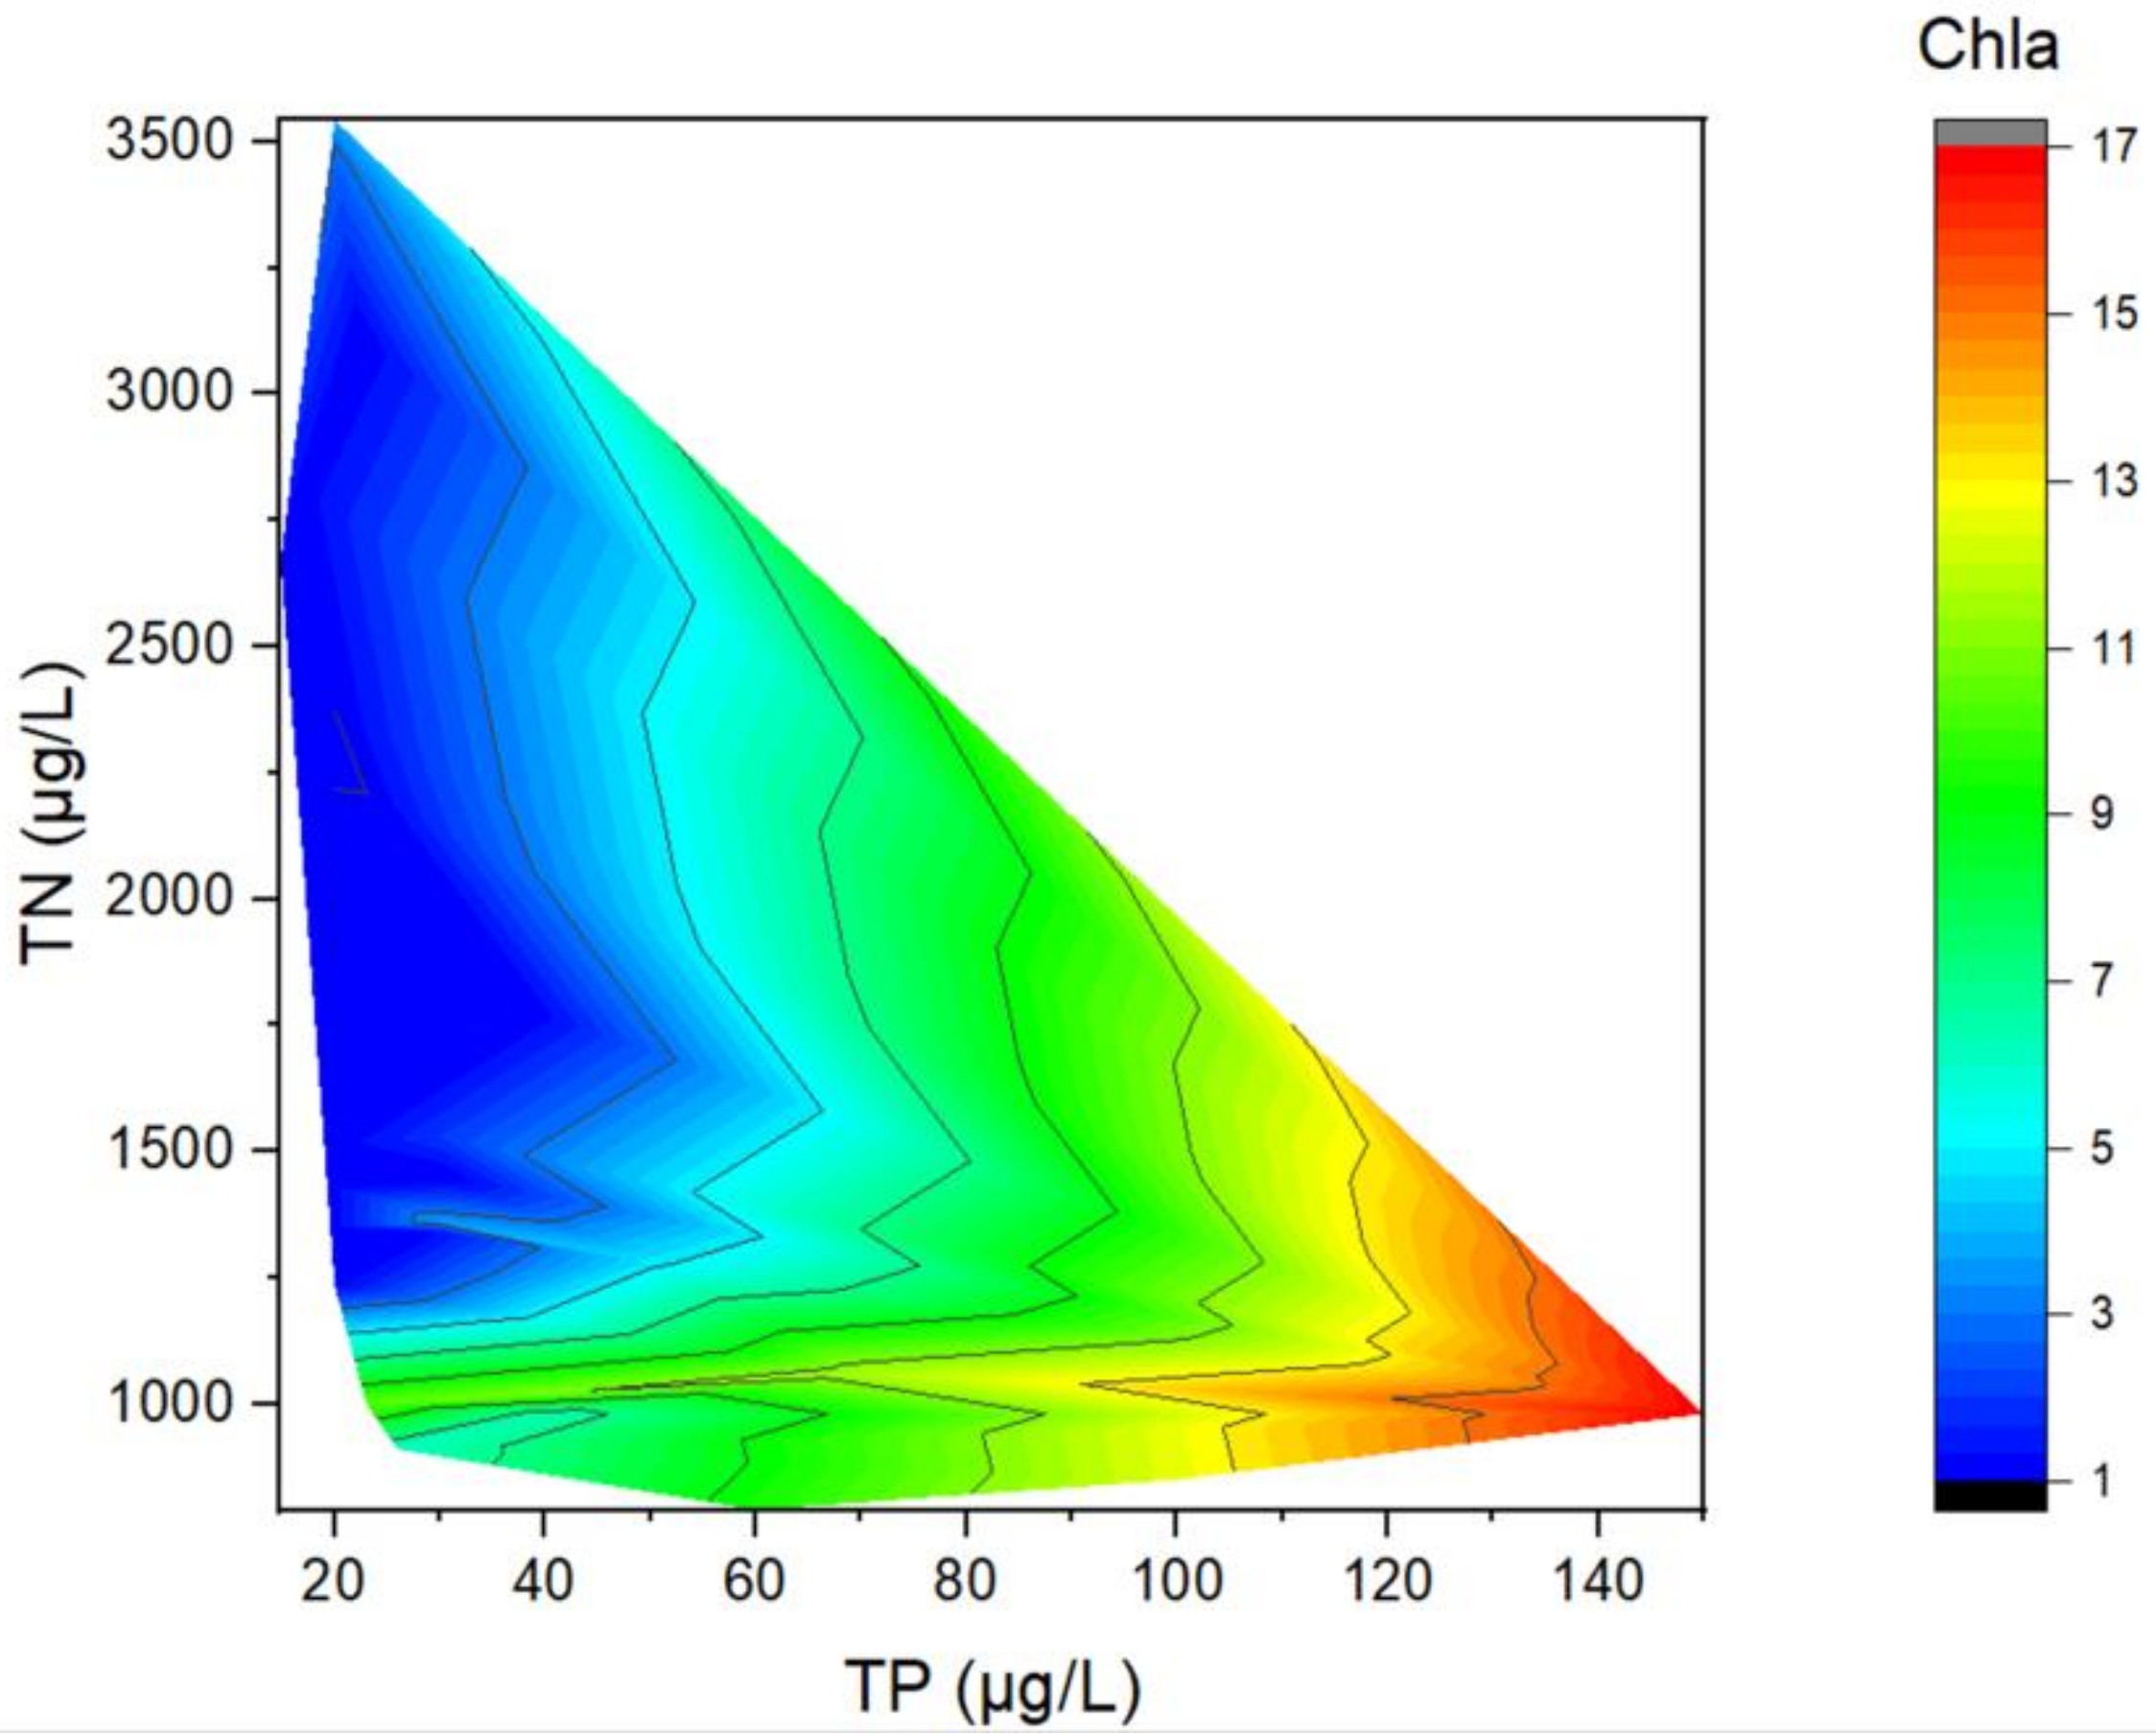
The distribution of Chla in the reservoir (Figure 5) indicated that the maximum value of Chla appeared at a higher TP concentration (TP > 100 μg/L), and the minimum value of Chla appeared at a low TP concentration (TP < 40 μg/L). This result indicated that Chla increased with the increase in TP. In addition, we found that the regions with low TN/TP ratios had higher Chla values than those with high TN/TP ratios.
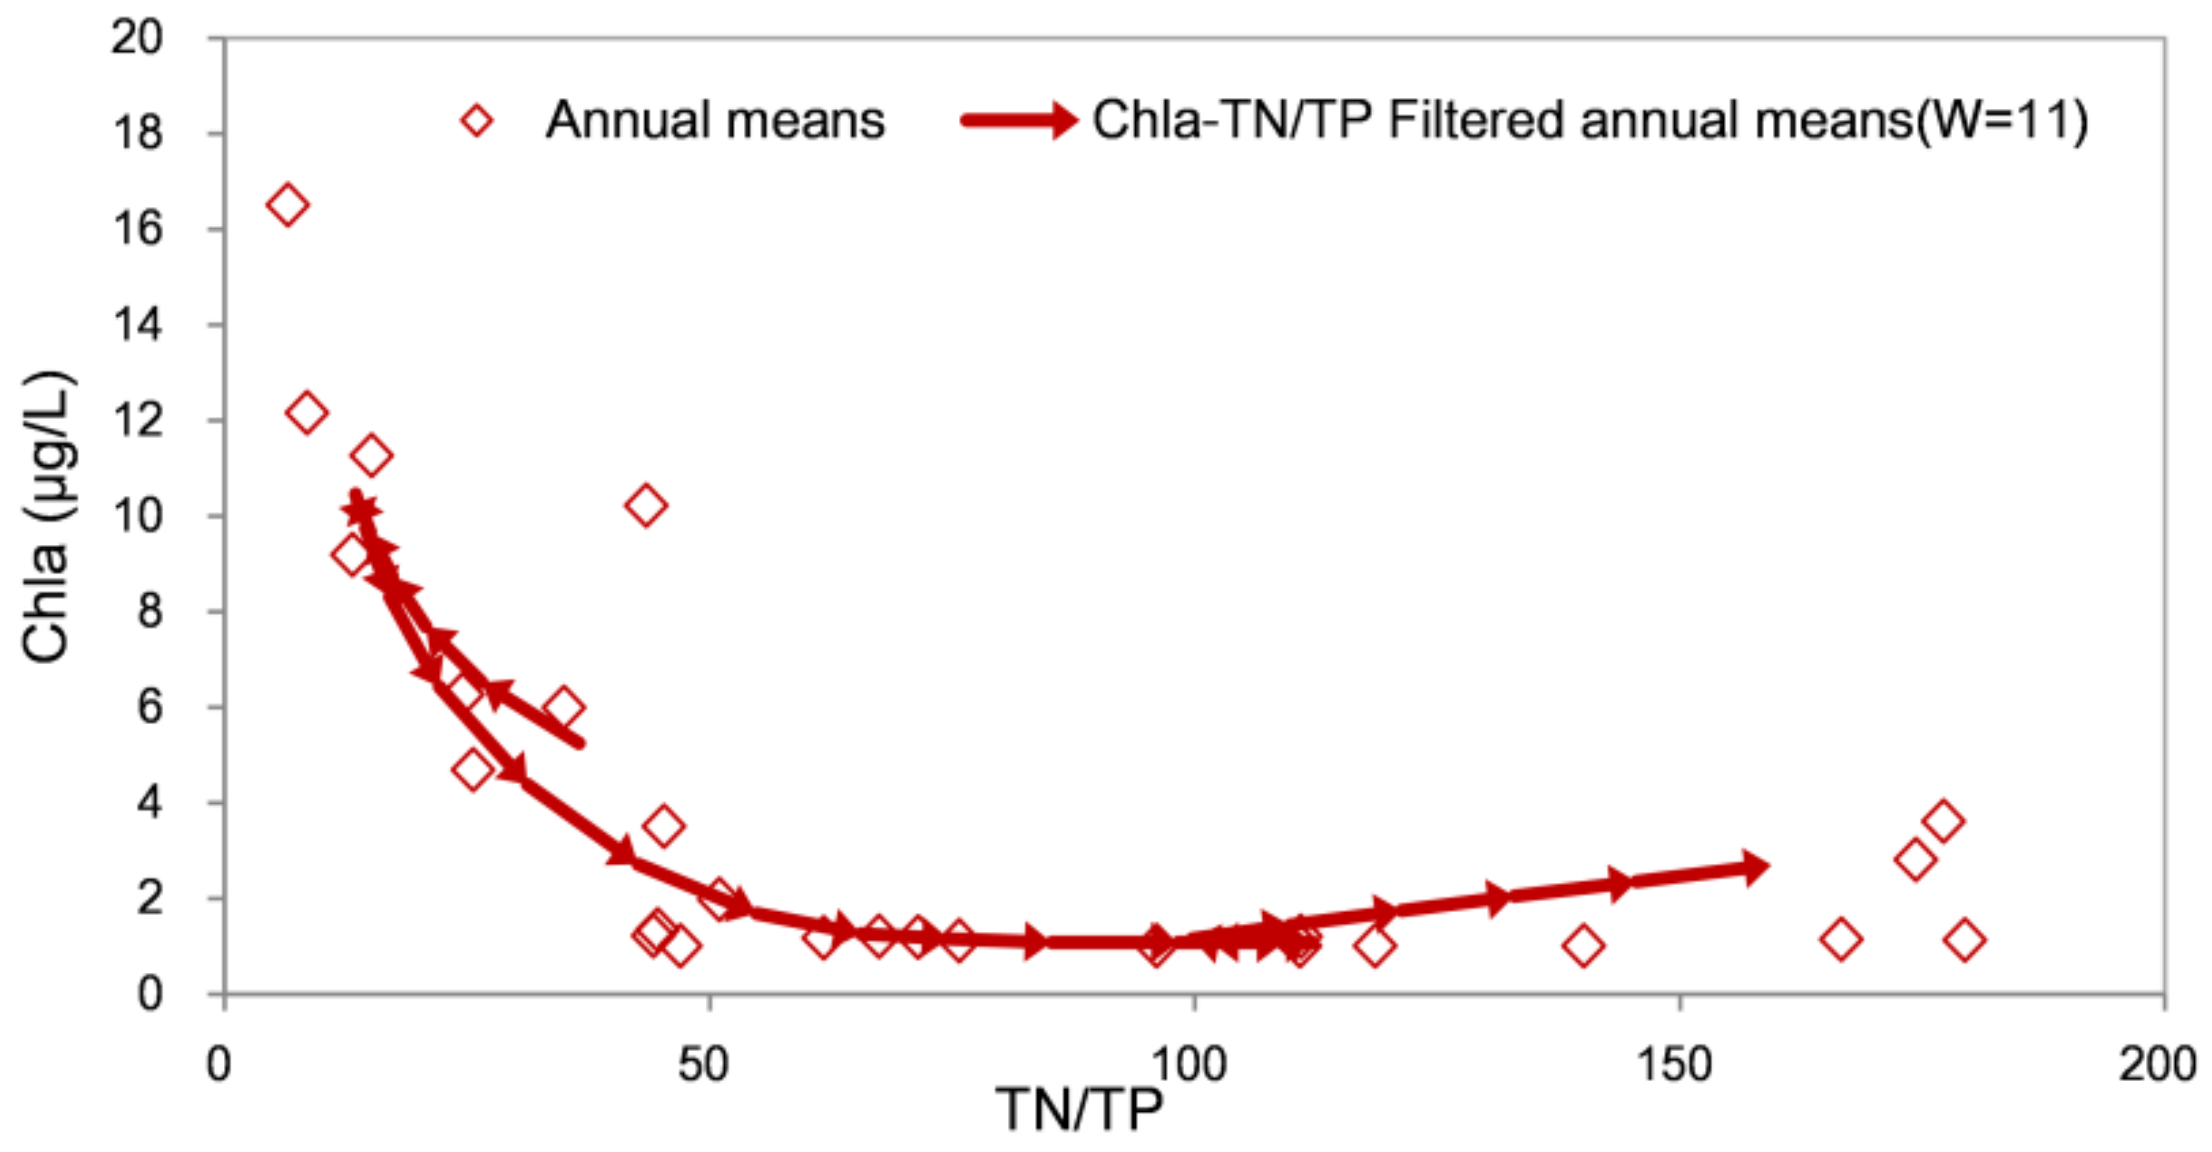
The filtering trajectory diagram of Chla-TN/TP (Figure 6) of the Chai River Reservoir (1996–2021) shows the change in Chla with the TN/TP ratio over time. There was a negative correlation between Chla and TN/TP, with TN/TP coverage from 10 to 170 (Figure 6). Because the filtered data are arranged following chronological order in the phase diagram, the red lines are reciprocating and there is more than one red line. In the recovery stage, the TN/TP increased, and the concentration of Chla decreased gradually. It is believed that the higher TN/TP ratio strengthened the phosphorus limitation in the reservoir and was effective for phosphorus control.
3.4. Setting the Nutrient Targets
3.4.1. Interannual Variation of TPa
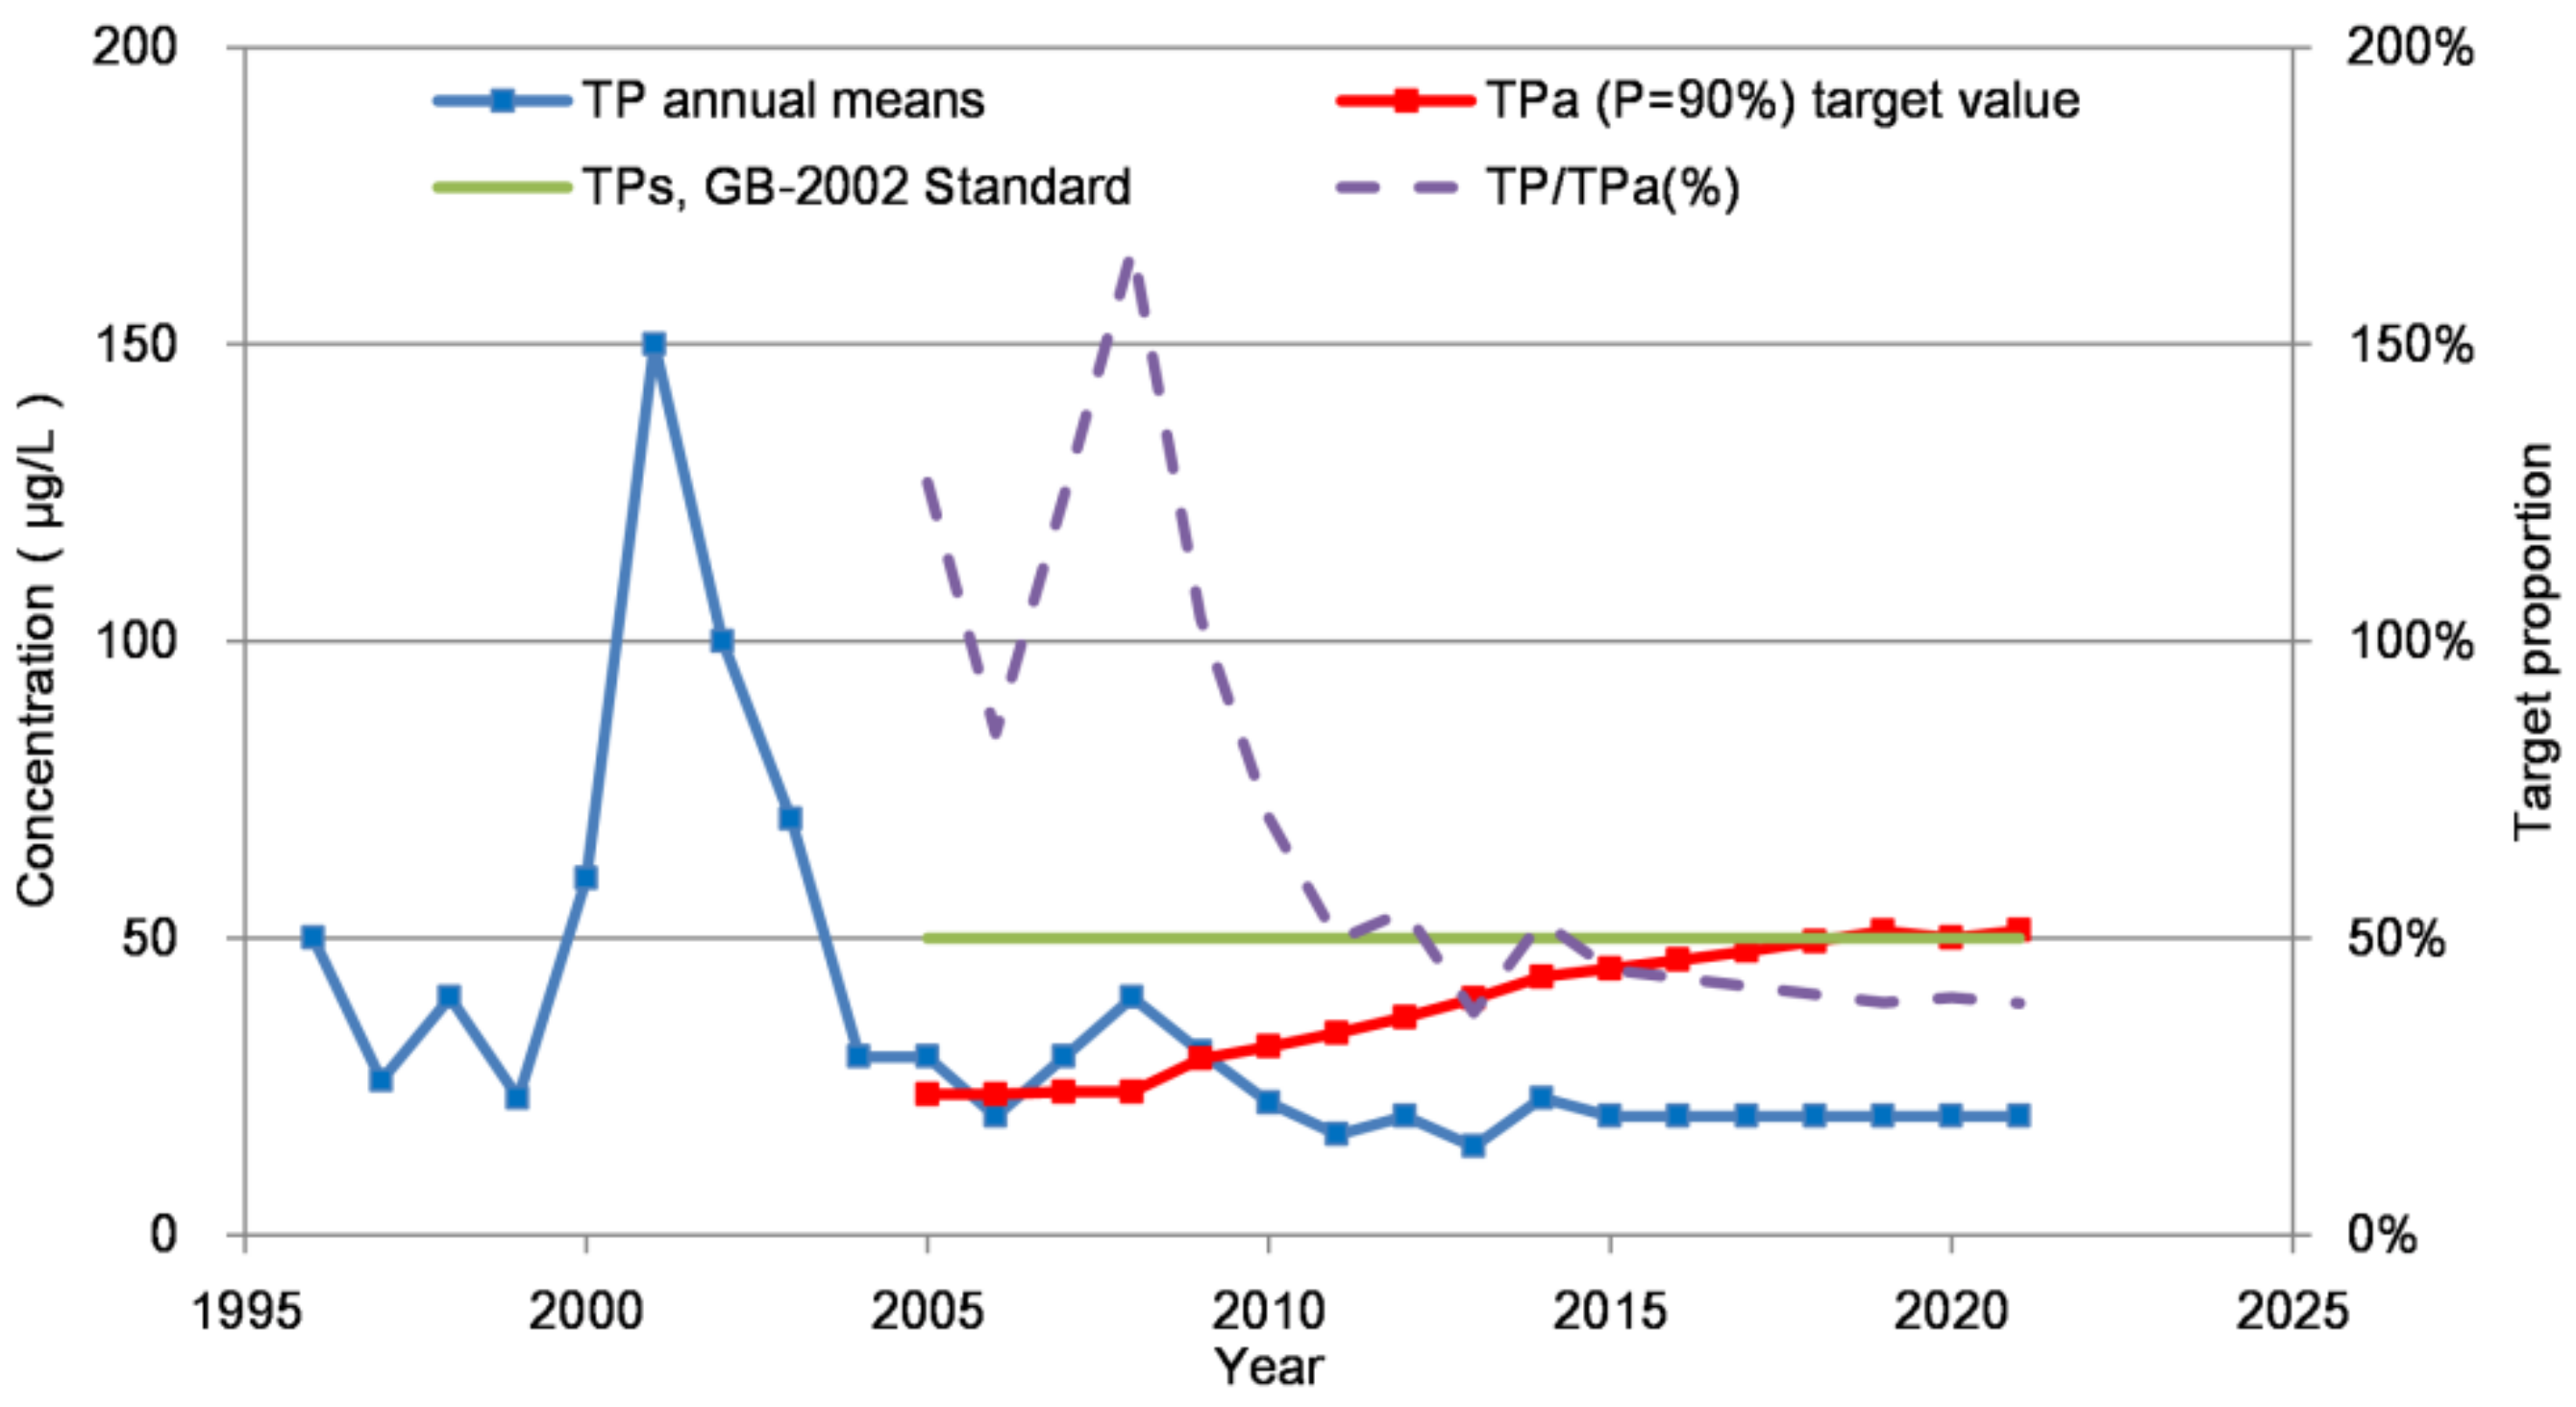
The TPa increased from 23.7 μg/L in 2005 to 51.3 μg/L in 2021 (Figure 7). The result showed that the TP-carrying concentration in the reservoir was gradually increased. Currently, the national TP standard can meet the needs of algal control (Chla =10 μg/L and P = 90%). The TP/TPa ratio decreased from 127% in 2005 to 39% in 2021, reflecting that the actual TP concentration could meet TPa.
3.4.2. The Thresholds for TP and TN under Different Chla Targets
In order to set the nutrient targets for the Chaihe Reservoir, we determined four different Chla levels as stage goals and estimated the thresholds for TP and TN. The data were mainly two types, including all data and data after 2004. Data after 2004 allowed for the ETP(t) to approach the actual ETP during oligotrophication, thus obtaining a TN threshold for buffering control. Table 2 shows the TP- and TN-carrying concentrations (μg/L) under different Chla levels (P = 90%). Using all the reservoir data since 1996, the average value of TPa in the recent period (2017–2021) was higher than that in the early period (2004–2009). The estimated TPa based only on data after 2004 was twice as large as the recent TPa (2004–2015) measured by all the data. Considering that the reservoir has the function of supplying drinking water, we settled at Chla = 8 μg/L as the goal for algal control. This is because Chla = 8 μg/L is the upper limit of the mesotrophic state settled by OECD. Consequently, the nutrient targets were advised to be TP < 40 μg/L and TN > 2100 μg/L, and these can effectively prevent cyanobacterial blooms. The current TP concentration in the reservoir meets the Chla goal (Chla = 8 μg/L). However, the actual TN concentration was over 3000 μg/L and seriously exceeded the TNb, which did not meet the requirement for water quality. Therefore, it was recommended to maintain the TN at 2100 μg/L. If the Chla goal needs to be stricter in future, the nutrient thresholds should also change.
4. Discussion
4.1. Nitrogen Control Was Unnecessary for Oligotrophication in P-Limited Systems
The oligotrophication pathway of the Chaihe Reservoir from 2001 to 2021 showed that decreasing the concentration of TP won the success of controlling eutrophication. The Chla responded rapidly with reductions in the TP and approached an oligotrophic state (TLICW ≈ 30). Whole-lake experiments [12,18] and many long-term lake cases [19,20,21] have shown that controlling phosphorus inputs alone can produce eutrophication recovery. However, in reservoirs with short water residence times, hydraulic flushing to control eutrophication may yield more a rapid response than reducing phosphorus loading [22]. In 2003, the Tieling sewage treatment plant was constructed and began operation, and this greatly reduced nutrient load input from the Chaihe River basin. As a result, the added function of urban water supply caused a very high quantity of outflow in the reservoir (Figure 4). We considered that the increased hydraulic flushing had effectively inhibited the growth and aggregation of algae. As a result, the utilization efficiency of phosphorus (Chla /TP) and the concentration of Chla decreased in the reservoir (Figure 3a). Moreover, it was found that the TP-carrying concentration was gradually recovering after the flushing event. We considered that it increased the hydraulic flush and effectively inhibited the growth and aggregation of algae. A major hydraulic flushing event that happened in Lake Paranoá produced a water quality improvement and a reduction in chlorophyll a, while five-year nutrient load reductions had little effect [23]. Our study highlights that adjusting hydraulic conditions is as important as decreasing TP loadings during eutrophication control.
The control of nitrogen loadings was generally unnecessary for relieving eutrophication in P-limited reservoirs or lakes. How to optimize the design of the nutrient load control as a water quality management strategy for coastal ecosystems is an important problem that remains to be solved [24]. By considering the global nitrogen cycle [25,26], biotoxicity [27,28] and lakes or marine areas that have N-limitations [13,29], it is necessary to reduce the nitrogen input. However, trying to control nitrogen levels is unnecessary when controlling eutrophication of P-limited lakes [30]. During the reoligotrophication of the Chaihe Reservoir (2002–2021), the increase in TN concentration did not always hinder the eutrophication recovery. Both the decline in TP and the increase in TN resulted in a higher TN/TP ratio and strengthened the phosphorus limitation (Figure 3b). A negative correlation between the Chla and TN/TP was found in our result, and the state with a low TN/TP had a higher Chla value than that with a high TN/TP ratio (Figure 5). The results demonstrated that the increase in TN could boost the TN/TP ratio, which may have an advantage for decreasing Chla. Hence, the reduction of nitrogen loads will definitely decrease TN/TP and shift it to a suitable area for algae growth, which has a negative effect on oligotrophication in the P-limited Chaihe Reservoir. In particular, reducing nitrogen through sewage treatment plants will not only consume high amounts of energy but also increase greenhouse gas emissions. Therefore, excessive nitrogen control is neither economical nor environmentally friendly.
Considering the relationship of trophic states (Chla) and the TN/TP ratio is beneficial for clarifying the long-debated nitrogen and phosphorus control [31]. Phosphorus limitation is primarily limited to lakes with poor natural nutrients, and most lakes are probably colimited by N and P [30]. TN:TP stoichiometry may be controlled using various biogeochemical processes in the lake (such as denitrified N2 fixed deposition and resuspension) and may change with the changeable nutrient status of lakes. Due to nitrogen fixation, nitrogen-fixing cyanobacteria can fix N2 from the atmosphere to compensate for lake nitrogen deficiency, thus supporting the lake phosphorus limitation paradigm. Recent research has revealed that nitrogen fixation does not axiomatically lead to phosphorus limitation in aquatic ecosystems [32]. In addition, the TN/TP ratio in lakes is more likely to be changed into being colimited by N and P, and the probability of phosphorus limitation decreases [33]. For hypereutrophic lakes such as Taihu Lake, the TN/TP ratio is very low due to the contribution of an endogenous P load, and there is nitrogen limitation in summer. Therefore, the dual control of N and P is necessary [29,34]. In addition, the Gehu Lake, which was less eutrophic than the Taihu Lake, was also colimited by N and P, and a decrease in TN and TP relieved the eutrophication [35]. However, reservoirs are oligotrophic or mesotrophic, and they could commonly have a higher TN/TP ratio. Therefore, phosphorus input reductions are an important and efficient eutrophication management method in light-eutrophic lakes and reservoirs, while nitrogen control may not be necessary.
4.2. Phosphorus Reduction Efforts Exacerbated Nitrogen Pollution
Efforts to reduce the phosphorus input to lakes have helped lessen algal blooms, but they have exacerbated nitrate pollution. In Figure 3, it can be seen that TP is positively correlated with Chla, TN is negatively correlated with Chla, and TN and TP show an obvious incongruous relationship. The results revealed that the eutrophication and nutrient carrying capacity of the reservoir were primarily affected by the TP concentration. A decrease in the P input reduced the algal biomass but caused a sharp increase in the TN/TP ratio. Wang et al. [36] evaluated the nutrient budget of the Chaihe Reservoir using the nutrient budget model integrated with remote sensing data. They found that fertilizer use was the primary source of nutrient input, and TP had a higher potential risk to agricultural non-point sources than TN. Nutrient inputs from landscapes have a relatively low TN/TP compared to in-lake processes, indicating that external nutrient inputs cannot explain the situation of low P and high N in the reservoir. The evaluation of atmospheric N deposition in China showed that N deposition reached a peak between 2000 and 2010 and then began a steady decline [37]. The nitrogen load was primarily determined by land inputs and atmospheric nitrogen deposition, which have reduced in recent years, while the TN concentration in the reservoir kept increasing. We believe that the nitrogen pollution was related to geochemical nitrogen and the phosphorus cycle.
During eutrophication, the accumulation of phosphorus accelerates the loss of nitrogen [38]. From 1996 to 2001, the phosphorus concentration in the Chaihe Reservoir increased, and the TN concentration decreased. These events confirmed that during eutrophication, increasing phosphorus input stimulated the lake’s nitrogen removal process, resulting in a large amount of pollutant nitrogen being absorbed into the tissues of algal blooms [7]. Ecosystem experiments in lakes and rivers have also shown that increased inputs of phosphorus can improve nitrogen removal [4,5,6]. Nitrogen fixation and denitrification are the processes that distinguish the nitrogen cycle from the phosphorus cycle. In many eutrophic lakes, fixed N may not accumulate because denitrification removes more N on an annual basis than is replenished through N fixation [39]. Eutrophicated lakes and reservoirs have a nitrogen removal capacity similar to that of sewage treatment plants, preventing more nitrogen export to coastal systems and causing marine eutrophication. However, it is often unrealistic to try to mitigate nitrogen pollution by adding phosphorus. Adding phosphorus will undoubtedly increase the risk of eutrophication in lakes. Hence, the disadvantages of adding phosphorus may far outweigh the benefits provided by nitrogen reduction.
During reoligotrophication, denitrification is inhibited and cannot alleviate the excess nitrogen input. An increase in the TN concentration after 2002 was the result of a decrease in Chla due to a TP reduction (Figure 3a), indicating that the nitrogen removal capacity of the reservoir was negatively correlated with the TP concentration and algal biomass. Denitrification is an important process in the nitrogen cycle that converts nitrates to N2 or N2O, thereby permanently removing nitrogen from freshwater ecosystems. The N removal amount of the reservoir primarily depends on the nitrogen content from the sediments caused by algal deposition. Without algal deposition, there would be no nitrogen burial in the sediments and denitrification [8]. Sollie et al. [40] studied the contribution of different retention processes for water quality improvement, indicating that settling and burial contributed more nutrient retention than denitrification. Müller et al. [11] studied N-elimination rates in 21 Swiss lakes based on whole-lake N budgets. They found that denitrification was the more efficient pathway and that it accounted for an average of 75% of the removed N, while the burial of organic N in sediments accounted for an average of 25%. When the phosphorus input decreased, the algal biomass and nitrogen burial decreased. In addition, due to the improved oxygen conditions, the denitrification process could not alleviate the excess nitrogen input; thus, the lake’s denitrification capacity decreased. This may be the explanation for the intensified nitrogen pollution caused by a decrease in the phosphorus input in the Chaihe Reservoir after 2002.
This asynchronous example of nitrogen and phosphorus may be found to occur in more cases, when considering least productive reservoirs, and it is attributed to nitrogen and phosphorus concentrations that primarily depend on external loads. In most lakes, the internal circulation of nitrogen and phosphorus is often hidden by an external load under nutrient management. Therefore, if the influence of the external load could be infinitely ignored, the phenomenon where nitrogen increases with a phosphorus reduction may find more case supports in less productive reservoirs or lakes with little anthropogenic interference. For example, the Fuxian Lake is oligotrophic and deep, and a stage was also found where the nitrogen increased with a phosphorus reduction [41].
4.3. Nutrient Thresholds and Management Strategies for the Chaihe Reservoir
In China, the water quality of reservoirs generally meets class III of China’s “Environmental Quality Standards for Surface Water (GB3838-2002)”, but excessive nitrogen content is a cause for concern, as is the case in the Chaihe Reservoir. In 2008, the TLI of the Chaihe Reservoir ranged from 30 to 45, belonging to the mesotrophic state [42], while the Chla indicated that the reservoir was oligotrophic. The current surface water standard and the TLI method have shortcomings or are not precise in their use. For example, the lake has met the eutrophication control requirements, and the TN index is not required to reach the standard for surface water. In this study, the TLIcw was used to evaluate the nutrient status of the Chaihe Reservoir. The result showed that the changes in the TP and Chla indicate the nutrient status of the reservoir well. Considering the requirements of eutrophication control, nitrogen loading does not need to be controlled. We recommend revising the national surface water quality standard as soon as possible or issuing a separate eutrophication standard, such as adding Chla as a national control index, to more accurately represent the level of eutrophication. In addition, by breaking the national standard pattern, the nutrient index TP (or TN) standard should be combined with the TN/TP ratio to achieve the accurate management of lakes based on the limiting nutrient. If the overall TN influx into the sea was reduced, assessment requirements could be appropriately relaxed to allow high-nitrogen operation, especially when lakes and reservoirs are limited by phosphorus. In fact, besides the requirements for drinking water, there are other separate ecosystem impacts from just high concentrations of nitrogen. The caveat is that maintaining high nitrogen levels may have a negative effect on shallow-lake ecosystems, such as the loss of submerged plants and the excessive growth of phytoplankton [43,44]. Thus, maintaining high nitrogen levels are not encouraged in shallow lakes, which will inhibit the reconstruction of submerged plants.
The Chaihe Reservoir is characterized by high nitrogen content and low algal population, and this confirmed the strategy that priority phosphorus control can ease eutrophication, while nitrogen reduction is not necessary. The algal biomass was limited by phosphorus at a low level when the TP was low but the TN was high (Figure 5). The downward jump of Chla-TP (Figure 3) confirmed that phosphorus control led to a sharp decrease in Chla. In addition, the nutrient-carrying concentration of the reservoir has improved due to TP reduction, causing an increase in TPa (Figure 7). A plankton survey of the Chaihe Reservoir performed in 2008 showed that green algae predominated in biomass and species abundance due to low phosphorus concentrations, while the blue algal biomass was low [45]. This result confirmed that a high TN/TP ratio inhibited the growth of nitrogen-fixing cyanobacteria. Therefore, TNb = 30 TPa was chosen as the lower limit to prevent cyanobacterial blooms (Table 2). The TPa threshold calculated from all data can be used as the standard for the reservoir. This threshold is stricter than that calculated from recent data. It is suggested that implementing the nutrient thresholds according to Chla = 8 μg/L can maintain the mesotrophic state of the reservoir (both are stricter than the current national standard of the functional area). Finally, the nutrient targets were advised to be TP < 40 μg/L and TN = 2100 μg/L, and these can effectively prevent cyanobacterial blooms. Chla-TP is close to the original pathway (Figure 3a), indicating that a low-nutrient freshwater system can easily recover from eutrophication. However, the nutrient threshold may change in the future if environmental factors change, such as climate change or hydraulic factors. When the actual TP concentration decreases, the TN threshold should be reduced according to the recommended TNb. In other words, under phosphorus limitation, it is not necessary to control nitrogen in advance in order to reach the goal of Chla, but to primarily control phosphorus. In addition, nutrient management should maintain a TN/TP ratio slightly greater than 30, and this will help prevent a dominance of cyanobacteria or nitrogen-fixing cyanobacteria [46]. Another advantage for maintaining high nitrogen in lakes and reservoirs is because it is conducive to reducing the energy consumption of nitrogen removal.
Adaptive nutrient-management strategies have been proposed, aiming to relieve nitrogen pollution and lake–coast eutrophication. Nitrogen targets were far from attained, and increasing the TN levels in the least productive lakes and reservoirs has been a problem, as this strategy increases the eutrophication risk of downstream N-sensitive sea areas [47]. However, due to the potential for rainfall to be exported, only a small amount of water flows directly from Chaihe Reservoir into the sea, while most of the water is used for irrigation and for supplying drinking water and industrial water. In addition, the upstream of the reservoir is a low-density population area; hence, it is clearly unwise to control nitrogen inputs with high energy consumption and high cost. We suggest that nitrogen removal can be implemented at the end of a water supply system. In the wet season, the necessary nutrient load control in the basin should be considered, since rainfall may export a large amount of nutrients to coastal areas. In addition, accelerating the cultivation of aerobic denitrifying bacteria is urgently required [10]. Therefore, the management value of TNb proposed in this paper is to avoid the inefficient energy consumption (such as increased emissions of CO2 and NOx) caused by the excessive removal of nitrogen in lakes and reservoirs limited by phosphorus.
5. Conclusions
Nitrogen pollution was related to phosphorus reduction during the reoligotrophication of the Chaihe reservoir. The Chaihe Reservoir experienced a rapid water quality improvement due to hydraulic flushing, and the TP reduction effectively reversed the eutrophication. The decline in TP decreased the algal biomass but led to nitrogen pollution in the Chaihe Reservoir, and this result provided empirical support for the influence of phosphorus on the nitrogen cycle and fate. The TN:TP stoichiometry had a negative relationship with the trophic status, and thus, during eutrophication recovery, attention should be paid to the regulation of the TN/TP ratio, and TN removal should be relaxed appropriately to prevent turning to a smaller TN/TP ratio that is suitable for cyanobacterial blooms. A quantitative analysis of the sources and consequences of N pollution in the entire reservoir area should be performed. This will reveal the removal mechanism of nitrogen in oligotrophic water. More research on net N2 fluxes can provide insights into denitrification and nitrogen fixation processes, and this will help us to understand the stoichiometric differences in the different nutrient states.
The case of the Chaihe Reservoir provides a high-nitrogen and low-algae paradigm to develop a strategy for priority phosphorus control, while nitrogen control can be utilized for buffering. For the Chaihe Reservior, it is clearly unwise to control nitrogen inputs with high energy consumption and high cost. To solve nitrogen pollution, nitrogen removal at the end of water treatment is recommended to meet the requirements of the drinking water supply. The nutrient targets are advised to be TP < 40 μg/L and TN = 2100 μg/L, and these can effectively prevent cyanobacterial blooms. A TN threshold of the buffering control has great significance for setting the nutrient goals and for mitigating cyanobacterial blooms in freshwater ecosystems.
Author Contributions
Conceptualization, J.Z. and Y.L. (Yuan Li); methodology, J.Z. and Y.L. (Yuan Li); software, L.D.; validation, H.L.; formal analysis, X.Z.; resources, J.Z.; data curation, B.X.; writing—original draft preparation, X.Z.; writing—review and editing, Y.L. (Yue Liu), J.Z. and Y.L. (Yuan Li); visualization, X.Z. and L.D.; supervision, J.Z. and Y.L. (Yuan Li); project administration, J.Z.; funding acquisition, J.Z. All authors have read and agreed to the published version of the manuscript.
Funding
This research was funded by the National Key Research and Development Program of China (2021YFC3201505) and the Major Science and Technology Program for Water Pollution Control and Treatment (2017ZX07301-003, 2012ZX07506-008).
Data Availability Statement
The authors confirm that the data supporting the findings of this study are available within the article. Raw data that support the findings of this study are available from the corresponding author, upon reasonable request.
Acknowledgments
We greatly appreciate the Tieling Research Academy of Environmental Sciences for providing the water quality data. We thank LetPub (www.letpub.com) for its linguistic assistance during the preparation of this manuscript.
Conflicts of Interest
The authors declare no conflict of interest.
References
- Smith, V.H. Responses of estuarine and coastal marine phytoplankton to nitrogen and phosphorus enrichment. Limnol. Oceanogr. 2006, 51, 377–384. [Google Scholar] [CrossRef]
- Schindler, D.W. Recent advances in the understanding and management of eutrophication. Limnol. Oceanogr 2006, 51, 356–363. [Google Scholar]
- Smith, V.H. Eutrophication of freshwater and coastal marine ecosystems—A global problem. Environ. Sci. Pollut. Res. 2003, 10, 126–139. [Google Scholar] [CrossRef]
- Kaste, Ø.; Lyche-Solheim, A. Influence of moderate phosphate addition on nitrogen retention in an acidic boreal lake. Can. J. Fish. Aquat. Sci. 2005, 62, 312–321. [Google Scholar] [CrossRef]
- Peterson, B.J.; Hobbie, J.E.; Hershey, A.E.; Lock, M.A.; Ford, T.E.; Vestal, J.R.; McKinley, V.L.; Hullar, M.A.J.; Miller, M.C.; Ventullo, R.M.; et al. Transformation of a Tundra River from Heterotrophy to Autotrophy by Addition of Phosphorus. Science 1985, 229, 1383–1386. [Google Scholar] [CrossRef]
- Davison, W.; George, D.G.; Edwards, N.J.A. Controlled reversal of lake acidification by treatment with phosphate fertilizer. Nature 1995, 377, 504–507. [Google Scholar] [CrossRef]
- Finlay, J.C.; Small, G.E.; Sterner, R.W. Human influences on nitrogen removal in lakes. Science 2013, 342, 247–250. [Google Scholar] [CrossRef]
- Bernhardt, E.S. Ecology. Cleaner lakes are dirtier lakes. Science 2013, 342, 205–206. [Google Scholar] [CrossRef]
- Bergstrom, A.K.; Blomqvist, P.; Jansson, M. Effects of atmospheric nitrogen deposition on nutrient limitation and phytoplankton biomass in unproductive Swedish lakes. Limnol. Oceanogr. 2005, 50, 987–994. [Google Scholar] [CrossRef]
- Wang, H.; Wang, T.; Yang, S.; Liu, X.; Kou, L.; Huang, T.; Wen, G. Nitrogen Removal in Oligotrophic Reservoir Water by a Mixed Aerobic Denitrifying Consortium: Influencing Factors and Immobilization Effects. Int. J. Environ. Res. Public Health 2019, 16, 583. [Google Scholar] [CrossRef]
- Müller, B.; Meyer, J.S.; Gächter, R. Denitrification and Nitrogen Burial in Swiss Lakes. Environ. Sci. Technol. 2022, 56, 2794–2802. [Google Scholar] [CrossRef] [PubMed]
- Schindler, D.W.; Hecky, R.E.; Findlay, D.L.; Stainton, M.P.; Parker, B.R.; Paterson, M.J.; Beaty, K.G.; Lyng, M.; Kasian, S.E.M. Eutrophication of lakes cannot be controlled by reducing nitrogen input: Results of a 37-year whole-ecosystem experiment. Proc. Natl. Acad. Sci. USA 2008, 105, 11254–11258. [Google Scholar] [CrossRef] [PubMed]
- Conley, D.J.; Paerl, H.W.; Howarth, R.W.; Boesch, D.F.; Seitzinger, S.P.; Havens, K.E.; Lancelot, C.; Likens, G.E. Controlling Eutrophication: Nitrogen and Phosphorus. Science 2009, 323, 1014–1015. [Google Scholar] [CrossRef] [PubMed]
- Paerl, H.W.; Scott, J.T.; McCarthy, M.J.; Newell, S.E.; Gardner, W.S.; Havens, K.E.; Hoffman, D.K.; Wilhelm, S.W.; Wurtsbaugh, W.A. It Takes Two to Tango: When and Where Dual Nutrient (N & P) Reductions Are Needed to Protect Lakes and Downstream Ecosystems. Environ. Sci. Technol. 2016, 50, 10805–10813. [Google Scholar] [CrossRef] [PubMed]
- APHA. Standard Methods for the Examination of Water and Wastewater; American Public Health Association: Washington, DC, USA, 2012. [Google Scholar]
- Han, X.; Fu, g.; Liu, q.; Zhang, S.; Zhao, J. Changed weight trophic level index method and its application to Longhe tributary of the Three Gorges reservoir area. J. Environ. Eng. Technol. 2018, 8, 627–634. [Google Scholar] [CrossRef]
- Zhao, J.; Fu, G. Assessment of lake eutrophication recovery: The filtering trajectory method (FTM) and its application to Dianchi Lake, China. Environ. Monit. Assess. 2019, 191, 360. [Google Scholar] [CrossRef]
- Schindler, D.W. Evolution of Phosphorus Limitation in Lakes. Science 1977, 195, 260–262. [Google Scholar] [CrossRef]
- Schindler, D.W. The dilemma of controlling cultural eutrophication of lakes. Proc. Biol. Sci 2012, 279, 4322–4333. [Google Scholar] [CrossRef]
- Jeppesen, E.; Sondergaard, M.; Jensen, J.P.; Havens, K.E.; Anneville, O.; Carvalho, L.; Coveney, M.F.; Deneke, R.; Dokulil, M.T.; Foy, B.O.B.; et al. Lake responses to reduced nutrient loading—An analysis of contemporary long-term data from 35 case studies. Freshw. Biol. 2005, 50, 1747–1771. [Google Scholar] [CrossRef]
- Welch, E.B. Should nitrogen be reduced to manage eutrophication if it is growth limiting? Evidence from Moses Lake. Lake Reserv. Manag. 2009, 25, 401–409. [Google Scholar] [CrossRef]
- Reid, N.J.; Hamilton, S.K. Controls on algal abundance in a eutrophic river with varying degrees of impoundment (Kalamazoo River, Michigan, USA). Lake Reserv. Manag. 2007, 23, 219–230. [Google Scholar] [CrossRef] [Green Version]
- Padovesi-Fonseca, C.; Philomeno, M.; Andreoni-Batista, C. Limnological features after a flushing event in Paranoá Reservoir, central Brazil. Acta Limnol. Bras. 2009, 21, 277–285. [Google Scholar]
- Smith, V.H.; Schindler, D.W. Eutrophication science: Where do we go from here? Trends Ecol. Evol. 2009, 24, 201–207. [Google Scholar] [CrossRef] [PubMed]
- Kong, X.; Dong, L.; He, W.; Wang, Q.; Mooij, W.M.; Xu, F. Estimation of the long-term nutrient budget and thresholds of regime shift for a large shallow lake in China. Ecol. Indic. 2015, 52, 231–244. [Google Scholar] [CrossRef]
- Klaus, M.; Bergstrom, A.-K.; Jonsson, A.; Deininger, A.; Geibrink, E.; Karlsson, J. Weak response of greenhouse gas emissions to whole lake N enrichment. Limnol. Oceanogr. 2018, 63, S340–S353. [Google Scholar] [CrossRef]
- He, L.; Cao, T.; Hu, X.; Zhang, H.; Zhang, X.; Ni, L.; Xie, P. Effects of NH4+and K+enrichments on carbon and nitrogen metabolism, life history and asexual reproduction ofVallisneria natansL. in aquarium experiments. J. Freshw. Ecol. 2014, 30, 391–406. [Google Scholar] [CrossRef]
- Gobler, C.J.; Burkholder, J.M.; Davis, T.W.; Harke, M.J.; Johengen, T.; Stow, C.A.; Van de Waal, D.B. The dual role of nitrogen supply in controlling the growth and toxicity of cyanobacterial blooms. Harmful Algae 2016, 54, 87–97. [Google Scholar] [CrossRef]
- Paerl, H.W.; Havens, K.E.; Xu, H.; Zhu, G.; McCarthy, M.J.; Newell, S.E.; Scott, J.T.; Hall, N.S.; Otten, T.G.; Qin, B. Mitigating eutrophication and toxic cyanobacterial blooms in large lakes: The evolution of a dual nutrient (N and P) reduction paradigm. Hydrobiologia 2020, 847, 4359–4375. [Google Scholar] [CrossRef]
- Sterner, R.W. On the Phosphorus Limitation Paradigm for Lakes. Int. Rev. Hydrobiol. 2008, 93, 433–445. [Google Scholar] [CrossRef]
- Liang, Z.; Soranno, P.A.; Wagner, T. The role of phosphorus and nitrogen on chlorophyll a: Evidence from hundreds of lakes. Water Res. 2020, 185, 116236. [Google Scholar] [CrossRef]
- van Gerven, L.P.A.; Kuiper, J.J.; Mooij, W.M.; Janse, J.H.; Paerl, H.W.; de Klein, J.J.M. Nitrogen fixation does not axiomatically lead to phosphorus limitation in aquatic ecosystems. Oikos 2019, 128, 563–570. [Google Scholar] [CrossRef]
- Zhou, J.; Han, X.X.; Brookes, J.D.; Qin, B.Q. High probability of nitrogen and phosphorus co-limitation occurring in eutrophic lakes. Environ. Pollut. 2022, 292, 118276. [Google Scholar] [CrossRef] [PubMed]
- Paerl, H.W.; Xu, H.; McCarthy, M.J.; Zhu, G.; Qin, B.; Li, Y.; Gardner, W.S. Controlling harmful cyanobacterial blooms in a hyper-eutrophic lake (Lake Taihu, China): The need for a dual nutrient (N & P) management strategy. Water Res. 2011, 45, 1973–1983. [Google Scholar] [CrossRef] [PubMed]
- Zhang, X.; Zhao, J.; Ding, L.; Li, Y.; Liu, H.; Zhao, Y.; Fu, G. Eutrophication evolution trajectory influenced by human activities and climate in the shallow Lake Gehu, China. Ecol. Indic. 2022, 138, 108821. [Google Scholar] [CrossRef]
- Wang, G.; Li, J.; Sun, W.; Xue, B.; Yinglan, A.; Liu, T. Non-point source pollution risks in a drinking water protection zone based on remote sensing data embedded within a nutrient budget model. Water Res. 2019, 157, 238–246. [Google Scholar] [CrossRef] [PubMed]
- Wen, Z.; Xu, W.; Li, Q.; Han, M.; Tang, A.; Zhang, Y.; Luo, X.; Shen, J.; Wang, W.; Li, K.; et al. Changes of nitrogen deposition in China from 1980 to 2018. Environ. Int. 2020, 144, 106022. [Google Scholar] [CrossRef]
- Zhang, Y.; Song, C.; Ji, L.; Liu, Y.; Xiao, J.; Cao, X.; Zhou, Y. Cause and effect of N/P ratio decline with eutrophication aggravation in shallow lakes. Sci. Total Environ. 2018, 627, 1294–1302. [Google Scholar] [CrossRef]
- Scott, J.T.; McCarthy, M.J.; Paerl, H.W. Nitrogen transformations differentially affect nutrient-limited primary production in lakes of varying trophic state. Limnol. Oceanogr. Lett. 2019, 4, 96–104. [Google Scholar] [CrossRef]
- Sollie, S.; Janse, J.H.; Mooij, W.M.; Coops, H.; Verhoeven, J.T.A. The Contribution of Marsh Zones to Water Quality in Dutch Shallow Lakes: A Modeling Study. Environ. Manag. 2008, 42, 1002–1016. [Google Scholar] [CrossRef]
- Zhao, J.; Gao, Q.; Liu, Q.; Fu, G. Lake eutrophication recovery trajectories: Some recent findings and challenges ahead. Ecol. Indic. 2020, 110, 105878. [Google Scholar] [CrossRef]
- Fu, Q.; Xiong, Y.; Lu, X. Nitrogen and Phosphorus Pollution Characteristic and Control Measures in Chaihe Reservoir. J. Basic Sci. Eng. 2010, 18, 66–74. [Google Scholar] [CrossRef]
- Rabalais, N.N. Nitrogen in aquatic ecosystems. AMBIO 2002, 31, 102–112. [Google Scholar] [CrossRef] [PubMed]
- de Vries, W. Impacts of nitrogen emissions on ecosystems and human health: A mini review. Curr. Opin. Environ. Sci. Health 2021, 21, 100249. [Google Scholar] [CrossRef]
- Guo, K.; Zhao, W.; Yan, H.-Q. Study on the Spatio-temporal Pattern of Plankton Community Structure and its Productivity in Chaihe Reservoir. J. Hydroecology 2013, 34, 22–26. [Google Scholar] [CrossRef]
- Smith, V.H. Low nitrogen to phosphorus ratios favor dominance by blue-green algae in lake phytoplankton. Science 1983, 221, 669–671. [Google Scholar] [CrossRef]
- Wilander, A.; Persson, G. Recovery from eutrophication: Experiences of reduced phosphorus input to the four largest lakes of Sweden. AMBIO 2001, 30, 475–485. [Google Scholar] [CrossRef]
Figure 1.
Study area.

Figure 2.
Interannual changes in water quality and nutrient status in the Chaihe Reservoir (1996–2021). (a) Total phosphours (TP) concentration; (b) Total nitrogen (TN) concentration; (c) Chlorophyll a (Chla) concentration; (d) Changed weight trophic level index (TLICW). The red dashed line is the boundary of oligotrophication and the mesotrophic state. The yellow dashed line is the lower limit of the eutrophication boundary.

Figure 3.
(a) Filtering trajectory diagram of Chla-TP and Chla-TN in the Chaihe Reservoir (1996–2021); (b) Filtering trajectory diagram of TN-TP in the Chaihe Reservoir (1996–2021) (the arrow denotes the time direction, where one arrow denotes 1 year. The arrow end represents the data of the year i, and the arrowhead represents the data of the year i+1. W is the number of years in the filtering window.

Figure 4.
Chlorophyll a (Chla) response to hydraulic factors in the Chaihe Reservoir (1996–2021). Q is the quantity of outflow (m3); V is the volume of the Chaihe Reservior (m3).
Figure 4.
Chlorophyll a (Chla) response to hydraulic factors in the Chaihe Reservoir (1996–2021). Q is the quantity of outflow (m3); V is the volume of the Chaihe Reservior (m3).

Figure 5.
Contour plot of the Chaihe Reservoir showing the distribution of Chla across different TP and TN concentrations.
Figure 5.
Contour plot of the Chaihe Reservoir showing the distribution of Chla across different TP and TN concentrations.

Figure 6.
Filtering trajectory diagram of Chla-TN/TP in the Chaihe Reservoir (1996–2021). The arrow denotes the time direction, where one arrow denotes 1 year. The arrow end represents the data of the year i, and the arrowhead represents the data of the year i+1. W is the number of years in the filtering window.

Figure 7.
Dynamic process analysis of the total phosphorus-carrying concentration, TPa, in the Chaihe Reservoir.
Figure 7.
Dynamic process analysis of the total phosphorus-carrying concentration, TPa, in the Chaihe Reservoir.


Table 1.
Changed weight trophic level index (TLICW) eutrophication grading standard.
| TLICW | Trophic Classes |
|---|---|
| ≤ 30 | Oligotrophic |
| 30 <TLICW ≤ 50 | Mesotrophic |
| 50<TLICW ≤ 60 | Light-eutrophic |
| 60<TLICW ≤ 70 | Mesoeutrophic |
| 70<TLICW ≤ 100 | Hypereutrophic |
Table 2.
TP- and TN-carrying concentrations (μg/L) under different Chla levels (P = 90%).
| The Goal of Chla (μg/L) | 10 | 8 | 6 | 4 | Data |
|---|---|---|---|---|---|
| TPa in the early period (2004–2009) | 25 | 20 | 15 | 10 | For all data |
| TPa in the recent period (2017–2021) | 50 | 40 | 30 | 20 | For all data |
| TPa in the recent period (2017–2021) | 89 | 71 | 53 | 35 | Data after 2004 |
| TNa = 10 TPa (2017–2021) | 890 | 710 | 530 | 350 | Data after 2004 |
| TNb = 30 TPa (2017–2021) | 2670 | 2130 | 1590 | 1050 | Data after 2004 |
| TN threshold | >2700 | >2100 | >1600 | >1000 | Data after 2004 |
Publisher’s Note: MDPI stays neutral with regard to jurisdictional claims in published maps and institutional affiliations. |
© 2022 by the authors. Licensee MDPI, Basel, Switzerland. This article is an open access article distributed under the terms and conditions of the Creative Commons Attribution (CC BY) license (https://creativecommons.org/licenses/by/4.0/).
Share and Cite
MDPI and ACS Style
Zhang, X.; Ding, L.; Liu, Y.; Liu, H.; Xuan, B.; Zhao, J.; Li, Y. Reoligotrophication of a High-Nitrogen Reservoir with Phosphorus Removal and Implications for Management. Water 2022, 14, 2629. https://doi.org/10.3390/w14172629
AMA Style
Zhang X, Ding L, Liu Y, Liu H, Xuan B, Zhao J, Li Y. Reoligotrophication of a High-Nitrogen Reservoir with Phosphorus Removal and Implications for Management. Water. 2022; 14(17):2629. https://doi.org/10.3390/w14172629
Chicago/Turabian StyleZhang, Xiaoyu, Lin Ding, Yue Liu, Haixia Liu, Boyu Xuan, Jian Zhao, and Yuan Li. 2022. "Reoligotrophication of a High-Nitrogen Reservoir with Phosphorus Removal and Implications for Management" Water 14, no. 17: 2629. https://doi.org/10.3390/w14172629
Note that from the first issue of 2016, this journal uses article numbers instead of page numbers. See further details here.