
Effect of Monohull Type and Catamaran Hull Type on Ocean Waste Collection Behavior Using OpenFOAM

1
Department of System and Naval Mechatronic Engineering, National Cheng Kung University, Tainan 701, Taiwan
2
Department of Marine Engineering, Hang Tuah University, Surabaya 60111, Indonesia
*
Author to whom correspondence should be addressed.
Water 2022, 14(17), 2623; https://doi.org/10.3390/w14172623
Submission received: 7 July 2022
/
Revised: 22 August 2022
/
Accepted: 23 August 2022
/
Published: 25 August 2022
(This article belongs to the Special Issue The Relationship between Ships and Marine Environment)
Abstract
:Ocean waste that continues moving in the water has been a problem until now. This has stimulated marine debris cleaning technology to emerge. This research sought to evaluate the effectiveness of waste collection using a monohull and catamaran fitted with a forward conveyor. The Reynolds Average Navier Stokes (RANS)-based numerical simulation research is used to predict flow pattern characteristics, velocity contour, wave pattern, pressure distribution, and ship resistance. The current research focuses on the impact of a round-bilge-type monohull and inner flat-type catamaran hull front shape on waste collection behavior by applying numerical methods. The multiphase solver numerical configuration supplied with OpenFOAM v2112 has been verified and validated using the Delft catamaran 372 with Froude numbers 0.3. The effect of free surface on resistance and flow characteristics was evaluated by comparing these two models. The results show the behavior of marine debris collection due to the flow characteristics of both models. The marine debris flows much more conveniently through the conveyor fitted in front of the catamaran model than in the monohull model. In addition, considering the front-side hull flow, the catamaran model is superior since marine debris is able to approach the ship easily. However, the monohull model is faster at bringing marine debris closer to the conveyor, particularly at the location in front of the conveyor.
1. Introduction
Ocean waste that continues moving in the sea has been a problem until now [1,2]. The size of ocean waste varies from very small in micrometers, a few centimeters, such as plastic bags and soda bottles, to the largest in tens of meters, such as shipwrecks and lost cargo containers [3,4,5]. According to the quantity of marine debris in 2010, forecast from these conditions, the total plastic mass in 2025 will rise from 100 to 250 million tonnes with the same commercial assumption [6]. Communities around seas and rivers have a significant influence on this issue [7]. Then the involvement and use of communities around the sea and rivers by using digital technology is also possible to solve this problem [8].
The role and functions of ships in ocean waste cleaning can be carried out in several ways, such as collecting and processing [9]. The design of an ocean waste collection ship using a monohull can also be used [10]. Monohull ships have more space that can be used to store marine debris catches. The monohull ship is also stable and can handle bad weather conditions. Even a relatively small ship will have excellent sailing characteristics from all directions. The monohull-type hull has long been used in the world of sea transportation because of its large loading capacity and relatively low development cost [11]. The current study aims to investigate and to analyze the possibilities of using a monohull ship that has installed a conveyor in front of the ship to collect ocean waste. The monohull ship model used in this research is a round-bilge type.
In addition, for comparison, this research was also carried out on a catamaran type. An inner flat catamaran type is used for comparison. Research on catamarans generally does not discuss the conveyor usage in front of the model. The majority of research tends to discuss the smallest resistance of the ship due to the differences in shape of the catamaran hull without an appendage such as a conveyor. A study of resistance and flow distribution in catamarans due to differences in shape was carried out by Chrismianto et al. The results showed that the inner flat-hull catamaran model generated the smallest resistance compared to the outer flat-hull catamaran model and the symmetry model catamaran [12]. In addition, research on the effect of using the chine in fishing vessels’ catamaran hull form on the resistance was carried out by Basir et al. The results showed that the shape of the catamaran’s hull using three chines was better than two chines and one chine [13]. Other studies have shown that the use of an asymmetrical catamaran is able to reduce wave resistance [14]. In addition, a study of the ship’s resistance due to the effects of catamaran hull distance showed that the wider the hull distance, the smaller the ship’s resistance. [15]. Najafi and Saeed investigated catamarans using foils to investigate the dynamic stability and longitudinal coefficient of motion of catamarans, and the results show that most coefficients are frequency independent, especially at high frequencies [16]. Numerical research on the flow and resistance between the S60 catamaran and the S60 monohull was performed by Farkas et al. The monohull form factor is different from the catamaran form factor, which has the same demihull. The catamaran form factor has also been found to correlate with separation [17]. In addition, research on multi-hull ships revealing greater safety, better seaworthiness, and more deck space than the monohull was performed by Dubrovsky et al. [18].
Research on marine passive plastic collectors in rough sea conditions as well as marine debris collection behavior due to ocean current speed, wave height, wave length, and plastic density was performed by Shaw et al [19]. The results indicated that the wavelength and plastic density of the parameters had a negligible effect on the capture rate. In contrast, the effects of the other two parameters were significant. Research on ocean surface cleaning systems using a mooring system and motion gauges, which is applicable in various marine locations, was carried out by Ji et al [20]. The results denoted that the system’s motion response in the vertical plane is small, indicating that marine debris was unable to escape from the top and bottom of the system.
However, these previous studies can only be applied in locations with large currents and waves, and cannot be applied in some locations without currents and waves such as lakes, sedentary rivers, and other calm water. The utilizations of tools or systems to pick up marine debris using catamarans are being discovered. The novelty of this research is, first, research on conveyor-mounted catamarans is scarce regarding hydrodynamic analysis, such as flow pattern characteristics, velocity contour, wave pattern, pressure distribution, and ship resistance as well as the behavior of ocean waste collection. Second, this research sought to evaluate the effectiveness of waste collection using a monohull and a catamaran, fitted with forward conveyors. The numerical simulation study based on Reynolds Average Navier Stokes (RANS) was used to predict the characteristics of flow patterns, velocity contours, wave patterns, pressure distributions, and ship resistance. The flow around the model was simulated at scaled model using OpenFOAM v2112. First, the multiphase solver numerical configuration supplied with OpenFOAM v2112 was verified and validated using the Delft catamaran 372 with Froude numbers 0.3. The resistance analysis was then evaluated according to the validation guidelines recommended by the International Towing Tank Conference (ITTC). The verified numerical setup was utilized in this present study to identify the flow characteristics and behavior of ocean waste collection around the model at the operation condition. In order to analyze how easily and rapidly the waste approaches the conveyor, the solutions from numerical processes were subsequently employed. The hull shapes affected the velocity contour, mainly in front of the conveyor. In addition, they also affected the ship resistance, ship power, and fuel consumption as well as the effectiveness in reducing air pollution [21,22]. The present study will focus on the impact of the front shape of the monohull and catamaran ship on waste collection in calm water through the application of a numerical method. Then, the results will show a comparison of the effectiveness of the two ship models in collecting ocean waste.
2. Numerical Methods
Air and water flow around the model were modeled as steady-state multiphase flows using OpenFOAM v2112. The governing equation of the flow around the ship is expressed using the incompressible RANS equations:
This study applied the volume of fluid (VOF) method, implemented in the interFoam solver, to record the phenomena of free surface when the model was operating at surface conditions. In addition, the sheer stress transport (SST) κ − ω eddy viscosity model containing wall functions was used to predict flow separation in the models. The interFoam solver approximates in each cell the Continuity and the Navier–Stokes equations for two immiscible, incompressible, and viscous fluids. Therefore, the free-surface interface was placed when 0 < α <1, and the available multidimensional universal limiter for explicit solution (MULES) correction algorithm was used to reconstruct the free space, ensuring its sharpness. The equations were integrated using local Euler time discretization with a global maximum Courant–Friedrichs–Lewy (CFL) number of 2 at the free surface and CFL number of 5 at the global domain. The present study utilized the PIMPLE algorithm, which is a combination of PISO (Pressure Implicit with Splitting of Operator) and SIMPLE (Semi-Implicit Method for Pressure-Linked Equations). The second-order upwind scheme was adopted as the discretization scheme for the momentum equations and turbulence quantities transport equation. At post-processing, the local flow velocity in front of the model was captured to analyze the behavior of ocean waste collection. Then, the validation steps were performed using the Delft catamaran 372 geometry. The validated results justify whether the meshing process and numerical scheme is applicable for another ship model. In addition, the uncertainty analysis was performed to evaluate the solutions obtained by numerical scheme in both the monohull and catamaran models.
2.1. Round-Bilge Monohull and Inner Flat Catamaran Model
The models used in this present study are monohull and catamaran fitted with a static forward conveyor. The monohull ship model is a round-bilge type as shown in Figure 1 while the catamaran model used in this study is the inner flat type as shown in Figure 2. Both models are bare hull and fitted with only a conveyor in front of the model without any other appendages. Hence, the numerical setup in the Delft catamaran 372 model whose results were validated with the experiment can be applied.
The main dimensions of both models as well as the conveyor dimension used in this study are presented in Table 1. This data was taken from previous research on ocean waste collection ships for river, estuary, and shallow sea in Surabaya [10]. Ships are only designed to collect and store waste while the ship is operating. After the ship has finished operating, the waste will be moved to the processing site on the land. The waste that can be collected by a conveyor ship is waste floating on the surface of the sea, such as plastic waste and solid waste. The conveyor data was taken from product catalogs of the Dorner conveyor industry project guide with the Aquapruf 7400 series [23]. Based on previous studies [24,25], the most optimal collection of marine debris in calm water conditions is carried out at a low speed, which is below 2 m/s. In this simulation, the size of both ship models reduces to a 4:1 scale. So, the speed is also scaled using the kinematic similarity based on ITTC to 1 m/s [26]. Then, we add one more speed, which is smaller than 1 m/s, for comparison, which is 0.5 m/s. Therefore, the speed used in the simulation is 0.5 m/s and 1 m/s for both models. The simulations are caried out in model-scale because the model size will be equated close to the Delft catamaran 372 model, since the Delft catamaran 372 model has open experimental data, which can be used to validate the mesh and numerical setup in this study.
The round-bilge monohull and inner flat catamaran model are shown in Figure 1 and Figure 2. The hull is full body and is defined by polynomials. The 3D CAD geometry was generated using the plugin in Solidwork and the surface was exported to OpenFOAM as an STL file. After converting the geometry to mesh type, the water tightness of the geometry also was checked. Figure 1a and Figure 2a use to define the dimensions for clarity. Figure 1c and Figure 2c are lateral view to clearly define the length of the conveyor and to ensure it exceeds the ship’s nose.
2.2. Sampling Location
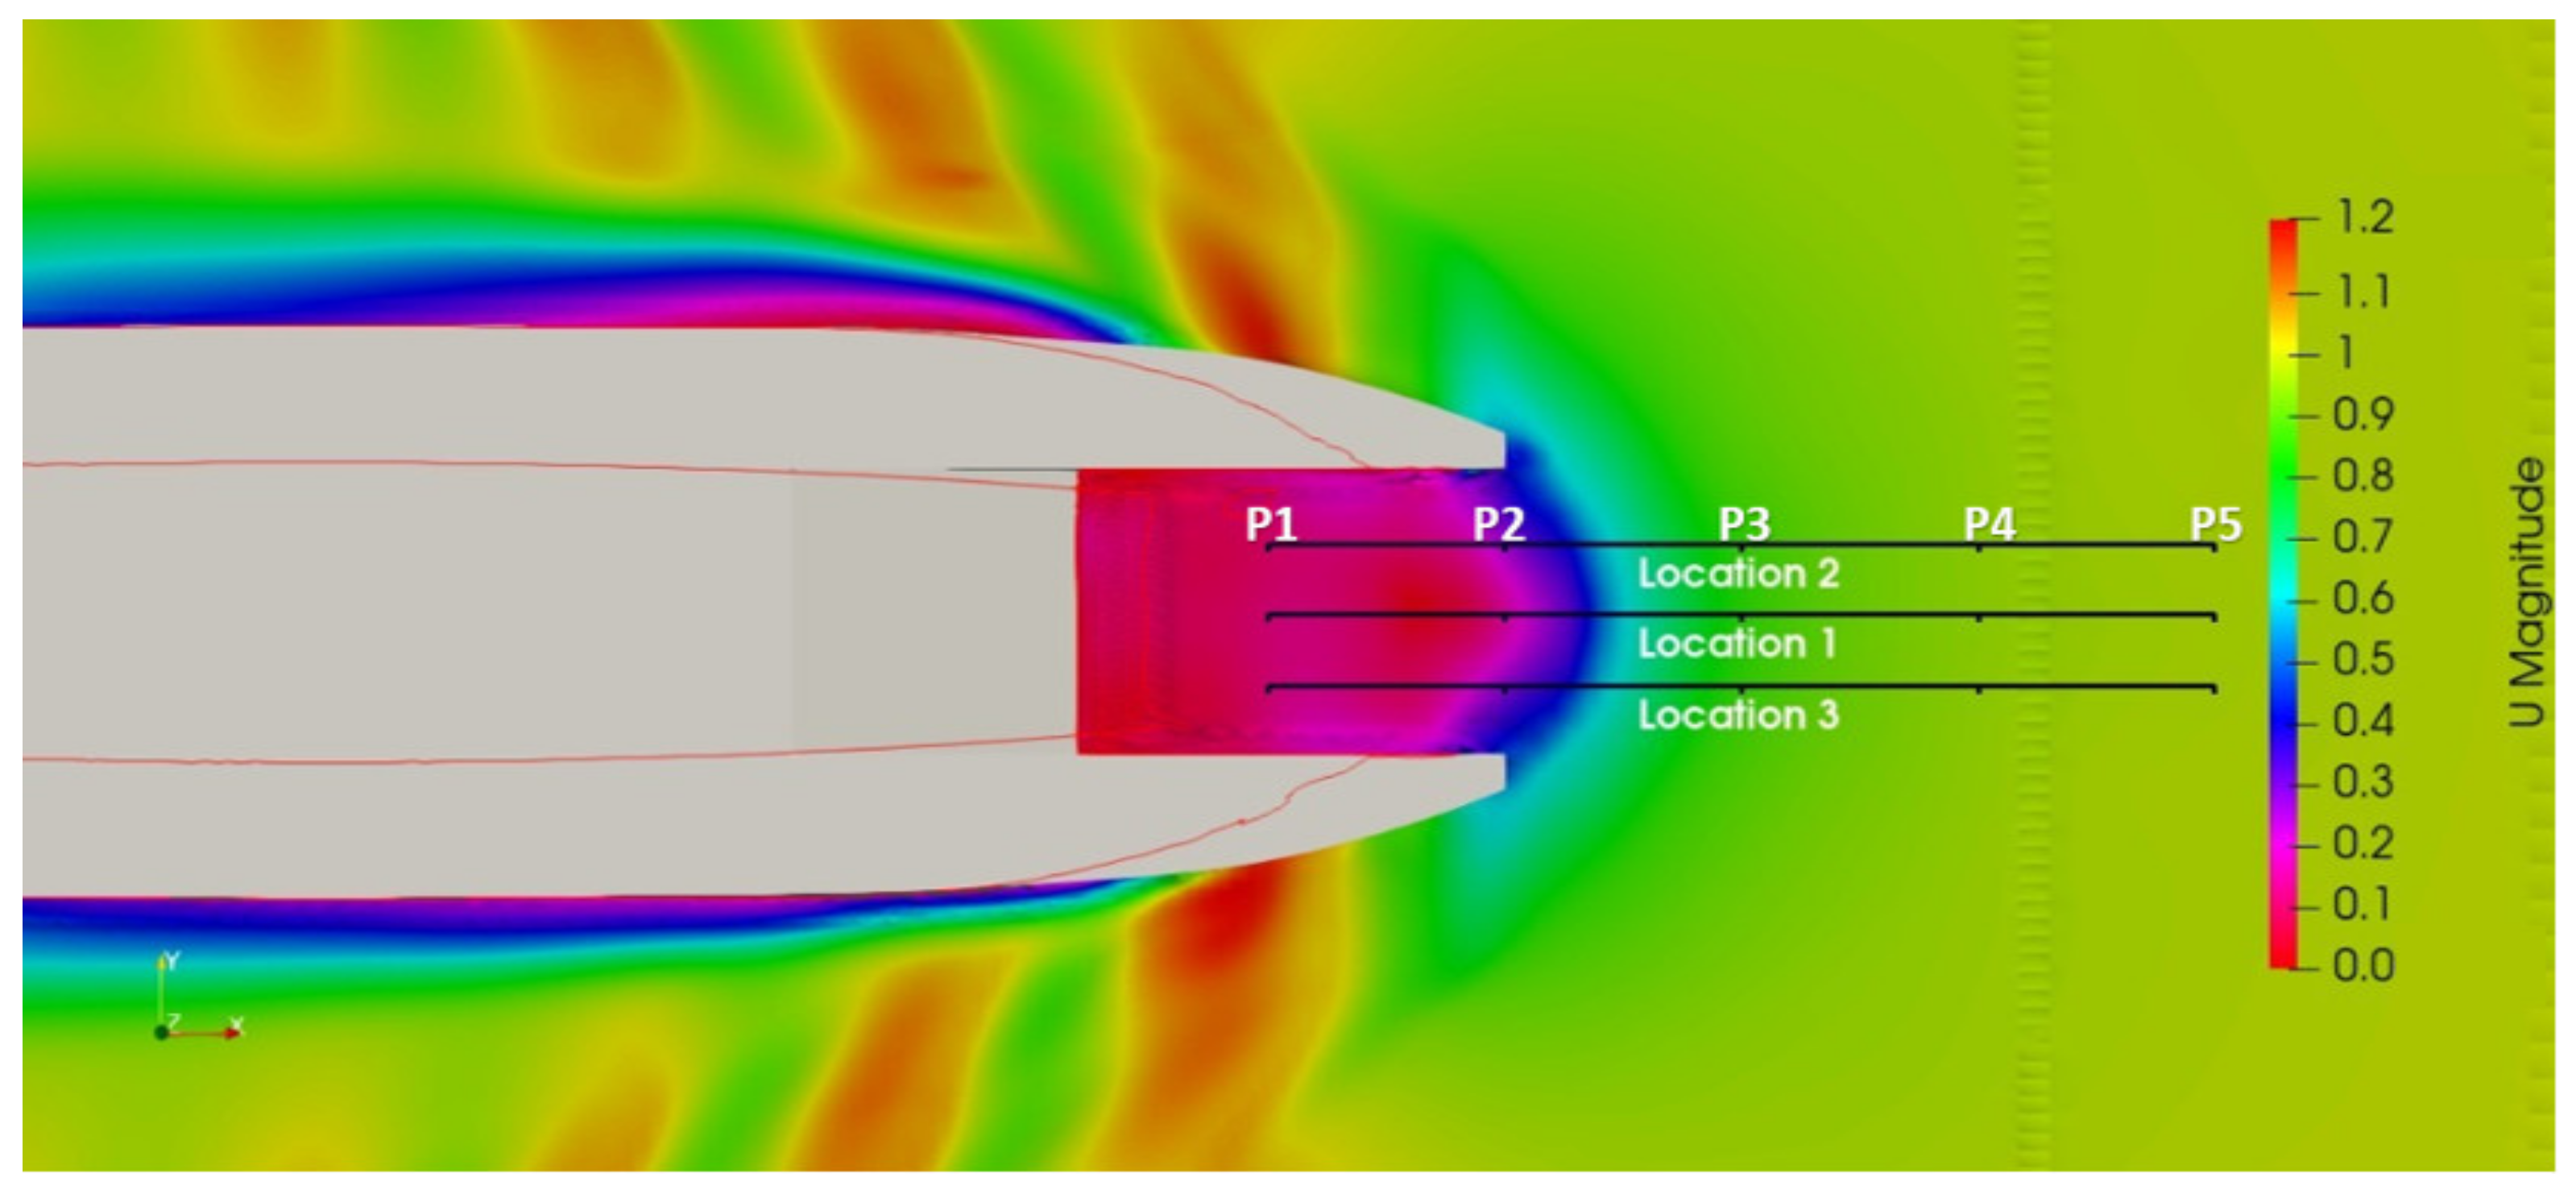
This research used a full domain or full model for the simulation. The flow characteristics in front of the conveyor was analyzed by obtaining the data with 3 sampling locations. The simulation results show that the solution was not totally symmetrical between measurement locations 2 and 3. Table 2 represents the coordinates of five points, P1 to P5, which correspond to the base and measurement location in front of the ship conveyor. The sampling location is shown in Figure 3. The vertical distance for each location is 0.15 m. Each location has 5 probe points and the distances between each pair vary along the location. These probe points are used to assess the longitudinal velocity of flow.
2.3. Computational Domain
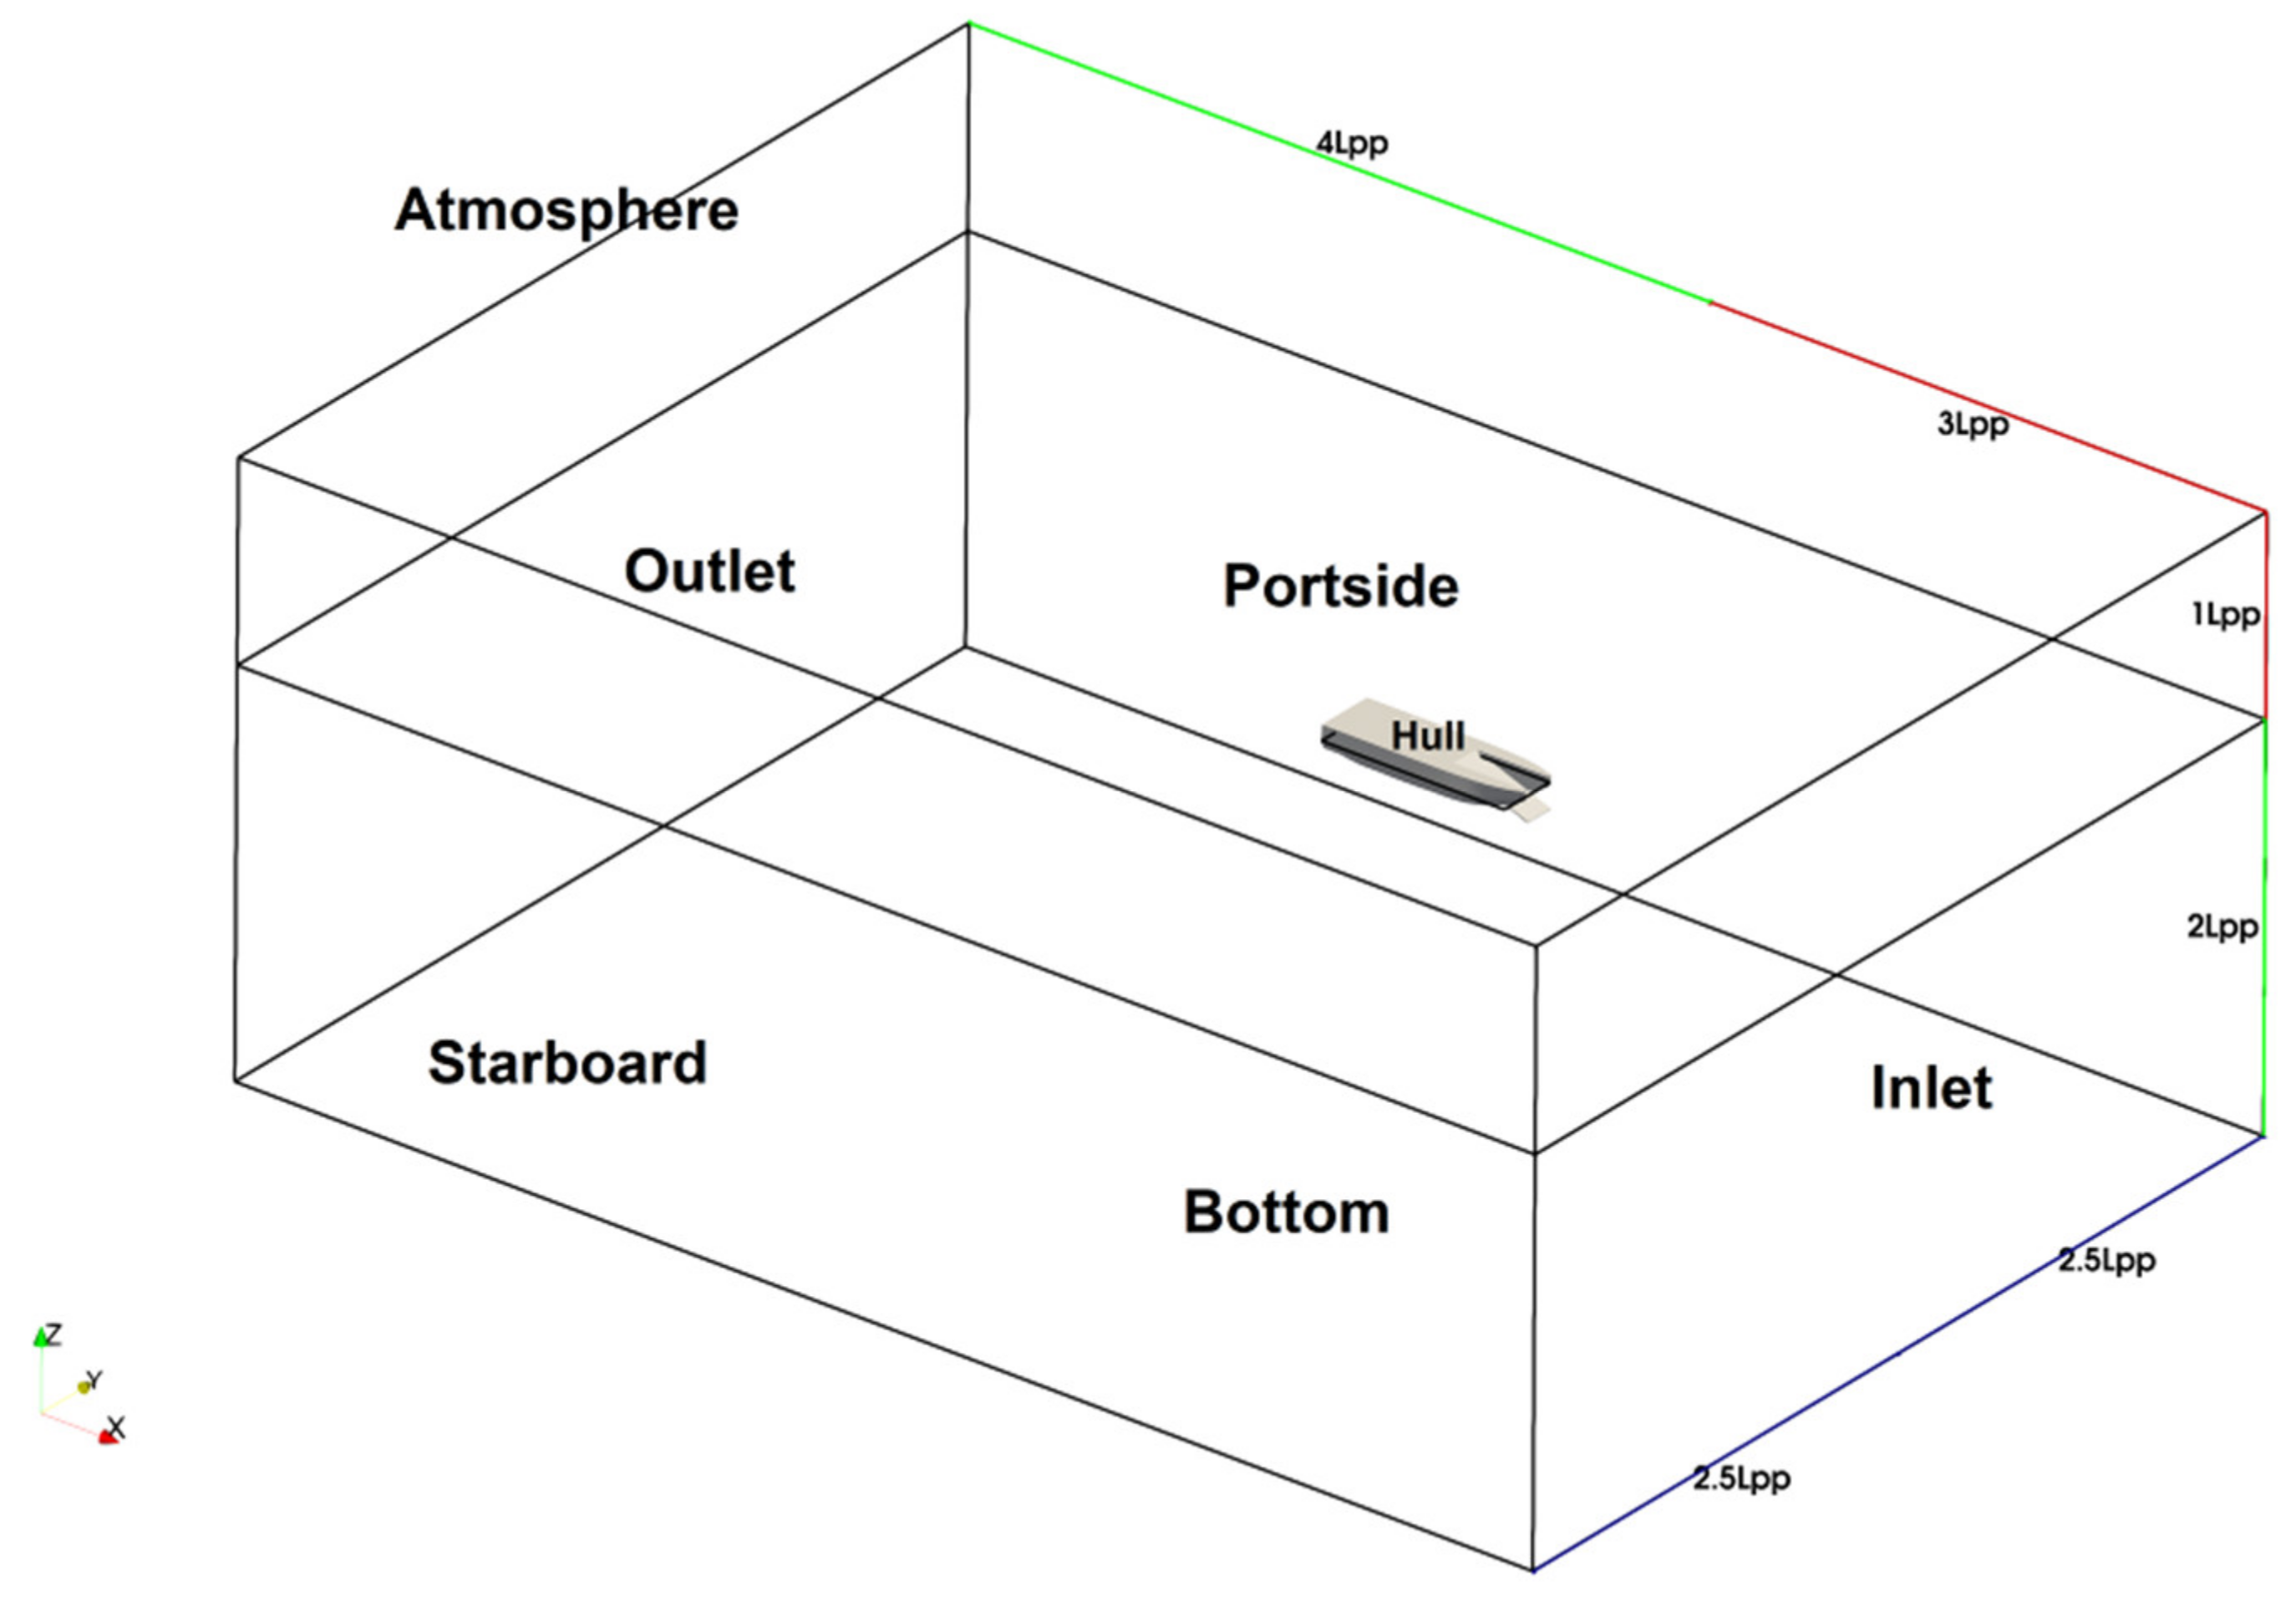
The present work focuses on the front of region of the ship conveyor, where the flow of fluid will move closer to the ship. The ocean litter was not simulated due to the similarity of fluid flow and ocean waste movement on free surface. The test was conducted on a digital tank using Computational Fluid Dynamics (CFD). The fully modeled ship was covered by a square 3D computational domain.
The computational domain size was defined following ITTC guidelines [27,28]. The inlet, side, bottom, atmosphere, and outlet boundaries are set far enough from the model to avoid spurious flow interaction, as shown in Figure 4. The dimensions are expressed in terms of the length perpendicular (Lpp). The distance between the origin coordinates and the inlet face is 3Lpp while 4Lpp is the distance to the outlet face. The distance between the midplane and the side wall is 2.5Lpp. The distance between the waterline and the bottom of the computational domain is 2Lpp while 1Lpp is the distance to the atmosphere face. The boundary conditions in the computational domain of OpenFOAM are velocity field, pressure, k, omega, nut, and alpha water. In this paper, fifth boundary conditions are written as shown in Table 3. A non-slip wall condition is imposed as the boundary conditions for the ship model. The hull uses moving wall boundary conditions, because in OpenFOAM the moving wall must be used for the velocity boundary condition in the hull, but the value is 0. So, the model is motionless or stationary. The flow velocity is initialized by the incoming flow velocity. The kinetic energy and the dissipation rate are determined by assuming a turbulence intensity at a low level. In addition, wall functions are applied for the ship hull.
2.4. Meshing Process
The meshing process is also called discretization in the CFD process, which converts continuous fluid into a discrete computational domain in order that fluid flow equations can be solved numerically by computer. The type of mesh used in the model and fluid domain is hexahedral. The mesh size is refined with some refinement levels, particularly in the region near the ship hull. The results of meshing on model and fluid domain are shown in Figure 5.
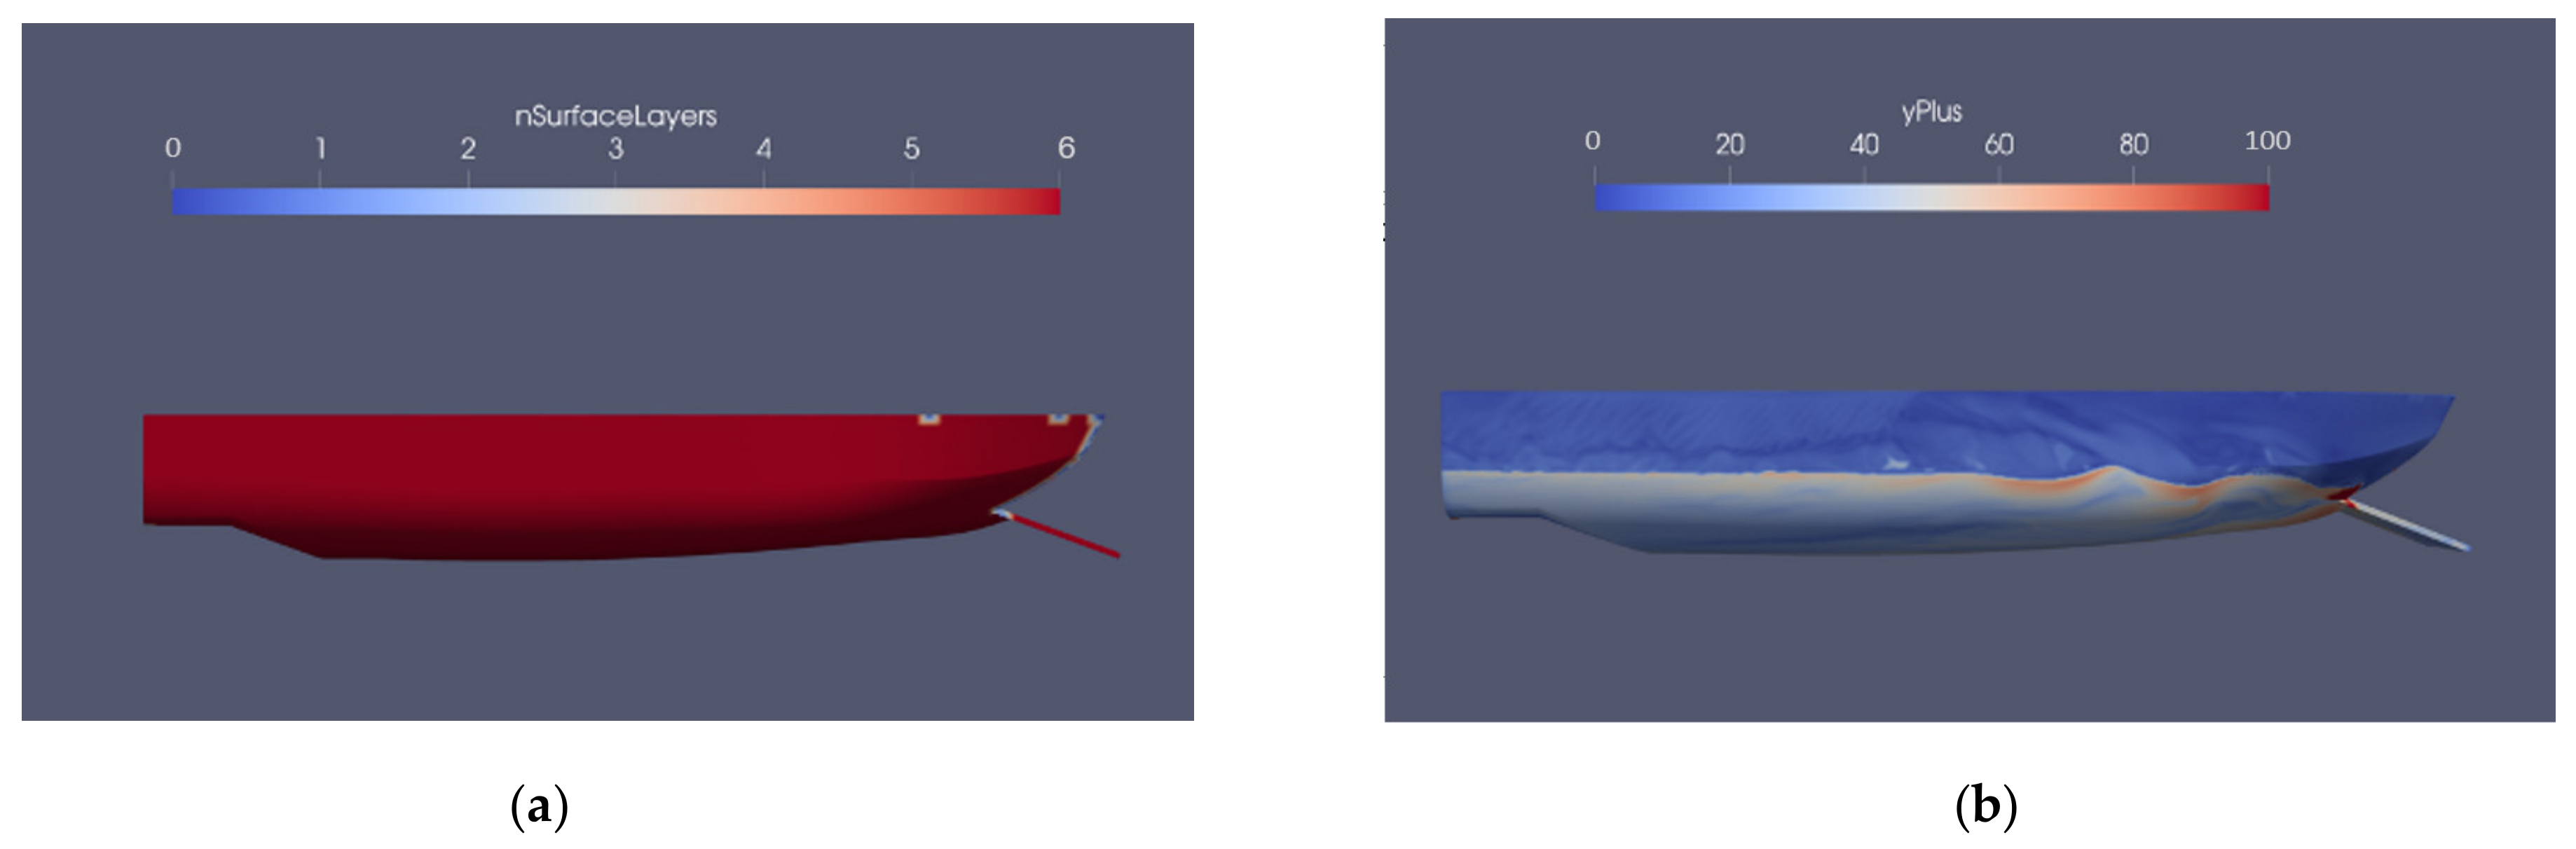
The computational grids are created in several stages. First, a hexahedral grid using blockMesh with improvements in regions where free surface interface may occur. Six refinement levels using topoSet tool are applied to make the mesh dense gradually as the elements get closer to the ship model. The ship and conveyor surface are refined with level 2, to make the surface smoother, so that, when it is snapped with the background mesh, the outside can be cut smoothly. The final process of meshing is generating six layers of prismatic elements parallel to the model with an inflation ratio of 1.2 in order to obtain the yPlus target.
The number of cells after the meshing process is about 7 million for the round-bilge monohull model and is about 5 million for the inner flat catamaran. The element size in the inner topoSet region is used as the reference length and it is uniform in all three directions to improve the reliability of free surface evolution and turbulence prediction. The target yPLus of 200 was used in this simulation. The distribution of inflation layers varies around the ship surface as shown in Figure 6a. It depends on mesh quality parameters and curvature of the model surface. The more complicated the model’s shape, the less the number of layers. Despite having requested six layers, Figure 6a shows that most of the hull has the necessary elements to capture the viscous effect within the boundary layer. Figure 6b shows yPlus distribution on ship model. The wetted surface has yPlus value of 40 to 100 which is fit on target. It will capture the related flow characteristics accurately.
2.5. Validation
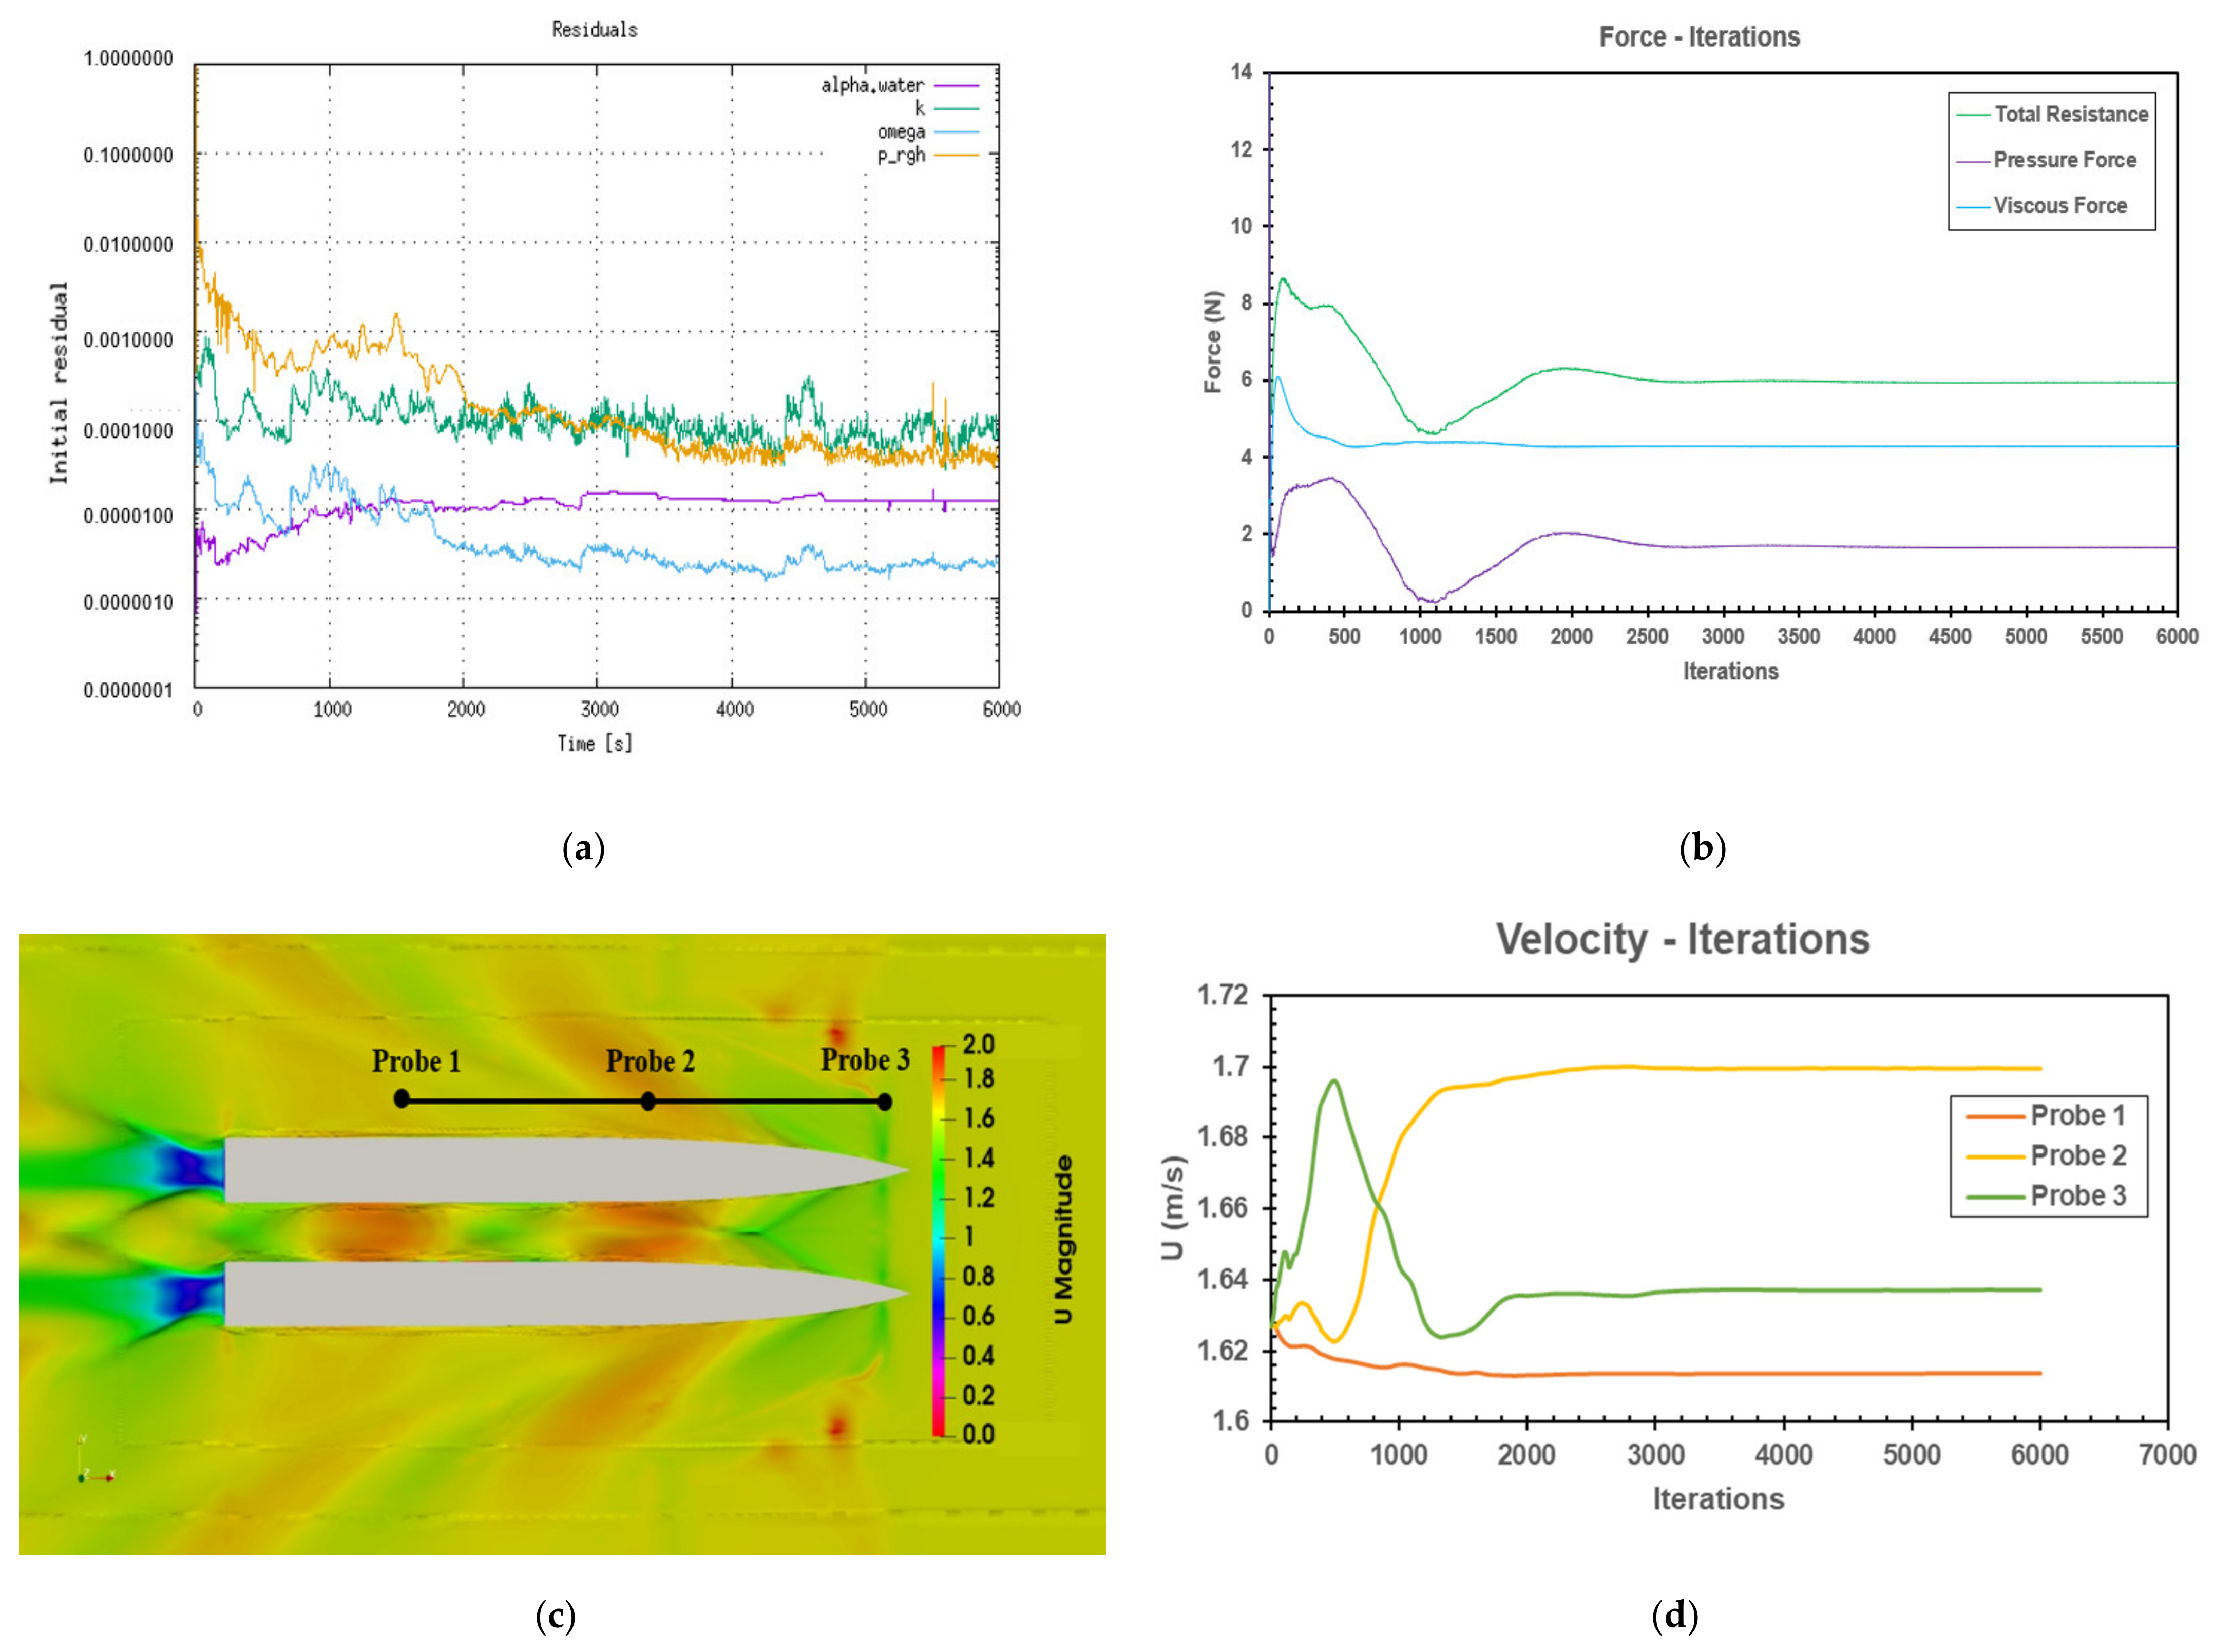
This validation method was used to verify the setup of the simulation used in this study. Since there was no experiment on the ship using a conveyor, the validation was carried out using the Delft catamaran 372 [29]. The solutions obtained from the simulation were pressure distribution, wave pattern, and resistance coefficient of the Delft catamaran 372 model due to changes in the Froude number using CFD. In addition, the results were validated by experimental research which was carried out in a towing tank using this model [30,31]. The mesh size was refined with some refinement levels, particularly in the region near the catamaran hull. The number of mesh on the Delft catamaran 372 at Fr = 0.30 was 2,196,512 cells. The results of the meshing process on the Delft catamaran 372 model and fluid domains are as shown in Figure 7.
The computational domain size was defined following ITTC guidelines [28]. All parameter settings used were the same as in chapter 2. The experimental result was compared with the simulation results obtained with this numerical setup [32]. Figure 8a shows the residuals evolution along the iterations. All residuals decreased gradually and reached a convergent condition where the residual values did not change significantly during iterations. In addition, Figure 8b indicates the convergence of pressure force, viscous force, and total resistance force. Those force components reached convergence after 3000 iterations.
Figure 8c shows the location of velocity sampling. The sampling location was on the side of the ship, extending horizontally from front to back. There were three sampling locations with a distance of 1 m between locations. Figure 8d shows convergent evolution by evaluating the velocity field at 3 locations. Those velocity components reached convergence after 3000 iterations.
There are three kinds of grid sizes or grid density used for mesh verification, namely coarse type with a total of 737,304 cells, medium type with a total of 2,196,512 cells, and fine type with a total of 4,400,870 cells. The results that are closest to the experimental results are from the medium grid density type. Table 4 shows the average values of pressure and viscous components acting on the whole hull area.
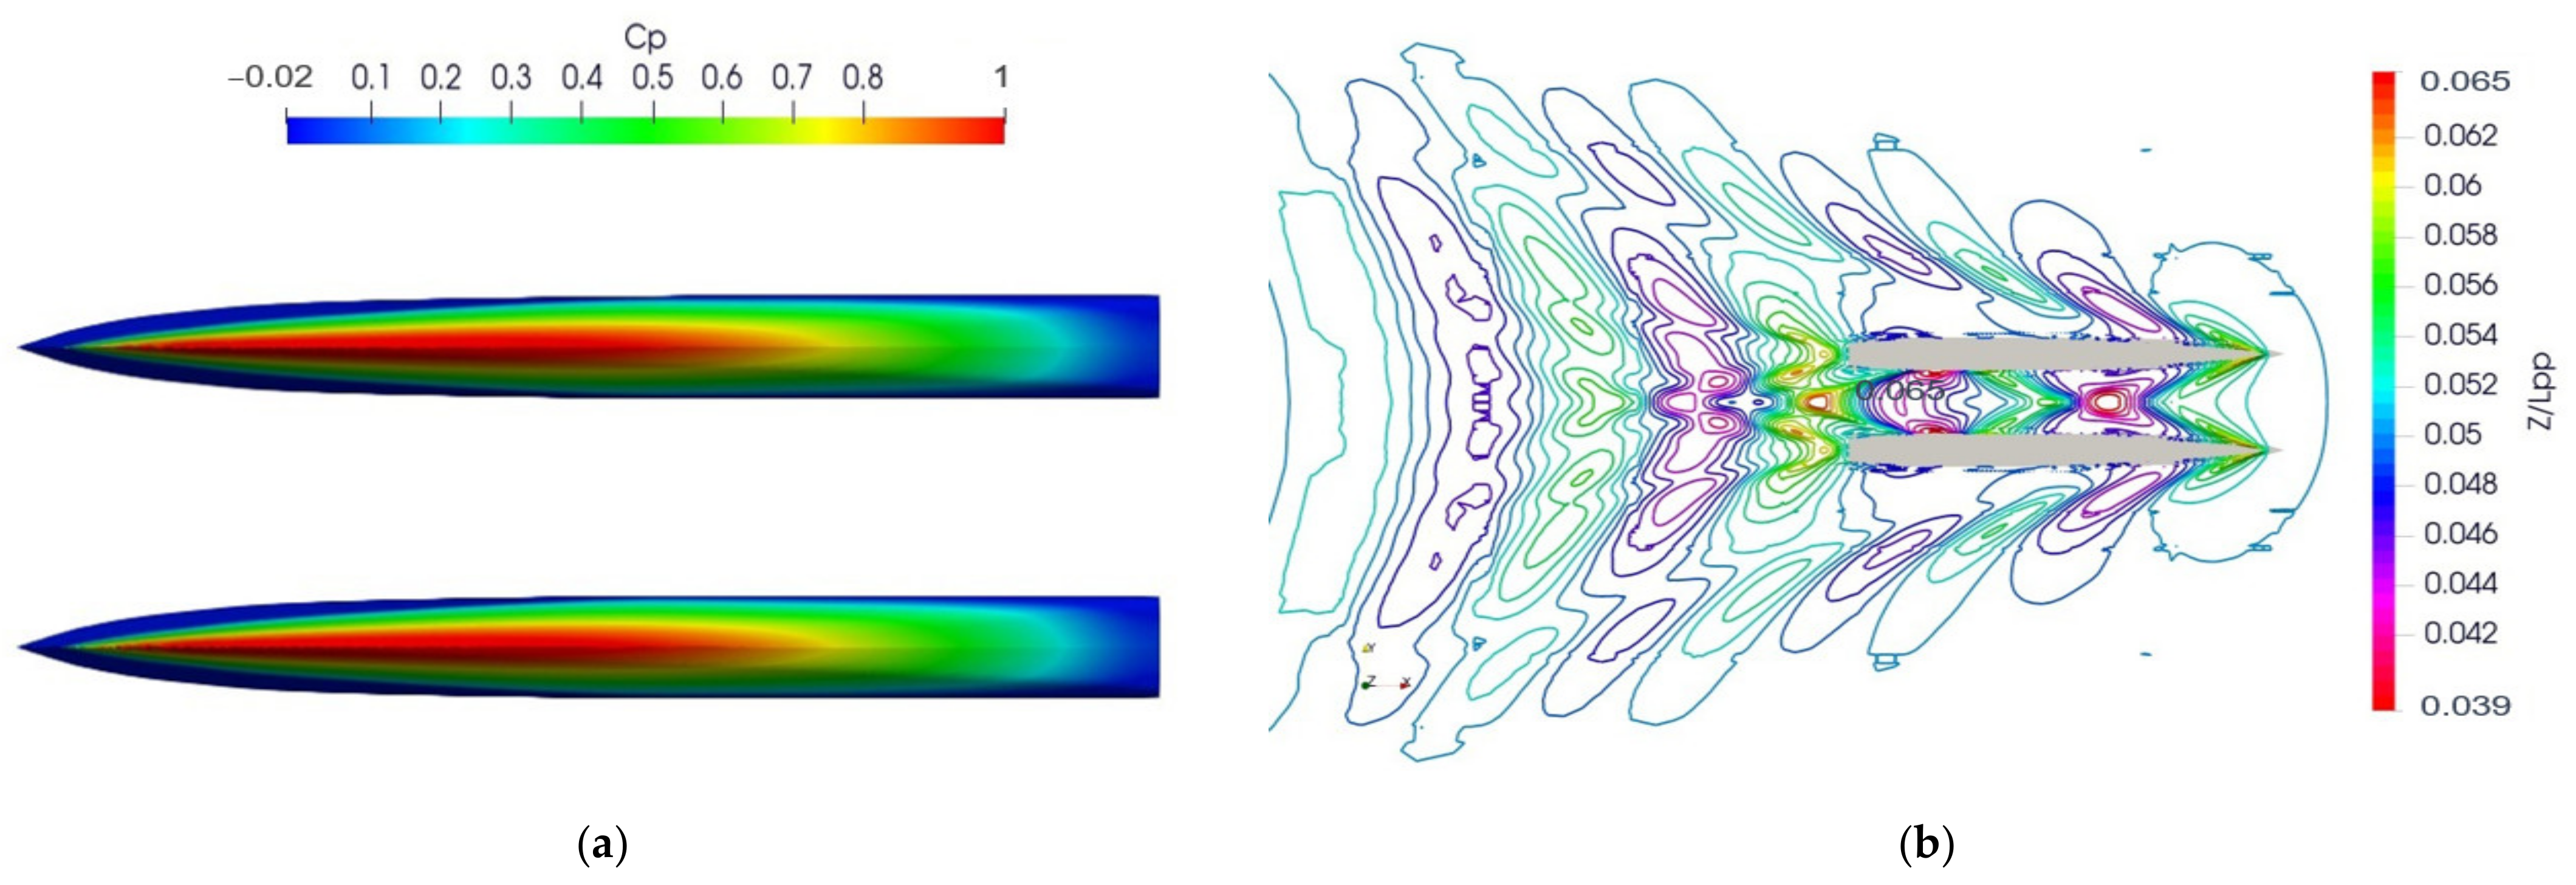
Figure 9a shows the pressure coefficient distribution on the catamaran’s surface. The highest value of Cp was distributed at the bow area while it was decreased and distributed uniformly along the hull. The wave pattern for the Delft catamaran 372 was depicted in Figure 9b for Fr = 0.3. It can be seen that the external wave field was only slightly affected by the presence of twin hulls, which, on the other hand, greatly influenced the wave pattern in the entire inner region. The result was almost the same as research conducted by Broglia et al. [32]. This is in accordance with the pattern of water flow, where the closer the flow approaches the catamaran, the greater the pressure and vice versa.
Table 5 shows comparison between the present results and the experimental work completed by Vant Veer [30] and Broglia et al. [31]. In this case, two parameters were analyzed, specifically total resistance force (Rt) and resistance coefficient (Ct). The results of both parameters were close to the experimental results. The experimental Ct was 4.961 × 10⁻³, then the current simulation Ct was 4.555 × 10⁻³. The differences were below 9%. The experiment procedure was determined using the ITTC guideline. This difference in numbers occurred because the model used in this simulation was not exactly the same as the model used in the experiment. The wet surface area of the experimental model was 1.945 m2, then the wet surface area of the simulation model was 1.896 m2. There was a difference of 2.519%, because the experimental and simulation models were not totally the same. In addition, the Rt and Ct from the present simulation were also compared to numerical results [32,33]. The experimental Rt was 12.77 N, then the current simulation Rt was 12.02 N. The results indicate that the differences were less than 5%. Then, a comparison was also made with a Prelimina solver [34], and the difference was quite large because there must have been different characteristics between the model used in this study and Prelimina.
2.6. Uncertainty Analysis
Numerical uncertainty is often induced by the errors in the CFD model and comprises the effects of discretization, round-off, and iterative convergence errors on the accuracy [35]. The grid refinement is considered as the most common solution to numerical uncertainties by using the grid convergence index (GCI) [36,37]. Basically, the GCI relates to the comparison of discrete solutions at different grid resolutions and gives an indication of how much further grid refinement would change the numerical solution [38]. Uncertainty analysis for parameters is performed following a systematic refinement process to create multiple solutions (at least 3) for the parameter under investigations, holding all other parameters constant. In this present study, the grid spacing of the monohull and catamaran meshes was varied with certain refinement ratio ri. A good alternative that applied is , as it provides a fairly large parameter refinement ratio and at least enables prolongation of the coarse-parameter solution as an initial guess for the fine-parameter solution. The change between medium-fine and coarse-medium solutions are used to defined the convergence ratio , where are the solutions of fine, medium, and coarse input parameters, respectively [39,40]. The total resistance at 1 m/s will be used as the solution of each mesh.
Depending on the sign and magnitude of , three convergence conditions are possible:
- Monotonic convergence: 0 < Ri < 1
- Oscillatory convergence: Ri < 0
- Divergence: Ri > 1
For monotonic convergence (1), Richardson extrapolation is used to estimate or and . For oscillatory convergence (2), uncertainties are estimated by bounding the error within the average of oscillating maximums () and minimums (), . As for divergence, errors and uncertainties cannot be estimated. Table 6 and Table 7 show the uncertainty analysis performed for the monohull and catamaran models in OpenFOAM.
From the results, the values for both models show monotonic convergence. For monotonous convergence, the order of convergence rate or accuracy can be estimated by the following equation [39].
The GCI estimated for the grid independence test of the total resistance over two grid solutions can be expressed as [41]:
where Fs is defined as a safety factor and implies 95% confidence for the uncertainty estimate [37], Fs = 1.25 is suggested for employment over these grids [42]. Since all GCI values are below 1.5% [38], it is verified that the dependency of numerical results on the grid size has been reduced and the solution achieves the grid-independent solution.
3. Results
The numerical solutions obtained with the settings described in the previous section are discussed in this chapter. The hydrodynamic analysis of both conveyor ship models, such as flow pattern characteristics, velocity contour, wave pattern, pressure distribution, and ship resistance as well as the behavior of ocean waste collection, can be performe1. Flow Characterization.
3.1. Flow Characterization
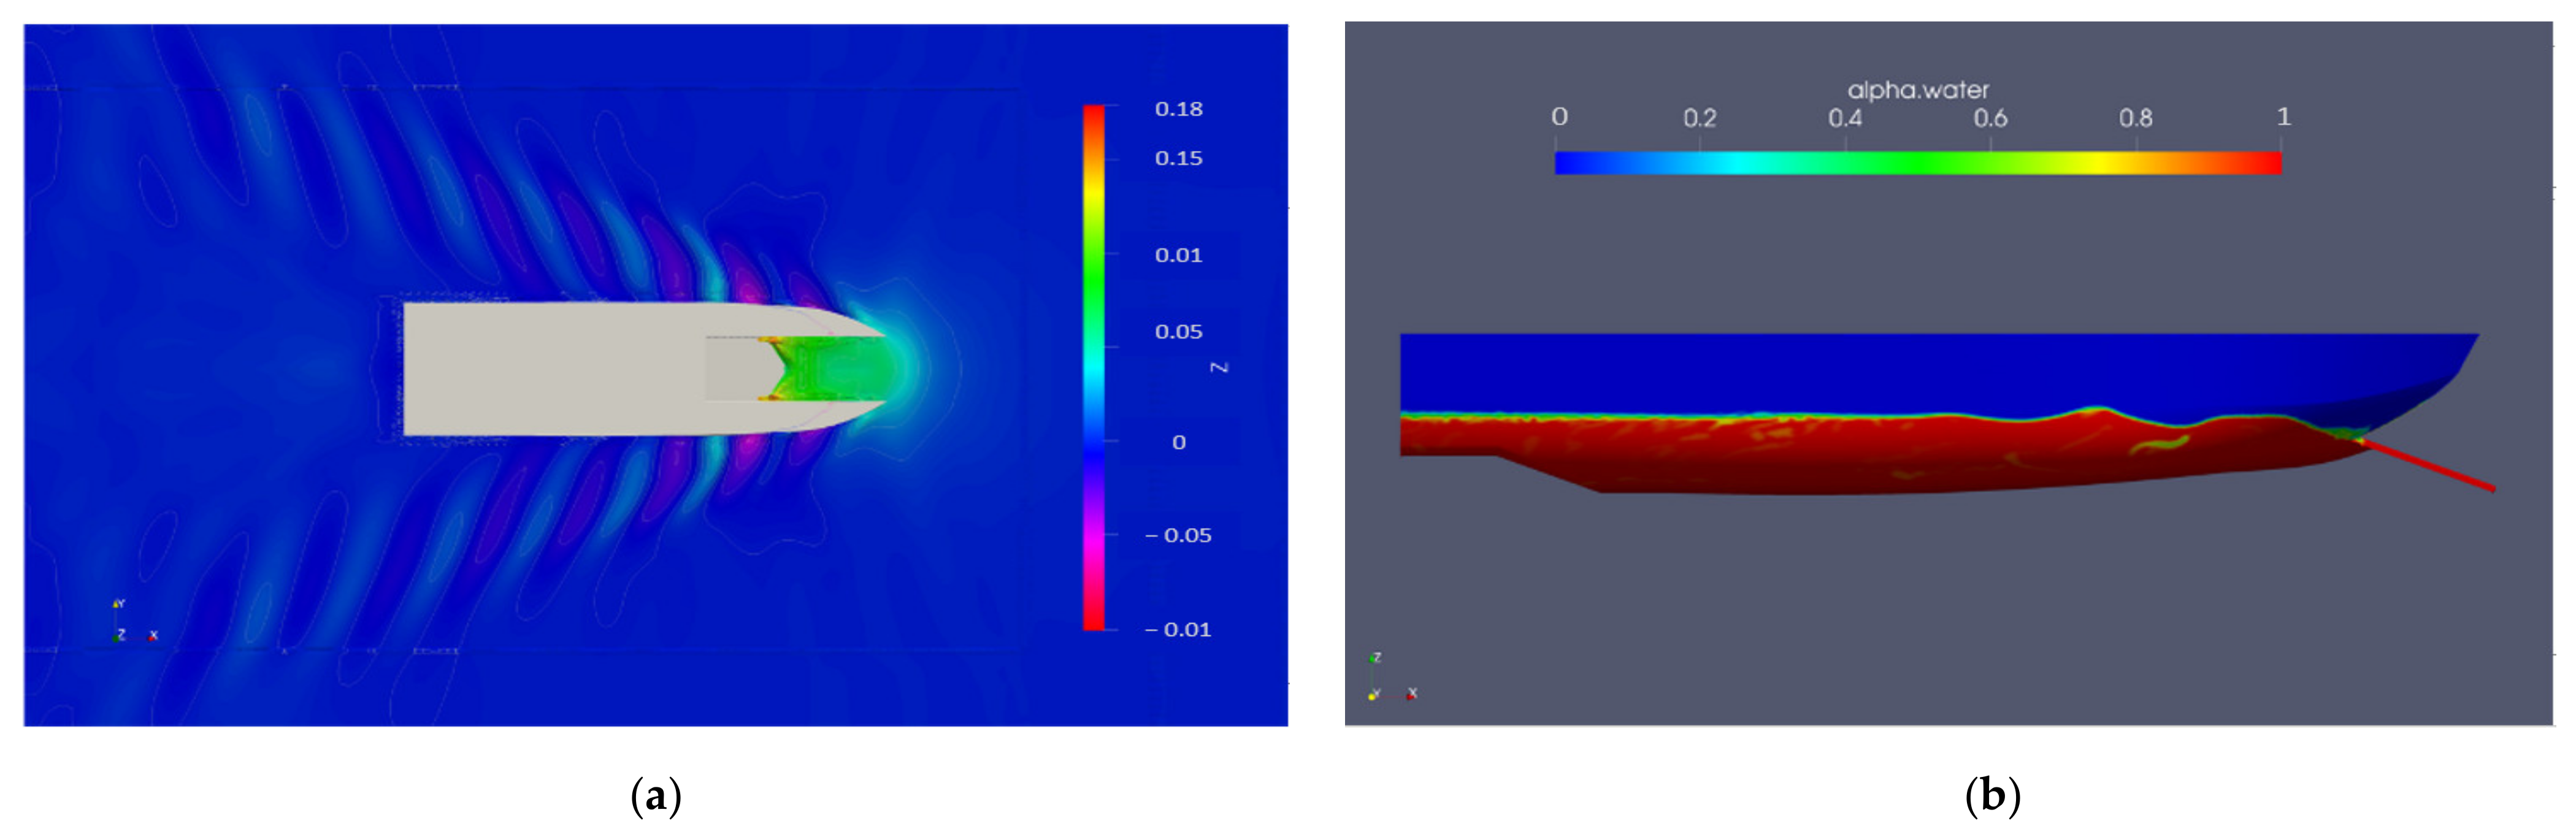
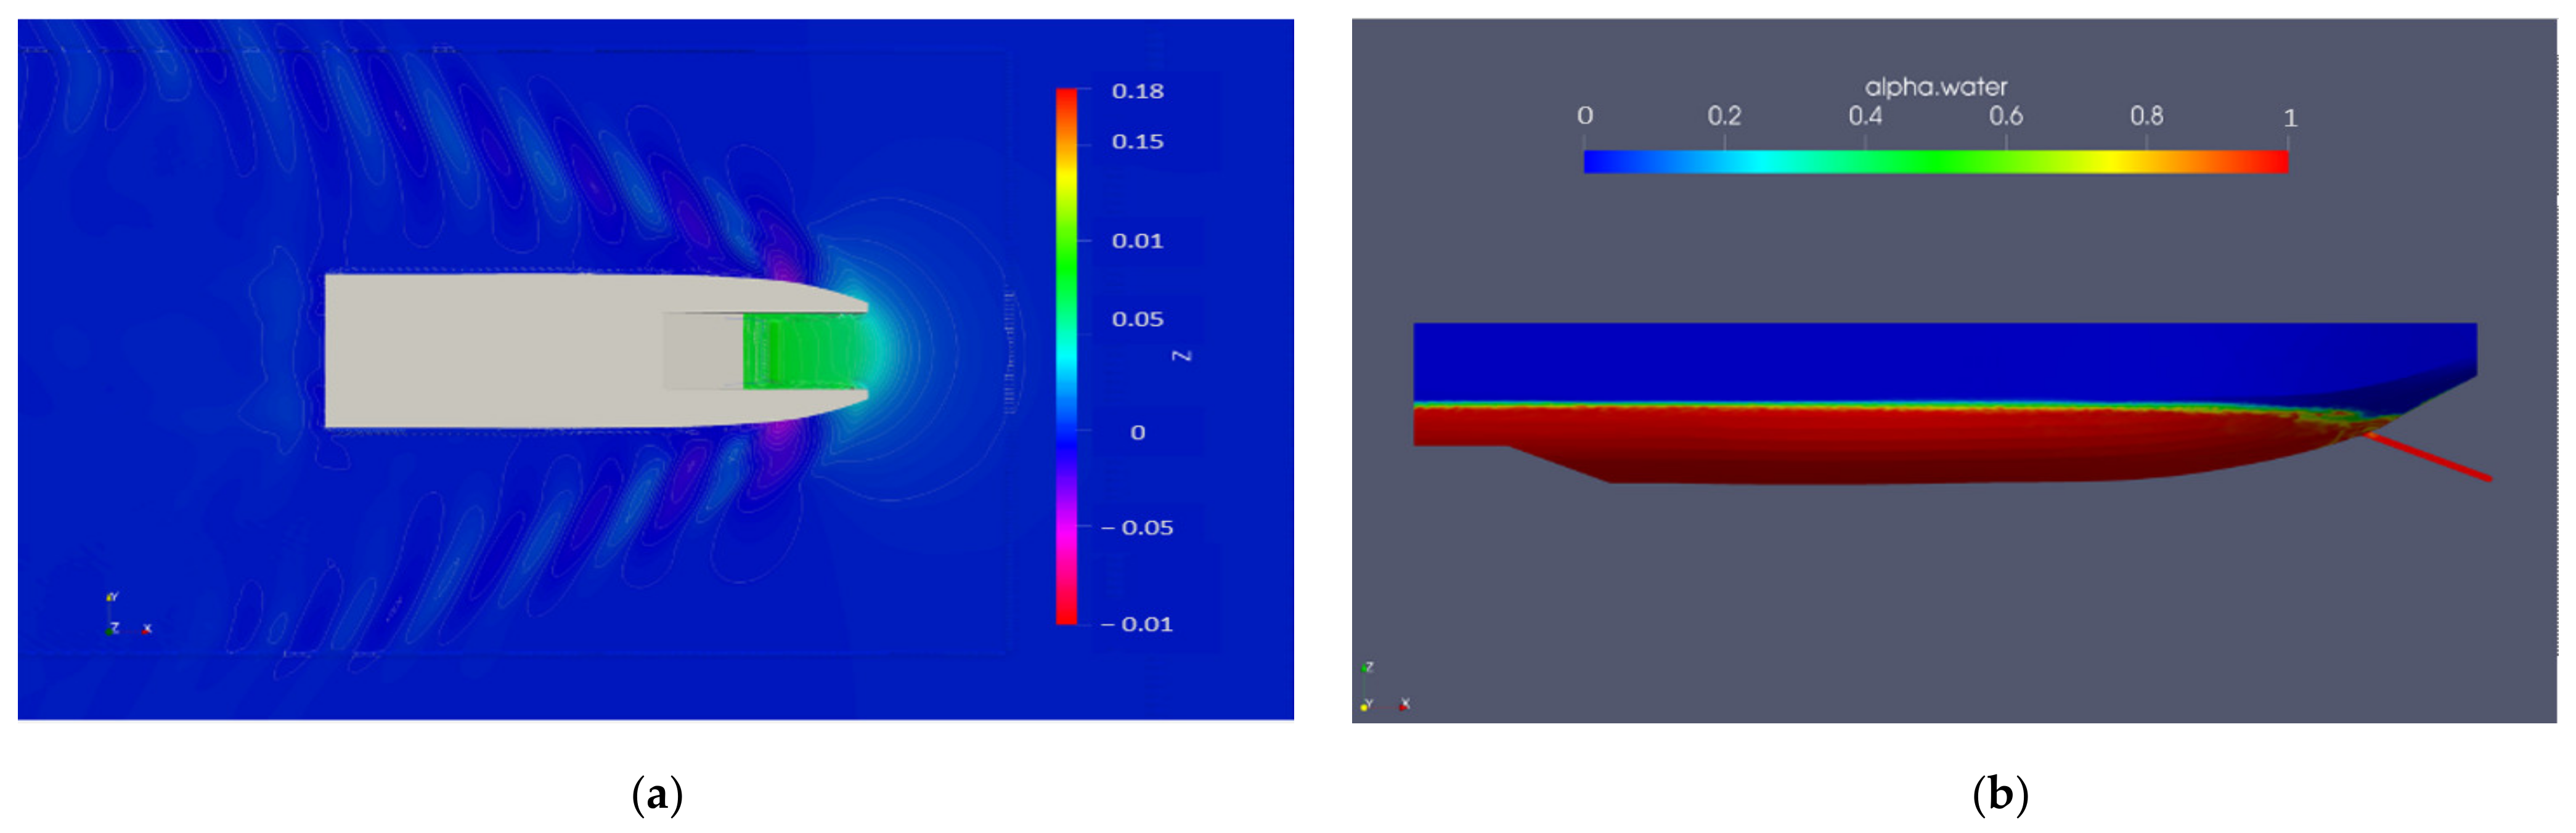
Figure 10 shows the wave elevation generated around the round-bilge monohull at a speed of 1 m/s. The Kelvin wave patterns seemed to be generated by the ship model as shown in Figure 10a, and it is likewise in Figure 11a. However, the monohull type generated higher wave elevation, particularly in the conveyor region, compared to that of the catamaran type. Hence, the marine debris will tend to approach easily to a catamaran type and vice versa on a monohull type.
Figure 10b shows the wave profile along the monohull model. The wave profile shows that the crest of the first wave was almost high enough to restrain marine debris flowing through ship’s conveyor. Figure 11b shows the distribution of the wave elevation around the inner flat catamaran at speed of 1 m/s. The wave elevations along the hull to the back of the catamaran model ship almost look straight. There was low wave amplitude only in a small part near the conveyor. The smaller wave elevation along the hull surface will not obstruct the marine debris to flow through the conveyor.
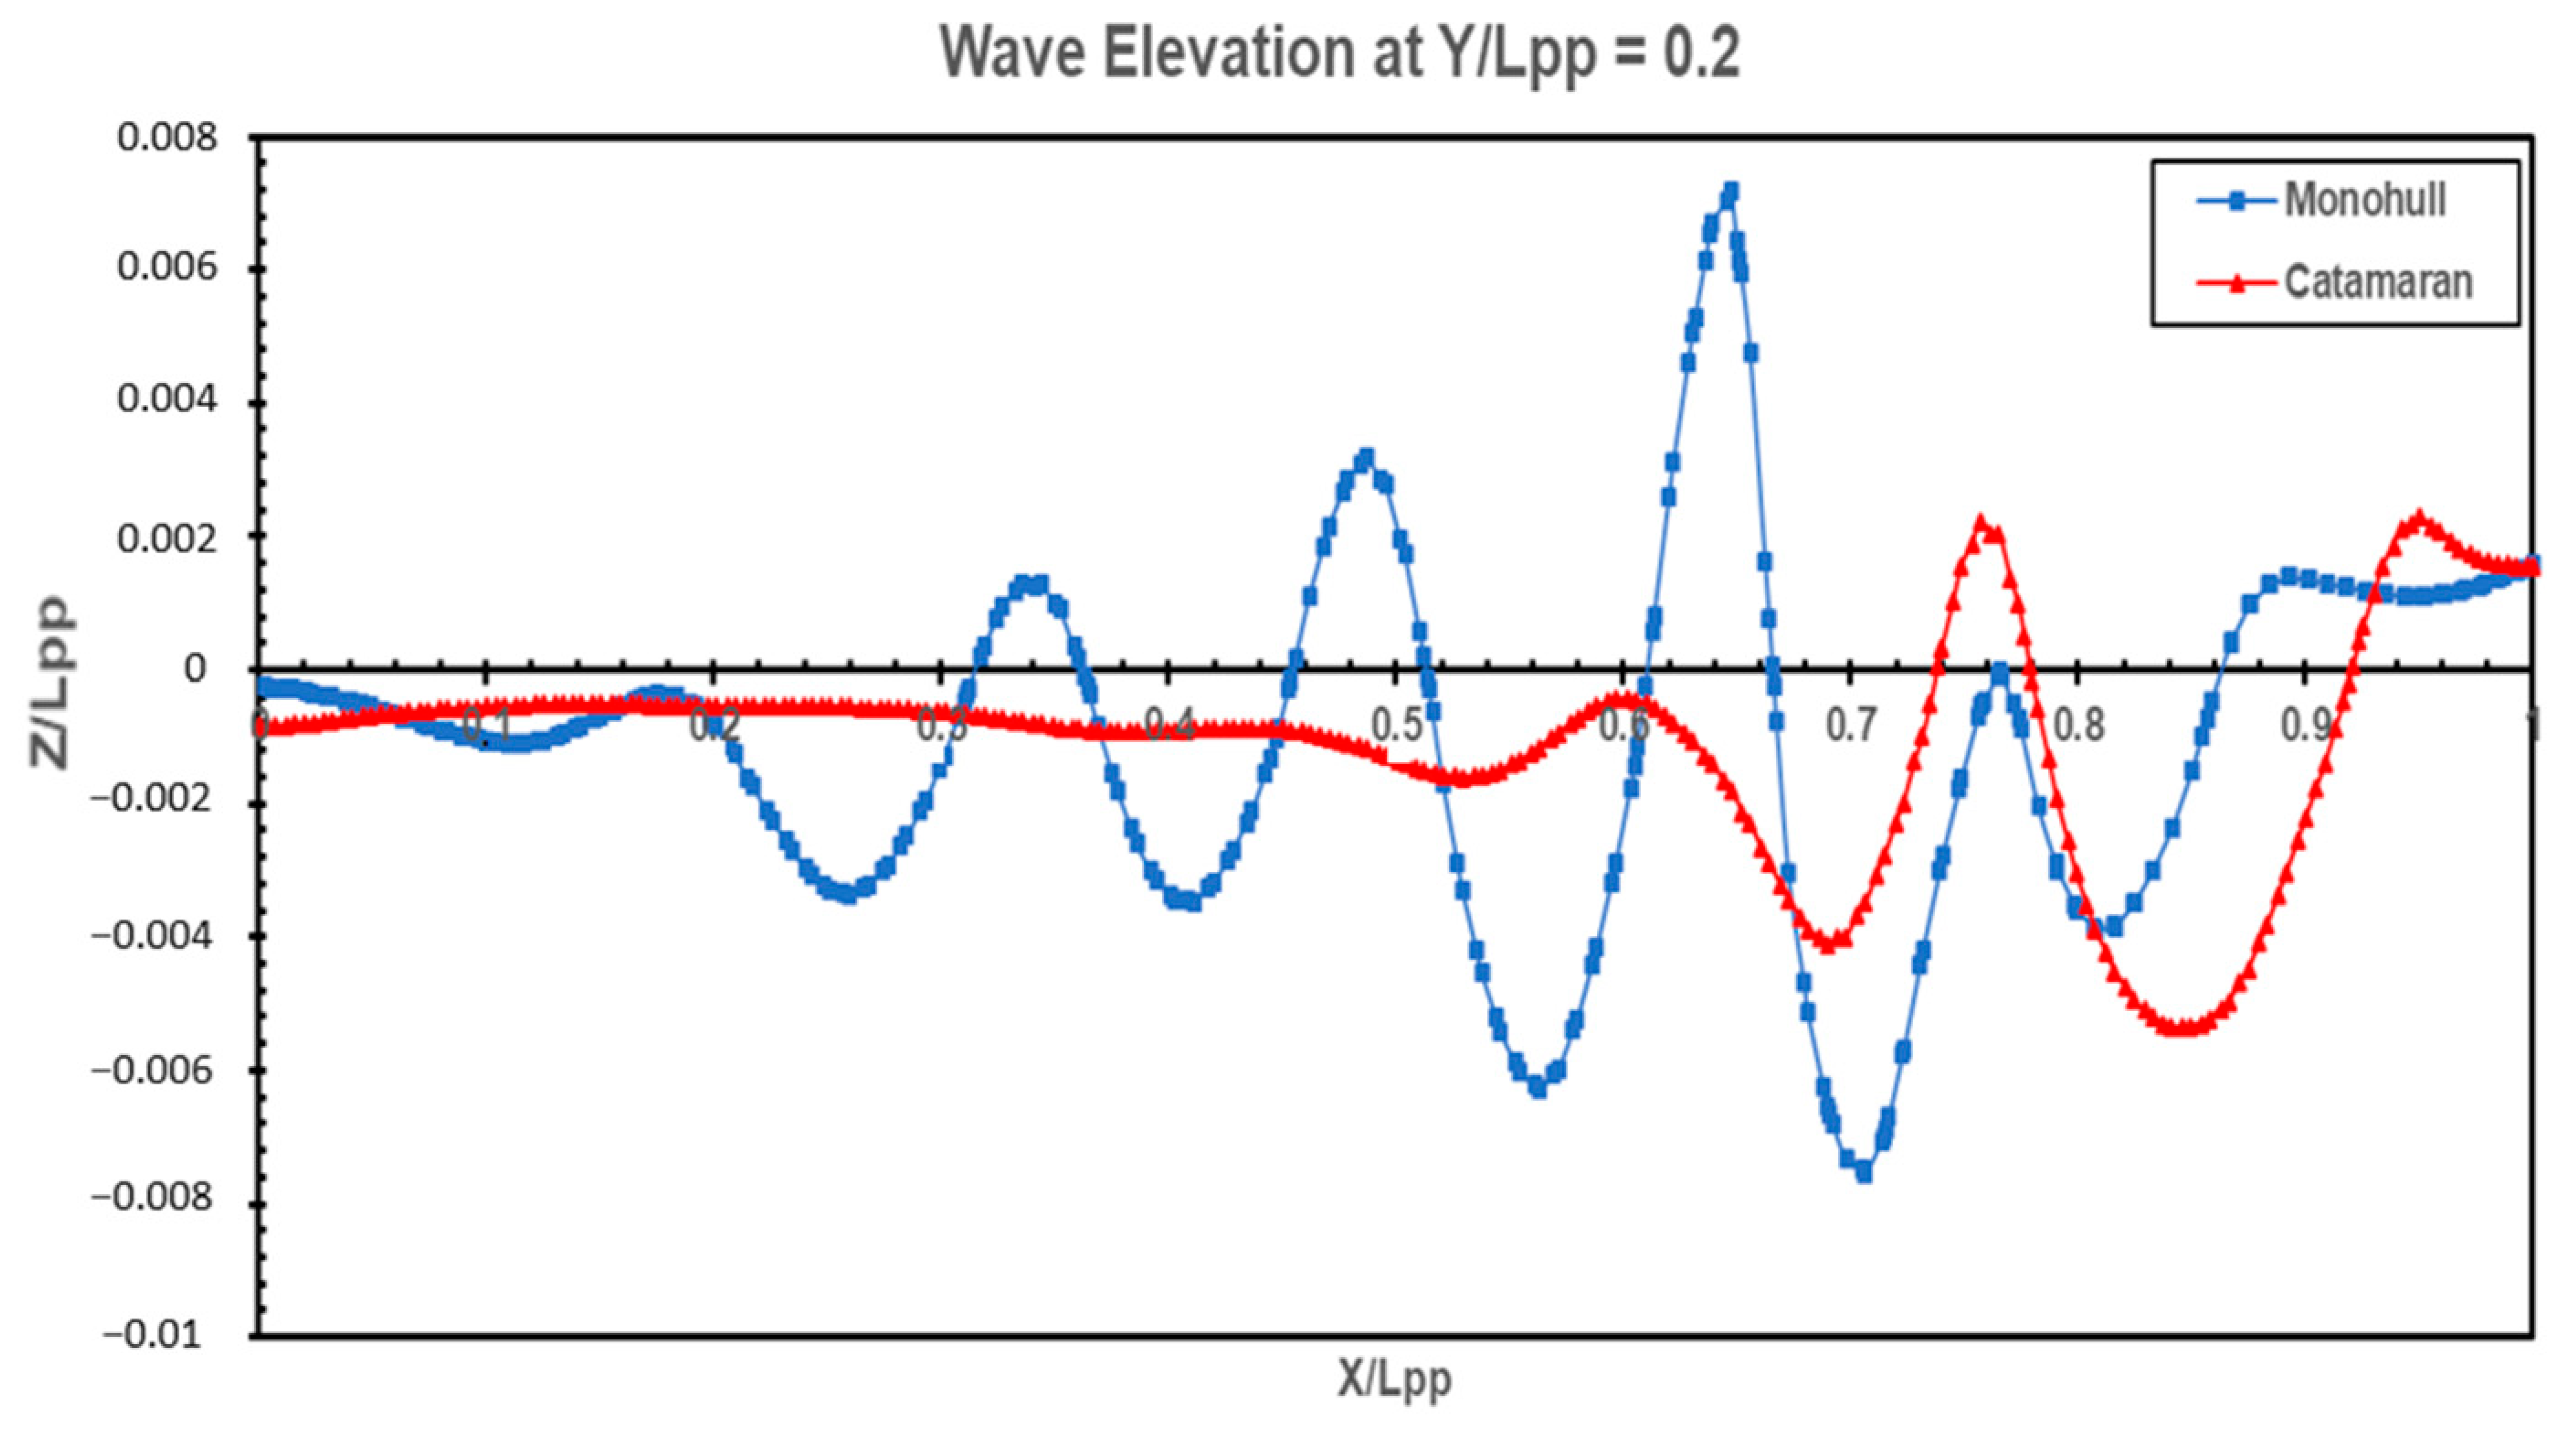
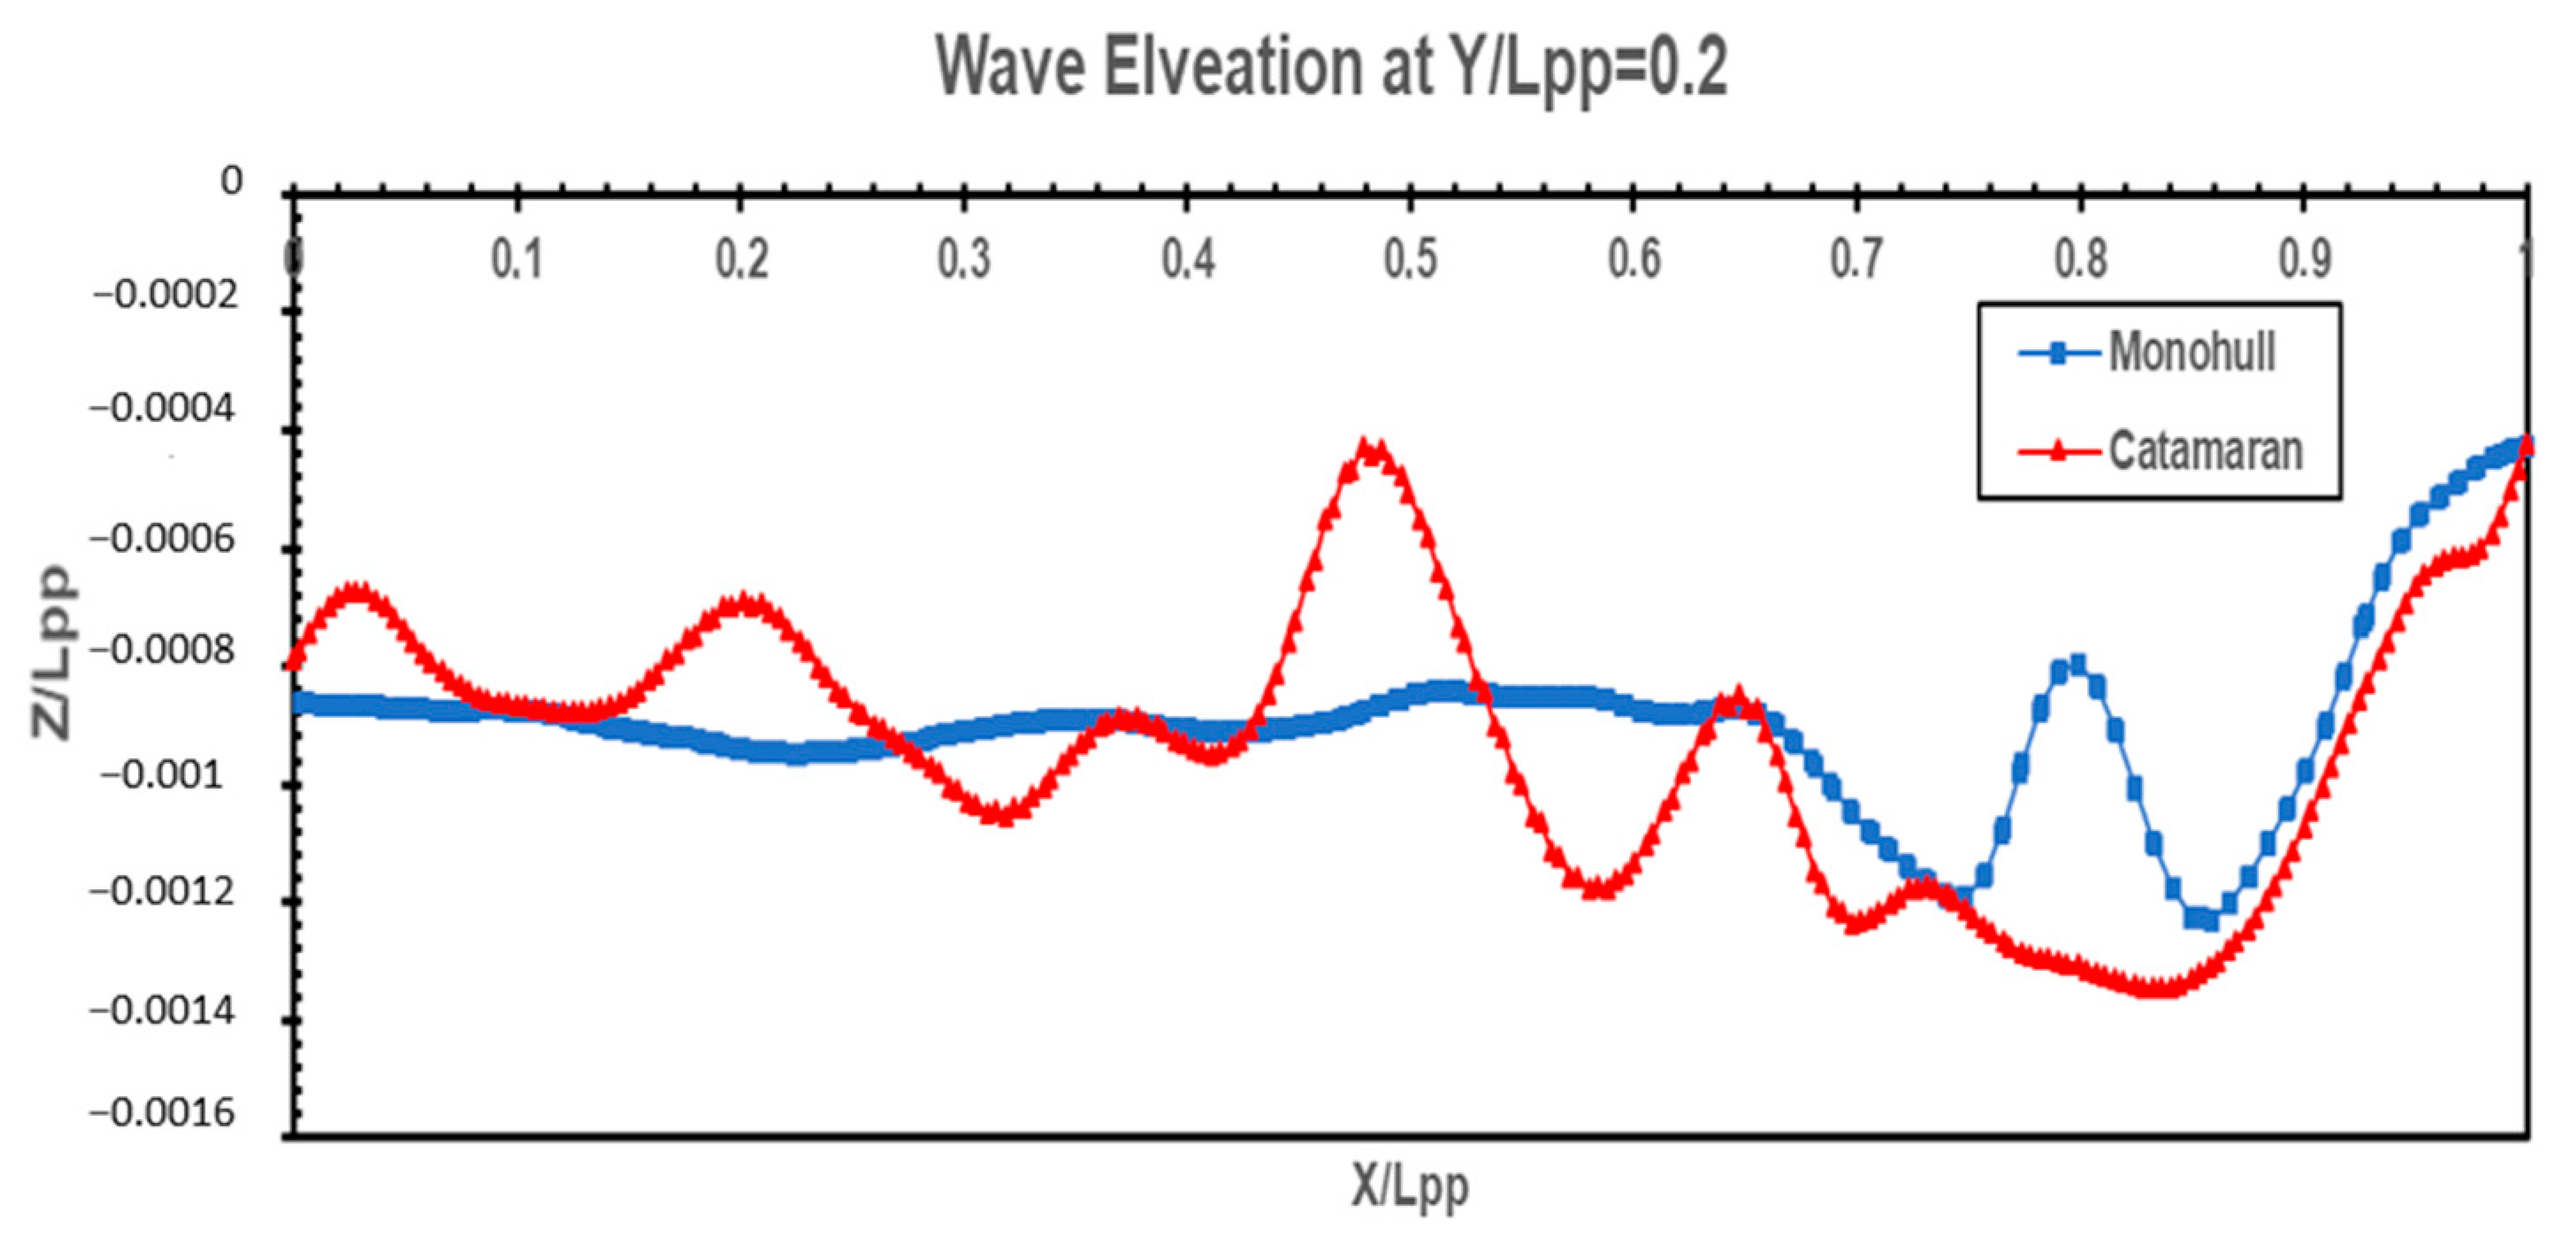
Figure 12 shows wave elevation at the distance of 0.8 m, measured from the center of the ship. Both models generated different wave elevations. The high wave elevation was only generated at location Y/Lpp = 0.7 to Y/Lpp = 1 by the catamaran model. However, the wave elevation was much lower behind those locations. In contrast, the monohull model generated higher wave elevation relatively at every location except at Y/Lpp = 0.77 to Y/Lpp = 1. The overall wave elevations generated by the monohull model at every location were nevertheless still higher. As a result, the wave added resistance of the monohull model was higher. Meanwhile, the wave elevation was at a speed of 0.5 m/s, as shown in Figure 13. The waves generated were very small and the wave elevation occurred below the ship’s draft. Then, the pattern of wave elevation on both of the models at a speed of 0.5 m/s was the opposite of a speed of 1 m/s.
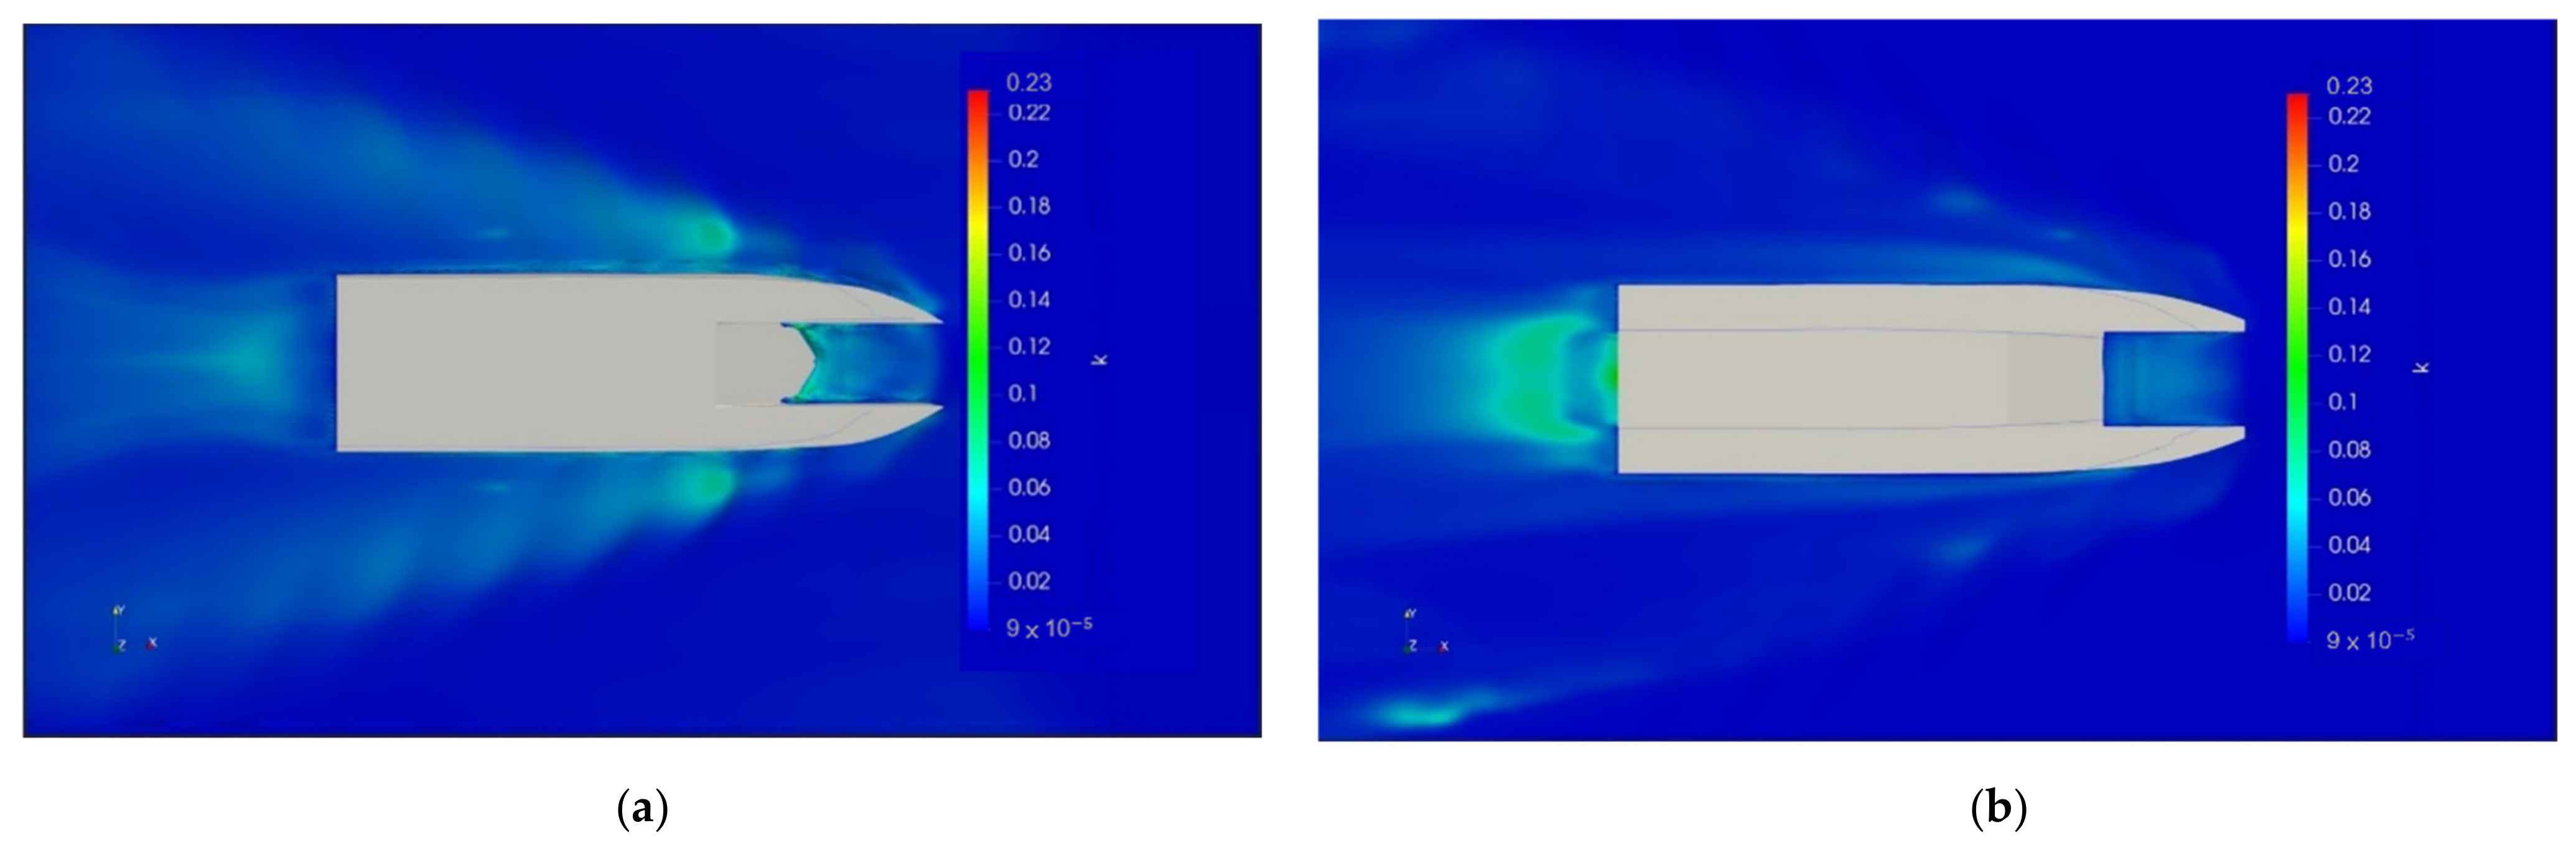
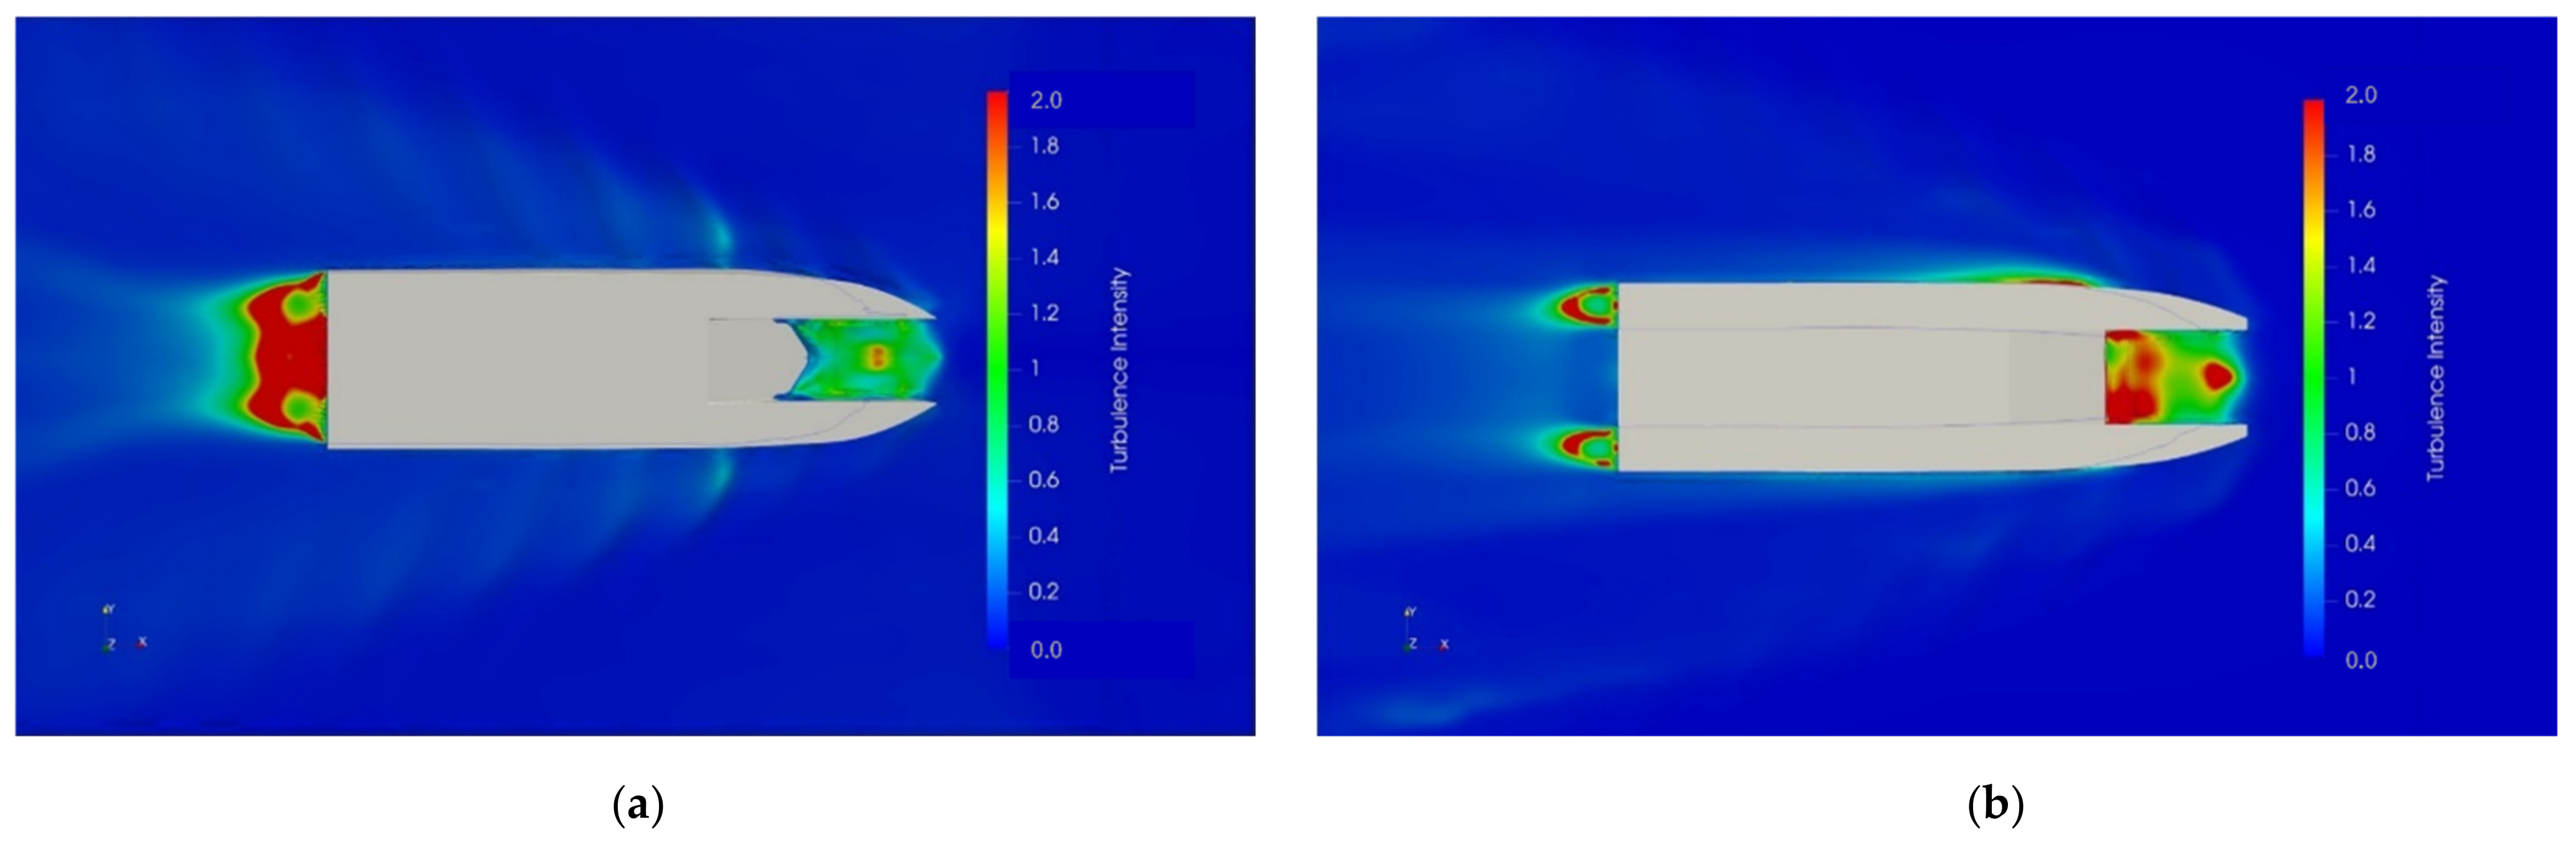
Figure 14 shows the distribution of turbulent kinetic energy around the hull of both models. The magnitude of turbulent kinetic energy was higher around the monohull model than the catamaran model at the same speed. Figure 15 shows the turbulent intensity around both models. The value was more intense in the wake region and side region around the monohull model, while in the catamaran model, the turbulent intensity was much lower. It indicates the effect of the catamaran hull’s shape, where the flow was distributed uniformly and steadier. However, in the front region of these two models, particularly around the conveyor, the catamaran type had higher turbulent intensity.
3.2. Dynamic Pressure
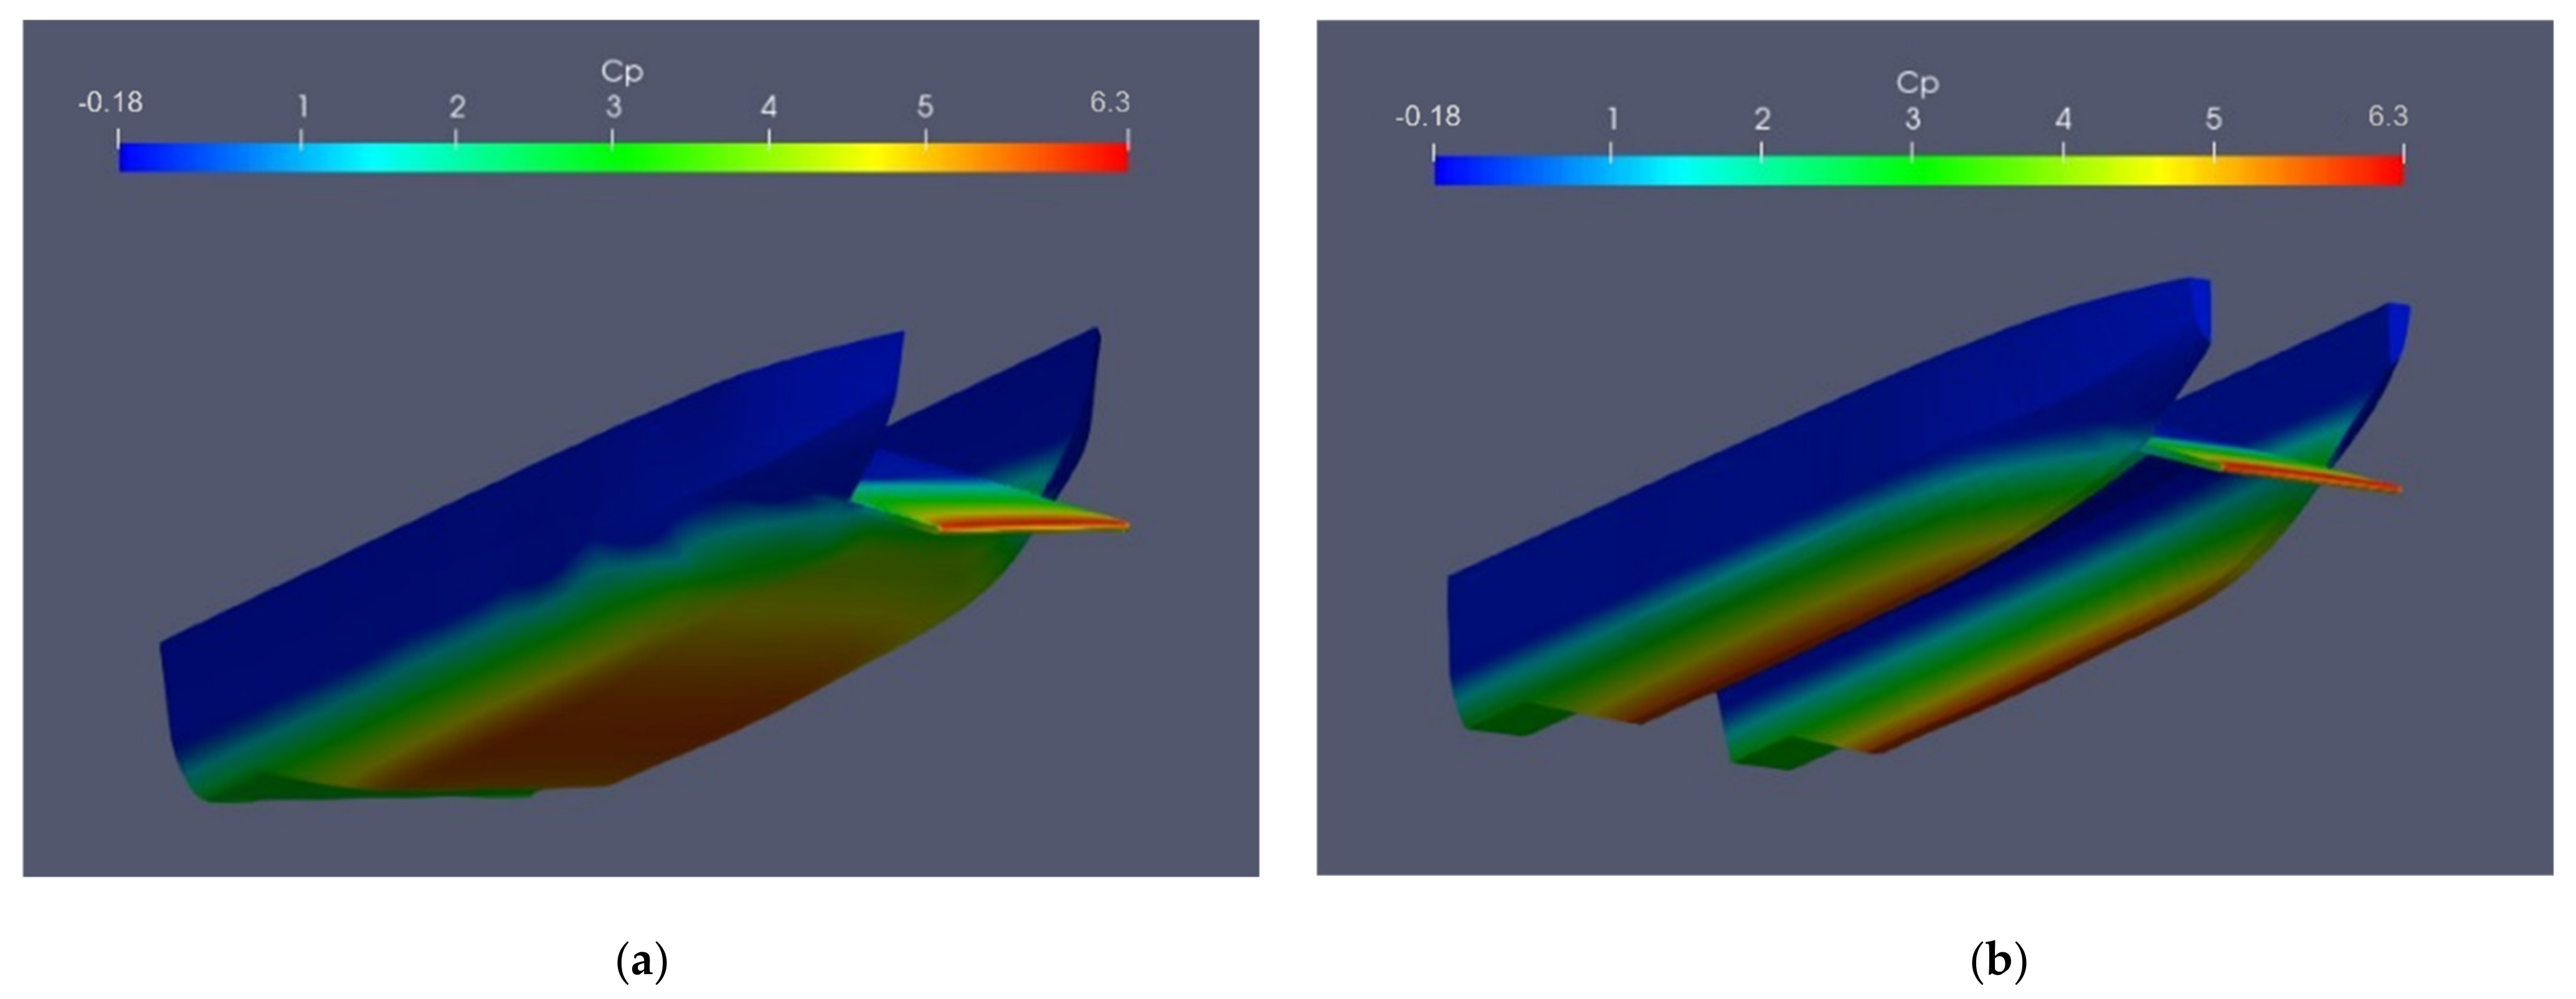
Figure 16 represents a comparison of the pressure coefficient on both models at 1 m/s speed. The pressure coefficient is defined as , where P is dynamic pressure and P0 is static pressure. The pressure coefficient distribution under the hull was higher on the monohull model than on the catamaran model. The bottom wetted surface of the monohull was much larger. As a result, it will amplify the pressure acting on the surface as well as the pressure force. It is identical to a ship without a conveyor, whereas catamaran ships typically have less resistance than monohull ships [43,44]. The pressure coefficient distribution on conveyor surface was similar between both models. The high magnitude of pressure was distributed at bottom end section of the conveyor. This corresponds to the deeper part immersed in the water, which is expected to have greater pressure from incoming flow. Therefore, at this location, it is necessary to provide more structural reinforcement than the other parts.
Figure 17 shows a comparison of the pressure distribution on both models at 0.5 m/s speed. It shows that the pressure coefficient of both models was very similar. Then, the pressure force of 0.5 m/s speed was smaller than the 1 m/s speed. This is in accordance with the resistance force of both models at both speeds, as the smaller the speed, the smaller the resistance force. The total resistance force predictions show the average value after reaching the convergent condition in the computation. The total resistance generated by the monohull type at a speed of 1 m/s was higher than the catamaran type, likewise for the speed of 0.5 m/s.
3.3. Flow Patterns
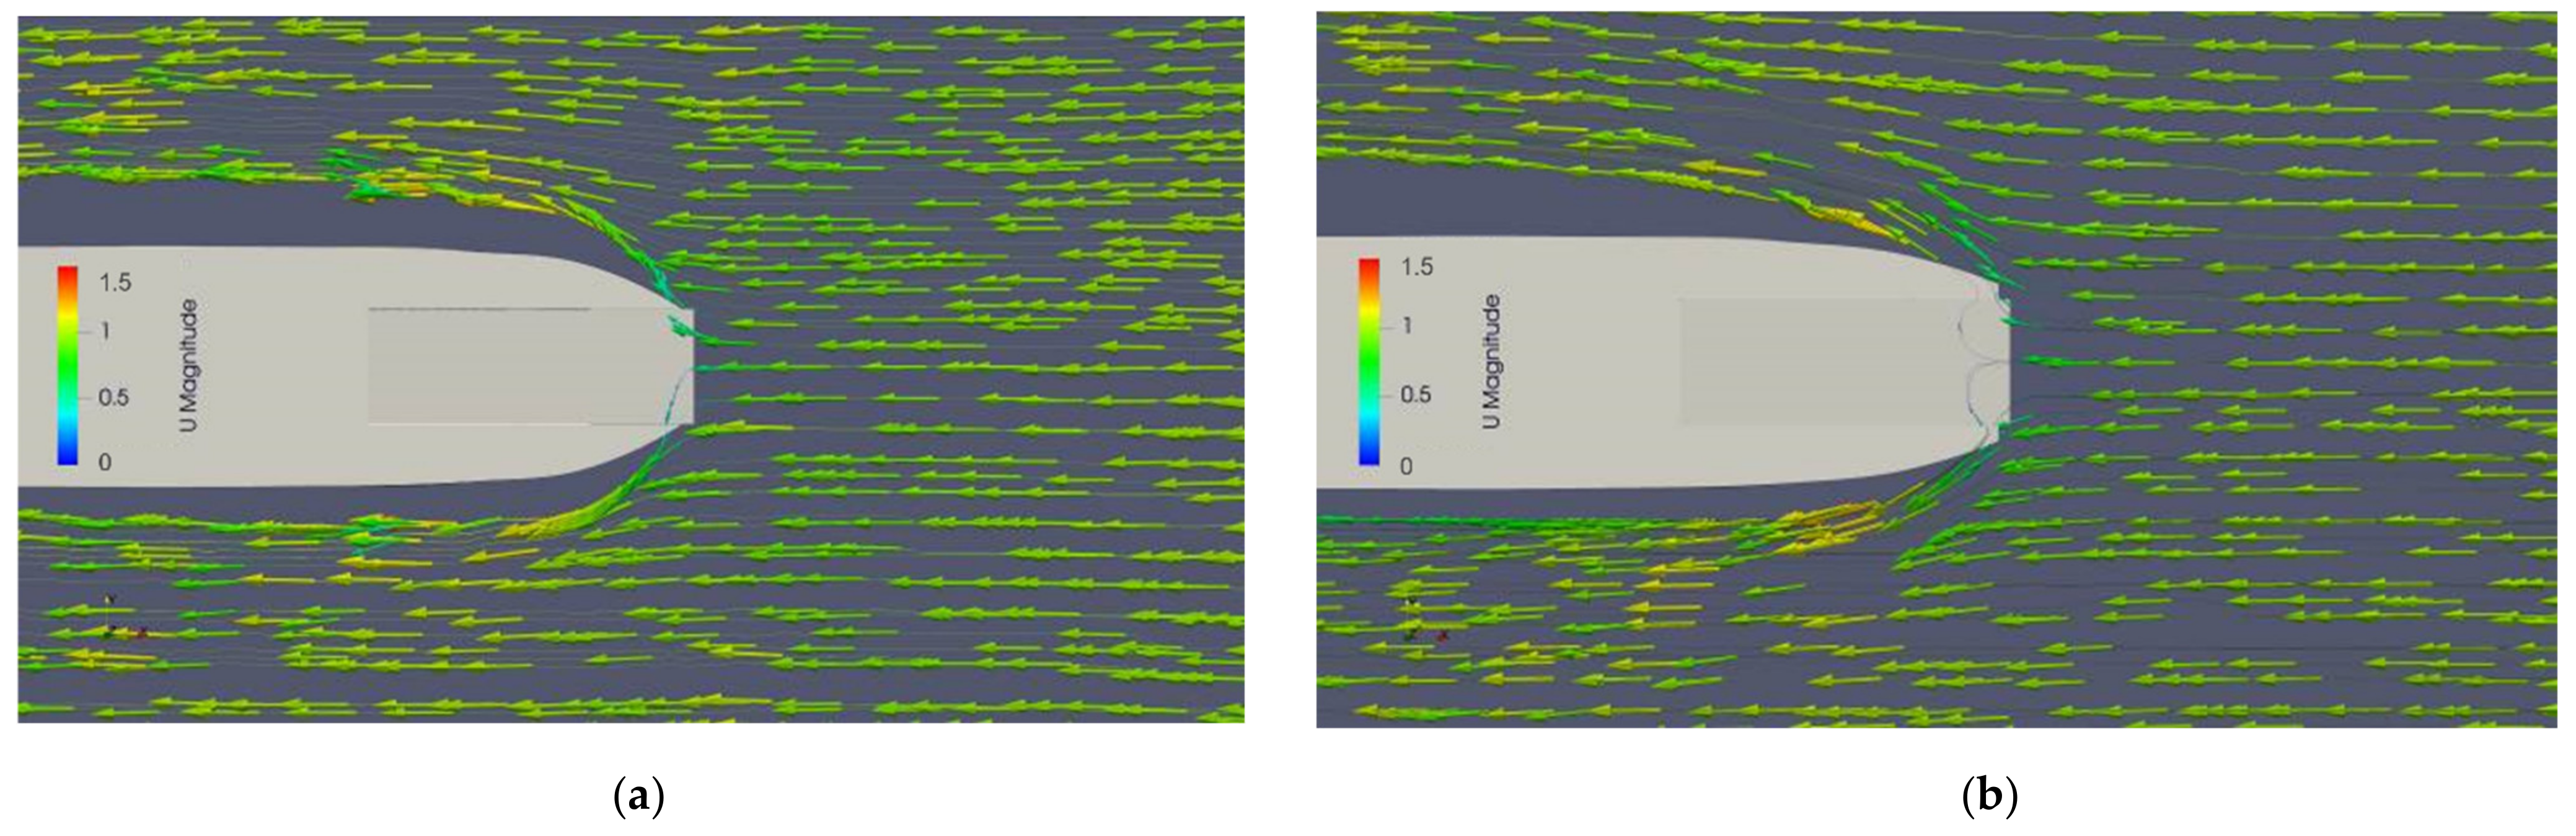
The flow patterns of both models at a speed of 1 m/s speed are presented in Figure 18. The incoming flow formed similar patterns on both models, which was a straight pattern through the conveyor. However, as the fluids flowed closer to the conveyor, the two models had different flow pattern. The flow formed a circular pattern on the conveyor fitted on the catamaran model, whereas there was no such a circular pattern on the monohull’s conveyor. In addition, the flow on the front side of both models was dissimilar. At the region, the fluid flow approached the catamaran hull, whereas it flowed away from the monohull. In terms of marine debris collection, the catamaran model is superior because marine debris is able to approach the ship easily.
At low speeds, as shown in Figure 19, the fluid flow approached the catamaran hull. In terms of marine debris collection, these two models are good at collecting marine debris because both models also bring the marine debris closer to the ship. However, when compared with the speed side, the condition of 1 m/s speed is better.
3.4. Velocity Contour and Velocity Sampling in Front of Model
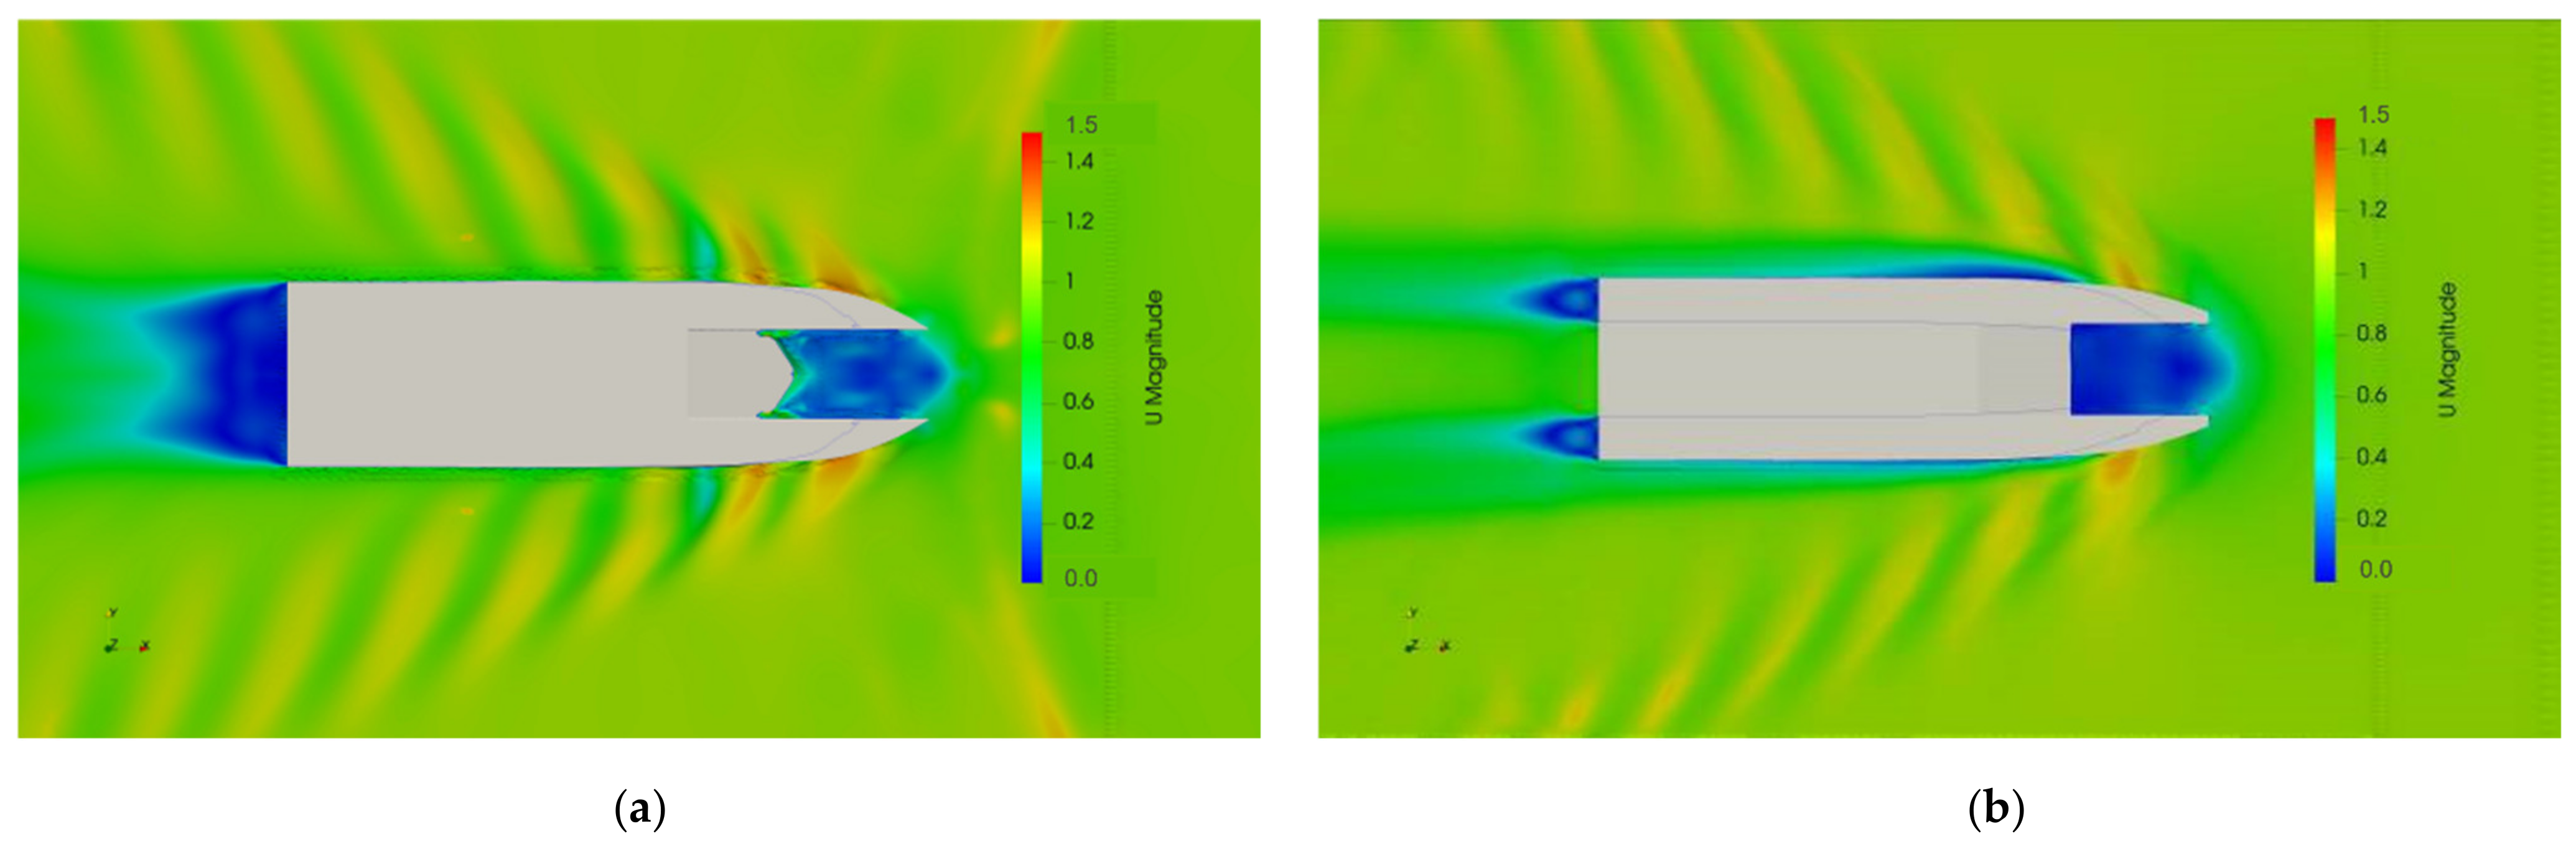
The velocity contour was used to determine flow velocity around the ship’s hull, mainly around the conveyor fitted on the models. The color of contour shows the flow velocity. The magnitude of flow velocity from the highest to the lowest is represented as red, yellow, green, and blue, respectively. Figure 20 shows the velocity contour at a 1 m/s speed of both conveyor ship models. The fluid velocity in front of the conveyor fitted on the catamaran model was lower than the monohull model. Then, Figure 21 shows the velocity contour at 0.5 m/s speed. In general, the velocity contour pattern in both models of both speeds was almost the same. The velocity contour in front of the conveyor on the monohull ship was greener and tended to be yellow compared to the catamaran, as shown in Figure 20a,b, as well as on both sides of the hull. Then, from the comparison at a 0.5 m/s speed, it was shown that the monohull had brighter contours than the catamaran, as shown in Figure 21a,b. What set it apart was the resulting velocity contour. When viewed from the aspect of marine debris collectors, the faster the speed, the faster the marine debris approaches the ship.
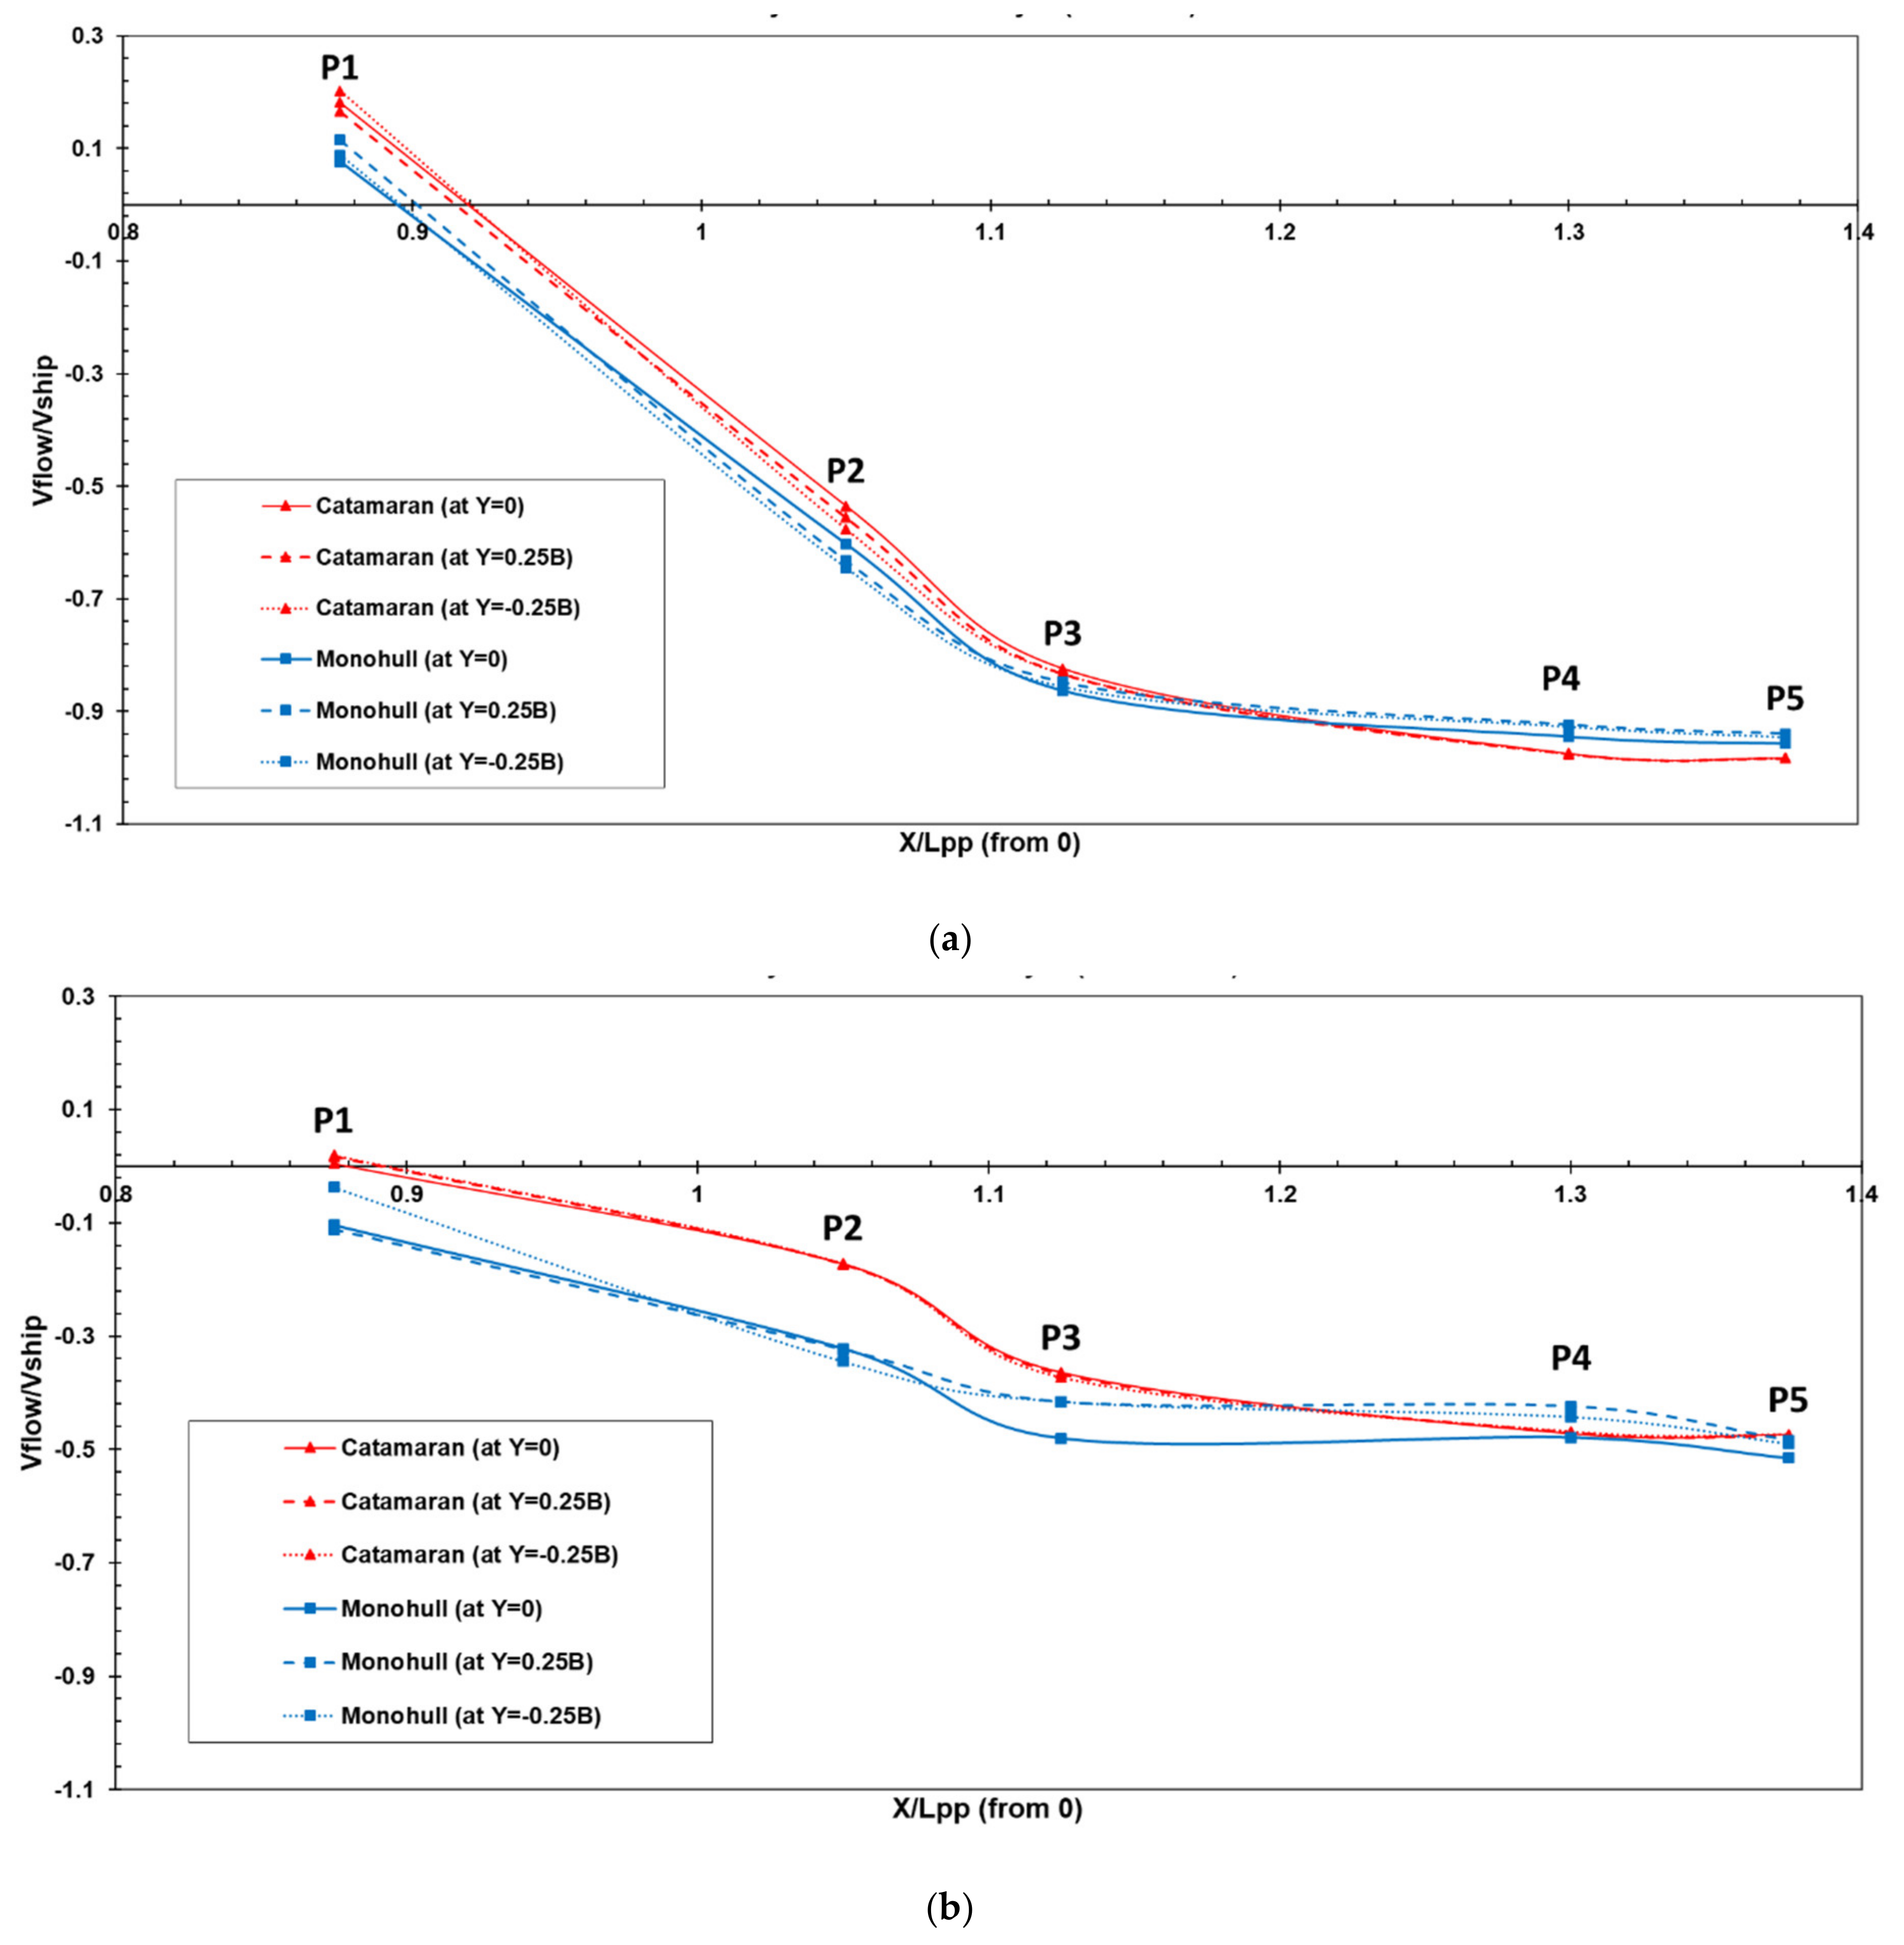
Figure 22 shows local flow velocity in front of ship’s conveyor, measured at five points: P1-P5, as shown in Table 2. There are three locations of measurement represented as three lines and each line has five probe points. These probe points were utilized to assess the longitudinal velocity of flow around the conveyor. The distance between three location lines is 0.15 m. A negative velocity value means that marine debris is heading towards the ship, while a positive value is in the opposite direction. From the comparison of Figure 22a at 1 m/s speed, Y = 0 at probe point P1 to P2, denoting the velocity of marine debris rotating after approaching the conveyor on a catamaran. The back flow velocity of catamaran model at that probe points is higher than that of a monohull. It indicates that marine debris is rapidly to be collected into the hull ship on a monohull model than on a catamaran model.
At probe point P2 to P3 of both the monohull and catamaran models, although the velocity magnitude of marine debris approaching the ship was almost identical, yet at probe points P4 to P5 it was higher for the monohull model than the catamaran model. By comparing the lines in Figure 22a, it can be summed up at location Y = 0.25 B at probe points P3 to P5, the incoming flow velocity to the conveyor on the catamaran was higher than that of the monohull, and also at location Y = −0.25 B, the incoming flow velocity to the conveyor on the catamaran was higher than the monohull ship. It denotes the behavior of the marine debris approaching the conveyor ship was almost same between the two models on both sides of the ship. Furthermore, at probe points P3 to P5, the flow velocity was similar towards the conveyor. Eventually, it could be identified from the Figure 22a that the catamaran model, at both locations, Y = 0.25 B and Y = −0.25 B, had faster flow velocity approaching the conveyor. It indicated that the conveyor catamaran ship is superior at flowing marine debris closer to the conveyor.
Figure 22b shows local flow velocity in front of the ship’s conveyor at 0.5 m/s speed, and at probe point P1 to P2, almost all conditions showed no velocity of marine debris rotating after approaching the conveyor, except for a small velocity of marine debris rotating in the catamaran at locations Y = 0.25 B and Y = −0.25 B. At points P2 to P3, the flow velocity of both models had high magnitude. However, the flow velocity of the monohull was faster than catamaran. Next, at probe points P3-P5, generally, the flow velocity of the monohull was higher than the catamaran. From all conditions at 0.5 m/s speed, it was indicated that marine debris is easier and faster to be collected into the hull ship on a monohull model than on a catamaran model.
Comparing the two speeds at probe points P1 to P3 showed that, at 1 m/s speed, the monohull was faster at bringing marine debris closer to the ship than the catamaran. Then, at probe points P3 to P5, it showed that the catamaran was faster than monohull at 1 m/s speed, but the monohull was faster than the catamaran at 0.5 m/s speed. From the whole results, the monohull ship is superior at flowing marine debris closer to the conveyor.
4. Conclusions
The numerical method used to analyze the flow characteristics of the conveyor ship model is technically reliable. The validation procedure was performed to validate the numerical approach used in this study. In addition, the uncertainty analysis was performed to evaluate the solutions obtained by numerical scheme in both the monohull and catamaran models. From the uncertainty analysis, all GCI values were below 1.5%. It was verified that the dependency of numerical results on the grid size has been reduced and the solution achieves the grid-independent solution. The simulation results show that the catamaran model is superior; however, each model offers advantages in its own way, as stated in this conclusion section. First, in terms of flow pattern, or how easily the waste approaches the conveyor, the flow pattern in the front-side of the hull indicated that the fluid flow approached the hull of the catamaran model, whereas it flowed away from the hull of the monohull model. As a result, the catamaran model is preferable because marine debris may be easily transported off into the conveyor. Second, in terms of velocity contour, or how quickly the waste reaches the conveyor, a comparison of fluid velocity over the conveyor showed that the speed of marine debris spinning after approaching the conveyor on the catamaran model was faster than that of the monohull model. This suggests that a conveyor connected to a monohull model will collect marine debris more quickly than a catamaran model. Following that, at the area directly in front of the conveyor, it was demonstrated that the conveyor monohull was faster at transporting marine debris closer to the conveyor. However, this transporting speed was not significant compared to the catamaran. Therefore, the catamaran model remains preferable. In addition, regardless of storage capacity, the recommendation for the real-life ship dimensions should be B/L = 0.3, T/L = 0.075.
Further research to improve this research can be conducted by: 1. comparing the marine debris behavior of different hull numbers with the same storage capacity, 2. research on the possibility and optimization of the use of a wing conveyor in front of the ship, in order that marine debris moving sideways to the ship can be caught by the wing conveyor, 3. using artificial marine debris in numerical simulations in order to obtain better results regarding behavior on marine debris collection, and it might be possible to use Lagrangian particle tracking [45], 4. further research can be performed by introducing the wind and wave conditions at a certain location and time, as, in this simulation, the initial conditions of wind and waves were ignored [46], therefore, the results of the numerical approach are more like real conditions, 5. adjusting the distance of the demihull of the catamaran, which will affect the total resistance. Then, it will affect the interference of hulls and waste collection behavior.
Author Contributions
Conceptualization, E.S. and J.-H.C.; methodology, E.S. and N.V.A.P.; software, N.V.A.P. and E.S.; validation, E.S. and N.V.A.P.; formal analysis, E.S.; investigation, E.S., J.-H.C. and N.V.A.P.; resources, J.-H.C.; data curation E.S. and N.V.A.P.; writing—original draft preparation, E.S.; writing—review and editing, J.-H.C. and N.V.A.P.; visualization, N.V.A.P.; supervision, J.-H.C.; project administration, J.-H.C.; funding acquisition, J.-H.C. All authors have read and agreed to the published version of the manuscript.
Funding
This research received no external funding.
Institutional Review Board Statement
Not applicable.
Informed Consent Statement
Not applicable.
Data Availability Statement
Not applicable.
Acknowledgments
The authors wish to thank the Doctoral Scholarship of the Taiwan government and CTCI Foundation Taiwan.
Conflicts of Interest
The authors declare no conflict of interest.
References
- Chiba, S.; Saito, H.; Fletcher, R.; Yogi, T.; Kayo, M.; Miyagi, S.; Ogido, M.; Fujikura, K. Human footprint in the abyss: 30 year records of deep-sea plastic debris. Mar. Policy 2018, 98, 204–212. [Google Scholar] [CrossRef]
- Bergmann, M.; Tekman, M.B.; Gutow, L. Marine litter: Sea change for plastic pollution. Nature 2017, 544, 297. [Google Scholar] [CrossRef]
- Leal Filho, W.; Hunt, J.; Kovaleva, M. Garbage Patches and Their Environmental Implications in a Plastisphere. J. Mar. Sci. Eng. 2021, 9, 1289. [Google Scholar] [CrossRef]
- UNEP. Marine Litter Vital Graphics. 2016. Available online: https://www.grida.no/publications/60 (accessed on 21 December 2021).
- Pradit, S.; Noppradit, P.; Loh, P.-S.; Nitiratsuwan, T.; Le, T.P.Q.; Oeurng, C.; Mohamed, C.A.R.; Lee, C.W.; Lu, X.; Anshari, G.Z.; et al. The Occurrence of Microplastics in Sediment Cores from Two Mangrove Areas in Southern Thailand. J. Mar. Sci. Eng. 2022, 10, 418. [Google Scholar] [CrossRef]
- IPCC. Impacts, Adaptation, and Vulnerability. Part B: Regional Aspects; Cambridge University Press: Cambridge, UK, 2014. [Google Scholar]
- World Bank Group. Hotspot Sampah Laut Indonesia; World Bank Group: Jakarta, Indonesia, 2018. [Google Scholar]
- Sugianto, E.; Chen, J.H. Buy marine debris: A digital platform for sustainable marine debris management involving fishermen. Int. J. Humanit. Soc. Sci. 2021, 3, 36–48. [Google Scholar]
- Sugianto, E.; Chen, J.H. Ships for waste management in Indonesian seas: Contexts and challenges. In Proceedings of the 12th International Indonesia Forum Conference: Rising to the Occasion: Indonesian Creativity, Ingenuity, and Innovation in a World in Transition, Tainan, Taiwan, 26–27 June 2019. [Google Scholar]
- Sugianto, E.; Chen, J.H. Preliminary concept of ship use to waste management in sea shallow water. In Proceedings of the 33th Asian-Pacific Technical Exchange and Advisory Meetings on Marine Structures (TEAM 2020), Tainan, Taiwan, 14–17 October 2019. [Google Scholar]
- Rizzuto, E.; Soares, C.G. Sustainable maritime transportation and exploitation of sea resources. In Proceedings of the 14th International Congress of the International Maritime Association of Mediterranean (IMAM), Genova, Italy, 13–16 September 2011. [Google Scholar]
- Chrismianto, D.; Adietya, B.A.; Sobirin, Y. Pengaruh variasi bentuk hull kapal catamaran terhadap besar hambatan total menggunakan CFD (The effect of variations in the hull shape of a catamaran on the total resistance using CFD). Kapal J. Mar. Sci. Technol. 2014, 11, 99–106. [Google Scholar] [CrossRef]
- Basir, N.B.; Trimulyono, A.; Santoso, A.W.B. Analisa pengaruh penggunaan chine pada hambatan kapal ikan tipe katamaran (Analysis of the effect of using chine on catamaran-type fishing vessel resistance). Kapal J. Mar. Sci. Technol. 2015, 3, 183–192. [Google Scholar]
- Hu, J.; Zhang, Y.; Wang, P.; Qin, F. Numerical and experimental study on resistance of asymmetric catamaran with different layouts. Brodogradnja 2020, 71, 91–110. [Google Scholar] [CrossRef]
- Yanuar; Ibadurrahman; Waskito, K.T.; Karim, S.; Ichsan, M. Interference resistance of pentamaran ship model with asymmetric outrigger configurations. J. Mar. Sci. Appl. 2017, 16, 42–47. [Google Scholar] [CrossRef]
- Najafi, A.; Saeed, S.M. RANS simulation of hydrofoil effects on hydrodynamic coefficients of a planing catamaran. Brodogradnja 2016, 67, 43–66. Available online: https://hrcak.srce.hr/154715 (accessed on 26 May 2022).
- Farkas, A.; Degiuli, N.; Martic, I. Numerical investigation into the interaction of resistance components for a series 60 catamaran. Ocean Eng. 2017, 146, 151–169. [Google Scholar] [CrossRef]
- Dubrovsky, V.A. Multi-Hulls: Some new options as the result of science development. Brodogradnja 2010, 61, 142–152. Available online: https://hrcak.srce.hr/56871 (accessed on 26 May 2022).
- Shaw, H.J.; Chen, W.L.; Li, Y.H. A CFD study on the performance of a passive ocean plastic collector under rough sea conditions. Ocean Eng. 2019, 188, 106243. [Google Scholar] [CrossRef]
- Ji, C.Y.; Guo, J.T.; Ye, R.C.; Yin, Q.L.; Xu, W.Y.; Yuan, Z.M. Experimental study of an ocean surface cleaning system. Ocean Eng. 2022, 249, 110937. [Google Scholar] [CrossRef]
- Papanikolaou, A.; Xing-Kaeding, Y.; Strobel, J.; Kanellopoulou, A.; Zaraphonitis, G.; Tolo, E. Numerical and Experimental Optimization Study on a Fast, Zero Emission Catamaran. J. Mar. Sci. Eng. 2020, 8, 657. [Google Scholar] [CrossRef]
- Shi, G.; Priftis, A.; Xing-Kaeding, Y.; Boulougouris, E.; Papanikolaou, A.D.; Wang, H.; Symonds, G. Numerical Investigation of the Resistance of a Zero-Emission Full-Scale Fast Catamaran in Shallow Water. J. Mar. Sci. Eng. 2021, 9, 563. [Google Scholar] [CrossRef]
- Dorner MFG Corp. Full Specification dorner Aquapruf Aquagard, Doner Move Fast and Smart. 2009. Available online: https://www.dornerconveyors.com/asia/aquagard-vs-aquapruf (accessed on 3 November 2021).
- Pramoko, A.G.; Kurniawati, H.A. Studi perancangan trash-skimmer boat di perairan Teluk Jakarta (Study on the design of a trash-skimmer boat in the waters of Jakarta Bay). J. Tek. ITS 2013, 2, 11–16. [Google Scholar]
- Sugianto, E.; Chen, J.H.; Purba, N.P. Numerical investigation of conveyor wing shape type effect on ocean waste collection behavior. E3S Web Conf. 2021, 324, 01005. [Google Scholar] [CrossRef]
- ITTC. Guideline for VIV Testing. In ITTC—Recommended Procedures and Guidelines, Proceedings of the Ocean Engineering Committee of the 29th ITTC, Virtual, 13–18 June 2021; Chapter 7.5-02-03-10; Available online: https://ittc.info/media/9876/0_0.pdf (accessed on 3 November 2021).
- Versteeg, H.-K.; Malalasekera, W. An Introduction to Computational Fluid Dynamics—The Finite Volume Method, 2nd ed.; Pearson Education Limited: London, UK, 2007. [Google Scholar]
- ITTC. Practical Guidelines for Ship CFD Applications. In ITTC—Recommended Procedures and Guidelines; 26th ITTC Executive Committee: Rio de Janeiro, Brazil, 2011; Chapter 7.5-03-02-03. [Google Scholar]
- Vant Veer, R. Experimental Results of Motions and Structural Loads on the 372 Catamaran Model in Head and Oblique Waves, 1130; TU Delft Rep: Wageningen, The Netherlands, 1998. [Google Scholar]
- Vant Veer, R. Experimental Results of Motions, Hydrodynamic Coefficients and Wave Loads on the 372 Catamaran Model; Delft University of Technology: Wageningen, The Netherlands, 1998. [Google Scholar]
- Broglia, R.; Jacob, B.; Zaghi, S.; Stern, F.; Olivieri, A. Experimental investigation of interference effects for high-speed catamarans. Ocean Eng. 2014, 76, 75–85. [Google Scholar] [CrossRef]
- Broglia, R.; Zaghi, S.; Di Mascio, A. Numerical simulation of interference effects for a high-speed catamaran. J. Mar. Sci. Technol. 2011, 16, 254–269. [Google Scholar] [CrossRef]
- Remmlinger, U. The Resistance of the Delft 372 Hull; VDI Verlag: Düsseldorf, Germany, 2014. [Google Scholar]
- Bašić, J.; Blagojević, B.; Andrun, M. Improved estimation of ship wave-making resistance. Ocean Eng. 2020, 200, 107079. [Google Scholar] [CrossRef]
- Roy, C.J. Review of code and solution verification procedures for computational simulation. J. Comput. Phys. 2005, 205, 131–156. [Google Scholar] [CrossRef]
- Paudel, S.; Saenger, N. Grid refinement study for three dimensional CFD model involving incompressible free surface flow and rotating object. Comput. Fluids 2017, 143, 134–140. [Google Scholar] [CrossRef]
- Roache, P.J. Perspective—A Method for Uniform Reporting of Grid Refinement Studies. J. Fluid Eng. 1994, 116, 405–413. [Google Scholar] [CrossRef]
- Roache, P.J. Verification of codes and calculations. AIAA J. 1998, 36, 696–702. [Google Scholar] [CrossRef]
- ITTC. Uncertainly analysis in CFD verification and validation methodology and procedures. In ITTC—Recommended Procedures and Guidelines; 28th ITTC Executive Committee: Wuxi, China, 2017; Chapter 7.5-03-01-01. [Google Scholar]
- Islam, H.; Soares, C.G. Uncertainty analysis in ship resistance prediction using OpenFOAM. Ocean Eng. 2019, 191, 105805. [Google Scholar] [CrossRef]
- Lin, Y.-H.; Li, X.-C. The Investigation of a Sliding Mesh Model for Hydrodynamic Analysis of a SUBOFF Model in Turbulent Flow Fields. J. Mar. Sci. Eng. 2020, 8, 744. [Google Scholar] [CrossRef]
- Roache, P.J. Quantification of uncertainty in computational fluid dynamics. Annu. Rev. Fluid Mech. 1997, 29, 123–160. [Google Scholar] [CrossRef]
- Adietya, B.A.; Gustiarini, E.D. Studi perbandingan performa kapal trimaran, katamaran, dan monohull sebagai kapal penyeberangan di Kepulauan Karimunjawa (Comparative study of the performance of trimaran, catamaran, and monohull vessels as crossing vessels in the Karimun Jawa Islands). Kapal J. Mar. Sci. Technol. 2018, 15, 18–23. [Google Scholar] [CrossRef]
- Zakki, F.Z.; Chrismianto, D.; Widyandari, A.; Ilham, R. On the development of catamaran hull form for fish processing vessel to support domestic fishing activities in Indonesia. Brodogradnja 2021, 68, 175–188. Available online: https://hrcak.srce.hr/262617 (accessed on 26 May 2022). [CrossRef]
- Bigdeli, M.; Mohammadian, A.; Pilechi, A.; Taheri, M. Lagrangian Modeling of Marine Microplastics Fate and Transport: The State of the Science. J. Mar. Sci. Eng. 2022, 10, 481. [Google Scholar] [CrossRef]
- De Leo, A.; Cutroneo, L.; Sous, D.; Stocchino, A. Settling Velocity of Microplastics Exposed to Wave Action. J. Mar. Sci. Eng. 2021, 9, 142. [Google Scholar] [CrossRef]
Figure 1.
Monohull model: (a) front view of round bilge, (b) 3D view of round bilge, and (c) side view.
Figure 1.
Monohull model: (a) front view of round bilge, (b) 3D view of round bilge, and (c) side view.

Figure 2.
Catamaran model: (a) front view of inner flat hull, (b) 3D view of inner flat hull, (c) side view.
Figure 2.
Catamaran model: (a) front view of inner flat hull, (b) 3D view of inner flat hull, (c) side view.

Figure 3.
Location of probes.

Figure 4.
Fluid domain and boundaries used to model.

Figure 5.
Meshing in fluid domain with refinement levels: (a) side view model, (b) top view, (c) front view.
Figure 5.
Meshing in fluid domain with refinement levels: (a) side view model, (b) top view, (c) front view.

Figure 6.
The actual number of surface prism layers generated around the ship model using the snappyHexMesh tool: (a) surface layers, (b) yPlus.
Figure 6.
The actual number of surface prism layers generated around the ship model using the snappyHexMesh tool: (a) surface layers, (b) yPlus.

Figure 7.
Meshing result on the Delft catamaran 372 model.

Figure 8.
Residual and force components evolution: (a) residual iteration evolution, (b) force components iteration evolution using 2,196,512 cells, (c) location of velocity sampling, (d) velocity convergence.
Figure 8.
Residual and force components evolution: (a) residual iteration evolution, (b) force components iteration evolution using 2,196,512 cells, (c) location of velocity sampling, (d) velocity convergence.

Figure 9.
Pressure coefficient distribution (a) and wave patterns (b) on Delft catamaran 372 surface at Froude number 0.3.
Figure 9.
Pressure coefficient distribution (a) and wave patterns (b) on Delft catamaran 372 surface at Froude number 0.3.

Figure 10.
Distribution of wave generated around round-bilge monohull 1 m/s: (a) wave elevation, (b) wave profile along body.
Figure 10.
Distribution of wave generated around round-bilge monohull 1 m/s: (a) wave elevation, (b) wave profile along body.

Figure 11.
Distribution of wave generated around inner flat catamaran at 1 m/s speed: (a) wave elevation, (b) wave profile along body.
Figure 11.
Distribution of wave generated around inner flat catamaran at 1 m/s speed: (a) wave elevation, (b) wave profile along body.

Figure 12.
Wave elevation at Y/Lpp = 0.2 at 1 m/s speed.

Figure 13.
Wave elevation at Y/Lpp = 0.2 at 0.5 m/s speed.

Figure 14.
Turbulent kinetic energy at 1 m/s speed: (a) monohull, (b) catamaran.

Figure 15.
Turbulent intensity at 1 m/s speed: (a) monohull, (b) catamaran.

Figure 16.
Pressure coefficient distribution on ship surface at 1 m/s: (a) monohull, (b) catamaran.

Figure 17.
Pressure coefficient distribution on ship surface at 0.5 m/s: (a) monohull, (b) catamaran.
Figure 17.
Pressure coefficient distribution on ship surface at 0.5 m/s: (a) monohull, (b) catamaran.

Figure 18.
Flow pattern at 1 m/s speed: (a) round-bilge monohull, (b) inner flat catamaran.

Figure 19.
Flow pattern at 0.5 m/s speed: (a) round-bilge monohull, (b) inner flat catamaran.

Figure 20.
Velocity contour at 1 m/s speed: (a) round-bilge monohull, (b) inner flat catamaran.

Figure 21.
Velocity contour at 0.5 m/s speed: (a) round-bilge monohull, (b) inner flat catamaran.

Figure 22.
Velocity flow at probes: (a) 1 m/s speed, (b) 0.5 m/s speed.


| Parameter | Symbol | Monohull | Catamaran |
|---|---|---|---|
| Length overall [m] | Loa | 4.000 | 4.000 |
| Length perpendicular [m] | Lpp | 3.950 | 3.950 |
| Length of water line [m] | Lwl | 3.858 | 3.858 |
| Maximum breadth [m] | B | 1.200 | 1.200 |
| Height [m] | H | 0.600 | 0.600 |
| Draft [m] | T | 0.300 | 0.300 |
| Wetted surface area [m2] | WSA | 6.232 | 5.723 |
| Conveyor length [m] | Lc | 1.625 | 1.625 |
| Conveyor angle [o] | La | 20 | 20 |
| Conveyor wide [m] | Lw | 0.600 | 0.600 |
| Volume displacement | m3 | 0.90 | 0.36 |
| Block coefficient | - | 0.625 | 0.25 |
Table 2.
Control points’ locations measured from in front of ship conveyors.
| Probes | X (m) | Y1 | Y2 | Y3 | Z |
|---|---|---|---|---|---|
| P1 | 3.5 | 0 | 0.15 | −0.15 | 0 |
| P2 | 4.2 | 0 | 0.15 | −0.15 | 0 |
| P3 | 4.5 | 0 | 0.15 | −0.15 | 0 |
| P4 | 5.2 | 0 | 0.15 | −0.15 | 0 |
| P5 | 5.5 | 0 | 0.15 | −0.15 | 0 |
Table 3.
Boundary conditions.
| Parameter | Velocity | Dynamic Pressure | α. Water | Omega | k |
|---|---|---|---|---|---|
| Inlet | fixedValue | fixedFluxPressure | fixedValue | fixedValue | fixedValue |
| Starboard | zeroGradient | zeroGradient | variableHeightFlowRate | zeroGradient | zeroGradient |
| Portside | zeroGradient | zeroGradient | zeroGradient | zeroGradient | zeroGradient |
| Atmosphere | pressureInletOutletVelocity | totalPressure | inletOutlet | inletOutlet | inletOutlet |
| Bottom | zeroGradient | zeroGradient | fixedValue | zeroGradient | eroGradient |
| Outlet | outletPhaseMeanVelocity | zeroGradient | variableHeightFlowRate | inletOutlet | inletOutlet |
| Hull | movingWallVelocity | fixedFluxPressure | zeroGradient | omegaWallFunction | qRWallFunction |
Table 4.
Average and standard deviation of force components vs. grid density for Delft catamaran 372 at Fr = 0.3.
Table 4.
Average and standard deviation of force components vs. grid density for Delft catamaran 372 at Fr = 0.3.
| Grid Density | Number of Cells | Pressure | Viscous | Total | Experiment Value | % Error |
|---|---|---|---|---|---|---|
| Coarse | 737,304 | 5.38 | 8.22 | 13.60 | 12.77 | 6.5 |
| Medium | 2,196,512 | 3.46 | 8.56 | 12.02 | 12.77 | 5.8 |
| Fine | 4,400,870 | 2.62 | 11.71 | 14.33 | 12.77 | 12.2 |
Table 5.
Comparison of numerical results and experimental data.
| Vs (m/s) | Fn | Re | Rt (N) | Ct × 10−3 | |
|---|---|---|---|---|---|
| Experiment [30,31] | 1.627 | 0.3 | 4.882 × 10⁶ | 12.77 | 4.961 |
| Prelimina [34] | 1.637 | 0.3 | 4.882 × 10⁶ | 14.00 | 5.523 |
| Present study | 1.627 | 0.3 | 4.882 × 10⁶ | 12.02 | 4.555 |
| Percentage error with experiment (%) | - | - | - | 5.843 | 8.18 |
| Percentage error with Prelimina (%) | - | - | - | 12.85 | 17.52 |
Table 6.
The uncertainty analysis for monohull model.
| Grid | No. of Cells | |||||||
|---|---|---|---|---|---|---|---|---|
| Fine | 7,735,423 | 141.51 | 1.59 | |||||
| Medium | 3,143,952 | 143.10 | 6.38 | 0.2492 | 4.009 | 0.35 | 1.41 | |
| Coarse | 945,286 | 149.48 |
Table 7.
The uncertainty analysis for catamaran model.
| Grid | No. of Cells | |||||||
|---|---|---|---|---|---|---|---|---|
| Fine | 5,877,600 | 136.95 | −0.07 | |||||
| Medium | 3,143,952 | 136.87 | −1.19 | 0.0623 | 8.007 | 0.0042 | 0.0042 | |
| Coarse | 1,777,139 | 135.68 |
Publisher’s Note: MDPI stays neutral with regard to jurisdictional claims in published maps and institutional affiliations. |
© 2022 by the authors. Licensee MDPI, Basel, Switzerland. This article is an open access article distributed under the terms and conditions of the Creative Commons Attribution (CC BY) license (https://creativecommons.org/licenses/by/4.0/).
Share and Cite
MDPI and ACS Style
Sugianto, E.; Chen, J.-H.; Permadi, N.V.A. Effect of Monohull Type and Catamaran Hull Type on Ocean Waste Collection Behavior Using OpenFOAM. Water 2022, 14, 2623. https://doi.org/10.3390/w14172623
AMA Style
Sugianto E, Chen J-H, Permadi NVA. Effect of Monohull Type and Catamaran Hull Type on Ocean Waste Collection Behavior Using OpenFOAM. Water. 2022; 14(17):2623. https://doi.org/10.3390/w14172623
Chicago/Turabian StyleSugianto, Erik, Jeng-Horng Chen, and Niki Veranda Agil Permadi. 2022. "Effect of Monohull Type and Catamaran Hull Type on Ocean Waste Collection Behavior Using OpenFOAM" Water 14, no. 17: 2623. https://doi.org/10.3390/w14172623
Note that from the first issue of 2016, this journal uses article numbers instead of page numbers. See further details here.